the Creative Commons Attribution 4.0 License.
the Creative Commons Attribution 4.0 License.
 | 16 Apr 2025
From rockfall source area identification to susceptibility zonation: a proposed workflow tested on El Hierro (Canary Islands, Spain)
Mauro Rossi
Paola Reichenbach
Rosa María Mateos
Rockfall modelling is a common topic in the landslide literature, but a comprehensive workflow for rockfall susceptibility zonation remains a challenge. Several aspects of the modelling, such as rockfall runout simulation, are consolidated, but others still show inconsistencies and ambiguities, such as the source area identification or the criteria to obtain probabilistic susceptibility zonation. This study proposes a workflow for rockfall susceptibility zonation at the regional scale that integrates (i) source area identification criteria, (ii) deterministic runout modelling, (iii) approaches for the runout classification, and (iv) robust procedures for validation and comparison.
The workflow is tested on El Hierro Island (Canary Islands, Spain) and considers the effect of different methods to identify the rockfall source areas that are used as input data for rockfall runout modelling. The runout outputs are classified to derive rockfall susceptibility zonation considering different types of classification (i.e. supervised versus unsupervised methods). The source area identification reflects situations with limited data availability and scenarios with a large amount of topographic, geological, and geomorphological information. The first approach is based on slope angle thresholding, the second uses a statistical method based on empirical cumulative distribution functions (ECDFs) of slope angle values, and the third involves the combination of multiple multivariate statistical classification models where the source area is the dependent variable and thematic information is the independent variables. The source area maps obtained from the three methods are utilized as inputs for a rockfall runout model (STONE) to derive rockfall trajectory count maps. Two classification approaches are applied to generate probabilistic susceptibility maps from the trajectory counts: unsupervised and supervised statistical methods using distribution functions. The unsupervised classification employs only the rockfall trajectory counts as input, whereas the supervised classification requires additional data on the areas already affected by rockfalls. To complement the workflow, statistical methods and metrics are proposed to verify, validate, and compare the susceptibility zonation.
- Article
(10430 KB) - Full-text XML
- BibTeX
- EndNote


Rockfalls are dangerous natural hazards with a relevant socioeconomic impact worldwide (Borella et al., 2019; Mateos et al., 2020). Changes in environmental conditions related to the growth of the population, land use intensification, and industrial development have the potential to increase the impact of rockfalls in many different regions (Farvacque et al., 2019; Othman et al., 2021; Santangelo et al., 2020). In addition, climate change is expected to modify precipitation patterns, which will have the effect of increasing the frequency and extension of rockfalls (Gariano et al., 2015; Sarro et al., 2021). As a consequence, there is an increasing interest in improving the reliability and accuracy of tools and products able to support rockfall management and mitigate its impact (Noël et al., 2021; Omran et al., 2021; Santos et al., 2024).
A rockfall susceptibility estimate shows where rockfalls are likely to occur. A susceptibility zonation is a map that classifies the territory based on the likelihood of rockfall occurrence. Several techniques have been developed for rockfall susceptibility zonation, which can be broadly classified into qualitative and quantitative approaches. Qualitative approaches may include geomorphological analysis and heuristic techniques, whereas quantitative approaches are different statistical or deterministic-based analyses (Reichenbach et al., 2018).
Rockfall runout modelling allows us to obtain information on the spatial distribution of boulder trajectories and their velocity, energy, and heights (Carlà et al., 2019; Gallo et al., 2021) and plays a relevant role in rockfall assessment, supporting the identification of rockfall-prone areas and the characterization of boulder behaviour (Crosta et al., 2015; Pfeiffer, 2019). A wide range of algorithms or models is currently available for the calculation of runout zones. Nevertheless, deterministic modelling remains inherently uncertain due to insufficient data on the mechanical and geometrical properties of the terrain, limiting the reliability of trajectory identification. To address this limitation, stochastic approaches have been introduced to account for the variability in the input parameters. In the literature, different modelling approaches have been proposed based on data availability, the environmental setting, and the type of analysis. An incomplete list consists of STONE (Guzzetti et al., 2003; Sarro et al., 2020), RocPro3d (Sarro et al., 2014, 2018), Hy-Stone (Dinçer et al., 2016; Lanfranconi et al., 2020), RAMMS (Dhiman and Thakur, 2021), RockyFor3D (Francioni et al., 2020; Robiati et al., 2019), and RocFall (Kakavas et al., 2023; Pérez-Rey et al., 2019).
The output of runout models is commonly used to estimate the rockfall susceptibility degree by classifying rockfall trajectory counts (Dorren et al., 2023; Nanehkaran et al., 2022; Noël et al., 2023). This susceptibility measures the degree to which terrain can be affected by future slope movements. In other words, it is an estimate of “where” landslides are likely to occur and, in mathematical language, can be defined as the probability of the spatial occurrence of slope failures, given a set of geo-environmental conditions (Reichenbach et al., 2018).
Rockfall modelling, both stochastic and deterministic, presents errors associated with the input data employed to replicate the rockfall process (Straub and Schubert, 2008). The inaccuracy in defining rockfall source areas is highly relevant in modelling, since source areas provide the starting state for rockfall trajectories (Frattini et al., 2013; Rossi et al., 2020).
The location of source areas depends on several characteristics, such as slope morphology, lithology, and geological discontinuities (Alvioli et al., 2021; Sarro et al., 2018; Yan et al., 2023). At the local scale, in situ analyses commonly involve discontinuity characterization and escarpment recognition. Frequently, logistical and safety issues in the field constrain these methods. Remote sensing techniques, such as laser scanners and uncrewed-aerial-vehicle-based (UAV-based) photogrammetry, are nowadays widely used to address these limitations and obtain detailed observations of slopes (Gallo et al., 2021; Giordan et al., 2020; Sarro et al., 2018). Although both fieldwork and remote sensing methods are successful at the local scale, their utility at the regional scale is limited.
Many methods with different degrees of complexity have been proposed to identify rockfall source areas at the regional scale based on deterministic, probabilistic, or statistical approaches (Muzzillo et al., 2018). Deterministic methods identify rockfall source or detachment locations using models based on mechanical principles, while statistical methods are based on the analyses of historical catalogues of past rockfall events. For the probabilistic identification of source areas, supervised multivariate classification or machine learning models are employed to predict rockfall detachment locations (i.e. the dependent or grouping variable) based on a set of explanatory variables (i.e. independent variables).
Most of the approaches are based on the numerical analysis of digital elevation models (DEMs) and additional environmental datasets. Source areas can be identified by analysing local topography using surface slope thresholds, which denote the area with favourable conditions for boulder detachment. Larcher et al. (2012) proposed an equation to define rockfall source areas by linking the slope angle threshold and the resolution of a DEM. Rockfall source areas can also be identified empirically or derived from the decomposition of slope frequency distributions using morphometric methods based on the slope angle thresholds. Several studies determined a correlation between this threshold and the angle of internal friction of the rock massif (Loye et al., 2008; Paredes et al., 2015). Thus, the evaluation of slope frequency distributions can determine the angle of internal friction associated with each lithological unit of the rock massif, and it is used as the threshold beyond which the massif becomes unstable. In the same way, Loye et al. (2009) developed a model based on the Gaussian distribution of the slope angle values. According to the results of this slope angle distribution, for each morphological unit, the steepest slopes are selected as potential source areas (Zhan et al., 2022). Additionally, Wang et al. (2021) identify rockfall source areas controlled by rock mass strength using relief–slope angle relationships.
Other identification techniques at the regional scale are based on the analysis of remote sensing multi-temporal imagery, such as interpretation of orthophotos from optical aerial or satellite data. The use of distinctive imaging features or signs, such as scars or deposits, has been shown to be feasible in several different research projects (Liu et al., 2020; Mateos et al., 2016; Scavia et al., 2020). However, this technique is limited by the availability of satellite data and the difficulty of analysing some areas (shadowed slopes, steep slopes, and/or vegetation). Moreover, photo interpretation is time-consuming, and this often hampers its application over large areas (Alvioli et al., 2021).
Recently, advanced heuristic methods and statistical tools were proposed to identify the location of source areas with good results. A heuristic method depends on the site characteristics, and its application requires validation and special adaptation processes (Fernandez-Hernández et al., 2012). Conversely, statistical methods can be performed to assess different levels of likelihood based on geomorphological, geological, and geo-environmental factors. These methods, such as multivariate analysis, logistic regressions, or frequency ratios, are more flexible than heuristic methods but require training with representative data samples. Hybrid methods combine statistical and experimental methods, such as neural networks or machine learning decision analysis, to reduce the amount of data required and improve the accuracy of the results (Fanos and Pradhan, 2019; Rossi et al., 2020).
Rockfall modelling has seen considerable improvements in recent years; however, a significant challenge remains concerning the seamless integration of different modelling components spanning the source area definition to the susceptibility zonation. In addition, numerous studies have explored methods to identify source areas, but there are no specific studies that analyse how they influence the rockfall modelling results.
This study proposes a workflow that combines existing knowledge and new concepts and techniques to estimate rockfall susceptibility and to enhance its robustness and applicability, moving beyond case-specific solutions to provide a robust and transferable framework. The workflow integrates (i) three source area identification criteria, (ii) deterministic runout modelling, (iii) supervised and unsupervised approaches for the runout classification, and (iv) statistical methods and metrics to verify, validate, and compare the susceptibility zonation. The application at a regional scale on El Hierro Island (Canary Islands, Spain) allowed a preliminary evaluation of the workflow.
The article is organized as follows: Sect. 2 describes the test area, Sect. 3 presents the variety of methodologies employed, Sect. 4 presents the results, and Sect. 5 discusses the results and highlights the main conclusions.
2.1 Geographical and geological setting
The Canary Islands are a volcanic archipelago located in the Atlantic Ocean, within the African plate. The archipelago is made up of seven major islands (Fig. 1) and some smaller ones, which, together with underwater reliefs, form an extensive volcanic domain. The islands are the result of a long magmatic history that started 70 million years ago and has continued to the present with the recent volcanic eruption on La Palma (September 2021).
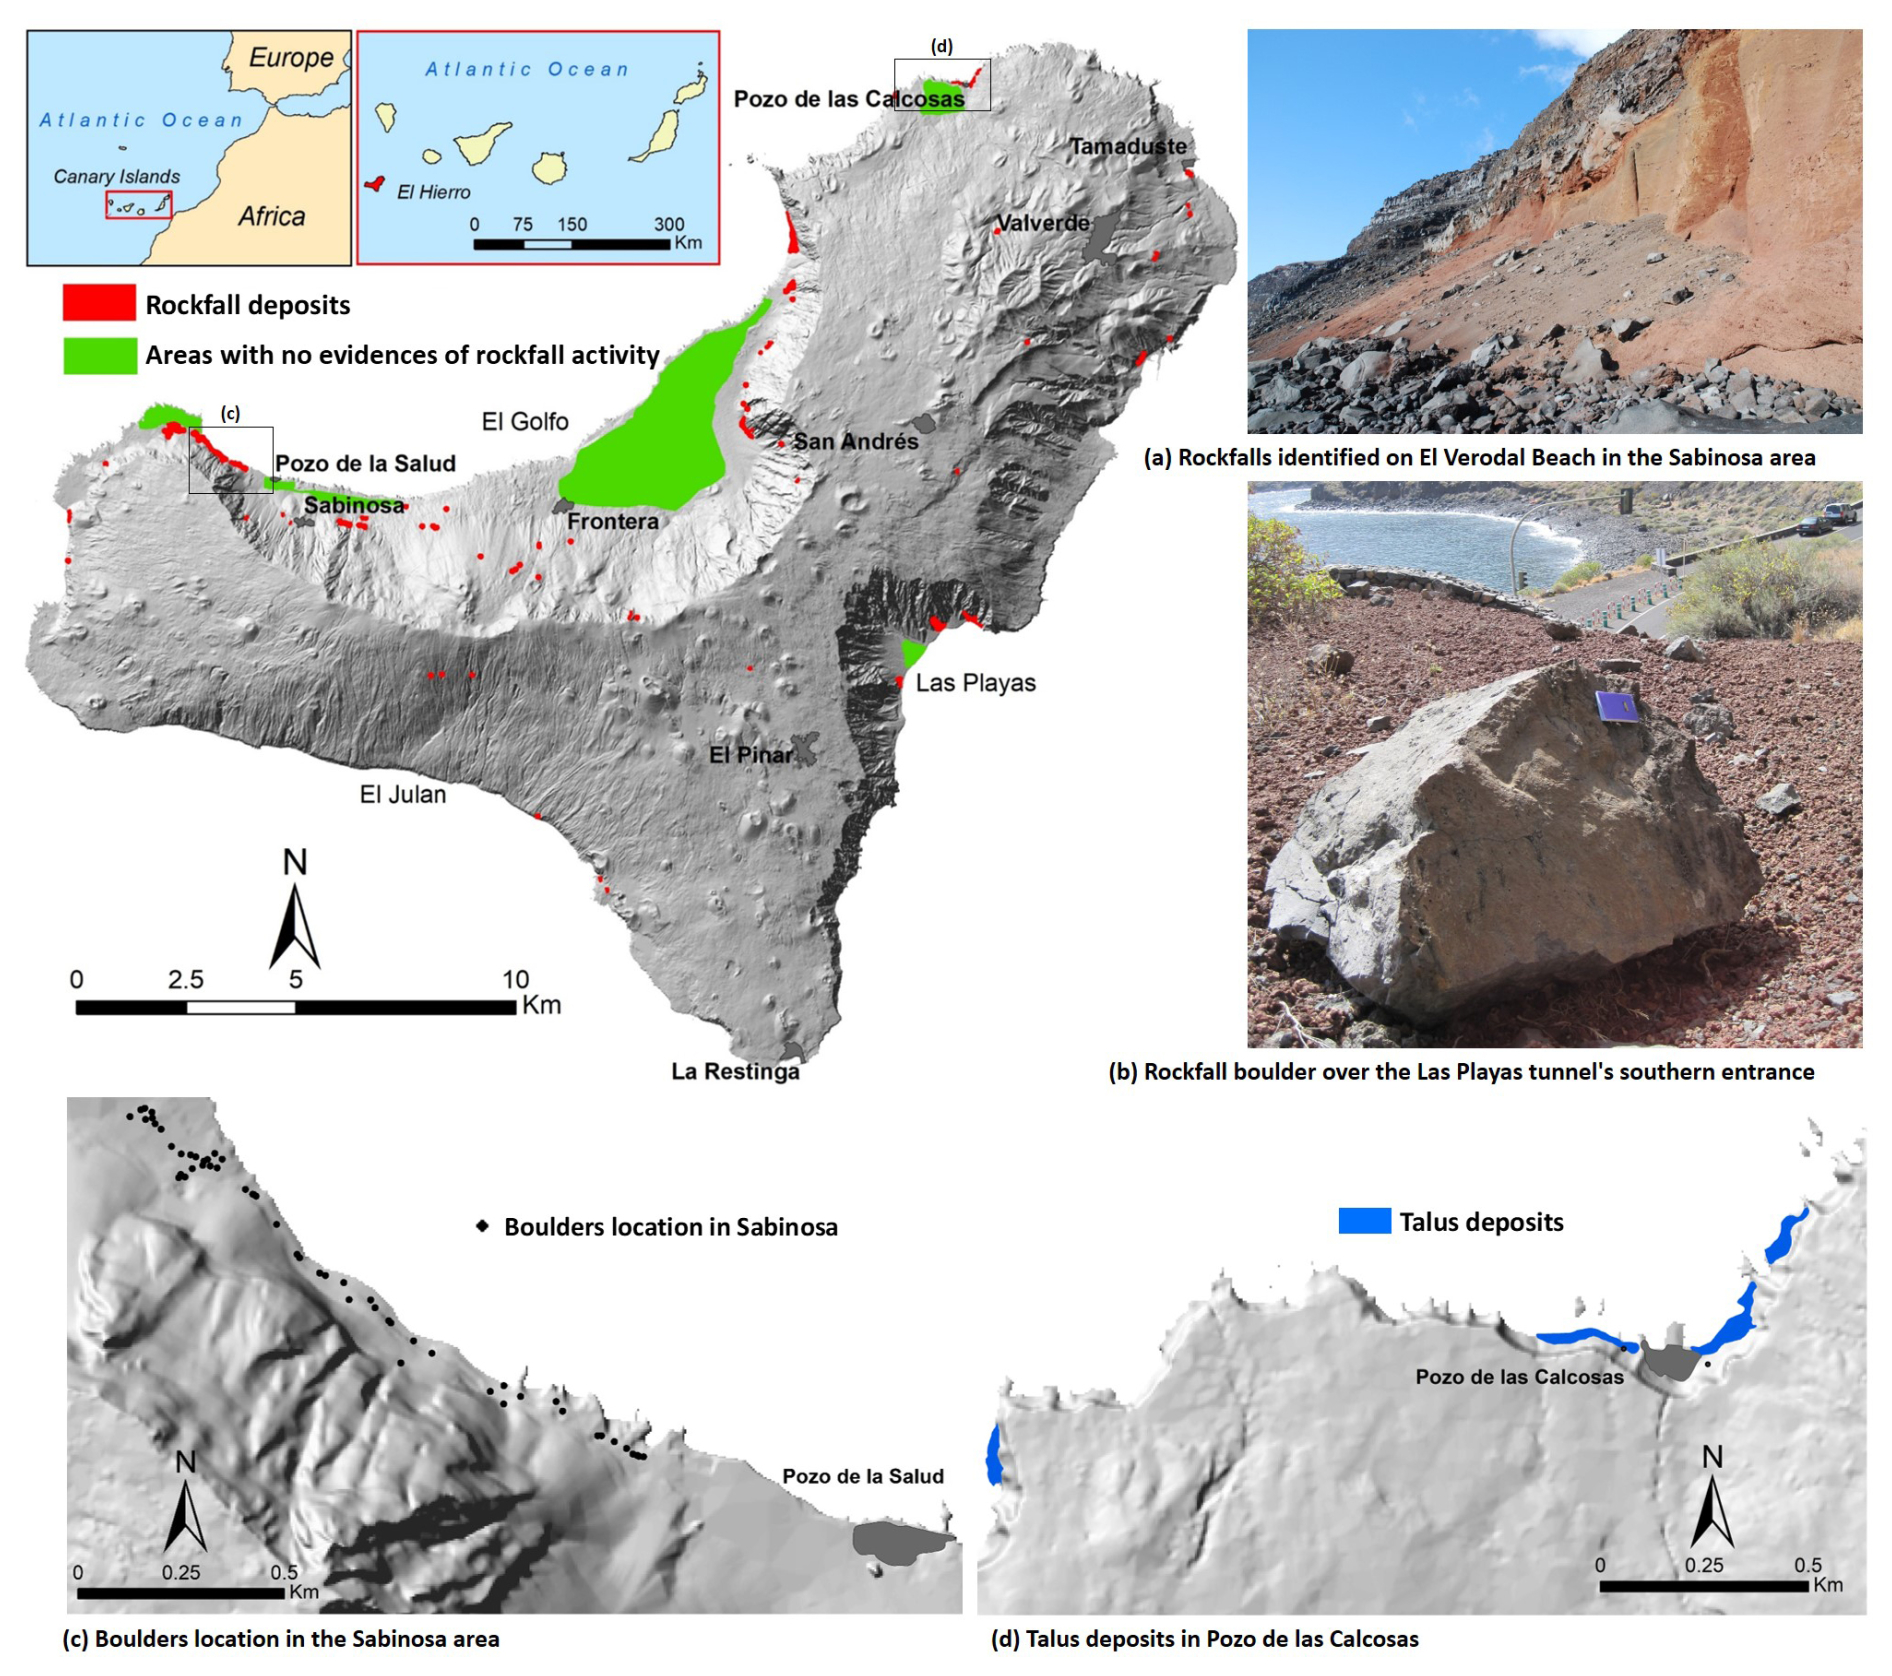
Figure 1Areas used to classify and validate the simulated rockfall runout.
El Hierro is the westernmost and youngest island, with an area of 268.71 km2 and a population of 11 147 inhabitants (Instituto Canario de Estadística (ISTAC), 2021). The climate is subtropical oceanic along the coast and is very mild and sunny for most of the year, with rainfall concentrated in October to March. Heavy storms are frequent, associated with intense rainfall and strong winds that often trigger landslides. The average temperature ranges between 19 and 25 °C, with maximum values in August.
The morphology of the island is the result of numerous volcanic events associated with important geological features. One of the most characteristic features of El Hierro is the occurrence of large landslides, which correspond to the escarpments of El Golfo, El Julan, and Las Playas, located in the north, southwest, and southeast, respectively (Fig. 1). The northern part, El Golfo, with cliffs that reach an elevation of more than 1100 m, is a hazardous area for rockfalls. During the period of 2011–2012, a submarine eruption took place about 2.5 km off the coast near the village of La Restinga. The highest seismicity was in the El Golfo area, with two earthquakes of magnitude 4.4 and 4.6 in mid-November 2011. The seismic events triggered rockfalls near the Los Roquillos tunnel, one piece of strategic infrastructure that connects the municipalities of Frontera and Valverde, the most populous villages on the island. After the event, the first field observations carried out by technicians of the Geological and Mining Institute of Spain (IGME-CSIC) allowed us to evaluate the cliff stability along the road HI-5, where the Roquillos tunnel is located. The report that was prepared showed a complex scenario for the analysis of rockfall hazard and the definition of source areas. The field surveys revealed that the dikes that outcrop on the escarpments of El Golfo and Las Playas are preferential rockfall source areas. Recently, on 14 March 2021, a large rockfall along the El Golfo escarpment alerted the population and caused a general alarm.
2.2 Available data and products
For El Hierro Island, the following data are available: (1) a digital elevation model (DEM) at a 5 m × 5 m resolution (Centro de Descargas del CNIG (IGN), 2024) that was used to compute morphometric parameters (elevation, slope, curvature, landform classification, etc.) and (2) lithological information derived from the geological map provided by IGME-CSIC at a scale of 1:25 000. The map was reclassified into seven geotechnical classes (Sarro et al., 2020; Rossi et al., 2020), ranging from class 1, which includes soft soils (such as lapilli and sand), to class 7, which includes extremely hard rocks (dikes and volcanic breccias).
In this paper, we have used different thematic data to identify source areas and to perform rockfall modelling and susceptibility zonation. The methods to identify source areas require diverse types of information. (i) Unsupervised slope thresholding (STRSA) and slope angle empirical cumulative distribution functions (ECDFs) (CDFRSA) require only slope data; (ii) supervised STRSA and CDFRSA require slope data and the location of source areas (i.e. normally mapped in the field; Rossi et al., 2020); and (iii) probabilistic identification (PROBRSA), together with the location of source areas, exploits the following additional geo-environmental information as conditioning factors: topography parameters (i.e. slope, curvature, and aspect derived from the DEM), lithology, and the presence of dikes (Rossi et al., 2020).
For the runout modelling, the following additional data were used: (i) a sample of mapped rockfall deposits in polygon format for the supervised cumulative distribution function (CDF) analyses of rockfall trajectories, (ii) a sample of areas affected by or with no evidence of rockfalls for the receiver-operating-characteristic-based (ROC-based) model performance evaluation, and (iii) a sample of the rockfall boulder locations (i.e. silent witnesses) for the violin plot and boxplot susceptibility zonation.
The rockfall information used in the runout simulation classification, and validation was derived using diversified techniques and sources of information. Using field investigations conducted from 2012 to 2018 (47 records), aerial image interpretation (84 records), and data from the MOVES database (BDMoves, 2024) (78 records), we have identified rockfall deposits (red polygons in Fig. 1) that include single detached boulders (i.e. mapped as points; black dots in Fig. 1c) and talus deposits (i.e. mapped as polygons; blue polygons in Fig. 1d). Additionally, areas with no evidence of rockfall activity were recognized in the field by experts, with the support of geomorphological and topographical maps (i.e. green polygons in Fig. 1).
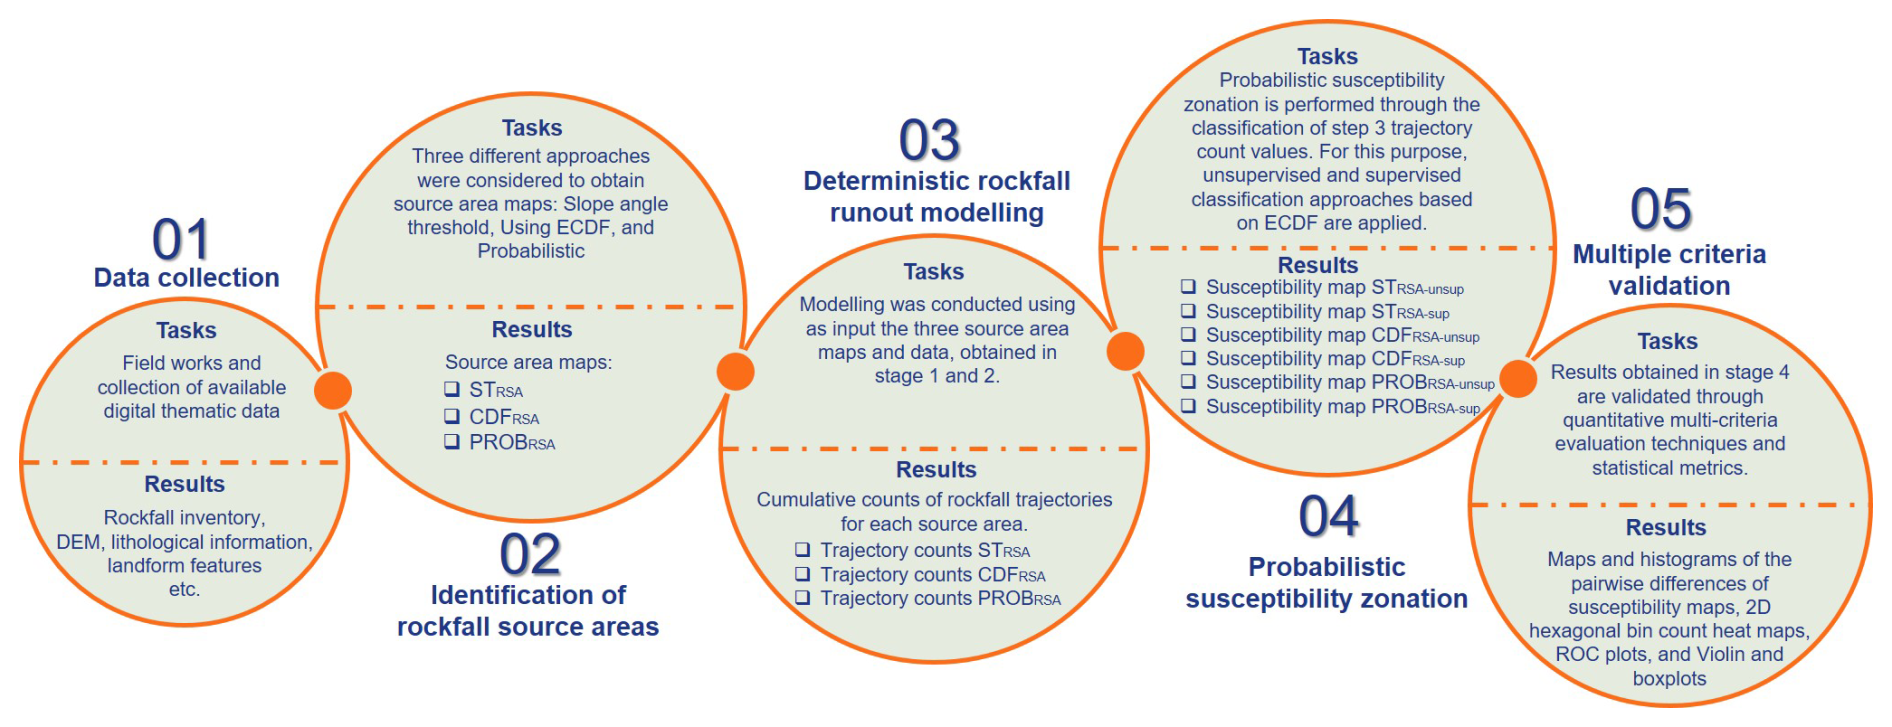
The methodology proposed in this study can be formalized in a workflow that considers different steps (Fig. 2).
- 1.
The first step is typical of any rockfall study, where available relevant data are collected (field surveys, photo interpretation, etc.).
- 2.
The second step focuses on the identification of rockfall source areas, a critical input for the subsequent analyses performed using different approaches.
- 3.
The third step is the deterministic rockfall runout modelling using the source areas from step (2) as input. The main output is a map of the cumulative count of rockfall trajectories.
- 4.
The fourth step derives probabilistic susceptibility zonation through the classification of the trajectory count values from step (3). Unsupervised and supervised classification approaches based on the empirical cumulative distribution function (ECDF) are applied for this purpose.
- 5.
The fifth step validates and verifies the susceptibility maps and assesses the reliability of susceptibility zonation using quantitative multi-criterion evaluation techniques and statistical metrics.
The five methodological steps, their application to the study area, and the results are illustrated in the following sections.
3.1 Identification of rockfall source areas
The maps of the source areas are crucial data for the rockfall analysis. In our study area, we have used three different approaches: (i) a morphometric schema based on the slope thresholding, (ii) cumulative distribution functions (CDFs) that consider slope information and geology, and (iii) a probabilistic model.
3.1.1 Slope thresholding
This method (hereafter referred to as STRSA) relies on a simple morphometric approach, which identifies potential rockfall detachment zones as those areas with a slope angle above a given threshold. Even though rockfalls initialize mainly on steep slopes and the steepness of the hillslope surface can be used to identify potential source areas, it is more realistic to determine a slope threshold using distinctive evidence (e.g. deposits, inventory) rather than arbitrarily establishing one (Michoud et al., 2012).
According to Fu et al. (2021), more than 80 % of 2238 rockfall records collected in Sichuan (China) over the past 30 years occurred on hillslopes with slopes ranging between 30 and 50°, with most of them around 40°. As the result of a historical rockfall study in the Yosemite Valley (California, USA), Guzzetti et al. (2003) identified slopes above 60° as potential release points. In the region of Vaud county (Switzerland), Jaboyedoff and Labiouse (2011) determined slope thresholds between 47 and 54°. Based on the experience of the Trentino Geological Survey, Frattini et al. (2008) selected as source area cells with slope angles over 37° in Val di Fassa (Dolomites, eastern Italian Alps). Overall, most of the previous studies cited reveal slope thresholds over 30°.
Sarro et al. (2020) proposed a slope threshold over 40° on Gran Canaria (Canary Islands), an island with similar topographical and geological conditions to El Hierro. Detailed evaluations revealed that the source areas in Gran Canaria are primarily associated with hard, very hard, and extremely hard rocks, corresponding to geological types such as dikes and breccia, phonolite, massive basalt, trachyte, and ignimbrite. Considering that the geological context of El Hierro where rockfalls are observed is similar to that of Gran Canaria, we have defined the threshold above 40°. The map obtained using the slope thresholding method is binary, with 0 corresponding to stable areas and 1 to rockfall-prone detachment zones.
3.1.2 Statistical identification of rockfall source areas using slope angle ECDFs
For the second identification of rockfall source areas, we utilized the empirical cumulative distribution functions (ECDFs) of slope angle values (hereafter referred to as CDFRSA).
An ECDF function returns the probability that a random variable is less than or equal to a given value (Lee et al., 2022). In mathematical terms, this is expressed by Eq. (1):
where FX(x) denotes the ECDF of a random variable X, whose probability distribution is f(x).
ECDF has lower and upper limits of 0 and 1, respectively, and gives a cumulated probability that increases with the x value. Equation (2) shows the values taken by ECDF or FX(x) for infinite boundaries of the random variable and Eq. (3) the relation between FX(x) values for successive values of x.
In our study, we selected the slope value as the random variable X, and using a supervised approach, we analysed only the slope values corresponding to the mapped rockfall detachment areas (source area inventory in Rossi et al., 2020) to derive CDFRSA. Thus, CDFRSA gives the probability that the slope in rockfall source areas is less than or equal to a given value. This function represents the cumulative probability of the slope causing rockfalls and can be used as a quantitative probabilistic estimation of rockfall detachment for given slope values. The map of source areas obtained using the CDFRSA approach is a probabilistic map, with values ranging from 0 to 1 for a 0 % probability or a 100 % probability of being a potential rockfall detachment area, respectively. The slope values corresponding to a classification of 1 in the CDFRSA approach range from 62 to 85°, with a mean slope of 77°. In contrast, the slope values associated with a classification of 0 do not exceed 47.27°, exhibiting a mean slope of 16°.
3.1.3 Probabilistic identification of rockfall source areas using LAND-SUITE
The third method for the source area identification (hereafter referred to as PROBRSA) proposes a probabilistic modelling framework that applies a combination of multiple multivariate statistical classification models, using the source area locations mapped in the field as the dependent variable and a set of thematic data as independent variables (i.e. morphometric data derived from DEMs and lithological data). The model uses morphometric parameters derived from the digital elevation model and lithological data as an expression of the mechanical behaviour of the rocks as input.
As described in detail in Rossi et al. (2020), we applied the probabilistic framework using LAND-SUITE (LANDslide – Susceptibility Inferential Tool Evaluator), an R-based open-source program (Rossi et al., 2022; (Rossi and Bornaetxea, 2021). The software allowed us to obtain a probabilistic map that expresses the probability of a certain area being a potential rockfall source area. A logistic regression model integrated into the tool was used for the preliminary analysis of different training and validation scenarios to determine whether the model was sensitive to the selection of dependent variables and to identify the best model training configuration for application on the island. Four scenarios were evaluated, incorporating variations in training and validation areas, as well as the inclusion of active-source areas (areas with recent geomorphological evidence of rockfall detachments) and prone areas (geologically and geomorphologically susceptible to rockfalls but lacking recent detachment evidence). The optimal scenario involved model training using data from four fieldwork sites (Sabinosa, El Golfo, Las Playas, and La Estaca), with validation applied to the entire island. This configuration achieved the best performance, with an accuracy of 91.28 % in training and a small difference in validation (2.68 %), as well as an area under the curve (AUCROC) of 0.954, the highest among all scenarios. Therefore, the source map obtained using this scenario stands out as the most consistent model, delivering the best performance in island-wide validation.
The final source area zonation was prepared applying a combination of different statistical modelling methods, namely a linear discriminant analysis, a quadratic discriminant analysis, and a logistic regression model. Then, different LAND-SUITE tools were used to evaluate probabilistic source area maps that resulted from different model applications and configurations to verify the modelling performance and to estimate the associated uncertainty. The resulting probabilistic source area zonation was evaluated by integrating the output, expressing the variation for a variety of probability thresholds. Specifically, contingency matrices and plots along with model sensitivity, specificity, Cohen's kappa indices, and ROC curves with the corresponding area under the curve (AUCROC) values were used to compare the observed and modelled source areas and to quantitatively explore the performance of different model configurations, allowing the selection of the best model and the corresponding probabilistic source area map. See Rossi et al. (2022) for the details on the training, validation, and combination procedure.
Similarly to the previous identification approach, the map of the source areas obtained using the method implemented in LAND-SUITE is a probabilistic map, with values ranging from 0 to 1 for a 0 % probability or a 100 % probability of being a potential rockfall detachment area, respectively.
3.2 Deterministic rockfall runout modelling
The rockfall runout simulation is a core analysis in rockfall modelling. On El Hierro Island, it was performed using a physics-based model employing the maps described above as input source areas (Fig. 3a, b, c). Such a model is based on the fundamental principles of mass and energy conservation and is employed extensively worldwide to study rockfall runout. In this study, we used STONE, a distributed three-dimensional software based on physics-based simulations. The software is raster based and applies a lumped mass approach to simulate boulder movement along the topography described by a digital elevation model (Guzzetti et al., 2002). The software requires four main inputs: (i) a digital elevation model, (ii) three coefficients maps (i.e. dynamic rolling friction, normal energy restitution, and tangential energy restitution) that simulate the energy loss of a boulder when rolling and bouncing at impact points, (iii) a map portraying the location of the rockfall source areas, and (iv) a map of the number of simulations to be run during modelling (Table 1).
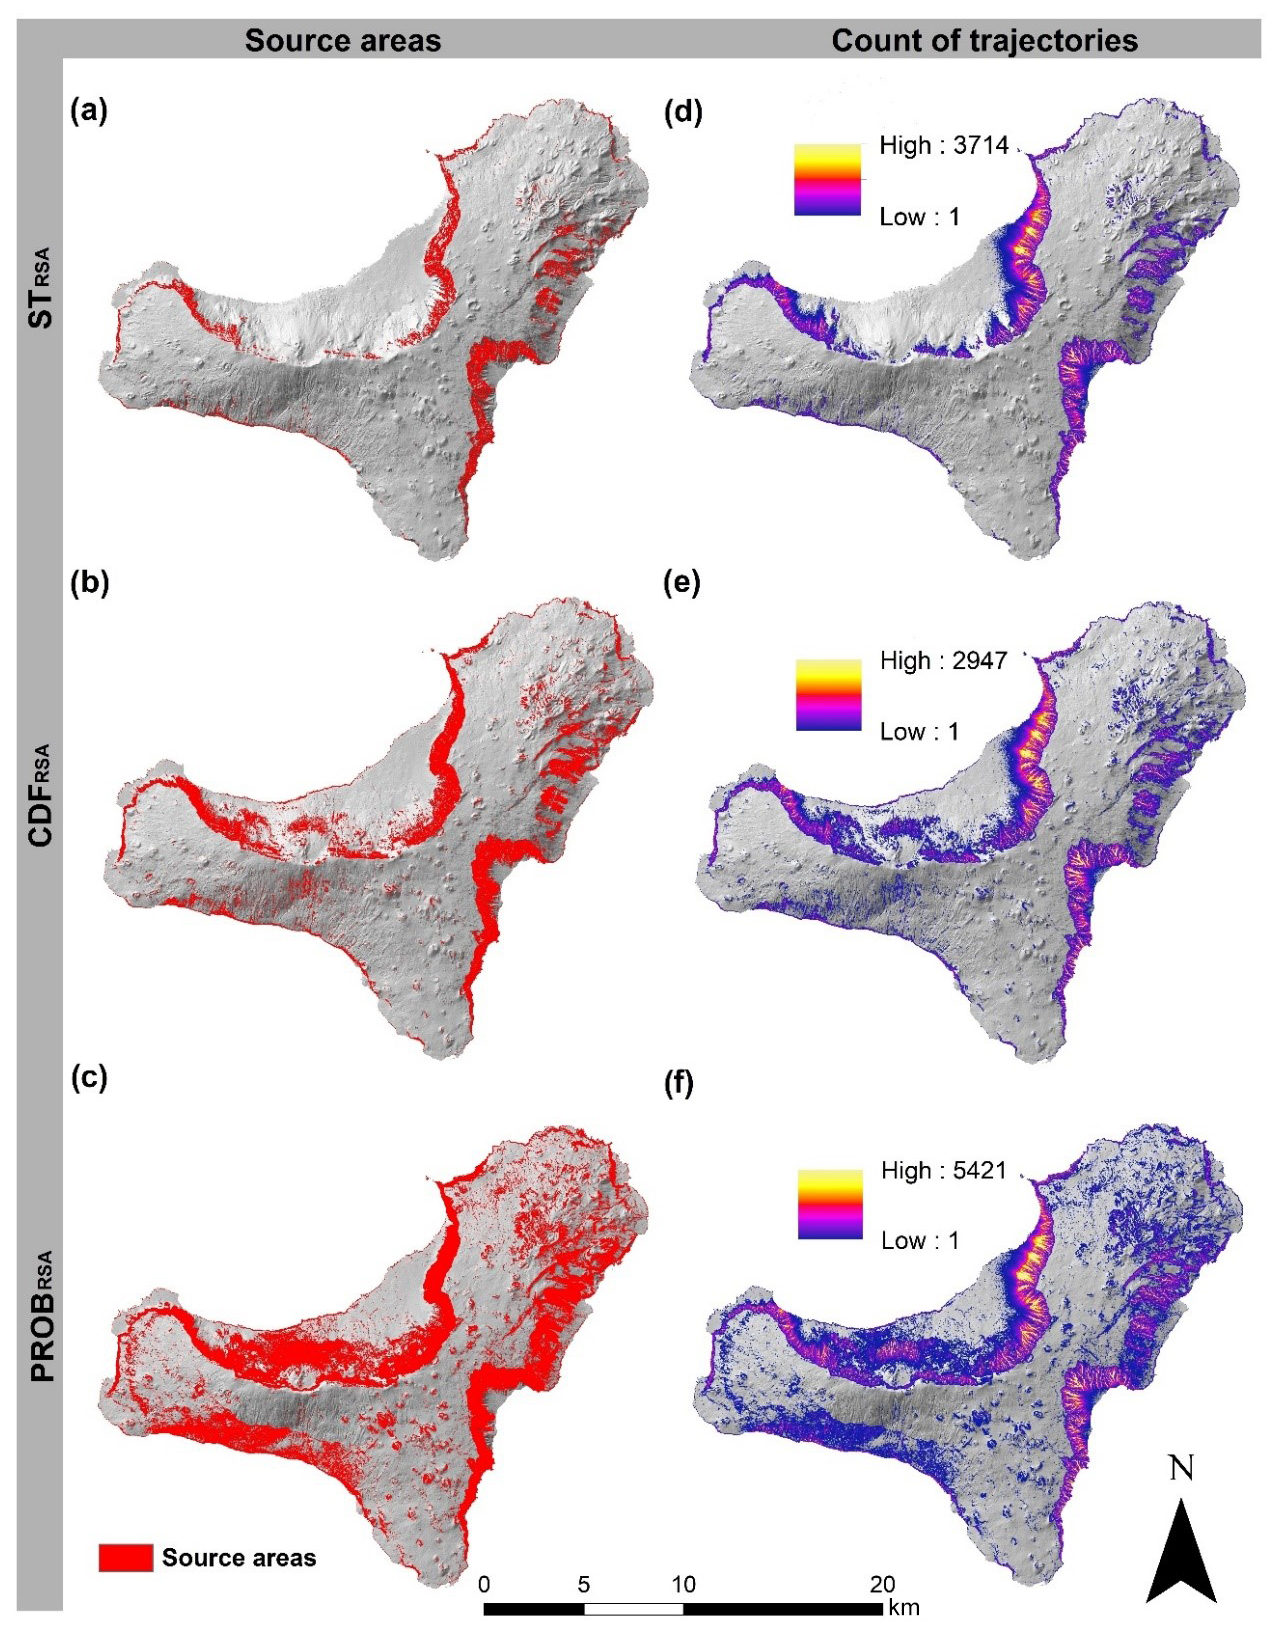
Figure 3The column on the left shows the maps of the source areas identified using the three different approaches (a, STRSA; b, CDFRSA; and c, PROBRSA), and the column on the right shows the cumulative counts of rockfall trajectories for each map (d, e, f). See Table 2 for the pixel counts of each map of the source areas.
Table 1The table shows values of the coefficients (i.e. dynamic rolling friction, normal energy restitution, and tangential energy restitution) used in the rockfall modelling.
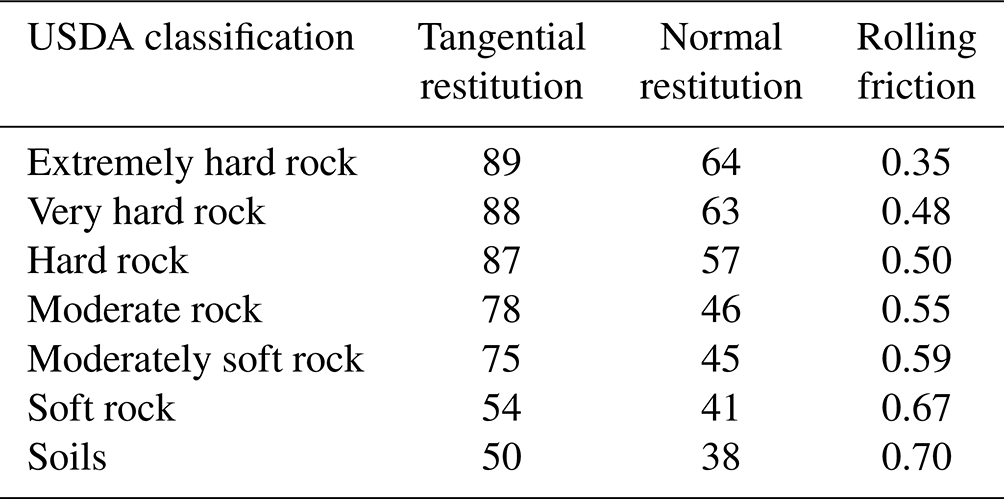
The three maps of the coefficients were estimated by considering the different lithological and geotechnical categories reported on the geotechnical map of El Hierro and by selecting values reported for similar lithologies in the literature (Alvioli et al., 2021; Guzzetti et al., 2003; Mateos et al., 2016; Sarro et al., 2020).
The number of simulations run for each source area pixel was obtained by multiplying the binary (i.e. 0 or 1) or probabilistic (i.e. from 0 to 1) value of the source area maps by 10, successively rounded to the closest integer value.
The main output of the runout modelling computed for the three source area maps is the cumulative count of rockfall trajectories (Fig. 3d, e, f).
3.3 Classification of rockfall runout for susceptibility zonation, model comparison, and validation
The map of the rockfall trajectory counts estimates the possibility of a specific pixel being impacted by a rockfall. To derive rockfall susceptibility maps, the trajectory values can be classified using different systems, including equal interval, natural break, quantile, standard deviation, head/tail breaks, and landslide percentage (Alqadhi et al., 2022; Baeza et al., 2016; Cantarino et al., 2019; Tehrani et al., 2022; Wang et al., 2016) in order to make a qualitative interpretation of the results.
To generate a probabilistic susceptibility map, we employed two classification approaches based on the ECDF of trajectory counts and considering an unsupervised and a supervised method.
The unsupervised classification technique is based exclusively on the raster map of rockfall trajectory counts. This method classifies the map by utilizing the ECDF derived from the values of counts obtained in the entire study area with the rockfall runout model (i.e. cells with count values greater than or equal to 1). The resulting map presents values ranging from 0 to 1, representing a probabilistic estimate of the likelihood of each pixel being affected by a rockfall event. Consequently, pixels equal to 1 indicate areas where the susceptibility model predicts the highest probability of rockfall occurrence.
The supervised classification method works similarly, but in this case, the ECDF analysis considers only the count of the trajectories together with the rockfall deposits and/or rockfall talus mapped in the study area. The rockfall deposit mapping can be affected by uncertainty and, to be reliable, should be statistically representative of the different geo-environmental settings controlling rockfall occurrence and evolution.
This two-fold classification methodology was applied to the maps of trajectory counts obtained by STONE using the three maps of source areas as input (i.e. STRSA, CDFRSA and PROBRSA). As a result, we obtained six ECDF graphs and six susceptibility maps that we compared and analysed using different analyses. The six susceptibility maps were evaluated in pairs considering the three source area maps and the two classification methods. To investigate and quantify the diversity, we used maps of the differences and histograms that enabled the identification of the locations where the susceptibility maps show a higher (or a lower) likelihood of rockfall occurrence. Additionally, two-dimensional (2D) hexagonal bin count heat maps derived from the different couplings of susceptibility maps were plotted to show the correlations between the model outcomes. Hexagonal binning for map comparison is a technique used in data visualization, particularly when dealing with large datasets in 2D scatter plots. It groups data points into hexagonal bins (rather than traditional square bins) to provide a more structured view of the data distribution. The hexagonal shape is often preferred because it avoids the visual artefacts that can result from aligning data into rectangular grids and provides a more compact and efficient way of packing data points (Wickham, 2016).
To validate the models, we used two rockfall inventories: (i) a polygon-type inventory with zones reached by rockfall boulders and zones without any significant evidence of potential boulders having reached them (i.e. red and green polygons in Fig. 1) and (ii) a point-type inventory with the locations of isolated rockfall boulders at their final reaches after runout (i.e. silent witnesses; black dots in Fig. 1c). We first used the polygon-type inventory to derive ROC plots (Rossi et al., 2010, 2022; Rossi and Reichenbach, 2016) and the corresponding area under the curve (AUCROC) in order to show the differences between the modelled and observed susceptibility values and provide quantitative estimates of the final rockfall susceptibility zonation performance, regardless of the classification approach adopted. Successively, we analysed the distribution of average susceptibility values (i.e. violin plots and boxplots) within circular buffers of different sizes built around the boulder locations reported in the point-type inventory to verify the ability of the models to discern susceptible conditions corresponding to and in the vicinities of mapped rockfall boulders. Different buffer sizes allow us to consider uncertainty due to local conditions and boulder locations. In the proposed approach, the location of the mapped boulders is used to evaluate the rockfall susceptibility zonation. Commonly, this information is used to evaluate runout models, verifying whether simulations reach the boulder locations entirely or partially. The violin plots show the distributions of the susceptibility data and specifically their probability density, and together with boxplots, they help visualize summary data statistics such as median values and interquartile ranges.
4.1 Comparison of different maps of the source area
Following the steps of the methodology, we first compared the maps of the source areas prepared using three different approaches (see Sect. 3.1), which cover the entire island with consistent and equal spatial coverage.
For the slope thresholding approach (STRSA), we determined a threshold of 40° by combining geomorphological data, geological analysis, and historical rockfall events. In this case, for the entire island, a total of 727 603 px were identified as being prone to rockfall detachments, corresponding to 18.19 km2 (6.8 % of the island, Table 2). To carry out the rockfall simulation, the binary map was multiplied by 10, resulting in two distinct values: 10 simulations corresponding to the rockfall source areas and 0 elsewhere.
Table 2The table shows the spatial extension of the source areas identified by the three approaches (i.e. STRSA, CDFRSA, and PROBRSA).
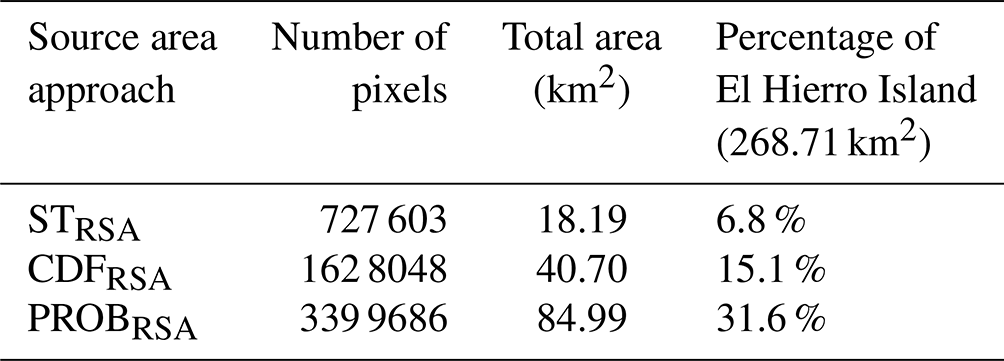
In the second approach, we used CDFRSA to obtain a probabilistic source map with values ranging from 0 to 1, respectively, for a 0 % probability or a 100 % probability of the area being a potential rockfall detachment area. Unlike the binary values in the STRSA map, this probabilistic information allows us to identify the source areas with different levels of certainty. The map shows that 1 628 048 px have non-zero probability of being a potential detachment area, twice the number of pixels identified using the slope thresholding approach (STRSA). Source areas identified through CDFRSA cover a total area of 40.70 km2, around 15 % of the island's surface. In this case, the map of the number of runout simulations has integer values ranging from 0 to 10.
The third source area map obtained using the PROBRSA method shows a total of 3 339 686 px with a non-zero probability of being a potential detachment area, which is equivalent to 84.99 km2 or approximately 31.6 % of the entire island surface. Similarly to the CDFRSA case, the resulting map of the number of simulations has integer values ranging from 0 to 10.
The comparison of source areas identified using the three methods was performed using a spatial overlay in raster format and using frequency-based criteria. The three maps show a diversified spatial arrangement: a total of 727 423 px were recognized as source areas through the three different methods, with the matching areas mostly located on steep slopes (Fig. 4). No pixels were identified as a source area by STRSA alone, as they were always associated with either CDFRSA or PROBRSA. The number of pixels identified by PROBRSA alone is 1 855 918, corresponding to more than 55 % of the pixels identified using other methods or combinations of methods (Table 3).
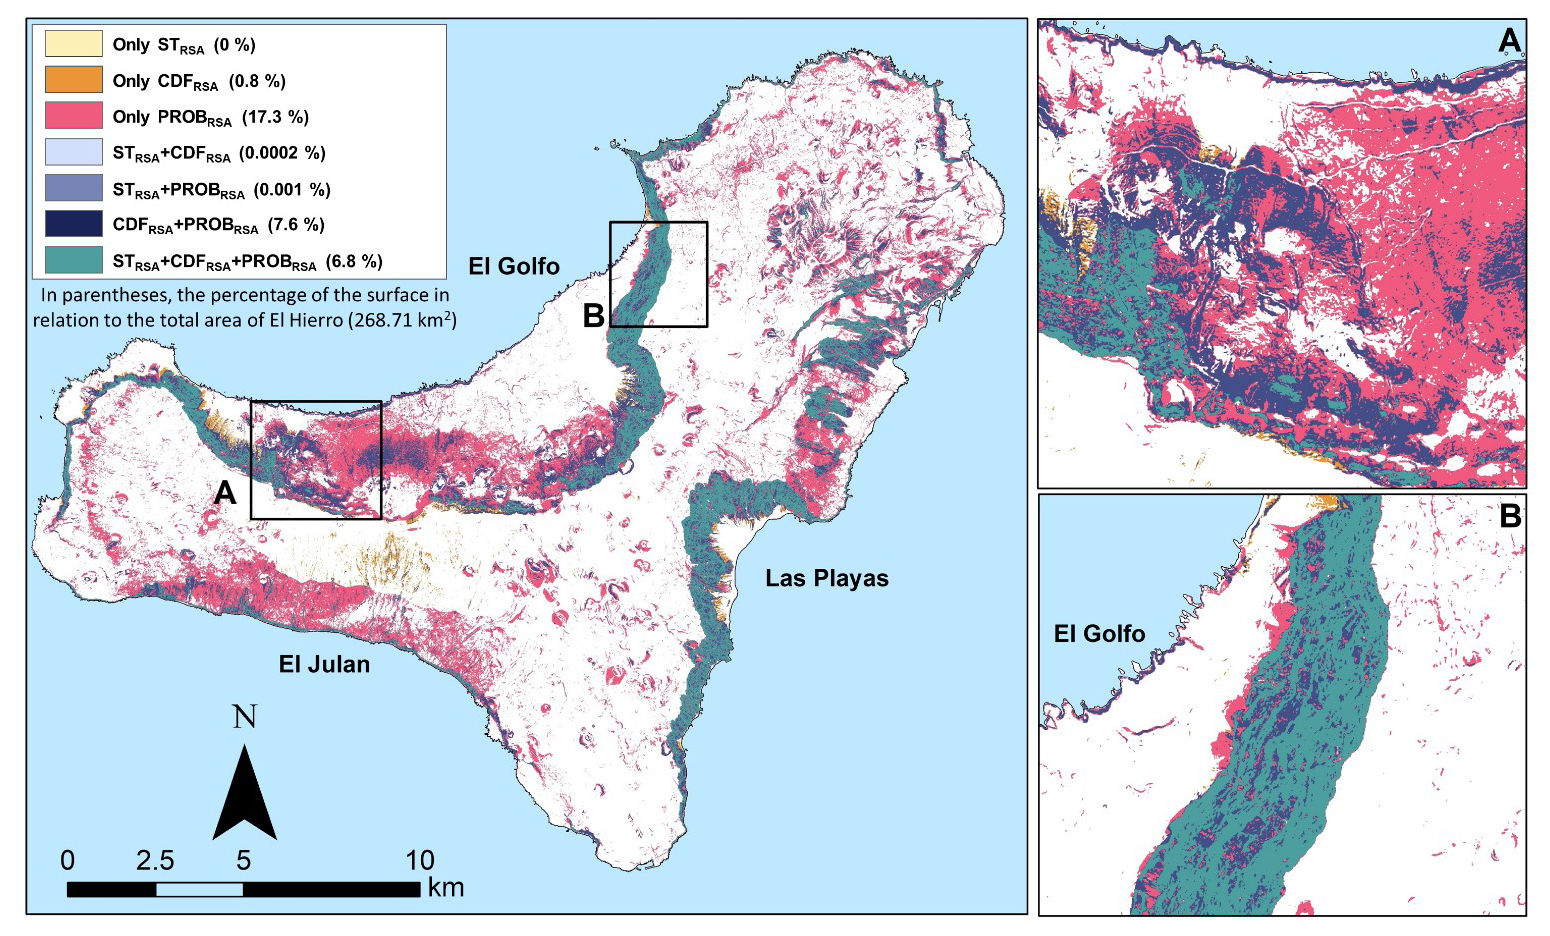
Figure 4The map shows the spatial comparison of the source areas identified using the three different approaches (i.e. STRSA, CDFRSA, and PROBRSA).
Table 3This table shows the differences in the spatial distribution of source areas identified by the three approaches (i.e. STRSA, CDFRSA, and PROBRSA).
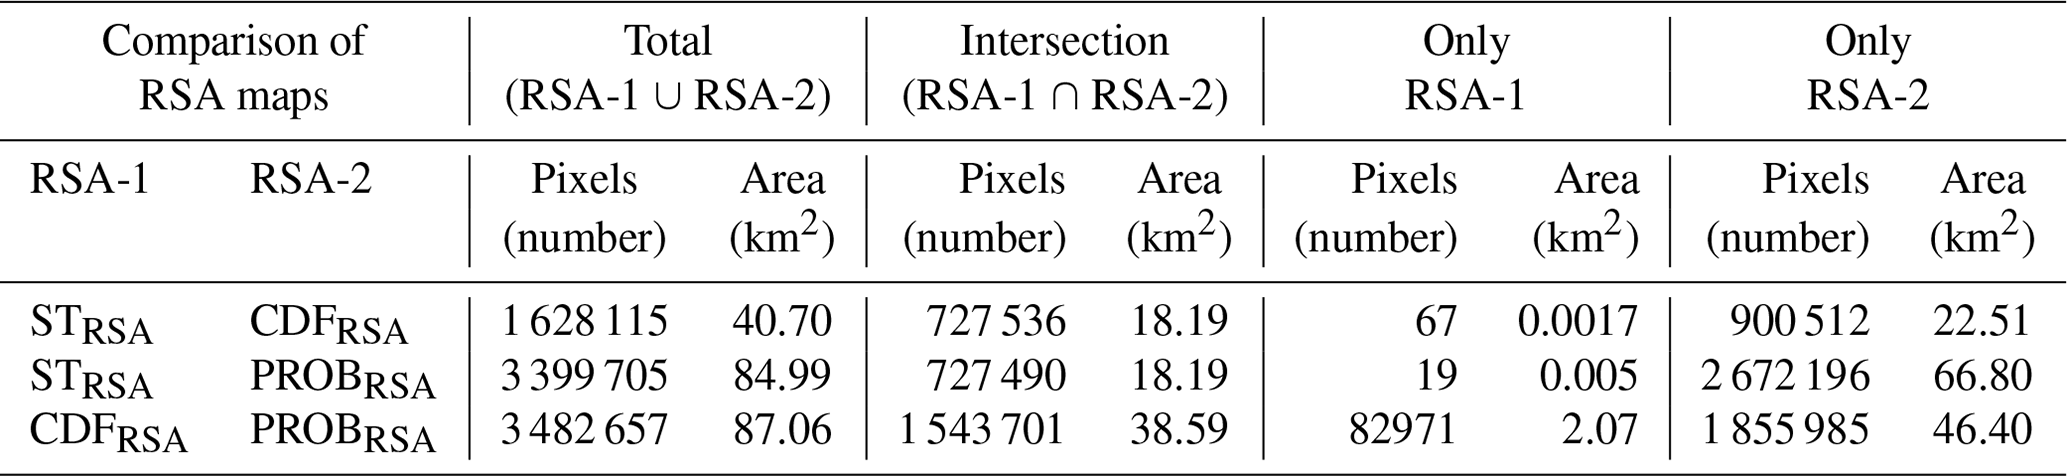
The largest RSA match is observed between CDFRSA and PROBRSA, 816 278 px (20.40 km2), while the largest mismatch was for STRSA and PROBRSA, with a deviation of 2 672 196 px (66.80 km2) detected by PROBRSA but not by STRSA. This provides evidence that the PROBRSA tends to identify a larger number of source areas, covering a larger portion of the study area (1 855 918 px and 46.39 km2).
An additional analysis to evaluate the possible relation with the geotechnical classes revealed that only STRSA is able to identify source areas in regions with soft and hard soils.
4.2 Comparison of rockfall simulation and susceptibility maps
The output of the runout simulations (Fig. 3d, e, f) shows diverse spatial distributions of rockfall trajectory counts, providing potentially different information on the susceptibility to rockfalls. To obtain comparable rockfall susceptibility maps, we classified the trajectory count maps using unsupervised and supervised ECDF analyses (Figs. 5 and 6). The application of the ECDFs to the relative trajectory count maps allows us to derive the six probabilistic susceptibility maps shown in Fig. 5. The figure reveals evident differences between the maps derived from the unsupervised ECDFs (Fig. 5a, b, c) that are reduced when considering the supervised alternatives (Fig. 5d, e, f).
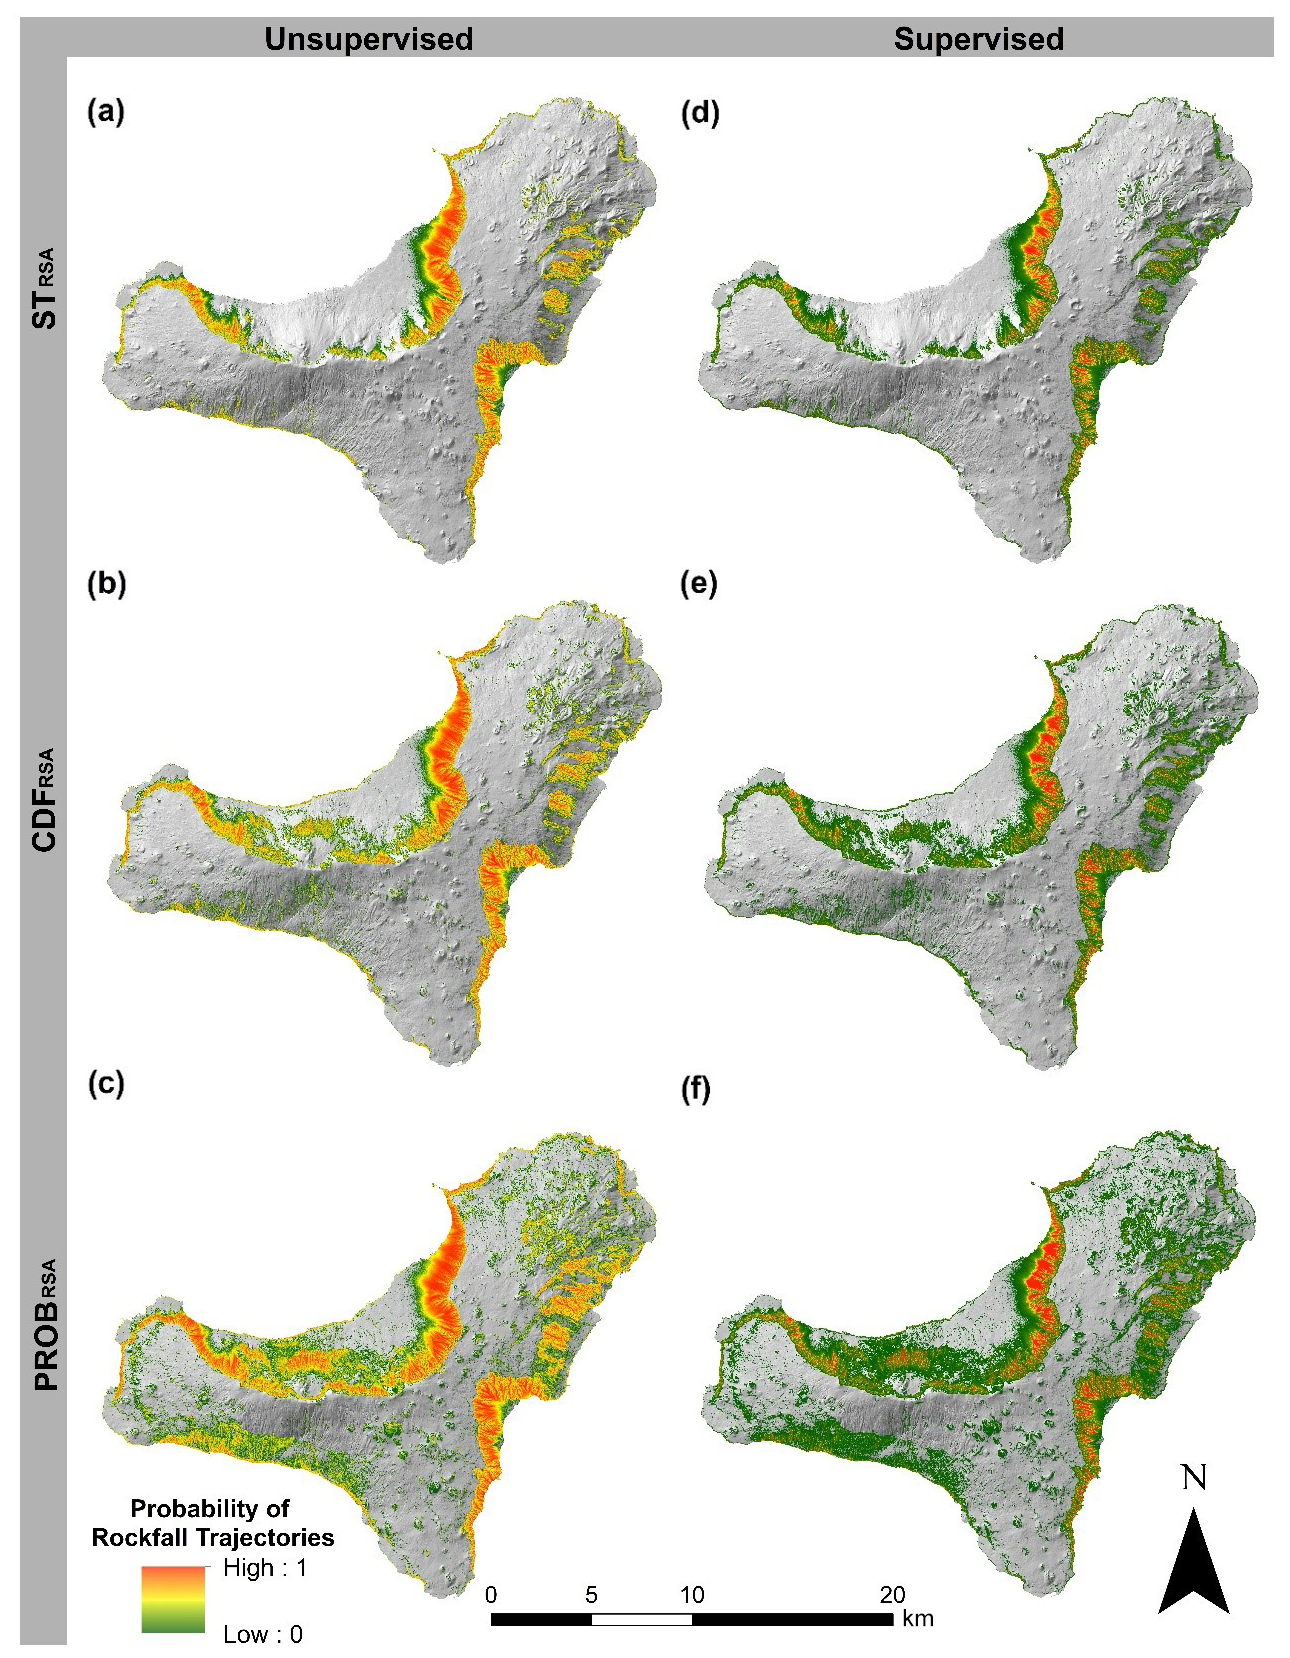
Figure 5Probabilistic susceptibility maps derived from the application of unsupervised (a, b, c) and supervised (d, e, f) ECDF functions (Fig. 6).
Different plot representations were used to compare the six maps and to understand their differences. Figure 6 shows the unsupervised and supervised ECDF functions derived from the outputs obtained using the three source area maps. The unsupervised distributions show larger ranges and a higher number of cells with low trajectory counts (i.e. values close to 0). Additionally, the comparison of the unsupervised ECDFs (Fig. 6a, b, c) reveals a larger number of cells with high count values for STRSA followed by CDFRSA and PROBRSA; this behaviour is reversed when considering the supervised ECDFs (Fig. 6d, e, f).
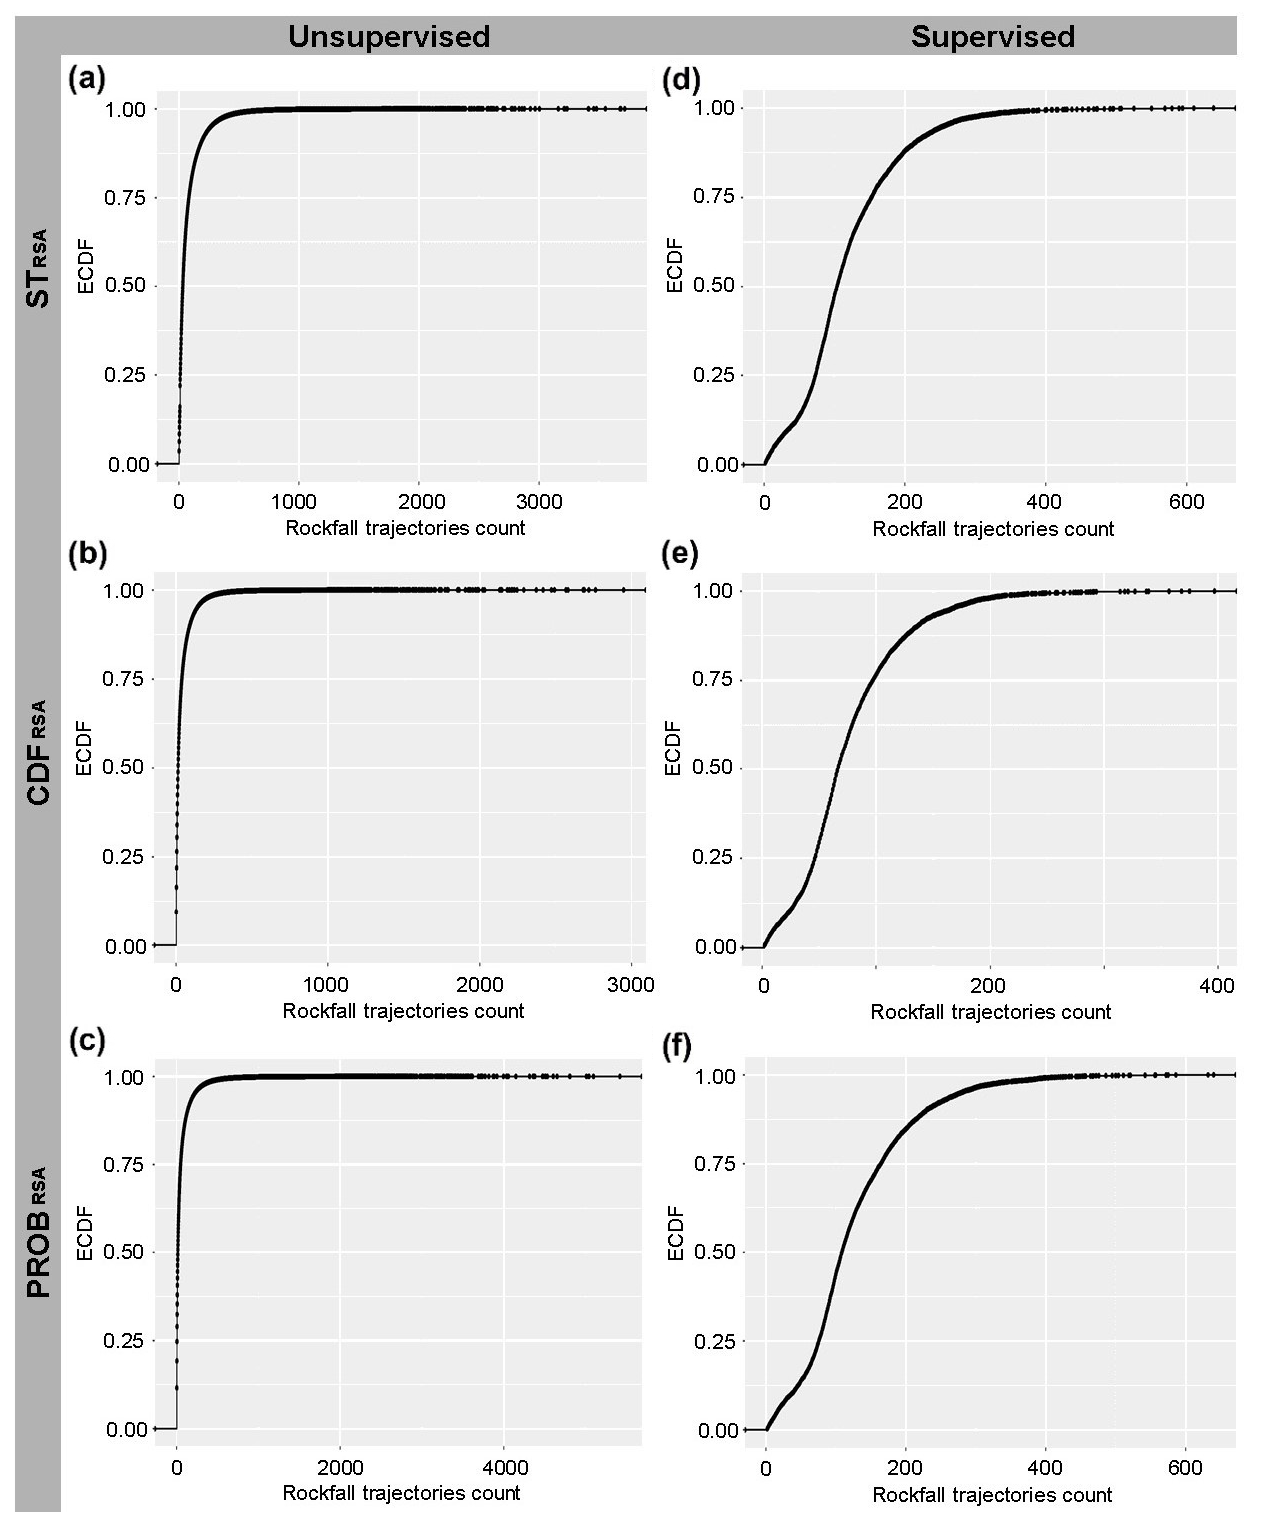
Figure 6Unsupervised (a b, c) and supervised (d, e, f) ECDF functions derived for outputs obtained from the different source area identification methods.
Figures 7 and 8 show the pairwise differences in susceptibility maps obtained using different source area maps and the diversified classification method. Specifically, the figure portrays the following six pairs of results: (a) STRSA-unsup − CDFRSA-unsup, (b) STRSA-unsup − PROBRSA-unsup, (c) CDFRSA-unsup − PROBRSA-unsup, (d) STRSA-sup − CDFRSA-sup, (e) STRSA-sup − PROBRSA-sup, and (f) CDFRSA-sup − PROBRSA-sup. The lighter colours (i.e. lower absolute difference values) between supervised map pairs and the frequency counts of the corresponding histograms highlight lower differences between the susceptibility outputs obtained by applying supervised ECDFs.
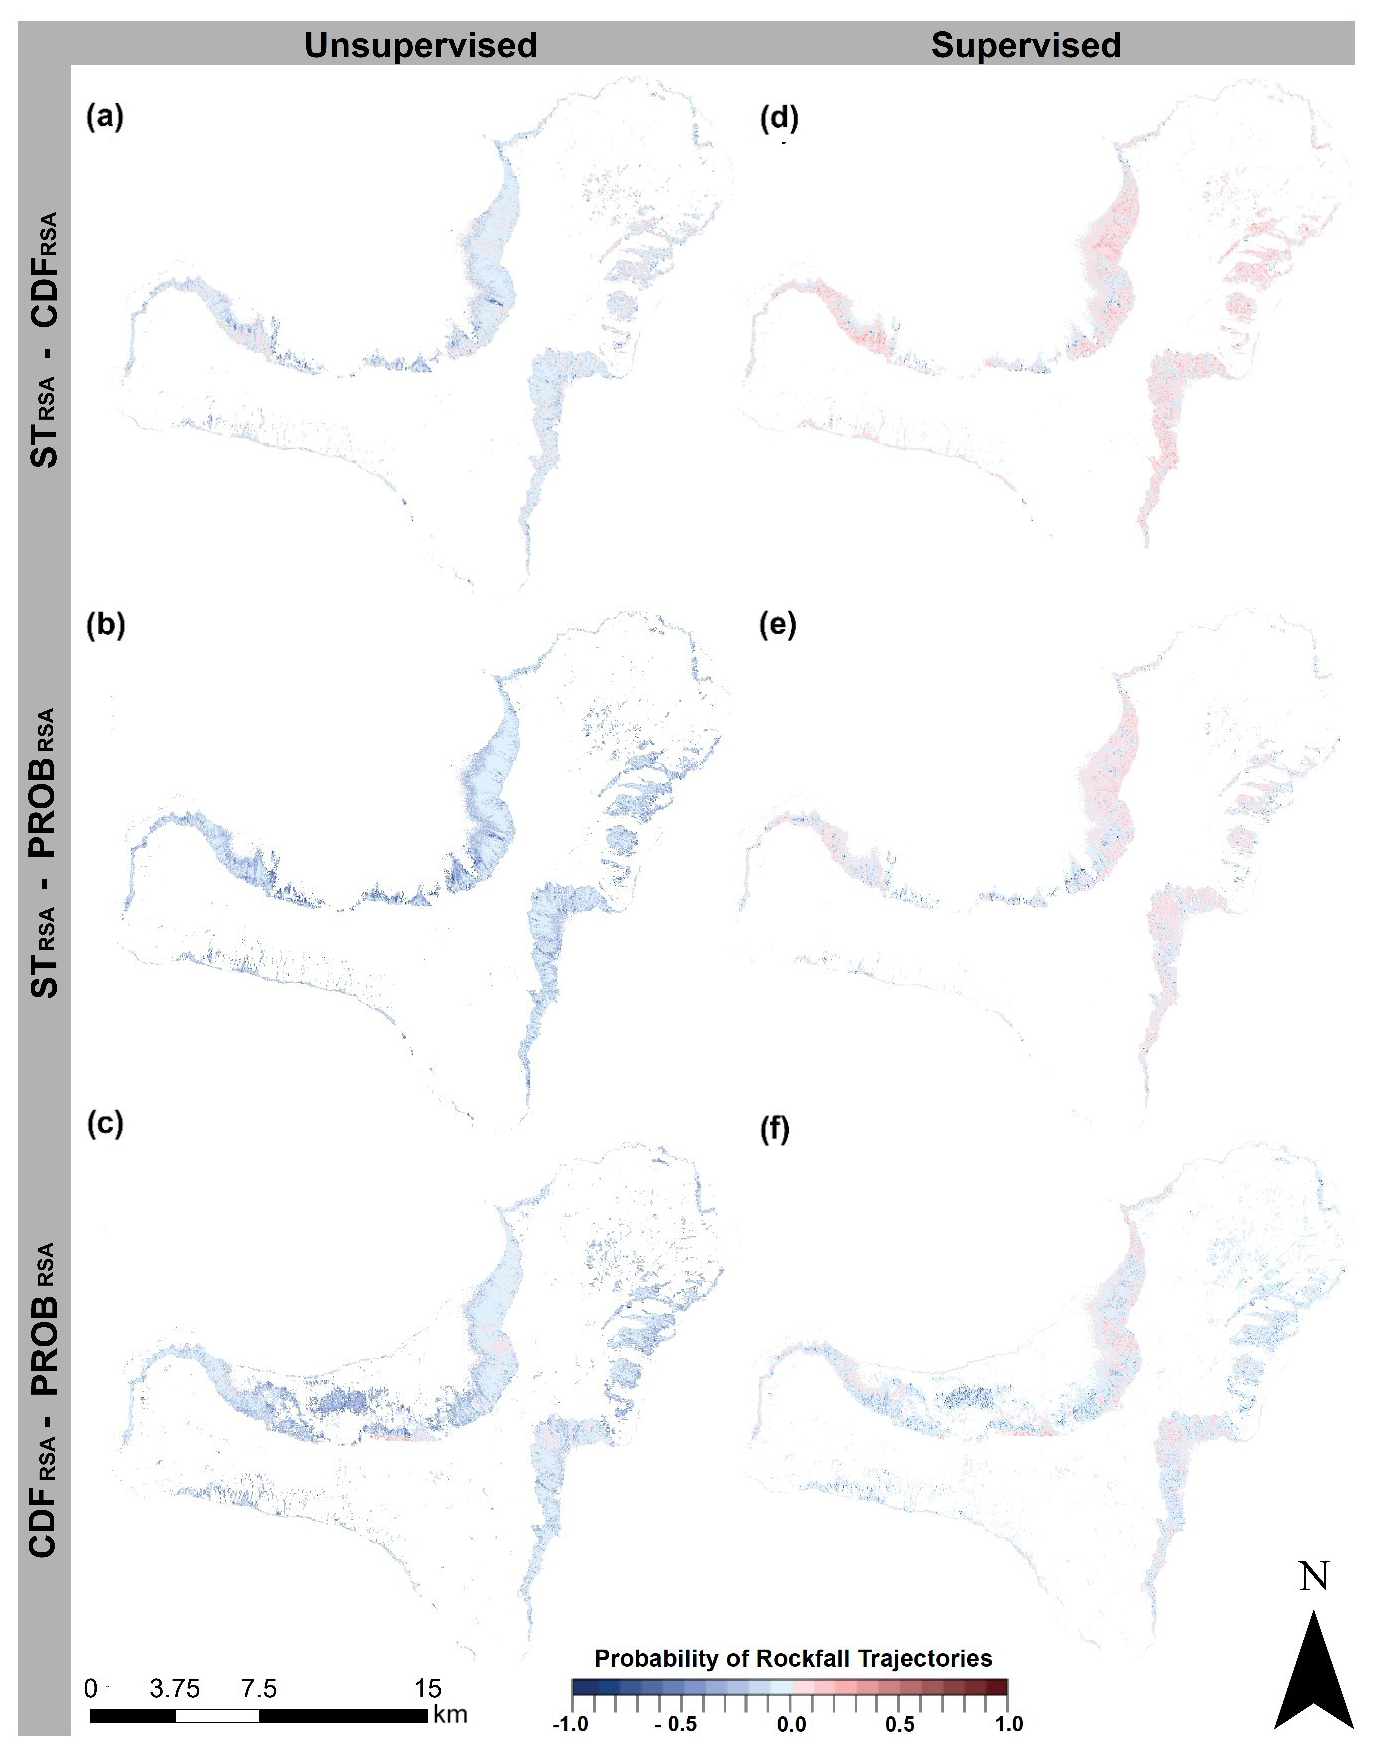
Figure 7Maps of the pairwise differences in susceptibility maps obtained for different source area identification methods (rows) and diversified classification methods (columns). Negative values indicate a higher probability for the second of the two methods compared.
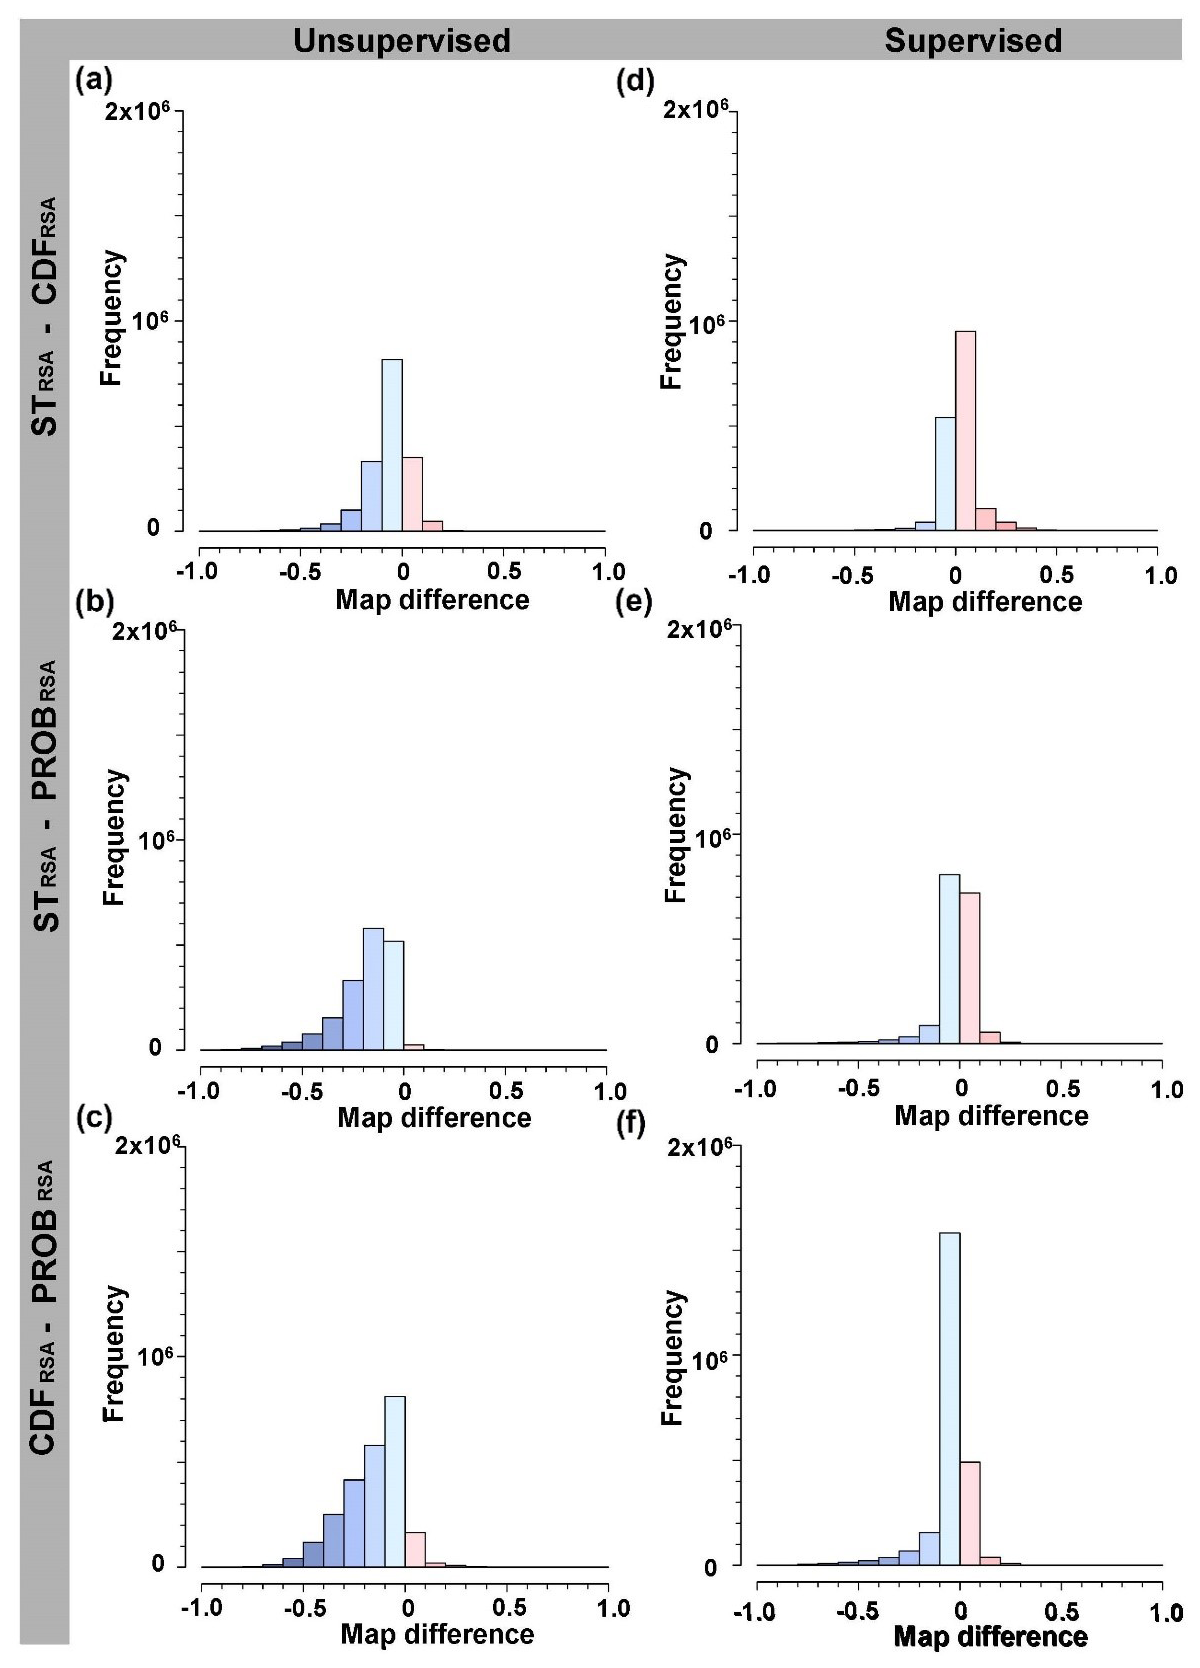
Figure 8Histograms of the pairwise differences in susceptibility maps obtained for different source area identification methods (rows) and diversified classification methods (columns).
The 2D hexagonal bin count heat maps (Fig. 9) derived for the different pairs of susceptibility maps confirm these results, showing a better alignment along the bisector of the higher frequency counts obtained for supervised susceptibility maps (Fig. 5d, e, f). These plots are divided into hexagonal bins, and each bin is coloured based on the count of the susceptibility map values. Dark-reddish shades indicate a higher frequency of measurements within the corresponding hexagon, while lighter areas may indicate sparse values.
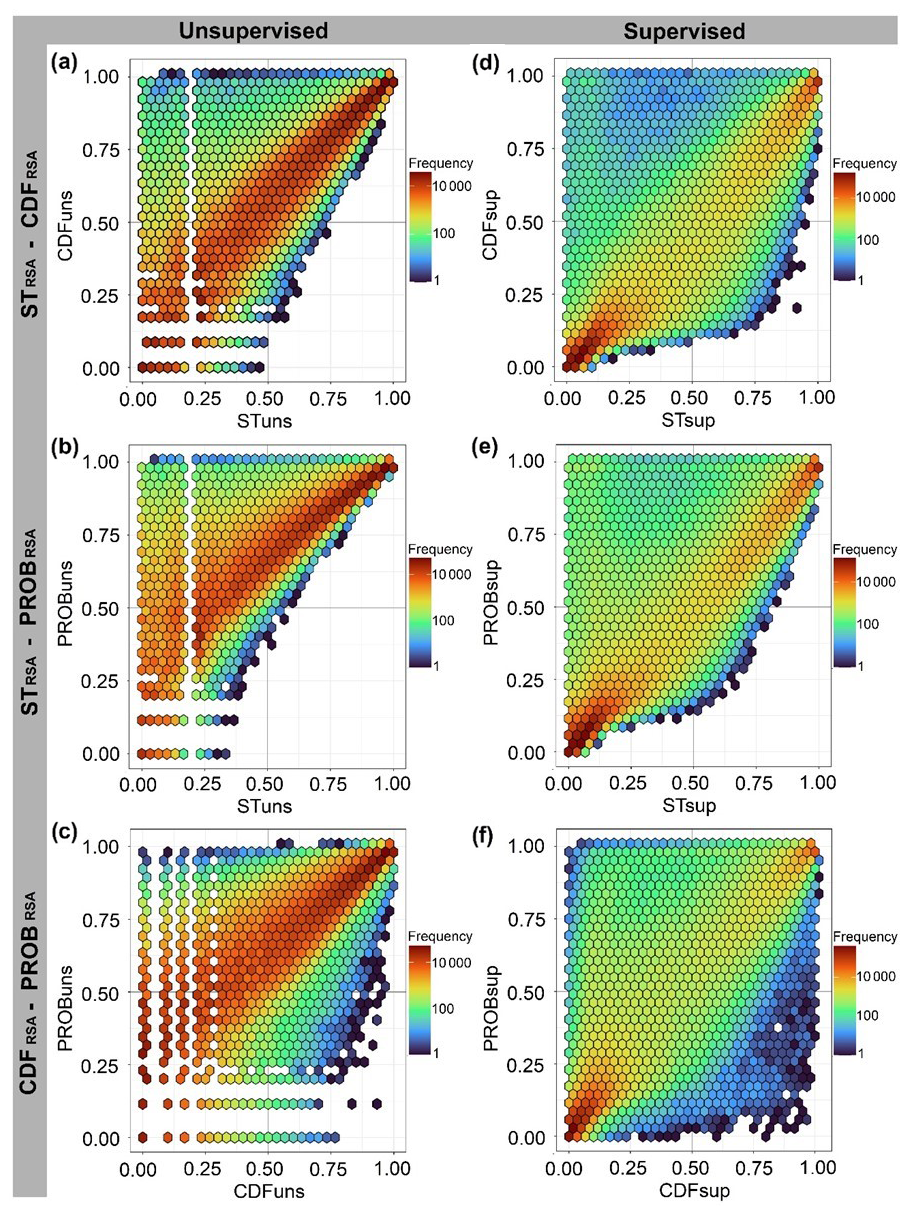
Figure 9The 2D hexagonal bin count heat maps derived for the different pairs of susceptibility maps obtained by applying unsupervised (a, b, c) and supervised (d, e, f) ECDF functions. Dark-reddish shades indicate a higher frequency of measurements within the corresponding hexagon.
In addition, the comparison of the trajectory maps with the simplified geotechnical classes (Fig. 1 in Rossi et al., 2020) reveals that the trajectories mainly cross over hard and very hard rocks and only occasionally cross over moderately soft rocks. In the unsupervised maps, very hard rocks are affected by rockfall trajectories approximately 19 %, 25 %, and 42 % of the time, corresponding to STRSA, CDFRSA, and PROBRSA, whereas for hard rocks, the percentages decrease to 7 %, 17 %, and 37 %. These percentages can be explained by the geological and morphological setting. Furthermore, the hard-soil class shows considerable percentages above 70 %. This distribution can be justified by their position on the lower part of the slopes, where trajectory paths commonly stop. Trajectories do not cross over soft soils, which are mainly located in flat areas. In the supervised maps, the very hard and hard rocks are passed over by the majority of the trajectories (i.e. 81 %, 81 %, and 88 % for STRSA, CDFRSA, and PROBRSA).
4.3 Rockfall susceptibility model validation
Figure 10 shows the results of the ROC analysis comparing the different susceptibility maps (Fig. 5) and field observations. The graphs show that the model with the best performance is obtained using the PROBRSA source areas (AUCROC = 0.88) followed by the CDFRSA (AUCROC = 0.84), with STRSA performing the worst (AUCROC = 0.78).
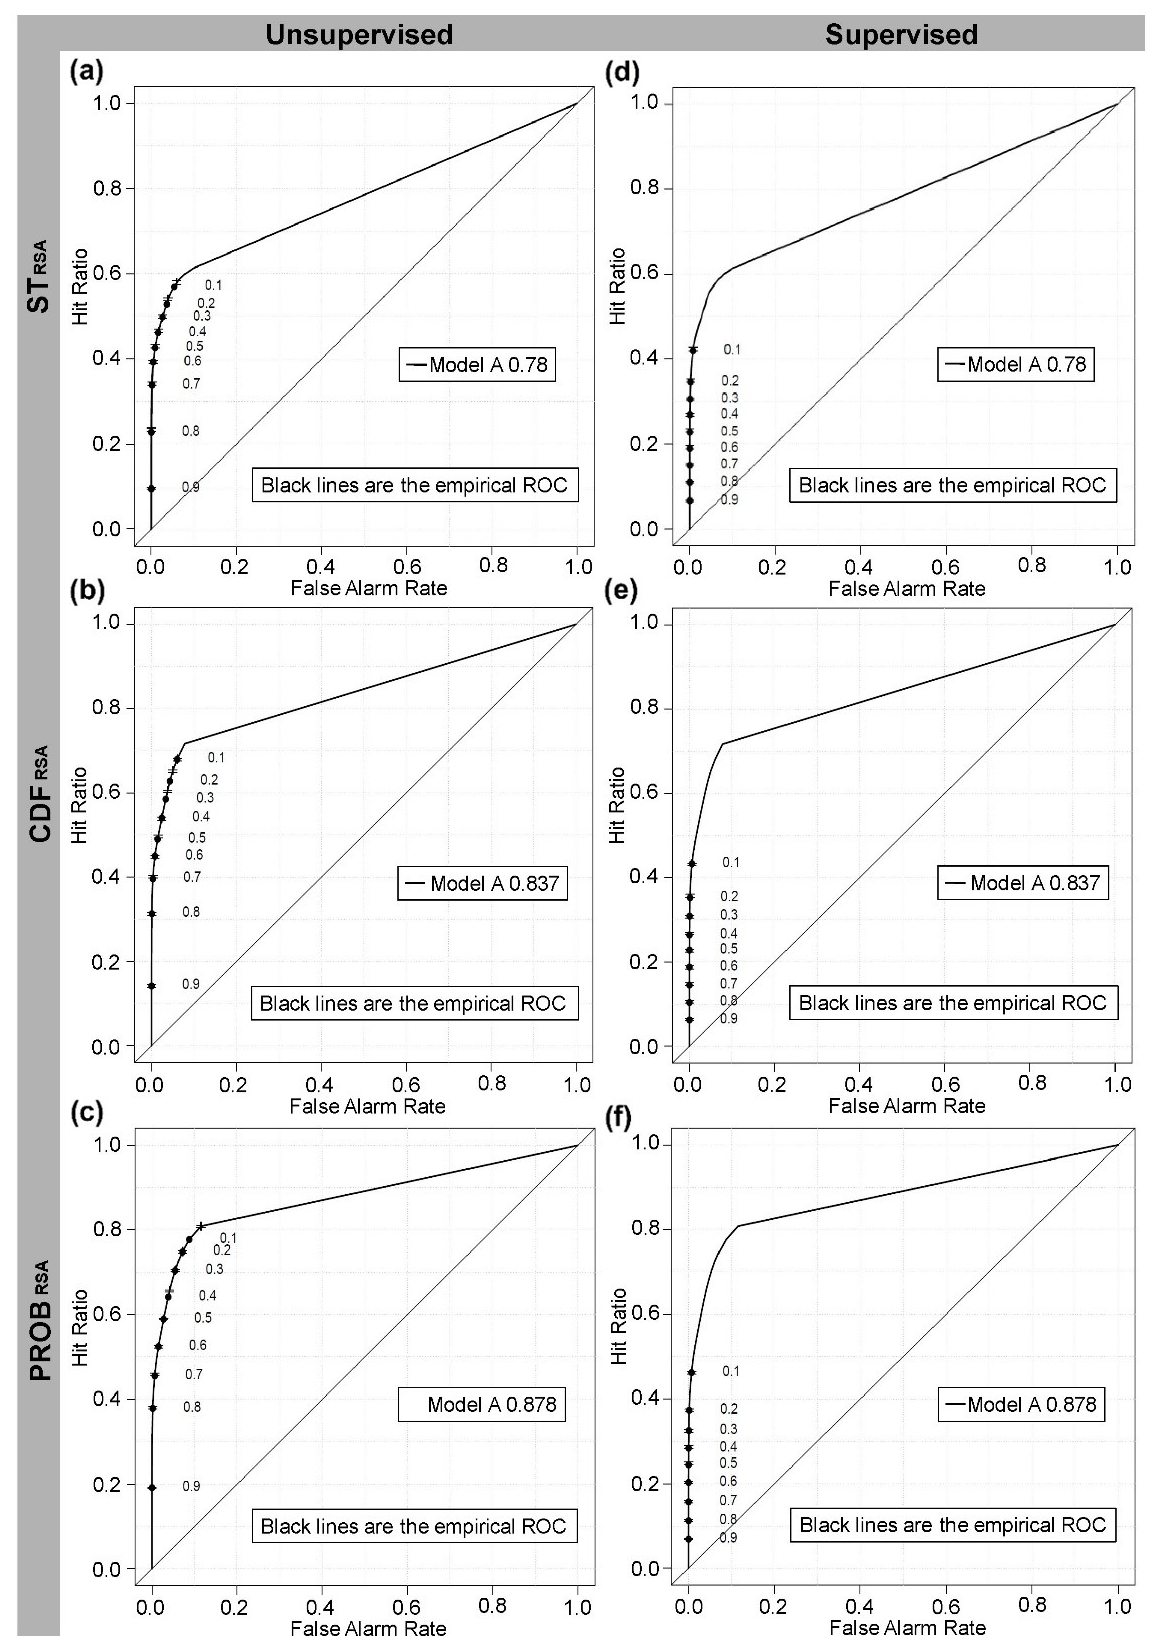
Figure 10ROC plots and corresponding AUCROC values for the six susceptibility maps shown in Fig. 5. The points show values of the hit rate (also referred to as the true-positive rate or sensitivity) and the false-alarm rate (also referred to as the false-positive rate equivalent to 1 – specificity) for a set of probability threshold reference values.
For the same maps, Fig. 11 shows the distributions of the average values within circular buffers of 5, 50, and 100 m defined around the observed boulder locations. Susceptibility median and maximum values increase with the decrease in the buffer size. The distributions of values change significantly for different source areas when the susceptibility is classified using the unsupervised EDCF, whereas they tend to be more homogeneous when the supervised ECDF is applied.
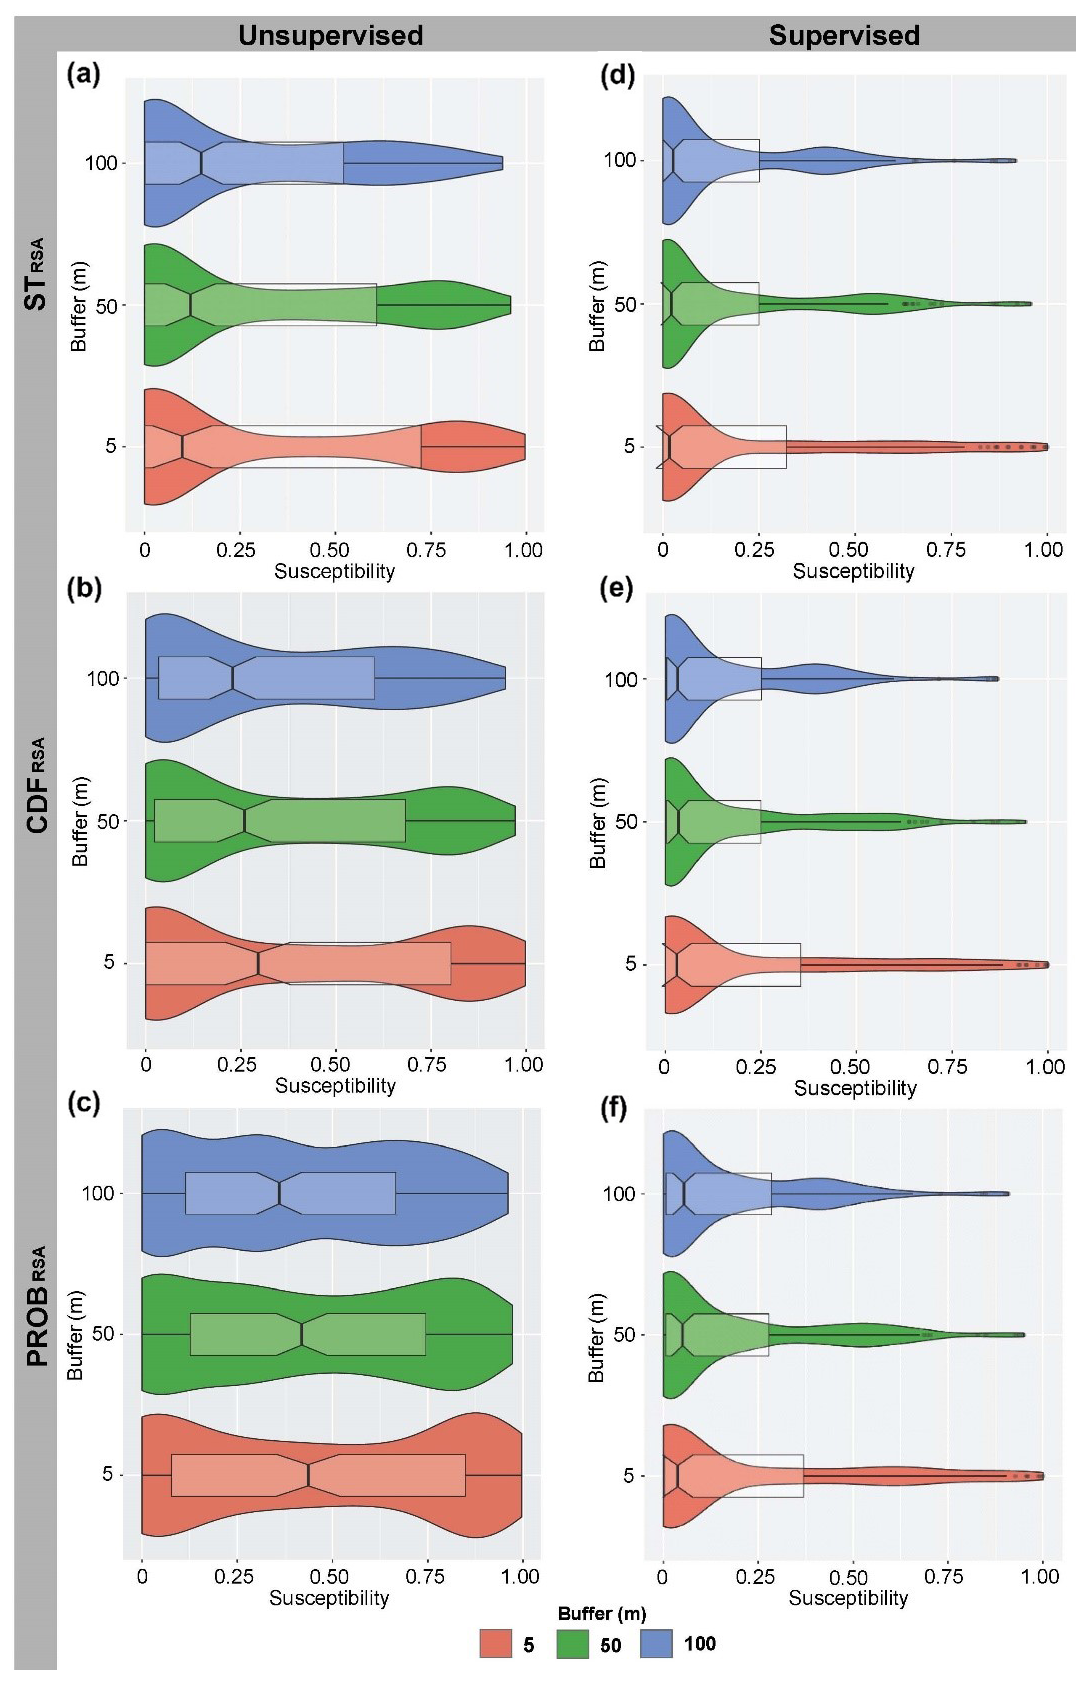
Figure 11Violin plots and boxplots derived for the average values of susceptibility within buffers defined around rockfall boulder locations. Plots correspond to the six susceptibility maps shown in Fig. 5.
Rockfall modelling is complex and requires a set of dedicated methodological choices and assumptions. Despite specific aspects of the modelling having been largely resolved in the literature (Ding et al., 2023; Noël et al., 2023; Yan et al., 2023; Yang et al., 2021; Žabota et al., 2019), a comprehensive methodology to assess susceptibility to rockfalls is still missing. To fill this gap, we have proposed a workflow that includes methods for the source area identification, the deterministic runout modelling, the classification of runout output to derive objective rockfall probabilistic susceptibility zonation, and finally the comparison and validation of the results. The methodology was applied on El Hierro Island (Canary Islands, Spain), where rockfalls pose a significant threat to structures, infrastructure, and the population. We have presented three methods to identify source areas of increasing complexity, namely STRSA, CDFRSA, and PROBRSA, which require diversified input. Table 3 and Fig. 4 show how these methods may provide different inputs (i.e. source area and number of simulations) for deterministic rockfall runout modelling, impacting the rockfall trajectory simulations and the corresponding susceptibility zonation (Fig. 5).
To derive probabilistic susceptibility maps, we propose the use of unsupervised and supervised ECDFs of the trajectory counts. We demonstrate with quantitative metrics (Figs. 8 and 9) how the use of the supervised ECDF approach helps to reduce differences and homogenize zonation at the expense of a dedicated mapping effort to derive a rockfall inventory (Fig. 1). This is a significant methodological finding of this work and shows that even when using simple source area identification methods, such as STRSA or CDFRSA, the supervised ECDF application guarantees a reliable and unbiased zonation of rockfall susceptibility. Traditionally, information on rockfall deposits is mainly used to validate the rockfall modelling results. In this study, we also show the relevance of mapping areas not affected by rockfalls to improve the reliability and robustness of the susceptibility zonation. This can be as relevant as the source area mapping and identification. In fact, the application of this workflow demonstrated that such data play a key role in susceptibility zonation classification, preventing overestimation of the results and enhancing their utility for decision-makers.
This study also explores the strategies to validate the rockfall susceptibility outputs using different types of inventory, such as (i) polygon-type maps portraying the zones reached by rockfall boulders and zones without any significant evidence of having been reached by potential boulders and (ii) point-type inventories with the locations of isolated rockfall boulders at the end of the runout (i.e. silent witnesses). Metrics comparing modelled and observed values (i.e. ROC plots and the corresponding AUCROC) can be used to show the performances of susceptibility models quantitatively, regardless of the classification approach adopted (Fig. 10).
The ROC analysis reveals differences in the performance of the three source area identification methods. However, identical AUCROC values are obtained for unsupervised and supervised ECDFs when the same source area identification method is used. This highlights the fact that the method used to classify the maps of trajectory counts and derive the susceptibility zonation is crucial. The ROC analysis is sensitive to methodological choices and helped us to select PROBRSA (followed by CDFRSA and STRSA) as the preferred method to identify rockfall source areas. Such results can be explained by the greater statistical robustness of this method (Rossi et al., 2020), which requires dedicated mapping, a set of thematic information, and the use of specific statistical software (Rossi et al., 2022). In general, the results of the multi-criterion techniques used to validate the outcomes and assess the reliability of the susceptibility zonation demonstrate that the larger the effort in the identification of source areas, the more reliable and accurate the rockfall susceptibility zonation. They also highlight the importance of selecting appropriate source area identification methods and incorporating supervised classification to improve rockfall susceptibility zonation. Furthermore, the study highlights the fact that supervised approaches provide added value by fine-tuning the modelling outputs.
Rockfall point-type inventories can be used for a basic verification of the ability of models to discern susceptible conditions corresponding to and in the vicinities of the mapped or observed boulders. This can be performed by analysing the distribution of susceptibility values within circular buffers of different sizes built around boulder locations. Such distributions can be visualized with violin plots (Fig. 11) that show the effects of different classification approaches for rockfall susceptibility zonation. Figure 11 reveals that susceptibility zonation values vary largely within buffers and tend to increase in the vicinity of the boulder locations mapped. Significant distribution differences can be observed among the susceptibility classification approaches and the source area identification criteria. Unsupervised ECDFs (Fig. 11a, b, c) show diversified shapes, with PROBRSA characterized by more uniform distributions and higher susceptibility values. Conversely, supervised ECDFs (Fig. 11d, e, f) minimize these differences, reshaping the distributions and making them more similar. This means that supervised ECDFs should be preferred because they reduce the effect of the criteria used to identify source areas on the final susceptibility zonation considerably.
In the analysis of rockfall susceptibility at the regional scale, the access to comprehensive data is frequently limited. This constraint impacts the choice of the methodologies employed to define source areas. When only a digital elevation model (DEM) and bibliographic resources are available, the slope thresholding method is preferred. Where additional data, such as geological or geomorphological information, are accessible, investing time in mapping source areas enables the application of probabilistic methods that yield more robust results. Furthermore, maps of trajectory counts are often considered the final modelling outputs; nevertheless we propose performing a supervised analysis to classify them for more reliable susceptibility zonation. Combining probabilistic methods for the source area identification with supervised classification of trajectory counts ensures a more accurate and balanced susceptibility zonation, enhancing its utility for decision-making processes in rockfall hazard management.
Despite the availability of various kinds of software and methods for rockfall runout simulation, we have selected STONE due to its previous use, validation, and application in the study area. Nonetheless, we recognize that the methodological framework proposed in this study remains relevant even when employing other rockfall modelling software. The unsupervised and supervised ECDF analyses are applicable to the trajectory counts generated by any software.
The proposed methodology provides possible guidance for objective and reliable rockfall modelling that is able to support civil protection, emergency authorities, and decision-makers in evaluating and assessing potential rockfall impacts, and it can be a potential strategic support for rockfall warning systems.
LAND-SUITE V1.0 is archived in the Zenodo repository at https://doi.org/10.5281/zenodo.5650810 (Rossi and Bornaetxea, 2021; restricted to users with access).
The authors (r.sarro@igme.es) can provide the El Hierro (Canary Islands, Spain) data used in the analyses to allow replication of the results.
RS – conceptualization, methodology, investigation, formal analysis, validation, writing (original draft), and visualization. MR – conceptualization, methodology, software, formal analysis, validation, writing (original draft), and visualization. PR – conceptualization, methodology, formal analysis, validation, and writing (review and editing). RMM – conceptualization, methodology, investigation, formal analysis, validation, and writing (review and editing). Given their contributions to the research, all authors should be considered the main authors.
At least one of the (co-)authors is a member of the editorial board of Natural Hazards and Earth System Sciences. The peer-review process was guided by an independent editor, and the authors also have no other competing interests to declare.
Publisher's note: Copernicus Publications remains neutral with regard to jurisdictional claims made in the text, published maps, institutional affiliations, or any other geographical representation in this paper. While Copernicus Publications makes every effort to include appropriate place names, the final responsibility lies with the authors.
We thank the reviewers for their comments and suggestions, which helped to improve the paper.
This research has been supported by the project U-GEOHAZ (Geohazard Impact Assessment for Urban Areas, grant agreement no. 783169) funded by the European Commission, Directorate-General for European Civil Protection and Humanitarian Aid Operations (ECHO), and by the RISKCOAST project (ref no. SOE3/P4/E0868) funded by the INTERREG SUDOE programme (third call for proposals). It was also partially supported by the University of Alicante in the framework of the Quality Improvement Grant of the PhD programme in Materials, Structures and Soil Engineering: Sustainable Construction.
The article processing charges for this open-access publication were covered by the CSIC Open Access Publication Support Initiative through its Unit of Information Resources for Research (URICI).
This paper was edited by Oded Katz and reviewed by four anonymous referees.
Alqadhi, S., Mallick, J., Talukdar, S., Bindajam, A. A., Van Hong, N., and Saha, T. K.: Selecting optimal conditioning parameters for landslide susceptibility: an experimental research on Aqabat Al-Sulbat, Saudi Arabia, Environ. Sci. Pollut. Res., 29, 3743–3762, https://doi.org/10.1007/s11356-021-15886-z, 2022.
Alvioli, M., Santangelo, M., Fiorucci, F., Cardinali, M., Marchesini, I., Reichenbach, P., Rossi, M., Guzzetti, F., and Peruccacci, S.: Rockfall susceptibility and network-ranked susceptibility along the Italian railway, Eng. Geol., 293, 106301, https://doi.org/10.1016/j.enggeo.2021.106301, 2021.
Baeza, C., Lantada, N., and Amorim, S.: Statistical and spatial analysis of landslide susceptibility maps with different classification systems, Environ. Earth Sci., 75, 1318, https://doi.org/10.1007/s12665-016-6124-1, 2016.
BDMoves: http://info.igme.es/BD2DMoves/ (last access: 14 May 2024), 2024.
Borella, J., Quigley, M., Krauss, Z., Lincoln, K., Attanayake, J., Stamp, L., Lanman, H., Levine, S., Hampton, S., and Gravley, D.: Geologic and geomorphic controls on rockfall hazard: how well do past rockfalls predict future distributions?, Nat. Hazards Earth Syst. Sci., 19, 2249–2280, https://doi.org/10.5194/nhess-19-2249-2019, 2019.
Cantarino, I., Carrion, M. A., Goerlich, F., and Martinez Ibañez, V.: A ROC analysis-based classification method for landslide susceptibility maps, Landslides, 16, 265–282, https://doi.org/10.1007/s10346-018-1063-4, 2019.
Carlà, T., Nolesini, T., Solari, L., Rivolta, C., Dei Cas, L., and Casagli, N.: Rockfall forecasting and risk management along a major transportation corridor in the Alps through ground-based radar interferometry, Landslides, 16, 1425–1435, https://doi.org/10.1007/s10346-019-01190-y, 2019.
Centro de Descargas del CNIG (IGN): https://centrodedescargas.cnig.es/CentroDescargas/index.jsp (last access: 9 May 2024), 2024.
Crosta, G. B., Agliardi, F., Frattini, P., and Lari, S.: Key Issues in Rock Fall Modeling, Hazard and Risk Assessment for Rockfall Protection, in: Engineering Geology for Society and Territory – Volume 2, edited by: Lollino, G., Giordan, D., Crosta, G. B., Corominas, J., Azzam, R., Wasowski, J., and Sciarra, N., Springer International Publishing, Cham, 43–58, https://doi.org/10.1007/978-3-319-09057-3_4, 2015.
Dhiman, R. K. and Thakur, M.: Rockfall Hazard Assessment Using RAMMS for the SE Facing Escarpment of Manikaran, Himachal Pradesh, India, in: Recent Technologies for Disaster Management and Risk Reduction: Sustainable Community Resilience & Responses, edited by: Rai, P. K., Singh, P., and Mishra, V. N., Springer International Publishing, Cham, 57–74, https://doi.org/10.1007/978-3-030-76116-5_4, 2021.
Dinçer, İ., Orhan, A., Frattini, P., and Crosta, G. B.: Rockfall at the heritage site of the Tatlarin Underground City (Cappadocia, Turkey), Nat. Hazards, 82, 1075–1098, https://doi.org/10.1007/s11069-016-2234-z, 2016.
Ding, Y., Wu, Y., Zhu, Q., Zhang, L., Sun, Q., and Wang, W.: Virtual geographic environment-based integrated rockfall risk simulation method for canyon bridges, T. GIS, 27, 797–820, https://doi.org/10.1111/tgis.13046, 2023.
Dorren, L., Schaller, C., Erbach, A., and Moos, C.: Automated Delimitation of Rockfall Hazard Indication Zones Using High-Resolution Trajectory Modelling at Regional Scale, Geosciences, 13, 182, https://doi.org/10.3390/geosciences13060182, 2023.
Fanos, A. M. and Pradhan, B.: A Novel Hybrid Machine Learning-Based Model for Rockfall Source Identification in Presence of Other Landslide Types Using LiDAR and GIS, Earth Syst. Environ., 3, 491–506, https://doi.org/10.1007/s41748-019-00114-z, 2019.
Farvacque, M., Lopez-Saez, J., Corona, C., Toe, D., Bourrier, F., and Eckert, N.: How is rockfall risk impacted by land-use and land-cover changes? Insights from the French Alps, Global Planet. Change, 174, 138–152, https://doi.org/10.1016/j.gloplacha.2019.01.009, 2019.
Fernandez-Hernández, M., Paredes, C., Castedo, R., Llorente, M., and de la Vega-Panizo, R.: Rockfall detachment susceptibility map in El Hierro Island, Canary Islands, Spain, Nat. Hazards, 64, 1247–1271, https://doi.org/10.1007/s11069-012-0295-1, 2012.
Francioni, M., Antonaci, F., Sciarra, N., Robiati, C., Coggan, J., Stead, D., and Calamita, F.: Application of Unmanned Aerial Vehicle Data and Discrete Fracture Network Models for Improved Rockfall Simulations, Remote Sensing, 12, 2053, https://doi.org/10.3390/rs12122053, 2020.
Frattini, P., Crosta, G., Carrara, A., and Agliardi, F.: Assessment of rockfall susceptibility by integrating statistical and physically-based approaches, Geomorphology, 94, 419–437, https://doi.org/10.1016/j.geomorph.2006.10.037, 2008.
Frattini, P., Crosta, G. B., and Agliardi, F.: Rockfall characterization and modeling, in: Landslides, edited by: Clague, J. J. and Stead, D., Cambridge University Press, https://doi.org/10.1017/cbo9780511740367.023, 2013.
Fu, H., Chen, W., and Fu, J.: Rockfall mechanisms and block theoretical stability analysis, in: Rock Mechanics and Engineering, Elsevier, 89–125, https://doi.org/10.1016/B978-0-12-822424-3.00003-7, 2021.
Gallo, I. G., Martínez-Corbella, M., Sarro, R., Iovine, G., López-Vinielles, J., Hérnandez, M., Robustelli, G., Mateos, R. M., and García-Davalillo, J. C.: An Integration of UAV-Based Photogrammetry and 3D Modelling for Rockfall Hazard Assessment: The Cárcavos Case in 2018 (Spain), Remote Sensing, 13, 3450, https://doi.org/10.3390/rs13173450, 2021.
Gariano, S. L., Brunetti, M. T., Iovine, G., Melillo, M., Peruccacci, S., Terranova, O., Vennari, C., and Guzzetti, F.: Calibration and validation of rainfall thresholds for shallow landslide forecasting in Sicily, southern Italy, Geomorphology, 228, 653–665, https://doi.org/10.1016/j.geomorph.2014.10.019, 2015.
Giordan, D., Adams, M. S., Aicardi, I., Alicandro, M., Allasia, P., Baldo, M., De Berardinis, P., Dominici, D., Godone, D., Hobbs, P., Lechner, V., Niedzielski, T., Piras, M., Rotilio, M., Salvini, R., Segor, V., Sotier, B., and Troilo, F.: The use of unmanned aerial vehicles (UAVs) for engineering geology applications, B. Eng. Geol. Environ., 79, 3437–3481, https://doi.org/10.1007/s10064-020-01766-2, 2020.
Guzzetti, F., Crosta, G., Detti, R., and Agliardi, F.: STONE: a computer program for the three-dimensional simulation of rock-falls, Comput. Geosci., 28, 1079–1093, https://doi.org/10.1016/S0098-3004(02)00025-0, 2002.
Guzzetti, F., Reichenbach, P., and Wieczorek, G. F.: Rockfall hazard and risk assessment in the Yosemite Valley, California, USA, Nat. Hazards Earth Syst. Sci., 3, 491–503, https://doi.org/10.5194/nhess-3-491-2003, 2003.
Instituto Canario de Estadística (ISTAC): http://www.gobiernodecanarias.org/istac/ (last access: 8 December 2021), 2021.
Jaboyedoff, M. and Labiouse, V.: Technical Note: Preliminary estimation of rockfall runout zones, Nat. Hazards Earth Syst. Sci., 11, 819–828, https://doi.org/10.5194/nhess-11-819-2011, 2011.
Kakavas, M. P., Nikolakopoulos, K. G., Kyriou, A., and Koukouvelas, I.: The Influence of the DSM Spatial Resolution in Rockfall Simulation and Validation with In Situ Data, Geosciences, 13, 57, https://doi.org/10.3390/geosciences13020057, 2023.
Lanfranconi, C., Sala, G., Frattini, P., Crosta, G. B., and Valagussa, A.: Assessing the rockfall protection efficiency of forests at the regional scale, Landslides, 17, 2703–2721, https://doi.org/10.1007/s10346-020-01458-8, 2020.
Larcher, V., Simoni, S., Pasquazzo, R., Strada, C., Zampedrio, G., and Berger, F.: PARAmount: WP6 Guidelines, Rockfall and Forecast systems, 2012.
Lee, J.-J., Song, M.-S., Yun, H.-S., and Yum, S.-G.: Dynamic landslide susceptibility analysis that combines rainfall period, accumulated rainfall, and geospatial information, Scientific Reports, 12, 18429, https://doi.org/10.1038/s41598-022-21795-z, 2022.
Liu, H., Wang, X., Liao, X., Sun, J., and Zhang, S.: Rockfall Investigation and Hazard Assessment from Nang County to Jiacha County in Tibet, Applied Sciences, 10, 247, https://doi.org/10.3390/app10010247, 2020.
Loye, A., Pedrazzini, A., and Jaboyedoff, M.: Regional indicative rockfall map using LIDAR based slope frequency histogram and conefall modelling, in: Interdisciplinary Workshop on Rockfall Protection: Morschach, Switzerland, Proceedings, 64–66, 2008.
Loye, A., Jaboyedoff, M., and Pedrazzini, A.: Identification of potential rockfall source areas at a regional scale using a DEM-based geomorphometric analysis, Nat. Hazards Earth Syst. Sci., 9, 1643–1653, https://doi.org/10.5194/nhess-9-1643-2009, 2009.
Mateos, R. M., García-Moreno, I., Reichenbach, P., Herrera, G., Sarro, R., Rius, J., Aguiló, R., and Fiorucci, F.: Calibration and validation of rockfall modelling at regional scale: application along a roadway in Mallorca (Spain) and organization of its management, Landslides, 13, 751–763, https://doi.org/10.1007/s10346-015-0602-5, 2016.
Mateos, R. M., López-Vinielles, J., Poyiadji, E., Tsagkas, D., Sheehy, M., Hadjicharalambous, K., Liscák, P., Podolski, L., Laskowicz, I., Iadanza, C., Gauert, C., Todorović, S., Auflič, M. J., Maftei, R., Hermanns, R. L., Kociu, A., Sandić, C., Mauter, R., Sarro, R., Béjar, M., and Herrera, G.: Integration of landslide hazard into urban planning across Europe, Landscape Urban Plan., 196, 103740, https://doi.org/10.1016/j.landurbplan.2019.103740, 2020.
Michoud, C., Derron, M.-H., Horton, P., Jaboyedoff, M., Baillifard, F.-J., Loye, A., Nicolet, P., Pedrazzini, A., and Queyrel, A.: Rockfall hazard and risk assessments along roads at a regional scale: example in Swiss Alps, Nat. Hazards Earth Syst. Sci., 12, 615–629, https://doi.org/10.5194/nhess-12-615-2012, 2012.
Muzzillo, R., Losasso, L., and Sdao, F.: Rockfall Source Areas Assessment in an Area of the Pollino National Park (Southern Italy), in: Computational Science and Its Applications – ICCSA 2018, vol. 10962, edited by: Gervasi, O., Murgante, B., Misra, S., Stankova, E., Torre, C. M., Rocha, A. M. A. C., Taniar, D., Apduhan, B. O., Tarantino, E., and Ryu, Y., Springer International Publishing, Cham, 366–379, https://doi.org/10.1007/978-3-319-95168-3_25, 2018.
Nanehkaran, Y. A., Licai, Z., Chen, J., Azarafza, M., and Yimin, M.: Application of artificial neural networks and geographic information system to provide hazard susceptibility maps for rockfall failures, Environ. Earth Sci., 81, 475, https://doi.org/10.1007/s12665-022-10603-6, 2022.
Noël, F., Cloutier, C., Jaboyedoff, M., and Locat, J.: Impact-Detection Algorithm That Uses Point Clouds as Topographic Inputs for 3D Rockfall Simulations, Geosciences, 11, 188, https://doi.org/10.3390/geosciences11050188, 2021.
Noël, F., Nordang, S. F., Jaboyedoff, M., Digout, M., Guerin, A., Locat, J., and Matasci, B.: Comparing Flow-R, Rockyfor3D and RAMMS to Rockfalls from the Mel de la Niva Mountain: A Benchmarking Exercise, Geosciences, 13, 200, https://doi.org/10.3390/geosciences13070200, 2023.
Omran, A., Fahmida, K., Schröder, D., Arnous, M. O., El-Rayes, A. E., and Hochschild, V.: GIS-based rockfall hazard zones modeling along the coastal Gulf of Aqaba Region, Egypt, Earth Sci. Inform., 14, 691–709, https://doi.org/10.1007/s12145-021-00580-y, 2021.
Othman, A., Shaaban, F., Abotalib, A. Z., El-Saoud, W. A., Gabr, S. S., Habeebullah, T., and Hegazy, D.: Hazard Assessment of Rockfalls in Mountainous Urban Areas, Western Saudi Arabia, Arab. J. Sci. Eng., 46, 5717–5731, https://doi.org/10.1007/s13369-020-05098-x, 2021.
Paredes, C., Sarro, R., and Ramos, M.: Estimación preliminar de los alcances por caída de bloques en la sierra de La Cabrera, Madrid, España, Rev. Mex. Cienc. Geol., 32, 475–491, 2015.
Pérez-Rey, I., Riquelme, A., González-deSantos, L. M., Estévez-Ventosa, X., Tomás, R., and Alejano, L.: A multi-approach rockfall hazard assessment on a weathered granite natural rock slope, Landslides, 16, 2005–2015, https://doi.org/10.1007/s10346-019-01208-5, 2019.
Pfeiffer, T. J.: Application of Rockfall Simulation to Risk Analysis, 70th Highway Geology Symposium, Portland Oregon, United States, 21–24 October 2019, https://trid.trb.org/View/1692609 (last access: 15 April 2025), 2019.
Reichenbach, P., Rossi, M., Malamud, B. D., Mihir, M., and Guzzetti, F.: A review of statistically-based landslide susceptibility models, Earth-Sci. Rev., 180, 60–91, https://doi.org/10.1016/j.earscirev.2018.03.001, 2018.
Robiati, C., Eyre, M., Vanneschi, C., Francioni, M., Venn, A., and Coggan, J.: Application of Remote Sensing Data for Evaluation of Rockfall Potential within a Quarry Slope, ISPRS Int. J. Geo-Inf., 8, 367, https://doi.org/10.3390/ijgi8090367, 2019.
Rossi, M. and Bornaetxea, T.: LAND-SUITE V1.0: a suite of tools for statistically-based landslide susceptibility zonation, Version 1.0, Zenodo [code], https://doi.org/10.5281/zenodo.5650810, 2021.
Rossi, M. and Reichenbach, P.: LAND-SE: a software for statistically based landslide susceptibility zonation, version 1.0, Geosci. Model Dev., 9, 3533–3543, https://doi.org/10.5194/gmd-9-3533-2016, 2016.
Rossi, M., Guzzetti, F., Reichenbach, P., Mondini, A. C., and Peruccacci, S.: Optimal landslide susceptibility zonation based on multiple forecasts, Geomorphology, 114, 129–142, https://doi.org/10.1016/j.geomorph.2009.06.020, 2010.
Rossi, M., Sarro, R., Reichenbach, P., and Mateos, R. M.: Probabilistic identification of rockfall source areas at regional scale in El Hierro (Canary Islands, Spain), Geomorphology, 381, 107661, https://doi.org/10.1016/j.geomorph.2021.107661, 2020.
Rossi, M., Bornaetxea, T., and Reichenbach, P.: LAND-SUITE V1.0: a suite of tools for statistically based landslide susceptibility zonation, Geosci. Model Dev., 15, 5651–5666, https://doi.org/10.5194/gmd-15-5651-2022, 2022.
Santangelo, M., Marchesini, I., Bucci, F., Cardinali, M., Cavalli, M., Crema, S., Marchi, L., Alvioli, M., and Guzzetti, F.: Exposure to landslides in rural areas in Central Italy, J. Maps, 17, 124–132, https://doi.org/10.1080/17445647.2020.1746699, 2020.
Santos, P. P., Reyes-Carmona, C., Pereira, S., Sarro, R., Martínez-Corbella, M., Coll-Ramis, M. À., Zêzere, J. L., and Mateos, R. M.: Seasonal rockfall risk analysis in a touristic island: Application to the Tramuntana Range (Mallorca, Spain), Int. J. Disast. Risk Re., 101, 104264, https://doi.org/10.1016/j.ijdrr.2024.104264, 2024.
Sarro, R., Mateos, R. M., García-Moreno, I., Herrera, G., Reichenbach, P., Laín, L., and Paredes, C.: The Son Poc rockfall (Mallorca, Spain) on the 6th of March 2013: 3D simulation, Landslides, 11, 493–503, https://doi.org/10.1007/s10346-014-0487-8, 2014.
Sarro, R., Riquelme, A., García-Davalillo, J. C., Mateos, R. M., Tomás, R., Pastor, J. L., Cano, M., and Herrera, G.: Rockfall simulation based on UAV photogrammetry data obtained during an emergency declaration: Application at a cultural heritage site, Remote Sens., 10, 1923, https://doi.org/10.3390/rs10121923, 2018.
Sarro, R., Mateos, R. M., Reichenbach, P., Aguilera, H., Riquelme, A., Hernández-Gutiérrez, L. E., Martín, A., Barra, A., Solari, L., Monserrat, O., Alvioli, M., Fernández-Merodo, J. A., López-Vinielles, J., and Herrera, G.: Geotechnics for rockfall assessment in the volcanic island of Gran Canaria (Canary Islands, Spain), J. Maps, 16, 605–613, https://doi.org/10.1080/17445647.2020.1806125, 2020.
Sarro, R., Pérez-Rey, I., Tomás, R., Alejano, L. R., Hernández-Gutiérrez, L. E., and Mateos, R. M.: Effects of Wildfire on Rockfall Occurrence: A Review through Actual Cases in Spain, Appl. Sci., 11, 2545, https://doi.org/10.3390/app11062545, 2021.
Scavia, C., Barbero, M., Castelli, M., Marchelli, M., Peila, D., Torsello, G., and Vallero, G.: Evaluating Rockfall Risk: Some Critical Aspects, Geosciences, 10, 98, https://doi.org/10.3390/geosciences10030098, 2020.
Straub, D. and Schubert, M.: Modeling and managing uncertainties in rock-fall hazards, Georisk: Assessment and Management of Risk for Engineered Systems and Geohazards, 2, 1–15, https://doi.org/10.1080/17499510701835696, 2008.
Tehrani, F. S., Calvello, M., Liu, Z., Zhang, L., and Lacasse, S.: Machine learning and landslide studies: recent advances and applications, Nat. Hazards, 114, 1197–1245, https://doi.org/10.1007/s11069-022-05423-7, 2022.
Wang, L.-J., Guo, M., Sawada, K., Lin, J., and Zhang, J.: A comparative study of landslide susceptibility maps using logistic regression, frequency ratio, decision tree, weights of evidence and artificial neural network, Geosci. J., 20, 117–136, https://doi.org/10.1007/s12303-015-0026-1, 2016.
Wang, X., Liu, H., and Sun, J.: A New Approach for Identification of Potential Rockfall Source Areas Controlled by Rock Mass Strength at a Regional Scale, Remote Sensing, 13, 938, https://doi.org/10.3390/rs13050938, 2021.
Wickham, H.: Data Analysis, in: ggplot2, Springer International Publishing, Cham, 189–201, https://doi.org/10.1007/978-3-319-24277-4_9, 2016.
Yan, J., Chen, J., Tan, C., Zhang, Y., Liu, Y., Zhao, X., and Wang, Q.: Rockfall source areas identification at local scale by integrating discontinuity-based threshold slope angle and rockfall trajectory analyses, Eng. Geol., 313, 106993, https://doi.org/10.1016/j.enggeo.2023.106993, 2023.
Yang, X., Zhang, G., Yu, Y., Yu, Q., Lei, M., and Ding, B.: Factors Influencing the Coefficient of Restitution in Rockfall Impacts, Nat. Hazards Rev., 22, 04021024, https://doi.org/10.1061/(ASCE)NH.1527-6996.0000454, 2021.
Žabota, B., Repe, B., and Kobal, M.: Influence of digital elevation model resolution on rockfall modelling, Geomorphology, 328, 183–195, https://doi.org/10.1016/j.geomorph.2018.12.029, 2019.
Zhan, J., Yu, Z., Lv, Y., Peng, J., Song, S., and Yao, Z.: Rockfall Hazard Assessment in the Taihang Grand Canyon Scenic Area Integrating Regional-Scale Identification of Potential Rockfall Sources, Remote Sensing, 14, 3021, https://doi.org/10.3390/rs14133021, 2022.