the Creative Commons Attribution 4.0 License.
the Creative Commons Attribution 4.0 License.
 | 14 Apr 2025
Soil moisture–atmosphere coupling strength over central Europe in the recent warming climate
Thomas Schwitalla
Lisa Jach
Volker Wulfmeyer
Kirsten Warrach-Sagi
In recent decades Europe has experienced severe droughts and heatwaves. Notably, precipitation in central Europe exhibited strong dry anomalies during the summers of 2003, 2018, and 2022. This phenomenon has significant implications for agriculture, ecosystems, and human societies, highlighting the need to understand the underlying mechanisms driving these events. Despite significant advancements in understanding land–atmosphere (LA) coupling, the temporal variability in LA coupling strength and its associated impacts remain poorly understood.
This study aims to quantify the variability in LA coupling strength over central Europe during the summer seasons from 1991 to 2022, with a focus on the relationships between temperature, soil moisture, precipitation, and large-scale weather patterns. Our results reveal that interannual variability occurs in different coupling relationships throughout the summer seasons, with significant implications for climate extremes, agriculture, and ecosystems. The increasing frequency of warm and dry summers from 2015 onwards hints at extended periods of reduced soil moisture available for evapotranspiration and the likelihood of locally triggered convection. This study provides new insights into the dynamics of LA coupling, highlighting the importance of considering the interannual variability in LA coupling strength in climate modeling and prediction, particularly in the context of a warming climate.
- Article
(16736 KB) - Full-text XML
-
Supplement
(1465 KB) - BibTeX
- EndNote


In recent decades, Europe has experienced severe droughts and heatwaves, with 2022 being the hottest summer on record (C3S, 2018; Markonis et al., 2021; WMO, 2022a). Notably, precipitation in central Europe exhibited strong dry anomalies during the summers of 2003, 2018, and 2022 (WMO, 2004, 2018; C3S, 2018; WMO, 2022b; Spensberger et al., 2020). Concurrently, soils experienced exceptional dryness in the uppermost 25 cm (Boeing et al., 2022; Rakovec et al., 2022). This phenomenon was also observed by Rousi et al. (2023) and Dirmeyer et al. (2021) in relation to the extreme conditions of 2018, suggesting that such events are likely to become more frequent under climate change. The underlying drivers of these events are complex and multifaceted, involving changes in atmospheric circulation patterns, sea surface temperatures, and land-surface conditions (Barriopedro et al., 2023).
For instance, Rousi et al. (2022) identified Europe as a heatwave hotspot, where the likelihood of heatwaves is 3 to 4 times greater than in other areas of the midlatitudes, attributed to a double-jet configuration associated with atmospheric blocking conditions (Kornhuber et al., 2017). One key factor influencing the development and persistence of heatwaves and droughts is the strength of land–atmosphere (LA) coupling (Yuan et al., 2023). LA coupling refers to the interaction between the land surface and the atmosphere, wherein the terrestrial surface influences atmospheric conditions and vice versa. This interaction is crucial for shaping the climate system as it affects the partitioning of energy between the land surface and the atmosphere, as well as the exchange of moisture and momentum. When the land surface is dry, it can lead to a reduction in evapotranspiration, which, in turn, may result in an increase in surface temperature. This can create a positive feedback loop, where a dry land surface amplifies the heatwave conditions, exacerbating the land-surface dryness. Such feedback loops can lead to the rapid intensification of heatwaves and droughts, significantly impacting agriculture, ecosystems, and human societies.
LA coupling generally describes the co-variability in atmospheric conditions (e.g., planetary boundary layer (PBL) height, convective available potential energy (CAPE), lifted condensation level (LCL)) with land-surface characteristics (e.g., vegetation, soil moisture) (Findell and Eltahir, 2003; Koster et al., 2004; Dirmeyer, 2011; Guo et al., 2006). In the context of extremes, LA coupling has been identified as a driver and intensifier of the duration and intensity of heatwaves and droughts (van Heerwaarden and Teuling, 2014; Ukkola et al., 2018). Miralles et al. (2019) and Schumacher et al. (2022) identified a self-propagating mechanism of droughts, wherein meteorological droughts intensify due to increased water vapor deficit (VPD) within the PBL, leading to further depletion of surface moisture reservoirs. Soil moisture is essential for climate dynamics, as it influences the partitioning between surface sensible and latent heat fluxes of incoming solar energy (Seneviratne et al., 2010; Stephens et al., 2023). In vegetated areas, surface latent heat flux additionally depends on vegetation characteristics such as stomatal resistance, the leaf area index (LAI), and rooting depth (Miralles et al., 2019; Warrach-Sagi et al., 2022).
Due to the spatial and temporal variability in these influencing factors, LA coupling often exhibits regional and temporal variations, especially under climate change conditions (Seneviratne et al., 2006; Denissen et al., 2022; Jach et al., 2022). According to Ossó et al. (2022), Europe has been experiencing an increase in climate extremes since 2000 and is likely to remain a hotspot for severe droughts (Huebener et al., 2017; van der Wiel et al., 2022), impacting not only summer crop yields (Toreti et al., 2022) but also renewable energy generation. Using water isotopes, precipitation, humidity, air temperature, and soil moisture data from 2006 to 2009, Yuan et al. (2023) identified the central and eastern Europe region in summer as 1 of 11 global hotspots for LA coupling, exhibiting varying pathways (e.g., soil moisture–precipitation, soil moisture–evapotranspiration, and soil moisture–temperature) and seasonality of LA coupling strength.
Several studies have examined the relationship between soil moisture and recent European heatwaves and droughts. Dirmeyer et al. (2021) and Orth et al. (2022) identified soil moisture as a key driver of the European heatwave in 2018. García-Herrera et al. (2010) similarly noted that a significant soil moisture deficit was one of the primary factors driving the 2003 European heatwave. Research by Miralles et al. (2014) suggested that the heatwaves across Europe in 2003 and in Russia in 2010 were intensified by a persistent large-scale weather pattern associated with substantial soil moisture decay. The analysis conducted by Dirmeyer et al. (2021) for the 2018 European heatwave revealed enhanced soil moisture–maximum temperature coupling under drought conditions, where exceptionally low soil moisture limited evapotranspiration and consequently amplified heatwave conditions due to reduced evaporative cooling (Santanello et al., 2018). This led to one of the most severe heatwaves recorded in Europe since 1979 (Becker et al., 2022). Wehrli et al. (2019) found that both soil moisture and large-scale weather patterns are equally critical for the duration and intensity of heatwaves worldwide.
Guo and Dirmeyer (2013) reported interannual variability in soil moisture–precipitation coupling, resulting from differing soil moisture availability. The critical soil moisture threshold defines the boundary between energy-limited and water-limited regimes for evapotranspiration. Shifts from energy-limited to soil-moisture-limited conditions due to droughts and heatwaves (Dirmeyer et al., 2021; Duan et al., 2020) or vice versa in the case of severe flooding (Lo et al., 2021) imply temporal variability in LA coupling over sub-seasonal to interannual timescales. Below these critical soil moisture thresholds, intensification of heat and drought conditions occurs through LA coupling over Europe, alongside a strengthening of the coupling itself. Jach et al. (2022) identified central Europe as a transition zone where the development of convection appears to be primarily influenced by temperature increases.
Despite significant advancements in understanding land–atmosphere (LA) coupling, a crucial aspect of this complex phenomenon remains poorly understood: the temporal variability in LA coupling strength and its associated impacts. Specifically, the investigation of LA coupling across timescales beyond climate periods has been largely neglected in central Europe, and shifts between coupling regimes driven by variability in climatic conditions remain an ongoing research topic (Barriopedro et al., 2023). To address this knowledge gap, the current study aims to quantify the variability in LA coupling strength over central Europe during the summer seasons from 1991 to 2022, focusing on the relationships between temperature, soil moisture, precipitation, and large-scale weather patterns. By leveraging high-resolution data from the fifth generation of the European Centre for Medium-Range Weather Forecasts (ECMWF) atmospheric reanalysis (ERA5; Hersbach et al., 2020), this study seeks to provide new insights into the dynamics of LA coupling and its implications for climate extremes, agriculture, and ecosystems in the region. This research aims to enhance our understanding of the complex interactions between the land surface and the atmosphere and to inform the development of more effective strategies for mitigating the impacts of climate change in central Europe. The paper is structured as follows: Sect. 2 describes the data sets and coupling indices utilized in the study. Section 3 covers the interannual variability in meteorological variables and evaluates the meteorological conditions of the summer seasons chosen, followed by the analysis of LA coupling. Section 4 discusses the results, while Sect. 5 summarizes the findings and provides an outlook for potential future research.
2.1 Data sets
For the analysis of the LA coupling, ERA5 was used. ERA5 is produced by the Copernicus Climate Change Service (C3S, http://climate.copernicus.eu/, last access: 9 April 2025) at ECMWF. This data set provides hourly estimates of atmospheric, surface, and oceanic variables on a horizontal resolution of 0.25°. ERA5 clearly outperforms its predecessor ERA-Interim (Dee et al., 2011; Martens et al., 2020) and makes use of sophisticated atmospheric data assimilation including satellite-derived soil moisture data (Albergel et al., 2012) in its land-surface model (LSM) HTESSEL (Balsamo et al., 2009).
ERA5 has been successfully applied in LA feedback studies over Europe (Rousi et al., 2023, 2022) and other regions (Sun et al., 2021; Qi et al., 2023). Other reanalysis data sets like the Uncertainties in Ensembles of Regional ReAnalyses (UERRA), only available until 2019, are not recommended for use if surface fluxes are required for analysis (https://confluence.ecmwf.int/display/UER/Issues+with+data, last access: 9 April 2025). The Consortium for Small-scale Modeling (COSMO) REA6 (Bollmeyer et al., 2015) data set is only available between 1995–2019 and makes use of neither a sophisticated data assimilation scheme nor an ensemble approach. The Climate Forecast System Reanalysis (CFSR; Schneider et al., 2013) is only available until 2010 and thus does not cover the recent climate change period. Although a study of Beck et al. (2021) revealed that ERA5-Land (Muñoz-Sabater et al., 2021) outperformed ERA5 with respect to in situ soil moisture measurements in the Carpathians and southeastern France during 2015–2019, data sets developed solely for land-surface studies like ERA5-Land and the Global Land Evaporation Amsterdam Model (GLEAM; Miralles et al., 2011) lack the atmospheric boundary layer variables required for studying LA coupling. Therefore, ERA5-Land and GLEAM were not considered in this study to avoid mixing different models for the investigation of the coupling chain.
While ERA5 is a robust data set, it has some limitations. On average, latent heat (LH) in ERA5 tends to be overestimated by about 9 W m−2 (Muñoz-Sabater et al., 2021). ERA5 soil moisture shows reasonable correlations of up to 0.7 with in situ measurements from the International Soil Moisture Network (Dorigo et al., 2021) over Europe but may be overestimated on wet days and underestimated when sub-daily precipitation is present. Despite its limitations, ERA5 is a reliable data set for studying LA coupling and has been successfully applied in previous works. Its hourly estimates and high horizontal resolution make it a valuable tool for understanding the complex interactions between the atmosphere and land surface.
2.2 LA coupling indices
In our study we apply a subset of the statistical LA coupling metrics, namely the terrestrial coupling index (TCI) and atmospheric coupling index (ACI) (Guo et al., 2006; Dirmeyer, 2011; Santanello et al., 2018). Additionally, the correlation (CORRSH_LH) between surface sensible heat flux (SH) and surface latent heat flux (LH) is calculated. To derive the different indices, we used a combination of the NCAR Command Language (NCL; Brown et al., 2012) and the Fortran programs provided by Tawfik (2015).
For our analysis, we used volumetric root zone soil moisture η, defined as the weighted sum of the soil moisture in the top three soil layers of ERA5 (i.e., the top 1 m), LH and SH, CAPE, and PBL height (PBLH). In addition, we used the height of the lifted condensation level (HLCL) and the lifted-condensation-level deficit (LCL deficit). The LCL deficit (m) is defined as the height difference between HLCL and PBLH. Since HLCL was not directly available from ERA5, we applied the approach proposed by Georgakakos and Bras (1984) and Bolton (1980), which derives the HLCL based on the surface pressure, 2 m temperature, and 2 m dew point, a method also employed by Dirmeyer et al. (2014):
Rd is the gas constant for dry air, Tv is the virtual temperature at 2 m above ground level, g is the acceleration due to gravity, PSFC is the surface pressure (hPa), and PLCL denotes the pressure of the LCL (hPa).
The strength of soil moisture–latent heat flux coupling (TCIη–LH) between η and LH is defined as
where is the slope of the linear regression as described in Santanello et al. (2018) and σ(η) corresponds to the standard deviation of root zone soil moisture. Equation (2) describes the sensitivity of LH with respect to changes in the root zone soil moisture.
To derive the strength of the coupling between the land surface and the atmosphere (ACI), the standard deviation of η can, for example, be substituted by surface fluxes in Eq. (2) while LH in Eq. (2) can be substituted by PBLH or CAPE (Dirmeyer et al., 2014). ACIs are computed (1) between LH and CAPE (ACILH–CAPE) and (2) between LH and HLCL (ACILH–HLCL):
σ (LH) denotes the standard deviation of LH. The daily mean values, required for the indices, are calculated between 06:00 and 18:00 UTC (Yin et al., 2023). Water grid cells are not considered in our evaluation.
2.3 Interannual variability in anomalies
Seasonal mean anomalies of 2 m temperatures and precipitation from ERA5 as well as precipitation from the ENSEMBLES daily gridded observational data set for precipitation (E-OBS; Cornes et al., 2018) version V26.0e were calculated to categorize the summer seasons in central Europe between 1991 and 2022 into dry to wet and warm to cold or moderate years.
The investigation of interannual variability in anomalies in various variables and metrics, including their spatial distribution, involved the calculation of time series of the spatial variability in anomalies as follows. For each land grid cell, the average anomaly for the months of June to August was computed for each year. Box–whisker plots were then utilized to represent data from all land grid cells, facilitating a comparison of the spatial variability in summer anomalies across different years.
3.1 Interannual variability in summer seasons 1991–2022
From 2015, apart from in 2016 and 2021, more than 75 % of the grid cells in the study area show negative soil moisture anomalies (Fig. 1a); in 2021, the proportion is more than 50 %. Before 2015, there was stronger interannual variability, where often more than 50 % of the grid cells had positive soil moisture anomalies. Since 2015, positive temperature anomalies have been observed over more than 75 % of the grid cells. Before 2015, only the years of 1994, 2003, 2006, and 2012 were characterized by having more than 50 % of the grid cells covered by positive temperature anomalies. There has also been a change in the dew point depression since 2015 (Fig. 1c). Except for in 2016, the proportion of grid cells with positive dew point depression anomalies is larger than 50 %, as indicated by the median line inside the boxes. Before 2015, apart from in 1994 and the hot and dry summers of 2003, 2006, and 2012, at least 50 % of the grid cells showed negative dew point depression anomalies. It is also noticeable that the anomalies have spanned the same or a larger range of values since 2015, as indicated by the upper quartile. This implies that the spatial variability in and the magnitude of the anomalies are increasing. Dew point depression anomalies (Fig. 1c) can be used as an indicator for the inhibition of cloud formation. The evaporative demand of the atmosphere increases with higher temperatures, resulting in a further reduction in soil moisture and an enhanced dew point depression. This relation pattern has been observed in the recent summer seasons, particularly after 2015. The anomaly ranges of η and 2 m temperatures did not increase during these years, pointing towards a general warming and drying over our region of interest.
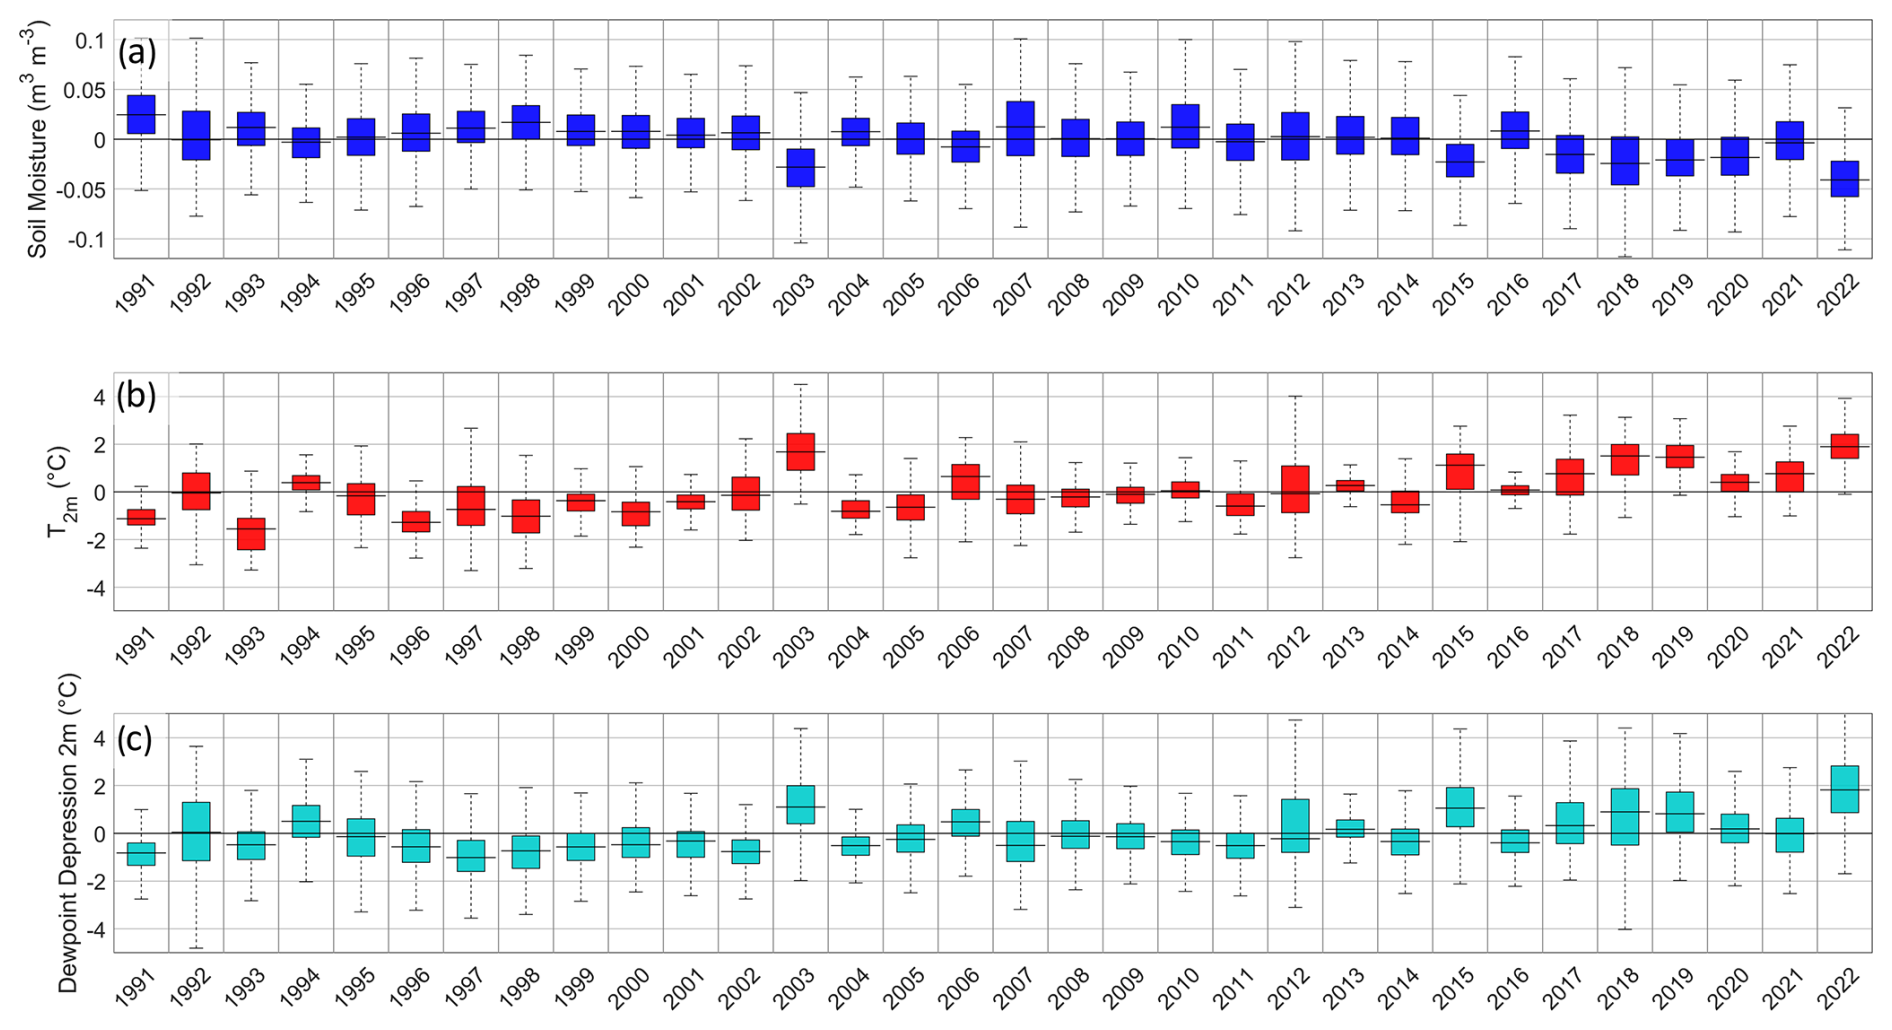
Figure 1Interannual variability in anomalies of root zone soil moisture η (a), 2 m temperature (b), and dew point depression (c) for the summer seasons between 1991 and 2022. For each land grid cell, the average anomaly for the months of June to August was computed. Box–whisker plots were then utilized to represent the data from all land grid cells in the region between 40–60° N and 5° W–25° E.
Figure 2 shows box–whisker plots of the summer mean values of LA coupling indices from 1991 to 2022 of all land grid cells in the study area between 40 and 60° N and between 5° W and 25° E. They represent the value range across Europe for each index and summer. Variations between the years denote both interannual variability in the number of grid cells (i.e., spatial extent) with potential for physical coupling and differences in the strength of the coupling (higher or lower values for the index).
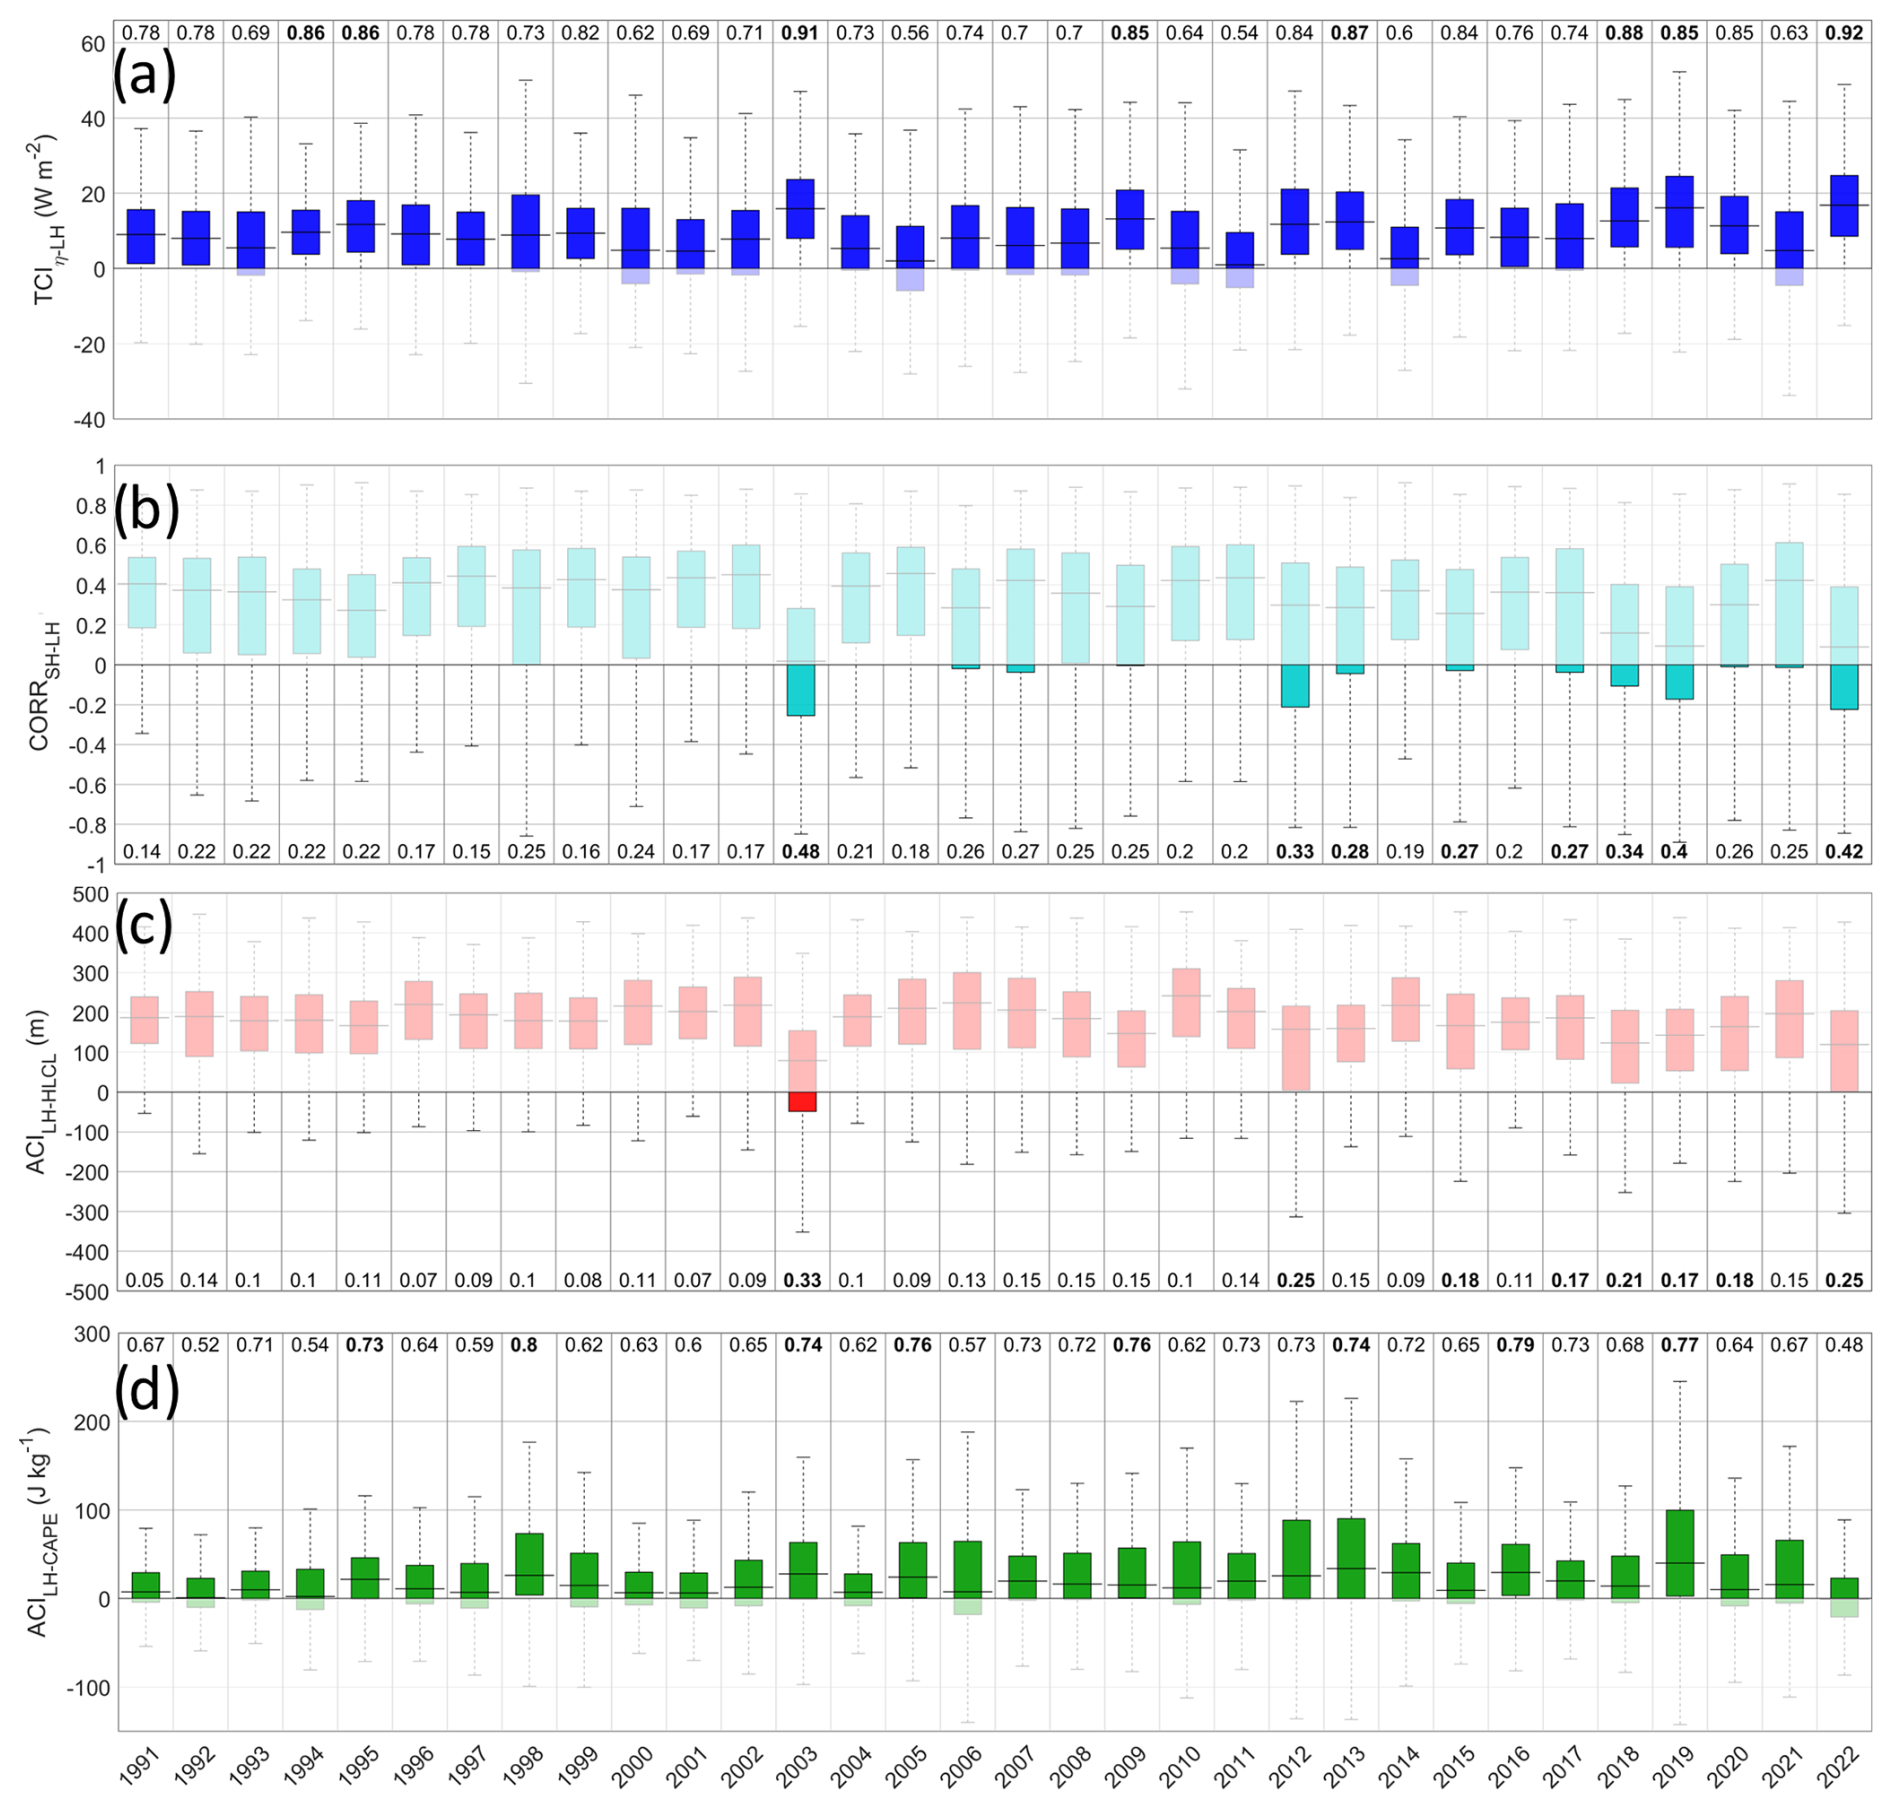
Figure 2Interannual variability in the coupling indices TCIη–LH (a), CORRSH–LH (b), ACILH–HLCL (c), and ACILH–CAPE (d) for the summer seasons of 1991–2022. The numbers indicate the fraction of land cells in the value range of the index potentially showing a physical relationship; i.e., TCIη–LH > 0, CORRSH–LH and ACILH–HLCL < 0, and ACILH–CAPE > 0. Boldfaced numbers mark the eight years (i.e., 25 % of the examined years) with the highest share of the period. Solid colors denote the sign at which the first variable of the index (e.g., η) drives the second variable (e.g., LH). For each land grid cell, the average anomaly for the months of June to August was computed from all land grid cells in the region between 40–60° N and 5° W–25° E.
The distribution of TCIη–LH (Fig. 2a) displays strong interannual variability in the fraction of all grid cells with potential for physical coupling (see number above each box). The fraction of land cells with positive TCIη–LH fluctuates between 0.54 in 2011 and 0.92 in 2022, indicating a variability of up to 38 % in the land area with potential for coupling. At the same time, the median of TCIη–LH (Fig. 2a) shows higher values for the warm summer seasons (see Fig. 1b). Consequently, the strength of the coupling also increases during these years.
In contrast, CORRSH–LH is mostly positive across Europe (Fig. 2b), which means that LH and SH co-vary. Negative correlations, where the limitation of LH causes an exaggeration of SH, mostly occur in the Mediterranean. However, there are a few exceptions during the very warm and dry summer seasons of 2003, 2018, 2019, and 2022, where the median of CORRSH–LH drops below 0.2 due to reduced positive correlation coefficients and a larger land area with negative correlations.
The interannual variability in ACILH–HLCL (Fig. 2c) is less pronounced than that in TCIη–LH and CORRSH–LH. The land area with potential for physical coupling ranges between 5 % in the early 1990s and 33 % in 2003. However, except for 2003, all summers with the largest spatial extent of the potential coupling region and the lowest median ACILH–HLCL occur in the warm and dry years of the last decade (bold numbers in Fig. 2c).
In contrast, ACILH–CAPE (Fig. 2d) exhibits weak interannual variability, with medians showing small variation over time. However, the land area with potential for coupling (positive ACILH–CAPE) varies between 0.48 and 0.8, showing variability in the spatial extent of the coupling region for this relationship. Unlike the other indices, the greatest coupling strength (represented by the median index) and the largest extent of the coupling region do not occur in the warm and dry years.
Based on the interannual variabilities shown in Figs. 1 and 2, we decided to focus on summer seasons which had a median 2 m temperature anomaly of more than 0.5 °C.
Table 1Selected summer seasons based on a positive summer temperature anomaly larger than 0.5 °C with respect to the climatological summer mean of 1991–2020. The first row below the header shows the median precipitation anomaly from E-OBS, and the bottom row denotes the median precipitation anomaly from ERA5.
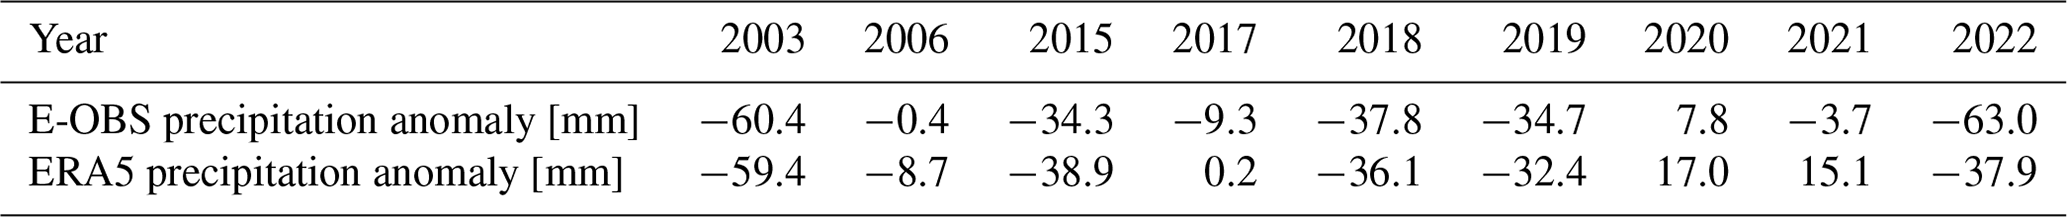
As seen from Fig. 1 and Table 1, the warm and dry summer seasons have become predominant since 2015. This has been associated with a strong reduction in annual and seasonal precipitation, combined with reduced near-surface water availability as shown by an increased dew point depression (Fig. 1c) that has led to a constant decline in the root zone soil moisture (Fig. 1a). Although the median 2 m temperature anomaly for summer 2020 was only 0.4 °C, it was included in our analysis considering that this was the only summer since 2015 that has witnessed a moderate observed positive precipitation anomaly according to both the ERA5 and the E-OBS data sets (Table 1).
3.2 Meteorological characterization of the selected warm and dry summers
3.2.1 Near-surface temperature
The highest 2 m temperature anomalies were observed during the summers of 2003, 2018, 2019, and 2022 (Fig. 3b, f, g, j) and were spatially associated with strong positive geopotential anomalies over central Europe (Fig. S1 in the Supplement). During the summer of 2006, the 2 m temperature anomalies were highest north of 51° N, while during the summer seasons of 2015 and 2017, the highest temperature anomalies were observed south of 50° N. This coincides with the fact that the maximum positive geopotential anomaly is observed south of 51° N (Fig. S1d, e). Summer 2020 shows positive temperature anomalies over a wide area of our study domain. However, the 500 hPa anomalies were very moderate (Fig. S1h), indicating a constant flow of cooler and moist air masses from western to central Europe. Summer 2021 showed a west–east anomaly gradient with temperatures slightly below the climatology over the western part of our investigation domain.
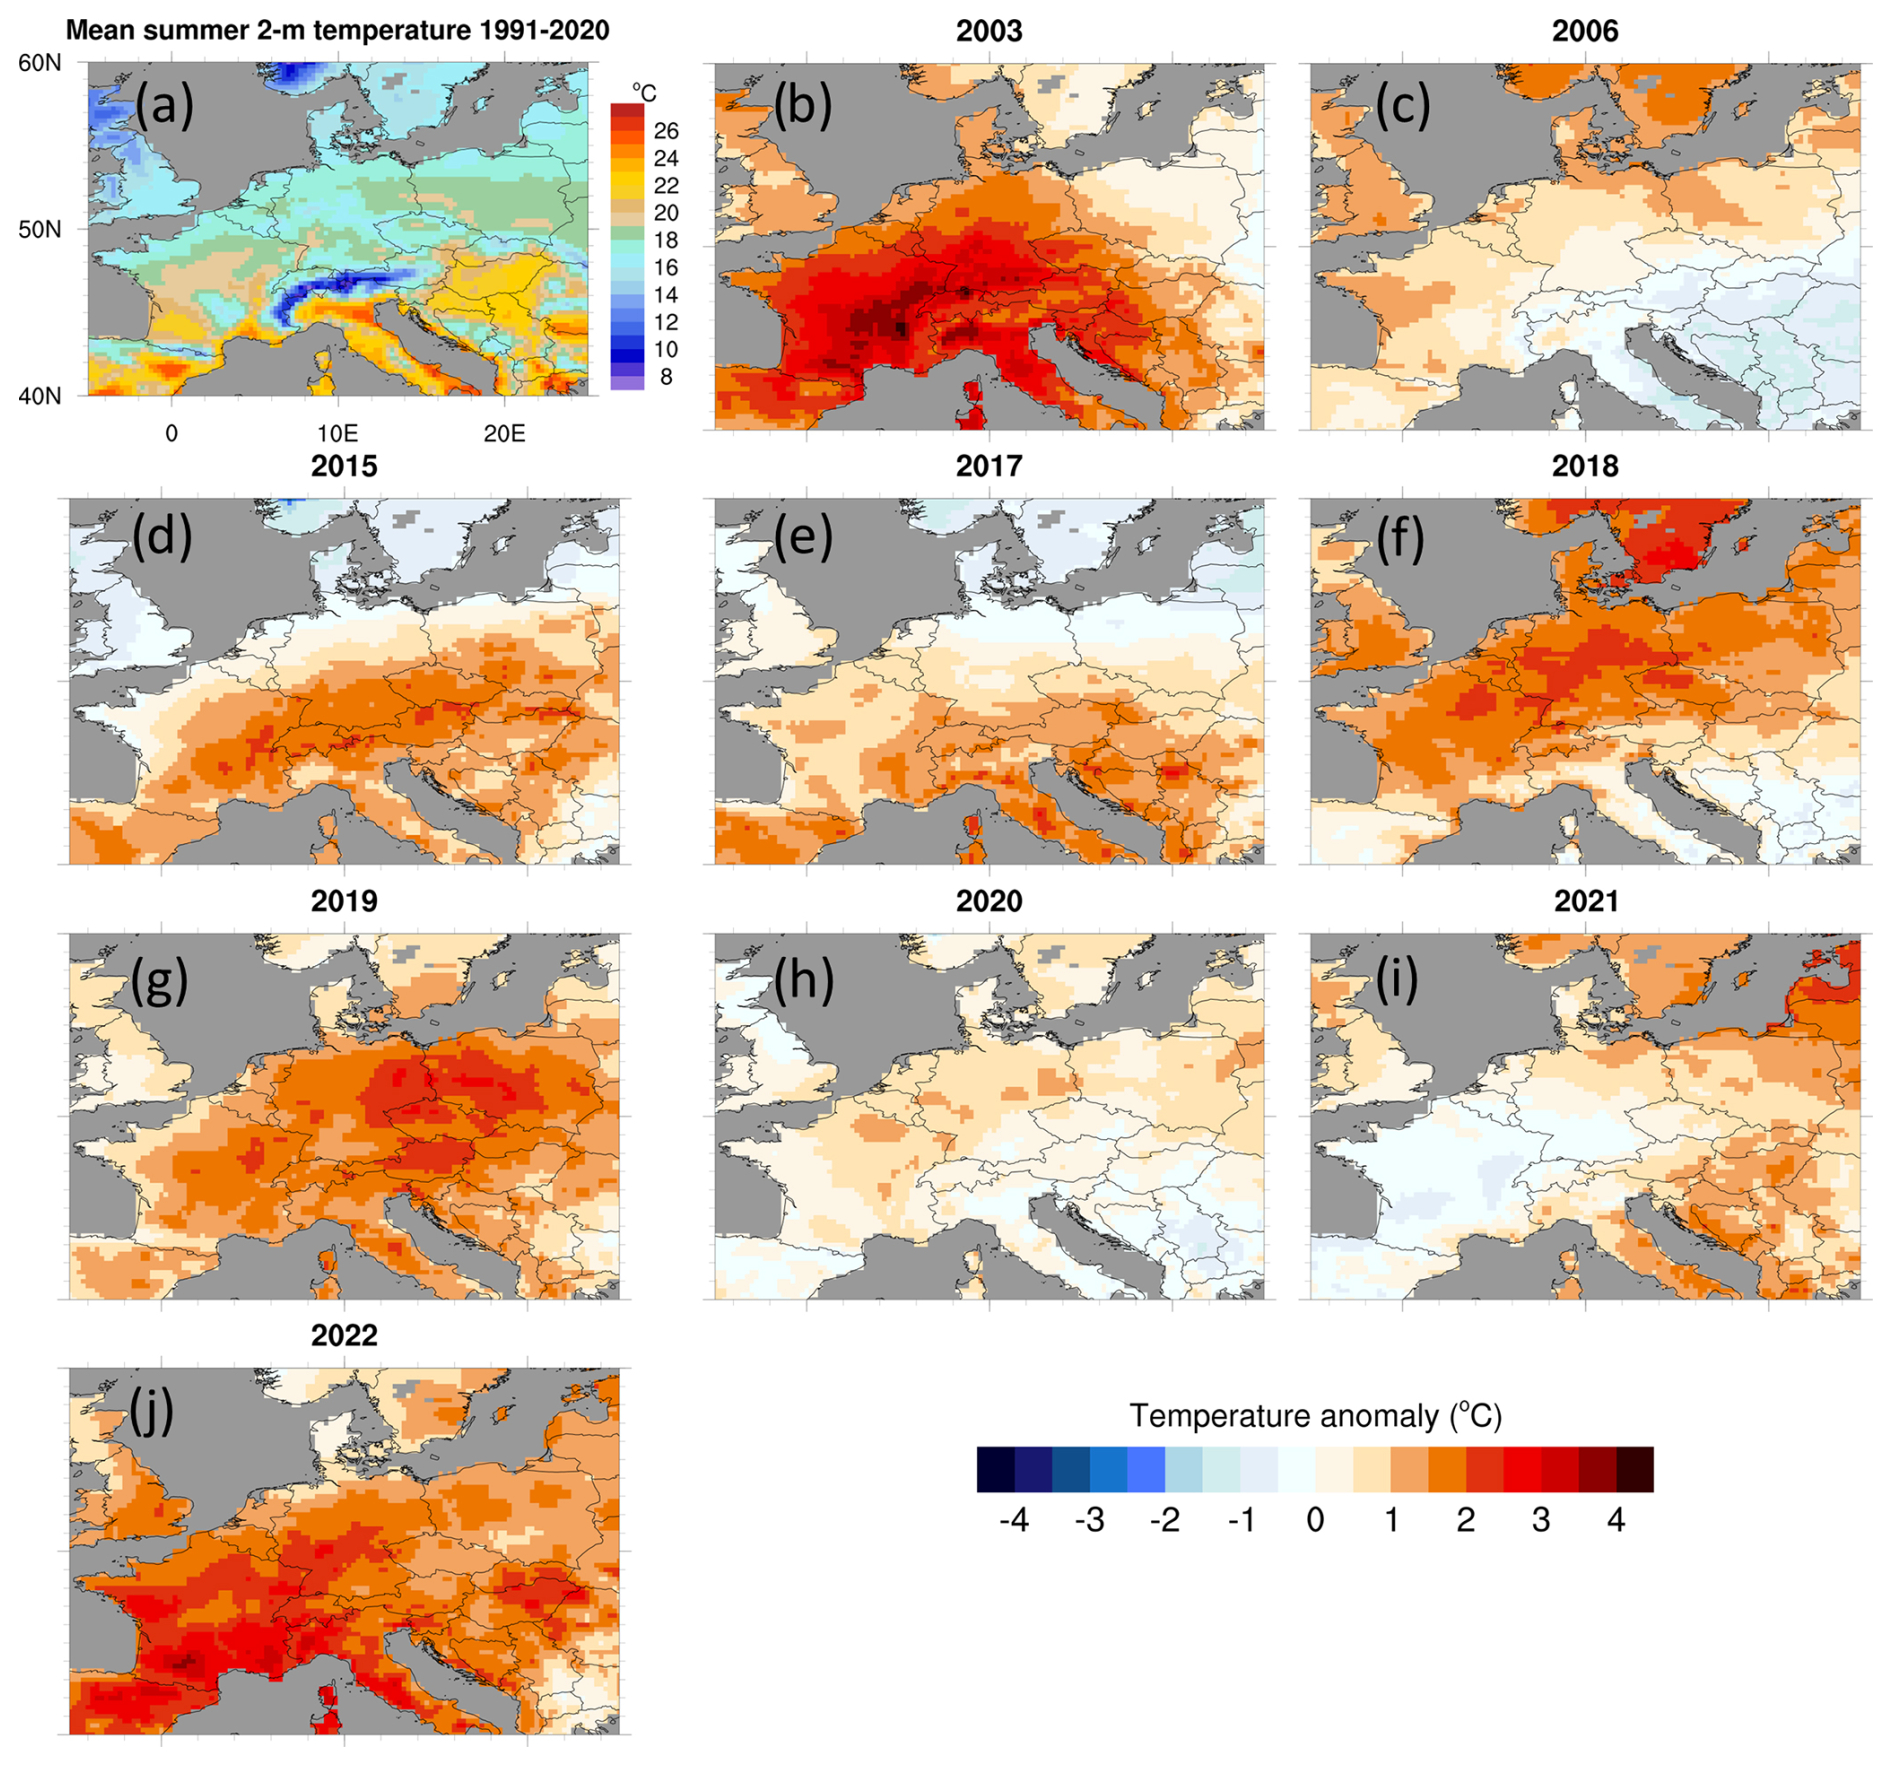
Figure 3ERA5 2 m temperature anomalies [°C]. Panel (a) shows the mean summer 2 m temperatures computed for the period between 1991 and 2020.
3.2.2 Precipitation
Precipitation (Fig. 4 and Table 1) is often well below the climatological average of 1991–2020. The summer seasons of 2003, 2015, 2018, 2019, and 2022 were exceptionally dry (Rousi et al., 2023, 2022), with a spatial median precipitation anomaly between −32.4 and −59.4 mm. ERA5 reasonably catches these dry periods (Lavers et al., 2022), which are also evident in E-OBS (see Fig. S2). The summer of 2006 can be seen as an average summer with moderate precipitation anomalies over central Europe. The summer season of 2015 shows a strong dry anomaly associated with warm temperatures and positive 500 hPa geopotential anomalies (Fig. S1d). The summer season of 2017 shows a strong wet bias over northern Germany, which is related to strong convective activity (e.g., Caldas-Alvarez et al., 2022). Summer 2020 shows strong to moderate precipitation anomalies over Germany, France, Poland, and Benelux, while precipitation over southeastern Europe is above the climatological average, resulting in an overall positive precipitation anomaly in both data sets. During summer 2021, precipitation over France, Benelux, and Germany was above average due to a small-scale, low-pressure system which caused the Ahr flood event (Mohr et al., 2023), as indicated by the dark-teal colors in Fig. 4j.
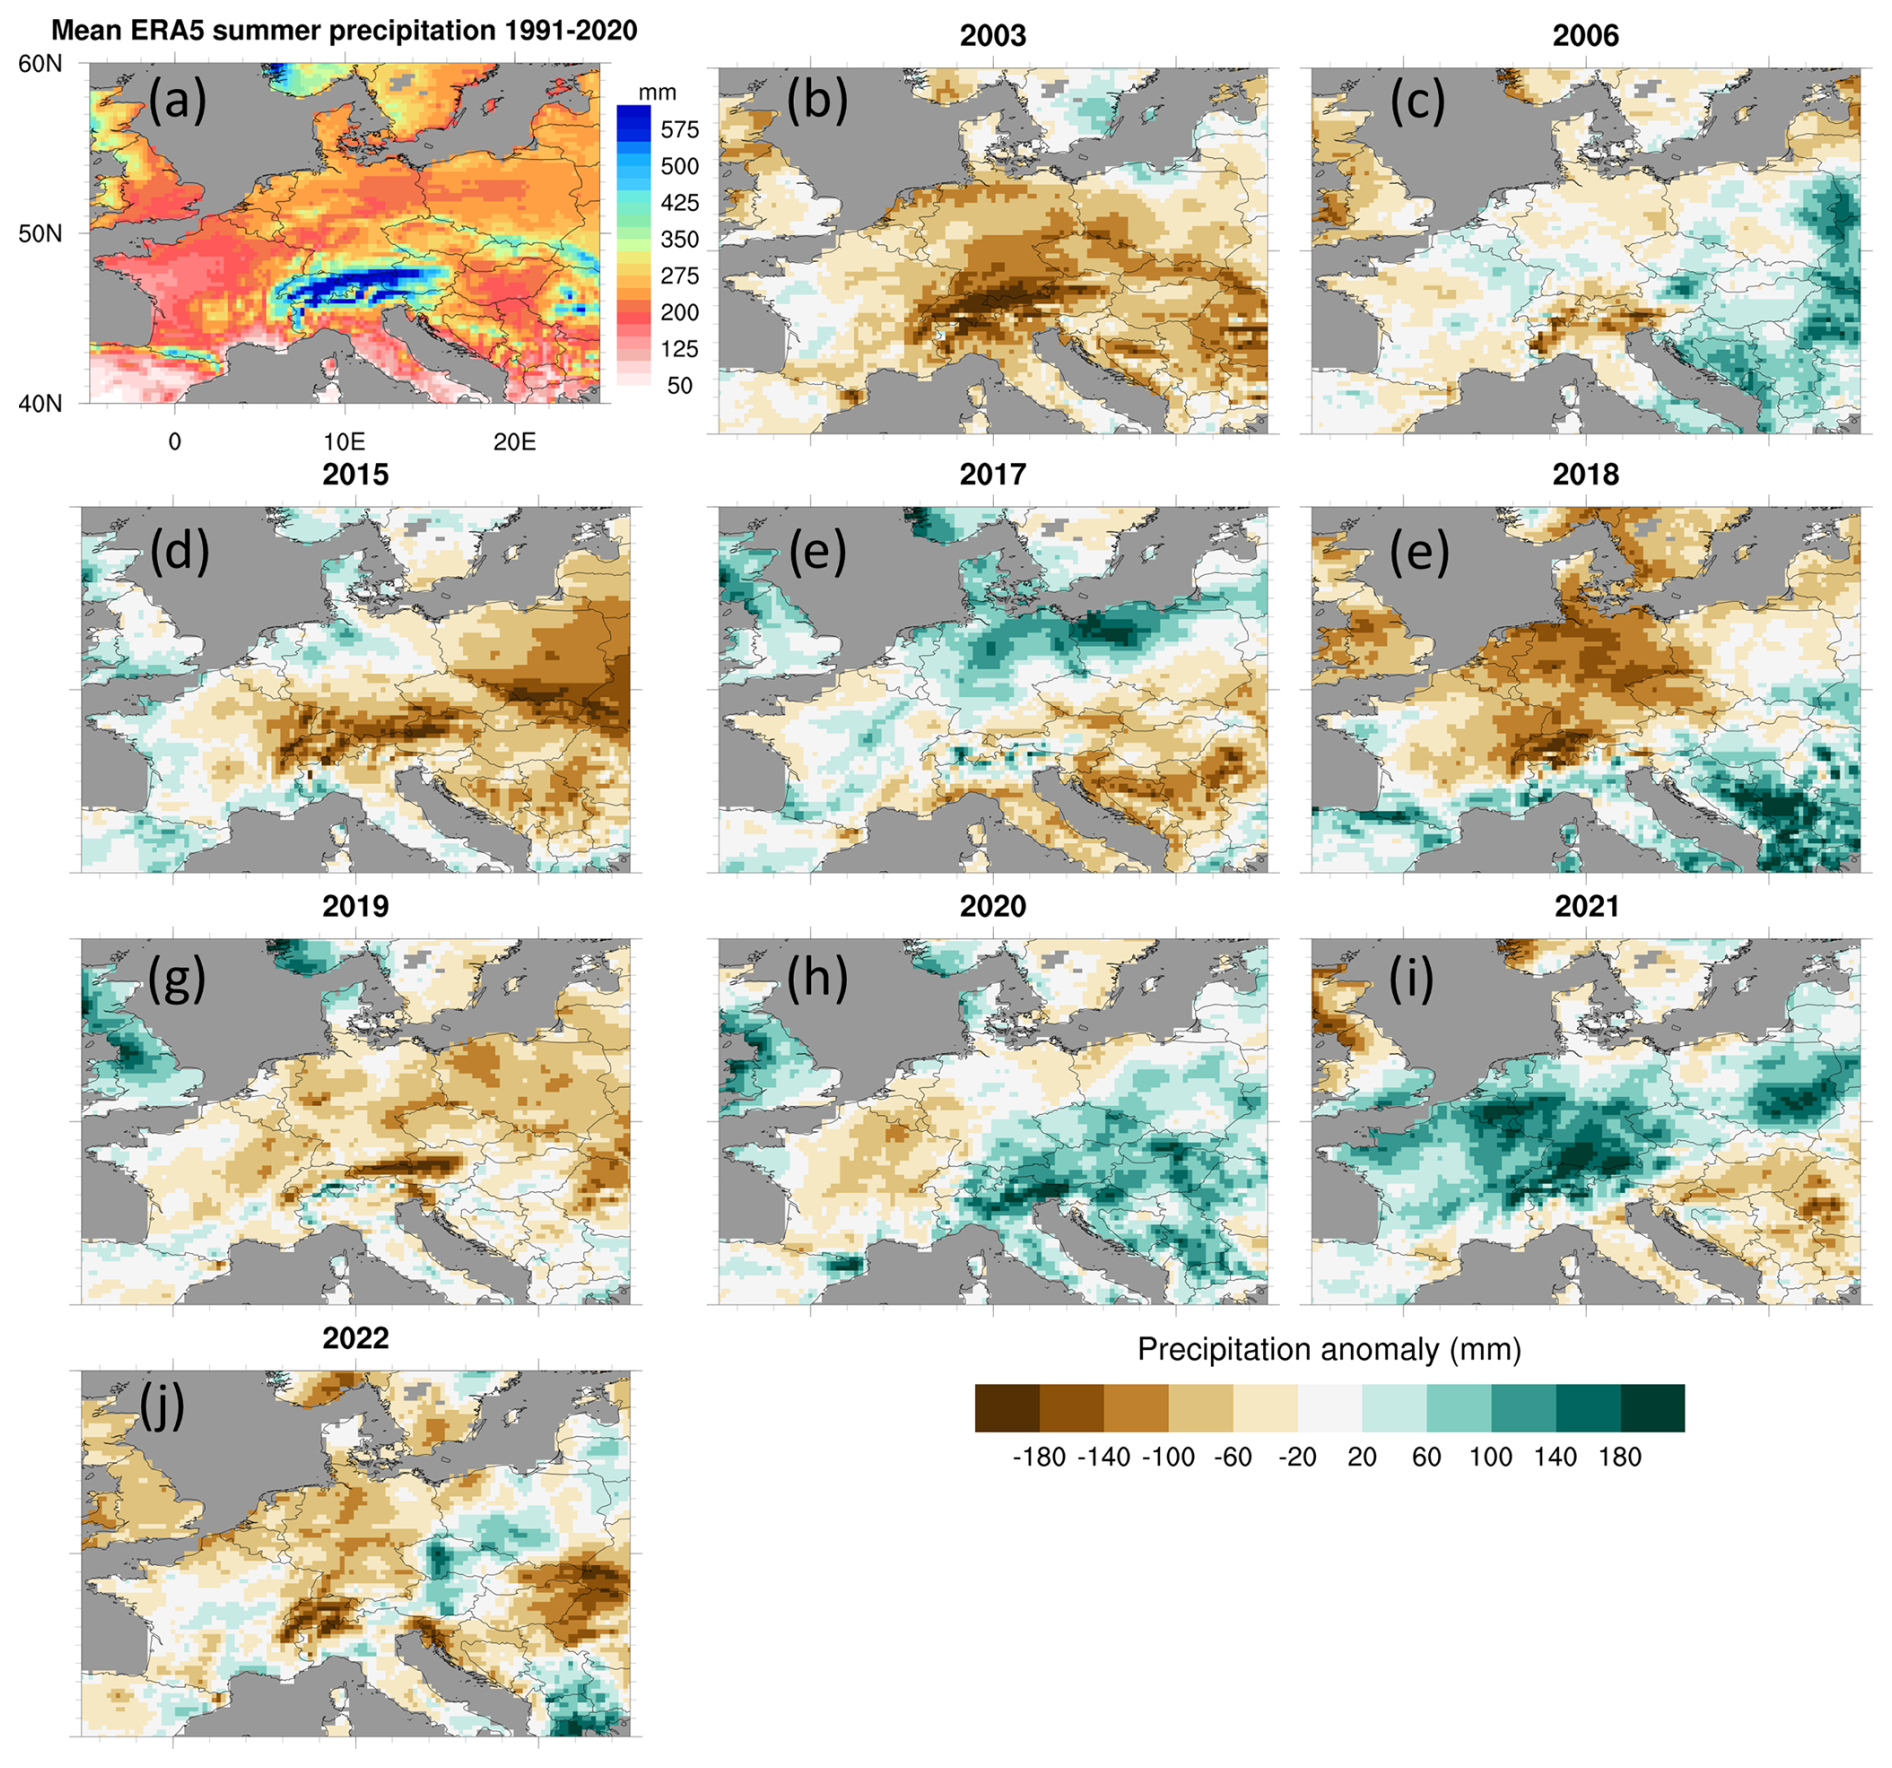
Figure 4ERA5 precipitation anomalies [mm] for the selected summer seasons. Panel (a) denotes the mean summer precipitation from 1991 to 2020.
3.2.3 Soil moisture
Figure 5 displays the ERA5-derived root zone soil moisture anomalies. The summer seasons of 2003, 2018, and 2022 show the lowest root zone soil moisture availability over Germany, Benelux, and France. This relates to the strong positive temperature bias and the precipitation dry bias. An evaluation of the median of the soil moisture anomalies over central Europe revealed that summer 2006 was an average summer with moderate positive anomalies over eastern Europe. The negative soil moisture anomaly during summer 2015 is related to missing precipitation over large parts of central Europe. Summer 2017 shows a strong positive soil moisture anomaly over northern Germany and northern Poland related to the higher-than-average rainfall (see Fig. 4). Interestingly, although summer 2019 was among the warmest and driest summers, the soil moisture dry anomaly is less pronounced than in the other three hot and dry summer seasons of 2003, 2018, and 2022. The reason for the less pronounced dry anomaly is the higher soil moisture availability during spring 2019 (Fig. S3f). The summer of 2020 shows drier-than-average soils over France and Germany, while soil moisture in the other regions is around or even above the climatological average. The summer season 2021 shows strong positive soil moisture anomalies over Benelux and Germany, which is related the fact that April and May 2021 were colder than average (C3S, 2022) as well as due to the Ahr flood event (Mohr et al., 2023).
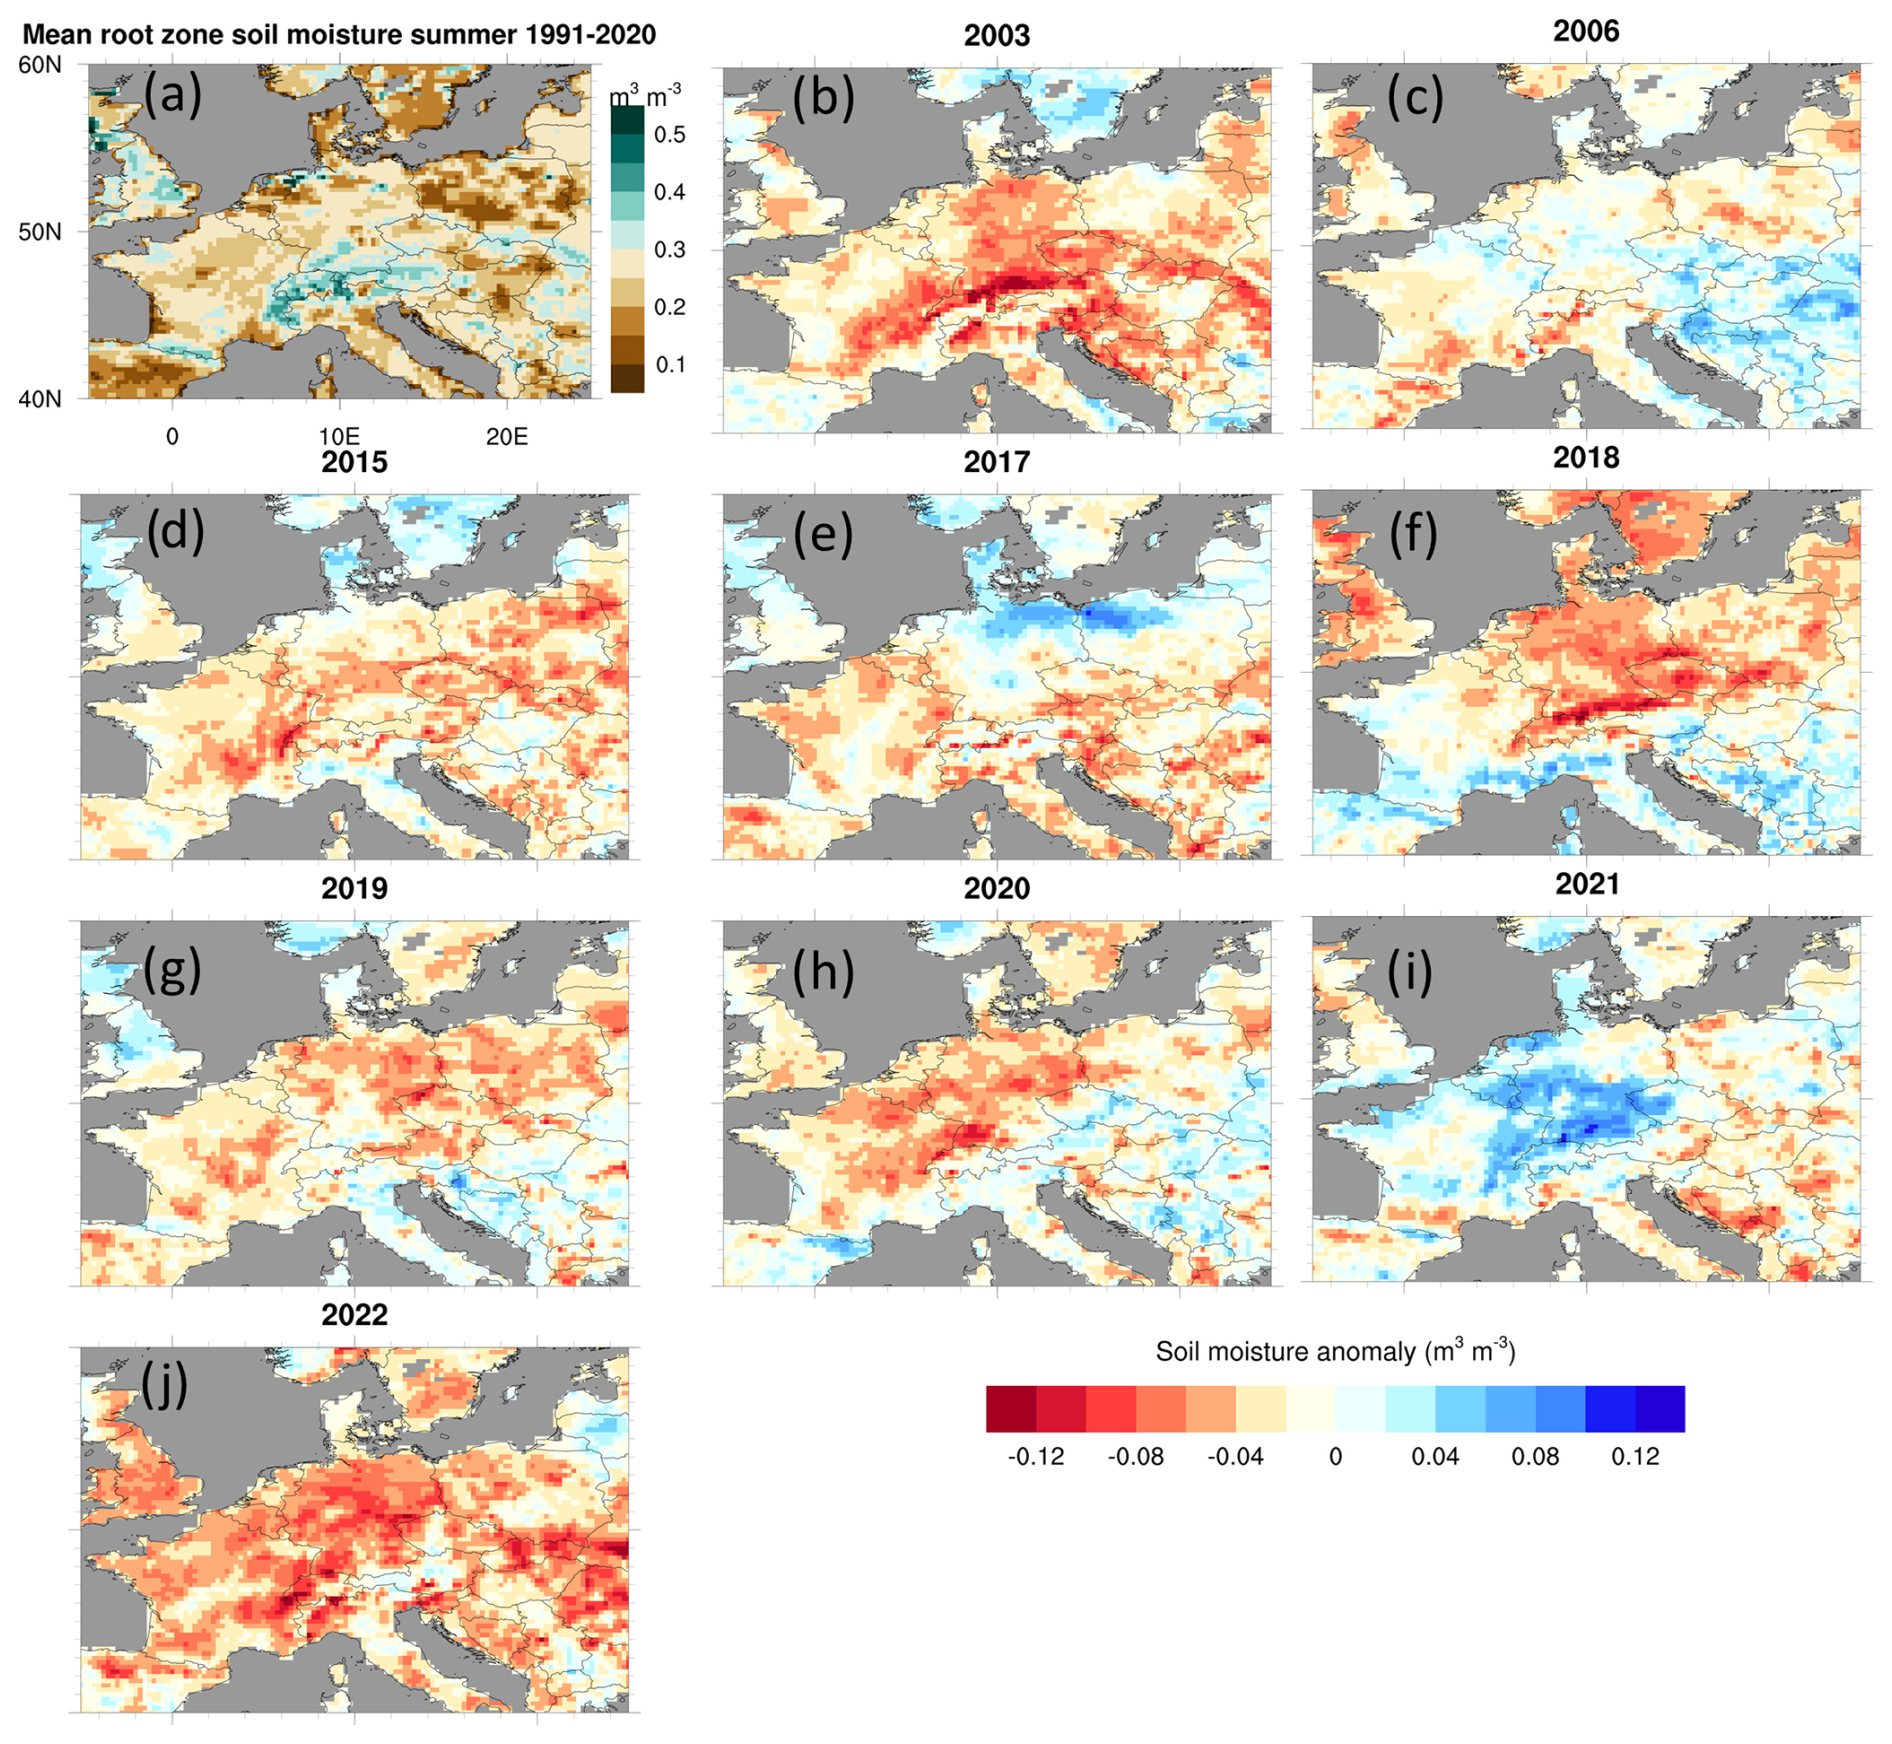
Figure 5ERA5 soil moisture anomalies [m3 m−3] for the selected summer seasons. Panel (a) denotes the summer mean root zone soil moisture from 1991 to 2020.
3.2.4 Categorization of evaluated warm summer seasons
While all years indicated that most of the cells experienced a significant warm anomaly, the spatial patterns and the extent of warm or cool, as well as moist or dry, anomalies varied between the years. By visual examination, it is possible to identify three groups within the hot years. Firstly, the years that stand out the most are 2003, 2015, 2018, 2019, and 2022. They are characterized by warm temperature anomalies and dry anomalies in soil moisture and precipitation across most of the land areas in our study domain. Secondly, 2017 and 2021 were warm, but also comparatively wet, years. Finally, 2006 and 2020 both exhibited moderate anomalies in all the meteorological fields shown before. In the following sections, the groups will be referred to as “warm and dry”, “warm and humid”, and “moderate”.
3.3 Terrestrial coupling
3.3.1 Soil moisture–latent heat flux coupling
In this section, we present the η–LH coupling based on the terrestrial coupling index (TCIη–LH) for the selected summer seasons. TCIη–LH describes how changes in soil moisture coincide with variations in LH. A positive TCIη–LH indicates that LH is limited by the root zone soil moisture and that the soil moisture variation results in LH variation. A negative TCIη–LH indicates that the development of LH is energy-limited; i.e., the incoming energy determines the LH development. In cases where the absolute TCIη–LH is low, either there is too little soil moisture available for evaporation, close to the wilting point, or the soil is too wet and a further increase does not lead to considerable changes in evaporation (Müller et al., 2021). Since the land-surface influence on the convective and nocturnal boundary layer differs considerably due to the presence or absence of incoming shortwave radiation, the analysis was based on daytime means computed for the period 06:00 and 18:00 UTC of each day (Yin et al., 2023).
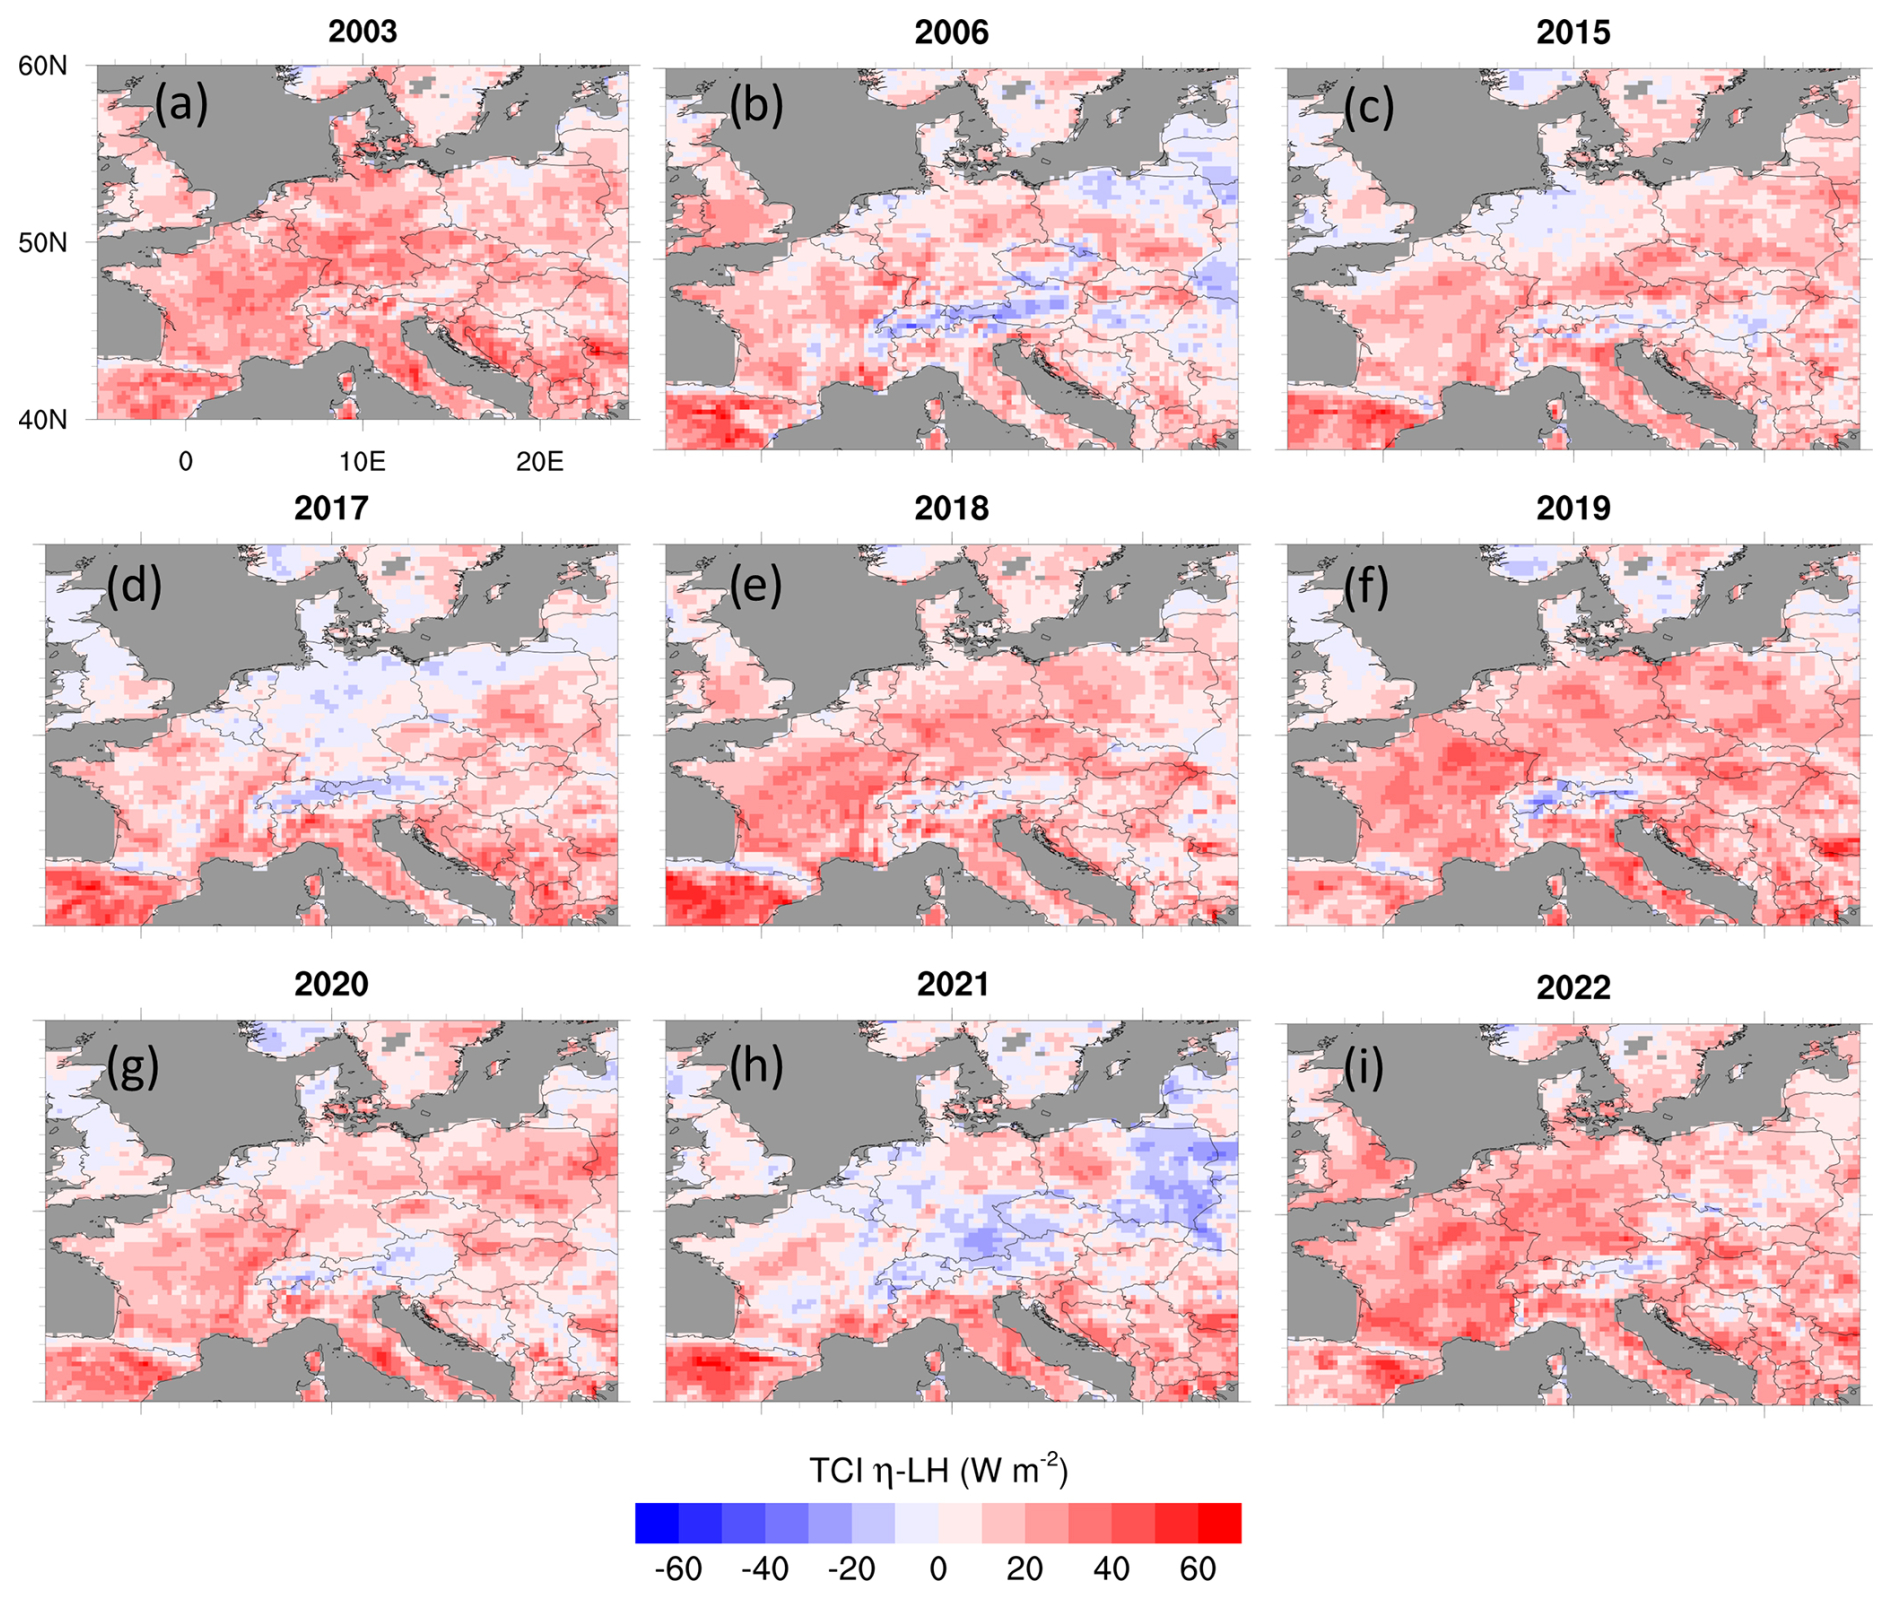
Figure 6ERA5-based terrestrial coupling index TCIη–LH between root zone soil moisture η and latent heat flux LH for the selected summer seasons.
Figure 6 shows the mean spatial pattern of TCIη–LH observed for the previously selected warm and dry summer seasons. The very warm and dry seasons show a strong positive TCIη–LH over the regions affected by low soil moisture (Germany, France, and Benelux; Fig. 5a, e, f, i). In summer 2015, which was overall very dry with respect to soil moisture and precipitation, TCIη–LH shows neutral values over northern Germany, while the rest of the investigation domain shows positive values. The warm and wet summers show the lowest values for the TCIη–LH of all warm years. In the wettest regions during the years 2017 and 2021, the index changes its sign. The now neutral-to-negative values indicate that there is enough soil moisture available (see Fig. 5). This implies that in these areas and during these years, the variations in latent heat (LH) flux are not directly linked to changes in soil moisture (refer to Figs. 5 and 6).
During 2021, when a positive η anomaly is observed over Germany, Benelux, and eastern France (Fig. 5h), the TCIη–LH becomes moderately negative in these regions, with values of about −20 W m−2 (Fig. 6h). This can be explained by a moist spring season (Fig. S3i) and the heavy-precipitation event that occurred in June 2021 (Mohr et al., 2023), leading to soil moisture content close to field capacity (Fig. S4). A similar behavior of TCIη–LH is observed during the two cold and wet summer seasons (1997 and 2002, not shown).
During the moderate summers of 2006 and 2020, TCIη–LH shows a heterogenous pattern with neutral to slightly positive values of up to 20 W m−2 over most parts of central Europe. The only exception is the Alpine area and in 2006 the eastern part of our study domain, where the TCIη–LH is slightly negative.
3.3.2 Correlation SH–LH
The majority of correlation coefficients CORRSH–LH are negative over the Iberian Peninsula and the Mediterranean, which is related to very low absolute evapotranspiration (Seneviratne et al., 2006). Over the British Isles, Scandinavia, and the Atlantic coasts, the heat fluxes usually demonstrate a positive correlation.
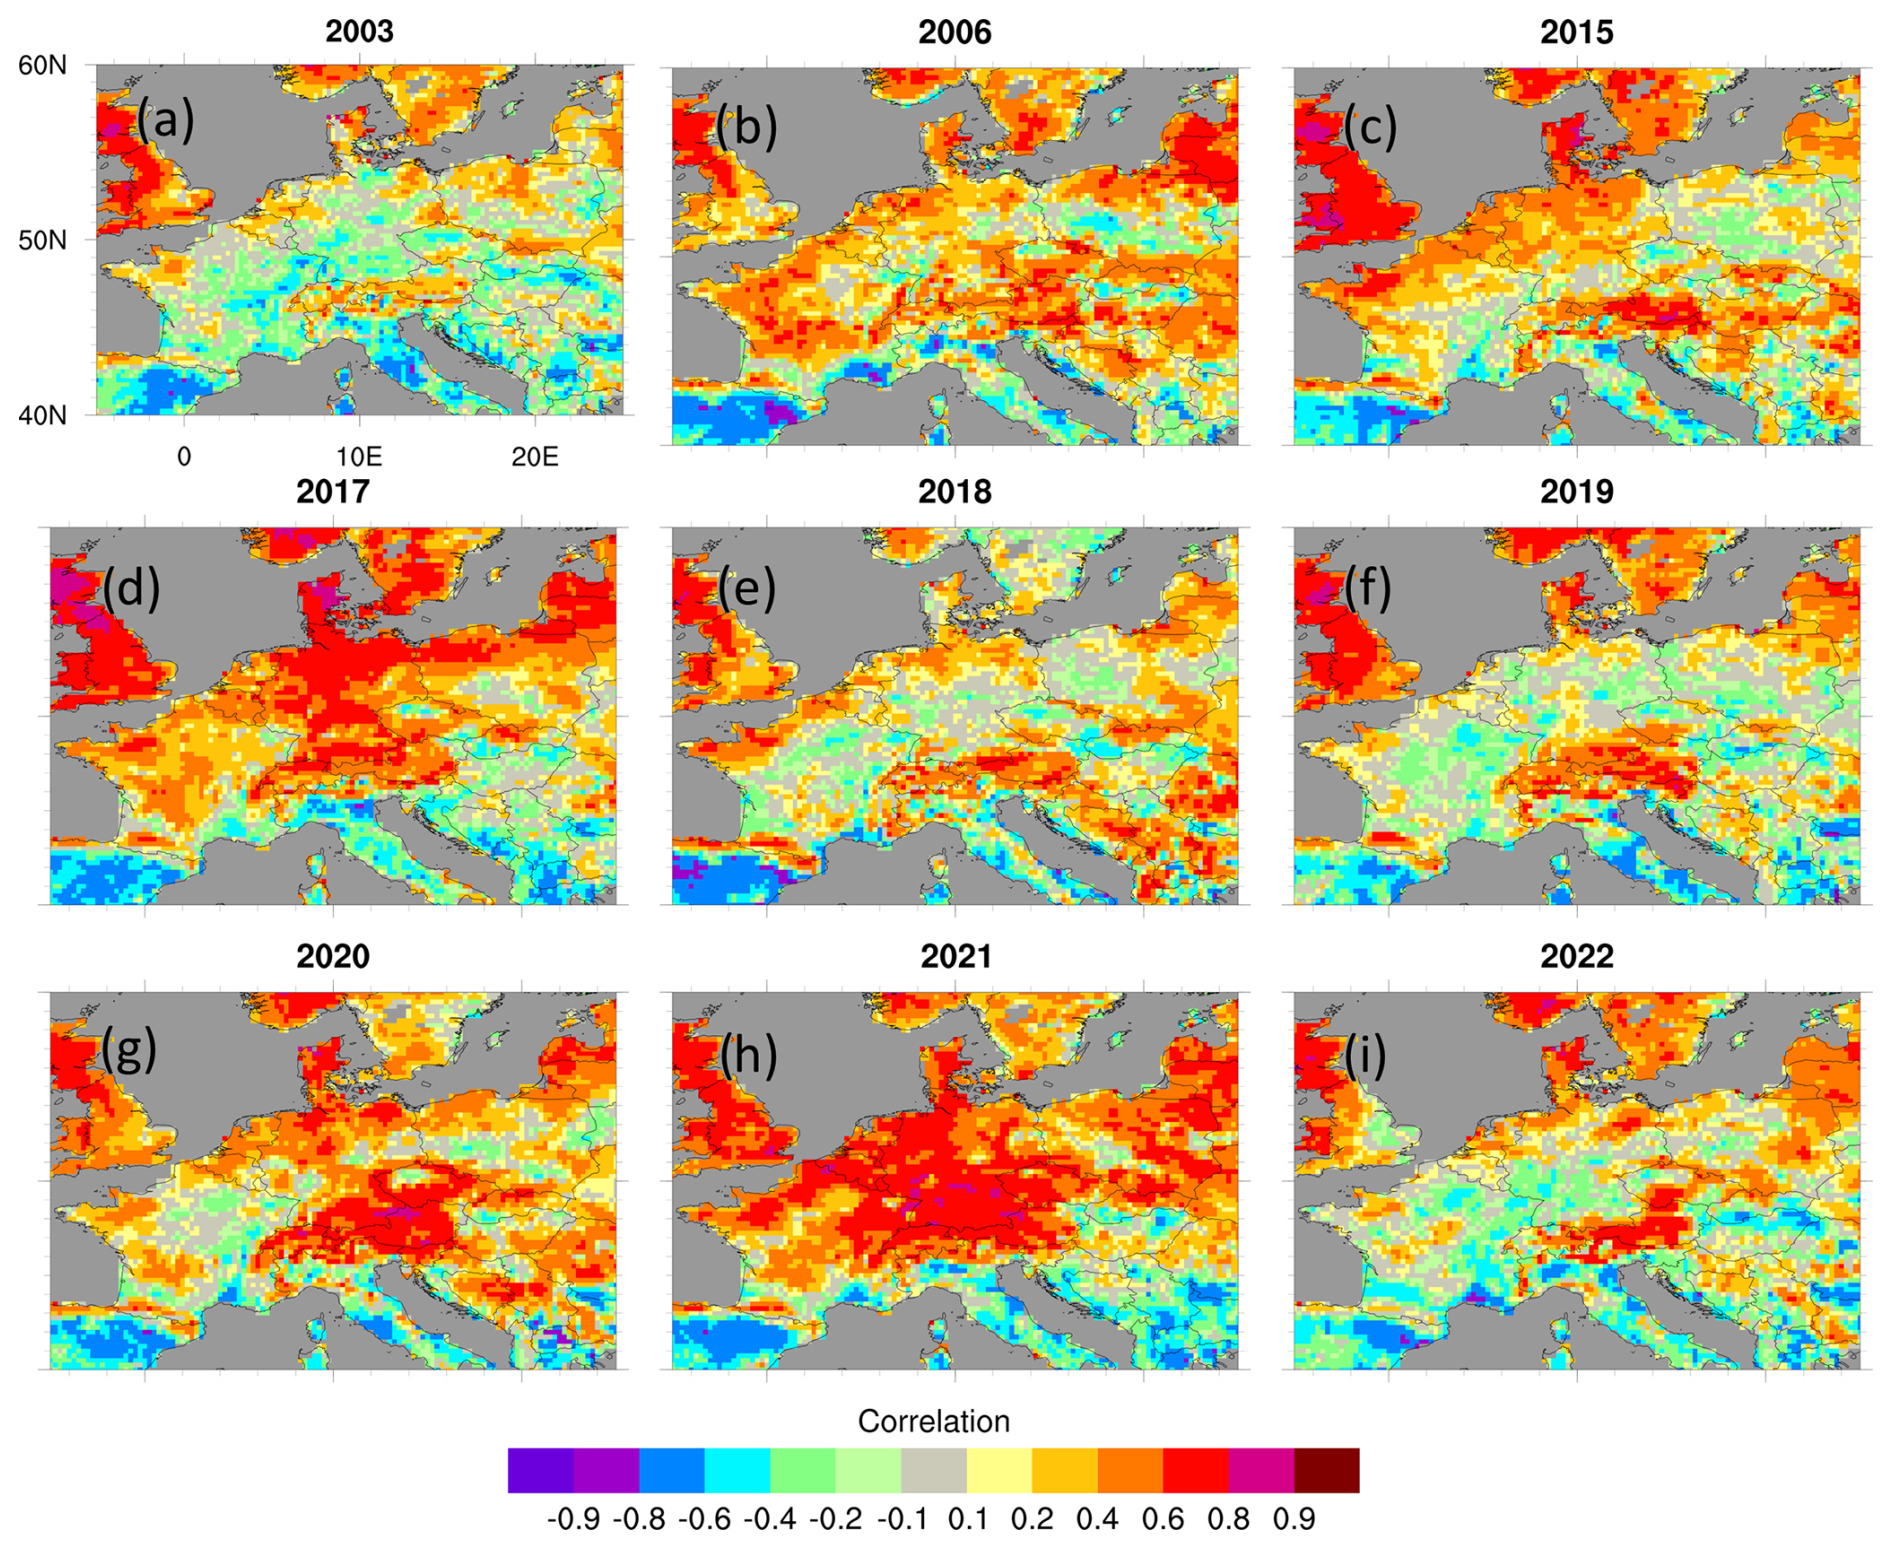
Figure 7Pearson correlation coefficient between SH and LH (CORRSH–LH) for the selected summer seasons. Dark-grey areas denote water grid cells.
During the warm and dry summers of 2003, 2018, 2019, and 2022, CORRSH–LH (Fig. 7) became negative over Germany, France, and Benelux. This is related to the anomalously warm and dry conditions in the atmosphere and a soil moisture deficit during these years. The soil moisture deficit limits LH, and due to the resulting reduction in evaporative cooling, SH is further increased. Consequently, the temperature gradient between land surface and atmosphere increases. During the warm and wet as well as the moderate years, the SH–LH correlations remain positive over central Europe and the patterns of CORRSH–LH largely resemble those of TCIη–LH (see Fig. 6).
In 2017, the spring season showed a positive soil moisture anomaly over Germany, eastern Europe, and the British Isles (Fig. S3), which is reflected in the strong positive CORRSH–LH during the summer over these regions (Fig. 7d). The correlation pattern for summer 2021 is similar to the patterns during the cold and wet seasons of 1997 or 2002 (not shown), when enough soil moisture was available for evapotranspiration.
3.4 Atmospheric coupling
3.4.1 Coupling LH–HLCL
This section explores the relationship between LH and HLCL and is complemented by an evaluation of the LCL deficit.
For ACILH–HLCL, negative values are associated with a potentially physical relationship. An increase in LH means stronger PBL moistening by the land surface. Stronger moistening in turn suggests that saturation is reached faster and at a lower altitude, meaning a lower HLCL. The LCL deficit compares the heights of the PBL and the LCL (PBLH − HLCL). It can be employed as a proxy for the evolution of locally triggered deep convective processes. A positive LCL deficit means that the PBL top is above the LCL, with both heights given in units of meters above ground level. Hence, saturation occurs within the PBL, which is a prerequisite for locally triggered convective processes and cloud formation. Contrarily, a negative LCL deficit denotes an inhibition of convection developments (Santanello et al., 2011). Please note that Santanello et al. (2011) depict LCL and PBL on pressure levels, which leads to a switch in the sign in their interpretation.
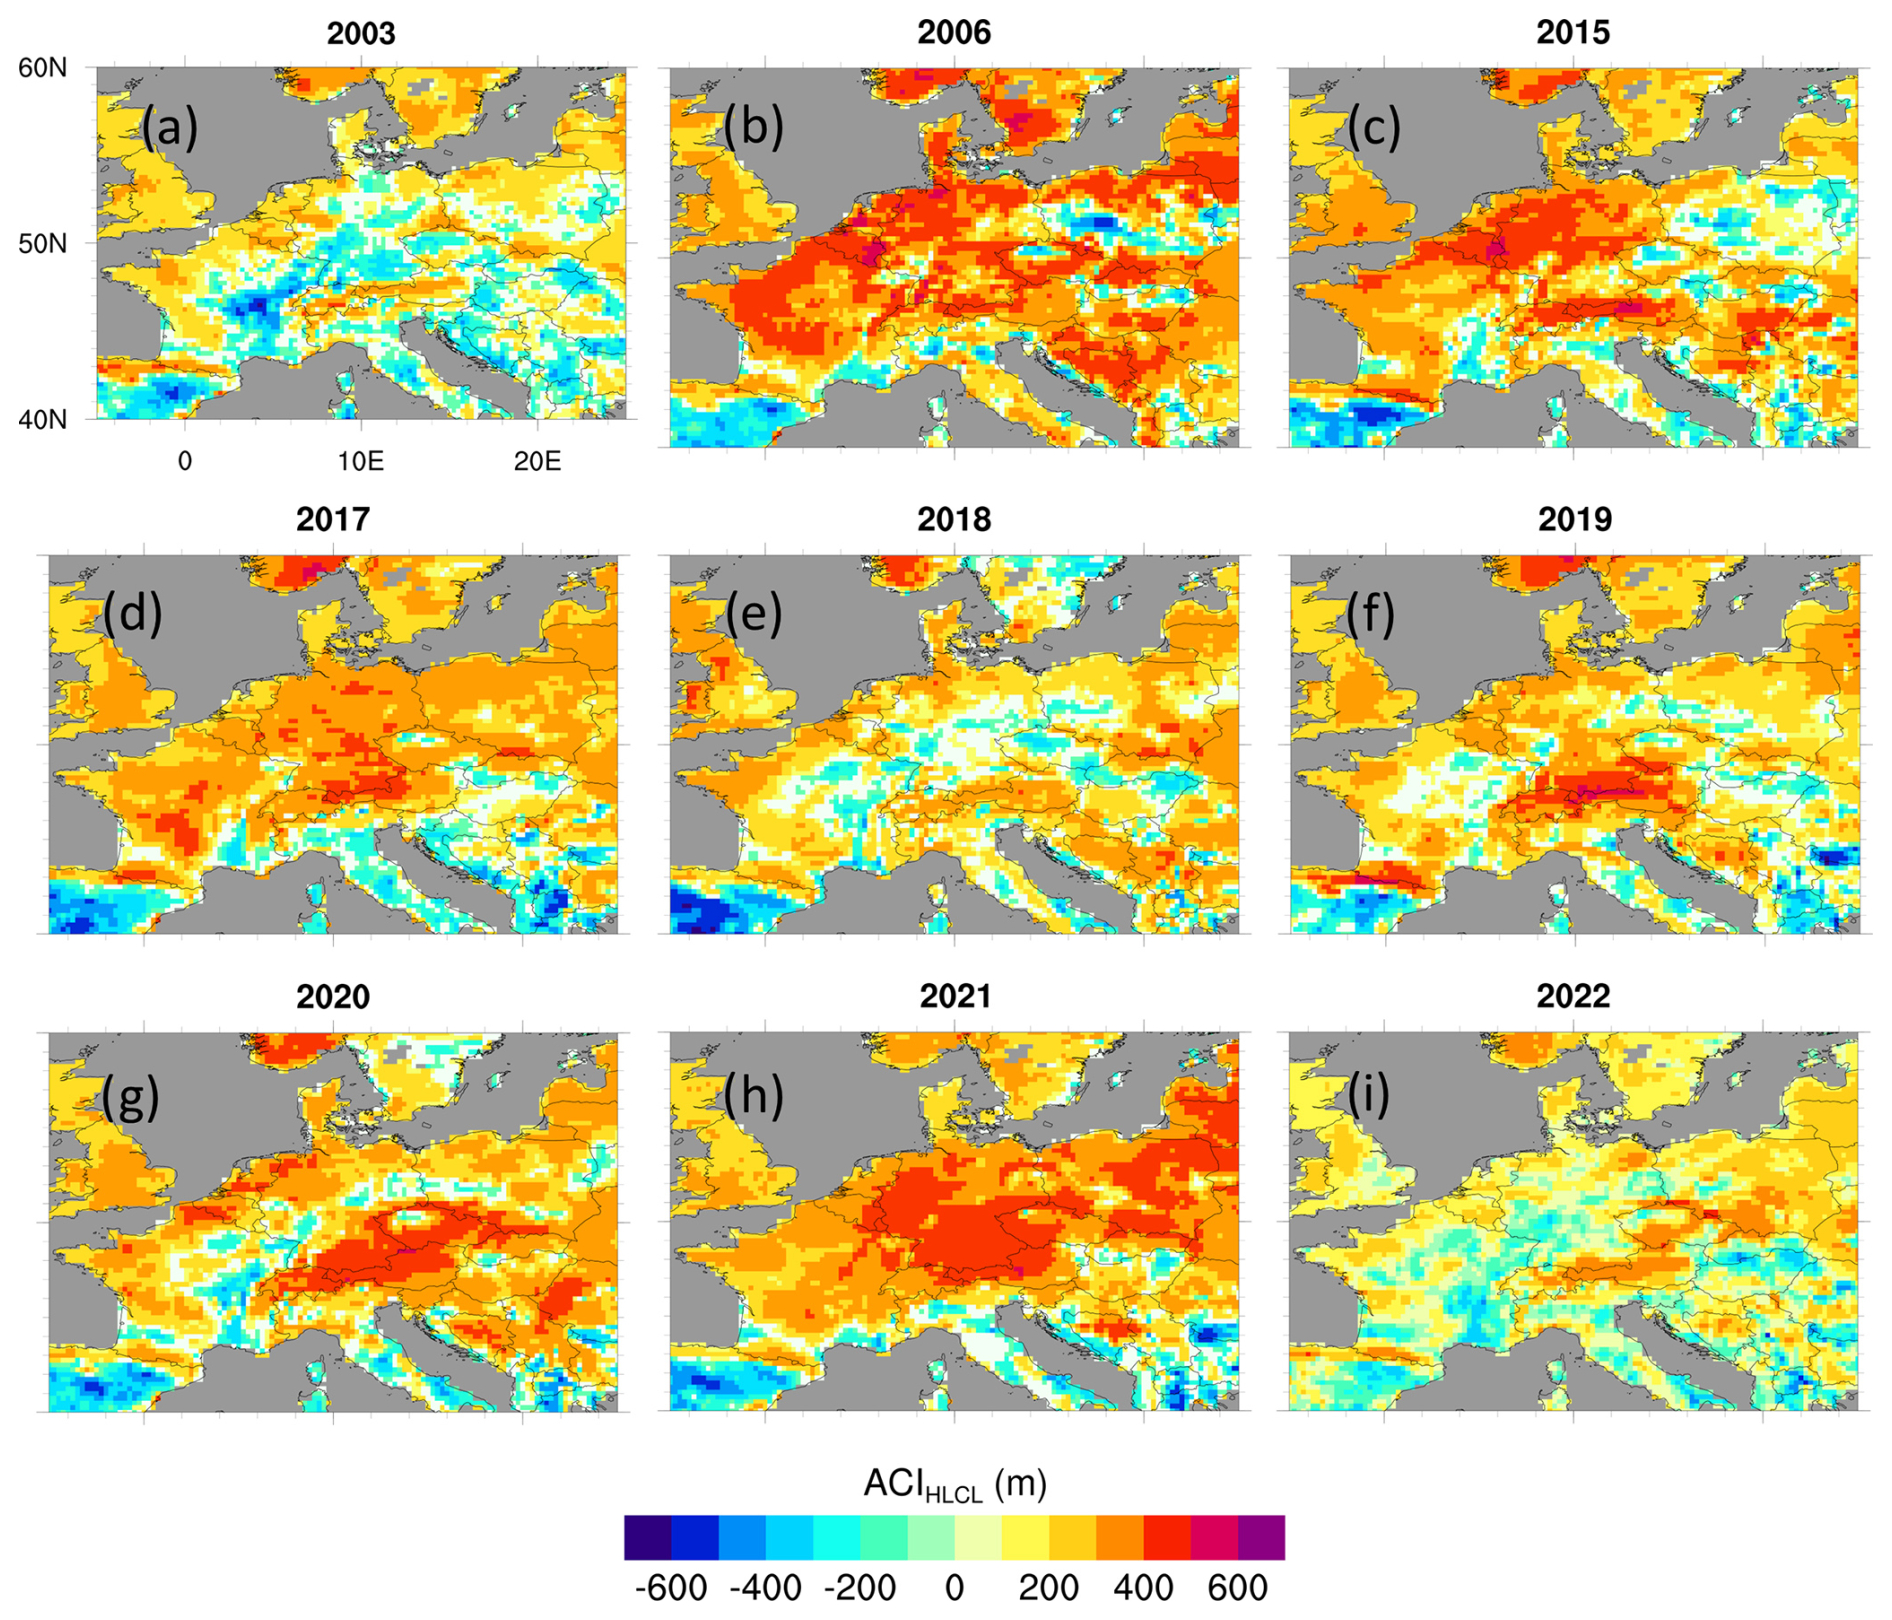
Figure 8Atmospheric coupling index between LH and HLCL (ACILH–HLCL) for the selected summer seasons.
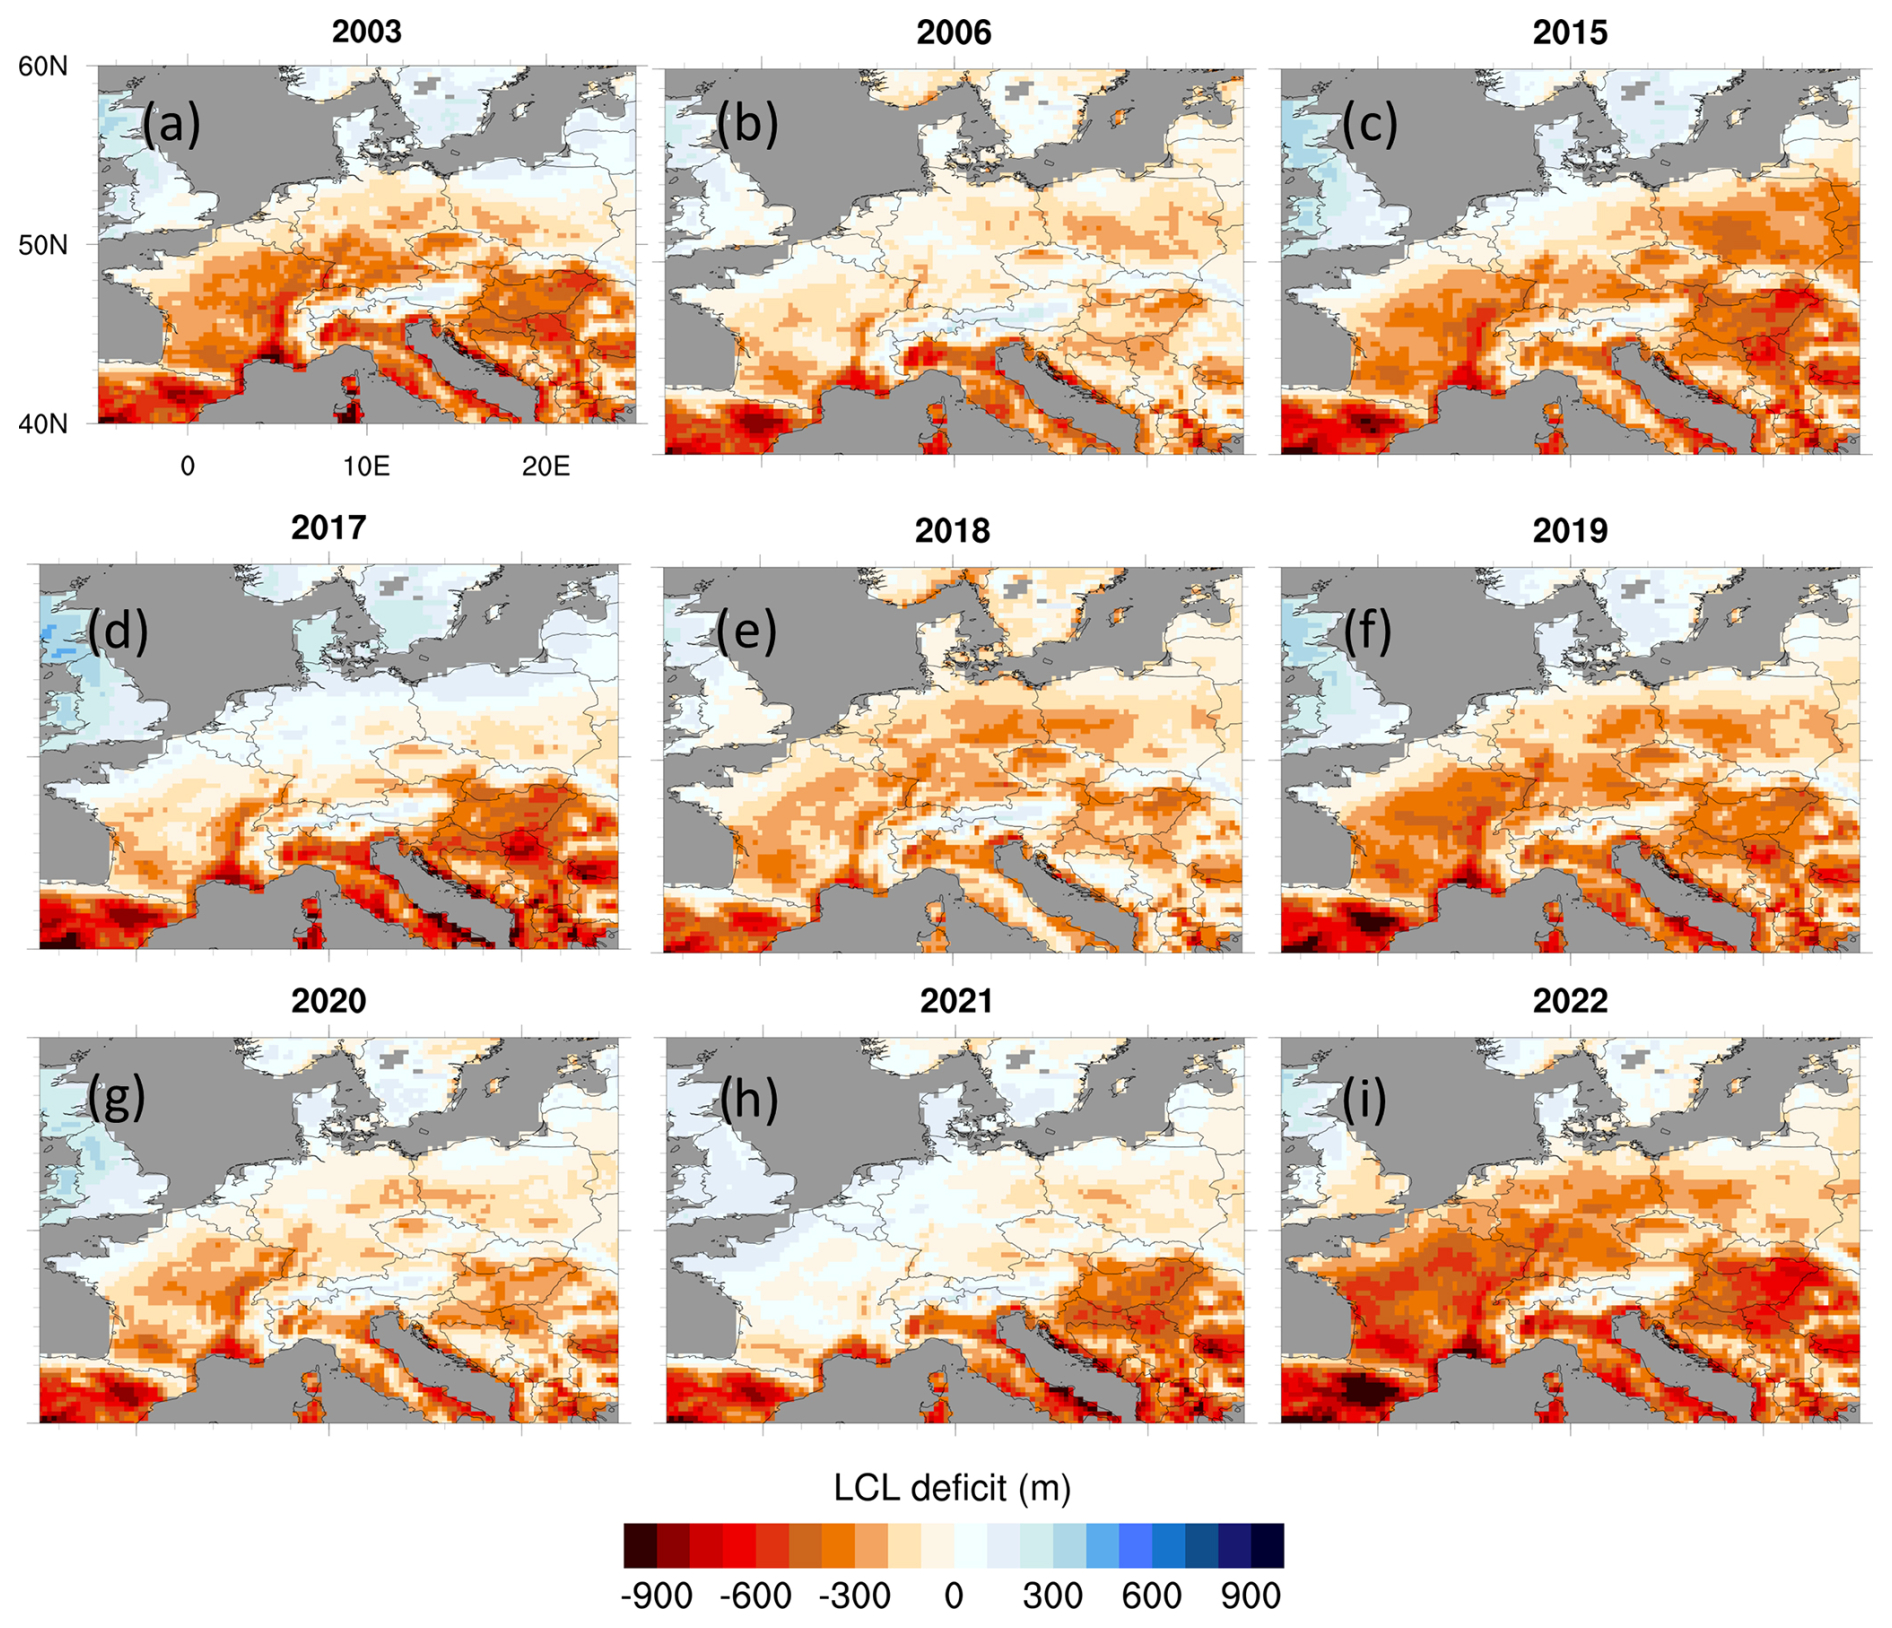
Figure 9Mean ERA5 LCL deficit. Orange and reddish colors denote less favorable conditions for convection.
The average pattern of the ACILH–HLCL in the reference period indicates a physical influence of the LH on HLCL (negative values) over the south of the domain (Fig. 8). The negative values are limited to the Iberian Peninsula and the Mediterranean, where summers are typically strongly moisture-limited. Simultaneously, the LCL deficit is negative (Fig. 9), leading to a strong inhibition of the local formation of clouds and deep moist convection. Over France, Germany, and the Balkans, the ACILH–HLCL patterns are patchy, with negative or slightly positive values at lower elevations and positive values over mountain ranges. The LCL deficit over these regions is comparatively low, with values of up to −300 m. This is the area in the study domain facing considerable interannual variability, which is reflected by the sign changes of the ACILH–HLCL. Over the other regions, the ACILH–HLCL is mostly positive, which suggests no considerable influence of the LH on HLCL, although the LCL deficit has negative values throughout all summer seasons. Over the northern regions of our investigation domain, the LCL deficit is often neutral or positive, indicating favorable conditions for the evolution of convection.
During the warm and dry summers of 2003, 2015, 2018, 2019, and 2022, central Europe experiences a switch in the sign from averagely positive to slightly negative values of ACILH–HLCL (Fig. 8a, e, f, i). These areas mostly overlap with those where CORRSH–LH also switches its sign (Fig. 7). At the same time, the negative LCL deficit increases up to −600 m over central Europe and to over −900 m over the Iberian Peninsula (Fig. 9). This indicates that the very dry soil during these summers (Fig. 7) caused low LH, which in turn initiated a considerable increase in the HLCL (Fig. S5) and thus a stronger negative LCL deficit, as shown in Fig. 9.
During the warm and humid as well as the moderate summers, ACILH–HLCL is positive over large parts of central Europe, indicating that LH variations are not the primary driver of HLCL evolution. Further, SH does not influence HLCL (not shown), which suggests a stronger atmospheric influence in the LA system during moderate to humid periods.
Over Germany, France, and Benelux, ACILH–HLCL shows low or negative values during the extreme warm and dry summer seasons of 2003, 2018, and 2022 (Fig. 8a, e, i). This indicates that the very dry soil during these summers (Fig. 5) caused low LH, which in turn initiated a considerable increase in HLCL (Fig. S5) and thus a higher LCL deficit, as shown in Fig. 9.
In the summers of 2006, 2015, and 2017, ACILH–HLCL is positive over large parts of central Europe, indicating that LH variations do not drive the evolution of HLCL. During summer 2021, the positive soil moisture anomaly (Fig. 5) is connected to weak or negative coupling between η and LH (Fig. 6). This implies that LH either has few variations or is high compared to other summer seasons. This leads to a lowering of HLCL (Fig. S5; e.g., Wei et al., 2021), which is also reflected in a mostly neutral LCL deficit over central Europe, as shown in Fig. 9. This leads to an HLCL decrease (not shown; e.g., Wei et al., 2021) and, ultimately, to a residual LCL deficit over central Europe, as shown in Fig. 9.
As the TCIη–LH is mostly positive over these regions during these summers, while the ACILH–CAPE is neutral to slightly positive, it can be inferred that soil moisture variation impacts LH variations but with weak feedback to the atmosphere.
3.4.2 Coupling LH–CAPE
This section explores the results of ACILH–CAPE for the warm summer seasons. This index aims to assess the relationship between surface moistening of the PBL represented by LH and the energy in the atmosphere, which is potentially available for the development of deep moist convection (CAPE). CAPE represents the deviation of the atmospheric virtual temperature profile from the moist adiabat between the level of free convection and the equilibrium level. This buoyant energy is typically stored a couple of hundred meters above the ground. It depends on both atmospheric humidity and the temperature gradient, which in turn are subject to surface influences through the surface heat fluxes. Through PBL moistening, an increase in LH can lead to an increase in CAPE, which indicates the potential for convective developments and thus precipitation.
A common feature is the negative ACILH–CAPE along the coast of the Mediterranean. As the sea surface temperatures in this region can reach up to 26 °C (García-Monteiro et al., 2022), this leads to high evaporation over the sea and thus high precipitable-water values. Together with a temperature gradient of up to 30 °C or more in the Mediterranean between 850 and 500 hPa (not shown), this can lead to a strong atmospheric instability in ERA5 and thus to an overestimation of CAPE in the Mediterranean (Taszarek et al., 2018).
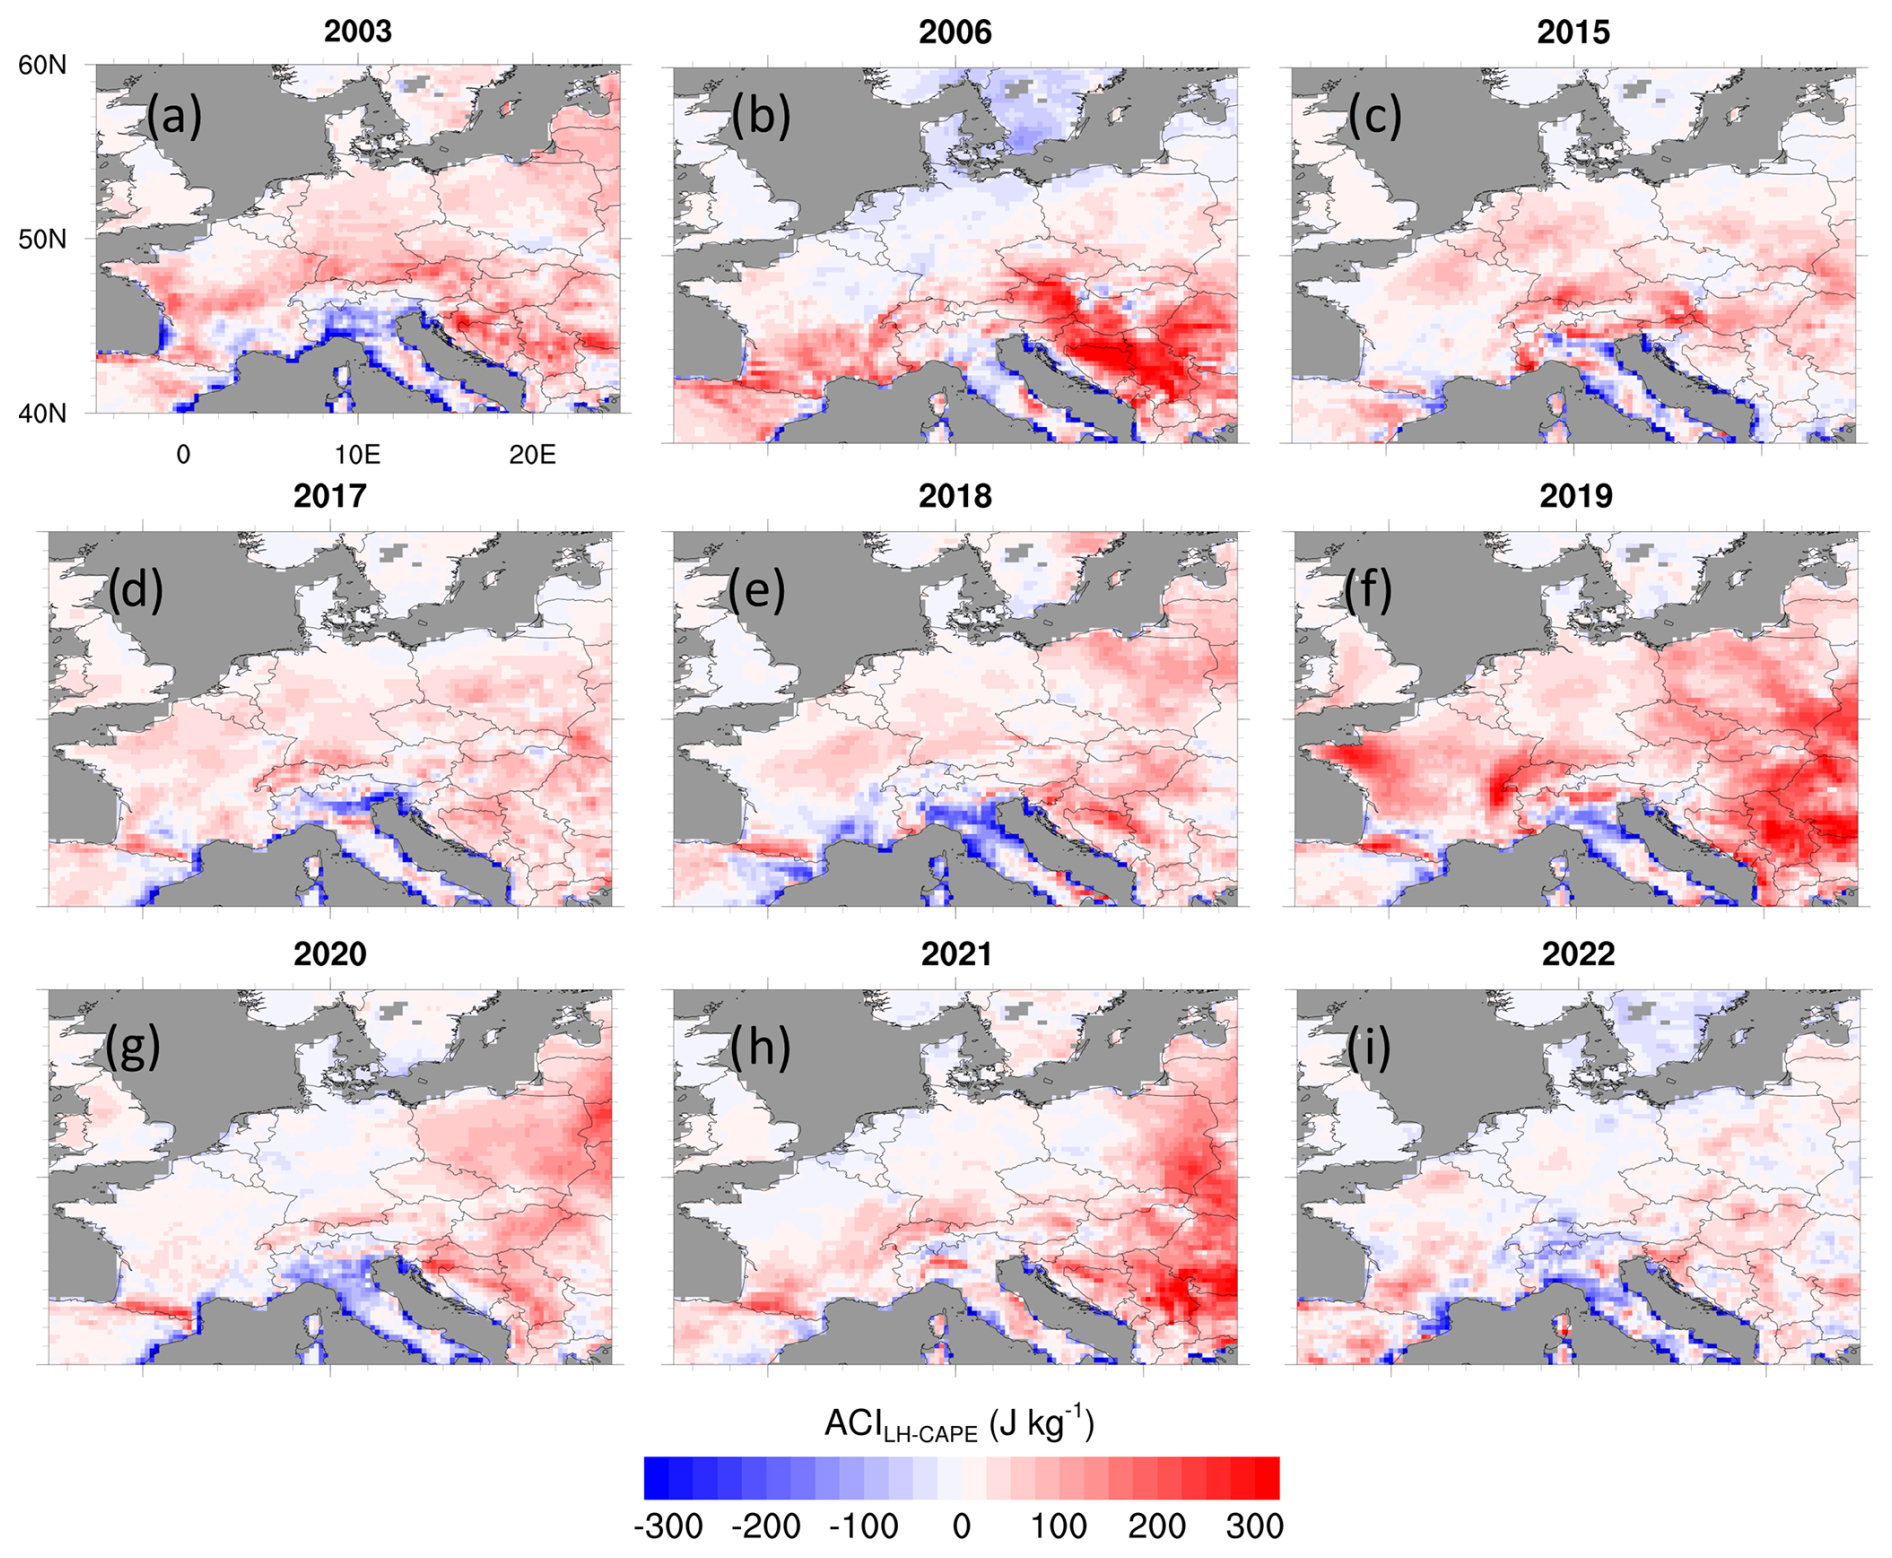
Figure 10ERA5 atmospheric coupling index between LH and CAPE (ACILH–CAPE). Grey areas denote water grid points.
Coupling hotspots are observed over eastern and southeastern Europe with ACILH–CAPE values of more than 250 J kg−1 in the summers of 2006, 2019, 2020, and 2021 (Fig. 10). They are related to higher values of LH over these regions (not shown) due to neutral or positive root zone soil moisture anomalies (Fig. 5). These coupling hotspots were also observed in a climate sensitivity study of Jach et al. (2022). Over Germany and France, coupling is weak, although stronger signals were observed in 2003 and 2019. The low values of ACILH–CAPE over the British Isles and southern Scandinavia suggest that these regions are more frequently impacted by large-scale synoptic systems with a more stable atmosphere rather than by localized precipitation events (Jach et al., 2020). This is also reflected by the positive LCL deficit shown in Fig. 9.
Our objectives were to evaluate interannual variability in coupling strength between soil moisture, surface fluxes, HLCL, and CAPE over central Europe (summers of 1991–2022) and to further investigate the coupling during the nine warmest summer seasons in the context of the prevailing temperature and humidity anomalies.
The results reveal that interannual variability occurs in different coupling relationships throughout the summer seasons from 1991 to 2022. This variability is particularly evident in indices associated with the hydrological cycle, such as the terrestrial coupling index (TCIη–LH), the correlation between surface sensible heat flux and surface latent heat flux (CORRSH–LH), and the atmospheric coupling index between LH and the lifted condensation level (ACILH–HLCL). These indices show a connection with temperature and moisture anomalies on the interannual scale, which is consistent with previous studies of Jach et al. (2022) and Guo and Dirmeyer (2013).
TCIη–LH shows interannual variability during the full period of summer seasons from 1991 to 2022, with the last decade exhibiting the largest spatial extent and highest coupling strengths (Fig. 2a). This indicates that variations in soil moisture (η) drive LH as there is not enough soil moisture available for evapotranspiration. The average CORRSH–LH stays mainly positive but becomes negative in the warm and dry summer seasons (Fig. 2b), suggesting a moisture-limited coupling regime. The interannual variability in ACILH–HLCL shows zero or even negative values during the warm and dry summer seasons (Fig. 2c), namely in the last decade. This indicates less moistening of the planetary boundary layer (PBL) due to insufficient evaporation from the land surface and thus an increase in HLCL.
CAPE results from a complex interplay of atmospheric stratification, synoptic circulation, and moistening and heating by the land surface. In agreement with findings of Jach et al. (2022), southeastern and eastern Europe and the Baltic states were found to be regions marked by strong ACILH–CAPE coupling. However, when analyzing the interannual variability in ACILH–CAPE, a weak connection is observed between these coupling mechanisms and temperature and humidity conditions, suggesting that such variability might be driven by other atmospheric processes.
From the interannual variability in the different variables shown in Figs. 1 and 2, it can be concluded that warm and dry summer seasons are associated with a differing behavior of LA coupling strength across Europe. During summer seasons with enough moisture, despite higher temperatures, strong LA coupling is largely limited to southern Europe, as seen in the summer of 2021. This agrees with the results of Guo and Dirmeyer (2013), who showed that areas with a normally wet climate can experience a shift in coupling regimes under dry conditions. On a seasonal timescale, Lo et al. (2021) also found regime shifts due to an extreme flood in a semi-arid region. According to Rousi et al. (2022), the frequency of occurrence of heatwaves has been accelerating across Europe in the last 30–40 years, and the large-scale circulation pattern often features mid- and upper-troposphere blocking situations, leading to a split in the jet stream towards the Arctic and towards the Mediterranean. As the position of the jet stream has a decisive effect on European weather, it can also alter the near-surface flow conditions in western and central Europe (Laurila et al., 2021), while in other regions like the Mediterranean and eastern Europe, soil moisture preconditioning is more important as the impact of the jet stream becomes weaker (Prodhomme et al., 2022). Dirmeyer et al. (2021) showed the causal connection between the hot and dry conditions during the extreme summer of 2018. The spring of 2018 showed a warm temperature anomaly and slightly drier soil moisture conditions over Germany (Xoplaki et al., 2025), turning into a severe drought due to strong soil moisture depletion during summer (Rousi et al., 2023). Dirmeyer et al. (2021) also showed that the drought conditions further intensified the 2018 heatwave. The reason for this is that when the volumetric soil moisture content fell below a critical value, surface fluxes and temperatures became highly sensitive to the further declining soil moisture. Evidence of this concept of drought-induced warming through evaporative controls was also found by Koster et al. (2009).
The coupling signals remain stable throughout the evaluated summer seasons over northern Europe and the Mediterranean region (Seneviratne et al., 2006; Knist et al., 2017; Jach et al., 2020, 2022). It is worth noting that the correlation between SH and LH is mainly positive over the British Isles, indicating that evapotranspiration is limited by the incoming energy (Knist et al., 2017). This is also the case over France, Benelux, and Germany for summer 2021, where a positive soil moisture anomaly is present during the preceding spring. Over central and eastern Europe, changes in the coupling regimes occur between the individual summers, as indicated by switches in the sign of different indices. This area coincides with the transition zones observed in the studies of Knist et al. (2017) and Jach et al. (2022).
The available net radiation is partitioned between LH and SH according to the energy required for evapotranspiration. LH and SH are correlated as long as evapotranspiration is not limited by the available soil moisture. Our study revealed that LH is often water-limited (reddish colors in Fig. 6), which is associated with an anticorrelation of LH and SH. As enough incoming solar energy is present, this further enhances SH and thus could further intensify drought periods (positive coupling). Together with the positive TCIη–LH, the anticorrelation of SH–LH points to a strong limitation of evapotranspiration by insufficient root zone soil moisture (Fig. 5).
Moisture limitation of the LH in the warm and dry summers leads to a shift in the energy flux partitioning towards reduced PBL moistening and amplified PBL heating because of increased SH. This shift causes a drying throughout the PBL, which is shown by an increased HLCL (Fig. S5) and an intensified negative LCL deficit (Fig. 9). Thus, the warm and dry conditions at the land surface propagate through the atmosphere, leading to less favorable conditions for local convection.
During warm and humid or moderate summer seasons, the local LA system is characterized by sufficient moisture, which leads to a decoupling in several links along the local coupling (LoCo; Santanello et al., 2018) chain. Specifically, the terrestrial coupling index TCIη–LH is negative, indicating that variations in η do not drive LH. Additionally, LH and SH co-vary, suggesting that evapotranspiration is not limited by soil moisture availability. Furthermore, the atmospheric coupling index between LH and HLCL (ACILH–HLCL) is positive, indicating that LH variations drive the evolution of HLCL. However, during these humid or moderate summers, the LCL deficit becomes positive, which can lead to the development of locally triggered deep convection.
As an example, in the warm and humid summer of 2021, a strong SW–NE temperature anomaly gradient associated with a strong 500 hPa geopotential anomaly gradient around 55° N was evident. This led to a stronger westerly airflow which allowed for more humid air masses from the Atlantic. A major event during this summer was the flood event in mid-July, which affected large areas of western and central Europe and led to extreme precipitation of more than 150 mm d−1 (Ludwig et al., 2023; Mohr et al., 2023). This heavy-precipitation event, which was also captured by ERA5 (Fig. 4i), was caused by a slow-moving, small-scale, low-pressure system over France and Benelux and led to a longer-lasting positive soil moisture anomaly from mid-July onwards. The anomaly is directly reflected in negative TCIη–LH values and a strong positive CORRSH–LH as enough surface moisture was available for evaporation. The pattern of CORRSH–LH and the pattern of ACILH–HLCL largely resemble each other, which is also observed in the cold and wet summer seasons (not shown). The LCL deficit shown in Fig. 9 is mainly positive over central and southern Europe, which is associated with a negative precipitation anomaly over the respective areas. On the other hand, the negative LCL deficit over the British Isles is directly connected with a positive precipitation anomaly (especially during the summers of 2019 and 2020), indicating that LA feedback processes were driven by low-pressure systems.
This study provides an assessment of interannual variability in four coupling relationships during the summer seasons between 1991 and 2022 for central Europe. The relationships under investigation are soil moisture–LH coupling at the terrestrial leg of the local coupling chain, the correlation LH–SH, and the coupling LH–CAPE and LH–HLCL. The latter two relationships comprise the atmospheric leg of the coupling chain. The analysis of the LA coupling strength was performed by means of different coupling indices like TCI and ACI (Dirmeyer, 2011; Santanello et al., 2018) as well as CORRSH–LH (Knist et al., 2017) by applying the coupling metrics framework provided by Tawfik (2015). Firstly, the interannual variability in these relationships was examined across all summers of the period considering the prevailing temperature and moisture anomalies. The second part of the analyses focused on the coupling during the nine warmest summers of the period to address the context of a warming climate and a projected increase in hot and dry periods until 2100 (Huebener et al., 2017). All indices were calculated from ERA5 data using daytime values from between 06:00 and 18:00 UTC each day (Yin et al., 2023). To enhance our analysis, anomalies of the 500 hPa geopotential, volumetric root zone soil moisture, and precipitation anomalies derived from ERA5 and E-OBS (Cornes et al., 2018) were considered for the interpretation of the results. Reanalyses can be used as a reference for further analysis and evaluation of climate simulations. However, these investigations require high-frequency and high-spatial-resolution model output from numerical weather prediction (NWP) models (Findell et al., 2024), which still is a challenging task.
Soil moisture availability during the summer seasons of 1991 to 2022 shows a decreasing trend, while average 2 m temperatures show an increase of about 0.5 °C since 2015. At the same time, the dew point depression anomalies show strong positive signals during the very warm and dry summer seasons of 2003, 2015, 2018, 2019, and 2022. These summer seasons are characterized by positive 500hPa geopotential anomalies throughout Europe, which are linked to considerable positive 2 m temperature anomalies, strong soil moisture decline, and larger dew point depressions. The warm and dry conditions led to an intensification or even the onset of statistically measurable coupling in the various processes along the LoCo process chain. In central Europe, they caused a shift from energy limitation to moisture limitation for evapotranspiration. This ultimately contributes to a drier PBL, potentially leading to a suppression of deep convection. In wet years, LH is not soil-moisture-limited; i.e., HLCL is primarily controlled not by the lack of moisture at the surface but by the available energy from radiation.
The interannual variability in CORRSH–LH as well as in TCIη–LH also reflected the exceptionally warm and dry summer seasons. Therefore, it was decided to further investigate the summer seasons exceeding a median temperature anomaly of +0.5 °C based on the ERA5 summer mean value of 1991–2020 (WMO, 2017).
The increasing frequency of warm and dry summers from 2015 onwards hints towards a trend of extended periods of reduced soil moisture available for evapotranspiration and the likelihood of locally triggered convection. This leads to a growing influence of soil moisture variability on the meteorological conditions which was not as pronounced before 2003 due to cooler and moister conditions. Markonis et al. (2021) found a considerable increase in drought events over central Europe since 2010, which they related to increasing temperature and a lack of rainfall together causing soil moisture depletion due to excessive evapotranspiration.
The switches in the sign of the coupling indices imply that, on a seasonal timescale, local soil moisture and temperature anomalies can cause an exceedance of thresholds along the LoCo process chain. This has the potential to change the role of the land surface as the driver of the local LA system on an interannual timescale and thus needs to be considered in sub-seasonal to seasonal (S2S) forecasts, which are used, for example, in risk assessment of natural hazards.
The code used in this study to calculate the coupling indices can be obtained from https://github.com/abtawfik/coupling-metrics/tree/master/terrestrial_coupling_index (Tawfik, 2015). The NCL software package can be downloaded from https://doi.org/10.5065/D6WD3XH5 (Brown et al., 2012).
E-OBS data were downloaded from https://surfobs.climate.copernicus.eu/dataaccess/access_eobs.php#datafiles (Cornes et al., 2018), and the ERA5 data are available at https://doi.org/10.24381/cds.adbb2d47 (Hersbach et al., 2023).
The supplement related to this article is available online at https://doi.org/10.5194/nhess-25-1405-2025-supplement.
TS, LJ, VW, and KWS conceived the idea for the LA feedback study presented here. TS processed the data and graphics and performed the analyses together with LJ and KWS. The paper was written by TS with support of all co-authors.
The contact author has declared that none of the authors has any competing interests.
Neither the European Commission nor ECMWF is responsible for any use that may be made of the Copernicus information or data it contains.
Publisher's note: Copernicus Publications remains neutral with regard to jurisdictional claims made in the text, published maps, institutional affiliations, or any other geographical representation in this paper. While Copernicus Publications makes every effort to include appropriate place names, the final responsibility lies with the authors. Regarding the maps used in this paper, please note that Figs. 3–10 contain disputed territories.
This article is part of the special issue “Past and future European atmospheric extreme events under climate change”. It is not associated with a conference.
At the time of writing the manuscript, Lisa Jach was funded by the German Ministry of Education and Research (BMBF) project ClimXtreme (subproject LAFEP, grant number 01LP1902D). Copernicus Climate Change Service data were downloaded from the Copernicus Climate Change Service (C3S) Climate Data Store (https://doi.org/10.24381/cds.adbb2d47, Hersbach et al., 2023). The results contain modified Copernicus Climate Change Service information from 2020. We thank the four anonymous reviewers for their valuable comments to further improve the quality of the manuscript.
This research has been supported by the Bundesministerium für Bildung und Forschung (grant no. 01LP1902D). Publishing fees were supported by the Funding Programme Open Access Publishing of the University of Hohenheim.
This paper was edited by Uwe Ulbrich and Jens Grieger and reviewed by four anonymous referees.
Albergel, C., de Rosnay, P., Balsamo, G., Isaksen, L., and Muñoz-Sabater, J.: Soil Moisture Analyses at ECMWF: Evaluation Using Global Ground-Based In Situ Observations, J. Hydrometeorol., 13, 1442–1460, https://doi.org/10.1175/JHM-D-11-0107.1, 2012.
Balsamo, G., Beljaars, A., Scipal, K., Viterbo, P., van den Hurk, B., Hirschi, M., and Betts, A. K.: A Revised Hydrology for the ECMWF Model: Verification from Field Site to Terrestrial Water Storage and Impact in the Integrated Forecast System, J. Hydrometeorol., 10, 623–643, https://doi.org/10.1175/2008JHM1068.1, 2009.
Barriopedro, D., García-Herrera, R., Ordóñez, C., Miralles, D. G., and Salcedo-Sanz, S.: Heat Waves: Physical Understanding and Scientific Challenges, Rev. Geophys., 61, e2022RG000780, https://doi.org/10.1029/2022RG000780, 2023.
Beck, H. E., Pan, M., Miralles, D. G., Reichle, R. H., Dorigo, W. A., Hahn, S., Sheffield, J., Karthikeyan, L., Balsamo, G., Parinussa, R. M., van Dijk, A. I. J. M., Du, J., Kimball, J. S., Vergopolan, N., and Wood, E. F.: Evaluation of 18 satellite- and model-based soil moisture products using in situ measurements from 826 sensors, Hydrol. Earth Syst. Sci., 25, 17–40, https://doi.org/10.5194/hess-25-17-2021, 2021.
Becker, F. N., Fink, A. H., Bissolli, P., and Pinto, J. G.: Towards a more comprehensive assessment of the intensity of historical European heat waves (1979–2019), Atmos. Sci. Lett., 23, e1120, https://doi.org/10.1002/ASL.1120, 2022.
Boeing, F., Rakovec, O., Kumar, R., Samaniego, L., Schrön, M., Hildebrandt, A., Rebmann, C., Thober, S., Müller, S., Zacharias, S., Bogena, H., Schneider, K., Kiese, R., Attinger, S., and Marx, A.: High-resolution drought simulations and comparison to soil moisture observations in Germany, Hydrol. Earth Syst. Sci., 26, 5137–5161, https://doi.org/10.5194/hess-26-5137-2022, 2022.
Bollmeyer, C., Keller, J. D., Ohlwein, C., Wahl, S., Crewell, S., Friederichs, P., Hense, A., Keune, J., Kneifel, S., Pscheidt, I., Redl, S., and Steinke, S.: Towards a high-resolution regional reanalysis for the European CORDEX domain, Q. J. Roy. Meteor. Soc., 141, 1–15, https://doi.org/10.1002/qj.2486, 2015.
Bolton, D.: The Computation of Equivalent Potential Temperature, Mon. Weather Rev., 108, 1046–1053, https://doi.org/10.1175/1520-0493(1980)108<1046:TCOEPT>2.0.CO;2, 1980.
Brown, D., Brownrigg, R., Haley, M., and Huang, W.: NCAR Command Language (NCL), UCAR/NCAR – Computational and Information Systems Laboratory (CISL) [code], https://doi.org/10.5065/D6WD3XH5, 2012.
C3S: European State of the Climate 2018, Copernicus Climate Change Service, https://climate.copernicus.eu/ESOTC/2018 (last access: 11 April 2025), 2018.
C3S: European State of the Climate 2021 summary, Copernicus Climate Change Service, https://doi.org/10.21957/9d7g-hn83, 2022.
Caldas-Alvarez, A., Augenstein, M., Ayzel, G., Barfus, K., Cherian, R., Dillenardt, L., Fauer, F., Feldmann, H., Heistermann, M., Karwat, A., Kaspar, F., Kreibich, H., Lucio-Eceiza, E. E., Meredith, E. P., Mohr, S., Niermann, D., Pfahl, S., Ruff, F., Rust, H. W., Schoppa, L., Schwitalla, T., Steidl, S., Thieken, A. H., Tradowsky, J. S., Wulfmeyer, V., and Quaas, J.: Meteorological, impact and climate perspectives of the 29 June 2017 heavy precipitation event in the Berlin metropolitan area, Nat. Hazards Earth Syst. Sci., 22, 3701–3724, https://doi.org/10.5194/nhess-22-3701-2022, 2022.
Cornes, R. C., van der Schrier, G., van den Besselaar, E. J. M., and Jones, P. D.: An Ensemble Version of the E-OBS Temperature and Precipitation Data Sets, J. Geophys. Res.-Atmos., 123, 9391–9409, https://doi.org/10.1029/2017JD028200, 2018 (data available at: https://surfobs.climate.copernicus.eu/dataaccess/access_eobs.php#datafiles, last access: 9 April 2025).
Dee, D. P., Uppala, S. M., Simmons, A. J., Berrisford, P., Poli, P., Kobayashi, S., Andrae, U., Balmaseda, M. A., Balsamo, G., Bauer, P., Bechtold, P., Beljaars, A. C. M., van de Berg, L., Bidlot, J., Bormann, N., Delsol, C., Dragani, R., Fuentes, M., Geer, A. J., Haimberger, L., Healy, S. B., Hersbach, H., Hólm, E. V., Isaksen, L., Kållberg, P., Köhler, M., Matricardi, M., McNally, A. P., Monge-Sanz, B. M., Morcrette, J.-J., Park, B.-K., Peubey, C., Rosnay, P. de, Tavolato, C., Thépaut, J.-N., and Vitart, F.: The ERA-Interim reanalysis: configuration and performance of the data assimilation system, Q. J. Roy. Meteor. Soc., 137, 553–597, https://doi.org/10.1002/qj.828, 2011.
Denissen, J. M. C., Teuling, A. J., Pitman, A. J., Koirala, S., Migliavacca, M., Li, W., Reichstein, M., Winkler, A. J., Zhan, C., and Orth, R.: Widespread shift from ecosystem energy to water limitation with climate change, Nat. Clim. Chang., 12, 677–684, https://doi.org/10.1038/s41558-022-01403-8, 2022.
Dirmeyer, P. A.: The terrestrial segment of soil moisture-climate coupling, Geophys. Res. Lett., 38, L16702, https://doi.org/10.1029/2011GL048268, 2011.
Dirmeyer, P. A., Wang, Z., Mbuh, M. J., and Norton, H. E.: Intensified land surface control on boundary layer growth in a changing climate, Geophys. Res. Lett., 41, 1290–1294, https://doi.org/10.1002/2013GL058826, 2014.
Dirmeyer, P. A., Balsamo, G., Blyth, E. M., Morrison, R., and Cooper, H. M.: Land-Atmosphere Interactions Exacerbated the Drought and Heatwave Over Northern Europe During Summer 2018, AGU Advances, 2, e2020AV000283, https://doi.org/10.1029/2020AV000283, 2021.
Dorigo, W., Himmelbauer, I., Aberer, D., Schremmer, L., Petrakovic, I., Zappa, L., Preimesberger, W., Xaver, A., Annor, F., Ardö, J., Baldocchi, D., Bitelli, M., Blöschl, G., Bogena, H., Brocca, L., Calvet, J.-C., Camarero, J. J., Capello, G., Choi, M., Cosh, M. C., van de Giesen, N., Hajdu, I., Ikonen, J., Jensen, K. H., Kanniah, K. D., de Kat, I., Kirchengast, G., Kumar Rai, P., Kyrouac, J., Larson, K., Liu, S., Loew, A., Moghaddam, M., Martínez Fernández, J., Mattar Bader, C., Morbidelli, R., Musial, J. P., Osenga, E., Palecki, M. A., Pellarin, T., Petropoulos, G. P., Pfeil, I., Powers, J., Robock, A., Rüdiger, C., Rummel, U., Strobel, M., Su, Z., Sullivan, R., Tagesson, T., Varlagin, A., Vreugdenhil, M., Walker, J., Wen, J., Wenger, F., Wigneron, J. P., Woods, M., Yang, K., Zeng, Y., Zhang, X., Zreda, M., Dietrich, S., Gruber, A., van Oevelen, P., Wagner, W., Scipal, K., Drusch, M., and Sabia, R.: The International Soil Moisture Network: serving Earth system science for over a decade, Hydrol. Earth Syst. Sci., 25, 5749–5804, https://doi.org/10.5194/hess-25-5749-2021, 2021.
Duan, S. Q., Findell, K. L., and Wright, J. S.: Three Regimes of Temperature Distribution Change Over Dry Land, Moist Land, and Oceanic Surfaces, Geophys. Res. Lett., 47, e2020GL090997, https://doi.org/10.1029/2020GL090997, 2020.
Findell, K. L. and Eltahir, E. A. B.: Atmospheric Controls on Soil Moisture–Boundary Layer Interactions. Part I: Framework Development, J. Hydrometeorol., 4, 552–569, https://doi.org/10.1175/1525-7541(2003)004<0552:ACOSML>2.0.CO;2, 2003.
Findell, K. L., Yin, Z., Seo, E., Dirmeyer, P. A., Arnold, N. P., Chaney, N., Fowler, M. D., Huang, M., Lawrence, D. M., Ma, P.-L., and Santanello Jr., J. A.: Accurate assessment of land–atmosphere coupling in climate models requires high-frequency data output, Geosci. Model Dev., 17, 1869–1883, https://doi.org/10.5194/gmd-17-1869-2024, 2024.
García-Herrera, R., Díaz, J., Trigo, R. M., Luterbacher, J., and Fischer, E. M.: A Review of the European Summer Heat Wave of 2003, Crit. Rev. Env. Sci. Tec., 40, 267–306, https://doi.org/10.1080/10643380802238137, 2010.
García-Monteiro, S., Sobrino, J. A., Julien, Y., Sòria, G., and Skokovic, D.: Surface Temperature trends in the Mediterranean Sea from MODIS data during years 2003–2019, Regional Studies in Marine Science, 49, 102086, https://doi.org/10.1016/j.rsma.2021.102086, 2022.
Georgakakos, K. P. and Bras, R. L.: A hydrologically useful station precipitation model: 1. Formulation, Water Resour. Res., 20, 1585–1596, https://doi.org/10.1029/WR020i011p01585, 1984.
Guo, Z. and Dirmeyer, P. A.: Interannual Variability of Land–Atmosphere Coupling Strength, J. Hydrometeorol., 14, 1636–1646, https://doi.org/10.1175/JHM-D-12-0171.1, 2013.
Guo, Z., Dirmeyer, P. A., Koster, R. D., Sud, Y. C., Bonan, G., Oleson, K. W., Chan, E., Verseghy, D., Cox, P., Gordon, C. T., McGregor, J. L., Kanae, S., Kowalczyk, E., Lawrence, D., Liu, P., Mocko, D., Lu, C.-H., Mitchell, K., Malyshev, S., McAvaney, B., Oki, T., Yamada, T., Pitman, A., Taylor, C. M., Vasic, R., and Xue, Y.: GLACE: The Global Land–Atmosphere Coupling Experiment. Part II: Analysis, J. Hydrometeorol., 7, 611–625, https://doi.org/10.1175/JHM511.1, 2006.
Hersbach, H., Bell, B., Berrisford, P., Hirahara, S., Horányi, A., Muñoz‐Sabater, J., Nicolas, J., Peubey, C., Radu, R., Schepers, D., Simmons, A., Soci, C., Abdalla, S., Abellan, X., Balsamo, G., Bechtold, P., Biavati, 710 G., Bidlot, J., Bonavita, M., Chiara, G., Dahlgren, P., Dee, D., Diamantakis, M., Dragani, R., Flemming, J., Forbes, R., Fuentes, M., Geer, A., Haimberger, L., Healy, S., Hogan, R. J., Hólm, E., Janisková, M., Keeley, S., Laloyaux, P., Lopez, P., Lupu, C., Radnoti, G., Rosnay, P., Rozum, I., Vamborg, F., Villaume, S., and Thépaut, J.-N.: The ERA5 global reanalysis, Q. J. Roy. Meteor. Soc., 146, 1999–2049, https://doi.org/10.1002/qj.3803, 2020.
Hersbach, H., Bell, B., Berrisford, P., Biavati, G., Horányi, A., Muñoz Sabater, J., Nicolas, J., Peubey, C., Radu, R., Rozum, I., Schepers, D., Simmons, A., Soci, C., Dee, D., and Thépaut, J.-N.: ERA5 hourly data on single levels from 1940 to present, Copernicus Climate Change Service (C3S) Climate Data Store (CDS) [data set], https://doi.org/10.24381/cds.adbb2d47, 2023.
Huebener, H., Hoffmann, P., Keuler, K., Pfeifer, S., Ramthun, H., Spekat, A., Steger, C., and Warrach-Sagi, K.: Deriving user-informed climate information from climate model ensemble results, Adv. Sci. Res., 14, 261–269, https://doi.org/10.5194/asr-14-261-2017, 2017.
Jach, L., Warrach-Sagi, K., Ingwersen, J., Kaas, E., and Wulfmeyer, V.: Land Cover Impacts on Land-Atmosphere Coupling Strength in Climate Simulations With WRF Over Europe, J. Geophys. Res.-Atmos., 125, e2019JD03198, https://doi.org/10.1029/2019JD031989, 2020.
Jach, L., Schwitalla, T., Branch, O., Warrach-Sagi, K., and Wulfmeyer, V.: Sensitivity of land–atmosphere coupling strength to changing atmospheric temperature and moisture over Europe, Earth Syst. Dynam., 13, 109–132, https://doi.org/10.5194/esd-13-109-2022, 2022.
Knist, S., Goergen, K., Buonomo, E., Christensen, O. B., Colette, A., Cardoso, R. M., Fealy, R., Fernández, J., García-Díez, M., Jacob, D., Kartsios, S., Katragkou, E., Keuler, K., Mayer, S., van Meijgaard, E., Nikulin, G., Soares, P. M. M., Sobolowski, S., Szepszo, G., Teichmann, C., Vautard, R., Warrach-Sagi, K., Wulfmeyer, V., and Simmer, C.: Land-atmosphere coupling in EURO-CORDEX evaluation experiments, J. Geophys. Res.-Atmos., 122, 79–103, https://doi.org/10.1002/2016JD025476, 2017.
Kornhuber, K., Petoukhov, V., Petri, S., Rahmstorf, S., and Coumou, D.: Evidence for wave resonance as a key mechanism for generating high-amplitude quasi-stationary waves in boreal summer, Clim. Dynam., 49, 1961–1979, https://doi.org/10.1007/s00382-016-3399-6, 2017.
Koster, R. D., Dirmeyer, P. A., Guo, Z., Bonan, G., Chan, E., Cox, P., Gordon, C. T., Kanae, S., Kowalczyk, E., Lawrence, D., Liu, P., Lu, C.-H., Malyshev, S., McAvaney, B., Mitchell, K., Mocko, D., Oki, T., Oleson, K., Pitman, A., Sud, Y. C., Taylor, C. M., Verseghy, D., Vasic, R., Xue, Y., and Yamada, T.: Regions of strong coupling between soil moisture and precipitation, Science, 305, 1138–1140, https://doi.org/10.1126/science.1100217, 2004.
Koster, R. D., Schubert, S. D., and Suarez, M. J.: Analyzing the Concurrence of Meteorological Droughts and Warm Periods, with Implications for the Determination of Evaporative Regime, J. Climate, 22, 3331–3341, https://doi.org/10.1175/2008JCLI2718.1, 2009.
Laurila, T. K., Sinclair, V. A., and Gregow, H.: Climatology, variability, and trends in near-surface wind speeds over the North Atlantic and Europe during 1979–2018 based on ERA5, Int. J. Climatol., 41, 2253–2278, https://doi.org/10.1002/joc.6957, 2021.
Lavers, D. A., Simmons, A., Vamborg, F., and Rodwell, M. J.: An evaluation of ERA5 precipitation for climate monitoring, Q. J. Roy. Meteor. Soc., 148, 3152–3165, https://doi.org/10.1002/qj.4351, 2022.
Lo, M.-H., Wu, W.-Y., Tang, L. I., Ryu, D., Rashid, M., and Wu, R.-J.: Temporal Changes in Land Surface Coupling Strength: An Example in a Semi-Arid Region of Australia, J. Climate, 34, 1503–1513, https://doi.org/10.1175/JCLI-D-20-0250.1, 2021.
Ludwig, P., Ehmele, F., Franca, M. J., Mohr, S., Caldas-Alvarez, A., Daniell, J. E., Ehret, U., Feldmann, H., Hundhausen, M., Knippertz, P., Küpfer, K., Kunz, M., Mühr, B., Pinto, J. G., Quinting, J., Schäfer, A. M., Seidel, F., and Wisotzky, C.: A multi-disciplinary analysis of the exceptional flood event of July 2021 in central Europe – Part 2: Historical context and relation to climate change, Nat. Hazards Earth Syst. Sci., 23, 1287–1311, https://doi.org/10.5194/nhess-23-1287-2023, 2023.
Markonis, Y., Kumar, R., Hanel, M., Rakovec, O., Máca, P., and AghaKouchak, A.: The rise of compound warm-season droughts in Europe, Science Advances, 7, eabb9668, https://doi.org/10.1126/sciadv.abb9668, 2021.
Martens, B., Schumacher, D. L., Wouters, H., Muñoz-Sabater, J., Verhoest, N. E. C., and Miralles, D. G.: Evaluating the land-surface energy partitioning in ERA5, Geosci. Model Dev., 13, 4159–4181, https://doi.org/10.5194/gmd-13-4159-2020, 2020.
Miralles, D. G., Holmes, T. R. H., De Jeu, R. A. M., Gash, J. H., Meesters, A. G. C. A., and Dolman, A. J.: Global land-surface evaporation estimated from satellite-based observations, Hydrol. Earth Syst. Sci., 15, 453–469, https://doi.org/10.5194/hess-15-453-2011, 2011.
Miralles, D. G., Teuling, A. J., van Heerwaarden, C. C., and Vilà-Guerau de Arellano, J.: Mega-heatwave temperatures due to combined soil desiccation and atmospheric heat accumulation, Nat. Geosci., 7, 345–349, https://doi.org/10.1038/ngeo2141, 2014.
Miralles, D. G., Gentine, P., Seneviratne, S. I., and Teuling, A. J.: Land-atmospheric feedbacks during droughts and heatwaves: state of the science and current challenges, Ann. N. Y. Acad. Sci., 1436, 19–35, https://doi.org/10.1111/nyas.13912, 2019.
Mohr, S., Ehret, U., Kunz, M., Ludwig, P., Caldas-Alvarez, A., Daniell, J. E., Ehmele, F., Feldmann, H., Franca, M. J., Gattke, C., Hundhausen, M., Knippertz, P., Küpfer, K., Mühr, B., Pinto, J. G., Quinting, J., Schäfer, A. M., Scheibel, M., Seidel, F., and Wisotzky, C.: A multi-disciplinary analysis of the exceptional flood event of July 2021 in central Europe – Part 1: Event description and analysis, Nat. Hazards Earth Syst. Sci., 23, 525–551, https://doi.org/10.5194/nhess-23-525-2023, 2023.
Müller, O. V., Vidale, P. L., Vannière, B., Schiemann, R., Senan, R., Haarsma, R. J., and Jungclaus, J. H.: Land–Atmosphere Coupling Sensitivity to GCMs Resolution: A Multimodel Assessment of Local and Remote Processes in the Sahel Hot Spot, J. Climate, 34, 967–985, https://doi.org/10.1175/JCLI-D-20-0303.1, 2021.
Muñoz-Sabater, J., Dutra, E., Agustí-Panareda, A., Albergel, C., Arduini, G., Balsamo, G., Boussetta, S., Choulga, M., Harrigan, S., Hersbach, H., Martens, B., Miralles, D. G., Piles, M., Rodríguez-Fernández, N. J., Zsoter, E., Buontempo, C., and Thépaut, J.-N.: ERA5-Land: a state-of-the-art global reanalysis dataset for land applications, Earth Syst. Sci. Data, 13, 4349–4383, https://doi.org/10.5194/essd-13-4349-2021, 2021.
Orth, R., O, S., Zscheischler, J., Mahecha, M. D., and Reichstein, M.: Contrasting biophysical and societal impacts of hydro-meteorological extremes, Environ. Res. Lett., 17, 14044, https://doi.org/10.1088/1748-9326/ac4139, 2022.
Ossó, A., Allan, R. P., Hawkins, E., Shaffrey, L., and Maraun, D.: Emerging new climate extremes over Europe, Clim. Dynam., 58, 487–501, https://doi.org/10.1007/s00382-021-05917-3, 2022.
Prodhomme, C., Materia, S., Ardilouze, C., White, R. H., Batté, L., Guemas, V., Fragkoulidis, G., and García-Serrano, J.: Seasonal prediction of European summer heatwaves, Clim. Dynam., 58, 2149–2166, https://doi.org/10.1007/s00382-021-05828-3, 2022.
Qi, Y., Chen, H., and Zhu, S.: Influence of Land–Atmosphere Coupling on Low Temperature Extremes Over Southern Eurasia, J. Geophys. Res.-Atmos., 128, e2022JD037252, https://doi.org/10.1029/2022JD037252, 2023.
Rakovec, O., Samaniego, L., Hari, V., Markonis, Y., Moravec, V., Thober, S., Hanel, M., and Kumar, R.: The 2018–2020 Multi‐Year Drought Sets a New Benchmark in Europe, Earths Future, 10, e2021EF002394, https://doi.org/10.1029/2021EF002394, 2022.
Rousi, E., Kornhuber, K., Beobide-Arsuaga, G., Luo, F., and Coumou, D.: Accelerated western European heatwave trends linked to more-persistent double jets over Eurasia, Nat. Commun., 13, 3851, https://doi.org/10.1038/s41467-022-31432-y, 2022.
Rousi, E., Fink, A. H., Andersen, L. S., Becker, F. N., Beobide-Arsuaga, G., Breil, M., Cozzi, G., Heinke, J., Jach, L., Niermann, D., Petrovic, D., Richling, A., Riebold, J., Steidl, S., Suarez-Gutierrez, L., Tradowsky, J. S., Coumou, D., Düsterhus, A., Ellsäßer, F., Fragkoulidis, G., Gliksman, D., Handorf, D., Haustein, K., Kornhuber, K., Kunstmann, H., Pinto, J. G., Warrach-Sagi, K., and Xoplaki, E.: The extremely hot and dry 2018 summer in central and northern Europe from a multi-faceted weather and climate perspective, Nat. Hazards Earth Syst. Sci., 23, 1699–1718, https://doi.org/10.5194/nhess-23-1699-2023, 2023.
Santanello, J. A., Peters-Lidard, C. D., and Kumar, S. V.: Diagnosing the Sensitivity of Local Land–Atmosphere Coupling via the Soil Moisture–Boundary Layer Interaction, J. Hydrometeorol., 12, 766–786, https://doi.org/10.1175/JHM-D-10-05014.1, 2011.
Santanello, J. A., Dirmeyer, P. A., Ferguson, C. R., Findell, K. L., Tawfik, A. B., Berg, A., Ek, M., Gentine, P., Guillod, B. P., van Heerwaarden, C., Roundy, J., and Wulfmeyer, V.: Land–Atmosphere Interactions: The LoCo Perspective, B. Am. Meteorol. Soc., 99, 1253–1272, https://doi.org/10.1175/BAMS-D-17-0001.1, 2018.
Schneider, D. P., Deser, C., Fasullo, J., and Trenberth, K. E.: Climate Data Guide Spurs Discovery and Understanding, EoS Transactions, 94, 121–122, https://doi.org/10.1002/2013eo130001, 2013.
Schumacher, D. L., Keune, J., Dirmeyer, P., and Miralles, D. G.: Drought self-propagation in drylands due to land-atmosphere feedbacks, Nat. Geosci., 15, 262–268, https://doi.org/10.1038/s41561-022-00912-7, 2022.
Seneviratne, S. I., Lüthi, D., Litschi, M., and Schär, C.: Land-atmosphere coupling and climate change in Europe, Nature, 443, 205–209, https://doi.org/10.1038/nature05095, 2006.
Seneviratne, S. I., Corti, T., Davin, E. L., Hirschi, M., Jaeger, E. B., Lehner, I., Orlowsky, B., and Teuling, A. J.: Investigating soil moisture–climate interactions in a changing climate: A review, Earth-Sci. Rev., 99, 125–161, https://doi.org/10.1016/j.earscirev.2010.02.004, 2010.
Spensberger, C., Madonna, E., Boettcher, M., Grams, C. M., Papritz, L., Quinting, J. F., Röthlisberger, M., Sprenger, M., and Zschenderlein, P.: Dynamics of concurrent and sequential Central European and Scandinavian heatwaves, Q. J. Roy. Meteor. Soc., 146, 2998–3013, https://doi.org/10.1002/qj.3822, 2020.
Stephens, G., Polcher, J., Zeng, X., van Oevelen, P., Poveda, G., Bosilovich, M., Ahn, M.-H., Balsamo, G., Duan, Q., Hegerl, G., Jakob, C., Lamptey, B., Leung, R., Piles, M., Su, Z., Dirmeyer, P., Findell, K. L., Verhoef, A., Ek, M., L’Ecuyer, T., Roca, R., Nazemi, A., Dominguez, F., Klocke, D., and Bony, S.: The First 30 Years of GEWEX, B. Am. Meteorol. Soc., 104, E126–E157, https://doi.org/10.1175/BAMS-D-22-0061.1, 2023.
Sun, G., Hu, Z., Ma, Y., Xie, Z., Sun, F., Wang, J., and Yang, S.: Analysis of local land atmosphere coupling characteristics over Tibetan Plateau in the dry and rainy seasons using observational data and ERA5, Sci. Total Environ., 774, 145138, https://doi.org/10.1016/j.scitotenv.2021.145138, 2021.
Taszarek, M., Brooks, H. E., Czernecki, B., Szuster, P., and Fortuniak, K.: Climatological Aspects of Convective Parameters over Europe: A Comparison of ERA-Interim and Sounding Data, J. Climate, 31, 4281–4308, https://doi.org/10.1175/JCLI-D-17-0596.1, 2018.
Tawfik, A. B.: Terrestrial coupling indices, GitHub [code], https://github.com/abtawfik/coupling-metrics/tree/master/terrestrial_coupling_index (last access: 9 Apil 2025), 2015.
Toreti, A., Bavera, D., Acosta Navarro, J., Cammalleri, C., De Jager, A., Di Ciollo, C., Hrast Essenfelder, A., Maetens, W., Magni, D., Masante, D., Mazzeschi, M., Niemeyer, S., and Spinoni, J.: Drought in Europe August 2022, EUR 31192 EN, Publications Office of the European Union, Luxembourg, JRC130493, ISBN 978-92-76-55855-2, https://doi.org/10.2760/264241, 2022.
Ukkola, A. M., Pitman, A. J., Donat, M. G., de Kauwe, M. G., and Angélil, O.: Evaluating the Contribution of Land-Atmosphere Coupling to Heat Extremes in CMIP5 Models, Geophys. Res. Lett., 45, 9003–9012, https://doi.org/10.1029/2018GL079102, 2018.
van der Wiel, K., Batelaan, T. J., and Wanders, N.: Large increases of multi-year droughts in north-western Europe in a warmer climate, Clim. Dynam., 60, 1781–1800, https://doi.org/10.1007/s00382-022-06373-3, 2022.
van Heerwaarden, C. C. and Teuling, A. J.: Disentangling the response of forest and grassland energy exchange to heatwaves under idealized land–atmosphere coupling, Biogeosciences, 11, 6159–6171, https://doi.org/10.5194/bg-11-6159-2014, 2014.
Warrach‐Sagi, K., Ingwersen, J., Schwitalla, T., Troost, C., Aurbacher, J., Jach, L., Berger, T., Streck, T., and Wulfmeyer, V.: Noah‐MP With the Generic Crop Growth Model Gecros in the WRF Model: Effects of Dynamic Crop Growth on Land‐Atmosphere Interaction, J. Geophys. Res.-Atmos., 127, e2022JD036518, https://doi.org/10.1029/2022JD036518, 2022.
Wehrli, K., Guillod, B. P., Hauser, M., Leclair, M., and Seneviratne, S. I.: Identifying Key Driving Processes of Major Recent Heat Waves, J. Geophys. Res.-Atmos., 124, 11746–11765, https://doi.org/10.1029/2019JD030635, 2019.
Wei, J., Zhao, J., Chen, H., and Liang, X.-Z.: Coupling Between Land Surface Fluxes and Lifting Condensation Level: Mechanisms and Sensitivity to Model Physics Parameterizations, J. Geophys. Res.-Atmos., 126, e2020JD034313, https://doi.org/10.1029/2020JD034313, 2021.
WMO: WMO STATEMENT ON THE STATUS OF THE GLOBAL CLIMATE IN 2003, Tech. Rep. WMO-No. 966, World Meteorological Organization, ISBN 978-92-63-10966-8, 2004.
WMO: WMO Guidelines on the Calculation of Climate Normals: Tech. Rep. WMO-No. 1203, World Meteorological Organization, ISBN 978-92-63-11203-3, 2017.
WMO: Precipitation, relative humidity and soil moisture for July 2018, World Meteorological Organization, https://climate.copernicus.eu/precipitation-relative-humidity-and-soil-moisture-july-2018 (last access: 11 April 2025), 2018.
WMO: Europe has hottest summer on record: EU Copernicus, World Meteorological Organization, https://wmo.int/media/news/europe-has-hottest-summer-record-eu-copernicus-0 (last access: 11 April 2025), 2022a.
WMO: Precipitation, relative humidity and soil moisture for July 2022, World Meteorological Organization, https://climate.copernicus.eu/precipitation-relative-humidity-and-soil-moisture-july-2022 (last access: 11 April 2025), 2022b.
Xoplaki, E., Ellsäßer, F., Grieger, J., Nissen, K. M., Pinto, J. G., Augenstein, M., Chen, T.-C., Feldmann, H., Friederichs, P., Gliksman, D., Goulier, L., Haustein, K., Heinke, J., Jach, L., Knutzen, F., Kollet, S., Luterbacher, J., Luther, N., Mohr, S., Mudersbach, C., Müller, C., Rousi, E., Simon, F., Suarez-Gutierrez, L., Szemkus, S., Vallejo-Bernal, S. M., Vlachopoulos, O., and Wolf, F.: Compound events in Germany in 2018: drivers and case studies, Nat. Hazards Earth Syst. Sci., 25, 541–564, https://doi.org/10.5194/nhess-25-541-2025, 2025.
Yin, Z., Findell, K. L., Dirmeyer, P., Shevliakova, E., Malyshev, S., Ghannam, K., Raoult, N., and Tan, Z.: Daytime-only mean data enhance understanding of land–atmosphere coupling, Hydrol. Earth Syst. Sci., 27, 861–872, https://doi.org/10.5194/hess-27-861-2023, 2023.
Yuan, R., Li, F., and Ye, R.: Global diagnosis of land–atmosphere coupling based on water isotopes, Sci. Rep., 13, 21319, https://doi.org/10.1038/s41598-023-48694-1, 2023.