the Creative Commons Attribution 4.0 License.
the Creative Commons Attribution 4.0 License.
Validated probabilistic approach to estimate flood direct impacts on the population and assets on European coastlines
Enrico Duo
Marine Le Gal
Tomás Fernández-Montblanc
Paolo Ciavola
This work presents the approach used to estimate coastal flood impact, developed within the EU H2020 European Coastal Flood Awareness System (ECFAS) project, for assessing flood direct impacts on population, buildings, and roads along European coasts. The methodology integrates object-based and probabilistic evaluations to provide uncertainty estimates for damage assessment. The approach underwent a user-driven co-evaluation process. It was applied to 16 test cases across Europe and validated against reported impact data in three major reference cases: Xynthia in La Faute-sur-Mer (France) in 2010, Xaver in Norfolk (UK) in 2013, and Emma in Cádiz (Spain) in 2018. A comparison with grid-based damage evaluation methods was also conducted. The findings demonstrate that the ECFAS impact approach offers valuable estimates for affected populations, reliable damage assessments for buildings and roads, and improved accuracy compared to traditional grid-based approaches. The methodology also provides information for prevention and preparedness activities, and it facilitates further evaluations of risk scenarios and cost–benefit analysis of disaster risk reduction strategies. The approach is a tool suitable for large-scale coastal flood impact assessments, offering improved accuracy and operational capability for coastal flood forecasts. It represents a potential advancement of the existing European-scale impact method used by the European Flood Awareness System (EFAS) for riverine flood warnings. The integration of object-based and probabilistic evaluations, along with uncertainty estimation, enhances the understanding and management of flood impacts along European coasts.
- Article
(7306 KB) - Full-text XML
- BibTeX
- EndNote
The assessment of flood impacts is crucial for coastal management, providing insights into consequences of coastal extremes for risk management (e.g. Van Dongeren et al., 2018). Historical loss analysis and scenario-based variations support strategy evaluation (e.g. Sanuy et al., 2018) and participatory risk management (Barquet and Cumiskey, 2018), as required by the Floods Directive (2007/60/EC). Estimations of the impact of forecasted floods could support civil protection actions (Dottori et al., 2017). With climate change and increasing human pressure, flood impacts will likely intensify (Poljanšek et al., 2017; Vousdoukas et al., 2018b), and there is a need for accurate predictions at various spatial and temporal scales.
This study focuses on flood direct impacts, which result from physical contact between water and objects, causing immediate and local effects. Nevertheless, indirect impacts can also persist on the long term, affecting local, regional, and larger scales through chain-reaction mechanisms. While the assessment of indirect impacts is challenging due to their diverse nature and the complexity of processes across multiple sectors and scales (Meyer et al., 2013; Armaroli et al., 2019), there are numerous methods to assess direct impacts (Gerl et al., 2016). Because of the heterogeneity of these methods, ongoing investigations are looking into their limitations for appropriate applications (Molinari et al., 2020; Marvi, 2020; Aribisala et al., 2022).
Methods to calculate flood direct impacts primarily focus on population, buildings, and transport networks, which are the most significantly exposed elements (Thomas et al., 2019; Marvi, 2020; Koks et al., 2022). For the population, the impact assessment quantifies the affected individuals, and when data on the characteristics of the exposed population are available (e.g. age, socio-economic status, governance, accessibility), comprehensive risk-based estimates can be derived using social science approaches. Direct impacts on buildings and roads are often measured by the number of affected assets, damage, or financial loss.
Traditional large-scale direct impact assessments often rely on grid-based, meso-scale evaluations, which are known to overestimate impacts (Molinari et al., 2020). Correcting these evaluations introduces additional uncertainties due to approximations and assumptions. However, object-based evaluations using detailed vector data and vulnerability models offer more accurate damage assessments (Molinari et al., 2020; Aribisala et al., 2022). While typically used for local scale assessments, a few studies (e.g. Van Ginkel et al., 2021) provide valuable insights for novel large-scale applications.
The European Flood Awareness System (EFAS; https://www.efas.eu/en, last access: 17 November 2023) represents the current European-scale operational application for riverine flood impact assessment. EFAS uses deterministic meso-scale methods to assess impacts on population (affected people, exposure only); infrastructure (affected roads, exposure only); and urban, built-up, and agricultural areas (affected areas identified using land cover data). The method provides evaluations of direct economic losses (Dottori et al., 2017). While the approach has limitations related to dataset approximation and deterministic impact assessment methods, it has demonstrated that it can produce reliable results, considering the continental scale of the application. When evaluating impact assessment models, it is important to consider the scale of analysis, the magnitude, and the uncertainty of the estimations.
Uncertainty evaluation is crucial in impact assessments, influencing disaster prevention, management, and policymaking. Researchers are investigating various sources of uncertainty, with consensus on the main driving factors (Hinkel et al., 2021). Besides the inundation model's performance (hazard component), which determines asset flooding (Vousdoukas et al., 2018a), socio-economic components significantly contribute to uncertainties (de Moel and Aerts, 2011; Jongman et al., 2012; Figueiredo and Martina, 2016; Nguyen et al., 2016), particularly related to exposure and vulnerability. These effects become more pronounced in the analysis of future scenarios.
Two types of uncertainty affect modelled flood impacts: aleatory and epistemic (Merz and Thieken, 2009; Wagenaar et al., 2016). Aleatory uncertainty arises from choices made in representing variables and processes in the model, such as using a single vulnerability model for all residential buildings without accounting for variability within the category (e.g. detached or semi-detached). It dominates for small flood events or local domains due to the limited sample size of affected assets. Epistemic uncertainty stems from incomplete understanding of the system, and it is the prevalent uncertainty for the analysis of the effects of large flood events or when applying impact methods on large domains.
Probabilistic modelling is used to address uncertainties in coastal flood impact assessment. These models incorporate evaluations of uncertainty, often expressed as percentile-based ranges, to account for specific sources of uncertainty. For instance, multi-model ensembles introduce uncertainty due to the variability of impact models (Figueiredo et al., 2018). Similarly, applications employing one model with multiple parameterisations or resampling of input data produce outcomes with the uncertainty linked to the variability of input data.
There is a growing interest in applying local object-based approaches to assess coastal flood impacts at large scales and incorporating uncertainty evaluation. This is now feasible due to improved computational capabilities and the availability of comprehensive datasets like the Copernicus Coastal Zones layer (https://land.copernicus.eu/local/coastal-zones, last access: 17 November 2023), which provides up-to-date Land Cover/Land Use (LC/LU) information for coastal areas. The layer was implemented by the European Environment Agency (EEA) in the framework on the thematic mapping of the Copernicus Land Monitoring Service (CLMS). Another valuable resource is the OpenStreetMap (OSM) dataset, which offers free object-based vector data.
This paper presents a coastal flood impact assessment approach for estimating direct impacts on population, buildings, and roads across Europe. The approach integrates methodologies that prioritise object-based and probabilistic evaluations to provide uncertainty estimates for damage assessment. Developed within the EU H2020 European Copernicus Coastal Flood Awareness System (ECFAS) project (grant agreement no. 101004211; https://www.ecfas.eu/, last access: 22 October 2024), the approach underwent a user-driven co-evaluation process (Velegrakis et al., 2022). Referred to as the ECFAS impact approach, it was applied to 16 test cases along different European coasts, and it was validated against reported impact data in three major reference cases. In this work, a comparison with a grid-based damage evaluation of buildings and roads was also conducted on all test cases.
The ECFAS impact approach was applied in the framework of the ECFAS project to generate impact layers using the flood maps of the ECFAS Pan-European Flood Catalogue (Le Gal et al., 2023). The flood maps were implemented running the LISFLOOD-FP model to cover over 95 % of the European coastline (Le Gal et al., 2024). The catalogue includes almost 8000 flood maps (i.e. flood extension, water depth, and velocities) built using 15 different scenarios of total water levels (considering the contribution of tides, storm surge, ocean circulation, steric sea level, wave set-up) and storm durations. The generated impact layers, implemented considering the extent of the different flooding scenarios (i.e. flood maps of the flood catalogue), were compiled into the ECFAS Pan-EU Impact Catalogue (Duo et al., 2022). Both catalogues were used to implement a proof of concept of a European coastal-flood early warning system, which provides warnings based on the affected population following the framework of the European Flood Awareness System for river flooding of the Copernicus Emergency Management Service.
The paper is organised as follows: a detailed description of the test cases, reference cases, and the data used to apply and validate the ECFAS impact approach (Sect. 2); a detailed description of the approach to evaluate direct impacts on population and assets (Sect. 3); an overview of the impacts for the reference cases and test cases (Sect. 4); a comprehensive discussion on the validation with reported impacts, including a comparison with grid-based damage evaluations and the limitations of the approach (Sect. 5); and conclusions (Sect. 6).
2.1 Test cases and reference cases
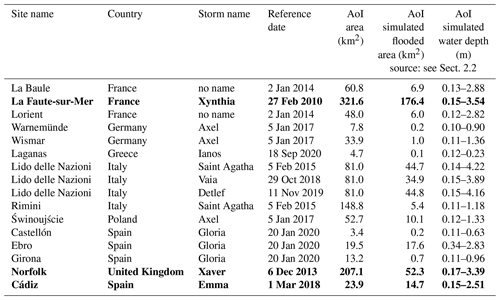
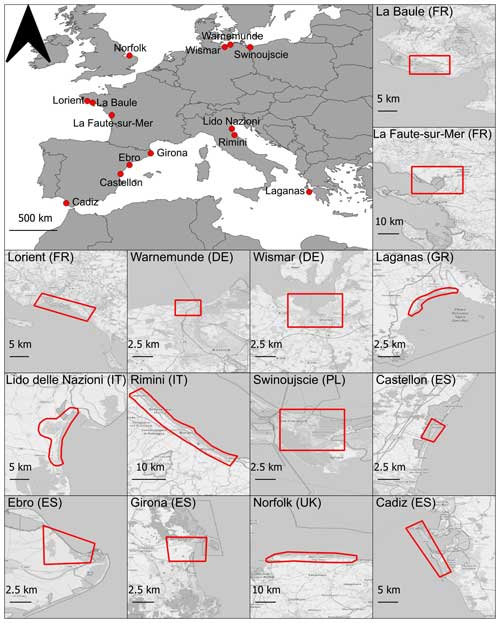
A total of 16 test cases (Table 1) were selected to apply the ECFAS impact approach. The test cases include 10 extreme events covering the period 2010–2020, generating considerable flooding and impacts along 15 European coastal sites (Fig. 1). These were selected from the database of extreme events and test cases produced in the framework of the ECFAS project (Souto Ceccon et al., 2021, 2024). The database contains events that generated significant flooding and impacts along European coastlines, and it was used to retrieve coastal flood impact data necessary to perform the analysis. The database includes a list of sources of information for each identified test case, collected through an extensive research of publicly available resources, for events included in the list of activations of the Copernicus Emergency Management Service (CEMS) and other national and European databases. The area of interest (AoI) of each site (Fig. 1) was defined based on the reported affected areas or the AoIs defined for the CEMS activations. Note that all the analyses reported in this work are limited to the AoIs.
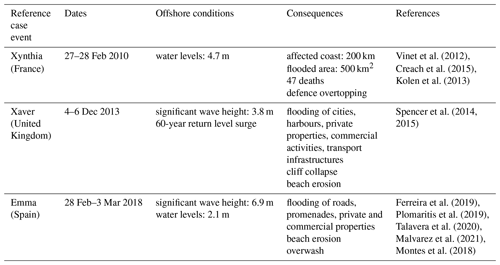
Three reference cases were selected from the previous list to implement a detailed comparison with reported damages for validation purposes: Xynthia in La Faute-sur-Mer (France) in 2010, Xaver in Norfolk (UK) in 2013, and Emma in Cádiz (Spain) in 2018. The reference cases were selected because they represent significant events that were able to generate damages and flooding over large coastal areas and because the media and institutional coverage generated enough information to be used for validation purposes. General information on the event of the reference cases is summarised in Table 2. The reference cases were selected because of their dimension in terms of hazard and impacts. The flood extension and water depths used for the impact assessment in the test cases were modelled using the LISFLOOD-FP model (Le Gal et al., 2023, 2024), as described in the following section.
2.2 Flood maps
The flood maps used to represent the coastal flood for the test cases were retrieved from the database of flood maps produced by Le Gal et al. (2023, 2024) using the LISFLOOD-FP model (Bates et al., 2005) in the framework of the ECFAS project. The approach utilised a 10 m DEM (COP-DEM-EEA10; European Space Agency and Airbus, 2022) to generate a 100 m resolution grid. The bottom friction was spatially adapted by using literature-based Manning coefficients adjusted to the LC/LU from the Copernicus Coastal Zone layer (see Sect. 2.3). The flood models were forced with total water level time series built by linear addition of the mean sea level, tide, and storm surge components retrieved from Copernicus Marine Environment Monitoring Service (CMEMS) ocean models (for tides, the FES2014 model was used when data were missing; more details in Irazoqui Apecechea et al., 2023) and empirical estimates of the wave set-up based on CMEMS wave model data. The flood maps were validated using satellite-based flood maps and in situ flood markers, following a pixel comparison approach (Bates et al., 2005; Vousdoukas et al., 2016). Although the modelled flood correctly represents the observed flood areas, in most cases the flood extension tended to be overestimated. More details can be found in Le Gal et al. (2023, 2024).
2.3 Main datasets for impact assessment
All datasets used to implement the flood impact assessment were collected in the framework of the ECFAS project (Ieronymidi and Grigoriadis, 2022). The Global Human Settlement Population Grid (GHS-POP R2019A; Schiavina et al., 2019) and the ENhancing ACTivity and population mapping 2011 Population Grid (ENACT-POP R2020A; Schiavina et al., 2020), which provide raster-based information about the distribution of population, were used to assess the number of people affected by the flood (see Sect. 3.2). The GHS-POP includes a static layer of the distribution of people in 2015; the ENACT includes 24 layers describing the population distribution by night and day for each month of the reference year 2011. The OSM vector dataset, which includes information about buildings and transport networks, was used to assess the flood damage to buildings (Sect. 3.3) and roads (Sect. 3.4). Note that the OSM coverage of the roads at the European level is reliable for large-scale evaluations, with almost complete coverage for the European countries (Barrington-Leigh and Millard-Ball, 2017; Van Ginkel et al., 2021). However, for buildings, the spatial coverage depends on the country. The Copernicus Coastal Zone (CCZ; https://land.copernicus.eu/local/coastal-zones, last access: 17 November 2023; Innerbichler et al., 2021) vector layer, which represents the most detailed up-to-date Land Cover/Land Use (LC/LU) layer for coastal areas in Europe, was used to support the damage assessment of buildings and the grid-based damage evaluations implemented for comparison purposes (Sect. 3.6). It represents a highly detailed dataset compared to CORINE (Büttner et al., 2014) or LUISA (Rosina et al., 2018) for the coastal areas. A detailed overview of the characteristics of the datasets and links to the sources can be found in Appendix A.
2.4 Sources of reported impacts
Reported impacts are essential for evaluating the performance of impact models. However, this type of information is often scarce, with qualitative information being more often available than quantitative ones. Databases of micro-scale flood damages are quite common, but they often represent very local datasets, which are difficult to retrieve, are usually reported in local languages, and are even more difficult to be used for large-scale analysis. On the other hand, aggregated information on impacts and damages is generally available at different spatial and temporal scales, but it can rarely be used in direct comparisons with simulated impacts, as often data disaggregation and manipulation are needed for comparisons. Additionally, reported damages are often incomplete, and reliable estimates might not be available for years after the event (Thieken et al., 2016).
Information on reported impacts was collected and used as ground truth for validation purposes. The data were extracted, georeferenced, and characterised by analysing the sources of information included in the database of extreme events and test cases produced in the framework of the ECFAS project (Souto Ceccon et al., 2021). The sources of information include institutional websites, scientific articles, databases, news, technical reports, blogs, and videos, among others. The collected information was analysed to build a database of impact markers that the events generated within the AoI of the affected sites. Impacts were categorised according to the type of impact as defined by the RISC-KIT project (Viavattene et al., 2015), thus discriminating between impacts on the population, buildings and private properties, infrastructures, economy, environment, and cultural heritage. Quality indexes were assigned to the identified markers to ensure the control of the reliability of the information using an approach adapted from Sancho-García et al. (2021). This approach employs three-level indexing of the quality of the spatial and temporal references and for the level of detail of the information contained in the original source. For each identified impact marker, when available, the reported local damages in euros was provided. Any additional information that could possibly support the analysis was included for each identified marker.
3.1 General aspects
The ECFAS impact approach integrates methodologies to assess direct impacts on population and assets. Developed specifically to be applied at the European scale, object-based, micro-scale methods were preferred when possible. Exposure and vulnerability aspects were considered depending on data availability and reliability. Exposure-based evaluations were preferred when vulnerability data were not available or when the assumptions related to the application of vulnerability models generated biased or very uncertain results. For population, a grid-based approach was used, while buildings and roads were assessed through object-based methods, incorporating category-based vulnerability.
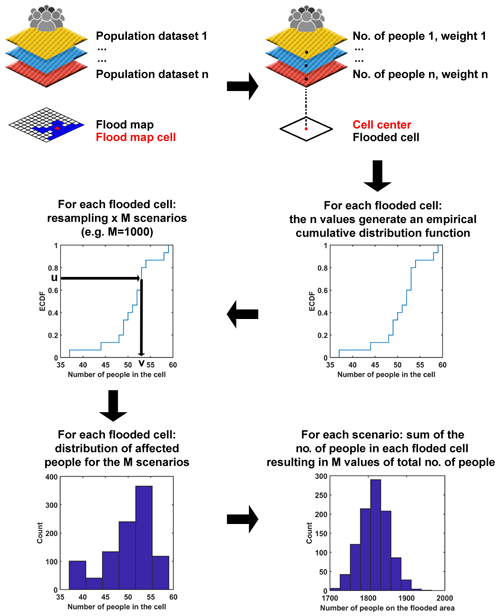
Impacts were calculated for each affected cell (population) or asset (buildings and roads) based on multiple input data or model ensembles. The model ensemble consists of a combination of different deterministic impact models. The ensemble approach usually works better than deterministic ones, as model ensemble reduces the importance of model selection, allowing one to obtain a probabilistic distribution and providing an estimation of the uncertainty (Figueiredo et al., 2018). Probabilistic impacts were generated by resampling an empirical cumulative distribution function (ECDF), generating 1000 scenarios. Although the use of flood damage curves (FDCs) is not inherently probabilistic, the use of a multi-model ensemble approach generates a probabilistic estimation and provides information about the impact distribution (mean, standard deviation, or quantiles, among others). The total impact in the flooded area was calculated by summing the contribution of each cell or asset for each scenario. The distribution of impact was represented by percentiles (2.5, 50, and 97.5). These evaluations can be repeated to calculate disaggregated impacts by category of asset. The probabilistic resample was applied to the number of people affected by the flood and the financial damage to buildings and to roads. Given the different approaches, the resampling was different for each damage sector, and a detailed explanation is provided below in each asset section.
Damages were based on average 2020 prices of the former EU-28, adjusted using Eurostat real gross domestic product (GDP) statistics for 2000–2020 (Eurostat, 2019). The reference year of the dataset for the GDP deflator (index = 100) is 2010.
Water depths lower than 0.1 m were excluded, considering flood model uncertainties (see Sect. 2.2). Representative flood depths for buildings and roads were assigned through nearest-neighbour interpolation of flood maps applied on the perimeter for buildings (Sect. 3.3) and on the polyline for roads (Sect. 3.4).
3.2 Population
The number of people affected by coastal flooding was evaluated by considering all 25 layers of the GHS-POP and ENACT datasets (Sect. 2.2) through a probabilistic approach. Given that the spatial resolution of the flood model (∼100 m) is higher than that of the datasets (250 m for GHS-POP, 1 km for ENACT), these were interpolated by using as a reference the centre of the cells of the flood map raster (Fig. 2). The interpolated values were corrected using the ratio between the cell areas of the flood map and the datasets (ratio = flood map cell area / population cell area) to consider the above-mentioned different cell resolutions. Thus, for each cell of the flood map with non-null values (i.e. the flooded cells), 25 evaluations of the number of people were available. These were used to fit an ECDF for each cell. In order to balance the higher number of layers of the ENACT dataset, weights were assigned: for the 24 evaluations based on the ENACT layers and 1 for the evaluation based on the GHS layer (i.e. assuming that the value is representative of day or night, for each month). For each cell, the affected number of people was resampled following the probabilistic approach described in Sect. 3.1, for which a schematic representation is provided in Fig. 2.
3.3 Buildings
Building damage evaluation relies on an object-based method using FDCs. Figueiredo et al. (2018) showed that model ensembles offer a useful alternative to deterministic impact assessments, allowing for semi-probabilistic or fully probabilistic evaluations and considering uncertainty. Duo et al. (2020) also used a similar approach, albeit not fully probabilistic, for assessing damage in Stavanger Harbour, Norway.
Impact models based on FDCs were preferred due to their straightforward implementation and state-of-the-art approach. More complex models (e.g. Dottori et al., 2016; Nofal et al., 2020; Taramelli et al., 2022) were not used due to the lack of required detailed input data at the large scale. Simpler models (e.g. Manselli et al., 2022) do not have the level of detail required for this study. The main datasets used were the OSM vector layer of buildings and the CCZ. The OSM layer provides the position and geometric characteristics of the buildings, excluding those with a footprint area less than 20 m2 or identified as places of worship. This approach avoids potential outliers in the damage distribution.
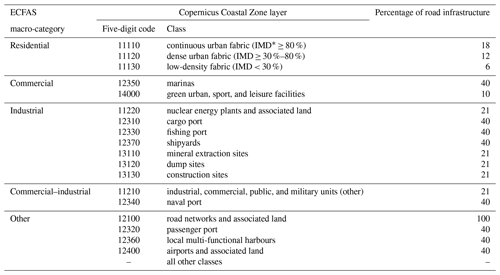
The CCZ's level-5 classes were used to categorise OSM buildings, using the dominant class for each element. In a second stage, buildings were reclassified based on macro-classification (residential, commercial, industrial, commercial/industrial, and other) defined in Table B1. The CCZ's macro-classification was derived by analysing the specific classes according to Innerbichler et al. (2021). Assumptions were made to ensure accurate representation of exposed building classes, such as including “green urban, sports and leisure facilities” (refer to Table B1) in the commercial macro-class for leisure and commercial activities in green urban areas. Limitations were discussed in Sect. 5.3.2. Damage was calculated using FDCs for residential, commercial, industrial, and commercial/industrial macro-classes. No damage was calculated for the “other” macro-class due to the unavailability of damage models. The ensemble approach applies curves described in Table 3 and shown in Fig. 3. Seven curves were used for residential buildings; four curves were used for commercial and industrial buildings. For the mixed commercial/industrial category, both commercial and industrial FDCs were applied. The curves were selected based on available technical documentation and scientific publications, ensuring consistency by using damage factors relative to maximum damage. This allowed us to focus on the variability of the vulnerability models (i.e. the FDCs), limiting the uncertainty related to the reference value of the damage factors that, in other cases, refers to construction or repair costs. The maximum damage from Huizinga et al. (2017), who developed a global database of depth–damage curves containing the maximum damage value, was used for all models. Note that for the mixed class commercial/industrial, defined to consider the aggregated CCZ Level-5 class 11210, which includes industrial and commercial units, as well as public and military units, both commercial and industrial models were applied for a total of eight curves.
Table 3Selected flood damage curves to calculate impacts to the identified buildings: brief descriptions and references are provided along with an indication of the macro-class for which a curve was available (R: residential; C: commerce; I: industry).
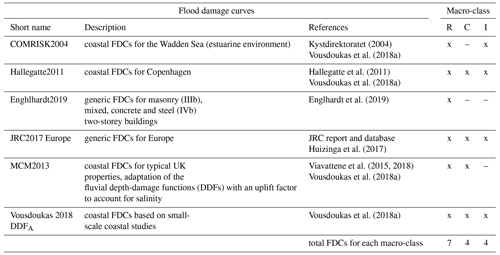
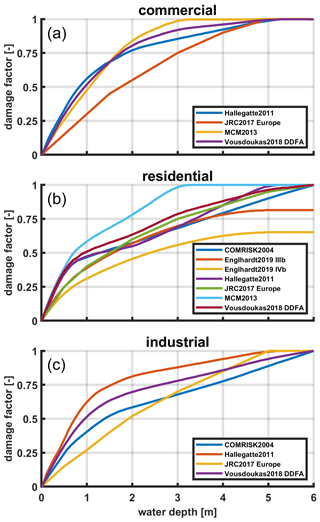
Figure 3Overview of the applied flood damage curves for the building types commercial (a), residential (b), and industrial (c).
Relative damage for each flooded building was calculated using all selected curves for its macro-class and then multiplied by the country-specific object-based maximum damage. The probabilistic evaluation of building damage, total damage in the AoI, and average damage by asset type follows the method described in Sect. 3.1. Then, for each flooded building, a large number of values (1000) are randomly generated from the ECDF, representing the probabilistic estimation (distribution) of the damage factor for that flooded building. The distribution is then multiplied for the (deterministic) maximum damage to retrieve the financial damage. The process is applied to each flooded building, and the probabilistic estimate of the total building damage is based on the resampling set of each building.
3.4 Roads
Road impact evaluation uses an object-based method with multiple FDCs, adapted from the work of Van Ginkel et al. (2021), who developed a flood impact assessment for roads at European scale using a new dataset of road-specific damage functions. FDCs are based on damage factors relative to construction costs for various road types. The available method was improved for this work by probabilistically resampling literature-based construction cost data from Van Ginkel et al. (2021).
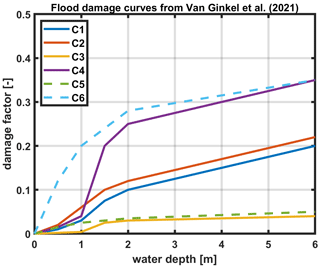
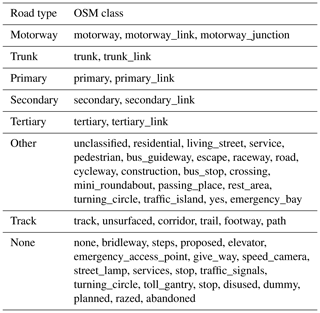
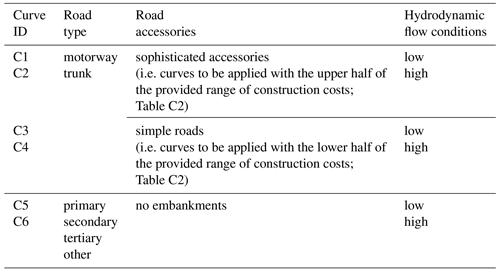
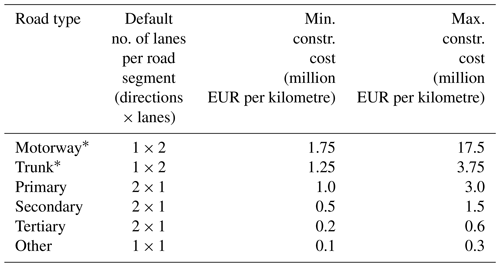
The main dataset used was the OSM road vector layer, providing position and geometric characteristics of roads. Road macro-classification (see Table B2) and FDCs (Fig. 4) were applied following Van Ginkel et al. (2021). Multiple curves exist for each category, considering road accessory characteristics and hydrodynamic flow conditions. Motorways and trunks are represented by curves C1 and C2 if highly accessorised (e.g. with street lighting and electronic signalling), C3 and C4 otherwise. Less important roads are represented by curves C5 and C6 (see Table C1). All curves were applied, multiplying them by probabilistic resampling of the appropriate construction cost range using ECDFs. An ECDF was fitted on the literature-based sample of construction costs for motorways from Van Ginkel et al. (2021) and rescaled within defined ranges (Table C2) for different road types and accessories. Damage was calculated accordingly, following the authors' recommendations (Table C1). An overview of applied ECDFs is shown in Fig. 5, where the curves were compared with the ECDFs of the empirical sample for each type of road.
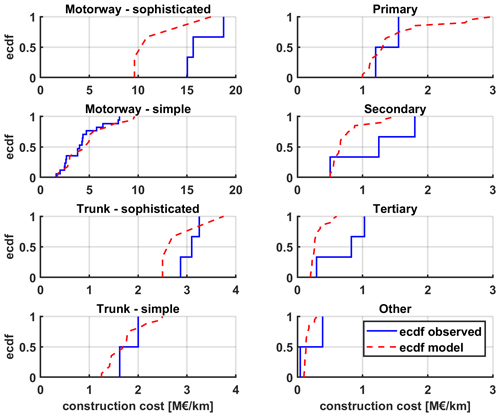
Figure 5The literature-based sample of construction costs for motorways from Van Ginkel et al. (2021) was used to calculate an ECDF that was then rescaled based on the ranges of the construction costs defined by the authors for each type of road and level of accessories for the application of the damage model (ecdf model, dashed red line). The curves are compared with the ECDFs of the empirical sample for each type of road (ecdf observed, solid blue line). The costs are based on 2015 prices for Europe, as reported by Van Ginkel et al. (2021).
The original methodology adjusts costs based on the number of lanes of each road segment, but in this application, default lanes were used (see Table C2). The probabilistic resampling considers both multi-FDCs damage factors and construction cost ranges. The probabilistic estimates of total damage and average damage by road type follow the method described in Sect. 3.1. The probabilistic resampling was applied to both the relative damage (using multiple damage curves) and the maximum damage (using an empirical set). In both cases the method generates an ECDF based on a set of values of relative damage factor for each flooded road, and a set of values of maximum damage and the ECDFs are resampled (n=1000). The resampling sets of the relative and maximum damage are combined, generating a set of n×n values of financial damage for each road that represent the probabilistic estimation.
3.5 Validation with reported impacts
Validation of the ECFAS impact approach for the reference cases involved a comparison between modelled and reported impact data (see Sect. 2.4). Quantitative performance evaluations were conducted when reliable quantitative data were reported, while qualitative discussion was given otherwise. In the first case, the comparisons focused on average damage to assets rather than absolute damage due to differences in spatial representation; the probabilistic representation of simulated impacts (95 % range; 50th percentile) was considered, and reported damages were corrected based on 2020 price levels of the former EU-28, accounting for the event year and country (see Sect. 2.1). On the other hand, qualitative comparison was applied by evaluating the capacity of the adopted methodology to describe the reported damages.
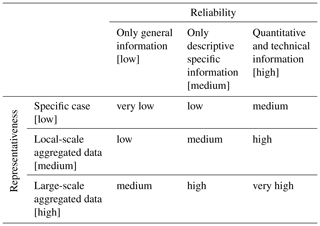
Performance assessment on the AoIs introduced potential bias due to aleatory uncertainties, but these are minimised in large-scale applications (Merz and Thieken, 2009; Wagenaar et al., 2016). For example, in small-scale applications, commercial buildings in an area that is macro-classified as residential (see Sect. 3.3 for methodology) can lead to overestimation of the flooded buildings' area and average damage per building. To address these issues, comparisons were carefully evaluated for reliability and representativeness, determining confidence levels. The reliability was defined based on three categories: low, medium, and high, depending on the verifiability of information, whether only general information (low), descriptive (medium), or quantitative and technical (high) information is included. The representativeness was defined based on three categories: low, medium, and high, depending on the scale of the data, whether it is valid for specific assets or based on aggregated (from local-scale to large-scale) data. Because of the scale of this application, aggregated data at the regional or national level were considered more representative than punctual or local information. Confidence levels ranged from very low to very high based on a combination of reliability and representativeness (Table 4).
3.6 Comparison with grid-based damage evaluations
To implement a comparison with commonly used impact approaches and to support the analysis, grid-based impact assessments were implemented for buildings and roads. For consistency with the object-based methods, to implement the grid-based evaluations the chosen reference dataset for LC/LU was the CCZ layer. The flooded cells of the flood maps were considered the basic unit of calculation, to which the most frequent LC/LU class in the cell was assigned.
Based on reclassification of the CCZ class, which is the same applied for the object-based method for buildings (Sect. 3.3), the damage was calculated for the flooded cell area by applying the FDCs for residential, commercial, and industrial buildings. The LU-based maximum damage was provided by Huizinga et al. (2017).
The damage to roads was calculated by applying the FDCs for infrastructure (roads) and the LU-based maximum damage (EUR 25 per square metre in 2010 prices for all of Europe) provided by Huizinga et al. (2017). The damage was calculated for a fraction of the flooded cell area, which was defined for each CCZ class (“Percentage of the road infrastructure” in Table B1) by adapting the application from Van Ginkel et al. (2021); thus it is based on guidelines provided by Huizinga et al. (2017) and EEA (2006).
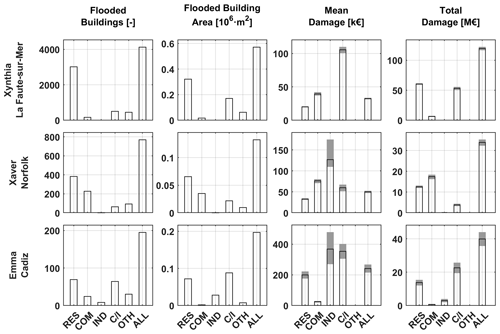
Figure 6Overview of impacts to buildings for Xynthia in La Faute-sur-Mer (France, 2010; first row panels), Xaver in Norfolk (UK, 2013; second row panels), and Storm Emma in Cádiz (Spain, 2018; third row panels): number of flooded buildings (deterministic estimate; first column panels), flooded building area in millions of square metres (deterministic estimate; second column panels), mean damage per asset in thousands of euros (probabilistic estimate; third column panels), and total damage (in the AoI) in millions of euros (probabilistic estimate; fourth column panels). The results are shown for residential (RES), commercial (COM), industrial (IND), commercial/industrial (C/I), others (OTH), and all (ALL) buildings. Damages are based on average 2020 price levels for EU-28, the European Union with 28 member states (Eurostat, 2019).
4.1 Reference case detailed impacts
Detailed results for the Xynthia (France, 2010), Xaver (UK, 2013), and Emma (Spain, 2018) reference cases are presented in this section (Figs. E1–E3). Figure 6 displays detailed, disaggregated impact results for buildings, while Fig. 7 shows the results for roads, including their uncertainty bands.
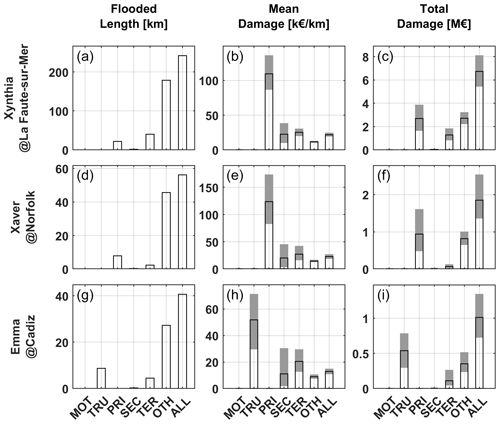
Figure 7Overview of impacts to roads for Xynthia in La Faute-sur-Mer (France, 2010; first row panels), Xaver in Norfolk (UK, 2013; second row panels), and Storm Emma in Cádiz (Spain, 2018; third row panels): length of flooded roads in kilometres (deterministic estimate; first column panels), mean damage per kilometre in thousands of euros (probabilistic estimate; second column panels), and total damage (in the AoI) in millions of euros (probabilistic estimate; third column panels). The results are shown for motorways (MOT), trunks (TRU), primary (PRI), secondary (SEC), tertiary (TER), others (OTH), and all (ALL) roads. Damages are based on average 2020 price levels for EU-28, the European Union with 28 member states (Eurostat, 2019).
The residential sector is the most impacted in terms of affected buildings and area in all three reference cases. However, when considering potential total damage to buildings, the residential sector accounts for roughly half of the damage in Xynthia but around 35 % in Xaver and Emma. The remaining damage is primarily associated with commercial or commercial/industrial buildings. Uncertainty in total damage estimates for buildings is generally contained.
Road damage is significantly lower than building damage. Minor roads are most affected, but main roads such as motorways, trunks, and primary roads also experience damage. Notably, no motorways were impacted in the analysed areas. Uncertainty ranges for total road damage, though smaller than building damage ranges, are relevant when compared to the magnitude of the total damage to roads.
4.2 Overview of impacts for the test cases
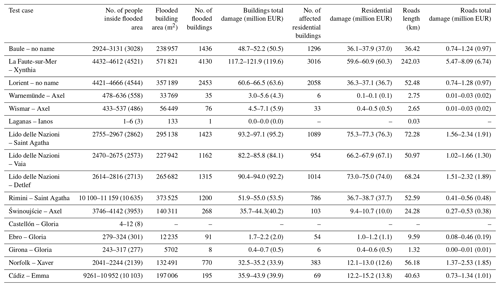
The impacts on population, buildings, and roads simulated with the ECFAS impact approach (Sect. 3.2–3.4) are shown in Fig. 8 for the analysed test cases. For buildings and roads, the corresponding impact evaluation implemented using a grid-based method (Sect. 3.6) is also reported in Fig. 8, for comparison purposes. The detailed results can be found in Table D1.
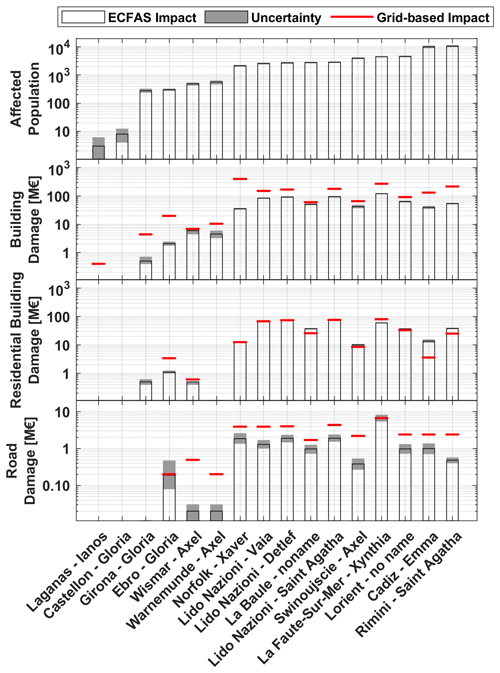
Figure 8Impacts on population, buildings, and roads simulated with the ECFAS impact approach for the 16 test cases, compared with grid-based methods. The impacts (y axis) are displayed on a logarithmic scale.
The results show that the uncertainty in the affected population is very low, except for the Laganas and Castellón test cases, where significant variations were observed. However, it is important to note that in both cases, the number of people affected by the events was almost negligible: [1–6 (3)] for Laganas and [4–12 (8)] for Castellón, while the affected population in the other test cases was orders of magnitude higher. The results for buildings indicate low uncertainty in the damage estimation for both categories. For roads, there is some variability that is consistent across all case studies.
Comparisons between different methodologies reveal that the grid-based method generally overestimates the values provided by the ECFAS impact approach. This discrepancy is most evident in the categories of buildings and roads, where in no test case does the ECFAS impact approach yield higher values than the grid-based method. For buildings, these values can differ by up to an order of magnitude. In the case of residential buildings, only five test cases (La Baule, Świnoujście, Lorient, Cádiz, and Rimini) show higher values with the ECFAS approach, although they remain within the same order of magnitude.
5.1 Validation with reported impacts
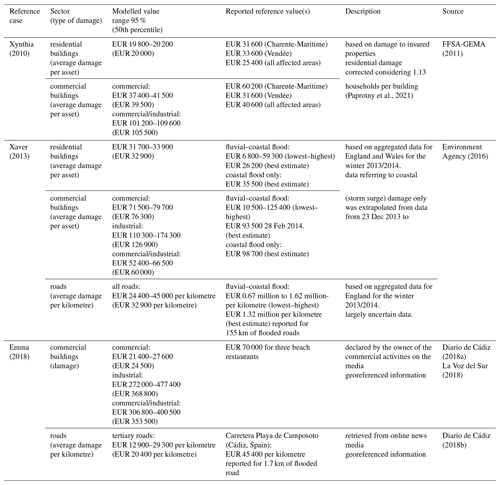
Detailed comparisons of simulated damage due to coastal floods with reported data for buildings and roads are summarised in Table 5. Buildings and roads are crucial sectors in terms of flood financial losses, making these comparisons valuable for validation purposes. Reported data vary in type and detail, depending on the country and event significance. Xynthia, for example, raised significant attention and resulted in abundant scientific and governmental information. In the UK, efficient flood impact collection and analysis, as well as a robust insurance system, provided detailed technical information for events like Xaver. On the other hand, for Emma limited information was available, mainly sourced from the media due to a lack of technical reports.
Table 5Modelled and reported impact data for the quantitative validation applied for the reference cases. Damages are based on average 2020 price levels for EU-28, the European Union with 28 member states (Eurostat, 2019).
5.1.1 Storm Xynthia, La Faute-sur-Mer (France), 2010
Buildings
The modelled damage for residential buildings underestimates reported values by a factor of 0.6 when compared to disaggregated data. When compared to aggregated (all areas) reported damage, the simulated damage underestimates average damage by a factor of 0.8. Note that the simulated damage includes both structure and content. Content damage is estimated to be roughly 30 % of total damage (André et al., 2013; Paprotny et al., 2021). The simulation does not consider building collapse, which was an important aspect for this test case: extensive damage led to destruction of properties and compensation by the government (∼1500 houses at an average of EUR 150 000 per house) (Kolen et al., 2013).
The average simulated damage for commercial and mixed (commercial/industrial) categories differs significantly due to varying footprint areas. For the mixed category, 27% of the flooded building area derives from assets larger than 1000 m2, while commercial buildings are all smaller than 1000 m2. Reported damage for professional properties aligns with simulated damage for commercial buildings by a factor of 0.65–1.25. However, for the mixed category, the comparison shows factors higher than 1.75.
Roads
Quantitative information on road impacts was limited. Government reports mention significant damages, while the media and other sources show erosion, debris deposition, and asphalt damage. The Route de la Tranche-sur-Mer (Fig. 9a) experienced significant erosion outside the AoI. A quick assessment considered it a tertiary road with a simulated flood of approximately 1 m. Damage for the 375 m segment ranged from EUR 2 100–43 400 (EUR 5 500–115 800 per kilometre). Calculated damage factors for the AoI were 0.6 %–28.3 %, with only 20 % of roads showing relative damage above 15 %. Higher values above 11 % (Van Ginkel et al., 2021) matched reported damages (Fig. 9a), suggesting that the higher portion of the distribution (75 %–97.5 %) better represents road damage. The model considers both low and high flow conditions, while reported damages mainly relate to high flow.
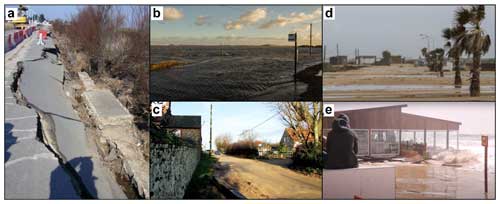
Figure 9Examples of damage to roads: (a) Route de la Tranche-sur-Mer in the area of La Faute-sur-Mer (France) after the Xynthia event in February 2010; (b) Coast Rd (Salthouse, Holt) and (c) Beach Rd (Holme-next-the-Sea, Hunstanton) in the Norfolk (UK) area after the Xaver event in December 2013; and (d) Carretera Playa de Camposoto in the south of the city of Cádiz (Spain) after the Emma event in March 2018. The images were retrieved from the sources of information collected in the ECFAS database of extreme events and test cases (Souto Ceccon et al., 2021).
5.1.2 Storm Xaver, Norfolk (UK), 2013
Buildings
Simulated damage in the residential sector aligns with the reported range for fluvial and coastal floods (Environment Agency, 2016). However, it slightly exceeds the reported best estimate. When considering disaggregated data for coastal floods only, the average damage matches the simulation. The reported estimation, extrapolated from data from 23 December 2013 to 28 February 2014, likely underestimates coastal flood damage for the Xaver event. Overall, the impact approach for residential buildings appropriately represents the magnitude of the average damage for coastal flooding. However, a tendency to overestimate the average damage must be underlined, as seen in the comparison with the reported best estimate for fluvial and coastal floods. The probabilistic-based approach accounts for this, including uncertainties in vulnerability models. Nevertheless, an overestimation of residential damage, even in magnitudes, is expected (Molinari et al., 2020). In this specific case, the approximation factor is 0.9–1.25 when compared to the reported best estimate for fluvial and coastal floods.
The average simulated damage significantly differs between the commercial and mixed categories, but it is comparable in magnitude. Only one industrial building in the flooded area incurs damage (EUR ∼127 000). The model underestimates damage for commercial buildings by a factor of 0.7–0.8. The evaluation for the mixed category also falls below the reported best estimate. When considering disaggregated data for coastal floods only for business properties, the underestimation is slightly emphasised. However, all simulated damages align with the reported range for riverine and coastal floods.
Roads
The comparison between simulated and reported average damage reveals a significant discrepancy, with simulated damage being 2 orders of magnitude lower than reported values (for fluvial and coastal floods). The reported information on road impacts carries large uncertainty, as acknowledged by the authors of the report (Environment Agency, 2016). The lack of detailed context information in the report raises doubts about the accuracy of the reported length of flooded/affected roads. Moreover, the reported examples primarily focus on damage to motorway and trunk roads, suggesting that the reported average damage may be more representative of those road types. In contrast, the simulated results primarily represent primary and other roads (see Fig. 7). Simulated average damage for primary roads is approximately 1 order of magnitude higher than other road classes. Assuming all flooded roads as trunks, the average simulated damage ranges from EUR 129 200 to 141 800 (135 500) per kilometre. Similarly, for motorways, it ranges from EUR 468 000 to 516 300 (491 900) per kilometre. This assessment supports the notion that the reported data may better reflect the average damage for motorways and trunks.
By analysing reported information (see Sect. 3.5), the type of damage affecting roads can be determined and qualitatively compared with the estimated damage from the applied model. Figure 9b and c provide examples of this test case, where debris deposition represents the main physical impact on minor roads (primary, secondary, tertiary, other). Cleaning operations account for most of the financial damage, while repair works typically pertain to the regular maintenance due to lower maintenance standards compared to motorways and trunks (Van Ginkel et al., 2021). These reported damages indicate that the flooding had low flow velocities, whereas the model considers damage curves for both low and high flow velocities. Therefore, it is reasonable to assume that the simulated damage for roads overestimates the overall damage, and the lower half of the sample (percentiles: 2.5 to 50; relative damage < 5 %) better represents the actual road damage. The construction cost used to calculate absolute damage introduces some uncertainty, but this is addressed through probabilistic application.
5.1.3 Storm Emma, Cádiz (Spain), 2018
Buildings
The high simulated damage for the residential sector could be related to the existence of large residential buildings. None of the sources of information analysed refer to damage to residential properties for this reference case, which could lead to the conclusion that residential buildings were not affected by the flooding, although the analysed resources do not represent official reports.
Considering the commercial sector, the comparison was implemented by analysing a single case of a beach restaurant. This building was repeatedly flooded during the event (Fig. 9e), as confirmed by news, videos, and the qualitative analysis of the data from a video monitoring system in the area (Montes et al., 2018). The simulated damage for the beach restaurant is estimated between EUR 52 500 and 99 500 (95 % probability), and the 50th percentile is EUR 78 800. The estimated damage reported by the owner of one of the beach restaurants in the area considered three beach restaurants. Nonetheless, the other two properties did not suffer significant damages, and it is reasonable to assume that most of the reported damage refers to the former. By taking this aspect into account, and the fact that the owner may have overestimated the damages, the comparison between the average simulated and the reported damage shows no significant differences. The approximation factors vary in the range of 0.75–1.4.
Roads
The damage reported for the Carretera Playa de Camposoto is higher than the upper limit of the simulated range for tertiary roads. However, it is comparable with the simulated damage for the specific road: EUR 5 800–121 300 (38 900) per kilometre. The corresponding simulated relative damage is 2.6 %–21.3 %. The results are in line with the observed damage (i.e. mainly cleaning costs and possible minor damage to asphalt; Fig. 9d). The lower limit of the simulated damage is expected to represent those cases where only cleaning cost is needed.
5.1.4 Confidence
The comparisons for the reference cases were assessed based on confidence levels (Sect. 3.5). For residential buildings, the storms Xynthia and Xaver showed underestimations (max. factor 2) and overestimations (max. factor 1.3), with good agreement in magnitude. No validation was possible for residential buildings in the Emma reference case. Comparisons for commercial buildings showed underestimates (max. factor 2) and overpredictions (max. factor 3), with appropriate magnitude estimates. Road comparisons generally agreed with reported damages, with slight overestimations expected.
High confidence was assigned to the Xynthia reference case validation, based on aggregated data from national insurance and scientific reports. The Xaver reference case had medium–high confidence due to reliable national technical reports aggregated that were considered more representative for evaluating the performance of an impact model to be applied at the large scale. The Emma reference case had low confidence due to limited data availability and representativeness. Commercial building validation relied on specific news information, while road comparison was limited to a 1.7 km segment in Cádiz.
It is necessary to note that the scarcity of reliable data on the impact of storms, usually available only in aggregated form, makes validation of impact models for coastal areas difficult. In this study, a validation process was carried out for three historical events that impacted different coastal areas, together with an analysis of the reliability and representativeness of the different resources used for the validation of the model output. Due to the type and number of available data, the comparison between simulated damage due to coastal floods and reported data for buildings and roads was based on an expert judgement approach. Furthermore, the effect of wind is not isolated from the reported damage due to lack of disaggregated data, so the reported damage was interpreted with caution. Nevertheless, the selected reference cases have been thoroughly analysed, and although wind can play an important role in the damage, the impacts generated by the selected events have mainly been caused by flooding.
In addition to uncertainties related to storm impact data, the accuracy of the modelled flood extent can bias the validation process, as discrepancies in the flood extent can lead to underestimation or overestimation of impacts. For the three reference cases, although the modelled floods accurately covered the observed flood extent, with pixel-to-pixel agreement values above 90 %, a general overestimation of the flood was observed. Specifically, the false flooded pixels were 160 % for Storm Xynthia and 750 % for Storm Xaver.
5.2 Comparison with grid-based damage evaluations
The comparison in Fig. 8 showed that object-based evaluations of the ECFAS impact approach generate lower results than grid-based methods for total damage to buildings and roads. The latter often report values that are 2 or more times or even 1 order of magnitude higher. Interestingly, the differences never exceed 1 order of magnitude, and the grid-based damage to residential buildings showed a general agreement with the corresponding object-based evaluations, with some exceptions. For damage to buildings, in fact, the residential FDC from Huizinga et al. (2017) applied for the grid-based estimates approximates the average behaviour of the set of curves applied by the ECFAS impact approach (Fig. 3) for residential buildings. Moreover, the maximum damage for both methods is retrieved from the same source (Huizinga et al., 2017). Although overestimation can be expected for the grid-based assessment, the overestimates of the building flooded area are partially balanced by the lower (LU-based) maximum damage applied. In this context, the ECFAS impact approach represents a more reliable method for refined damage estimates. The object-based approaches outperform the grid-based ones in terms of resolution and detail of the assessment, although no conclusion can be drawn on the performance of grid-based methods when compared with reported data. Indeed, implementing the comparisons as described in Sect. 3.5 would not be feasible with grid-based results because of the nature of the methodology (e.g. it is not possible to estimate the number of affected assets without the availability of specific information).
5.3 Limitations
5.3.1 Population
The evaluation of affected people provides an estimate of individuals directly exposed to the flood. Uncertainties arise from temporal differences between datasets (ENACT: 2011; GHS: 2015) and the flood event's reference year, as well as spatial resolution discrepancies between the flood map and datasets. Uncertainty due to the input datasets is expected for this type of assessment (Lichter et al., 2011); however, the probabilistic resampling partially accounts for it.
It also accounts for seasonal and day–night variability. Timing-based assessments of the affected population would be more appropriate for operational applications. Certainly, it would represent a refinement of the assessment from a deterministic point of view. Comparisons between GHS-POP and ENACT datasets for the number of people in the affected areas show minor variations (Fig. 10; horizontal axes in logarithmic scale), which is also evident when analysing the uncertainty in the results presented in Fig. 8. Exceptions exist, like Castellón (Spain), where ENACT's low resolution makes it statistically unreliable. Overall, similar numbers of affected people are identified, with acceptable variations within the same magnitude. Probabilistic implementation was preferred for these reasons.
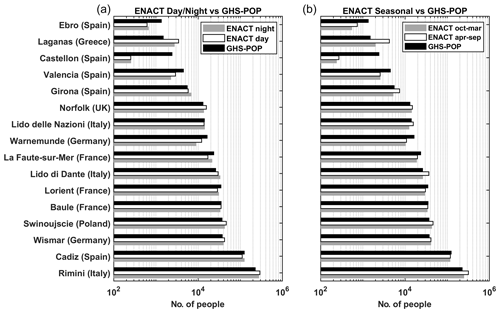
Figure 10Overview of the population on the AoIs of the site test cases: the GHS-POP estimate is compared to the ENACT estimate for daytime and nighttime (a) and with the ENACT estimate for summer (April–September) and winter (October–March) seasons (b). The number of people is represented using a logarithmic scale.
Constructing ECDFs at the flood map cell scale involved applying different weights to datasets. Equal weights would favour ENACT, so using different weights aims to homogenise representativeness. This weighting method has a significant impact on the evaluation. Alternative solutions may require assumptions on dataset uncertainty, generating values to feed the ECDF, but these introduce additional uncertainties.
Validating the reliability of simulated affected population numbers using reported figures is challenging, as reported data mostly focus on casualties, injuries, and hospitalisations. These factors depend not only on human presence but also on early warning systems and emergency response efficiency. Additional considerations could involve evacuated households, long-term flood-related illnesses, or other indirect impacts to estimate the number of affected people.
Vulnerability-based evaluations can enhance flood risk assessment, but large-scale implementation is hindered by the need for detailed socio-economic, cultural, and governance data (Thomas et al., 2019).
5.3.2 Buildings
OSM provides reliable building coverage for large-scale evaluations at the European level. However, quality control at specific sites revealed some coverage gaps (e.g. Castellón site in Spain), leading to underestimations of building damage. Nevertheless, this limitation is considered non-critical as OSM is regularly improved and updated.
The macro-classification is based on CCZ layer representativeness analysis. OSM buildings were found on beaches classified as open spaces in the CCZ layer (sandy, 62 111; shingle, 62 112), representing beach facilities and economic activities, such as tourism (e.g. Emilia-Romagna coast Italian sites: Lido delle Nazioni, Lido di Dante, and Rimini). Hence, beach-related CCZ classes were included in the commercial macro-class, providing a practical solution for commercial buildings located on beaches without specific commercial classification in the CCZ layer.
Numerical interpolation of data introduces limitations. The interpolation method for representative flood depth calculation can influence the number of flooded buildings and the building macro-classification. These aspects refer to the aleatory component of the uncertainty and should be therefore contained when modelling large-scale events (see Sect. 3.5).
The application utilises damage factors and object-based maximum damage (provided by Huizinga et al., 2017), accounting for country-based GDP. However, this simplified approach may not capture intra-country variability, and maximum damage-based curves generally overestimate flood damage to buildings (Molinari et al., 2020). To improve the assessment, robust national, regional, or municipality-based damage curves can be generated, as recently demonstrated by Martínez-Gomariz et al. (2020) for Spain.
The multi-model ensemble implementation based on Figueiredo et al. (2018) has limitations due to the number of models and other factors discussed in previous studies (e.g. Duo et al., 2020). In this case, the number of models applied for each building macro-class is limited due to the scale of application of the impact assessment. Despite limitations, multi-model ensembles demonstrate better predictive skills compared to single-model (deterministic) assessments (Figueiredo et al., 2018).
5.3.3 Roads
Limitations exist regarding the numerical interpolation of data, as discussed previously for building impacts. The macro-classification used is adapted from Van Ginkel et al. (2021). Negligible uncertainty is expected from this reclassification due to the coverage of the OSM road dataset, particularly for important roads. However, there may be some uncertainty for less significant roads.
In this case, probabilistic resampling assumes that the empirical construction cost distribution for motorways is applicable to other road types. The comparisons shown in Fig. 5 support this hypothesis. The main difference is observed for highly accessorised motorways due to a lack of observations in the literature-based sample within a specific cost range (EUR 8.2 million and 14.9 million per kilometre; 2015 prices).
Probabilistic resampling is applied at two levels: for input data on construction costs and for multiple FDCs applied to each road class. This provides an evaluation of uncertainty in both construction costs and FDCs.
The approach uses the default number of lanes for each road segment. While this may introduce uncertainty, it should be limited, particularly at a large scale (aleatory uncertainty; see Sect. 3.5), and it is accounted for by probabilistic resampling of construction costs.
It is important to note that certain aspects, such as infrastructure failure or damage from compound hazards (e.g. pluvial, landslides), are not addressed by the method of Van Ginkel et al. (2021), as recently demonstrated by Koks et al. (2022).
This study presents a coastal flood impact assessment approach designed to estimate flood direct impacts on population, buildings, and roads across Europe. The ECFAS impact approach integrates methodologies that prioritise object-based and probabilistic evaluations, providing uncertainty estimates for damage assessment. The presented approach was applied to 16 test cases along several European coasts, encompassing events that generated significant flooding and impacts, and it was validated against reported direct impacts for Storm Xynthia in La Faute-sur-Mer (France) in 2010, the Xaver event in Norfolk (UK) in 2013, and Storm Emma in Cádiz (Spain) in 2018. The implemented validation, suited to the characteristics of an object-based approach through detailed geolocated impact markers and damage information, represents a step forward in approaches designed to be applied on a large scale, providing valuable information on the accuracy and uncertainty of the results. Results showed a valuable estimation for affected populations and reliable damage assessments for buildings and roads. Moreover, the use of different population datasets allows the associated uncertainty to be reduced by probabilistic resampling.
The ECFAS impact approach improves upon the European-scale operational approach for riverine flood warnings (EFAS) by utilising detailed recent datasets and probabilistic methods. The use of multiple FDC as multi-model ensemble allows the generation of the probabilistic estimations. Additionally, the adoption of object-based methods for buildings and roads improves the detail and reliability of the simulated impacts, moving from the meso-scale to the micro-scale analysis, even if it is applied at a large scale. The presented methodology, tested against grid-based approaches on 16 test cases across Europe, shows a better accuracy for damage to buildings and roads than traditional and widely used grid-based approaches. The comparison with the grid-based approach showed that the ECFAS impact approach reduces the overestimation of the simulated impact and damage for both buildings and roads, although in most test cases the results are of the same order of magnitude.
Although the ECFAS impact approach represents an improvement over other widely used methodologies for coastal flood impact assessment, it has limitations that need to be considered. The estimation of the affected population has uncertainties related to temporal differences between datasets and the flood event, as well as from the spatial resolution of the datasets, although probabilistic resampling partially addresses these issues. Uncertainties in building impact assessment arise from outdated building coverage datasets or incorrect macro-classification based on CCZ, as well as the use of damage factors and object-based maximum damage accounting for country-based GDP, which can lead to an overestimation of flood damage. Additionally, the number of models selected for the multi-model ensemble implementation contributes to this uncertainty. Similar to buildings, road impact assessment has limitations related to numerical interpolation data.
The approach presented in this work is part of the ECFAS project, which is designed to extend the capabilities of the Copernicus Emergency Management System for coastal flood early warnings, complementing EFAS for riverine floods. Future developments aim to enhance population assessment incorporating vulnerability and risk to life estimates and refine damage and uncertainty evaluation for buildings and roads. The results provided by the ECFAS impact approach can support prevention and preparedness activities and can feed further evaluations of risk scenarios, including cost–benefit analysis of disaster risk reduction (DRR) strategies.
Table A1Overview of the dataset used for the impact assessment. The data are available through the Zenodo platform (Ieronymidi and Grigoriadis, 2022; https://doi.org/10.5281/zenodo.7319270).
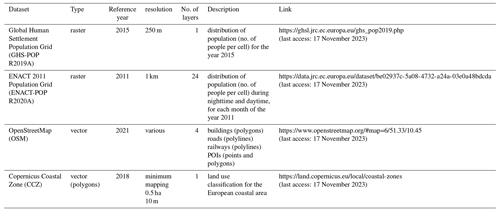
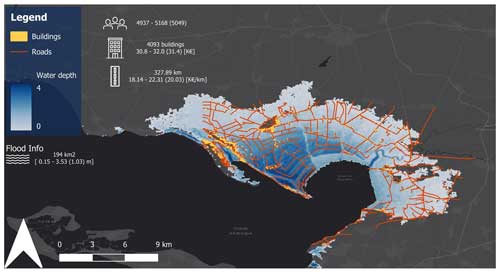
Figure E1Modelled impact map for Xynthia (La Faute-sur-Mer, France) in 2010. The map contains information on the modelled flood extent, the estimation of affected people, the damage assessment for buildings (number of flooded buildings and mean damage), and the damage assessment for roads (affected road length and mean damage).
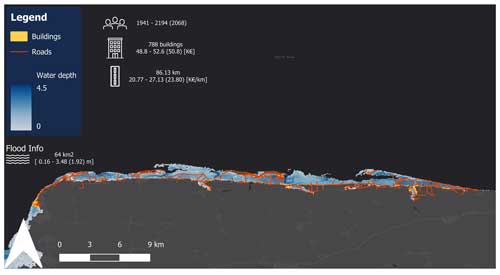
Figure E2Modelled impact map for Xaver (Norfolk, UK) in 2013. The map contains information on the modelled flood extent, the estimation of affected people, the damage assessment for buildings (number of flooded buildings and mean damage), and the damage assessment for roads (affected road length and mean damage).
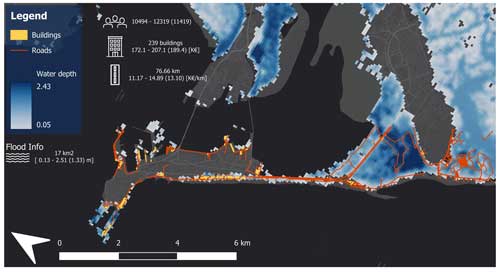
Figure E3Modelled impact map for Emma (Cádiz, Spain) in 2018. The map contains information on the modelled flood extent, the estimation of affected people, the damage assessment for buildings (number of flooded buildings and mean damage), and the damage assessment for roads (affected road length and mean damage).
The data and code related to this work and produced during the EU H2020 ECFAS project (GA 101004211; https://www.ecfas.eu/, last access: 22 October 2024) can be accessed through the Zenodo platform: the Impact Tool (Duo et al., 2022a; https://doi.org/10.5281/zenodo.7489035), the Pan-European Flood Catalogue (Le Gal et al., 2022; https://doi.org/10.5281/zenodo.7488978), and the Pan-European Impact Catalogue (Duo et al., 2022b; https://doi.org/10.5281/zenodo.6951527). The data presented in this study are available on request from the corresponding author.
ED: conceptualisation, methodology, software, validation, formal analysis, investigation, writing (original draft), visualisation. JMP: methodology, software, validation, formal analysis, investigation, writing (original draft). MLG: resources, writing (review and editing). TFM: resources, writing (review and editing). PC: writing (review and editing), supervision, funding acquisition. CA: writing (review and editing), supervision, funding acquisition.
The contact author has declared that none of the authors has any competing interests.
Publisher's note: Copernicus Publications remains neutral with regard to jurisdictional claims made in the text, published maps, institutional affiliations, or any other geographical representation in this paper. While Copernicus Publications makes every effort to include appropriate place names, the final responsibility lies with the authors.
The authors are thankful to Paulo Cabrita, Paola Emilia Souto Ceccon, Maialen Irazoqui, Vera Gastal, Sebastien Delbour, Dionysis Grigoriadis, and Emmanouela Ieronymidi, for their support with the work described in this paper. Juan Montes has a postdoctoral contract Margarita Salas at the University of Cádiz from the Ministry of Universities of Spain, funded by the European Union – NextGenerationEU. Marine Le Gal benefited from the “Go for IT” grant (Area 04 – Scienze della Terra) from the Fondazione CRUI under the responsibility of Paolo Ciavola.
This work received funding from the H2020 European Project ECFAS (a proof of concept for the implementation of a European Copernicus coastal flood awareness system, grant agreement no. 101004211; https://www.ecfas.eu/, last access: 22 October 2024). This study was carried out also within the CIRCE – “Conseguenze delle alluvioni in aRee CostierE” project (Impacts of floods in coastal areas), funded by the Department of Biological, Geological and Environmental Sciences of the University of Bologna (Italy).
This paper was edited by Robert Sakic Trogrlic and reviewed by Timothy Tiggeloven and one anonymous referee.
André, C., Monfort, D., Bouzit, M., and Vinchon, C.: Contribution of insurance data to cost assessment of coastal flood damage to residential buildings: insights gained from Johanna (2008) and Xynthia (2010) storm events, Nat. Hazards Earth Syst. Sci., 13, 2003–2012, https://doi.org/10.5194/nhess-13-2003-2013, 2013.
Aribisala, O. D., Yum, S.-G., Adhikari, M. D., and Song, M.-S.: Flood Damage Assessment: A Review of Microscale Methodologies for Residential Buildings, Sustainability, 14, 13817, https://doi.org/10.3390/su142113817, 2022.
Armaroli, C., Duo, E., and Viavattene, C.: From Hazard to Consequences: Evaluation of Direct and Indirect Impacts of Flooding Along the Emilia-Romagna Coastline, Italy, Front. Earth Sci., 7, 203, https://doi.org/10.3389/feart.2019.00203, 2019.
Barquet, K. and Cumiskey, L.: Using participatory Multi-Criteria Assessments for assessing disaster risk reduction measures, Coast. Eng., 134, 93–102, https://doi.org/10.1016/j.coastaleng.2017.08.006, 2018.
Barrington-Leigh, C. and Millard-Ball, A.: The world's user-generated road map is more than 80 % complete, PLoS ONE, 12, e0180698, https://doi.org/10.1371/journal.pone.0180698, 2017.
Bates, P. D., Dawson, R. J., Hall, J. W., Horritt, M. S., Nicholls, R. J., Wicks, J., and Hassan, M. A. A. M.: Simplified two-dimensional numerical modelling of coastal flooding and example applications, Coast. Eng., 52, 793–810, https://doi.org/10.1016/j.coastaleng.2005.06.001, 2005.
Büttner, G., Soukup, T., and Kosztra, B.: CLC2012. Addendum to CLC2006 Technical Guidelines, European Environment Agency, Copenhagen, Denmark, 35 pp., https://forum.eionet.europa.eu/nrc_land_covers/library/gio-land/corine-landcover-clc/technical-guidelines/clc2012-addendum-clc2006-technical-guidelines (last access: 17 November 2023), 2014.
Creach, A., Pardo, S., Guillotreau, P., and Mercier, D.: The use of a micro-scale index to identify potential death risk areas due to coastal flood surges: lessons from Storm Xynthia on the French Atlantic coast, Nat. Hazards, 77, 1679–1710, https://doi.org/10.1007/s11069-015-1669-y, 2015.
De Moel, H. and Aerts, J. C. J. H.: Effect of uncertainty in land use, damage models and inundation depth on flood damage estimates, Nat. Hazards, 58, 407–425, https://doi.org/10.1007/s11069-010-9675-6, 2011.
Diario de Cadiz: `Emma' se come las playas, https://www.diariodecadiz.es/noticias-provincia-cadiz/Emma-come-playas_0_1223278229.html (last access: 18 June 2023), 2018a.
Diario de Cadiz: El Ayuntamiento cifra en cuatro millones los daños del temporal, https://www.diariodecadiz.es/noticias-provincia-cadiz/Ayuntamiento-cifra-millones-danos-temporal_0_1225977960.html (last access: 18 June 2023), 2018b.
Dottori, F., Salamon, P., Bianchi, A., Alfieri, L., Hirpa, F. A., and Feyen, L.: Development and evaluation of a framework for global flood hazard mapping, Adv.Water Resour., 94, 87–102, https://doi.org/10.1016/j.advwatres.2016.05.002, 2016.
Dottori, F., Kalas, M., Salamon, P., Bianchi, A., Alfieri, L., and Feyen, L.: An operational procedure for rapid flood risk assessment in Europe, Nat. Hazards Earth Syst. Sci., 17, 1111—1126, https://doi.org/10.5194/nhess-17-1111-2017, 2017.
Duo, E., Fernández-Montblanc, T., and Armaroli, C.: Semi-probabilistic coastal flood impact analysis: From deterministic hazards to multi-damage model impacts, Environ. Int., 143, 105884, https://doi.org/10.1016/j.envint.2020.105884, 2020.
Duo, E., Montes-Pérez, J., and Souto-Ceccon, P. E.: ECFAS Impact Tool, D5.3 – Algorithms for impact assessment – ECFAS project (GA 101004211), https://www.ecfas.eu/ (Version 2), Zenodo [code], https://doi.org/10.5281/zenodo.7489035, 2022a.
Duo, E., Montes Pérez, J., Le Gal, M., Souto Ceccon, P. E., Cabrita, P., Fernández Montblanc, T., and Ciavola, P.: ECFAS Pan-EU Impact Catalogue, D5.4 – Pan-EU flood maps catalogue – ECFAS project (GA 101004211), https://www.ecfas.eu/, Zenodo [data set], https://doi.org/10.5281/zenodo.6951527, 2022b.
EEA: The thematic accuracy of Corine land cover 2000 – assessment using LUCAS, Technical report No. 7/2006, European Environment Agency, Copenhagen, Denmark, 90 pp., https://www.eea.europa.eu/publications/technical_report_2006_7 (last access: 17 November 2023), 2006.
Englhardt, J., de Moel, H., Huyck, C. K., de Ruiter, M. C., Aerts, J. C. J. H., and Ward, P. J.: Enhancement of large-scale flood risk assessments using building-material-based vulnerability curves for an object-based approach in urban and rural areas, Nat. Hazards Earth Syst. Sci., 19, 1703–1722, https://doi.org/10.5194/nhess-19-1703-2019, 2019.
Environment Agency: The costs and impacts of the winter 2013 to 2014 floods, Report – SC140025/R1, https://rpaltd.co.uk/uploads/report_files/the-costs-and-impacts-of-the-winter-2013-to-2014-floods-report.pdf (last access: 17 November 2023), 2016.
European Space Agency and Airbus: Copernicus DEM EEA-10 [data set], European Space Agency and Airbus [data set], https://doi.org/10.5270/ESA-c5d3d65, 2022.
Eurostat: Real GDP per capita, Statistical Office of the European Union, European Commission, Brussels, Belgium, https://ec.europa.eu/eurostat/web/main/data/database (last access: 15 June 2023), 2019.
Ferreira, Ó., Plomaritis, T. A., and Costas, S.: Effectiveness assessment of risk reduction measures at coastal areas using a decision support system: Findings from Emma storm, Sci. Total Environ., 657, 124–135, https://doi.org/10.1016/j.scitotenv.2018.11.478, 2019.
FFSA-GEMA: La tempête Xynthia du 28 février 2010 Bilan chiffré au 31 décembre 2010, https://www.mrn.asso.fr/wp-content/uploads/2018/01/2010-bilan-tempete-xynthia-2010-ffsa-gema.pdf (last access: 18 June 2023), 2011.
Figueiredo, R. and Martina, M.: Using open building data in the development of exposure data sets for catastrophe risk modelling, Nat. Hazards Earth Syst. Sci., 16, 417–429, https://doi.org/10.5194/nhess-16-417-2016, 2016.
Figueiredo, R., Schröter, K., Weiss-Motz, A., Martina, M. L. V., and Kreibich, H.: Multi-model ensembles for assessment of flood losses and associated uncertainty, Nat. Hazards Earth Syst. Sci., 18, 1297–1314, https://doi.org/10.5194/nhess-18-1297-2018, 2018.
Gerl, T., Kreibich, H., Franco, G., Marechal, D., and Schröter, K.: A Review of Flood Loss Models as Basis for Harmonization and Benchmarking, PLoS ONE, 11, e0159791, https://doi.org/10.1371/journal.pone.0159791, 2016.
Hallegatte, S., Ranger, N., Mestre, O., Dumas, P., Corfee-Morlot, J., Herweijer, C., and Wood, R. M.: Assessing climate change impacts, sea level rise and storm surge risk in port cities: a case study on Copenhagen, Climatic Change, 104, 113–137, https://doi.org/10.1007/s10584-010-9978-3, 2011.
Hinkel, J., Feyen, L., Hemer, M., Le Cozannet, G., Lincke, D., Marcos, M., Mentaschi, L., Merkens, J. L., de Moel, H., Muis, S., Nicholls, R. J., Vafeidis, A. T., van de Wal, R. S. W., Vousdoukas, M. I., Wahl, T., Ward, P. J., and Wolff, C.: Uncertainty and Bias in Global to Regional Scale Assessments of Current and Future Coastal Flood Risk, Earth's Future, 9, e2020EF001882, https://doi.org/10.1029/2020EF001882, 2021.
Huizinga, J., de Moel, H., and Szewczyk, W.: Global flood depth-damage functions: Methodology and the database with guidelines, No. JRC105688, Joint Research Centre, https://doi.org/10.2760/16510, 2017.
Ieronymidi, E. and Grigoriadis, D.: Coastal dataset including exposure and vulnerability layers, Deliverable 3.1 – ECFAS Project (GA 101004211), https://www.ecfas.eu/ (5), Zenodo [data set], https://doi.org/10.5281/zenodo.7319270, 2022.
Innerbichler, F., Kreisel, A., and Gruber, C.: Coastal Zones Nomenclature Guideline, https://land.copernicus.eu/user-corner/technical-library/coastal-zones-nomenclature-and-mapping-guideline.pdf (last access: 15 June 2023), 2021.
Irazoqui Apecechea, M., Melet, A. and Armaroli, C: Towards a pan-European coastal flood awareness system: Skill of extreme sea-level forecasts from the Copernicus Marine Service, Front. Mar. Sci., 9, 1091844., https://doi.org/10.3389/fmars.2022.1091844, 2023.
Jongman, B., Kreibich, H., Apel, H., Barredo, J. I., Bates, P. D., Feyen, L., Gericke, A., Neal, J., Aerts, J. C. J. H., and Ward, P. J.: Comparative flood damage model assessment: towards a European approach, Nat. Hazards Earth Syst. Sci., 12, 3733–3752, https://doi.org/10.5194/nhess-12-3733-2012, 2012.
Koks, E. E., van Ginkel, K. C. H., van Marle, M. J. E., and Lemnitzer, A.: Brief communication: Critical infrastructure impacts of the 2021 mid-July western European flood event, Nat. Hazards Earth Syst. Sci., 22, 3831–3838, https://doi.org/10.5194/nhess-22-3831-2022, 2022.
Kolen, B., Slomp, R., and Jonkman, S. N.: The impacts of storm Xynthia February 27–28, 2010 in France: lessons for flood risk management: Impacts of storm Xynthia, J. Flood Risk Managee, 6, 261–278, https://doi.org/10.1111/jfr3.12011, 2013.
Kystdirektoratet: COMRISK SP7 Report – Risk Assessment of the Wadden Sea, https://kyst.dk/media/541ffqmy/risk-assessment-wadden-sea.pdf (last access: 17 November 2023), 2004.
La Voz del Sur: Temporal Emma en Cádiz Playa de la Victoria, chiringuito el Potito, https://www.youtube.com/watch?v=LMpS4VshZgE (last access: 18 June 2023), 2018.
Le Gal, M., Fernández Montblanc, T., Montes Pérez, J., Duo, E., Souto Ceccon, P. E., Cabrita, P., and Ciavola, P.: ECFAS Pan-EU Flood Catalogue, D5.4 – Pan-EU flood maps catalogue – ECFAS project (GA 101004211), https://www.ecfas.eu/ (1.3) [Data set], Zenodo [data set], https://doi.org/10.5281/zenodo.7488978, 2022.
Le Gal, M., Fernández-Montblanc, Duo, E., Montes, J., Cabrita, P., Souto Ceccon, P., Gastal, V., Ciavola, P., and Armaroli, C.: A new European coastal flood database for low-medium intensity events, Nat. Hazards Earth Syst. Sci., 23, 3585–3602, https://doi.org/10.5194/nhess-23-3585-2023, 2023.
Le Gal, M., Fernández-Montblanc, T., Montes, J., Souto Ceccon, P., Duo, E., and Ciavola, P.; Influence of model configuration for coastal flooding across Europe, Coast. Eng., 192, 104541, https://doi.org/10.1016/j.coastaleng.2024.104541, 2024.
Lichter, M., Vafeidis, A. T., and Nicholls, R. J.: Exploring Data-Related Uncertainties in Analyses of Land Area and Population in the “Low-Elevation Coastal Zone” (LECZ), J. Coast. Res., 27, 757–768, https://doi.org/10.2112/JCOASTRES-D-10-00072.1, 2011.
Malvarez, G., Ferreira, O., Navas, F., Cooper, J. A. G., Gracia-Prieto, F. J., and Talavera, L.: Storm impacts on a coupled human-natural coastal system: Resilience of developed coasts, Sci. Total Environ., 768, 144987, https://doi.org/10.1016/j.scitotenv.2021.144987, 2021.
Manselli, L., Molinari, D., Pogliani, A., Zambrini, F., and Menduni, G.: Improvements and Operational Application of a Zero-Order Quick Assessment Model for Flood Damage: A Case Study in Italy, Water, 14, 373, https://doi.org/10.3390/w14030373, 2022.
Martínez-Gomariz, E., Forero-Ortiz, E., Guerrero-Hidalga, M., Castán, S., and Gómez, M.: Flood Depth-Damage Curves for Spanish Urban Areas, Sustainability, 12, 2666, https://doi.org/10.3390/su12072666, 2020.
Marvi, M. T.: A review of flood damage analysis for a building structure and contents, Nat. Hazards, 102, 967–995, https://doi.org/10.1007/s11069-020-03941-w, 2020.
Merz, B. and Thieken, A. H.: Flood risk curves and uncertainty bounds, Nat. Hazards, 51, 437–458, https://doi.org/10.1007/s11069-009-9452-6, 2009.
Meyer, V., Becker, N., Markantonis, V., Schwarze, R., van den Bergh, J. C. J. M., Bouwer, L. M., Bubeck, P., Ciavola, P., Genovese, E., Green, C., Hallegatte, S., Kreibich, H., Lequeux, Q., Logar, I., Papyrakis, E., Pfurtscheller, C., Poussin, J., Przyluski, V., Thieken, A. H., and Viavattene, C.: Review article: Assessing the costs of natural hazards – state of the art and knowledge gaps, Nat. Hazards Earth Syst. Sci., 13, 1351–1373, https://doi.org/10.5194/nhess-13-1351-2013, 2013.
Molinari, D., Scorzini, A. R., Arrighi, C., Carisi, F., Castelli, F., Domeneghetti, A., Gallazzi, A., Galliani, M., Grelot, F., Kellermann, P., Kreibich, H., Mohor, G. S., Mosimann, M., Natho, S., Richert, C., Schroeter, K., Thieken, A. H., Zischg, A. P., and Ballio, F.: Are flood damage models converging to “reality”? Lessons learnt from a blind test, Nat. Hazards Earth Syst. Sci., 20, 2997–3017, https://doi.org/10.5194/nhess-20-2997-2020, 2020.
Montes, J., Simarro, G., Benavente, J., Plomaritis, T., and del Río, L.: Morphodynamics Assessment by Means of Mesoforms and Video-Monitoring in a Dissipative Beach, Geosciences, 8, 448, https://doi.org/10.3390/geosciences8120448, 2018.
Nguyen, T. T. X., Bonetti, J., Rogers, K., and Woodroffe, C. D.: Indicator-based assessment of climate-change impacts on coasts: A review of concepts, methodological approaches and vulnerability indices, Ocean Coast. Manage., 123, 18–43, https://doi.org/10.1016/j.ocecoaman.2015.11.022, 2016.
Nofal, O. M., van de Lindt, J. W., and Do, T. Q.: Multi-variate and single-variable flood fragility and loss approaches for buildings, Reliabil.Eng. Syst. Safe., 202, 106971, https://doi.org/10.1016/j.ress.2020.106971, 2020.
Paprotny, D., Kreibich, H., Morales-Nápoles, O., Wagenaar, D., Castellarin, A., Carisi, F., Bertin, X., Merz, B., and Schröter, K.: A probabilistic approach to estimating residential losses from different flood types, Nat. Hazards, 105, 2569–2601, https://doi.org/10.1007/s11069-020-04413-x, 2021.
Plomaritis, T. A., Ferreira, O., and Costas, S.: Validation of a Bayesian based Early Warning System for coastal hazards: the Emma storm impact at Faro Beach (South Portugal), in: Coastal Sediments 2019, International Conference on Coastal Sediments 2019, 27–31 May 2019, Tampa/St. Petersburg, Florida, USA, 1447–1459, https://doi.org/10.1142/9789811204487_0126, 2019.
Poljanšek, K., Marin Ferrer, M., De Groeve, T., and Clark, I. (Eds.): Science for disaster risk management 2017: knowing better and losing less, EUR 28034 EN, Publications Office of the European Union, Luxembourg, JRC102482, ISBN 978-92-79-60679-3, https://doi.org/10.2788/842809, 2017.
Rosina, K., Batista e Silva, F., Vizcaino, P., Marín Herrera, M., Freire, S., and Schiavina, M.: Increasing the detail of European land use/cover data by combining heterogeneous data sets, Int. J. Digit. Earth, 13, 602–626, https://doi.org/10.1080/17538947.2018.1550119, 2018.
Sancho-García, A., Guillén, J., Gracia, V., Rodríguez-Gómez, A. C., and Rubio-Nicolás, B.: The Use of News Information Published in Newspapers to Estimate the Impact of Coastal Storms at a Regional Scale, J. Mar. Sci. Eng., 9, 497, https://doi.org/10.3390/jmse9050497, 2021.
Sanuy, M., Duo, E., Jäger, W. S., Ciavola, P., and Jiménez, J. A.: Linking source with consequences of coastal storm impacts for climate change and risk reduction scenarios for Mediterranean sandy beaches, Nat. Hazards Earth Syst. Sci., 18, 1825–1847, https://doi.org/10.5194/nhess-18-1825-2018, 2018.
Schiavina, M., Freire, S., and MacManus, K.: GHS population grid multitemporal (1975–1990–2000–2015), R2019A, European Commission, https://doi.org/10.2905/0C6B9751-A71F-4062-830B-43C9F432370F, 2019.
Schiavina, M., Batista, F., Rosina, K., Ziemba, L., Marin Herrera, M., Craglia, M., Lavalle, C., Kemper, T., and Freire, S.: ENACT-POP R2020A – ENACT 2011 Population Grid, European Commission, https://doi.org/10.2905/BE02937C-5A08-4732-A24A-03E0A48BDCDA, 2020.
Souto Ceccon, P. E., Duo, E., Ciavola, P., Fernandez-Montblanc, T., and Armaroli, C.: Database of extreme events, test cases selection and available data, Deliverable 5.1 – ECFAS Project (GA 101004211), https://www.ecfas.eu/ (2), Zenodo [data set], https://doi.org/10.5281/zenodo.7488643, 2021.
Souto-Ceccon, P. E., Montes-Perez, J., Duo, E., Ciavola, P., Fernandez Montblanc, T., and Armaroli, C.: A European database of resources on coastal storm impacts, Earth Syst. Sci. Data Discuss. [preprint], https://doi.org/10.5194/essd-2024-183, in review, 2024.
Spencer, T., Brooks, S. M., Möller, I., and Evans, B. R.: Where Local Matters: Impacts of a Major North Sea Storm Surge, Eos Trans. AGU, 95, 269–270, https://doi.org/10.1002/2014EO300002, 2014.
Spencer, T., Brooks, S. M., Evans, B. R., Tempest, J. A., and Möller, I.: Southern North Sea storm surge event of 5 December 2013: Water levels, waves and coastal impacts, Earth-Sci. Rev., 146, 120–145, https://doi.org/10.1016/j.earscirev.2015.04.002, 2015.
Talavera, L., del Río, L., and Benavente, J.: UAS-based High-resolution Record of the Response of a Seminatural Sandy Spit to a Severe Storm, J. Coast. Res., 95, 679–683, https://doi.org/10.2112/SI95-132.1, 2020.
Taramelli, A., Righini, M., Valentini, E., Alfieri, L., Gatti, I., and Gabellani, S.: Building-scale flood loss estimation through vulnerability pattern characterization: application to an urban flood in Milan, Italy, Nat. Hazards Earth Syst. Sci., 22, 3543–3569, https://doi.org/10.5194/nhess-22-3543-2022, 2022.
Thieken, A. H., Bessel, T., Kienzler, S., Kreibich, H., Müller, M., Pisi, S., and Schröter, K.: The flood of June 2013 in Germany: how much do we know about its impacts?, Nat. Hazards Earth Syst. Sci., 16, 1519–1540, https://doi.org/10.5194/nhess-16-1519-2016, 2016.
Thomas, K., Hardy, R. D., Lazrus, H., Mendez, M., Orlove, B., Rivera-Collazo, I., Roberts, J. T., Rockman, M., Warner, B. P., and Winthrop, R.: Explaining differential vulnerability to climate change: A social science review, WIREs Clim. Change, 10, e565, https://doi.org/10.1002/wcc.565, 2019.
Van Dongeren, A., Ciavola, P., Martinez, G., Viavattene, C., Bogaard, T., Ferreira, O., Higgins, R., and McCall, R.: Introduction to RISC-KIT: Resilience-increasing strategies for coasts, Coast. Eng., 134, 2–9, https://doi.org/10.1016/j.coastaleng.2017.10.007, 2018.
Van Ginkel, K. C. H., Dottori, F., Alfieri, L., Feyen, L., and Koks, E. E.: Flood risk assessment of the European road network, Nat. Hazards Earth Syst. Sci., 21, 1011–1027, https://doi.org/10.5194/nhess-21-1011-2021, 2021.
Velegrakis A., Chatzistratis. D., Chalazas, T., Armaroli C., Schiavon , E., Konstantina, P., Antigoni, N., and Giorgia, G.: Final report on users' needs and requirements. Regulations vs needs and technical specifications, Deliverable 2.4 – ECFAS Project (GA 101004211), https://ec.europa.eu/research/participants/documents/downloadPublic?documentIds=080166e5fa9eb7a9&appId=PPGM (last access: 24 October 2024), 2022.
Viavattene, C., Micou, A. P., Owen, D., Priest, S., andParker, D.: Library of Coastal Vulnerability Indicators, Guidance Document. Deliverable No: D.2.2 – Coastal Vulnerability Indicator Library, https://eprints.mdx.ac.uk/15199/1/RISC-KIT_D.2.2_CVIL_Guidance_Document.pdf (last access: 18 June 2023), 2015.
Viavattene, C., Jiménez, J. A., Ferreira, O., Priest, S., Owen, D., and McCall, R.: Selecting coastal hotspots to storm impacts at the regional scale: a Coastal Risk Assessment Framework, Coast. Eng., 134, 33–47, https://doi.org/10.1016/j.coastaleng.2017.09.002, 2018.
Vinet, F., Lumbroso, D., Defossez, S., and Boissier, L.: A comparative analysis of the loss of life during two recent floods in France: the sea surge caused by the storm Xynthia and the flash flood in Var, Nat. Hazards, 61, 1179–1201, https://doi.org/10.1007/s11069-011-9975-5, 2012.
Vousdoukas, M. I., Bouziotas, D., Giardino, A., Bouwer, L. M., Mentaschi, L., Voukouvalas, E., and Feyen, L.: Understanding epistemic uncertainty in large-scale coastal flood risk assessment for present and future climates, Nat. Hazards Earth Syst. Sci., 18, 2127–2142, https://doi.org/10.5194/nhess-18-2127-2018, 2018a.
Vousdoukas, M. I., Mentaschi, L., Voukouvalas, E., Bianchi, A., Dottori, F., and Feyen, L.: Climatic and socioeconomic controls of future coastal flood risk in Europe, Nat. Clim. Change, 8, 776–780, https://doi.org/10.1038/s41558-018-0260-4, 2018b.
Vousdoukas, M. I., Voukouvalas, E., Mentaschi, L., Dottori, F., Giardino, A., Bouziotas, D., Bianchi, A., Salamon, P., and Feyen, L.: Developments in Large-Scale Coastal Flood Hazard Mapping, Nat. Hazards Earth Syst. Sci., 16, 1841–1853, https://doi.org/10.5194/nhess-16-1841-2016, 2016.
Wagenaar, D. J., de Bruijn, K. M., Bouwer, L. M., and de Moel, H.: Uncertainty in flood damage estimates and its potential effect on investment decisions, Nat. Hazards Earth Syst. Sci., 16, 1–14, https://doi.org/10.5194/nhess-16-1-2016, 2016.
- Abstract
- Introduction
- Data
- Methods
- Results
- Discussion
- Conclusions
- Appendix A: Datasets
- Appendix B: Macro-classifications defined for buildings and roads
- Appendix C: Additional information on impact to roads
- Appendix D: Overview of the results for each test case
- Appendix E: Impact maps for the reference cases
- Code and data availability
- Author contributions
- Competing interests
- Disclaimer
- Acknowledgements
- Financial support
- Review statement
- References


