the Creative Commons Attribution 4.0 License.
the Creative Commons Attribution 4.0 License.
 | 01 Mar 2024
Seasonal forecasting of local-scale soil moisture droughts with Global BROOK90: a case study of the European drought of 2018
Ivan Vorobevskii
Thi Thanh Luong
Rico Kronenberg
Prolonged deficit of soil moisture can result in significant ecosystem and economical losses. General slowdown of vegetation growth and development, withering of foliage cover, reduction of carbon, nutrients and water cycling, increase of fire and insect outbreaks are just a few examples of soil moisture drought impacts. Thus, an early and timely warning via monitoring and forecast could help to prepare for a drought and manage its consequences.
In this study, a new version of Global BROOK90, an automated framework to simulate water balance at any location, is presented. The new framework integrates seasonal meteorological forecasts (SEAS5 forecasting system) from European Centre for Medium-Range Weather Forecasts (ECMWF). Here we studied how well the framework can predict the soil moisture drought on a local scale. Twelve small European catchments (from 7 to 115 km2) characterized by various geographical conditions were chosen to reconstruct the 2018–2019 period, when a large-scale prolonged drought was observed in Europe. Setting the ERA5-forced soil moisture simulations as a reference, we analysed how the lead time of the SEAS5 hindcasts influences the quality of the soil moisture predictions under drought and non-drought conditions.
It was found that the hindcasted soil moisture fits well with the reference model runs only within the first (in some cases until the second and third) month of lead time. Afterwards, significant deviations up to 50 % of soil water volume were found. Furthermore, within the drought period the SEAS5 hindcast forcings resulted in overestimation of the soil moisture for most of the catchment, indicating an earlier end of a drought period. Finally, it was shown that application of the probabilistic forecast using the ensembles' quantiles to account for the uncertainty of the meteorological input is reasonable only for a lead time of up to 3 months.
- Article
(11516 KB) - Full-text XML
- BibTeX
- EndNote


Drought is a complex, multifactorial phenomenon that includes climate, water resources and socioeconomic factors, and impacts a community in the short term as well as the long term (Crausbay et al., 2017; Grillakis, 2019; Mueller and Zhang, 2016; Sheffield et al., 2012; Wanders et al., 2014). In the past two decades Europe has experienced a series of dry summers with significant impacts: in 2003 (Fischer et al., 2007; Schär and Jendritzky, 2004), 2010 (Barriopedro et al., 2011), 2015 (Moravec et al., 2021; Van Lanen et al., 2016) and 2018–2020 (Moravec et al., 2021; Peters et al., 2020; Rakovec et al., 2022). The European Commission reported EUR 9 billion in annual monetary losses in 2018–2019 across Europe due to drought in the current situation. The amount is expected to increase to EUR 65 billion by the end of the 21st century for the worst climate change scenario (Naumann et al., 2021). Among commonly accepted drought types, the soil drought typically causes most of the damages for agriculture, forestry and ecosystems in general (Mishra and Singh, 2010; Sutanto et al., 2019; Zink et al., 2016). Although significant efforts are being made to develop drought monitoring and forecasting systems, the ability to forecast droughts is limited due to the inherent uncertainties of long-term weather forecasts (Sutanto and Van Lanen, 2022; Wanders and Van Lanen, 2015). Therefore, often multiple multi-year droughts are rarely mentioned in seasonal forecasts and only reported “post factum” in observations, reports and reconstructions (Boeing et al., 2022; Boergens et al., 2020; Rakovec et al., 2022). Hence, accurate monitoring and seasonal forecasting of drought is beneficial for the development of early prevention, mitigation and management strategies.
Recently, with the improvement of computing infrastructure and capacity, the use of probability-based seasonal weather forecasts driven by numerical weather prediction models has become more popular and advanced (Samaniego et al., 2019). This has led to the development of drought warning systems at various spatial and temporal scales (Wanders et al., 2019). Several operational monitoring and forecasting systems exist on continental, national and regional scales. These systems are principally based on rainfall, temperature and hydrological gridded observed and modelled data (Otkin et al., 2018; Sheffield et al., 2012), although new approaches, such as DroughtCast (Brust et al., 2021), implementing machine learning algorithms, have also been attempted. For the United States, a real-time drought monitoring system provides information on current, short- (up to 8 weeks) and long-term (3.5 months) predicted drought conditions in 0.12° spatial resolution (Lorenz et al., 2017; Svoboda et al., 2002). It uses a combination of precipitation anomalies, evaporative stress index as well as soil moisture tendencies on three levels and the input of regional and local experts. The African Flood and Drought Monitor (0.25° resolution with daily updates) was developed for monitoring purposes and provides a set of drought indices such as the standardized precipitation index (SPI), various soil moisture and vegetation indices, and streamflow percentiles and deficit (Sheffield et al., 2014). The Swiss monitoring and forecasting system shows state(canton)-based current precipitation and soil moisture deficit levels as well as gives a 5 and 30 d forecast (Zappa et al., 2014). The German drought monitor (Zink et al., 2016) provides daily drought information for topsoil and full soil columns based on soil moisture anomalies on a 5 km grid scale. The European Drought Observatory provides up-to-date information on the occurrence and severity of droughts across Europe with 5 km resolution based on a combination of the SPI, the soil moisture anomaly index and vegetation greenness (Cammalleri et al., 2021), as well as basic forecasts based on the SPI (Wanders et al., 2019). Finally, the European Flood Awareness System's (EFAS) forecasts produced with the LISFLOOD model and based on SEAS5 forcing (Thielen et al., 2009) provides soil moisture forecasts for three standard soil layers on a 5 km grid and for a 24 h time step (Joint Research Centre (European Commission) et al., 2019). However, the major drawbacks of the most advanced existing frameworks is their inability to reach local scale for the current and predicted conditions of soil moisture.
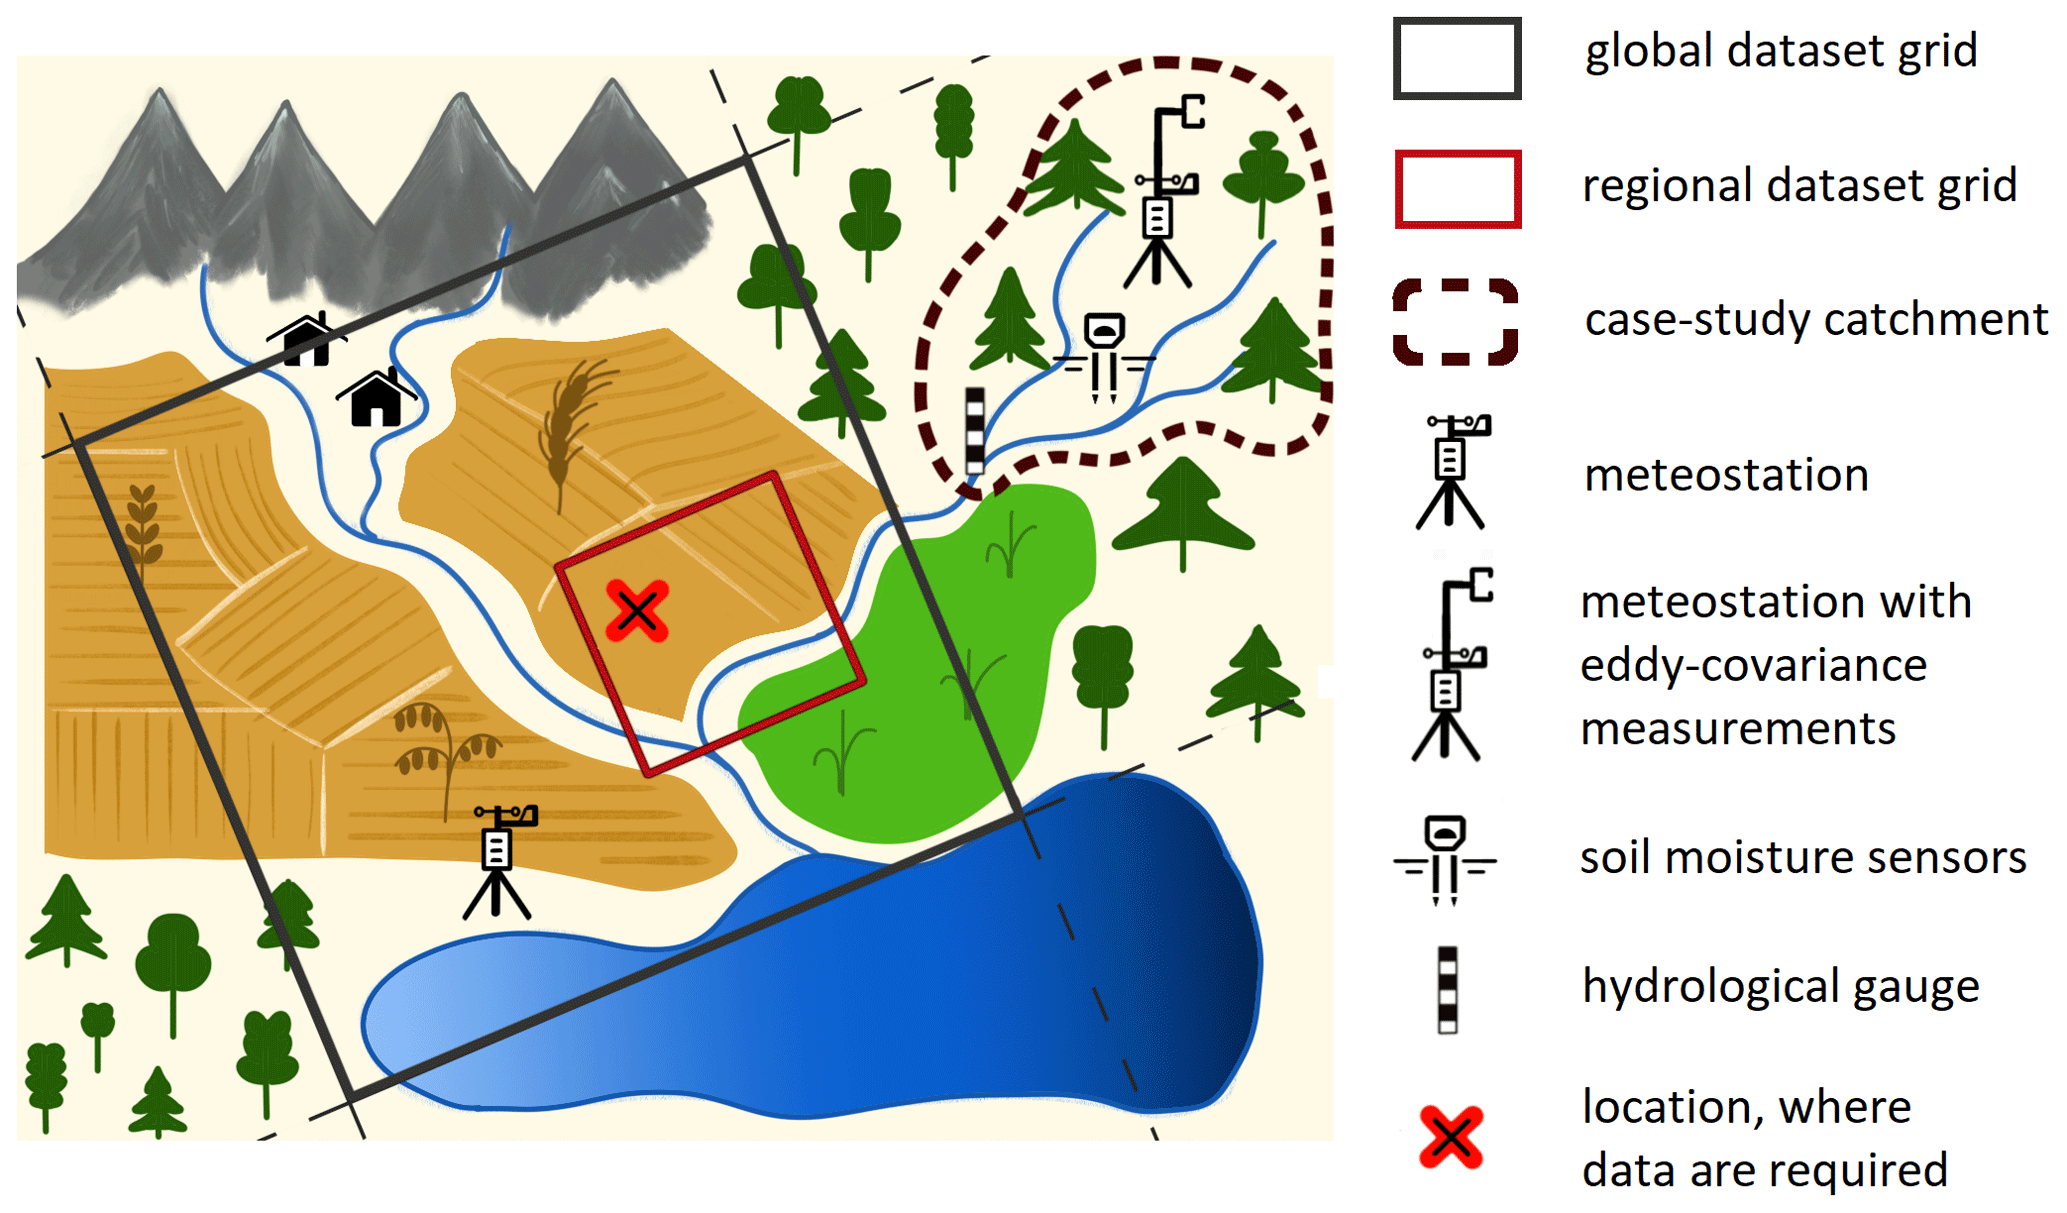
Tackling the problem of achieving high resolution in monitoring and forecasting water balance components in general and soil moisture in particular is an ongoing process. The local scale plays a special role (Fig. 1), since this is often the scale where the final decisions are made, measures are implemented and management is taking place (European Commission, 2015; Suárez-Almiñana et al., 2017; Wagner et al., 2009). Although there are several global and national datasets, which could be used for monitoring purposes, data quality and resolution often do not correspond to the local requirements. So far, the grid size for the state of the art up-to-date global reanalysis varies in a range of 10–50 km (Gelaro et al., 2017; Ebita et al., 2011; Martens et al., 2020) and regional models can reach 1–5 km (Zink et al., 2017). Therefore, the local scale is not, and in the nearest future probably will not be, considered for global or regional models (Beven and Cloke, 2012; Sood and Smakhtin, 2015; Wood et al., 2011). Finally, even in the presence of a dense network of long-term measurements, it is highly improbable that the data of all observed variables will be available or transferable and thus representative for the desired location.
In 2020, a first version of a fully automated framework to simulate water balance in general, and soil moisture in particular on a local scale at any desired location with historical meteorological data called Global BROOK90, was released (Vorobevskii et al., 2020). The framework has thereafter been validated using runoff and evaporation components (Vorobevskii et al., 2021, 2022). Here we want to present an updated version of the framework, which integrates SEAS5 seasonal forecasts from the European Centre for Medium-Range Weather Forecasts (ECMWF) and thus allows long-term forecasts of the local water balance. Taking the European drought of 2018–2019 as a case study, we attempted to hindcast soil moisture conditions during this period on a local scale for several catchments located within different geographical conditions. We compared simulations forced with reanalysis and forecast meteorological datasets to answer the following questions:
-
How accurate are the local seasonal soil moisture estimates derived from Global BROOK90 framework using long-term meteorological forecasts under drought conditions of the years 2018 and 2019 for European catchments?
-
How does the lead time of the meteorological forecast affect soil moisture predictions on a local scale in a normal state and under drought conditions, as well as for different landscapes?
-
Does the usage of ensemble quantiles advance drought prediction compared with the ensemble mean?
Global BROOK90 v 2.0
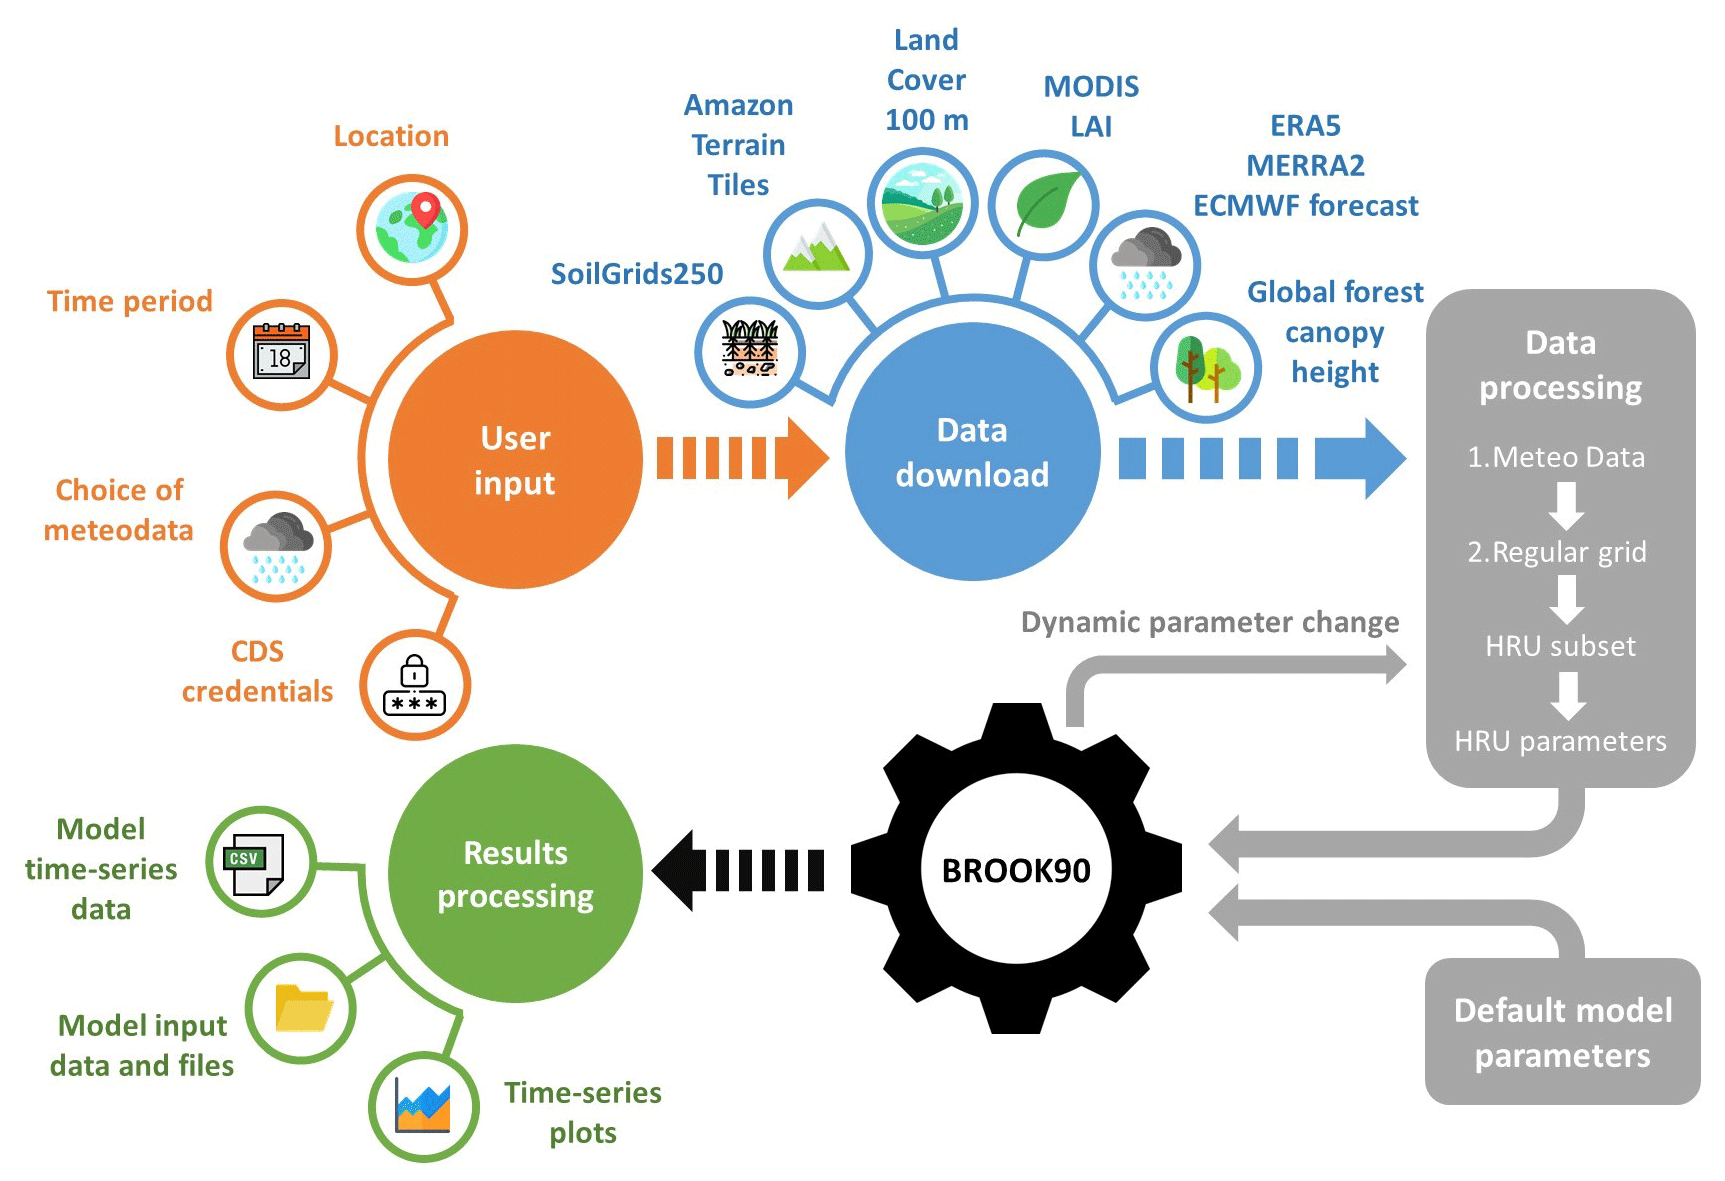
The first version of Global BROOK90 framework was introduced in 2020 (Vorobevskii et al., 2020) and the new updated version was released in 2023 and is applied here to simulate soil moisture. The framework uses open-source global datasets to parameterize and force the water balance model into a fully automatic mode based on the input location and time interval. As these input datasets are covering almost the entire terrestrial earth, the framework is applicable all over the globe, including ungauged locations, which was one of the main goals of its development. The framework was tested for a variety of different geographical conditions (Vorobevskii et al., 2021).
The following datasets are incorporated to describe the characteristics of the location: for the canopy, identification and parameterization Copernicus Global land Cover 100 m (Buchhorn et al., 2020), MOD15A2H MODIS Leaf Area Index/FPAR 8-Day L4 Global (Myneni et al., 2021) and Global Forest Canopy Height (Potapov et al., 2021) are used. The SoilGrids250 dataset (Hengl et al., 2017) provides global information on soil properties (texture, depth to the bedrock, stone content, etc.) for seven standard layers. The digital elevation model is downloaded from the Mapzen Terrain Tiles (Larrick et al., 2020).
For meteorological forcing, reanalysis and forecast datasets are implemented. Historical runs could be performed with ERA5 (Copernicus Climate Change Service Information, 2018a) and MERRA-2 (Gelaro et al., 2017). ERA5 provides hourly temporal and 0.25° spatial resolution data and covers the time period starting from 1959, while MERRA-2 has a 0.5°×0.625° grid with 6 h time slices and starts from 1980. For seasonal forecasting the SEAS5 data from ECMWF (Copernicus Climate Change Service Information, 2018b) is integrated. It implements a 51-member ensemble meteorological forecast for 215 d on a 1° grid with daily temporal resolution and is released on the fifth day of each month. The dataset is also available in a hindcast mode starting from 1993. For the bias correction of the forecast, empirical quantile mapping on a monthly basis (Boé et al., 2007) is applied. The bias is calculated between each hindcast ensemble mean and reanalysis data on a monthly scale and then averaged for each calendar month and lead time. Thereafter, the resulting bias is used to correct the forecast. As the temporal resolutions of the datasets are not the same, which might be of importance when sub-daily precipitation dynamics play a significant role in water redistribution in the system, an additional remark is needed: BROOK90 itself runs with a variable number of iterations per day, which is automatically determined and dictated by the equilibrium of the water balance equation inside the model system. The minimum iteration number is two, or in case of a precipitation event, it equals the resolution of the meteorological data input. However, under some conditions (e.g. heavy rain, drought or complex soil profile) this number could be as high as 1000, independent from the input data resolution. Nevertheless, the model output is always of daily resolution. However, the BROOK90 allows us to account for the problem of sub-daily precipitation absence (SEAS5 case) to create hourly data using daily precipitation input and monthly values of mean event duration in hours (DURATN parameter). It is then calculated from the available ERA5 hourly data and applied to the forecast forcing to improve the results. Finally, Global BROOK90 allows combining historical and forecast simulations if the continuous timeline is preserved.
This framework is based on the BROOK90 model (Federer et al., 2003) which is a one-dimensional physically based model for the vertical water fluxes simulations in soil–plant–atmosphere systems. At first, the precipitation input goes through the canopy, where it could be either intercepted (and then evaporated) or passed through to the ground surface. Then, the portion reaching the ground level could be infiltrated, frozen, evaporated, converted to surface flow, percolated or stored as soil moisture. The infiltrated volume is distributed between soil layers to macropore bypass and matrix flow using a “top-down” approach. Soil water movement in the model is based on the approximations of the Richard's equation (Richards, 1931), where the functional relationships between the main soil parameters (soil–water content, matric potential and hydraulic conductivity) are estimated using the Clapp and Hornberger parameterization (Clapp and Hornberger, 1978). The soil column has groundwater, seepage and downslope outflow. Finally, soil water storage is used for evaporation from the top layers and root uptake for transpiration.
The scheme of the framework is presented on Fig. 2. It applies a regular 50×50 m grid to identify hydro response units (HRUs) based on the downloaded characteristics of the input catchment. The model is then applied separately to each HRU and then an area-weighted mean for each variable is calculated from HRU output data. A more detailed description of the framework is presented in Vorobevskii et al. (2020).
By means of an automatic workflow of all processes, the framework serves both professional and non-professional users. Furthermore, as it is designed for a local scale, it does not require substantial resources regarding computational power, time and memory. For example, a 7-month water balance forecast for a small catchment is required. For a test case we can use a 4.6 km2 catchment with 24 HRUs (Wernersbach Creek near Tharandt in Saxony, Germany) provided with the Global BROOK90 framework on GitHub. It takes around 5–10 min to download elevation, land cover and soil data. Depending on the requested length and type of meteorological data, the download time can vary from half an hour to a few days due to system build-up of meteorological data providers. For instance, download of 1 year of ERA5 data for the model warm-up and 7 months of SEAS5 forecasts without hindcasts for bias correction lasted 7 h (6 h of which were needed for the forecast request). Finally, computational time, including data processing, modelling and saving the results on a 3.4 GHz 16 GB RAM PC, lasted approximately 30 min, of which the time needed to forecast one HRU with the abovementioned time interval was 1.5 min.
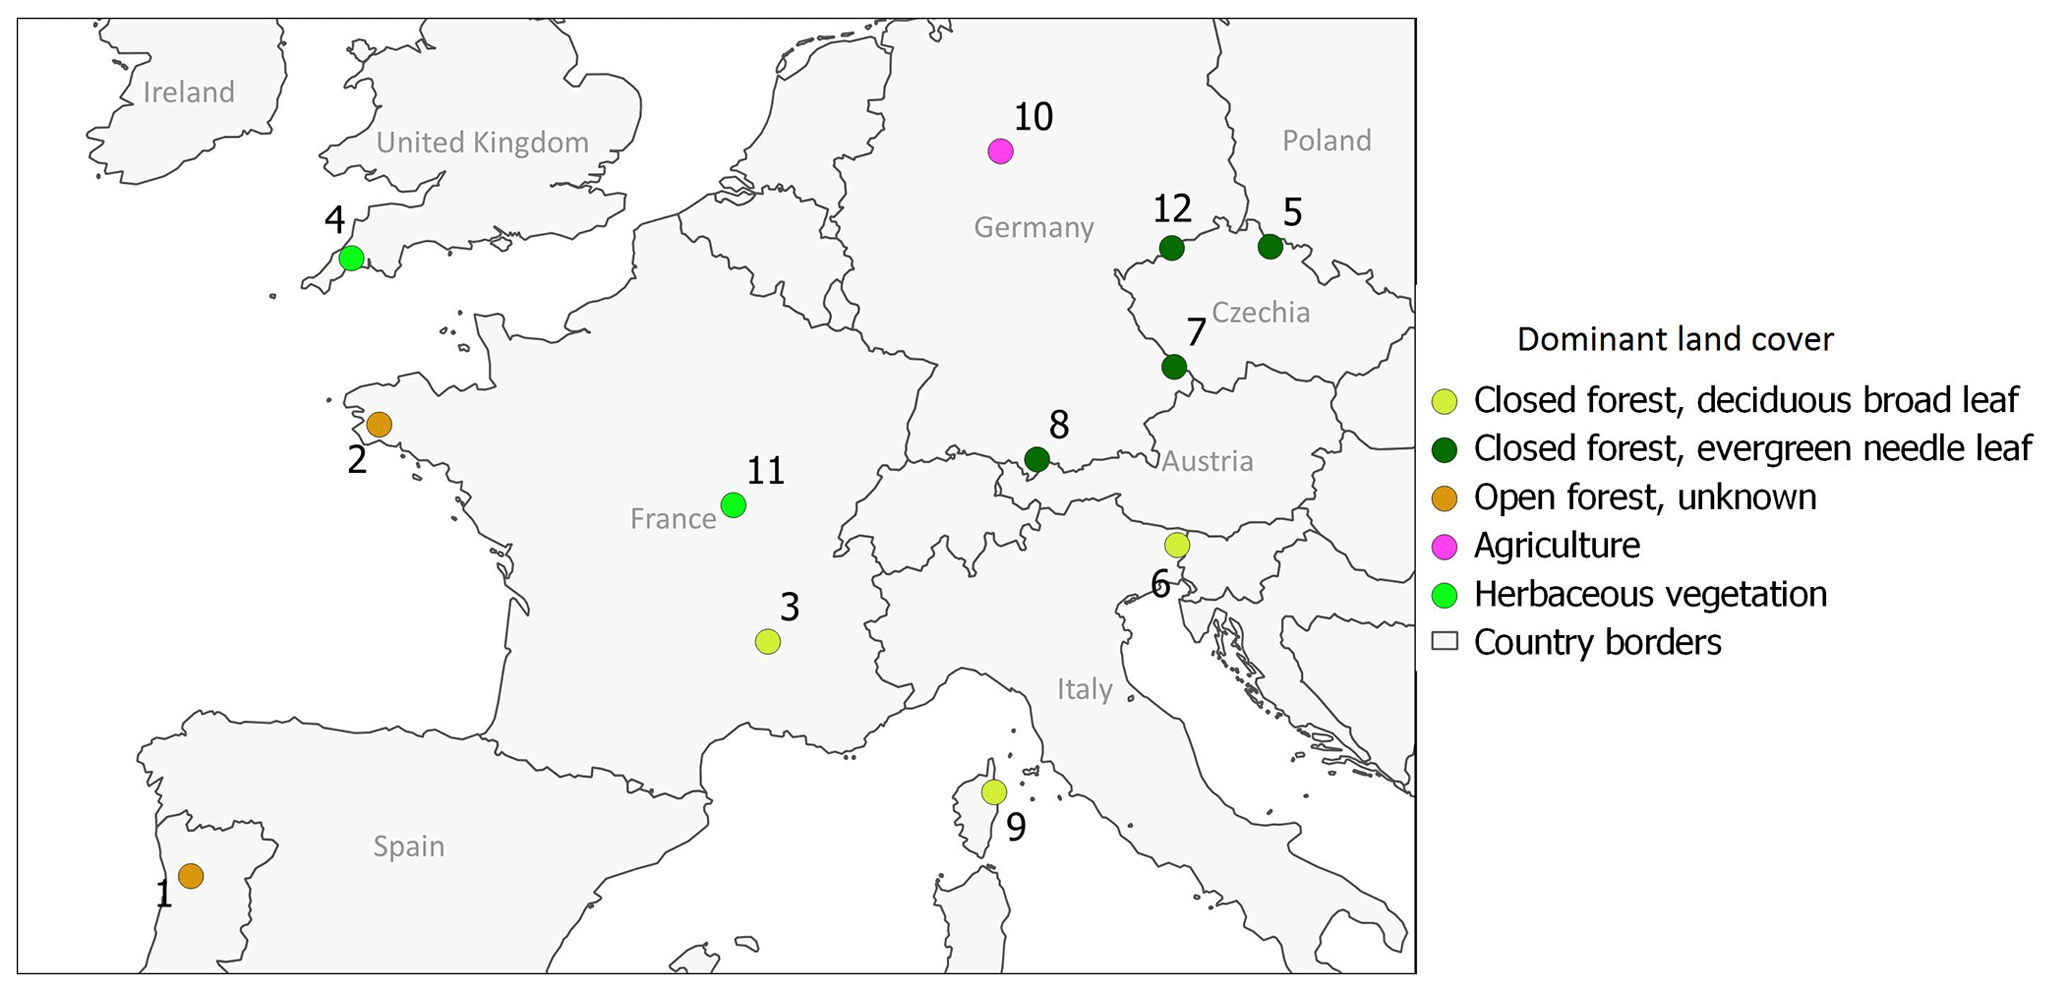
Figure 3Overview on the 12 selected European catchments.
3.1 Spatiotemporal extent of the soil moisture simulations
For the assessment of the soil moisture forecast with Global BROOK90 the time period of 2017–2020 was chosen. The choice of the time period was determined by the extent of the drought event including pre- and post-conditions. Thus, 2 years with “normal” (2017 and 2020) and two with “drought” (2018–2019) conditions were considered to investigate the difference in forecasting accuracy for two hydrological conditions. According to ECMWF technical documentation, the version of the forecast system (SEAS5) used was operationally launched in 2017. It is advised to use the hindcast data (available from 1991)for forecast bias correction purposes only, since the ensemble number is significantly reduced in comparison with the operational dataset. SEAS5 hindcasts with 51 ensemble members on a daily scale and 7 months of lead time were applied for each month starting from July 2016 up to December 2020, so that for each month during 2017–2020 all possible lead times (1–7 months) will appear. All forecasts were bias corrected using hourly ERA5 data and the whole available length of hindcasts. Additionally, for all model runs 1 warm-up year was included. In cases of a simulation with hindcast, corresponding ERA5 data were attached. Model input files and row simulation results with standard daily resolution output are available in the Supplement (Vorobevskii, 2023b).
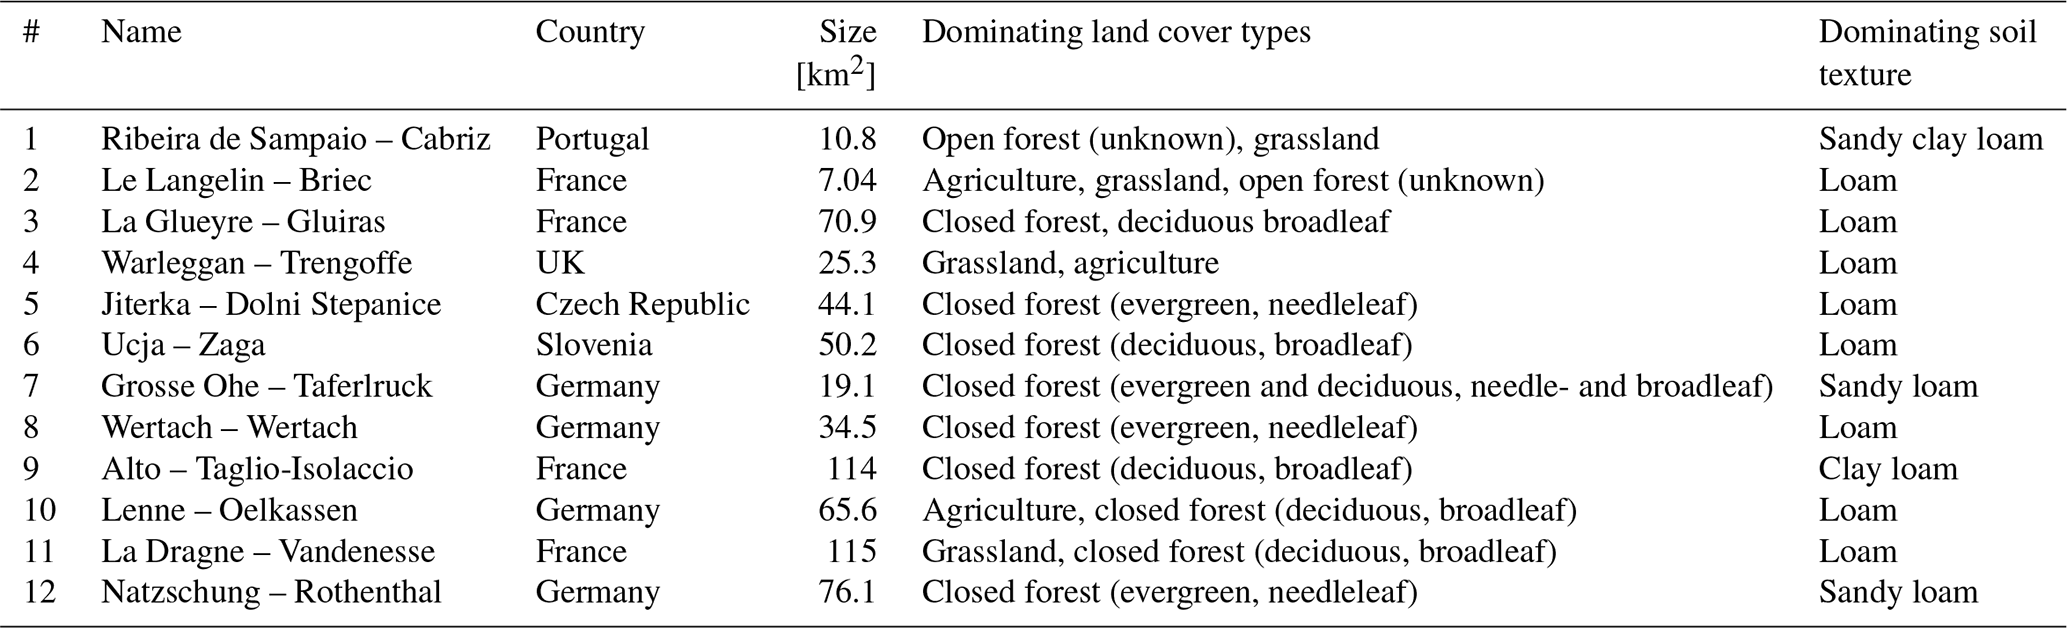
Simulations were conducted in 12 small European catchments in total (Fig. 3; Table 1). The focus of the study was intentionally put on predicting soil moisture in dry conditions since they are typically hard to forecast. The pilot catchments were chosen in such a way that they are distributed over Europe, ideally covered different geographical conditions and showed a good discharge validation skill score, thus potentially giving reliable estimations of soil moisture with regard to site-specific parameterization. Chosen catchments range from 7 to 115 km2 (average size 52 km2). They are covered with three different forest types (opened and closed, deciduous and evergreen, needle- and broadleaf), two short canopy types (grassland and crops) and have various soil textures. Available open-source satellite images and maps do not show significant signs of urbanization (maximum values of 5 % were identified for a few catchments) or hydraulic structures (except artificial channels in cultivated areas) which could noticeably influence a natural flow regime. Although numerous reports and research data of the 2018–2019 drought are available, evaluations of the drought spatial extension in 2018–2019 over Europe differ significantly (Boergens et al., 2020; Buras et al., 2020; Hari et al., 2020; JRC European Drought Observatory, 2018, 2019). However, the majority of the selected locations appear within the commonly identified territories that were affected by the drought. The Kling–Gupta efficiency (KGE) values for a daily scale discharge validation for the selected catchments (Vorobevskii et al., 2021) varies between 0.43 and 0.77 (with a mean of 0.57) for the evaluation time period of 30–42 years (with a mean of 38 years).
3.2 Validation of the simulated soil moisture
3.2.1 Validation of ERA5-forced simulations against SMAP pseudo-observations
With the absence of available data of on-site soil moisture measurements, satellite-based products were chosen for the validation. To benchmark the soil moisture simulations from Global BROOK90, the SMAP L4 Global 3-hourly 9 km EASE-Grid Surface and Root Zone Soil Moisture Geophysical Data V007 (Reichle et al., 2021) was used. The product uses L-band brightness temperature data from satellites assimilated into a land surface model to estimate soil moisture on a 9 km spatial and 3 h temporal scale globally from April 2015. The soil moisture is provided for the topsoil (0–5 cm), root zone (0–100 cm) and the full soil column (up to the model bedrock; e.g. 1.3–3.8 m for the study catchments depending on specific location with a mean of 1.9 m) according to product description (Reichle et al., 2021).
For the validation, the catchment-weighted mean of soil moisture simulated with ERA5 meteorological forcing was taken. As the thickness of standard soil layers in Global BROOK90 (dictated by SoilGrids250 dataset) does not provide a full match with the SMAP layout, it was decided to use the closest values of 0–2.5 cm for topsoil, 0–80 cm for root zone and 2 m for the whole soil profile. Since the area of one SMAP grid (81 km2) corresponds well with the sizes of the chosen catchments, the closest to the catchment centre grid was selected. Kling–Gupta efficiency (Gupta et al., 2009) was chosen to show the agreement of volumetric water content from SMAP and Global BROOK90 on a monthly scale.
3.2.2 Validation of SEAS5-forced against ERA5-forced simulations
As Global BROOK90 initially provides soil moisture estimates applying ERA5 reanalysis as a forcing, it is reasonable to show the added value of forecasted (with SEAS5 forcing) soil moisture with regard to ERA5, since both datasets come from the same assimilation model. Daily and monthly catchment-weighted means, as well as HRU-based absolute values (millimetres per layer), were used to compare soil moisture simulations using reanalysis and forecast forcings. For the calculation of the differences between the two forcings, monthly means from the 51 forecast ensemble runs were considered. Relative errors were calculated as the absolute error divided by the mean soil moisture of the specific catchment to account for differences in site-specific soil moisture conditions between the catchments. Furthermore, the results for topsoil (0–45 cm) and full soil column (up to 200 cm) were analysed separately. Drought periods were identified based on the root extractable water coefficient (Eq. 1):
where Θ is volumetric soil moisture at different states, C is current value at present conditions, WP is wilting point (−1500 kPa), and FC is field capacity. This coefficient is calculated along with soil moisture values on a daily scale in Global BROOK90 and is presented in the output. Various researchers state that the values of REW below 0.2–0.4 indicate the beginning of water stress for vegetation (Bréda et al., 2006; Granier et al., 1999; Schmidt-Walter et al., 2019; Vilhar, 2016). Here, we have chosen a threshold of 0.3 to mark drought conditions.
4.1 Comparison of SMAP and ERA5-forced soil moisture
Summarized performance of Global BROOK90 with regard to SMAP data for the study catchments is shown in Fig. 4. The performance of the soil moisture simulations in the upper zone of 5 cm (which in SMAP is directly assimilated from satellite data) was found to be better than for the root zone and for the full profile (which in SMAP includes land surface model derivatives). The mean KGE value for the topsoil was 0.53, the lowest value of 0.27 was found for the catchment 8 and the highest value of 0.82 for the catchment 11. All catchments showed high correlation coefficients with a mean KGE of 0.88. However, both Global BROOK90 underestimated the mean (mean bias 0.82) as well as the variance (mean variance ratio 0.66) in comparison with SMAP, except for two catchments. This could be partly explained by different framework setups, namely differences in the models themselves as well as underlying datasets used to derive soil properties. With an increase in the soil depth, the agreement between two datasets decreased, leading to mean KGE values of 0.48 for the root zone and 0.34 for the full column. This is mainly due to a decrease in correlation and variance ratio.
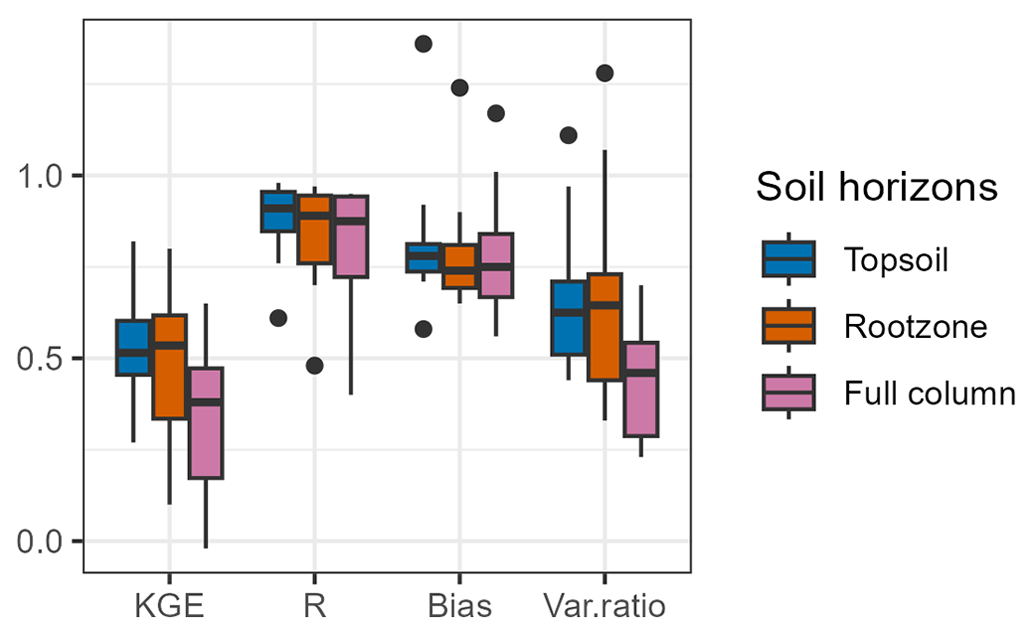
Figure 4Kling–Gupta efficiency and its components between SMAP and Global BROOK90P monthly soil moisture (2017–2021) for 12 catchments.
Overall, the best performance was achieved for the short canopies (cultivated and herbaceous land covers), where the satellite signal could penetrate deeper through the vegetation into the soil (Babaeian et al., 2019). Thus, it is not evident that Global BROOK90 simulations in tall canopies have worse performance, but rather that the uncertainty of SMAP data is much higher for these land covers.
4.2 Drought monitoring and forecasting on a local scale
Several snapshots of spatial soil water deficit for 2018 in the Natzschung catchment (12 in Fig. 1) are shown in Fig. 5 to present the advantages of drought monitoring with Global BROOK90 on a local scale. In January, the soil is close to saturation (REW values 0.7–0.8 for topsoil and 0.9–1 for full column). Exceptions are the few HRUs with urban areas, where the highly sealed surfaces lead to blockage of moisture renewal. Six months later in June, when meteorological and hydrological droughts were already clearly noticeable, amounts of the soil water were reduced by around 40 % but remained on a plant-demand level. Cultivated territories in the catchment are mainly planted with wheat, barley, oil fruits, silage maize and rye. As these cultures have a shallow effective root penetration, topsoil moisture (where REW values were between 0.4 and 0.6) plays a greater role than deeper horizons. The predominant forest species in the catchment is Norway Spruce, which also quite often has a shallow rooting system and the majority of the root mass is concentrated in the upper soil layers (Puhe, 2003). Thus, it could have already experienced some water stress by June as REW values in topsoil reached 0.2–0.4. On 15 October, the minimum soil water content was observed. The upper 45 cm of soil was almost completely dry, while deeper horizons under the croplands, beech and opened forests still contained plant-available soil moisture (although not accessible to the crops due to root depth). As November and December brought new precipitation, the soil gained enough moisture for plant water supply (REW values 0.4–0.8 for topsoil and 0.5–1 for full column). Recovery of soil moisture under the tall canopies was not as noticeable as under the short ones. This can be explained with the harvesting of cultivated areas and withering on grasslands. Thus, almost no soil moisture was used for transpiration, which is typically the most consumable part of water balance in this climate. Moreover, the general prevailing drought conditions under the forest sites in comparison with short canopies most probably resulted from much higher transpiration rates of the spruce stand. Thus, a faster depletion of soil water content is observed there.
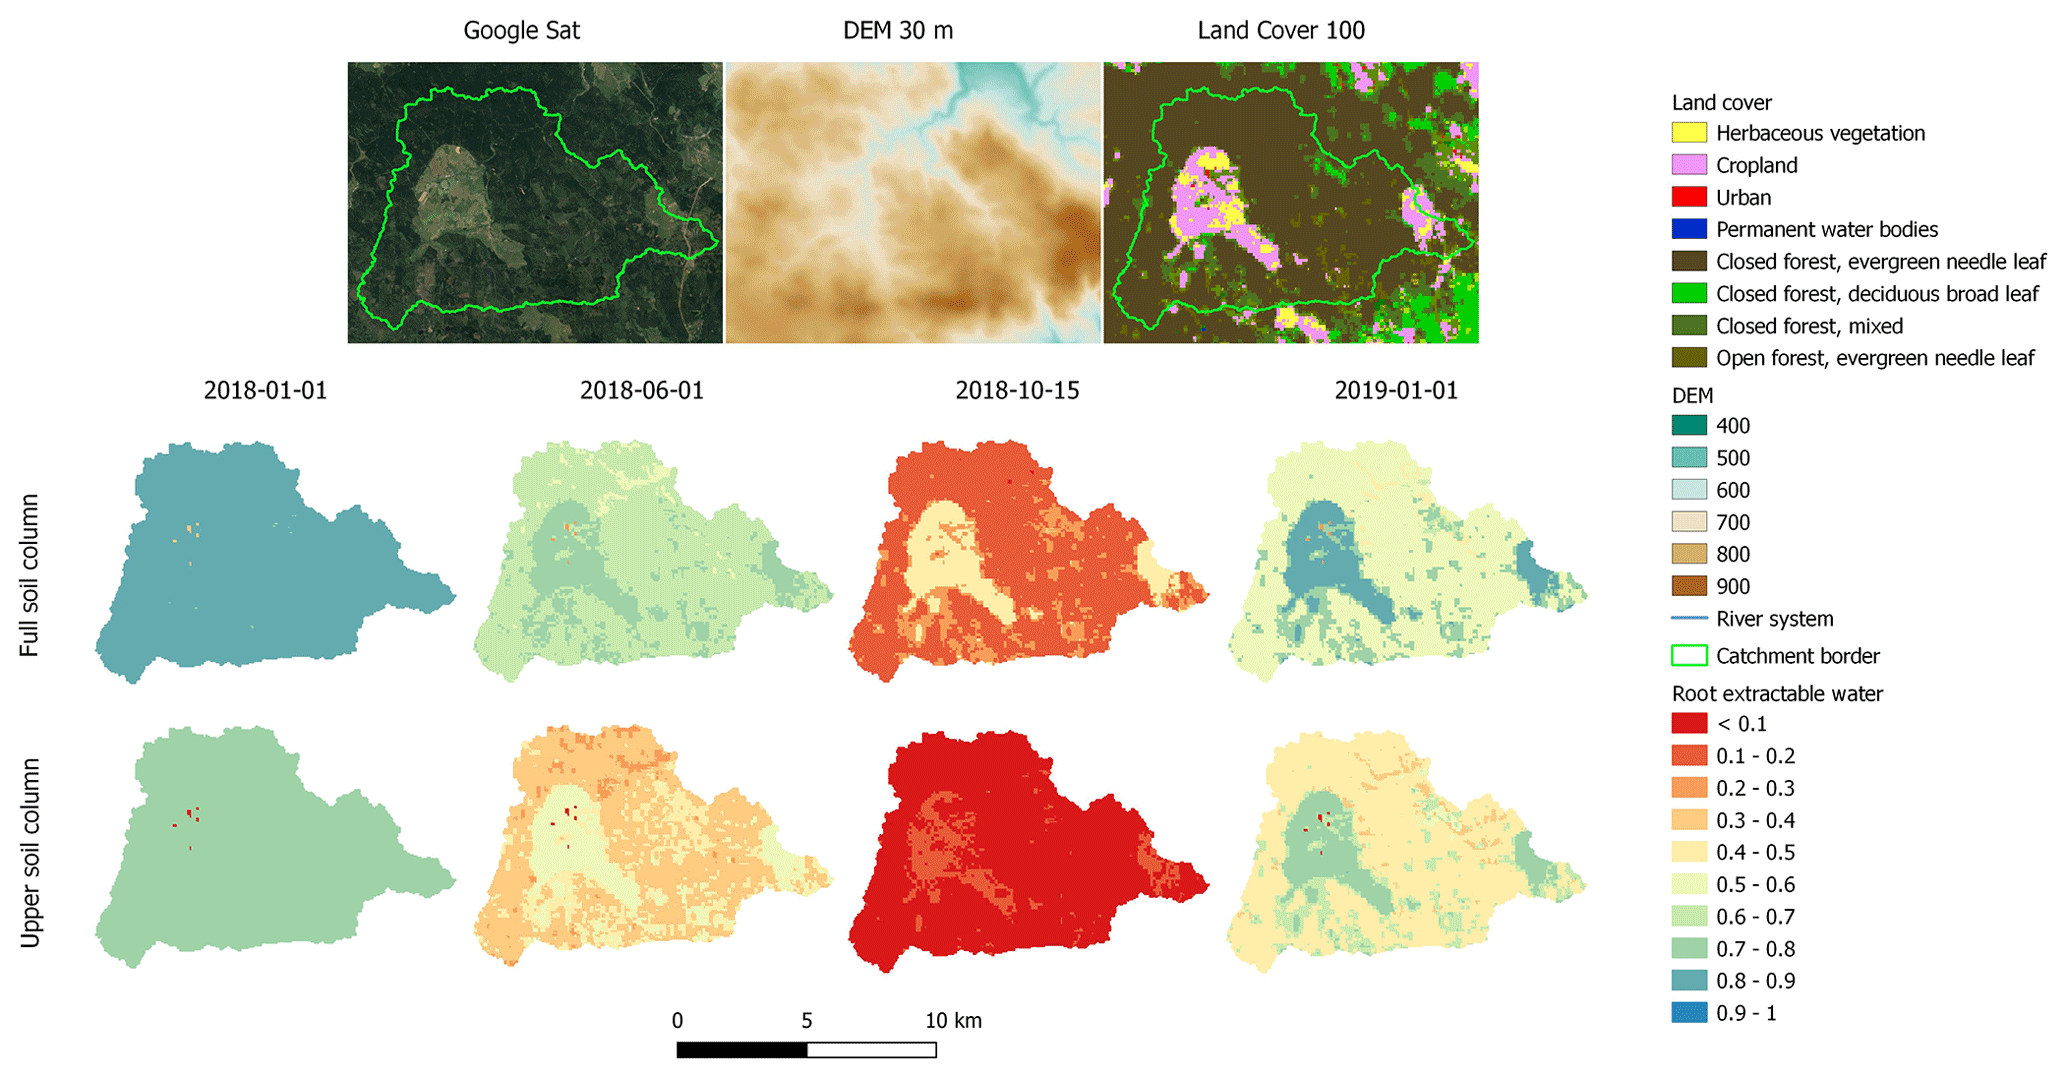
Figure 5Beginning, propagation and recovery of the 2018 drought on HRU scale in the Natzschung catchment for the root zone (0.45 m) and full soil column (up to 2 m). Reference to satellite imagery: Imagery 2023 TerraMetrica, Map Data 2023, GeoBasis-DE/BKG 2009. Reference to elevation model: NASA Shuttle Radar Topography Mission Global 1 arcsec, 2023. Reference to land cover map: Copernicus Global Land Service, Land Cover 100 m, collection 3.
The SEAS5 data used as a forcing in Global BROOK90 allows getting daily ensemble predictions of soil moisture with a lead time of 7 months and monthly updates. Figure 6 shows three different hindcast-forced soil moisture simulations for the Natzschung catchment. The start of each hindcast is indicated with a red dot, ensemble mean is shown with red colour and single ensemble runs with grey colour. In the pre-drought winter period of 2017–2018, the September hindcast ensemble mean showed approximately 10 %–15 % underestimation of water content compared with ERA5 forcing until February. In fact, this is rather a 1–1.5 month lag due to delayed prediction of the rainy season, since the slope of the growing moisture curve as well as the saturation-plateau values look consistent between both forcings. In May 2018, when the soil moisture decline was clear according to ERA5 data, the hindcast demonstrated even a steeper depletion of water content in the first 3 months; thereafter, however, it quickly flattened out and soil moisture refill began due to significant precipitation input. Thus, SEAS5 forcing not only predicted the drought recovery point 2 months earlier and severely overestimated soil water content by more than 25 %. Finally, a hindcast started in January 2019 on the upward “recovery” soil moisture curve showed a decent agreement with ERA5 forcing until a new seasonal decline started in April–May marking the beginning of the 2019 drought. For all three presented hindcasts, the ensemble band (especially the lowest members) covers the variability of ERA5 forced soil moisture through all lead times; however, a general overestimation of precipitation for the drought period and its variability in general in the SEAS5 hindcast is clear.
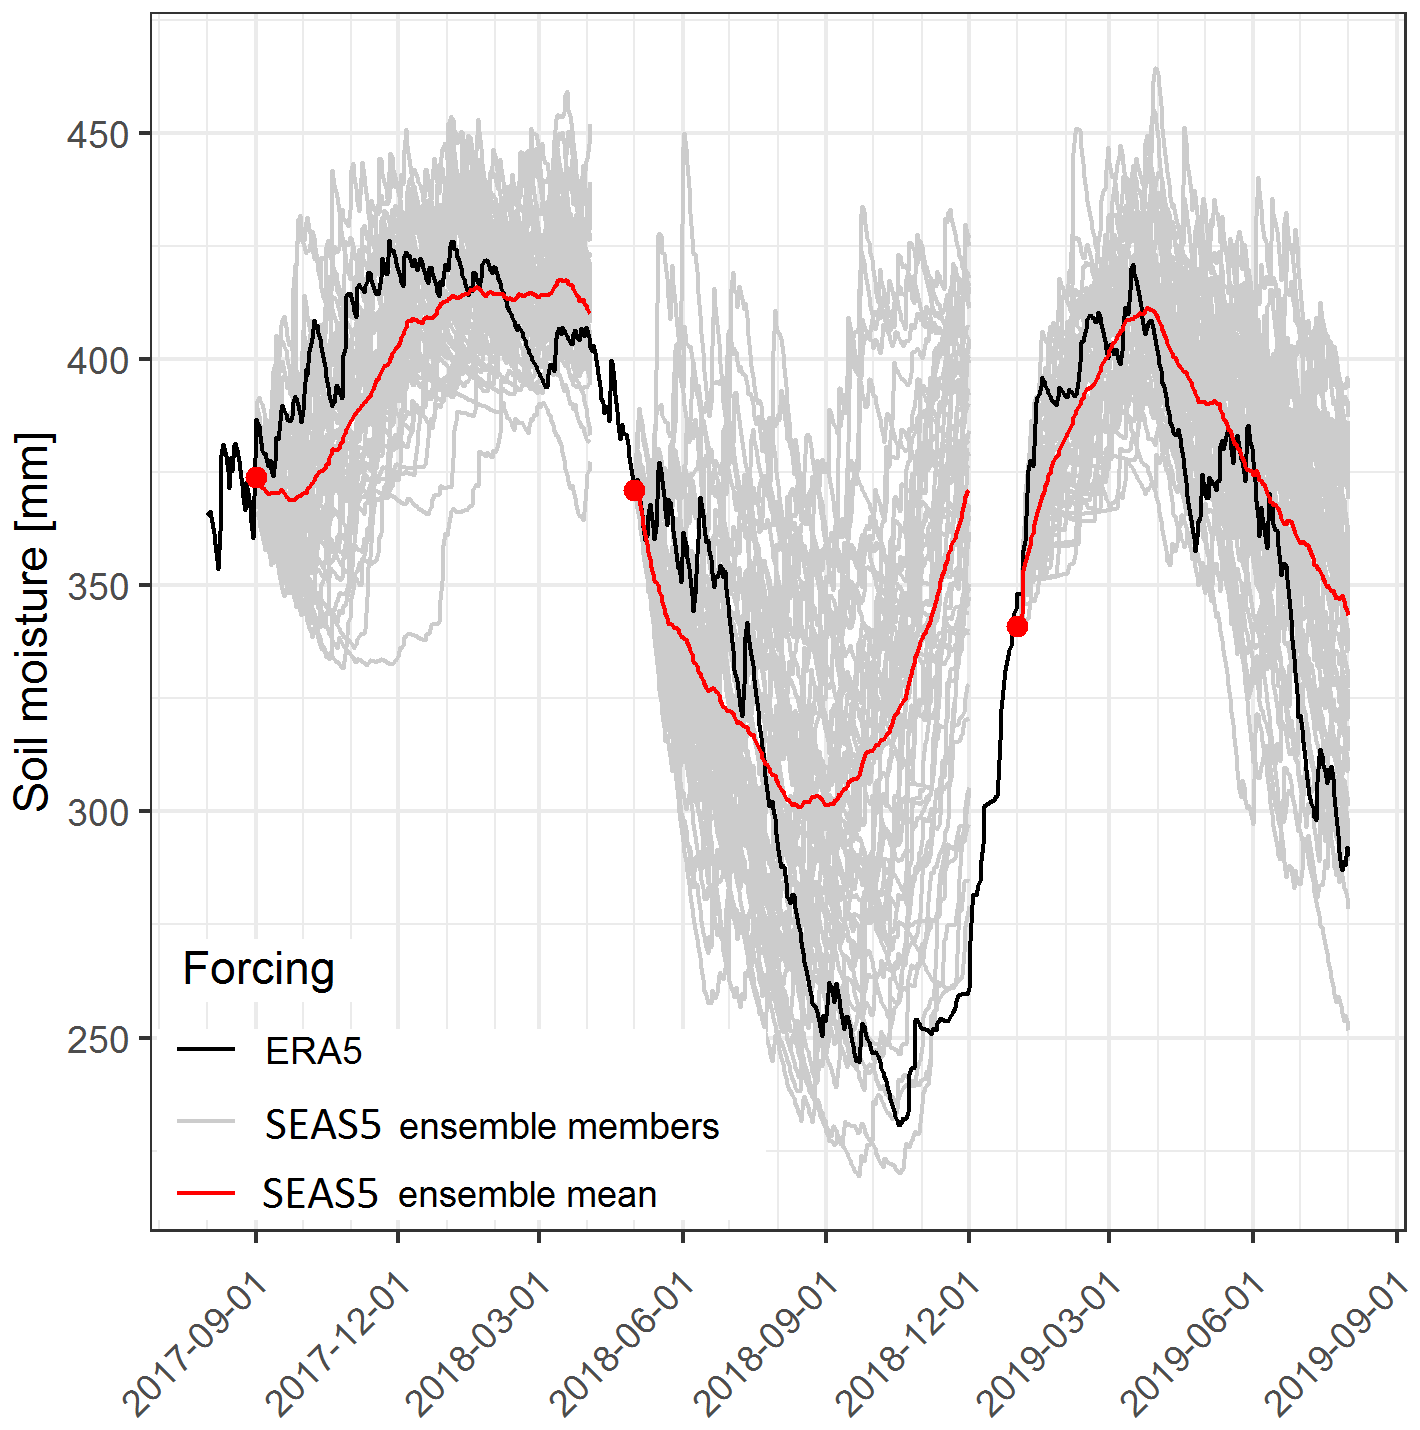
Figure 6Catchment-mean full-column (up to 2 m) soil moisture for the 2018 drought simulated with ERA5 and SEAS5 ensemble hindcast forcings in the Natzschung catchment.
Both land cover and soil texture affect the performance of the soil moisture forecast. Figure 7 reveals that for ERA5 forcing, HRUs with croplands on loams resulted in a higher soil moisture content and lower seasonal variations during the 2018 drought months than forests on sandy soils. This can be explained by, in general, lower evaporation rates from herbaceous vegetation, slower soil water movement and higher holding capacity of loamy soils. However, winter moisture recovery was found to have the same rate for all HRUs. The SEAS5 hindcast started in the beginning of the drought period (July 2018) showed a good agreement within HRUs until the beginning of August, thereafter displaying moisture increase, while according to ERA5 forcing, the drought continued. SEAS5-forced soil moisture content came in line with ERA5-forced data only during the winter recovery time (January–February 2019). The absolute error of the forecast was found to be significantly different for various HRUs. It was lower for croplands ( mm), while for forests it was much higher ( mm).
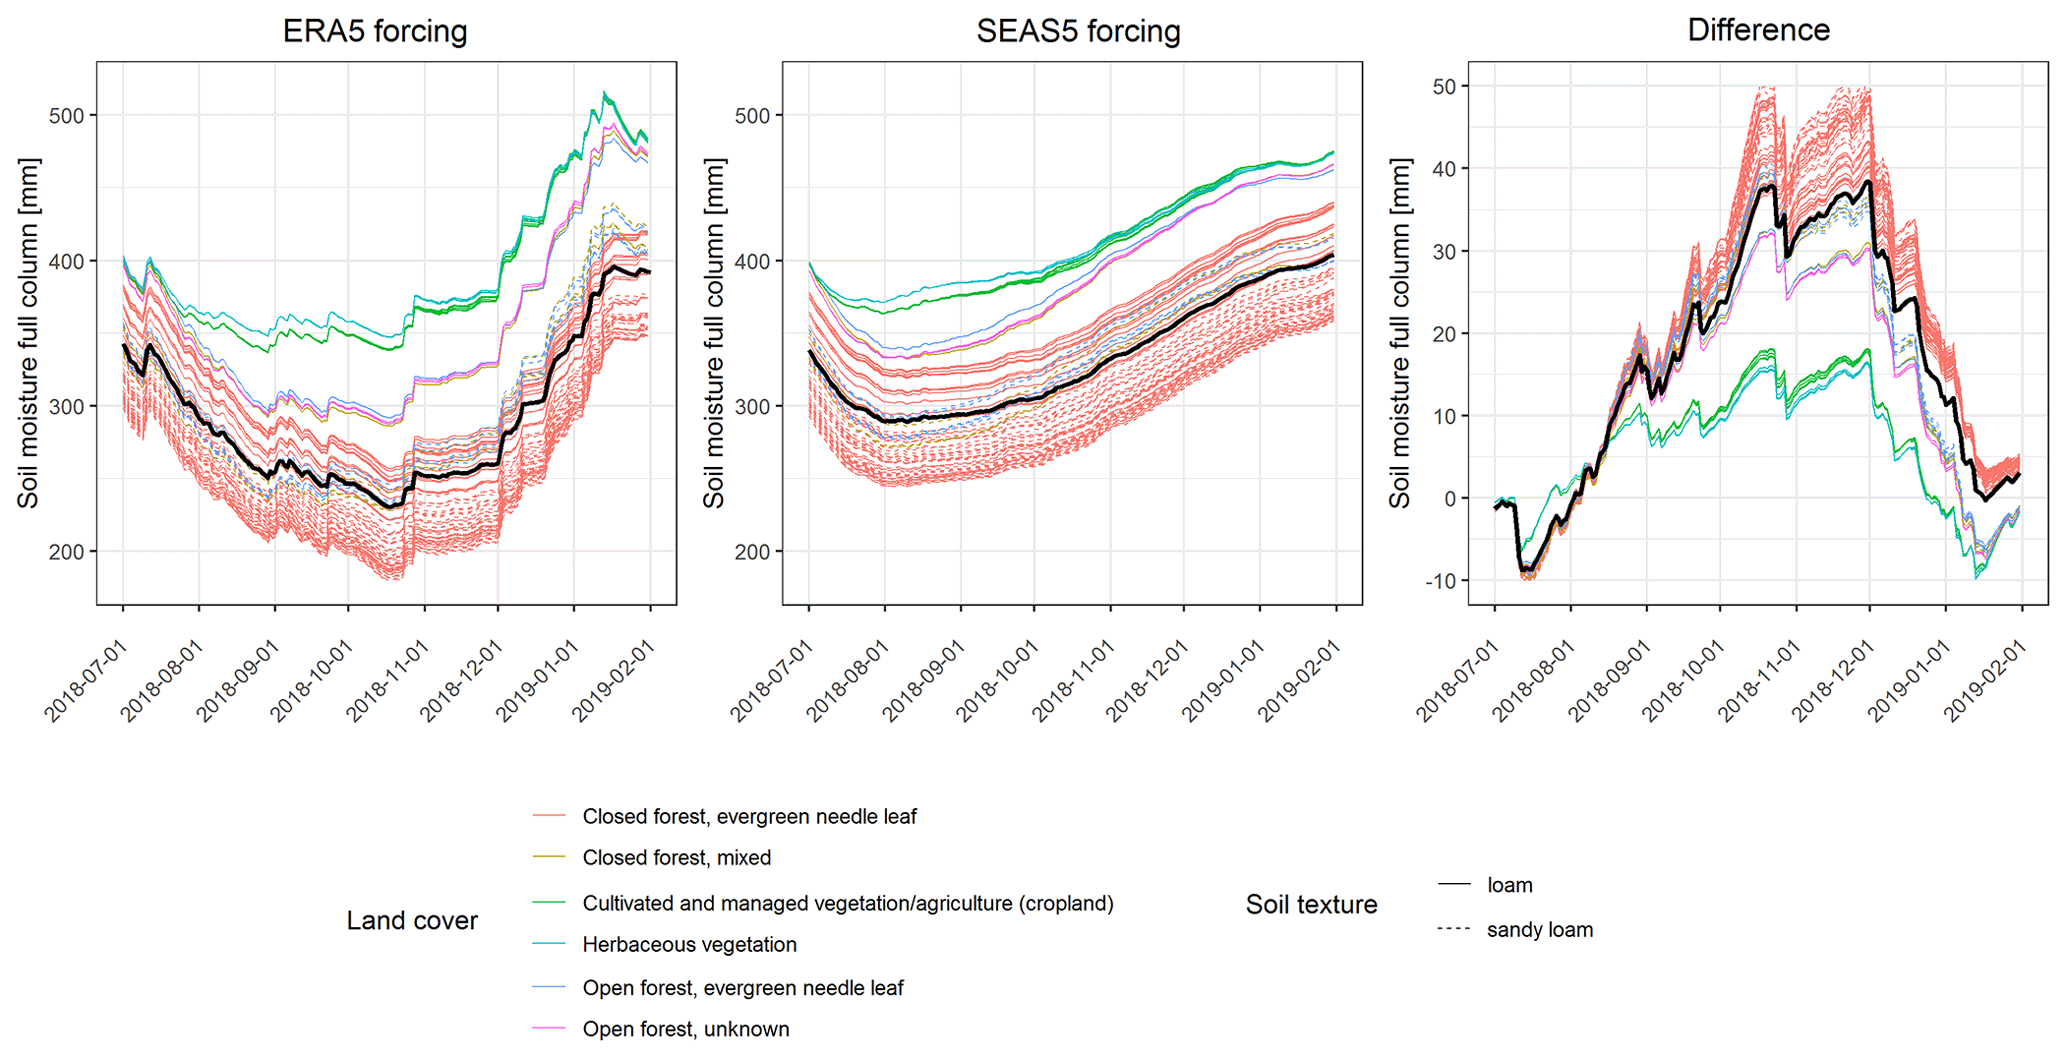
Figure 7HRU-specific full-column (up to 2 m) soil moisture for the 2018 drought simulated with ERA5 and SEAS5 ensemble hindcast forcings in the Natzschung catchment. The thick black line is the catchment-weighted mean. SEAS5-forced runs are represented with the ensemble mean.
Taking a closer look at the driest month (October) during the 2018–2019 drought in the catchment, it can be seen that SEAS5 forcing underestimates precipitation dynamics with an increase in lead time during the drought season (Fig. 8). While for a 1-month lead time the differences between two ERA5-forced and hindcasted soil moisture simulations are minor (up to 50 mm) even in forested areas of the catchment, already starting from a 3-month lead time overestimations are up to 100 mm. Lastly, the 7-month forecast showed almost twice as much soil moisture as was found in the reanalysis runs for the forests and more than +50 % for cultivated areas.
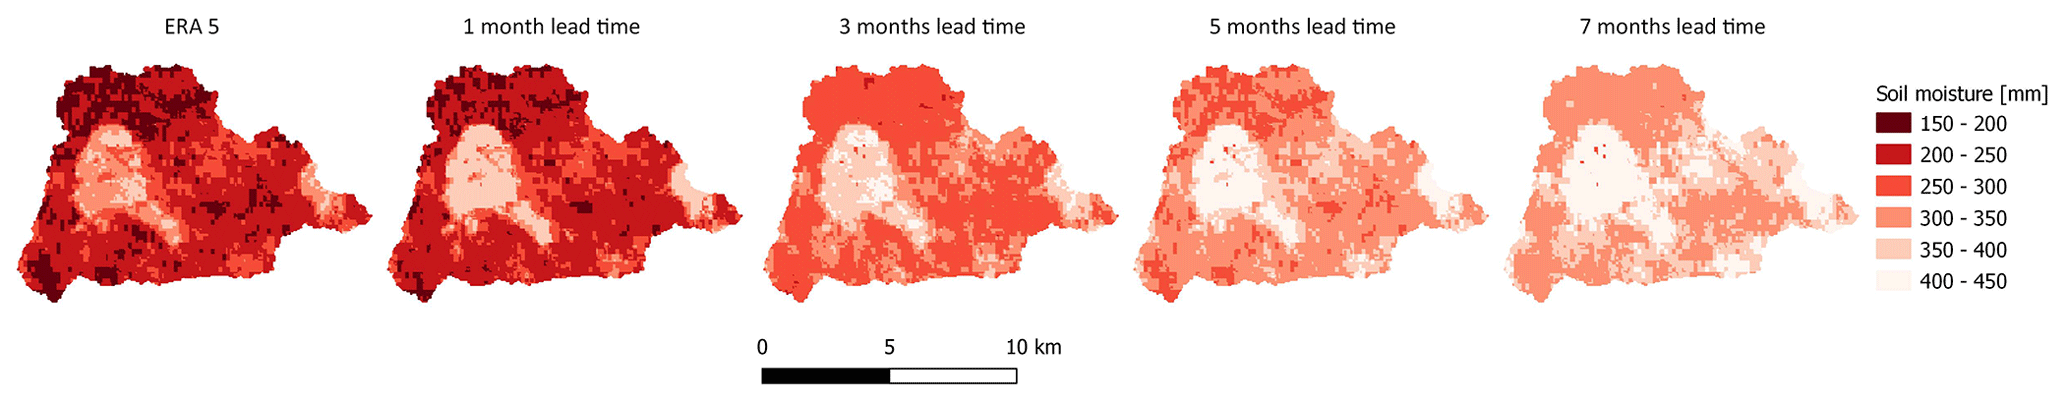
Figure 8Full-column (up to 2 m) mean monthly soil moisture in October 2018 simulated with ERA5 and SEAS5 ensemble hindcast (1, 3, 5 and 7 months of lead time) forcings in the Natzschung catchment. SEAS5-forced runs are represented with the ensemble mean.
The spatial distribution of the daily KGE values between hindcasted and reanalysis soil moisture for the whole study period are presented in Fig. 9. The best performance was found in the cultivated areas, where the KGE values started from 0.95 for up to 1 month and were reduced to 0.5 for up to a 7-month lead time. Grassland and deciduous broadleaf forest showed slightly lower values. The worst performance was demonstrated by spruce forests, especially on loamy soils (in the northeastern part of the catchment). Here, already from a 3-month lead time, a difference in hindcast quality to cropland is noticeable (KGE values 0.6–0.8) and for a 7-month lead time the values dropped below 0. Disaggregation of KGE into its components reveal that the highest influence on the hindcast quality have overestimated mean and underestimated variance ratios.

Figure 9Kling–Gupta efficiency values for full-column (up to 2 m) daily soil moisture (2017–2020) calculated between simulations with ERA5 and SEAS5 ensemble hindcast (1, 3, 5 and 7 months of lead time) forcings in the Natzschung catchment.
4.3 Effect of the forecast lead time on the soil moisture predictions in different conditions
The effect of a forecast lead time in predicting the monthly soil moisture for the root zone and the full soil column in 12 selected catchments is shown in Figs. 10 and 11. A lead time of 1 month resulted in a relatively small discrepancy between hindcast and reanalysis forcings for all catchments. The relative and absolute errors rarely exceeded 10 % and 20 mm respectively (for full soil column), even in drought periods, and no noticeable correlation with seasonality was observed. However, already a lead time of 2 months (3 months for some catchments) showed much higher differences (both positive and negative) between hindcast- and ERA5-forced soil moisture (up to 30 % relative and 150 mm absolute errors for full soil column). For the topsoil, absolute errors are in the range of 5–10 mm for a 1-month lead time and increase to 10–40 mm for 3 months of lead time. However, the relative errors were found to be higher than for the full column. Moreover, for the majority of the catchments (except catchment 4) positive anomalies were found within identified drought periods (REW < 0.3). This accounts for general overestimation of small-scale precipitation in autumn forecasts compared with ERA5. On the other hand, a big negative anomaly during August–September 2017 for catchments 2, 4, 5, 6, 10 and 12 symbolizes a general issue with the SEAS5 forecast system, which met some general problems in the whole European domain for these months. With the further increase in lead time, the differences increase as well; however, they are not so drastic compared with the differences between 1 and 3 months. Thus, based on results from 12 study sites, it can be concluded that the predictability of the soil moisture using the SEAS5 seasonal forecasts can be successfully accomplished with a lead time of up to 2–3 months. Results for both full soil column and root zone look similar and consistent, although the difference in two datasets is more prominent for the latter one. Furthermore, it was noticed that regardless lead time, SEAS5-forced simulations tend to show the highest overestimations of soil moisture near the end of REW-declared drought periods, thus forecasting the end of a water shortage too early, which is clearly visible for the topsoil (catchments 1, 2, 3, 5, 6, 9, 10, 11 and 12). Finally, comparing the relative errors between the catchments in different conditions, it was found that the smallest errors were achieved for catchment 8 (10 %–15 %), located on humid alpine forested foothills in the south of Germany. Systematic overestimations of more than 30 % were found in catchments 1, 3, 10 and 12 during the drought periods, which sometimes were already significant at a lead time of 2 months (up to 20 %). Underestimations of more than 30 % were observed in catchments 6, 9, 10 and 12, and appeared mostly in non-drought conditions during autumn.
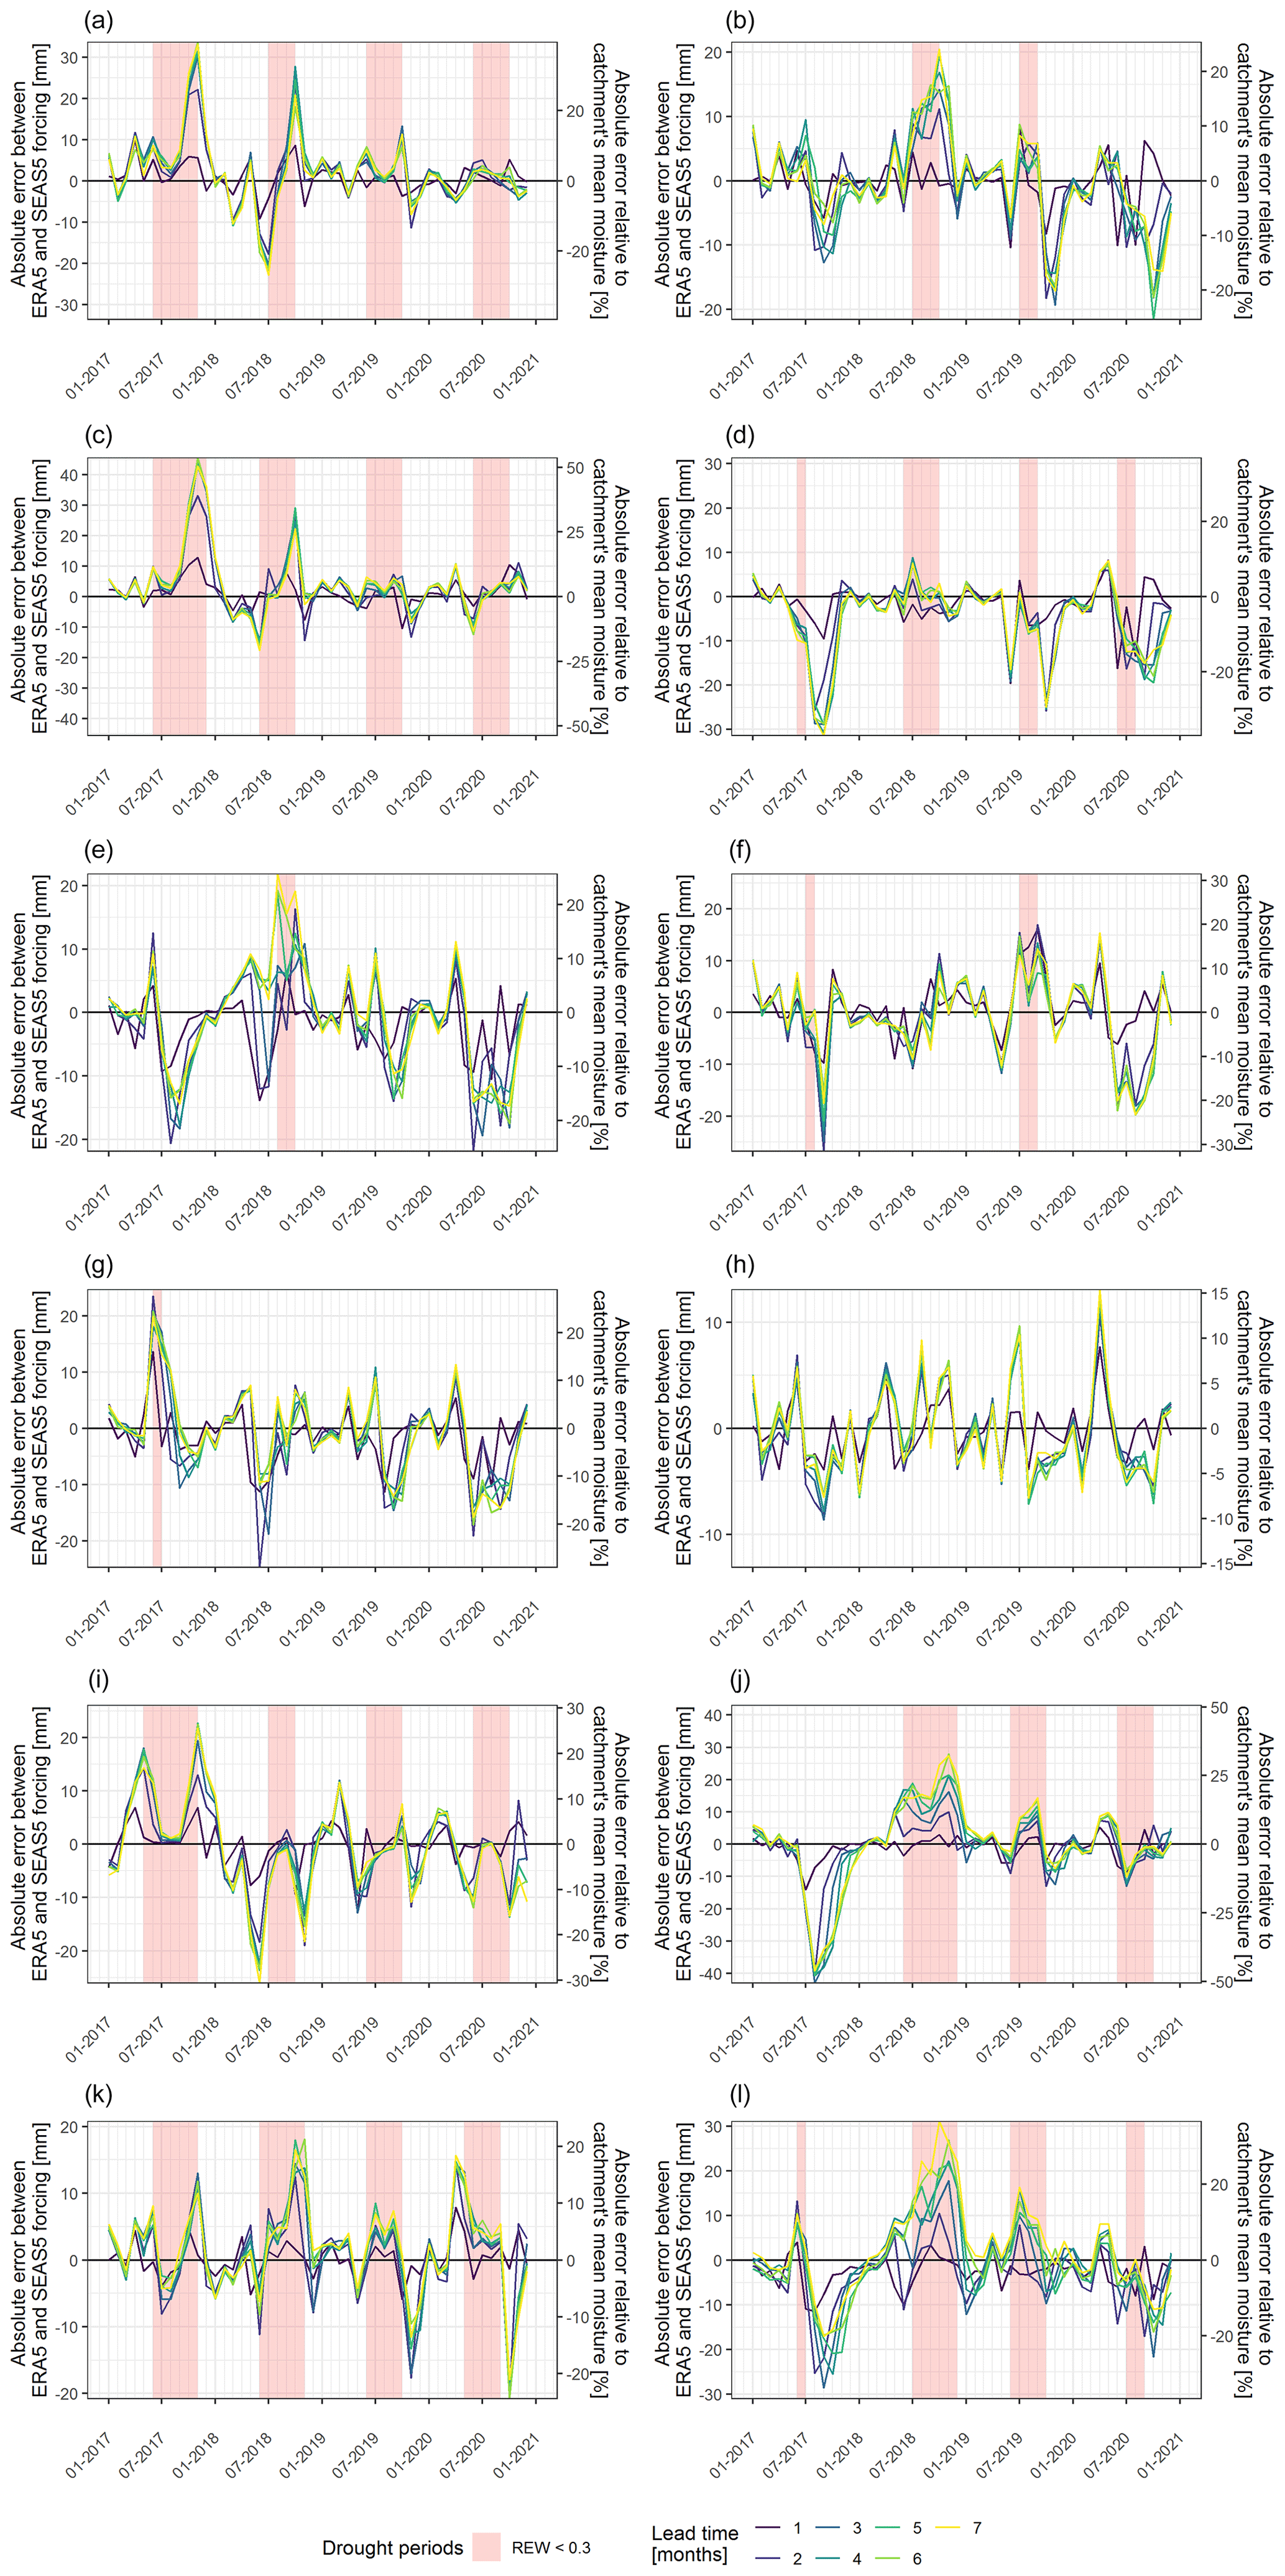
Figure 10Absolute and relative differences between monthly soil moisture simulated with SEAS5 hindcast (mean of ensemble runs) and ERA5 forcings for root zone (0.45 m).
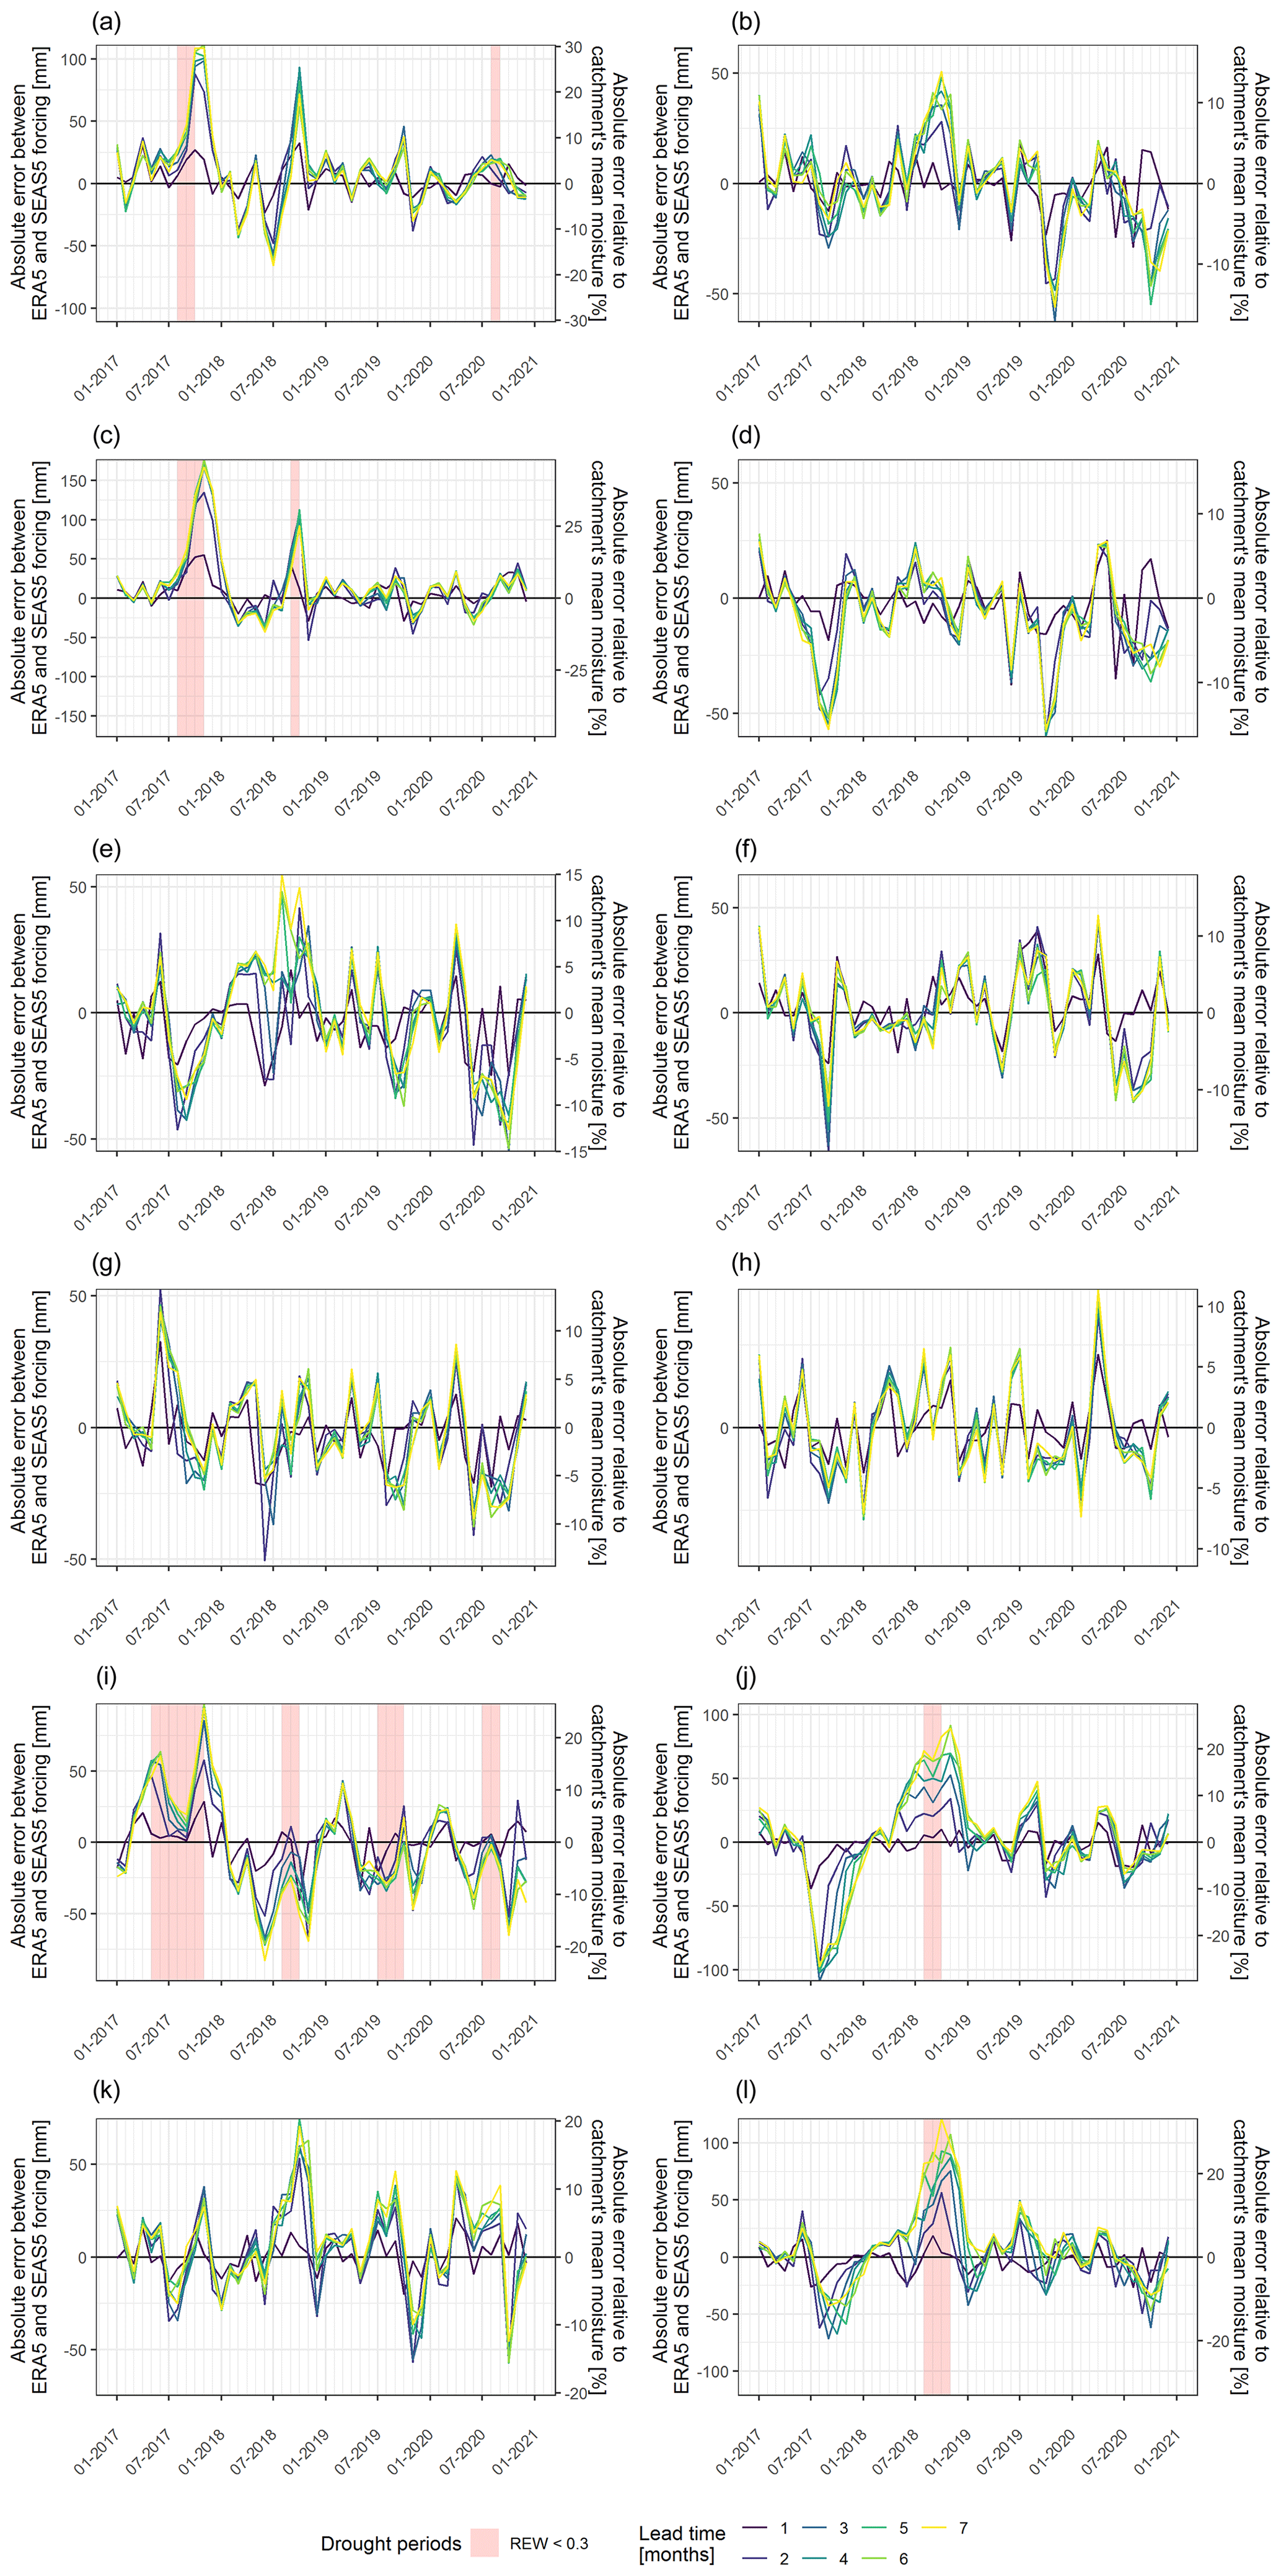
Figure 11Absolute and relative differences between monthly soil moisture simulated with SEAS5 hindcast for full soil column (up to 2 m).
4.4 Advantages of using probabilistic weather forecasts in drought prediction
Multiple uncertainties of a weather forecast could be compensated by the advantages of using its members instead of only considering an ensemble mean. Here the quantile predictions of monthly soil moisture simulated from 51 members of the SEAS5 meteorological hindcast with different lead times are presented (Fig. 12). A 1-month lead time hindcast provides a good fit with ERA5 forcing. Here the width of an ensemble band is relatively narrow due to the small uncertainty band of the meteorological conditions within a short prediction range. Minor inconsistencies in soil moisture predictions for the hindcast and ERA5 forcings (summer 2017 and 2020) probably resulted from the difference in spatial resolution between two datasets. However, already by a 3-month lead time, the spread between the ensemble mean and quantiles becomes considerable, especially in summer due to increased uncertainty in the meteorological forecast. Here the drought development and propagation is better depicted by lower hindcast quantiles (10 %–20 %), while for drought attenuation in the wet season all probabilities need be used due to a delay in the drought peak in the hindcast forcing dataset. Using a 7-month lead time, thus staying on the edge of seasonal forecast predictability, will bring an even higher spread in quantile hindcasts, however with close developments as for a 3-month lead time. Here the magnitude of soil moisture drought in 2018 cannot be captured even with a 1 % quantile for 5 months in a row, meaning a significant overestimation of precipitation with increasing leading time for that year.
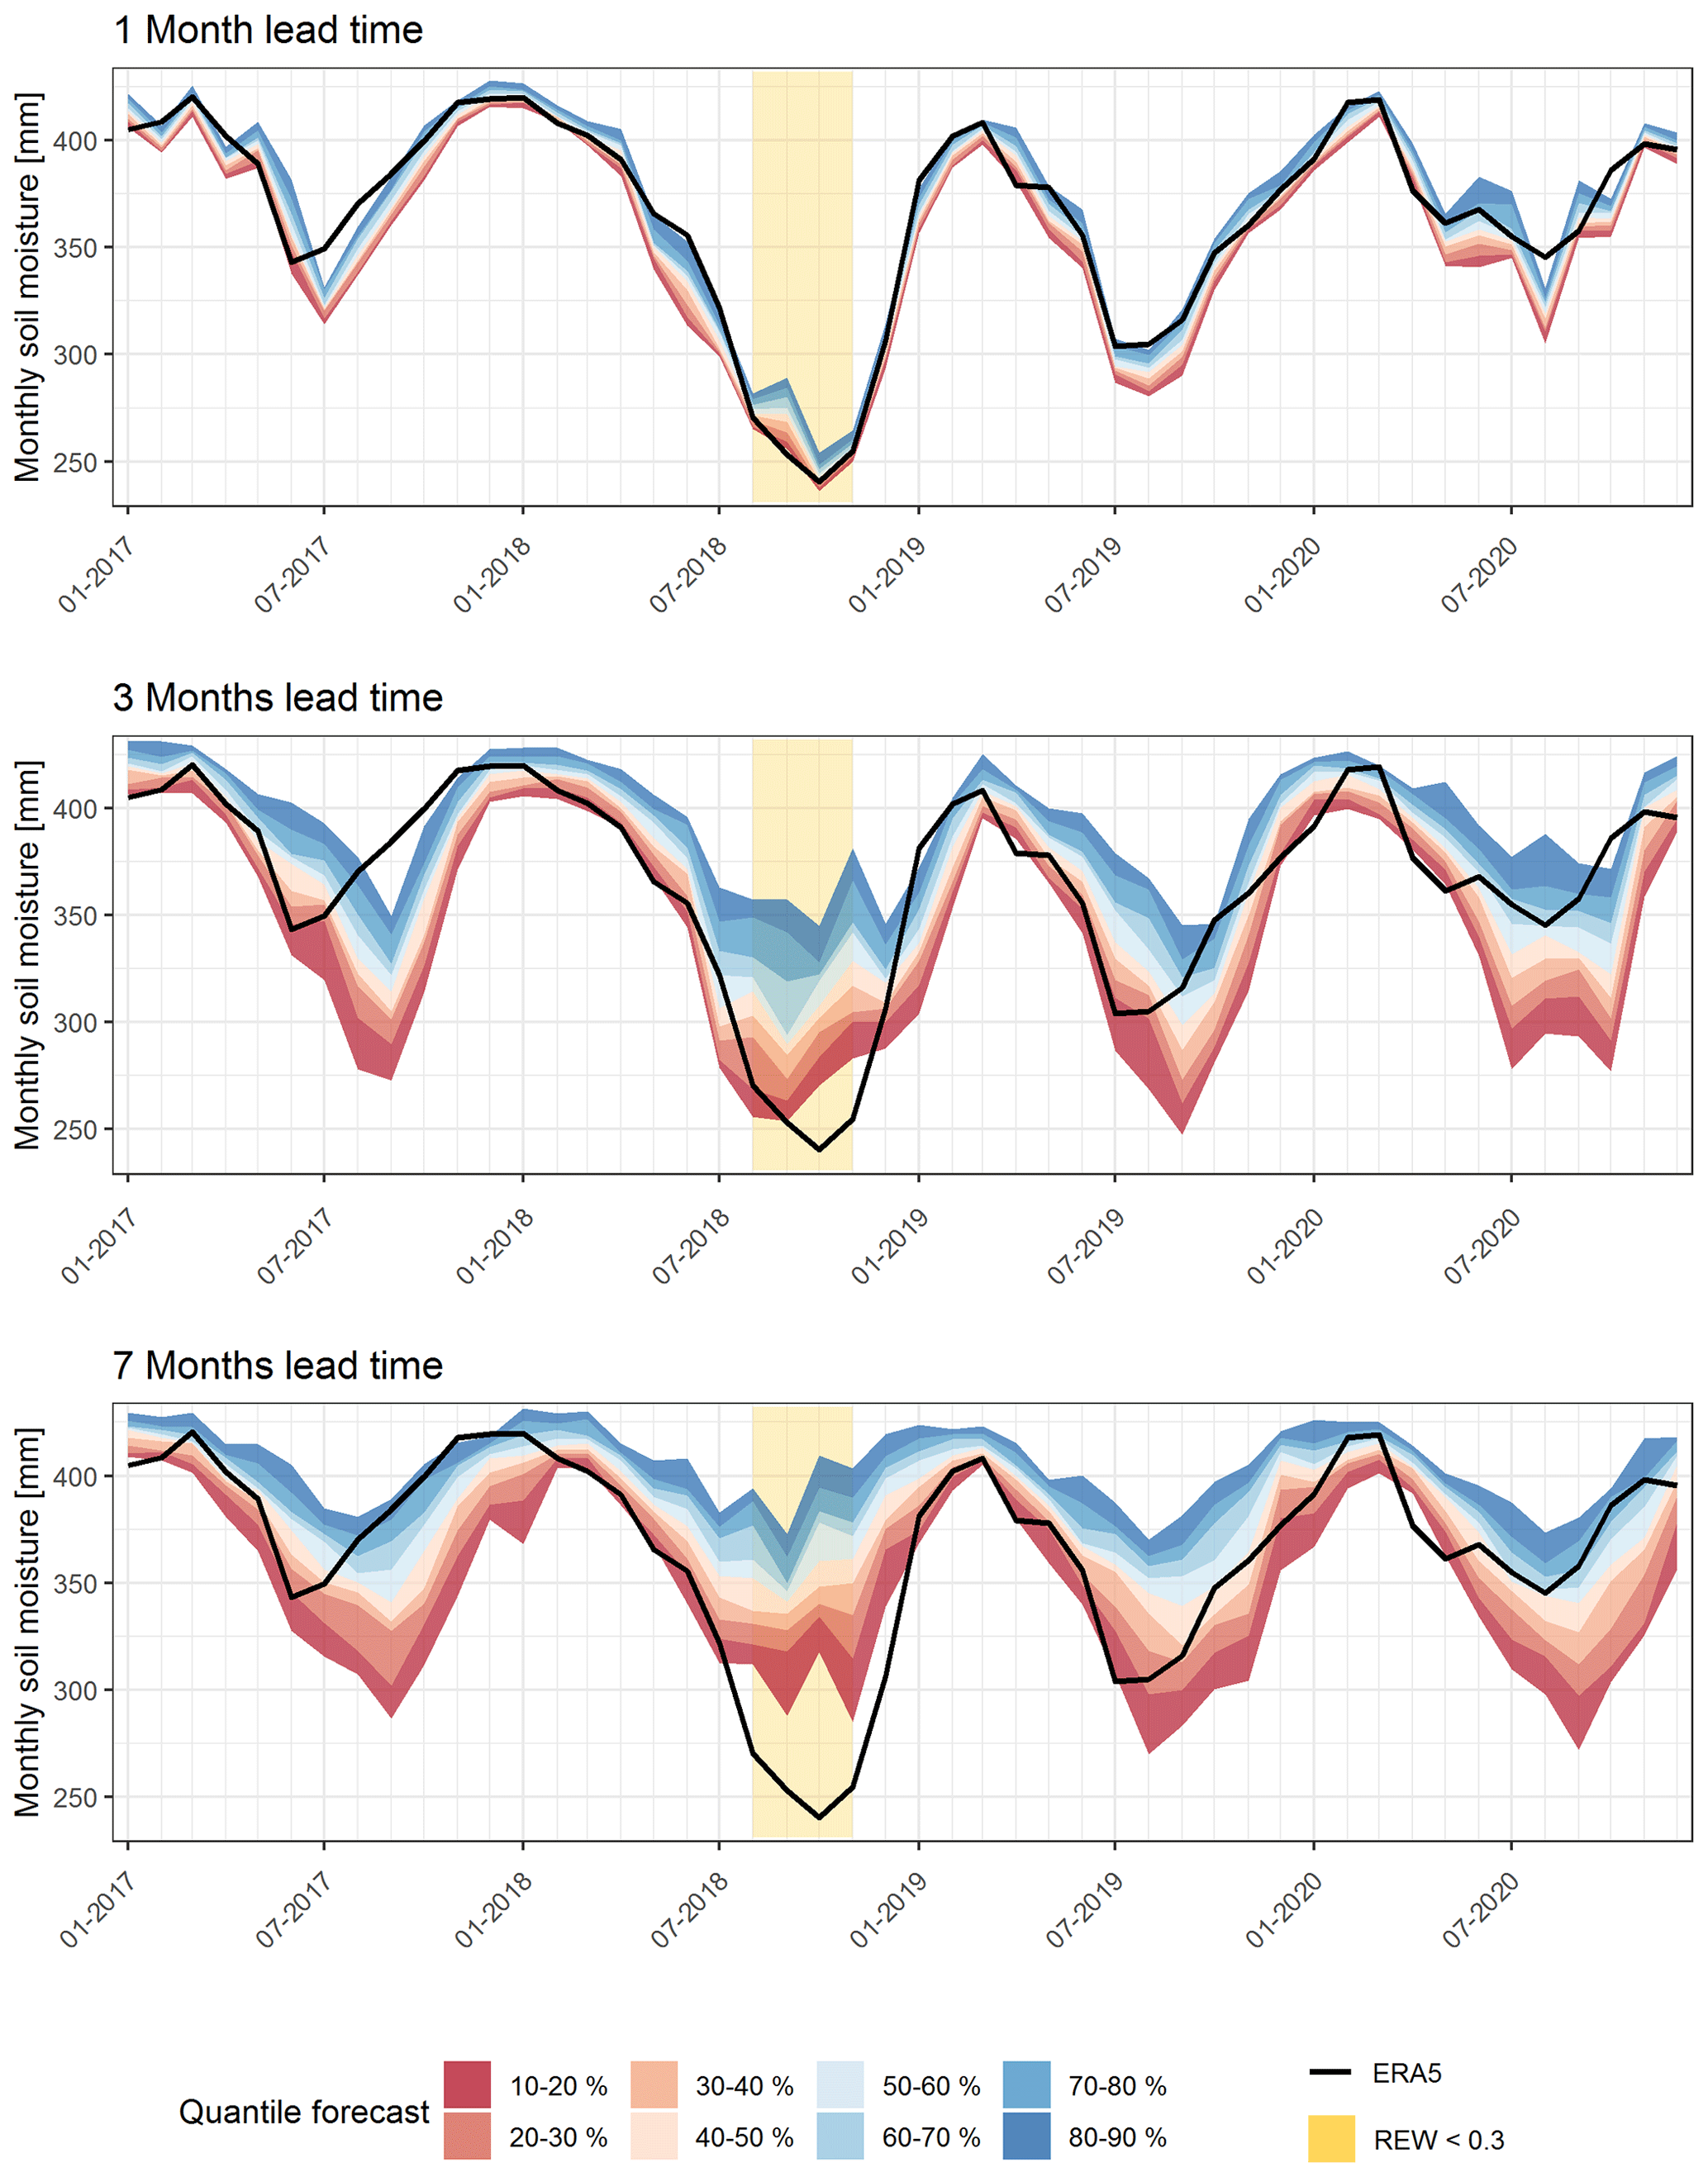
Figure 12Monthly averages of a catchment-mean full-column (up to 2 m) soil moisture simulated with ERA5 and SEAS5 hindcast forcings in the Natzschung catchment.
Global setup of the presented framework incorporates the latest state-of-the-art meteorological, topographical vegetation and soil datasets. Application of a 1D model on a high-resolution HRU-based scale allows 1.5D simulations of water balance components, including their forecast. Despite high uncertainties, which arise from the setup (i.e. scale differences, the quality of input datasets and model shortcomings), it is the first tool capable of delivering reliable soil moisture forecasts on a local scale. The scale here is particularly important, since it was shown that the large deviations in forecasted soil moisture on an HRU scale mirror the catchment heterogeneity and hence the complex interactions of different landscapes and soil profiles, and imply the need for a local-scale forecast.
Benchmarking the SEAS5-forced with ERA5-forced simulations revealed that the quality of the long-term soil moisture forecasts declines rapidly after 2–3 months of lead time. These results are consistent with similar research on other scales (Wanders et al., 2019) and indicate imperfection of meteorological input, namely increasing uncertainties of the seasonal forecasts with the increasing lead time. Typically, forecasted values overestimated reanalysis, especially for lead times longer than 3 months within the identified drought periods. In a few catchments a time shift in drought phases, which depends on the forecast starting date, was detected. It was shown that in some cases, the difference in soil moisture between two forcings could result in more than 100 mm (around 30 % of the mean annual soil moisture content), which is a considerable amount, especially for the drought periods. HRU-based simulation also helps us to detect patterns in forecast accuracy with regard to different vegetation types and soil types. With the Natzschung catchment as an example, it was shown that soil moisture conditions under the tall canopies, with high moisture consumption for the transpiration process growing on the soils with low holding capacities, are particularly hard to forecast. However, overall, no clear pattern between the behaviour of forecasted soil moisture and catchment characteristics (i.e. size, orography, dominated land cover and soil type) was found on the catchment-mean scale. This means that long-term planning regarding drought adaptation and mitigation is limited and severely affected by uncertainties of seasonal meteorological forecast but nevertheless should be implemented with regard to local-scale heterogeneity.
Quite often in forecasting practice the results are presented not in absolute (deterministic) values but as a range (probabilistic). The range typically arises from ensemble simulations, representing uncertainty in the meteorological data. The presented framework provides ensemble runs along with the ensemble mean, and thus stakeholders can use the advantages of quantile soil moisture forecasts. However, it was found that as the SEAS5-forced runs generally tend to overestimate soil moisture, for 3 and 7 months of lead time even the 10 % quantile of hindcasts could be insufficient to reach ERA5-forced soil moisture values in dry conditions.
In this article, we present a new version of an automatic framework for water balance modelling on a local scale for any location on the globe called Global BROOK90. Special focus is given on the ability of the new version to provide predictions of water balance components for up to 7 months in advance by incorporation of SEAS5 seasonal meteorological forecasts. We showed how a combination of global land cover and soil open-source datasets, large-scaled meteorological forecasts and a physically based model can predict a soil moisture drought with high spatial resolution.
Soil moisture simulations were conducted, for the period 2017–2020, for 12 small European catchments with various landscapes and which cover the well-known continent-scale European drought of 2018–2019. ERA5 reanalysis and SEAS5 hindcasts were applied as a meteorological forcing. The runs with ERA5 forcing served as a reference for the soil moisture to assess the added value and quality of the forecast performance, thus comparing the meteorological data uncertainty. We illustrated the spatiotemporal advantages and the quality of small-scale modelling in monitoring and forecasting a drought using one of the study sites as an example.
Additionally, the ERA5-forced model runs were compared with SMAP data, which represent a satellite brightness temperature assimilated in a land surface model. Validation resulted in a good agreement between both datasets on a monthly scale, especially for the correlation coefficient. However, Global BROOK90 runs ended up with a lower mean and variance of soil moisture. The highest KGE values were found for the topsoil and the goodness of fit declined with profile depth.
Comparison of HRU-based and catchment-mean monthly soil moisture showed that forecasts of soil moisture on a local scale are accurate for up to 2–3 months of lead time, which is valid for drought conditions as well. It was found that for the majority of the study sites, the SEAS5 forecast resulted in overestimation of soil moisture in identified plant–water–stress periods due to the general overestimations of precipitation amounts. Furthermore, the absence of patterns in the seasonal forecasts with regard to the catchment characteristics indicates that a forecast generalization to catchment scale is not recommended for water management purposes.
Finally, it was shown that for the lead times of up to 3 months, probabilistic forecast could be advantageous as the band of quantile forecasts could cover the variability in soil moisture produced with ERA5 forcing.
Overall, Global BROOK90 combined with SEAS5 seasonal ensemble forecasts showed good results for a range of 1–3 months of lead time and can serve as a fairly reliable basis for drought monitoring and forecasting on a local scale. Moreover, one of the definitive advantages of the framework is that it does not require significant computational resources or a programming background and could be run on a normal computer or laptop by a non-professional user.
The authors fully support open-source and reproducible research. The Global BROOK90 framework is available at https://doi.org/10.5281/zenodo.8318913 (Vorobevskii, 2023a) repository (CC BY-NC-ND 4.0). Simulation results, initial and simulation datasets and R-scripts to reproduce figures and tables for the manuscript are available at the following HydroShare composite resource: https://doi.org/10.4211/hs.d882e83bae95438881c7b47f003e7a3c (Vorobevskii, 2023b).
Conceptualization: VI and KR; data curation: VI and LTT; formal analysis: VI; methodology: VI, LTT and KR; supervision: KR; visualization: VI; writing – original draft: VI and LTT; writing – review: KR.
The contact author has declared that none of the authors has any competing interests.
Publisher's note: Copernicus Publications remains neutral with regard to jurisdictional claims made in the text, published maps, institutional affiliations, or any other geographical representation in this paper. While Copernicus Publications makes every effort to include appropriate place names, the final responsibility lies with the authors.
This article is part of the special issue “Reducing the impacts of natural hazards through forecast-based action: from early warning to early action”. It is not associated with a conference.
This research has been supported by the Bundesministerium für Bildung und Forschung (grant no. FKZ 01LR 2005A).
This open access publication was financed by the Saxon State and University Library Dresden (SLUB Dresden).
This paper was edited by Marc van den Homberg and reviewed by four anonymous referees.
Babaeian, E., Sadeghi, M., Jones, S. B., Montzka, C., Vereecken, H., and Tuller, M.: Ground, Proximal, and Satellite Remote Sensing of Soil Moisture, Rev. Geophys., 57, 530–616, https://doi.org/10.1029/2018RG000618, 2019.
Barriopedro, D., Fischer, E. M., Luterbacher, J., Trigo, R. M., and García-Herrera, R.: The Hot Summer of 2010: Redrawing the Temperature Record Map of Europe, Science, 332, 220–224, https://doi.org/10.1126/science.1201224, 2011.
Beven, K. J. and Cloke, H. L.: Comment on “Hyperresolution global land surface modeling: Meeting a grand challenge for monitoring Earth's terrestrial water” by Eric F. Wood et al., Water Resour. Res., 48, W01801, https://doi.org/10.1029/2011WR010982, 2012.
Boé, J., Terray, L., Habets, F., and Martin, E.: Statistical and dynamical downscaling of the Seine basin climate for hydro-meteorological studies, Int. J. Climatol., 27, 1643–1655, https://doi.org/10.1002/joc.1602, 2007.
Boeing, F., Rakovec, O., Kumar, R., Samaniego, L., Schrön, M., Hildebrandt, A., Rebmann, C., Thober, S., Müller, S., Zacharias, S., Bogena, H., Schneider, K., Kiese, R., Attinger, S., and Marx, A.: High-resolution drought simulations and comparison to soil moisture observations in Germany, Hydrol. Earth Syst. Sci., 26, 5137–5161, https://doi.org/10.5194/hess-26-5137-2022, 2022.
Boergens, E., Güntner, A., Dobslaw, H., and Dahle, C.: Quantifying the Central European Droughts in 2018 and 2019 With GRACE Follow-On, Geophys. Res. Lett., 47, e2020GL087285, https://doi.org/10.1029/2020GL087285, 2020.
Bréda, N., Huc, R., Granier, A., and Dreyer, E.: Temperate forest trees and stands under severe drought: a review of ecophysiological responses, adaptation processes and long-term consequences, Ann. Forest Sci., 63, 625–644, https://doi.org/10.1051/forest:2006042, 2006.
Brust, C., Kimball, J. S., Maneta, M. P., Jencso, K., and Reichle, R. H.: DroughtCast: A Machine Learning Forecast of the United States Drought Monitor, Front. Big Data, 4, 773478, https://doi.org/10.3389/fdata.2021.773478, 2021.
Buchhorn, M., Smets, B., Bertels, L., Lesiv, M., Tsendbazar, N.-E., Herold, M., and Fritz, S.: Copernicus Global Land Service: Land Cover 100 m: collection 3: epoch 2019: Globe 2020, Zenodo [data set], https://doi.org/10.5281/zenodo.3939050, 2020.
Buras, A., Rammig, A., and Zang, C. S.: Quantifying impacts of the 2018 drought on European ecosystems in comparison to 2003, Biogeosciences, 17, 1655–1672, https://doi.org/10.5194/bg-17-1655-2020, 2020.
Cammalleri, C., Arias-Muñoz, C., Barbosa, P., de Jager, A., Magni, D., Masante, D., Mazzeschi, M., McCormick, N., Naumann, G., Spinoni, J., and Vogt, J.: A revision of the Combined Drought Indicator (CDI) used in the European Drought Observatory (EDO), Nat. Hazards Earth Syst. Sci., 21, 481–495, https://doi.org/10.5194/nhess-21-481-2021, 2021.
Clapp, R. B. and Hornberger, G. M.: Empirical equations for some soil hydraulic properties, Water Resour. Res., 14, 601–604, https://doi.org/10.1029/WR014i004p00601, 1978.
Copernicus Climate Change Service Information: ERA5: Fifth generation of ECMWF atmospheric reanalyses of the global climate, ERA5 hourly data on single levels from 1959 to present, https://doi.org/10.24381/cds.adbb2d47, 2018a.
Copernicus Climate Change Service Information: Copernicus Climate Change Service (C3S): Seasonal forecast daily and subdaily data on single levels, https://doi.org/10.24381/cds.181d637e, 2018b.
Crausbay, S. D., Ramirez, A. R., Carter, S. L., Cross, M. S., Hall, K. R., Bathke, D. J., Betancourt, J. L., Colt, S., Cravens, A. E., Dalton, M. S., Dunham, J. B., Hay, L. E., Hayes, M. J., McEvoy, J., McNutt, C. A., Moritz, M. A., Nislow, K. H., Raheem, N., and Sanford, T.: Defining Ecological Drought for the Twenty-First Century, B. Am. Meteorol. Soc., 98, 2543–2550, https://doi.org/10.1175/BAMS-D-16-0292.1, 2017.
Ebita, A., Kobayashi, S., Ota, Y., Moriya, M., Kumabe, R., Onogi, K., Harada, Y., Yasui, S., Miyaoka, K., Takahashi, K., Kamahori, H., Kobayashi, C., Endo, H., Soma, M., Oikawa, Y., and Ishimizu, T.: The Japanese 55-year Reanalysis “JRA-55”: An Interim Report, SOLA, 7, 149–152, https://doi.org/10.2151/sola.2011-038, 2011.
European Commission: Guidance document on the application of water balances for supporting the implementation of the WFD, 6.1., Office for Official Publications of the European Communities, Luxembourg, https://op.europa.eu/en/publication-detail/-/publication/7d148604-faf0-11e5-b713-01aa75ed71a1 (last access: 27 February 2024), 2015.
Federer, C. A., Vörösmarty, C., and Fekete, B.: Sensitivity of Annual Evaporation to Soil and Root Properties in Two Models of Contrasting Complexity, J. Hydrometeorol. 4, 1276–1290, https://doi.org/10.1175/1525-7541(2003)004<1276:SOAETS>2.0.CO;2, 2003.
Fischer, E. M., Seneviratne, S. I., Vidale, P. L., Lüthi, D., and Schär, C.: Soil Moisture–Atmosphere Interactions during the 2003 European Summer Heat Wave, J. Climate, 20, 5081–5099, https://doi.org/10.1175/JCLI4288.1, 2007.
Gelaro, R., McCarty, W., Suárez, M. J., Todling, R., Molod, A., Takacs, L., Randles, C. A., Darmenov, A., Bosilovich, M. G., Reichle, R., Wargan, K., Coy, L., Cullather, R., Draper, C., Akella, S., Buchard, V., Conaty, A., da Silva, A. M., Gu, W., Kim, G.-K., Koster, R., Lucchesi, R., Merkova, D., Nielsen, J. E., Partyka, G., Pawson, S., Putman, W., Rienecker, M., Schubert, S. D., Sienkiewicz, M., and Zhao, B.: The Modern-Era Retrospective Analysis for Research and Applications, Version 2 (MERRA-2), J. Climate, 30, 5419–5454, https://doi.org/10.1175/JCLI-D-16-0758.1, 2017.
Granier, A., Bréda, N., Biron, P., and Villette, S.: A lumped water balance model to evaluate duration and intensity of drought constraints in forest stands, Ecol. Model., 116, 269–283, https://doi.org/10.1016/S0304-3800(98)00205-1, 1999.
Grillakis, M. G.: Increase in severe and extreme soil moisture droughts for Europe under climate change, Sci. Total Environ., 660, 1245–1255, https://doi.org/10.1016/j.scitotenv.2019.01.001, 2019.
Gupta, H. V., Kling, H., Yilmaz, K. K., and Martinez, G. F.: Decomposition of the mean squared error and NSE performance criteria: Implications for improving hydrological modelling, J. Hydrol., 377, 80–91, https://doi.org/10.1016/j.jhydrol.2009.08.003, 2009.
Hari, V., Rakovec, O., Markonis, Y., Hanel, M., and Kumar, R.: Increased future occurrences of the exceptional 2018–2019 Central European drought under global warming, Sci. Rep., 10, 12207, https://doi.org/10.1038/s41598-020-68872-9, 2020.
Hengl, T., Mendes de Jesus, J., Heuvelink, G. B. M., Ruiperez Gonzalez, M., Kilibarda, M., Blagotić, A., Shangguan, W., Wright, M. N., Geng, X., Bauer-Marschallinger, B., Guevara, M. A., Vargas, R., MacMillan, R. A., Batjes, N. H., Leenaars, J. G. B., Ribeiro, E., Wheeler, I., Mantel, S., and Kempen, B.: SoilGrids250m: Global gridded soil information based on machine learning, PLOS ONE, 12, 1–40, https://doi.org/10.1371/journal.pone.0169748, 2017.
Joint Research Centre (European Commission), Ziese, M., Garcia, R., Dottori, F., Salamon, P., Schweim, C., Arnal, L., Disperati, J., Prudhomme, C., Gomes, G., Krzeminski, B., De Roo, A., Baugh, C., Sprokkereef, E., Lorini, V., Kalas, M., Mazzetti, C., Muraro, D., Wetterhall, F., Smith, P., Thiemig, V., Mikulickova, M., Asp, S., Skoien, J., Rehfeldt, K., Garcia-Padilla, M., Gelati, E., Rauthe-Schöch, A., and Latini, M.: EFAS upgrade for the extended model domain: technical documentation, Publications Office of the European Union, Luxembourg, https://doi.org/10.2760/806324, 2019.
JRC European Drought Observatory: EDO Analytical Report: Drought in Central-Northern Europe – September 2018, https://edo.jrc.ec.europa.eu/documents/news/EDODroughtNews201809_Central_North_Europe.pdf (last access: 27 February 2024), 2018.
JRC European Drought Observatory: EDO Analytical Report: Drought in Europe – August 2019, https://edo.jrc.ec.europa.eu/documents/news/EDODroughtNews201908_Europe.pdf (last access: 27 February 2024), 2019.
Larrick, G., Tian, Y., Rogers, U., Acosta, H., and Shen, F.: Interactive Visualization of 3D Terrain Data Stored in the Cloud, in: 2020 11th IEEE Annual Ubiquitous Computing, Electronics & Mobile Communication Conference (UEMCON), 28–31 October 2020, New York, NY, USA, 0063–0070, https://doi.org/10.1109/UEMCON51285.2020.9298063, 2020.
Lorenz, D. J., Otkin, J. A., Svoboda, M., Hain, C. R., Anderson, M. C., and Zhong, Y.: Predicting the U.S. Drought Monitor Using Precipitation, Soil Moisture, and Evapotranspiration Anomalies. Part II: Intraseasonal Drought Intensification Forecasts, J. Hydrometeorol., 18, 1963–1982, https://doi.org/10.1175/JHM-D-16-0067.1, 2017.
Martens, B., Schumacher, D. L., Wouters, H., Muñoz-Sabater, J., Verhoest, N. E. C., and Miralles, D. G.: Evaluating the land-surface energy partitioning in ERA5, Geosci. Model Dev., 13, 4159–4181, https://doi.org/10.5194/gmd-13-4159-2020, 2020.
Mishra, A. K. and Singh, V. P.: A review of drought concepts, J. Hydrol., 391, 202–216, https://doi.org/10.1016/j.jhydrol.2010.07.012, 2010.
Moravec, V., Markonis, Y., Rakovec, O., Svoboda, M., Trnka, M., Kumar, R., and Hanel, M.: Europe under multi-year droughts: how severe was the 2014–2018 drought period?, Environ. Res. Lett., 16, 034062, https://doi.org/10.1088/1748-9326/abe828, 2021.
Mueller, B. and Zhang, X.: Causes of drying trends in northern hemispheric land areas in reconstructed soil moisture data, Climatic Change, 134, 255–267, https://doi.org/10.1007/s10584-015-1499-7, 2016.
Myneni, R., Knyazikhin, Y., and Park, T.: MODIS/Terra Leaf Area Index/FPAR 8-Day L4 Global 500 m SIN Grid V061, USGS, https://doi.org/10.5067/MODIS/MCD15A2H.061, 2021.
Naumann, G., Cammalleri, C., Mentaschi, L., and Feyen, L.: Increased economic drought impacts in Europe with anthropogenic warming, Nat. Clim. Change, 11, 485–491, https://doi.org/10.1038/s41558-021-01044-3, 2021.
Otkin, J. A., Svoboda, M., Hunt, E. D., Ford, T. W., Anderson, M. C., Hain, C., and Basara, J. B.: Flash Droughts: A Review and Assessment of the Challenges Imposed by Rapid-Onset Droughts in the United States, B. Am. Meteorol. Soc., 99, 911–919, https://doi.org/10.1175/BAMS-D-17-0149.1, 2018.
Peters, W., Bastos, A., Ciais, P., and Vermeulen, A.: A historical, geographical and ecological perspective on the 2018 European summer drought, Philos. T. Roy. Soc. B, 375, 20190505, https://doi.org/10.1098/rstb.2019.0505, 2020.
Potapov, P., Li, X., Hernandez-Serna, A., Tyukavina, A., Hansen, M. C., Kommareddy, A., Pickens, A., Turubanova, S., Tang, H., Silva, C. E., Armston, J., Dubayah, R., Blair, J. B., and Hofton, M.: Mapping global forest canopy height through integration of GEDI and Landsat data, Remote Sens. Environ., 253, 112165, https://doi.org/10.1016/j.rse.2020.112165, 2021.
Puhe, J.: Growth and development of the root system of Norway spruce (Picea abies) in forest stands – a review, Forest Ecol. Manage., 175, 253–273, https://doi.org/10.1016/S0378-1127(02)00134-2, 2003.
Rakovec, O., Samaniego, L., Hari, V., Markonis, Y., Moravec, V., Thober, S., Hanel, M., and Kumar, R.: The 2018–2020 Multi-Year Drought Sets a New Benchmark in Europe, Earth's Future, 10, e2021EF002394, https://doi.org/10.1029/2021EF002394, 2022.
Reichle, R., De Lannoy, G., Koster, R. D., Crow, W. T., Kimball, J. S., and Liu, Q.: SMAP L4 Global 3-hourly 9 km EASE-Grid Surface and Root Zone Soil Moisture Geophysical Data, Version 6: User guide, NSIDC, https://doi.org/10.5067/08S1A6811J0U, 2021.
Richards, L. A.: Capillary conduction of liquids through porous mediums, Physics, 1, 318–333, https://doi.org/10.1063/1.1745010, 1931.
Samaniego, L., Thober, S., Wanders, N., Pan, M., Rakovec, O., Sheffield, J., Wood, E. F., Prudhomme, C., Rees, G., Houghton-Carr, H., Fry, M., Smith, K., Watts, G., Hisdal, H., Estrela, T., Buontempo, C., Marx, A., and Kumar, R.: Hydrological Forecasts and Projections for Improved Decision-Making in the Water Sector in Europe, B. Am. Meteorol. Soc., 100, 2451–2472, https://doi.org/10.1175/BAMS-D-17-0274.1, 2019.
Schär, C. and Jendritzky, G.: Hot news from summer 2003, Nature, 432, 559–560, https://doi.org/10.1038/432559a, 2004.
Schmidt-Walter, P., Ahrends, B., Mette, T., Puhlmann, H., and Meesenburg, H.: NFIWADS: the water budget, soil moisture, and drought stress indicator database for the German National Forest Inventory (NFI), Ann. Forest Sci., 76, 39, https://doi.org/10.1007/s13595-019-0822-2, 2019.
Sheffield, J., Wood, E. F., and Roderick, M. L.: Little change in global drought over the past 60 years, Nature, 491, 435–438, https://doi.org/10.1038/nature11575, 2012.
Sheffield, J., Wood, E. F., Chaney, N., Guan, K., Sadri, S., Yuan, X., Olang, L., Amani, A., Ali, A., Demuth, S., and Ogallo, L.: A Drought Monitoring and Forecasting System for Sub-Sahara African Water Resources and Food Security, B. Am. Meteorol. Soc., 95, 861–882, https://doi.org/10.1175/BAMS-D-12-00124.1, 2014.
Sood, A. and Smakhtin, V.: Global hydrological models: a review, Hydrolog. Sci. J., 60, 549–565, https://doi.org/10.1080/02626667.2014.950580, 2015.
Suárez-Almiñana, S., Pedro-Monzonís, M., Paredes-Arquiola, J., Andreu, J., and Solera, A.: Linking Pan-European data to the local scale for decision making for global change and water scarcity within water resources planning and management, Sci. Total Environ., 603–604, 126–139, https://doi.org/10.1016/j.scitotenv.2017.05.259, 2017.
Sutanto, S. J. and Van Lanen, H. A. J.: Catchment memory explains hydrological drought forecast performance, Sci. Rep., 12, 2689, https://doi.org/10.1038/s41598-022-06553-5, 2022.
Sutanto, S. J., van der Weert, M., Wanders, N., Blauhut, V., and Van Lanen, H. A. J.: Moving from drought hazard to impact forecasts, Nat. Commun., 10, 4945, https://doi.org/10.1038/s41467-019-12840-z, 2019.
Svoboda, M., LeComte, D., Hayes, M., Heim, R., Gleason, K., Angel, J., Rippey, B., Tinker, R., Palecki, M., Stooksbury, D., Miskus, D., and Stephens, S.: The drought monitor, B. Am. Meteorol. Soc., 83, 1181–1190, https://doi.org/10.1175/1520-0477-83.8.1181, 2002.
Thielen, J., Bartholmes, J., Ramos, M.-H., and de Roo, A.: The European Flood Alert System – Part 1: Concept and development, Hydrol. Earth Syst. Sci., 13, 125–140, https://doi.org/10.5194/hess-13-125-2009, 2009.
Van Lanen, H. A. J., Laaha, G., Kingston, D. G., Gauster, T., Ionita, M., Vidal, J.-P., Vlnas, R., Tallaksen, L. M., Stahl, K., Hannaford, J., Delus, C., Fendekova, M., Mediero, L., Prudhomme, C., Rets, E., Romanowicz, R. J., Gailliez, S., Wong, W. K., Adler, M.-J., Blauhut, V., Caillouet, L., Chelcea, S., Frolova, N., Gudmundsson, L., Hanel, M., Haslinger, K., Kireeva, M., Osuch, M., Sauquet, E., Stagge, J. H., and Van Loon, A. F.: Hydrology needed to manage droughts: the 2015 European case, Hydrol. Process., 30, 3097–3104, https://doi.org/10.1002/hyp.10838, 2016.
Vilhar, U.: Comparison of drought stress indices in beech forests: a modelling study, iForest, 635–642, https://doi.org/10.3832/ifor1630-008, 2016.
Vorobevskii, I.: Global_BROOK90 (v2.1 forecast), Zenodo [code] https://doi.org/10.5281/zenodo.8318913, 2023a.
Vorobevskii, I.: Supplement materials for publication: Seasonal forecasting of local-scale soil moisture droughts with Global BROOK90, HYDROSHARE [data set], https://doi.org/10.4211/hs.d882e83bae95438881c7b47f003e7a3c, 2023b.
Vorobevskii, I., Kronenberg, R., and Bernhofer, C.: Global BROOK90 R Package: An Automatic Framework to Simulate the Water Balance at Any Location, Water, 12, 2037, https://doi.org/10.3390/w12072037, 2020.
Vorobevskii, I., Kronenberg, R., and Bernhofer, C.: On the runoff validation of `Global BROOK90' automatic modeling framework, Hydrol. Res., 52, 1083–1099, https://doi.org/10.2166/nh.2021.150, 2021.
Vorobevskii, I., Luong, T. T., Kronenberg, R., Grünwald, T., and Bernhofer, C.: Modelling evaporation with local, regional and global BROOK90 frameworks: importance of parameterization and forcing, Hydrol. Earth Syst. Sci., 26, 3177–3239, https://doi.org/10.5194/hess-26-3177-2022, 2022.
Wagner, S., Kunstmann, H., Bárdossy, A., Conrad, C., and Colditz, R. R.: Water balance estimation of a poorly gauged catchment in West Africa using dynamically downscaled meteorological fields and remote sensing information, Phys. Chem. Earth Pt. A/B/C, 34, 225–235, https://doi.org/10.1016/j.pce.2008.04.002, 2009.
Wanders, N. and Van Lanen, H. A. J.: Future discharge drought across climate regions around the world modelled with a synthetic hydrological modelling approach forced by three general circulation models, Nat. Hazards Earth Syst. Sci., 15, 487–504, https://doi.org/10.5194/nhess-15-487-2015, 2015.
Wanders, N., Karssenberg, D., de Roo, A., de Jong, S. M., and Bierkens, M. F. P.: The suitability of remotely sensed soil moisture for improving operational flood forecasting, Hydrol. Earth Syst. Sci., 18, 2343–2357, https://doi.org/10.5194/hess-18-2343-2014, 2014.
Wanders, N., Thober, S., Kumar, R., Pan, M., Sheffield, J., Samaniego, L., and Wood, E. F.: Development and Evaluation of a Pan-European Multimodel Seasonal Hydrological Forecasting System, J. Hydrometeorol., 20, 99–115, https://doi.org/10.1175/JHM-D-18-0040.1, 2019.
Wood, E. F., Roundy, J. K., Troy, T. J., van Beek, L. P. H., Bierkens, M. F. P., Blyth, E., de Roo, A., Döll, P., Ek, M., Famiglietti, J., Gochis, D., van de Giesen, N., Houser, P., Jaffé, P. R., Kollet, S., Lehner, B., Lettenmaier, D. P., Peters-Lidard, C., Sivapalan, M., Sheffield, J., Wade, A., and Whitehead, P.: Hyperresolution global land surface modeling: Meeting a grand challenge for monitoring Earth's terrestrial water, Water Resour. Res., 47, W05301, https://doi.org/10.1029/2010WR010090, 2011.
Zappa, M., Bernhard, L., Spirig, C., Pfaundler, M., Stahl, K., Kruse, S., Seidl, I., and Stähli, M.: A prototype platform for water resources monitoring and early recognition of critical droughts in Switzerland, Proc. Int. Assoc. Hydrolog. Sci., 364, 492–498, https://doi.org/10.5194/piahs-364-492-2014, 2014.
Zink, M., Samaniego, L., Kumar, R., Thober, S., Mai, J., Schäfer, D., and Marx, A.: The German drought monitor, Environ. Res. Lett., 11, 074002, https://doi.org/10.1088/1748-9326/11/7/074002, 2016.
Zink, M., Kumar, R., Cuntz, M., and Samaniego, L.: A high-resolution dataset of water fluxes and states for Germany accounting for parametric uncertainty, Hydrol. Earth Syst. Sci., 21, 1769–1790, https://doi.org/10.5194/hess-21-1769-2017, 2017.