the Creative Commons Attribution 4.0 License.
the Creative Commons Attribution 4.0 License.
Where will the next flank eruption at Etna occur? An updated spatial probabilistic assessment
Alexander Garcia
Cristina Proietti
Stefano Branca
Gaetana Ganci
Annalisa Cappello
The assessment of the spatial probability of future vent opening is one of the key factors in quantifying volcanic hazard, especially for active volcanoes where eruptions can occur at different locations and altitudes over distributed areas. Mount Etna (Italy), one of the most active volcanoes in the world, exhibits such variability, and its flank eruptions can harm people, properties and services over the volcano's slopes. In this paper, we quantify the spatial probability of future vent opening for Etna's flank eruptions, adopting a kernel analysis and testing different functions (exponential, Cauchy, uniform and Gaussian). Starting from the assumption that the location of past fissures is indicative of where future events will occur, we consider the flank eruptions of the last 4000 years, thus accounting for a much longer and complete record than in previous studies. The large dataset of eruptive fissures enables splitting the data into training and testing subsets. This allows selecting the best kernel model, testing the completeness of the fissure dataset and investigating a possible migration through time in fissure location. The results show that neither under-recording nor possible migration over time significantly affects the informative value of previous flank fissures in forecasting the location of future ones. The resulting map highlights that the most likely opening area follows a northeast-to-south trend, corresponding to the location of the most active rifts. It also shows that the southern flank of the volcano, which is the most urbanized one, sits downhill of the largest cumulated probability area for flank eruption. We also run sensitivity analyses to test the effect of (i) restricting the data to the most recent 400 years and (ii) including the information on the stress induced on the mapped fissures by sources of deformation proposed in the literature for recent eruptions of Etna. The sensitivity analyses confirm the main features of the proposed map and add information on the epistemic uncertainty attached to it.
- Article
(26593 KB) - Full-text XML
-
Supplement
(2648 KB) - BibTeX
- EndNote
The location of future eruptions is one of the main sources of uncertainty in eruption forecasting and volcanic hazard assessment, especially at volcanoes that exhibit a large variability in the position of eruptive centres, such as extensive volcanic fields (e.g. the Auckland Volcanic Field; Bebbington and Cronin, 2011), large calderas (e.g. Campi Flegrei, Selva et al., 2010; Rivalta et al., 2019) or wide volcanic edifices characterized by the opening of eruptive vents at different altitudes along the flanks of the volcano (e.g. Pico del Teide, Martí and Felpeto, 2010; Nyiragongo, Favalli et al., 2009a; or Etna, Cappello et al., 2012). In such contexts, assessing the spatial probability of where future volcanic eruptions will occur is a challenging problem that must be tackled in order to avoid a biased hazard assessment. The spatial probability of vent opening can be evaluated by analysing the geological history and features of the volcanic area under consideration and by feeding suitable statistical models (e.g. Martin et al., 2004) with such information types.
Etna is a composite stratovolcano located along the Ionian coast of eastern Sicily and is characterized by a complex eruptive history that occurred over the last 500 kyr (Branca et al., 2008, 2011a). Its four summit craters – namely Voragine, North-East Crater, Bocca Nuova and South-East Crater – display nearly continuous eruptive activity. At the summit craters, Strombolian activity and lava fountaining episodes are often associated with short-lasting lava flows (Alparone et al., 2003). Eruptive events also occur at intervals of years to tens of years from the flanks of the volcano. These flank eruptions are generally effusive and can be accompanied by explosive activity (Branca and Del Carlo, 2005).
Flank eruptions at Etna pose a relevant societal and economic threat on a large spatial scale and exhibit a considerable variability in the location of eruptions along the flanks of the volcano edifice. In the last 400 years, lava flows from flank fissures (i.e. lateral eruptions) have severely impacted inhabited areas on Etna flanks, causing property loss and disruption of economic activities (Branca and Del Carlo, 2004). The 17th century saw the highest incidence of flank eruptions that impacted the lower slopes of Etna and its urban fabric (Branca and Abate, 2019). Lateral lava flows caused significant damage to the town of Bronte in 1651–1653 and to the city of Catania in 1669 (Guidoboni et al., 2014), destroyed the suburb of Linguaglossa in 1923 (Cerro and Catena) and the town of Mascali in 1928, and threatened the town of Randazzo in 1981 (Chester et al., 2012; Coltelli et al., 2012; Branca et al., 2017). Most of these events had limited impact, except for the 1669 and 1928 eruptions. In particular, the 1669 eruption was the most destructive event by the Etna volcano in historical times. This event conditioned the pattern of urbanization of the subsequent centuries and influenced the economic development across the southeast flank of the volcanic edifice (Branca et al., 2013, 2015a, 2017). The 1928 eruption led to the destruction of the small town of Mascali and the cutting of roads, railways, and power and telecommunication lines. More recently, lava flows of the 2001 and 2002–2003 flank eruptions damaged tourist facilities, which are located up to 2600 m elevation (Behncke and Neri, 2005). Occasionally, flank eruptions are accompanied by explosive activity, which, as in the case of summit eruptions, impacts the mobility by tephra dispersal and fallout, such as in 1669 (Mulas et al., 2016) and in recent times in 2001 (Andronico et al., 2008) and 2002–2003 (Scollo et al., 2007). Sometimes flank eruptions are accompanied by shallow seismicity on the eastern flank of the volcano, such as in October 2002 and December 2018 (Barberi et al., 2004; Alparone et al., 2020). In the last few decades, rapid development has occurred on Etna's flanks, with the creation of a wide network of lifelines and rapid growth of settlements (see Fig. 1a), often above lava flows from the historical period (Behncke and Neri, 2005). The inhabited areas (see Fig. 1a) cover over 154 km2 and include the city of Catania (298 616 inhabitants in February 2023; IST, 2023) and 41 more municipalities, with a total population of 1 029 107.
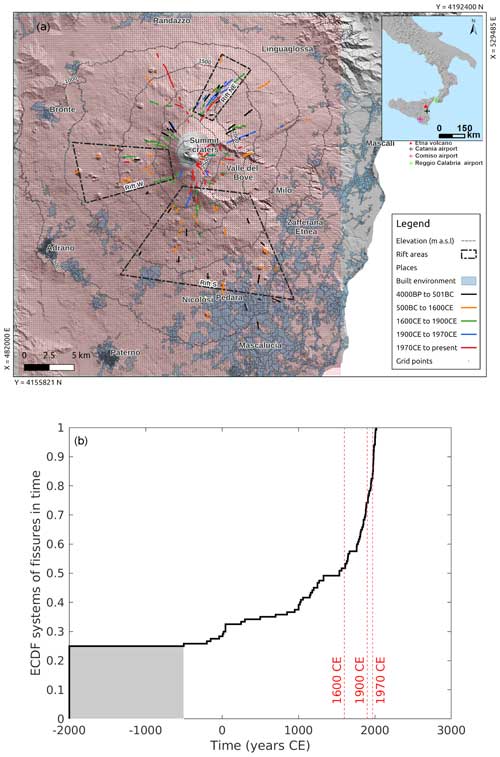
Figure 1(a) Grid (red dots) and fissures (different colours depending on their age; see legend) used in this study. The location and extent of the built environment is shown as shaded pale-blue areas. The three main rifts (northeast – NE, south – S and west – W) (according to Azzaro et al., 2012) are shown as dashed–dotted black lines. Altitude contour lines are shown as thin dashed black lines. The inset shows the location of the Etna volcano in southern Italy and the main airports that can be affected by its activity. (b) Empirical cumulative distribution function (ECDF) of the systems of fissures in time (solid black line). The dotted red lines indicate the different breaks in time used to partition the data into training and testing. The shaded grey area underlines the uncertainty in the age of events older than 500 BCE.
The flank eruptions of Etna in the last 15 kyr show a gradual clustering of the eruptive fissures. This evidences the development of some main weakness zones into the volcanic edifice, named northeast (NE), south (S) and west (W) rifts (see Fig. 1a), in which the recurrent intrusion of feeder dikes occurred, also under the action of an external stress field of tectonic or topographic origin (Maccaferri et al., 2011; Azzaro et al., 2012). In this framework, the present state of the knowledge of the flank eruptions that occurred on Etna in the past 2500 years, performed by Branca and Abate (2019), has evidenced that these events most frequently involve the southern sector, thus highlighting that the S rift (Fig. 1a) is the most active magma intrusion zone of Etna. In addition, temporal analysis of the elevation of the eruptive fissures outlines that their opening at low elevation (<1000 m a.s.l., above sea level) was common until the 17th century. Following the 1669 eruption, the opening of fissures is mainly concentrated in the upper-middle slopes, between 1600 m and 2500 m a.s.l., and no flank eruptions have occurred below 1000 m altitude (Branca and Abate, 2019).
In order to minimize the potential impact of lava flows on inhabited areas, it is crucial to define a spatial probability for the location of flank fissures. On Etna, different approaches have been proposed to assess the probability of future vent opening by analysing the geology and distribution of historical eruptions and the processes driving magma transfer (e.g. see Guest and Murray, 1979; Wadge et al., 1994; Behncke and Neri, 2005; Salvi et al., 2006; Favalli et al., 2009b; Cappello et al., 2013). Most of them are based on probabilistic analyses using the position of past vents. These studies considered the eruptions of the last 500 (Salvi et al., 2006) or 400 years (Guest and Murray, 1979; Behncke and Neri, 2005; Cappello et al., 2013) or even shorter recent periods (Wadge et al., 1994), owing to the lack of completeness in the pre-1600 eruption record and in the corresponding lava flow fields. The results of these analyses have confirmed the NE, S and W rifts (Fig. 1) as the most prone areas.
In this paper, we evaluate the spatial probability density function of future flank eruptions on Etna by applying a kernel technique to a longer dataset that includes the location of eruptive fissures having emplaced lateral lava flows during the last 4000 years. Such fissures are roughly oriented following a radial pattern (e.g. see Fig. 2a), directly correlated with the stress field in the volcanic cone (Acocella and Neri, 2009), so we consider these flank eruption fissures informative for the position of future flank eruptions. The choice to use the flank eruption fissures in the last 4000 years is based on the observation that flank eruptions in this time period are comparable to the current activity in terms of eruptive style, frequency, magnitude and main features. Moreover, the last 4000 years of Etna's activity is the best known period in the entire eruptive history of the volcano (Branca et al., 2011a).
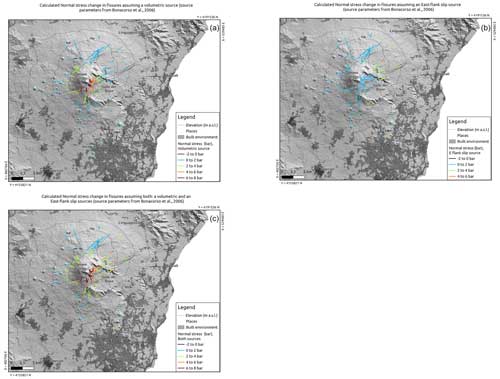
Figure 2Normal stress change on fissures in the catalogue (colours indicate normal stress change; positive values indicate unclamping), when (a) a volumetric source of deformation at depth is placed, (b) an eastward flank slip source of deformation at depth is placed, and (c) both a volumetric source and an eastward flank slip source of deformation at depth are placed. The volumetric and flank slip sources are taken from Bonaccorso et al. (2006). The location and extent of the built environment are shown in shaded dark-grey areas.
The data used in this study were reconstructed by analysing the Etna new geological map (NGM; Branca et al., 2011b) and considering the eruptive products having a lithostratigraphic position above the tephra layer related to the subplinian explosive eruption of picritic magma that occurred in 3930±60 ka (Coltelli et al., 2005).
The larger input dataset allows adopting a general strategy that consists in dividing the fissure input catalogue to obtain independent training and testing sub-datasets. This allows setting up a reference model on the training data based on specific hypotheses and then testing it on new and independent data (the test data). In this way, we are able to objectively judge the model performance. Further, if temporal coherence is kept among the training and testing data (i.e. training data are the older fissures; testing data are the younger ones), we can check whether there have been significant shifts in the spatial pattern of flank activity and/or systematic under-recording of past fissures in some areas. With the training–testing strategy, we are also able to objectively identify the best model among a set of competing ones, which we build to evaluate different assumptions: the best model, which we call “canonical map”, is the one that maximizes the likelihood of the test data.
Finally, we consider the sensitivity of our method and results to different time windows to select the input data and to the orientation of flank fissures in a stress field. For the latter point, we model flank fissures as planes in a stress field that is subject to changes due to deformation sources at depth: in this view flank fissures can be oriented more or less favourably for unclamping (or reduced compressive normal stress, indicated by a positive variation in normal stress) normal stress (e.g. Walter et al., 2005; Bonali et al., 2015; Dumont et al., 2024). At Etna different plausible deformation sources have been proposed in the literature (Bonaccorso et al., 2006; Bonaccorso and Aloisi, 2021). In this study, we build on alternative models for the proposed deformation scenarios to account for variations in the normal stress on the training eruptive fissures.
The geological history of Etna has been reconstructed by the NGM of the volcano, which particularly details the present volcanic centre, i.e. the Mongibello volcano, whose eruptive activity started at about 15 ka (Branca et al., 2011a, b). This dataset provides a detailed record of the spatial distribution of the volcanic products and of the eruptive fissures, as well as of their stratigraphic relationships. In particular, the historical flank eruptions are chronologically well constrained thanks to both the combination of stratigraphic and historiographical investigations and to the dating of all the lava flows occurring below roughly 2500 m altitude. Above this altitude, the products of the post-17th-century eruptions have almost covered the summit portion of the volcano (Branca and Abate, 2019). Finally, after the mid-17th century the record of flank eruptions is considered complete and accurate (Branca and Del Carlo, 2004).
2.1 Updating the fissure dataset
The first step of our work was to prepare the input data for the statistical analysis, namely the position, direction and extent of the eruptive fissures of the last 4000 years. To this end, we first selected all the flank eruptions in this time window from the Etna NGM and its updates (Branca et al., 2015b; Branca and Vigliotti, 2015; Branca and Abate, 2019). We also added information from other papers describing Etna volcanic activity (Behncke and Neri, 2005; Branca and Del Carlo, 2005; Tanguy et al., 2012). This resulted in a dataset of 193 lava flows, considering both the main and minor ones, that occurred in the last 4000 years, which was the starting point to localize the corresponding eruptive fissures. The main fissure of an eruption is defined as the one that fed the lava flow that had the longest duration, covered the widest area and had the greatest distance from the vent (Proietti et al., 2011). All the remaining fissures of an eruption are defined as minor ones.
Concerning the historical eruptive fissures covered by the eruptions that occurred from the 19th century, we integrated the dataset of the geological map of Branca et al. (2011b) with the previous 1:50 000 cartographies compiled by Sartorius Von Waltershausen (1848–1861) and Romano et al. (1979) and with the maps of the 1971–1991 eruptions (Azzaro and Neri, 1992). These fissures were traced on the basis of their geological evidence, such as along the central axis of spatter ramparts and scoria cones or at the main effusive vent of purely effusive eruptions. The dry portions of the fissures, i.e. those that did not give rise to eruptive activity, were not included in the dataset used in subsequent analyses. For each eruption, we considered all the mapped flows, both the main and the minor ones, and we associated each of them with the corresponding fissure. For some of the lava fields, it has not been possible to map the fissures that had been later partially or totally buried by more recent volcanic products. This was the case for minor lava fields or for other lava fields from purely effusive eruptions that were covered in the proximal portion, i.e. near the vent.
We obtained a total of 190 fissures that occurred in the last 4000 years that have been re-organized into 124 “systems of fissures”, each consisting of all the mapped fissures (both main and minor) that were active simultaneously in the same sector of the volcano, i.e. those related to the same eruptive event. In some cases (e.g. the 1978 eruptions in Valle del Bove, known to have occurred distinctively over time at different periods, or the 1879 one whose fissures opened in two distinct sectors of the volcano), the systems of fissures have been separated into different ones, as there was known separation in time and/or space. Among the identified eruptions in the last 4000 years, only those that opened in the last 2500 years have been dated by applying different techniques (Branca and Abate, 2019). For the older fissures, a common age of 2000 BCE was assigned, in order to label them as the oldest (older than 500 BCE) in our input dataset. The set of fissures in the last 4000 years is shown in Fig. 1a.
2.2 Target domain
The target domain adopted for calculating the probability of vent opening for flank eruption is represented in Fig. 1a (red dots): for simplicity, it is a rectangular regular grid of points (lower left and upper right centres are respectively (482590° E, 4156090° N) and (514790° E, 4191890° N) on the WGS84 33N UTM zone, with a grid spacing of 200 m), over which a mask covering the summit area (the polygon enclosing the summit caldera and craters) is applied to exclude the summit area. It consists of NC=28 975 grid cells.
In the Supplement we provide a CSV file containing the UTM coordinates and the elevation of each grid point.
We build the spatial probability of flank eruption, conditional to the occurrence of such an eruption at Mount Etna, with a spatial kernel method (Lutz and Gutmann, 1995). In order to account for the spatial extension and direction of fissures, we consider that the location and orientation of each fissure influence the spatial rate of flank opening as an elongated structure. In other words, in applying the classical kernel method, the rate of flank opening in a given point (xP, yP) of the target domain is affected by the Nf known past fissures (main and minor) by
where di is the minimum Euclidean distance between (xP, yP) and the ith linear fissure element in the easting and northing system of reference (i.e. neglecting altitude difference), and is a probability density function of the kernel function adopted, with zero mean and h smoothing parameter related to the dispersion around the mean (i.e. the standard deviation for the Gaussian case). The smoothing coefficient h is indicative of the degree of clustering between fissures (Martin et al., 2004) and must be determined by the available data, along with the best kernel function. We tested whether adding the altitude coordinate (extracted from a 5 m resolution Etna digital elevation model) in the computation of the Euclidean distance between two elements had a significant effect on it. We found that relative differences were of the order of a few percent or smaller, so we neglected the altitude coordinate.
The spatial probability of future flank fissures opening in a given point (xP, yP) is computed by renormalizing over all the NC grid cells on the considered domain:
Given the large dataset available for this study, we have the chance to divide the data into training and testing sets. In this way, we are able to set up different models on the training data (as input to Eq. 1), assuming different kernel functions and related parameter values. In such a case, Nf corresponds to the number of fissures in the training set. The best combination of kernel function and smoothing parameter values is then selected by judging the capability of the different models to reproduce the testing data, which are new and independent data with respect to those used to set up the models.
Once the best combination of kernel function and smoothing parameter values is identified, the full dataset (i.e. using both training and testing fissures) is used to compute (with Eq. 2) a reference map of the spatial probability of future flank fissure opening (which we call the canonical map).
3.1 Partition into training and testing datasets
There is no univocal method to partition the data into training and testing subsets. Here, to test both the effect of under-recording of fissures as we go back in time and the effect of possible spatial migration in the flank activity with time, we partition the input data into training and testing, respecting temporal order: training data are older, and testing data are younger. However, no sharp criterion on where to set the border between “older” and “younger” data exists. In Fig. 1b, we show the empirical cumulative distribution function (ECDF) of the number of fissures in time. We highlight that the large step at 2000 BCE is an artifact due to missing dates for systems of fissures older than 500 BCE, and thus they have been assigned a common age of 2000 BCE to build the ECDF. In Fig. 1b, we also highlight different dates corresponding to breaks in slope that can be subjectively identified by visual inspection. The partition at 1600 CE can be related to the fact that the catalogue of flank eruptions is complete starting in the 17th century; the partition at 1900 CE could be linked to the increased activity around the northeast rift system since 1908 (Behncke and Neri, 2003), and the 1971 partition can be associated with the increase in the lava output and frequency of eruptions that began after 1970 CE (Branca and Del Carlo, 2004; Cappello et al., 2013), also related to the formation of the South-East Crater that formed as a pit crater in 1971 (Salvi et al., 2006; Del Negro et al., 2013; Rittman et al., 1971; Branca et al., 2021). In order to set the border between training and testing data, we use the visual breaks in slope of the ECDF shown in Fig. 1b. Since there are three breaks in slope, we test three different partitions (see Table 1, first three rows); this allows checking the stability of our results with different partition dates.
Table 1Different partitions or training and testing data explored (first two columns respectively). In columns 3 and 4 we provide, for each partition, the pair of kernel function and smoothing parameter values that fit well the ECDF of the distance to the nearest system of fissures in the training data and is capable of explaining the testing data (p values > 5 %). See text.

3.2 Identification of the best kernel function and degree of clustering
The first step in applying a spatial kernel method is to select a type of kernel function and the value for the smoothing coefficient. In this study, we use the method proposed by Martin et al. (2004): by comparing the ECDF of the distance to the nearest-neighbour system of fissures to the cumulative distribution computed by using different kernel functions and suitable values of the smoothing coefficient, we estimate the best pair of kernel function and smoothing coefficient for each training set in the three different partitions of the data in the last 4000 years. In practice, our method selects the best pair as the one that best describes the ECDF of the distance between a fissure and the closest fissure of the nearest system that opened during a different eruption. We neglect the distance among fissures belonging to the same system, since they opened during the same eruption, so we do not deem them indicative of where a successive eruption will take place.
In this work, we test four different possible kernel functions that all decay with distance: Gaussian and Cauchy (as in Martin et al., 2004) and exponential and uniform. The exponential kernel was used following the assumption that future fissures will not open far from existing ones and that the likelihood of a new fissure decays much more rapidly with distance than with the Cauchy and Gaussian kernels. The uniform kernel was considered to account for a uniform smoothing over a given distance. In other words, the uniform kernel represents the case in which we do not rank points within a given distance from a fissure as more or less prone to a new opening, accounting also for the uncertainty in the fissure location.
We repeat the selection of the best pair of kernel function and degree of clustering for three partitions between training and testing datasets of fissures (first three rows in Table 1) to test the stability of the results. Once the best pair for a given partition is selected, we build a reference probability model by applying Eq. (1) to the training data for that partition (Table 1).
3.3 Model performance evaluation
For each of the three reference models (one for each partition of the data in the last 4000 years), in order to judge their performance on the testing data, we repeat the following procedure.
First we compute the log likelihood of observing the testing data under the reference model similarly to Marzocchi et al. (2016):
where NY is the number of grid cells that host the trace of at least one test fissure, and NN is the remaining number of grid cells (i.e. ).
We then generate 100 synthetic catalogues of fissures based on the reference model, in which synthetic fissures are randomly placed on the target grid, with a higher chance where the reference model has larger λ. Each synthetic catalogue consists of the same number of fissures as in the test dataset. Further, the length of each synthetic fissure is sampled without replacement from the test catalogue. This implies that the number of grid cells hosting a synthetic fissure is NY as for the real test data, and this is an important requirement for synthetic- and real-catalogue likelihoods to be comparable. In fact, for each jth synthetic catalogue, we compute the log likelihood of observing the synthetic data under the reference model similarly to Eq. (3). By comparing the log-likelihood value of the real test data to the cumulative distribution of the 100 log-likelihood values of the synthetic catalogues, we can judge whether the real test data are a plausible sample of the reference model or whether they are a very unlikely sample (or whether the p value on the left tail > or ≤5 %).
3.4 Sensitivity analysis
So far, we have described the method of achieving a reference model, based on the data of the last 4000 years. In order to evaluate how much our results and tests change according to different hypotheses and assumptions, we repeat the model training and testing both considering (i) a shorter time window for the input data (i.e. since 1600 CE) and (ii) the potential effects of other phenomena such as the stress change on the mapped fissures induced by different plausible deformation source scenarios in Etna's recent eruptions, proposed in the literature (Bonaccorso et al., 2006; Bonaccorso and Aloisi, 2021).
3.4.1 Using only the data since 1600 CE
As a first sensitivity analysis, we re-apply our strategy only considering the most recent part of the input data, the last 400 years, considered to be a complete catalogue of the flank eruptions at Etna. For this time window, we partition the data into training and testing at 1900 CE (Table 1, bottom line), thus using the data from the oldest 300 years for training the model and those from the most recent 120 years for the testing. We remark that this time window neglects the older portion of the catalogue, which captures flank eruptions similar, in terms of eruptive style, frequency and magnitude, to the recent ones. However, this time window is similar to that used in previous studies (Salvi et al., 2006; Guest and Murray, 1979; Behncke and Neri, 2005; Cappello et al., 2013).
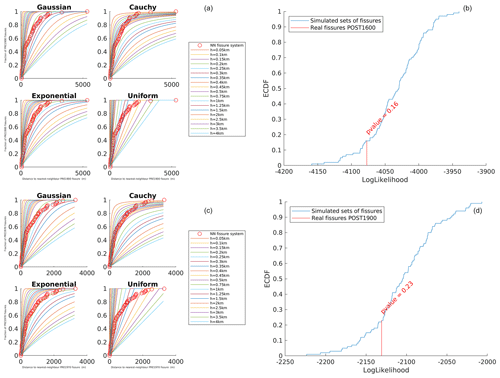
Figure 3Empirical cumulative density functions (ECDFs) of the distance to the nearest system of fissures (red dots) for the training period 2000 BCE to 1600 CE (a) and 1600 to 1900 CE (c). The curves represent the theoretical cumulative for different kernel functions (Gaussian, Cauchy, exponential and uniform) and smoothing parameter h, as in the legends on the right for each case. ECDFs of the log likelihood of synthetic catalogues of synthetic fissures (black line) under the reference model for the training period (b) 2000 BCE to 1600 CE (exponential kernel, h=1250 m) and (d) 1600 to 1900 CE (exponential kernel, h=1000 m). In red we point out the value of the log likelihood achieved by the reference model on the real testing data, providing the p value in percent.
3.4.2 Inclusion of stress changes due to different deformation sources
Theoretical studies have demonstrated that the trajectories of dikes underneath topography are affected by a balance among the topographic load, buoyancy forces, external stresses and the free surface (e.g. Davis et al., 2021). Host rock stresses then influence magma pathways, and eruptive fissures tend to align themselves with the most energy-efficient orientation, which is roughly perpendicular to the least compressive principal stress axis (σ3; e.g. Anderson, 1951; Pollard, 1987; Dahm, 2000; Gudmundsson, 1995; Maccaferri et al., 2010; Roman and Jaupart, 2014; Rivalta et al., 2019). As mentioned in the Introduction, eruptive fissures at the cone-shaped Etna volcano are roughly oriented in a radial pattern (e.g. see Fig. 2a); for example according to Acocella and Neri (2009), such a pattern is directly correlated with the stress field in the volcanic cone, and this is the reason why we want to test whether fissure orientation adds further information on the location of flank eruptions.
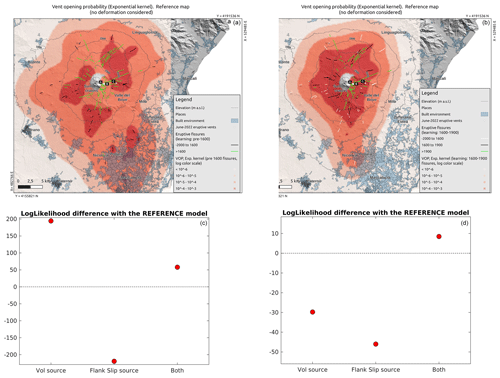
Figure 4(a, b) Spatial probability (colours in log scale) distribution of flank opening under the reference model for the training period 2000 BCE to 1600 CE (a) and 1600 to 1900 CE (b). In black and green the training and testing (i.e. respectively post 1600 CE and post 1900 CE for a and b) fissures. In panel (b), in white solid lines we show the fissures older than 1600 CE, which are not used in the case of panel (b). (c, d) Log-likelihood difference between the models weighted with the three deformation sources explored (volumetric, flank slip and both) and the reference model of panels (a) and (b) respectively. Positive differences (values above the dashed line) indicate the best performance on the testing data with respect to the reference model.
When deformation processes take place underneath the volcano, it is possible to foresee changes in normal and shear stresses in fracture planes, the magnitude of which depends also on the orientation of the plane with respect to the deformation source (e.g. Stein, 1999; Lin and Stein, 2004; Walter et al., 2005). According to this observation, in this work we are interested in evaluating whether changes in normal stresses on fissure planes, associated with different deformation scenarios, are informative to improve our spatial assessment of flank-opening likelihood. In particular, we assume that unclamping, a reduced compressive normal stress on the fissure plane (and conventionally indicated by a positive variation in normal stress), can favour fissure opening. In practice, we compute the normal component of the compressive stress change on the fissures in the catalogue accounting separately for two possible sources of deformation: a volumetric source at depth feeding of the volcanic system and a lateral slip of the eastern flank of the volcano towards the Ionian Sea. These sources of deformation have been proposed recently in the literature (Bonaccorso et al., 2006; Bonaccorso and Aloisi, 2021) to explain the deformation patterns observed in GPS data. We also account for a linear combination of the stress change due to both sources if active simultaneously. We acknowledge that these two sources may not be active systematically and with the same intensity in a constant way; however, we argue that, when they are active, the assumption that the stress pattern (i.e. the relative stress difference over the fissures) does not change sign but is mostly enhanced or decreased depending on the deformation intensity and location can be acceptable at first order.
In order to compute the stress on a given fissure, we assume the fissure as the intersection with the Earth's surface of a vertical structure. We use the software Coulomb 3.3 (Toda et al., 2005; Lin and Stein, 2004) to compute the compressive stress change (normal and shear components) in vertically oriented fissures assuming the deformation caused by the active sources proposed recently in the literature for Etna, retrieved by inverting the displacement recorded at the surface. In particular, we model the sources defined according to data from Table 2 in Bonaccorso et al. (2006). The first source is volumetric, with a volume of 7.9×10⁶ m3 located at the point (499634° E; 4177478° N) in UTM coordinates and at depth 2.9 km b.s.l. (below sea level). We also performed tests varying the depth from 2.9 to 6.0 km b.s.l., without significant changes in the relative stress change distribution. The second source is a slip of the eastern flank, with the coordinates of the top centre of the plane at (505375° E; 4172644° N) in UTM coordinates, at a depth 0.6 km b.s.l., with azimuth angle relative to North of 8°. The length and the width of the plane are 20.3 and 25 km respectively; its dip angle is 11.2°. The slip on the plane is −0.042 m in strike direction and −0.077 m in dip direction. In all of the cases, we use Poisson's ratio equal to 0.25 and Young’s modulus 8.0×10⁵ bar.
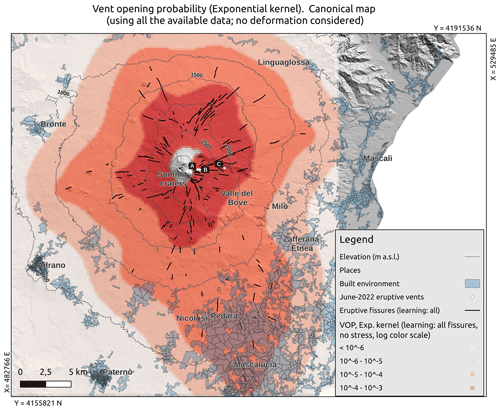
Figure 5Map of the probability (colours in log scale) of the flank fissure opening at Etna, based on the data 2000 BCE to present (solid black lines), in what we call the canonical model. The locations of the vents active in June 2022 are indicated by white points and labelled A, B and C. The location and extent of the built environment are shown as shaded pale-blue areas, and altitude contour lines are shown by dashed black lines.
We then assign a weight ωi to each fissure depending on the sign and intensity of the normal component of the compressive stress, ranging from 0 (if the fissure is subject to clamping or is neutral) to 1 (if it is the fissure with maximum unclamping stress). In Fig. 2 we show different colour shades the normal stress change on the fissures in our dataset (negative and positive respectively for clamping and unclamping) according to the three sources of deformation considered in this study: volumetric, flank slip and both of them. We then rebuild reference models for each of the partitions into training and testing reported in Table 1, considering the weights due to the deformation source S as
For each partition, we then compute the log likelihood of the model considering the deformation source S on the testing data, enabling the comparison with the unweighted reference model by means of the log-likelihood difference: if the weighted model that considers the deformation source S has a larger likelihood on the testing data (positive log-likelihood difference), then it means that it outperforms the unweighted model in explaining the testing data, so it must be preferred, otherwise not.
We repeat this for each source of deformation (volumetric, flank slip, both), in each case identifying those fissures experiencing unclamping stress, i.e. those fissures located and oriented favourably for opening.
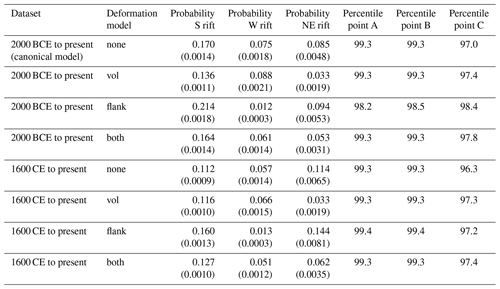
Table 2Columns 3–5: probability of future flank eruption in the different rifts (south, west and northeast respectively in columns 3, 4 and 5) and in parentheses the probabilities normalized per square kilometre. Columns 6–8: percentiles of the points A, B and C (respectively columns 6, 7 and 8) located at the three vents active in June 2022 on Etna (e.g. Fig. 6). The rift probabilities and the June 2022 vents' percentiles are relative to the spatial probability distribution for flank eruptions computed for different data periods (first column) and deformation sources (second column).
4.1 Reference model on training data and test on independent data
In Fig. 3a we show the comparison of the ECDF of the real training data (dots) with the theoretical cumulative distribution of the distance to the nearest system of fissures for the different types of kernel function explored (Gaussian, Cauchy, exponential and uniform) and different values of the smoothing coefficient h for the training set 2000 BCE to 1600 CE. By computing the RMSE between the ECDF points and the cumulative of the different kernel functions, we find that the exponential model is always among the best ones in explaining the real ECDF, with best h values ranging from 500 to 1000 m for the partitions testing on recent data (1900 CE or later) up to 1250 m when testing also on older data (see Table 1). We see that the smoothing factor does not change dramatically when different boundaries between training and testing data are set.
In Fig. 3b we show the ECDF of the log likelihood of the synthetic testing datasets sampled from the reference model built with the exponential kernel and smoothing factor h=1250 m for the partition shown in Fig. 3a, with a red bar showing the value of the log likelihood of the real testing data (i.e. the data between 1601 CE and the present; see Table 1). Based on this analysis, we cannot reject the hypothesis of the reference models built on the training data by means of the exponential kernel being able to explain the real testing data.
In Fig. 4a we show the reference model built on the training data 2000 BCE to 1600 CE with the corresponding best combination in kernel function and smoothing parameter (i.e. for the case shown in Fig. 3b and first row in Table 1). For a visual inspection, we overlay the training and testing fissures.
4.2 Sensitivity analysis
In Fig. 3c we show the same results as Fig. 3a when considering only the most recent portion of input data (last 400 years), with the training set from 1600 to 1900 CE and the testing set from 1901 CE to present. Also in this case, according to the RMSE, the exponential model is the best one in explaining the real ECDF, with the best h value around 1000 m (see Table 1, bottom line). In Fig. 3d we show the ECDF of the log likelihood of the synthetic testing datasets sampled from the reference models built with the exponential kernel and smoothing factor h=1000 m for the case of Fig. 3c. Similarly to the case above (and to the other two partitions considered; see Appendix), we cannot reject the hypothesis of the reference models built on the training data by means of the exponential kernel being able to explain the real testing data. The reference model built on the training data 1600–1900 CE is shown in Fig. 4b. The main difference between this map and the one built on the training period 2000 BCE to 1600 CE is related to the fissures located at high elevation (>2500 m a.s.l.), which are included in the testing set in Fig. 4a and partially in the training set in Fig. 4b. The comparisons for the other two partitions explored when considering the data from the last 4000 years, as well as all the other results for those two partitions, are provided in the Appendix (Fig. A1).
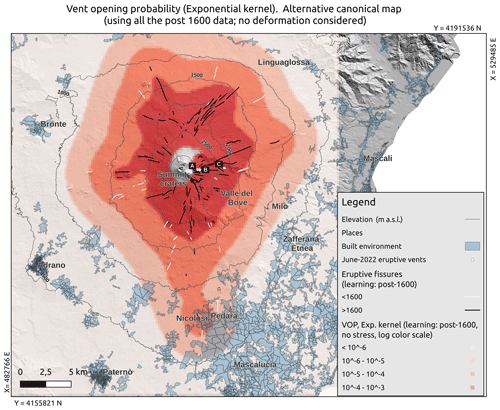
Figure 6Result of the sensitivity analysis: map of the probability (colours in log scale) of flank fissure opening at Etna, based on a shorter time window for input data (1600 CE to present, solid black lines). The locations of the vents active in June 2022 are indicated by white points and labelled A, B and C. The location and extent of the built environment are shown as shaded pale-blue areas, and altitude contour lines are shown as dashed black lines. In solid white lines we show the oldest fissures (2000 BCE to 1600 CE) not used in these maps.
In Fig. 4c and d, we show the log-likelihood difference, compared to the reference models of the two cases shown in Fig. 4a and b, of the models built when considering the orientation of fissures and the normal stress change due to different deformation sources, i.e. volumetric at approximately 3 km b.s.l. depth, flank slip towards the east and a combination of both (Sect. 3.4.2). We can see that the gain in model performance when weighting the training fissures according to their favoured orientation to unclamping stress is not univocal: the weighting according to the volumetric source of deformation is the one that maximizes the gain in likelihood in three out of four partitions (see also the Appendix for the training on 2000 BCE to 1900 CE and 2000 BCE to 1970 CE; Fig. A2), except in the case of training on 1600 to 1900 CE, where that model is rejected, and the preference is to use both volumetric and flank slip sources. In all of the examined cases, the flank slip source by itself never gives rise to the preferred model.
In the Supplement we provide a CSV file containing, for each grid point, the probability according to the canonical model and to all the sensitivity test models (eight models in total).
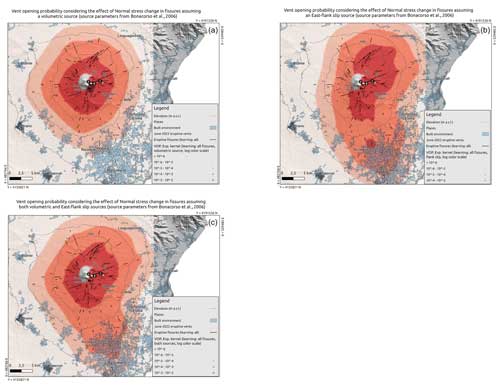
Figure 7Sensitivity analysis: maps of the probability (colours in log scale) of flank fissure opening at Etna, based on the data 2000 BCE to present (solid black lines), considering the unclamping stress in the input fissures. Panels (a)–(c) correspond to, respectively, information from the volumetric, flank slip and both sources. In each panel, the locations of the vents active in June 2022 are indicated by white points and labelled A, B and C. The location and extent of the built environment are shown as shaded pale-blue areas.
5.1 A canonical spatial probability map for future flank fissures based on the last 4000 years of data
Based on our analysis of the position of flank fissures at Etna in the last 4000 years, a spatial map for flank fissure opening at Etna built with an exponential kernel should be able to forecast the position of the future fissures better than chance. On the one hand, the position of the past systems of fissures seems informative of the preferred positions of fissures that will open afterward. On the other hand, the results we have achieved by splitting the data into training and test subsets (Fig. 3b–d) show that (i) data incompleteness (unavoidable in such volcanic settings of high activity rate on a time period of thousands of years) does not seem to deteriorate the forecasting capability to an excessive degree and that (ii) there is no significant evidence of a systematic spatial migration in time during the past 4000 years. As a consequence, we propose a probabilistic model for the opening of future flank fissures based on Eq. (1) and using the complete dataset of known fissures in the last 4000 years and the largest smoothing parameter value for this case (h=1250 m, top row in Table 1). This model, which we call “canonical”, is shown in Fig. 5 (colours are represented using a logarithmic scale; see Fig. A3 in the Appendix for the colours in linear scale) and is based on the longer set of data available (the last 4000 years), still representative of the present state of Etna volcano. This map is based only on geological data, with the only assumption that future eruptions are more likely to open close to past flank eruption fissures. Furthermore, the input dataset includes only the active portion of the past fissures, i.e. those effectively feeding an eruption.
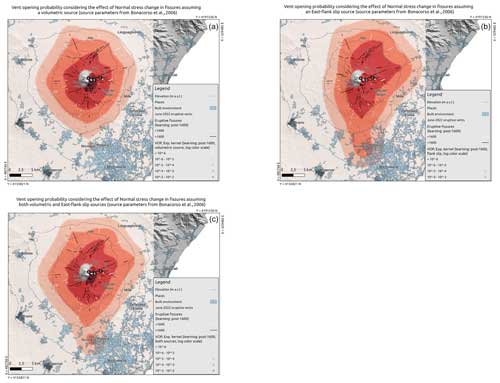
Figure 8Sensitivity analysis: maps of the probability (colours in log scale) of flank fissure opening at Etna, based on the data 1600 CE to present (solid black lines), considering the unclamping stress in the input fissures. Panels (a)–(c) correspond to, respectively, information from the volumetric, flank slip and both sources. In each panel, the locations of the vents active in June 2022 are indicated by white points and labelled A, B and C. The location and extent of the built environment are shown as shaded pale-blue areas. In solid white lines we show the oldest fissures (2000 BCE to 1600 CE) not used in these maps.
Overall, the canonical map clearly shows that the opening of fissures higher up towards the summit of the volcano (i.e. approximately >1500 m a.s.l.) has probabilities 2–3 orders of magnitude larger than positions located at low altitudes. This is expected due to the higher density of fissures at higher elevations, yet it is possibly underestimated by the overlapping of younger lava flows burying older fissures. A clear north-to-southeast stretch in the probability pattern emerges, due to the density of fissures along the NE and S rifts (e.g. Ruch et al., 2010). This north-to-southeast stretch also shows that, on the SSE flank, intermediate probability values (10−5 to 10−4) can be found at low altitudes, that is, down to approximately 300 m a.s.l., enclosing densely populated areas immediately upstream of the city of Catania (e.g. the municipalities of Nicolosi, Mascalucia and Pedara; see Fig. 5). Moreover, on the SSE flank the probabilities are not negligible (10−6 to 10−5) up to very low elevations, i.e. about 100 m a.s.l. In contrast, in the other directions the intermediate probabilities are found at altitudes greater than 1000 m a.s.l. and enclosing inhabited areas only to a limited extent. With respect to the previously available maps in Cappello et al. (2012, 2013), we see that our results confirm a northeast to southeast pattern in the highest probability already highlighted in those papers. Considering that the Mongibello flank eruptions showed a gradual clustering along the northeast, south and west rifts (Azzaro et al., 2012), we investigated whether this clustering is confirmed by our probability analyses. In Table 2 (first line) we show the cumulated probability of future flank opening in the different rift areas (these areas are shown in Fig. 1 by dashed–dotted black lines). Since the spatial extent of the three rifts is very different (NE ≈ 18 km2; S ≈ 119 km2; W ≈ 42 km2), in Table 2 we also show in parentheses the probability normalized per unit area (per square kilometre). The S rift has the highest cumulated probability among the rifts. This result is coherent with the fact that the S rift has been the main zone of magma intrusion for the last 2500 years (Branca and Abate, 2019). However, the S rift is by far the largest one, so a comparison of the normalized probability per unit area is also useful: it shows that the NE rift is the one characterized by a spatial peak in the probability, with a normalized value about 3–4 times larger than for the W and S rifts respectively. The W rift has the lowest normalized probability value. For comparison, the cumulated probability of flank eruption outside the rifts is about 0.67 spread over a very large area, resulting in a probability per unit area of per square kilometre, which is an order of magnitude lower than in the W rift, the lowest-probability one. We note that the S rift is the one much closer to, and partially covering, areas characterized by intense urbanization. From a risk perspective, a more “diffuse” and less peaked spatial probability of a future flank eruption on the S rift poses a hazard characterized by a large aleatory uncertainty (e.g. see Marzocchi and Jordan, 2014) on the southern flank of the volcano. The S rift is also the one with non-negligible probability at the lowest elevations and closest to urbanized areas: below 1000 m a.s.l. the cumulated probability of flank opening in the S rift is approximately 0.04, whereas below 500 m a.s.l., where most urbanization is found, it is around 0.03.
5.2 Sensitivity analysis: alternative maps
Considering only the flank fissures that opened in the most recent 400 years in Eq. (1), the best kernel distribution for this case (exponential with h=1000 m; bottom row in Table 1) yields the probabilistic model shown in Fig. 6. Similarly to the canonical model in Fig. 5, this map confirms that high-altitude vent positions have larger probabilities. It shows higher-resolution details in probability changes (due to a smaller smoothing parameter value), but it neglects the fact that distal fissures have opened at Etna in the previous 3600 years. Indeed, the probability pattern is more peaked at higher altitudes (i.e. >1500 m a.s.l.); at lower altitudes it has lower values than in the previous case. Similarly to the canonical map (Fig. 5), the opening probability based on the last 400-year fissures shows a clear north–south stretch (Fig. 6). However, compared to the canonical map, it yields much lower values at elevations where inhabited areas are present, for example below 500 and 1000 m in the south and west slopes respectively.
The addition of the information from the unclamping stress transferred from a volumetric source of deformation at depth and/or an eastward flank slip movement does not univocally improve or deteriorate the forecast on the position of future fissures: this analysis shows contrasting results when different partitions of training and/or testing data are assumed (Fig. 4c and d). When giving a higher weight to fissures favourably oriented to unclamping in response to a volumetric stress change (Figs. 7a and 8a), the probabilistic pattern is roughly axisymmetric. In all of the remaining cases, the north-to-south stretch in the probability pattern appears as in the canonical map of Fig. 5, especially when stress changes due to an eastward flank slip are included (Fig. 8b–c), due to the favoured orientation of many fissures in this condition.
For comparison with the canonical model of Fig. 5, in Table 2 we also provide the cumulated probability of future flank opening in the different rift areas computed under the alternative models explored in the sensitivity analysis. The inclusion of the effect of unclamping stress on fissures does not affect the main findings when the last 4000 years of data are used (rows 2–4 in Table 2). However, when we weight the fissures with the unclumping stress under a volumetric change in the deformation pattern, the normalized probability in the W rift becomes the largest, whereas when the flank slip mechanism is accounted for, it becomes negligible compared to the other two rift areas.
Using only the last 4 centuries of data to build the probability maps does not change these findings significantly (rows 5 to 8 in Table 2). The most evident effect is that, overall, the NE rift has larger probability values than those achieved using all the last 4000 years of the fissure catalogue, and conversely the S rift probability decreases slightly.
In the Appendix we provide the same maps (canonical model and alternative ones) using a linear scale for the colour ramp (Figs. A4–A6).
After completing the data analysis and model setup for this paper, at the beginning of June 2022, there were three active vents producing lava flows on Etna (https://www.ct.ingv.it/Dati/informative/vulcanico/ComunicatoETNA20220612201349.pdf, last access: November 2024). Their locations are shown in Figs. 5–8 (points labelled A, B and C). Since these vents had not been used in building the probability maps, their position is tested to check whether they have opened in high-probability areas. In Table 2 we show the overall percentiles of these three vents in the distributions computed on the basis of different data periods (data since 2000 BCE or 1600 CE) and deformation models. In all cases we see that the vents active in June 2022 opened in areas with probabilities well above the 95th percentile, and in most of the combinations of data periods and deformation models, points A and B are above the 99th percentile. We consider this a small piece of evidence in favour of our maps being an informative and quantitative tool to forecast the position of future vents.
In this work, we have reconstructed the most complete and up-to-date catalogue of flank fissures at Etna that opened in the last 4000 years, based on the most recent and complete update of the geological map of Etna, which represents significant progress in the geological studies of this volcano over the last 30 years (Branca et al., 2011b).
We have used this catalogue to build a spatial probability model for fissure opening in future flank eruptions at Etna. The proposed model extends and improves the previous ones available in the literature, as the temporal range that our input data cover (4000 years) is larger with respect to previous works (up to 500 years; Guest and Murray, 1979; Behncke and Neri, 2005; Wadge et al., 1994; Salvi et al., 2006; Favalli et al., 2009b; Cappello et al., 2013), and it is based on a more complete and updated geological map.
Since the reconstructed catalogue is composed of over 120 systems of fissures, we were able to split the data into training and testing subsets. This allowed us to perform an objective evaluation of the model performance on independent data with respect to those used in the model setup. It also allowed excluding the possibility that the unavoidable (over a time interval of 4000 years) data incompleteness significantly deteriorates the forecasting capability of the location of flank fissures based on the position of previous ones. Finally, it excluded a systematic and significant spatial migration in time during the past 4000 years.
The proposed canonical model shows that high-altitude flank fissures are more likely by 2–3 orders of magnitude with respect to the lower-altitude ones. It also confirms a northeast to southeast pattern of higher probability, which involves the highest urbanized flank immediately upstream of the city of Catania, as already found by Cappello et al. (2012, 2013).
In order to check the effects of the hypothesis and assumptions of our model, we build alternative models based on (i) a shorter time window of data (only the last 400 years, a period that is considered complete in terms of flank fissure recording) and (ii) a weighting of the past fissures according to the unclamping stress exerted by changes in the normal stress due to different deformation patterns at depth. We considered two deformation sources proposed recently in the literature (Bonaccorso et al., 2006; Bonaccorso and Aloisi, 2021), i.e. a volumetric source at depth and an eastward flank slip of the eastern flank of Etna, and a combination of the two. The canonical map based on the last 4000 years shows non-negligible probabilities at elevations lower than those based on the last 400 years. This result is in agreement with the opening of fissures at low altitudes (below 1000 m a.s.l.) observed before the 1669 CE eruption and subsequently with their greater concentration in the mid-slopes to upper slopes (Branca and Abate, 2019). Both the maps based on the last 4000 and 400 years show that the three rifts (NE, S and W; Azzaro et al., 2012) are the areas with highest probability per unit area of flank fissure opening. The low elevations to which the probability of opening on the S rift extends, especially when considering the canonical map, and the intense urbanization within this area imply a high risk there.
We argue that averaging the canonical map and the alternative ones into a single, weighted map may not be the best solution for two reasons. First, in potential unrest characterized by a specific deformation pattern, having separate vent-opening maps based on alternative deformation source models allows for giving more credit to the map based on the deformation pattern that is similar to the ongoing one. Secondly, in case the vent-opening maps are used for hazard assessment (e.g. coupling them to simulations of lava flows or tephra dispersal from different vents; e.g. Favalli et al., 2009b; Del Negro et al., 2013; Selva et al., 2010; Martinez Montesinos et al., 2022), a portfolio of vent-opening maps allows a disaggregation of the contribution to the total hazard. In this view, the canonical map and the alternative ones encompass and quantify the epistemic uncertainty.
In this Appendix we provide six figures related to some of the sensitivity analyses not shown in the main text. In Fig. A1 we show the results of the analysis of the degree of clustering using other partitions of the data into training and testing datasets (different from those shown in the main text).
In Fig. A2 we show the reference models and the results of the sensitivity analysis to different sources of deformation for other partitions of the data into training and testing datasets (different from those shown in the main text).
In Fig. A3 we show the canonical model in linear scale.
In Fig. A4 we show the probability model achieved with the sensitivity test using only the last 400 years of data in linear scale.
In Fig. A5 we show the probability models, in linear scale, achieved with sensitivity tests on the canonical model based on different weighting of past fissures according to different sources of deformation.
In Fig. A6 we show the probability models, in linear scale, achieved with sensitivity tests on the model based on different weighting of past fissures according to different sources of deformation and built on the last 400 years only.
We also provide a table (Table A1) with the polygons defining the three rifts, taken from Azzaro et al. (2012).
Table A1Points defining the polygons of the three rifts from Azzaro et al. (2012). Coordinates are given in UTM coordinates, 33T zone.
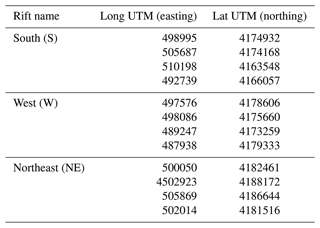
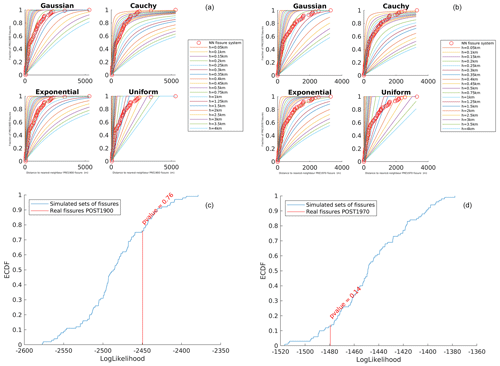
Figure A1(a, b) Empirical cumulative density functions (ECDFs) of the distance to the nearest system of fissures (red dots) for the training period 2000 BCE to 1900 CE (a) and 2000 BCE to 1970 CE (b). The curves represent the theoretical cumulative for different kernel functions (Gaussian, Cauchy, exponential and uniform) and smoothing parameter h, as in the legends on the right for each case. (c, d) ECDFs of the log likelihood of synthetic catalogues of synthetic fissures (black line) under the reference model for the training period (c) 2000 BCE to 1900 CE (exponential kernel, h=1000 m) and (d) 2000 BCE to 1970 CE (exponential kernel, h=500 m). In red we point out the value of the log likelihood achieved by the reference model on the real testing data, providing the p value in percent.
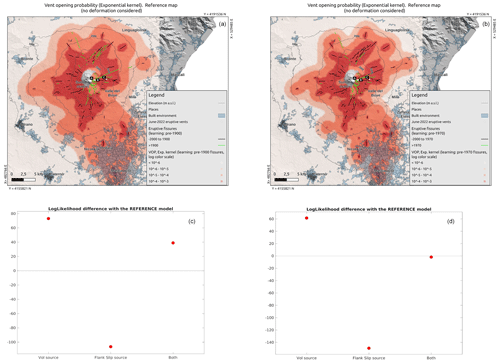
Figure A2(a, b) Spatial probability (colours in log scale) distribution of flank opening under the reference model for the training period 2000 BCE to 1900 CE (a) and 2000 BCE to 1970 CE (b). In black and green the training and testing (i.e. post-1900 CE and post-1970 CE for a and b respectively) fissures. (c, d) Log-likelihood difference between the models weighted with the three deformation sources explored (volumetric, flank slip and both) and the reference model of panels (a) and (b) respectively. Positive differences (values above the dashed line) indicate a best performance on the testing data with respect to the reference model.
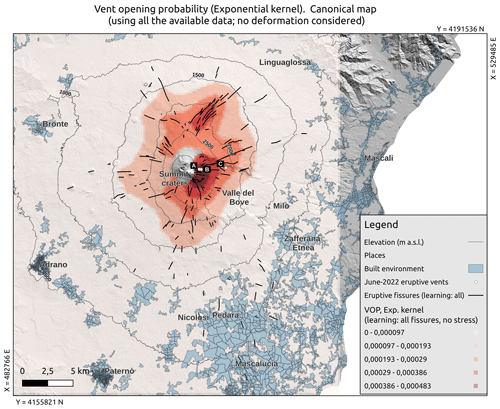
Figure A3Same as Fig. 5 but in linear scale: map of the probability (colours in linear scale) of flank fissure opening at Etna, based on the data 2000 BCE to present (solid black lines), in what we call the canonical model. The locations of the vents active in June 2022 are indicated by white points and labelled A, B and C. The location and extent of the built environment are shown as shaded pale-blue areas, and altitude contour lines are shown as dashed black lines.
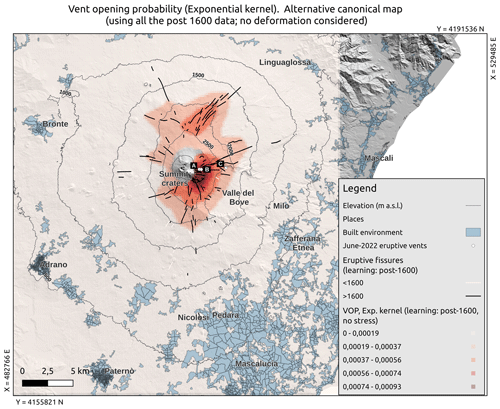
Figure A4Same as Fig. 6 but in linear scale: map of the probability (colours in linear scale) of flank fissure opening at Etna, based on a shorter time window for input data (1600 CE to present, solid black lines). The location of the vents active in June 2022 is indicated by white points and labelled A, B and C. The location and extent of the built environment are shown as shaded pale-blue areas, and altitude contour lines are shown as dashed black lines.
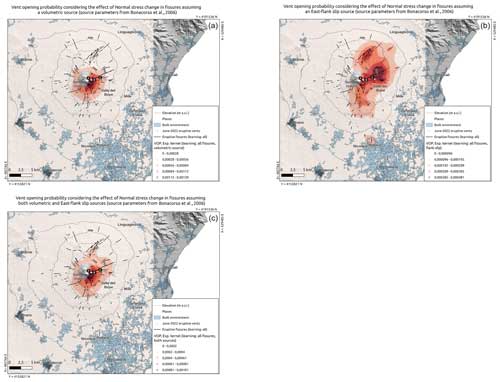
Figure A5Same as Fig. 7 but in linear scale: maps of the probability (colours in linear scale) of lateral fissure opening at Etna, based on the data 2000 BCE to present (solid black lines), considering the unclamping stress in the input fissures. Panels (a)–(c) correspond to, respectively, information from the volumetric, flank slip and both sources. In each panel, the locations of the vents active in June 2022 are indicated by white points and labelled A, B and C. The location and extent of the built environment are shown as shaded pale-blue areas. In solid white lines we show the oldest fissures (2000 BCE to 1600 CE) not used in these maps.
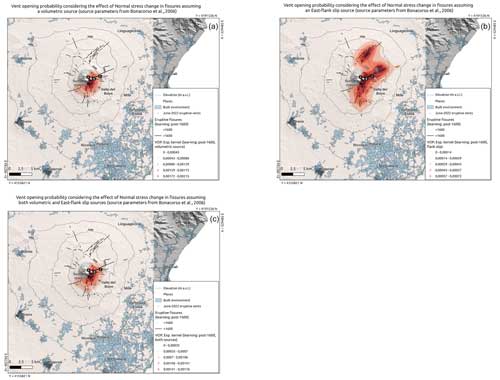
Figure A6Same as Fig. 8 but in linear scale: maps of the probability (colours in linear scale) of lateral fissure opening at Etna, based on the data 1600 CE to present (solid black lines), considering the unclamping stress in the input fissures. Panels (a)–(c) correspond to, respectively, information from the volumetric, flank slip and both sources. In each panel, the locations of the vents active in June 2022 are indicated by white points and labelled A, B and C. The location and extent of the built environment are shown as shaded pale-blue areas. In solid white lines we show the oldest fissures (2000 BCE to 1600 CE) not used in these maps.
The dataset of flank fissures used in this study paper is available at https://doi.org/10.5281/zenodo.14284932 (Proietti and Branca, 2024). In the Supplement we provide, in CSV format, the resulting probability maps under the different models proposed in the paper.
The supplement related to this article is available online at: https://doi.org/10.5194/nhess-24-4431-2024-supplement.
LS, AG, GG and AC conceived the study. CP and SB extracted the data from the new geological map. AG computed the stress on the vertical faults. LS and AG conceived the method and analysed the data and the results. LS wrote the manuscript, with input from all the authors. AG prepared with QGIS the maps shown in the figures, with input data from the authors. All authors reviewed the manuscript.
The contact author has declared that none of the authors has any competing interests.
Publisher's note: Copernicus Publications remains neutral with regard to jurisdictional claims made in the text, published maps, institutional affiliations, or any other geographical representation in this paper. While Copernicus Publications makes every effort to include appropriate place names, the final responsibility lies with the authors.
The authors wish to thank Mauro Coltelli for thorough discussions about the data and results, which improved the study. The authors wish to thank the editor Giovanni Macedonio. They also wish to thank Oryaëlle Chevrel, Valerio Acocella, and other anonymous reviewers for providing detailed and very valuable reviews that improved the quality of the manuscript.
This research has been supported by Ministero dell'Università e della Ricerca (grant no. CUP D53J19000170001) through project Pianeta Dinamico, Tema 8 – PANACEA 2021–2023, and DYNAMO 2023–2025.
This paper was edited by Giovanni Macedonio and reviewed by Valerio Acocella, Oryaëlle Chevrel, and one anonymous referee.
Acocella, V. and Neri, M.: Dike propagation in volcanic edifices: Overview and possible developments, Tectonophysics, 471, 67–77, https://doi.org/10.1016/j.tecto.2008.10.002, 2009. a, b
Alparone, S., Andronico, D., Lodato, L., and Sgroi, T.: Relationship between tremor and volcanic activity during the Southeast Crater eruption on Mount Etna in early 2000, J. Geophys. Res.-Solid, 108, 2241, https://doi.org/10.1029/2002JB001866, 2003. a
Alparone, S., Barberi, G., Giampiccolo, E., Maiolino, V., Mostaccio, A., Musumeci, C., Scaltrito, A., Scarfì, L., Tuvè, T., and Ursino, A.: Seismological constraints on the 2018 Mt. Etna (Italy) flank eruption and implications for the flank dynamics of the volcano, Terra Nova, 32, 334–344, https://doi.org/10.1111/ter.12463, 2020. a
Anderson, E. M.: The Dynamics of Faulting and Dyke Formation with Applications to Britain, in: Edn. 2, Oliver and Boyd, 1951. a
Andronico, D., Scollo, S., Caruso, S., and Cristaldi, A.: The 2002–03 Etna explosive activity: tephra dispersal and features of the deposits, J. Geophys. Res.-Solid, 113, B04209, https://doi.org/10.1029/2007JB005126, 2008. a
Azzaro, R. and Neri, M.: L'attività eruttiva dell'Etna nel corso del ventennio 1971–1991. Primi passi verso la costituzione di un data-base relazionale, CNR IIV Open File Report 3/92, 1–10, 1992. a
Azzaro, R., Branca, S., Winner, K., and Coltelli, M.: The volcano-tectonic map of Etna volcano, 1:100.000 scale: an integrated approach based on a morphotectonic analysis from high-resolution DEM constrained by geologic, active faulting and seismotectonic data, Ital. J. Geosci. (Boll. Soc. Geol. It.), 131, 153–170, https://doi.org/10.3301/IJG.2011.29, 2012. a, b, c, d, e, f
Barberi, G., Cocina, O., Maiolino, V., Musumeci, C., and Privitera, E.: Insight into Mt. Etna (Italy) kinematics during the 2002–2003 eruption as inferred from seismic stress and strain tensors, Geophys. Res. Lett., 31, L21614, https://doi.org/10.1029/2004GL020918, 2004. a
Bebbington, M. and Cronin, S.: Spatio-temporal hazard estimation in the Auckland Volcanic Field, New Zealand, with a new event-order model, Bull. Volcanol., 73, 55–72, https://doi.org/10.1007/s00445-010-0403-6, 2011. a
Behncke, B. and Neri, M.: Cycles and trends in the recent eruptive behaviour of Mount Etna (Italy), Can. J. Earth Sci., 40, 1405–1411, https://doi.org/10.1139/e03-052, 2003. a
Behncke, B. and Neri, M.: Lava flow hazard at Mount Etna (Italy): new data from a GIS-based study, Special Papers, Geological Society of America, https://doi.org/10.1130/0-8137-2396-5.189, 2005. a, b, c, d, e, f, g
Bonaccorso, A. and Aloisi, M.: Tracking Magma Storage: New Perspectives From 40 Years (1980–2020) of Ground Deformation Source Modeling on Etna Volcano, Front. Earth Sci., 9, 638742, https://doi.org/10.3389/feart.2021.638742, 2021. a, b, c, d
Bonaccorso, A., Bonforte, A., Guglielmino, F., M, P., and Puglisi, G.: Composite ground deformation pattern forerunning the 2004–2005 Mount Etna eruption, J. Geophys. Res., 111, B12207, https://doi.org/10.1029/2005JB004206, 2006. a, b, c, d, e, f
Bonali, F., Tibaldi, A., and Corazzato, C.: Sensitivity analysis of earthquake-induced static stress changes on volcanoes: the 2010 Mw 8.8 Chile earthquake, Geophys. J. Int., 201, 1868–1890, https://doi.org/10.1093/gji/ggv122, 2015. a
Branca, S. and Abate, T.: Current knowledge of Etna's flank eruptions (Italy) occurring over the past 2500 years. From the iconographies of the XVII century to modern geological cartography, J. Volcanol. Geoth. Res., 385, 159–178, 2019. a, b, c, d, e, f, g, h
Branca, S. and Del Carlo, P.: Eruptions of Mt. Etna during the past 3,200 years: A revised compilation integrating the historical and stratigraphic records, in: Mt. Etna, volcano laboratory, edited by: Bonaccorso, A., Calvari, S., Coltelli, M., Del Negro, C., and Falsaperla, S., American Geophysical Union, Geophys. Monogr., 143, 1–27, 2004. a, b, c
Branca, S. and Del Carlo, P.: Types of eruptions of Etna volcano AD 1670–2003: implications for short-term eruptive behavior, Bull. Volcanol., 67, 732–742, 2005. a, b
Branca, S. and Vigliotti, L.: Finding of an historical document describing an eruption in the NW flank of Etna in July 1643 AD: timing, location and volcanic products, Bull. Volcanol., 77, 1–6, 2015. a
Branca, S., Coltelli, M., De Beni, E., and Wijbrans, J.: Geological evolution of Mount Etna volcano (Italy) from earliest products until the first central volcanism (between 500 and 100 ka ago) inferred from geochronological and stratigraphic data, Int. J. Earth Sci. (Geol. Rundsch.), 97, 135–152, 2008. a
Branca, S., Coltelli, M., and Groppelli, G.: Geological evolution of a complex basaltic stratovolcano: Mount Etna, Ital. J. Geosci., 130, 306–317, 2011a. a, b, c
Branca, S., Coltelli, M., Groppelli, G., and Lentini, F.: Geological map of Etna volcano, scale, Ital. J. Geosci., 130, 265–291, https://doi.org/10.3301/IJG.2011.15, 2011b. a, b, c, d
Branca, S., De Beni, E., and Proietti, C.: The large and destructive 1669 AD eruption at Etna volcano: reconstruction of the lava flow field evolution and effusion rate trend, Bull. Volcanol., 75, 1–16, https://doi.org/10.1007/s00445-013-0694-5, 2013. a
Branca, S., Azzaro, R., De Beni, E., Chester, D., and Duncan, A.: Impacts of the 1669 eruption and the 1693 earthquakes on the Etna Region (Eastern Sicily, Italy): An example of recovery and response of a small area to extreme events, J. Volcanol. Geoth. Res., 303, 25–40, 2015a. a
Branca, S., Condomines, M., and Tanguy, J. C.: Flank eruptions of Mt Etna during the Greek–Roman and Early Medieval periods: New data from 226Ra–230Th dating and archaeomagnetism, J. Volcanol. Geoth. Res., 304, 265–271, 2015b. a
Branca, S., De Beni, E., Chester, D. K., Duncan, A. M., and Lotteri, A.: The 1928 eruption of Mount Etna (Italy): Reconstructing lava flow evolution and the destruction and recovery of the town of Mascali, J. Volcanol. Geoth. Res., 335, 54–70, 2017. a, b
Branca, S., Musumeci, D., and Ingaliso, L.: The significance of the 1971 flank eruption of Etna from volcanological and historic viewpoints, Ann. Geophys., 64, VO543, https://doi.org/10.4401/ag-8669, 2021. a
Cappello, A., Neri, M., Acocella, V., Gallo, G., Vicari, A., and Del Negro, C.: Spatial vent opening probability map of Mt Etna volcano (Sicily, Italy), Bull. Volcanol., 74, 2083–2094, https://doi.org/10.1007/s00445-012-0647-4, 2012. a, b, c
Cappello, A., Bilotta, G., Neri, M., and Del Negro, C.: Probabilistic modeling of future volcanic eruptions at Mount Etna, J. Geophys. Res.-Solid, 118, 1–11, https://doi.org/10.1002/jgrb.50190, 2013. a, b, c, d, e, f, g
Chester, D. K., Duncan, A. M., and Sangster, H.: Human responses to eruptions of Etna (Sicily) during the late-Pre-Industrial Era and their implications for present-day disaster planning, J. Volcanol. Geoth. Res., 225–226, 65–80, https://doi.org/10.1016/j.jvolgeores.2012.02.017, 2012. a
Coltelli, M., Del Carlo, P., Pompilio, M., and Vezzoli, L.: Explosive eruption of a picrite: the 3930 BP subplinian eruption of Etna volcano (Italy), Geophys. Res. Lett., 32, L23307, https://doi.org/10.1029/2005GL024271, 2005. a
Coltelli, M., Marsella, M., Proietti, C., and Scifoni, S.: The case of the 1981 eruption of Mount Etna: An example of very fast moving lava flows, Geochem. Geophy. Geosy., 13, Q01004, https://doi.org/10.1029/2011GC003876, 2012. a
Dahm, T.: Numerical simulations of the propagation path and the arrest of fluid-filled fractures in the Earth, Geophys. J. Int., 141, 623–638, https://doi.org/10.1046/j.1365-246x.2000.00102.x, 2000. a
Davis, T., Bagnardi, M., Lundgren, P., and Rivalta, E.: Extreme Curvature of Shallow Magma Pathways Controlled by Competing Stresses: Insights From the 2018 Sierra Negra Eruption, Geophys. Res. Lett., 48, e2021GL093038, https://doi.org/10.1029/2021GL093038, 2021. a
Del Negro, C., Cappello, A., Neri, M., Bilotta, G., Herault, A., and Ganci, G.: Lava flow hazards at Mount Etna: constraints imposed by eruptive history and numerical simulations, Sci. Rep., 3, 3493, https://doi.org/10.1038/srep03493, 2013. a, b
Dumont, Q., Cayol, V., and Froger, J.-L.: Is stress modeling able to forecast intrusions and slip events at Piton de la Fournaise volcano?, Earth Planet. Sc. Lett., 626, 118494, https://doi.org/10.1016/j.epsl.2023.118494, 2024. a
Favalli, M., Chirico, G. D., Papale, P., Pareschi, M. T., and Boschi, E.: Lava flow hazard at Nyiragongo volcano, DRC. 1. Model calibration and hazard mapping, Bull. Volcanol., 71, 363–374, https://doi.org/10.1007/s00445-008-0233-y, 2009a. a
Favalli, M., Mazzarini, F., Pareschi, M. T., and Boschi, E.: Topographic control on lava flow paths at Mount Etna, Italy: Implications for hazard assessment, J. Geophys. Res.-Earth, 114, F01019, https://doi.org/10.1029/2007JF000918, 2009b. a, b, c
Gudmundsson, A.: Infrastructure and mechanics of volcanic systems in Iceland, J. Volcanol. Geoth. Res., 64, 1–22, https://doi.org/10.1016/0377-0273(95)92782-Q, 1995. a
Guest, J. E. and Murray, J. B.: An analysis of hazard from Mount Etna volcano, J. Geol. Soc., 136, 347–354, https://doi.org/10.1144/gsjgs.136.3.0347, 1979. a, b, c, d
Guidoboni, E., Ciuccarelli, C., Mariotti, D., Comastri, A., and Bianchi, M. G.: L'Etna nella storia. Catalogo delle eruzioni dall'antichità alla fine del XVII sec., Bononia University Press, Bologna, ISBN 978-88-7395-916-8, 2014. a
IST: IstatData – La banca dati dell'Istituto Nazionale di Statistica, http://dati.istat.it/Index.aspx?QueryId=18976# (last access: 9 May 2023), 2023. a
Lin, J. and Stein, R. S.: Stress triggering in thrust and subduction earthquakes and stress interaction between the southern San Andreas and nearby thrust and strike-slip faults, J. Geophys. Res.-Solid, 109, B02303, https://doi.org/10.1029/2003JB002607, 2004. a, b
Lutz, T. M. and Gutmann, J. T.: An improved method for determining and characterizing alignments of point like features and its implications for the Pinacate volcanic field, Sonora, Mexico, J. Geophys. Res., 100, 17659–17670, 1995. a
Maccaferri, F., Bonafede, M., and Rivalta, E.: A numerical model of dyke propagation in layered elastic media, Geophys. J. Int., 180, 1107–1123, https://doi.org/10.1111/j.1365-246X.2009.04495.x, 2010. a
Maccaferri, F., Bonafede, M., and Rivalta, E.: A quantitative study of the mechanism governing dike propagation, dike arrest and sill formation, J. Volcanol. Geoth. Res., 208, 39–50, https://doi.org/10.1016/j.jvolgeores.2011.09.001, 2011. a
Martí, J. and Felpeto, A.: Methodology for the computation of volcanic susceptibility: Application to Tenerife Island (Canary Islands), J. Volcanol. Geoth. Res., 195, 69–77, https://doi.org/10.1016/j.jvolgeores.2010.06.008, 2010. a
Martin, A., Umeda, K., Connor, C., Weller, J., Zhao, D., and Takahashi, M.: Modeling long-term volcanic hazards through Bayesian inference: An example from the Tohoku volcanic arc, Japan, J. Geophys. Res.-Solid, 109, B10, https://doi.org/10.1029/2004JB003201, 2004. a, b, c, d
Martinez Montesinos, B., Luzón, M., Sandri, L., Rudyy, O., Cheptsov, A., Macedonio, G., Folch, A., Barsotti, S., Selva, J., and Costa, A.: On the feasibility and usefulness of high performance computing in probabilistic volcanic hazard assessment: An application to tephra hazard from Campi Flegrei, Front. Earth Sci., 10, 941789, https://doi.org/10.3389/feart.2022.941789, 2022. a
Marzocchi, W. and Jordan, T.: Testing for ontological errors in probabilistic forecasting models of natural systems, P. Natl. Acad. Sci USA, 111, 11973–11978, https://doi.org/10.1073/pnas.1410183111, 2014. a
Marzocchi, W., Sandri, L., Heuret, A., and Funiciello, F.: Where giant earthquakes may come, J. Geophys. Res.-Solid, 121, 7322–7336, https://doi.org/10.1002/2016JB013054, 2016. a
Mulas, M., Cioni, R., Andronico, D., and Mundula, F.: The explosive activity of the 1669 Monti Rossi eruption at Mt. Etna (Italy), J. Volcanol. Geoth. Res., 328, 115–133, 2016. a
Pollard, F.: Elementary fracture mechanics applied to the structural interpretation of dikes, Geol. Assoc. Can. Spec., 34, 112–128, 1987. a
Proietti, C. and Branca, S.: Dataset of Etna's flank eruptive fissures of the last 4000 years, Zenodo [data set], https://doi.org/10.5281/zenodo.14284932, 2024. a
Proietti, C., De Beni, E., Coltelli, M., and Branca, S.: The flank eruption history of Etna (1610–2006) as a constraint on lava flow hazard, Ann. Geophys., 54, 480–490, https://doi.org/10.4401/ag-5333, 2011. a
Rittman, A., Romano, R., and Sturiale, C.: L'eruzione etnea dell'aprile–giugno 1971, Atti Accad. Gioenia Sci. Nat. (Catania), 1–29, 1971. a
Rivalta, E., Corbi, F., Passarelli, L., Acocella, V., Davis, T., and Di Vito, M. A.: Stress inversions to forecast magma pathways and eruptive vent location, Sci. Adv., 5, eaau9784, https://doi.org/10.1126/sciadv.aau9784, 2019. a, b
Roman, A. and Jaupart, C.: The impact of a volcanic edifice on intrusive and eruptive activity, Earth Planet. Sc. Lett., 408, 1–8, https://doi.org/10.1016/j.epsl.2014.09.016, 2014. a
Romano, R., Lentini, F., and Sturiale, C.: Carta geologica del Monte Etna: Geological map of Mt. Etna, in: Progetto finalizzato Geodinamica, Istituto internazionale di vulcanologia, edited by: Cartografica, L. A., Consiglio nazionale delle ricerche (Italy), Catania, 1979. a
Ruch, J., Acocella, V., Storti, F., Neri, M., Pepe, S., Solaro, G., and Sansosti, E.: Detachment depth of an unstable volcano revealed by rollover deformation: an integrated approach at Mt. Etna, Geophys. Res. Lett., 37, L16304, https://doi.org/10.1029/2010GL044131, 2010. a
Salvi, F., R, S., and C, P.: Statistical analysis of the historical activity of Mount Etna, aimed at the evaluation of volcanic hazard, J. Volcanol. Geoth. Res., 154, 159–168, https://doi.org/10.1016/j.jvolgeores.2006.01.002, 2006. a, b, c, d, e
Sartorius Von Waltershausen, W.: Atlas des Aetna (v. 1), in: vol. 2–8, Weimar 9, edited by: Schmidt, S., Geografisches Institut, Berlin, 1848–1861. a
Scollo, S., Del Carlo, P., and Coltelli, M.: Tephra fallout of 2001 Etna flank eruption: analysis of the deposit and plume dispersion, J. Volcanol. Geoth. Res., 160, 147–164, https://doi.org/10.1016/j.jvolgeores.2006.09.007, 2007. a
Selva, J., Costa, A., Marzocchi, W., and Sandri, L.: BET_VH: exploring the influence of natural uncertainties on long-term hazard from tephra fallout at Campi Flegrei (Italy), Bull. Volcanol., 72, 717–733, https://doi.org/10.1007/s00445-010-0358-7, 2010. a, b
Stein, R. S.: The role of stress transfer in earthquake occurrence, Nature, 402, 605–609, https://doi.org/10.1038/45144, 1999. a
Tanguy, J. C., Condomines, M., Branca, S., La Delfa, S., and Coltelli, M.: New archeomagnetic and 226Ra–230Th dating of recent lavas for the Geological map of Etna volcano, Ital. J. Geosci., 131, 241–257, 2012. a
Toda, S., Stein, R. S., Richards-Dinger, K., and Bozkurt, S. B.: Forecasting the evolution of seismicity in southern California: Animations built on earthquake stress transfer, J. Geophys. Res.-Solid, 110, B05S16, https://doi.org/10.1029/2004JB003415, 2005. a
Wadge, G., Young, P. A., and Mckendrick, I. J.: Mapping lava flow hazards using computer simulation, J. Geophys. Res., 99, 489–504, https://doi.org/10.1029/93JB01561, 1994. a, b, c
Walter, T. R., Acocella, V., Neri, M., and Amelung, F.: Feedback processes between magmatic events and flank movement at Mount Etna (Italy) during the 2002–2003 eruption, J. Geophys. Res.-Solid, 110, B10205, https://doi.org/10.1029/2005JB003688, 2005. a, b


