the Creative Commons Attribution 4.0 License.
the Creative Commons Attribution 4.0 License.
Exploring drought hazard, vulnerability, and related impacts on agriculture in Brandenburg
Pedro Henrique Lima Alencar
Huihui Zhang
Friedrich Boeing
Silke Hüttel
Tobia Lakes
Adaptation to an increasingly dry regional climate requires spatially explicit information about current and future risks. Existing drought risk studies often rely on expert-weighted composite indicators, while empirical evidence on impact-relevant factors is still scarce. The aim of this study is to investigate to what extent hazard and vulnerability indicators can explain observed agricultural drought impacts via data-driven methods. We focus on the German federal state of Brandenburg, 2013–2022, including several consecutive drought years. As impact indicators we use thermal–spectral anomalies (land surface temperature (LST) and the normalized difference vegetation index (NDVI)) on the field level, and empirical yield gaps from reported statistics on the county level. Empirical associations to the impact indicators on both spatial levels are compared. Extreme gradient boosting (XGBoost) models explain up to about 60 % of the variance in the yield gap data (best R2 = 0.62). Model performance is more stable for the drought years and when using all crops for training rather than individual crops. Meteorological drought in June and soil quality are selected as the strongest impact-relevant factors. Rye is empirically found to be less vulnerable to drought than wheat, even on poorer soils. LST NDVI only weakly relates to our empirical yield gaps. We recommend comparing different impact indicators on multiple scales to proceed with the development of empirically grounded risk maps.
- Article
(8208 KB) - Full-text XML
- BibTeX
- EndNote
Agricultural drought risk mapping is essential for the spatial prioritization of adaptation actions and measures and particularly to raise awareness of stakeholders throughout the social–ecological system (Mishra and Singh, 2011; Blauhut, 2020; Kim et al., 2021). In the light of climate change, droughts are expected to occur at a higher frequency and unprecedented magnitudes, which poses a major challenge for risk management (Hanel et al., 2018; Hari et al., 2020; Satoh et al., 2022; Kreibich et al., 2022). Risk in this context can be conceptualized as the potential for negative impacts, assembled from hazard, exposure, and vulnerability components – while definitions of terms have shifted over the years, the recent guideline by the Intergovernmental Panel on Climate Change (IPCC) is very clear on that matter (Reisinger et al., 2020). A sound understanding of hazard thresholds and vulnerability conditions associated with impacts under droughts (hereinafter “impact-relevant factors”) is thus urgently needed to provide reliable risk maps and move towards impact-based forecasting (Sutanto et al., 2019). However, many drought risk maps are still being produced by more or less arbitrary weighting of indicators to produce a composite score (Kim et al., 2015; Dabanli, 2018; Kim et al., 2021; Khoshnazar et al., 2023), sometimes based on expert opinion (Frischen et al., 2020; Abdullah et al., 2021; Stephan et al., 2023a), or by process-based models for individual agricultural crops (Söder et al., 2022). A review of international examples found that drought studies in particular often neither define their target of investigation in sufficient detail nor include any sort of validation, thereby making the results difficult to interpret and use (Hagenlocher et al., 2019). Such aggregated indicators could harm more than they help by masking important differences between areas (Jhan et al., 2020). For Brandenburg, our study region, Ihinegbu and Ogunwumi (2022) produced a drought event map based on weighting of the normalized difference vegetation index (NDVI), land surface temperature (LST), and rainfall, without considering vulnerability or impacts. We suggest that drought risk mapping should be more closely related to investigations of actual hazard–impact relationships.
Droughts are natural hazards with a relatively slow-onset character, although there has recently been more scientific attention paid to flash droughts (Alencar and Paton, 2022). Purely meteorological droughts, soil moisture droughts, hydrological low flow in rivers, and socio-economic droughts that have consequences for the broader population and might lead to water conflicts are distinguished (Wilhite and Glantz, 1985). For agriculture, direct biophysical drought impacts arguably start once water availability restricts plant growth. Depending on the drought intensity, duration, and timing within the plant phenological stage, crop health is affected, which translates into yield levels, product quality, and ultimately prices also being affected (Santini et al., 2022). Historically, droughts are associated with famine and high death tolls (Mishra et al., 2019; Contreras, 2019). With modern disaster response, the impacts usually stay on the economic level, but monetary loss can also have severe consequences for individuals, businesses, and entire regions, and these consequences should be anticipated and managed proactively (Erfurt et al., 2019; Krishnamurthy et al., 2022). While there are mechanisms to partially compensate for losses due to extreme events (European Commission, 2023), a notable residual business risk remains with farms – potentially leading to stress and anxiety experienced by farmers (Austin et al., 2018; Abunyewah et al., 2024). Indirect effects are then propagated along the value chain and within the affected region. More than EUR 100 billion has been attributed to drought events between 1986 and 2016 in the European Union (Blauhut et al., 2016), and severe increases in economic impacts are projected for climate change scenarios without adaptation (Naumann et al., 2021). In the German federal state of Brandenburg, our study region, the local government spent EUR 72 million on compensation to farmers for drought-related losses in 2018 alone, accounting for about 45 % of the actual claims of that year (MLUK, 2019). This, however, was only the beginning of a prolonged multi-year drought (Boeing et al., 2022). As an area that has historically been water-rich, Brandenburg now needs to prepare for a drier future (Kahlenborn et al., 2021; MLUK, 2023), making it an interesting case for an empirical study.
Methods for empirically investigating impact-relevant factors for natural hazards range from simple regression to state-of-the-art algorithms from the field of (explainable) artificial intelligence (AI and, for explainable artificial intelligence, XAI). Investigated impacts include, for example, damage to buildings from river floods (Merz et al., 2013), debris flows (Jakob et al., 2012), or compound events (Brill et al., 2020), as well as casualties from floods (Tellman et al., 2020) and heat (Şalap-Ayça and Goto, 2023) or the occurrence of wildfires (Kondylatos et al., 2022). There have been similar attempts to uncover impact-relevant factors from text reports of past droughts (Stahl et al., 2016; Blauhut et al., 2016; de Brito et al., 2020; Sodoge et al., 2023; Stephan et al., 2023b) and from yield anomalies for selected crops (Sutanto et al., 2019; Peichl et al., 2021; Tanguy et al., 2023). Despite these recent efforts, empirical evidence on regional impact-relevant factors and nonlinearities of actual observed drought impacts is still rather scarce (Bachmair et al., 2016; Sutanto et al., 2019; Peichl et al., 2021; Tanguy et al., 2023). The application of AI methods in particular has led to considerable advances in terms of drought hazard monitoring and forecasting in recent years (Prodhan et al., 2022; Kowalski et al., 2023; Zhang et al., 2024). While these methods are very promising, they rely on the availability of (big) data covering the processes of interest. On the topic of vulnerability and impact-relevant factors, a key bottleneck of such data-driven studies is the availability of impact data.
One potential solution to solve the data availability issue is the use of remote sensing data products, from which indicators of crop health can be derived. While there are various potential indicators for mapping drought impacts on crops, the ratio between LST and NDVI is a particularly well established observable metric for that purpose (McVicar and Bierwirth, 2001; Karnieli et al., 2010; Crocetti et al., 2020). The middle of the growing season is generally regarded as the most decisive time of observation (Ghazaryan et al., 2020). Reinermann et al. (2019) used remote sensing time series from 2000 to 2018 and detected negative vegetation anomalies in Germany during summer months, particularly in the drought year 2018. The strength of correlation between drought indicators and yields was found to increase over time (Lüttger and Feike, 2018). However, most data-driven studies using earth observation merely model the occurrence of drought or treat anomalies of spectral indicators as “observed impact” without proper comparison to yields (Houmma et al., 2022).
Based on these identified gaps, the aim of this study is twofold: (1) we investigate the recent drought years in Brandenburg by combining indicators on hazard, vulnerability, and impacts from multiple data sources and (2) we derive empirical relationships of hazard and vulnerability indicators to the different impact indicators by data-driven methods. Additionally, an interactive web map was developed to assist in the exploration of the components of regional drought risk. The findings provide new insights into the complexity of the impact–hazard–vulnerability relationship of agricultural droughts for our study region in Brandenburg, as well as into limitations of currently available datasets. This has implications for the modelling and monitoring of agricultural drought.
2.1 Approach and study area
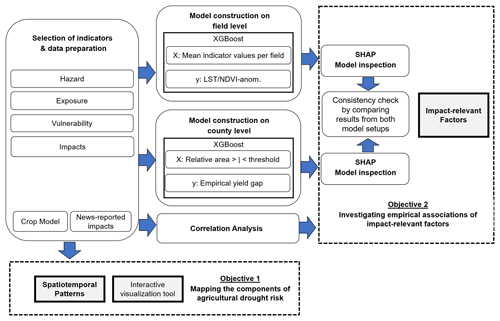
To achieve our two objectives, we select a set of indicators based on a literature analysis, including impact indicators on two different levels: the field level and the county level. Spatiotemporal patterns are investigated by visual inspection. We then conduct data-driven analyses to identify hazard and vulnerability indicators empirically associated with the impact indicators on both levels (Fig. 1). These data-driven analyses consist of correlation checks, machine learning regression, and model inspection techniques. In addition to this paper, we provide an interactive web-based visualization tool to foster the exploration of data beyond the printed figures.
As the study region we choose the German federal state of Brandenburg, which has a relevant agricultural sector that has been affected by drought in recent years and where reported yields as well as high-spatial-resolution data on grown crops are available. Brandenburg is characterized by flat topography, sandy soils, and lakes stemming from the latest ice age, as well as former peatland areas that have been drained over centuries for the purpose of obtaining arable land (LBGR, 2010). The climate is continental and comparably dry for German standards, with averaged precipitation around 600 mm a−1 and evapotranspiration around 500 mm a−1, including smaller subregions with negative water balances (Germer et al., 2011). Regional climate projections indicate a further reduction in precipitation during the crop growing season, i.e. harsher conditions for agriculture (Kahlenborn et al., 2021; MLUK, 2023). Soil water is generally expected to decrease in the region (Holsten et al., 2009). Agriculture in Brandenburg is primarily rainfed though, and current priorities of regional water management suggest that the uptake of large-scale irrigation will not be a realistic option in the near future (MLUK, 2023). Despite this setting, the agricultural sector is very important for the region and its population in its 18 counties (in German, Landkreise, corresponding to NUTS 3 regions), with about 1×10⁶ ha of land, one-third of the state, used for arable farming (MLUK, 2023). The agricultural sector of Brandenburg has also been identified as highly vulnerable to drought in European-scale studies (de Stefano et al., 2015; Blauhut et al., 2016).
2.2 Exposure and vulnerability indicators
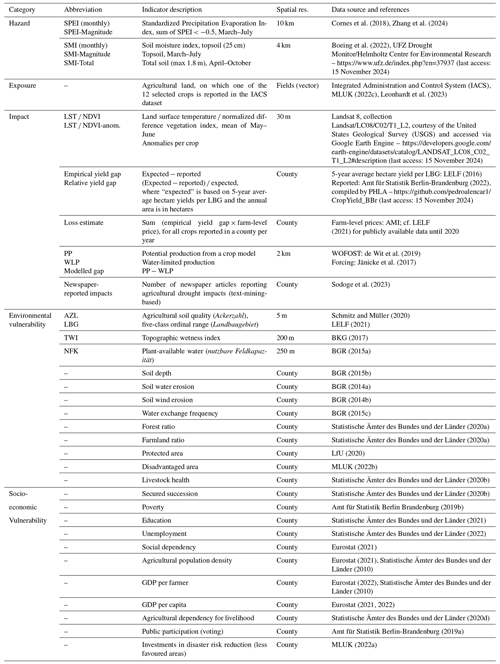
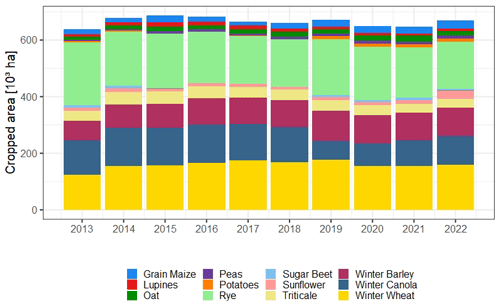
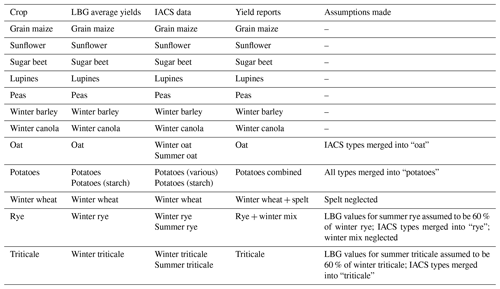
Spatially explicit information about exposure, i.e. cropped agricultural land, is derived from the Integrated Administration and Control System (IACS), which provides field-level data on crops for farms that have applied for annual payments within the EU's Common Agricultural Policy (CAP) (Leonhardt et al., 2023). These shapes provide the basis of our field-level analysis. We selected 12 of the most important crop types in Brandenburg in terms of area of production for which matching information in the yield reports and average values per LBG (agricultural production area, abbreviation from the German, Landbaugebiet) are available (Table A1). In some cases we only used the winter variety; in other cases we had to merge summer and winter varieties to match the yield reports (Table A2). The 12 crops used in this study are winter wheat, rye, triticale, oat, winter barley, winter canola, grain maize, sunflower, potatoes, lupines, peas, and sugar beet. The total cropped area covered by our 12 selected crop types fluctuated in the investigated time period (2013–2022) between about 638 000 and 686 000 ha, with no clear trend. The largest unconsidered fraction is silage maize, which is mostly used as fodder and is thus not consistently covered in the reported statistics. Rye is among the most commonly found crops in the region and is regarded as a reliable source of income on sandy soils even with little precipitation (LBV, 2024). Wheat is considered more demanding but commands higher prices. Cultivation of potatoes and sugar beet has been drastically reduced over recent decades, partially owing to the increasingly dry climate (LBV, 2024). Farm-level product prices were purchased from the company Agrarmarkt Informations-Gesellschaft mbH (AMI) (see LELF, 2021, for publicly available data until 2020).
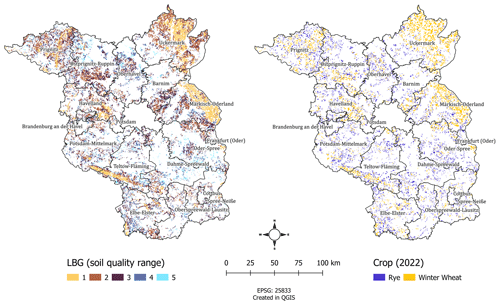
Vulnerability indicators attempt to capture the relevant characteristics that shape the relationship between hazard intensity and impacts. We compiled a list of environmental and socio-economic indicators and their assumed direction of influence on agricultural drought vulnerability (cf. Walz et al., 2018; Meza et al., 2019; Frischen et al., 2020; Zhou et al., 2022; Stephan et al., 2023a). A gridded estimate of agricultural soil quality (in German, Ackerzahl, AZL) is available at 5 m resolution (Schmitz and Müller, 2020). Based on AZL, five different LBGs are classified, for which average yields for the most important crops are published (LELF, 2016). As a specific water-related indicator, we include the plant-available water capacity (in German, nutzbare Feldkapazität, NFK) (BGR, 2015a). To capture potential water accumulation in the landscape, we further derived the topographic wetness index (TWI) from a digital elevation model (BKG, 2017). We extracted mean values of AZL, NFK, and TWI per agricultural field for the available point in time, assuming that they do not change over time. Other indicators, in particular the socio-economic datasets, were only available per county for Brandenburg. This restricted their use to simple correlation analysis with impact indicators on the same spatial level. Large parts of Brandenburg are classified as a “disadvantaged area” due to rather poor soils – the exception here being the north-eastern counties Uckermark and Märkisch-Oderland. These two counties also exhibit the highest scores for secured succession (along with Potsdam), despite long-known problems with general unemployment in Uckermark (10.7 % in the year 2022). Smaller strips and patches of high-quality LBG-1 soils are found in the west (Fig. 2). The spatial distribution of crop types partially reflects these patterns; e.g. winter wheat is typically grown on high-quality soils, making it the dominant crop type in the abovementioned areas, while rye is most common throughout the rest of Brandenburg on poorer sandy soils.
2.3 Hazard indicators: SPEI and SMI
The Standardized Precipitation Evaporation Index (SPEI) captures both precipitation and potential evaporation and has evolved into one of the most commonly used meteorological drought indicators in recent years (Vicente-Serrano et al., 2010; Rossi et al., 2023; Tanguy et al., 2023). Monthly values of SPEI-1 (1-month accumulation SPEI) used in this study are at a 10 km grid resolution from 2013 to 2022, based on the E-OBS dataset (Cornes et al., 2018). The calculation details are described in Zhang et al. (2024). As the harvest of the main crops in the region typically starts in July, we used data for the months March to July. Negative SPEI values indicate meteorological water deficit. In addition to the monthly SPEI, a metric of the growing-season drought magnitude was computed as the sum of SPEI-1 < −0.5 over the period between March and July (SPEI-Magnitude) (cf. Wang et al., 2021 for SPEI thresholds).
Regarding soil moisture droughts, the model-based German drought monitor developed at the Helmholtz Centre for Environmental Research (UFZ) is the most established regional product (Samaniego et al., 2013; Zink et al., 2016; Boeing et al., 2022) and has already been used for a similar purpose (Peichl et al., 2021). Identically to the SPEI data, we use monthly values and a growing-season aggregation of drought intensity derived from the soil moisture index (SMI) for the topsoil (25 cm), again from March to July (Eq. 1). To add some information on slower long-term drought processes (i.e. accumulation and lag time), we further include the annual drought magnitude for the total soil (up to 1.8 m depth), which is temporally aggregated from April to October (SMI-Total).
where τ is the drought threshold; SMI* is the raw soil moisture index; and d and A refer to the duration and area of potential aggregation, respectively. A value of 0 for all SMI-based features thus means that none of the values were below the drought threshold τ. We use τ= 0.2 (20th percentile), which is a common value for drought analysis adopted in the literature (e.g. US Drought Monitor; Svoboda et al., 2002). For more details, the interested reader is referred to Boeing et al. (2022).
2.4 Impact indicators: crop health observations and empirical yield gaps
2.4.1 LST NDVI anomaly
As an indicator of crop health, the ratio of LST to NDVI between May and June, i.e. roughly in the middle of the growing season, of each year (2013–2022) was obtained from Landsat 8 satellite imagery, using all images of the T1_L2 collection. This dataset already includes processed LST (Cook et al., 2014). Pre-processing and cloud masking were conducted within Google Earth Engine (Gorelick et al., 2017). The temporal aggregation of the satellite data is necessarily a compromise: a comparison between years becomes more precise when the interval is shorter, but to smooth out potential variations in overpasses and cloud cover, as well as disturbances to individual pixels, mean values across several weeks are generally more trusted (Ghazaryan et al., 2020). Images were downloaded at a 30 m spatial resolution and then aggregated on individual fields. A small fraction of fields had to be discarded due to missing data, e.g. because of cloud cover, and we continued the statistical analysis with the remaining ones. As different crop types exhibit characteristic spectra, we further computed the anomalies of LST NDVI over the entire observation period stratified by crop type (Eq. 2). By doing so, the resulting anomalies (LST NDVI-anom.) are comparable among different crops.
where is the area-weighted mean for a given crop across all years and the subscripts c, f, and y denote crop, field, and year, respectively.
2.4.2 Empirical yield gaps
We further calculated empirical yield gaps per county for 12 crops for the last 10 years (2013–2022) by subtracting actual reported yields (total production in tonnes) by the regional statistical authority (Amt für Statistik Berlin-Brandenburg, 2022) from an estimate of expected yields under non-drought conditions. We refer to expected yields as the product of cropped area (per crop type in a given year) and the respective 5-year average yield (tonnes per hectare) per LBG from the time 2010–2014. The expected yields are computed on the field level and then aggregated on the level of counties to be comparable to the reported yield data. The empirical yield gap is divided by the expected yield we call the “relative gap”. A relative gap value of 1 thus implies that all yield was lost, while a value of −1 implies that double the expected amount was reported, and a value of 0 indicates a perfect match between expected and reported numbers. To correct for differences in the total area reported in IACS as compared to the yield reports, we added the difference in area per crop, multiplied with the average yield per hectare of that crop within the respective county as derived from the data. Some minor assumptions had to be made to merge crop types reported in IACS with the reports like neglecting spelt in the statistics for wheat (details in Appendix A). Multiplication of the empirical yield gaps and prices of the respective year results in a total estimate of monetary loss in euros. As not all of the 12 considered crops are grown in all regions in every year, the total monetary loss estimate can be based on partially different crops per region. We assume that this reflects the real agroeconomic situation in each region.
2.4.3 Comparison to external data
For a plausibility check, we compared the resulting empirical yield gaps and loss estimates to regional newspaper reports. For individual crops (rye, wheat, maize, barley), we were able to additionally calculate the potential production (PP) and water-limited production (WLP) by the process model WOFOST at a 2 km grid resolution (Jänicke et al., 2017; de Wit et al., 2019). If our expected yields from the pre-drought years are realistic, they should be similar to the potential production. Crop growth in WOFOST is modelled from irradiation, temperature, CO2 concentration, plant characteristics, seeding date, and availability of water. The physically modelled potential production from this simulation matches very well with the expected yields derived by our empirical approach for soil quality range LBG-2 in the case of wheat and barley and LBG-1 in the case of rye (Fig. 3). We are thus confident that our approach produces estimates in a realistic range. Only for maize is the modelled potential production higher than the average values for Brandenburg suggested on any soil type. This comparison also underlines that it is important to account for the soil quality range, and thus our empirical approach appears more realistic than this particular WOFOST simulation. For further comparison we use the newspaper-reported impact score by Sodoge et al. (2023) for the category “agriculture”. All data used are summarized in Table 1.
2.5 Statistical procedures and algorithms
Exploratory analysis is conducted by calculating descriptive statistics and correlation matrices and by visual inspection of spatiotemporal patterns in the data. For the latter, we additionally provide a simple web app in R Shiny. Changes over the investigated years are analysed by plotting the shift in statistical distributions and the temporal evolution of regional mean values. To investigate empirical relations between our hazard and vulnerability indicators and our impact indicators, we apply the statistical learning algorithm extreme gradient boosting (XGBoost) (Chen and Guestrin, 2016) combined with the Shapley additive explanations (SHAP) model inspection technique (Shapley, 1953; Lundberg and Lee, 2017). This combination is widely used in the field of XAI and has recently been successfully applied in many different scientific studies to derive insights from complex nonlinear and interacting datasets (Yang et al., 2021; Jena et al., 2023; Raihan et al., 2023; Li et al., 2024). XGBoost is an ensemble method based on boosting; i.e. consecutive models are trained on the residuals of the predecessor, thereby increasing the fit step by step (as opposed to bagging like in random forest, where an ensemble is trained in a parallel fashion and aggregated via majority voting). This iterative analysis of errors and weight adjustment supposedly leads to models that reflect actual patterns in the overall data, rather than random patterns observed in random bootstrap subsets. We use a common tree-based model variant to allow for a hierarchical structure. As the sampling scheme, we implemented nested cross-validation, with an inner loop for hyperparameter optimization and an outer loop to assess the skill applied to independent holdout sets (not used in parametrization). SHAP values were computed for the best model of each nested iteration, selected by the highest R2 score for the holdout set. The SHAP values represent a game-theoretic estimate of the effect size, where the feature values are treated as players that can join a coalition game (model). The resulting values give the expected marginal contribution for each feature value across all possible coalitions, in the unit of the model target, and fulfil the efficiency property, meaning that they sum up to the difference between the overall expected value and the specific model prediction for a set of feature values. By computing these SHAP values for all samples used to construct a model, it is possible to visualize the effect each feature has within the inspected model. Note that this does not necessarily imply insights into processes in nature, but rather it implies insights into empirical relations in the data as learned by the specific model.
In total our dataset contains 437 476 agricultural fields across 18 counties. With 12 crop types and 10 years, the theoretical maximum number of data points on the county level is 2160, from which missing entries have to be removed (not all crops grown in all counties in all years). Predictive features on the field level are the indicator values. Some feature engineering is necessary to convert the field-level data into features on the county level. It is reasonable to assume that damaging processes are more dependent on extreme conditions than on the mean value over a large area. To retain as much information about the hazard distributions as possible, we computed the relative affected area exceeding (or not exceeding) specified thresholds in regular intervals (Appendix B). This manual feature engineering resulted in a total of 68 features on the county level.
3.1 Spatiotemporal patterns of hazard, vulnerability, and impact indicators
3.1.1 Temporal evolution on the state level
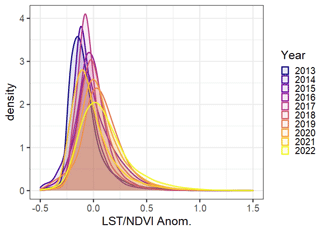
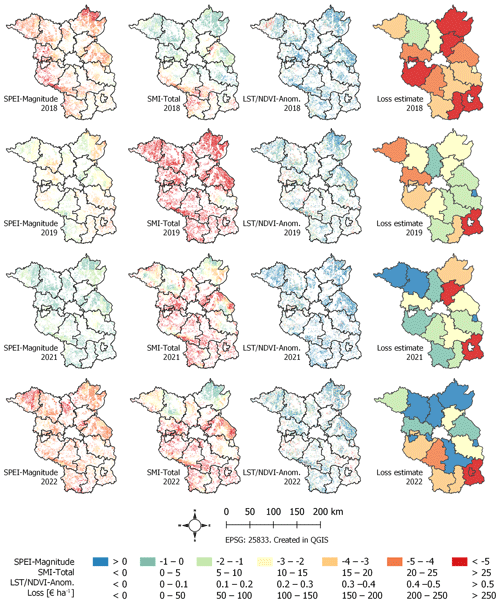
The temporal evolution of mean indicator values for the whole of Brandenburg suggests that the investigated decade can be divided into a pre-drought phase (2013–2017) and a drought phase (2018–2022) (Fig. 4). In 2013 and 2014, SMI-Total is close to 0, observed vegetation health is at its maximum (i.e. negative LST NDVI-anom.), essentially no impact-related statements are captured in the newspaper text-mining data, and our economic calculation even estimates an excess of about EUR 100 million compared to expectations. Particularly 2014 made headlines with record-breaking (positive) yields (Agrarheute, 2014). However, the crop model WOFOST still estimates a gap between potential production and water-limited production in that year, and also in SPEI-Magnitude there is some drought signal visible. We interpret this as locally and temporally constrained meteorological effects that did not propagate to the soil and consequently did not have a negative effect on crop health and yields. The year 2017 was then rather wet, which is reflected in SPEI, LST NDVI, and the media impact statements. However, the soil drought only declined slightly according to SMI. From 2018, a multi-year drought started. There seems to be a temporal lag of 1 year between meteorological and soil moisture drought indicators, likely reflecting the propagation from atmospheric conditions to the deeper soil layers. This is also visible in data for the year 2021, where SPEI-Magnitude indicates there was a good meteorological water balance, but soil moisture drought remained. Interesting to note though is that the satellite observations of crop health peak in the same year as SMI-Total, 2019, while the estimated economic loss (12 crops), as well as the crop model (for wheat) and newspaper-reported impacts, exhibits peaks at the meteorological drought maximum in 2018. The distribution of LST NDVI-anom. has been shifting towards higher values in recent years – not only the median but also the upper tail of the distribution became heavier (Fig. 5). This upper part of the distribution is where we expect impacts like reduced yields. The most notable exposure changes over the decade are decreasing trends for rye (−30 %), triticale (−22 %), winter canola (−26 %), sugar beet (−33 %), and lupines (−38 %) and increases in winter wheat (+19 %), winter barley (+28%), oat (+44 %), peas (+132 %), and sunflower (+145 %) (Fig. 6). Changes in crop choice may partially reflect a response to experienced crop-damaging conditions but are also driven by unconsidered factors such as fertilizer or market prices (e.g. Albers et al., 2017). Our total loss estimate from the 12 crops for Brandenburg in 2018 is EUR 132 million, which comes close to the official numbers: EUR 72 million in compensation was issued by the state, and this sum was considered to account for about 45 % of actual claims (which would translate to a loss of EUR 160 million when taken at face value) (MLUK, 2019).
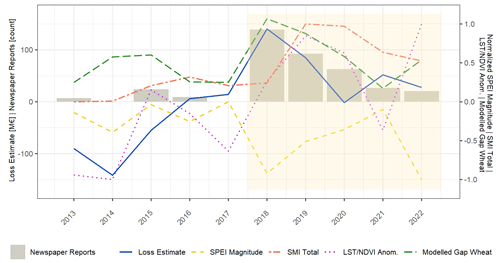
Figure 4Evolution of indicator values over the whole of Brandenburg. Our loss estimate is given in the original values on the left axis. Bars indicate the number of agricultural impact statements in newspapers on the original scale (left axis). All other indicators were extracted on agricultural fields, area-weighted, and scaled to fit the same axis. SPEI-Magnitude has only negative values and is thus scaled to [−1, 0]. SMI-Total and the crop-model-based gap (PP − WLP) have only positive values and are thus scaled to [0, 1]. LST NDVI-anom. has positive and negative values and is thus scaled to [−1, 1].
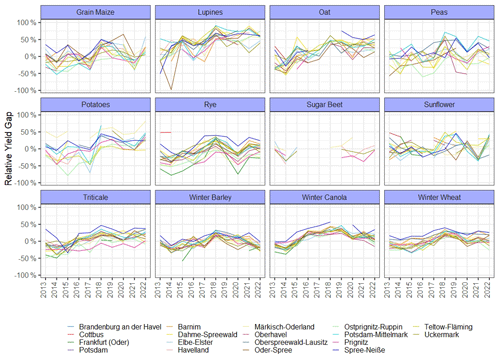
Our empirical yield gaps peak in the year 2018 for most crops in most regions, but the variability between counties is high for most crops (Fig. 7). Only winter wheat, winter canola, and winter barley exhibit low to moderate variability between counties. Sugar beet is only reported in a few cases. Plausibility checks against newspaper articles suggest that our relative gap estimates are in a reasonable range: yield reduction for individual crops from 25 % to more than 50 % was reported in 2018 and 2019, with winter canola performing worse in 2019 (Agrarheute, 2018; DLF, 2019). Grain crops did better in 2022 than 2021, but maize did much worse (Tagesschau, 2022). The year 2014 on the other hand is remembered for record-breaking yields with “+24 % compared to the previous 5-year average and 11 % higher than the previous year”, indicating that 2013 was still well above average (Agrarheute, 2014), which is captured in our estimates.
3.1.2 Spatiotemporal patterns
A more facetted picture appears when comparing the spatial distributions of hazard and impact indicators alongside each other for consecutive years (Fig. 8). Essentially the entire state of Brandenburg was affected by meteorological drought in 2018, with the SPEI-Magnitude minimum registered in the south-west. Soils in the south were already dry by then, but severe soil moisture drought throughout the state developed a year later. Contrarily, during the rather rainy year of 2021, the accumulated soil drought persisted. When another intense meteorological drought struck in 2022, only the soils in the north had moderately recovered. Annual distributions of LST NDVI-anom. exhibit small-scale variability that is difficult to align with the aggregated hazard indicators. Patches of high anomalies (i.e. supposedly damaged fields) are found scattered across the state, while low anomalies (i.e. supposedly healthy crops) appear to dominate in the areas of good soil quality (see Fig. 2). The highest economic loss per hectare is mapped in the southern areas of Spree-Neiße and Oberspreewald-Lausitz (with the highest absolute loss in Uckermark due to the large fraction of agricultural land). While the exceptional years of 2018 and 2019 also caused severe losses in the north and west of Brandenburg, the south-east ranks high in the relative loss estimates throughout all of the investigated years. Loss per hectare from our empirical approach is higher than the crop model estimates by Söder et al. (2022), who report separate numbers of around EUR 90 per hectare from summer drought and EUR 60 per hectare from spring drought in 2018 in the region. Our estimates refer to the sum of all damaging processes. The socio-economic vulnerability indicators and low-resolution maps for all investigated years can be viewed at https://fabiobrill.shinyapps.io/agrdrought-explorer-brandenburg/ (Brill, 2024b), while the high-resolution data can be obtained from Zenodo (https://doi.org/10.5281/zenodo.13373271, Brill, 2024a).
3.2 Empirical investigation of impact-relevant factors
3.2.1 Relations between indicators on the field level
The spatiotemporal patterns suggest non-trivial and multi-way interactive relationships between our chosen hazard, vulnerability, and impact indicators. This is further supported by a correlation analysis, which shows that the bivariate linear relations in the data are mostly weak (Fig. 9). Correlations slightly increase when subdividing the data by crop, presumably because the relationships are more linear for individual crops; however the effect is almost negligible (not shown). The meteorological and soil moisture hazard indicators SPEI and SMI are correlated to each other. Monthly SPEI and SMI are essentially uncorrelated to LST NDVI-anom. in March, very weakly correlated in April, and moderately correlated in May and June. As the LST NDVI measurements are also from May and June, the additional correlation in July has to be a spurious effect stemming from the collinearity in the SPEI layers (almost 0.5 between June and July). Raw NDVI – and therefore also LST NDVI – is clearly related to AZL, meaning that crops grown on better soils tend to be “greener”, with or without drought. This effect is reduced in the anomalies. TWI and NFK exhibit no relation except to AZL. The modelled water-limited production from WOFOST only weakly relates to LST NDVI (not shown).
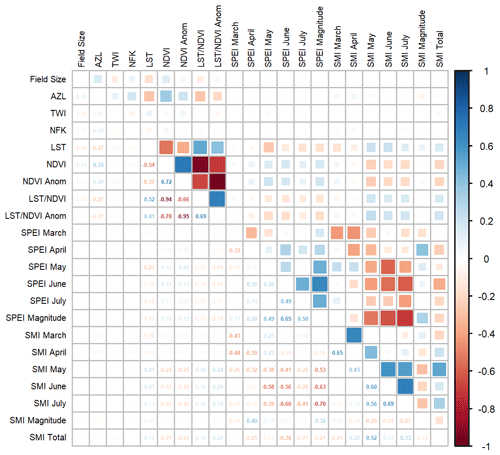
Figure 9Pearson's correlation coefficient applied to field-level data. Almost all correlations are statistically significant due to the high number of samples (n= 437 245 complete observations, 474 966 in total).
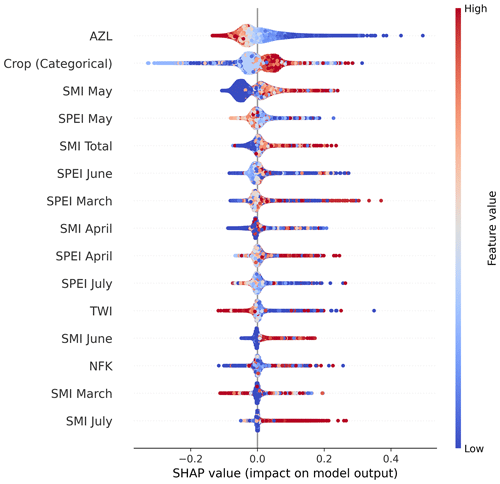
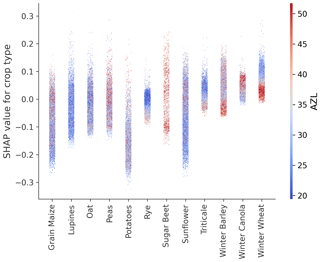
An XGBoost model trained to predict LST NDVI-anom. from monthly hazard indicators SPEI and SMI; aggregated SMI-Total; and environmental vulnerability factors AZL, TWI, and NFK, as well as crop type, obtains R2 scores of around 0.5 (Appendix C). AZL is chosen by the models as the most important feature, followed by the categorical variable crop type, while the other environmental vulnerability factors, TWI and NFK, have little influence (Fig. 10). Each dot in this plot corresponds to a sample, and the SHAP values represent the feature effects (conditional expectation) on the predicted quantity, i.e. LST NDVI-anom. in this case. Interaction plots for crop types highlight that wheat, canola, and barley are grown on relatively good soils; lupines on bad soils; and rye on both (Fig. 11). While the absolute effect of AZL on the predictions is higher than the effect of crop type, particularly wheat is modelled as more likely to be impacted compared to other crops despite growing on better soils (higher AZL).
Some more process understanding about droughts might be distilled from the SHAP dependence plots (Fig. 12). A sharp increase in SHAP values is observed for AZL below 35, meaning that vulnerability is higher on soils below that quality. There is a strong interaction between AZL and SMI-Total, which on its own shows a weakly S-shaped relationship to the LST NDVI anomaly. A more or less linear response is uncovered for SMI in May, with an offset at 0, i.e. good vegetation health for no drought in May. Meteorological drought in June seems to have a decisive effect in the model, judged by a sharp increase in SHAP values for SPEI < −1. SPEI in March appears to have a damaging effect under conditions that are too wet (SPEI > +1), which is in line with previous findings by Peichl et al. (2021).
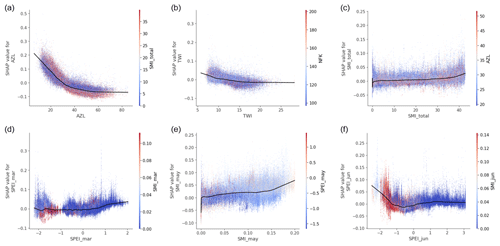
Figure 12SHAP dependence plots for selected features: (a) AZL, (b) TWI (c) SMI Total, (d) SPEI March, (e) SMI May, and (f) SPEI June. The centre line is derived by a loess regression on the SHAP values. The colour visualizes interaction with a second feature.
From a methodological point of view, it is worth mentioning that SHAP plots based on the full dataset exhibit far larger variance on the y axis than preliminary experiments with only 10 % of the data. One reason for this might be the spatial resolution of the features, but we assume that it is also related to the complexity of the regression task. While there are some clear effects on the centre lines, it also becomes obvious that no single feature explains all the data. Several steps in our analysis include simplifications; e.g. calculations using mean values per field imply that an entire field is treated as a unit. For larger fields it might be realistic that only parts are affected; however such effects are below the credible resolution of input data. We acknowledge that particularly for maize, which is typically harvested from September on, a longer observation window might be more suitable. Adjusting the remote sensing data to the actual sowing and harvest dates of each crop might improve the results – however, doing so would further complicate the data pre-processing and was considered out of scope of this study. Although agriculture in Brandenburg is predominantly rainfed, a future study could also benefit from spatially explicit information on irrigated areas (Ghazaryan et al., 2022).
3.2.2 Relations between indicators on the county level
When arranging the 12 crops by correlation among the relative gaps (i.e. each sample referring to a county in a given year), it appears that almost all crops are positively correlated over time, while spatially (and thus spatiotemporally) several groups emerge (not shown). Correlation between the newspaper-based “agriculture” impact score by Sodoge et al. (2023) and our relative economic impact measure (in euros per hectare) over all 12 crops for the years 2013–2022 is 0.75 for the entire are of Brandenburg and 0.53 on the county level. When compressing the data to mean values over the entire time span to merge them with the socio-economic vulnerability indicators, the highest correlation of newspaper-reported impacts is to participation in local politics (0.69). From our data and analysis, we see no meaningful correlation between the vulnerability indicators and reported impacts or calculated losses. A major drawback is the resolution of the indicators. For this reason, they were not included in the following XGBoost regression analysis.
The statistical learning models trained to predict the empirical yield gaps on the county level obtain R2 scores of around 0.6 when using all features and all data (Fig. 13). Models using only LST NDVI features as predictors perform poorly (R2 ∼ 0.2). It is quite remarkable that a field-level (i.e. high-spatial-resolution) observation of crop health does not provide more useful information for predicting yield. Models using hazard indicators as predictors perform better. Monthly values of SPEI are clearly to be preferred over seasonally aggregated magnitude, and the same is true for SMI. However, we observe that models using only SPEI perform slightly better than those using only SMI. One potential reason for this might be that SMI is itself model-based, which introduces further uncertainty. We find a minor improvement when using both SPEI and SMI, where SMI-Total is more relevant than the monthly topsoil layers (as information complementary to SPEI). The additional improvement when adding LST NDVI features on top is almost negligible. Our predictive features explain much more variance for the drought years 2018–2022 than for the pre-drought years 2013–2017, as expected. Models trained on the full dataset exhibit both higher skill and less variance. A similar effect is observed when training separate models for the different crop types: individual models for winter wheat perform better than individual models for rye, but a lumped model using all crops is much more stable. We explain this by the higher number of training samples in combination with a tree-based model structure that exploits similarities between crops. The R2 skill score of the final model used for inspection via SHAP plots is 0.62 for the holdout set; i.e. about 60 % of the variance in the empirical yield gaps can be explained by our drought-related features, while about 40 % remains unexplained. Agricultural crops are highly managed and face numerous threats, not only droughts. It would be unreasonable to assume that drought indicators alone could fully explain real observed yield data. In a similar published attempt, Peichl et al. (2021) report that their best model for winter wheat obtained an R2 of 0.68, which is very close to our best models – however, they do not report any details on the variability in this score. Empirical damage models, such as those used for floods, typically report rather weak model fits (e.g. Wagenaar et al., 2017; Sieg et al., 2017). In the European Drought Risk Atlas, Rossi et al. (2023) do not even report the model fit at all but still uncover plausible impact-relevant factors for droughts.
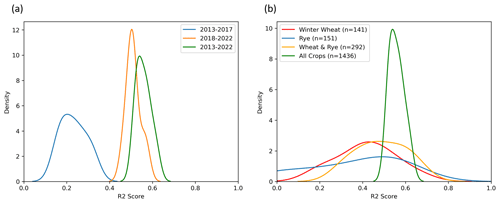
Figure 13Distributions of the R2 skill score based on 10 repetitions for each setup. (a) Separate models for pre-drought and drought years. (b) Separate models for individual crop types.
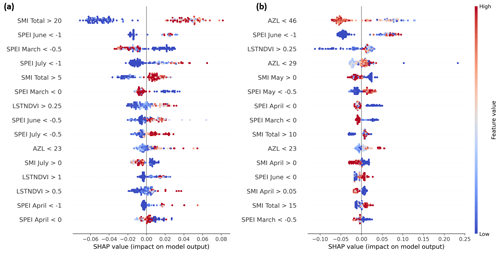
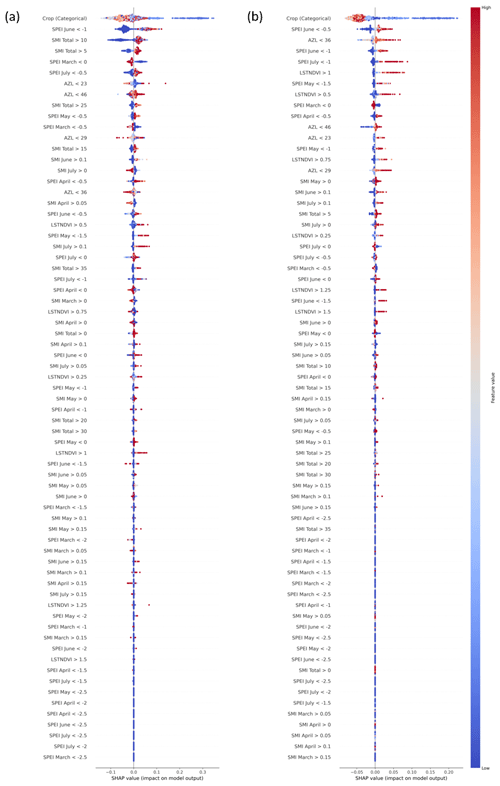
Model inspection identifies SPEI below −1 in June as the most relevant condition in the lumped model for all crops (Fig. 14) and also in crop-specific models for wheat and rye (Appendix D). Note that the features on the county level always refer to the relative affected area above or below a threshold; e.g. the value of “SPEI June < −1” indicates the relative area per crop per county affected by SPEI in June below −1. However, a large fraction of the data indicate that not exceeding −1 coincided with negative empirical yield gaps, i.e. higher-than-expected yields. To investigate this in more detail, we run another model setup using only data with a positive empirical yield gap (n= 827). Data on the county level always include mixed effects; i.e. the “empirical yield gap > 0” constraint on the county level implies not that there are no damaged fields in the data but rather that damaged fields are outweighed by fields with higher-than-expected yields within the same county. Features based on SPEI in June are still among the most important predictors for such a subset, with thresholds of −0.5 and −1 ranked high (Fig. 14b). Even more severe meteorological drought conditions (SPEI < −2) are apparently just too rare in this dataset to be influential on the county level. In March the threshold of 0 is again selected in the reverse direction, i.e. indicating damage from conditions that are too wet (cf. Fig. 15d). Multiple AZL features are selected, confirming once more that soil quality is a relevant drought vulnerability factor (the regression target is already based on expected yield estimates that account for AZL, so this effect is on top of that). LST NDVI as a predictive feature for the empirical yield gaps is of low relevance when using all data but ranks higher when restricting the training data to positive yield gaps. In the comparison of crops (Fig. 15a), lupines clearly stick out, which is explained by the high losses in the yield data (cf. Fig. 7). The interaction of crop type with AZL < 36 shows once more that rye is being grown on worse soils than wheat but still has lower SHAP values with respect to the regression on impacts. Triticale is on a level similar to wheat, and canola is even higher. From all these crops, rye is thus empirically found to be the most robust.
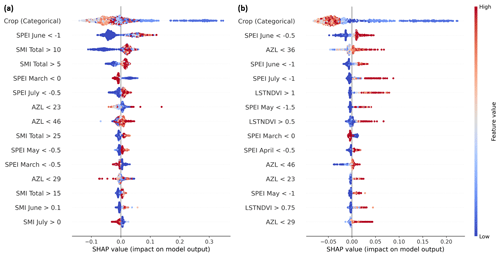
Figure 14SHAP summary plots for the best model trained on (a) all data and (b) data with an empirical yield gap > 0.
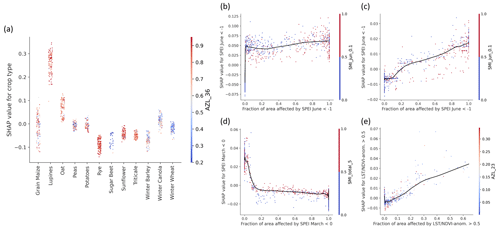
Figure 15SHAP dependence plots for selected features on the county level. (a) The effect of crop type and interaction with relative area of AZL < 36 from a model trained on all data. (b, c) The effect of SPEI in June being < −1 (b) from a model trained on all data and (c) from a model trained only on positive empirical yield gaps. (d) The effect of SPEI in March being < 0 from a model trained only on positive empirical yield gaps. (e) The effect of the LST NDVI anomaly being > 0.5 from a model trained only on positive empirical yield gaps.
To check the stability of the SHAP values, we repeated the model fitting several times and inspected the resulting summary plots. The first features are always crop type and SPEI in June. Beyond the first few ranks, feature effects become very similar, and the exact ranks can shift in repeated model runs (depending on the random data subset and respective model parameters). The effects for the different crop types and shapes of the dependence plots also exhibit stable results, confirmed in multiple setups. Focusing the models on positive empirical yield gaps can make the feature effects more linear (Fig. 15b and c). Nonlinear responses in the dependence plots for single features on the county level are likely empirical artefacts, as the definition of a feature as a relative affected area should more or less linearize the physical response. Although spatial neighbourhood effects, like a lack of water in a hydrologically connected area, could introduce nonlinearities, we assume in general that a more affected area should lead to more impact, regardless of the criterion.
3.3 Summary and discussion
3.3.1 Key findings
The main innovation of our study is the comparison of impact-relevant factors derived from field-level thermal–spectral ratios to those derived from county-level yield gaps via consistent XAI methods. Anomalies of LST NDVI are shifted to higher values during the drought years, but spatial patterns are rather scattered. The south-east of Brandenburg ranks high in our per-hectare economic loss estimates throughout all of the investigated years, although in the exceptional years of 2018 and 2019, high losses are also registered in the north and west. It is not immediately obvious how the spatial patterns of the individual hazard and vulnerability indicators relate to both impact indicators. While other studies have already presented regression attempts for drought impacts on individual crops in Germany (Peichl et al., 2021), crops vs. forest in Thailand (Tanguy et al., 2023), multiple sectors across Europe (Poljanšek et al., 2021; Rossi et al., 2023), or modelled economic loss under climate change scenarios (Naumann et al., 2021), none of these studies compared impact-relevant factors derived on the field level and county level from different impact data sources via XGBoost and SHAP. Through this comparison, we find the importance of SPEI in June for regressing the observed impacts substantiated by multiple model setups: (1) on the field level, regressing LST NDVI-anom., the SHAP values of SPEI in June strongly increase below −1. (2) On the county level, regressing empirical yield gaps, the relative area affected by SPEI < −1 is selected as the most important predictive feature for a model trained on all data, as well as for crop-specific models (both wheat and rye). (3) Even when removing all data where the empirical yield gap < 0, i.e. more yield reported than expected, SPEI features from June still top the ranking, although several thresholds are selected (mainly −0.5 and −1). This is of particular concern as current regional climate simulations for Brandenburg project a shift in the seasonal water balance and intensity of rainfall: more precipitation than today might arrive in winter, but rainfall during the summer months is expected to occur in shorter and more intense downpours, which implies a lower fraction of infiltration and longer times of amplified evaporative loss between the rain events (Jacob et al., 2014; Coppola et al., 2021; MLUK, 2023). While uncertainties in these projections are rather high for the case of summer precipitation, more robust projections of increasing summer dryness have been shown for surface soil moisture (Berg et al., 2017; Cook et al., 2018). We further identify conditions that are too wet in March as an impact-relevant factor, in agreement with Peichl et al. (2021).
SMI-Total adds complementary information to monthly SPEI. No real model improvement is obtained when using both SPEI and SMI monthly values though. From the considered vulnerability factors, AZL (i.e. agricultural soil quality) is by far the most relevant one. There is a clear influence of AZL on LST NDVI-anom., with vulnerability rising at AZL below about 35. LST NDVI is, somewhat surprisingly, not a good predictor for the empirical yield gaps in our study. We thus advise caution when interpreting empirical results from a single impact indicator. AZL is also related to selected crop types. Most notably, wheat is grown on high-quality soils, while rye is grown predominantly on low- to medium-quality soils. While this already indicates that rye tolerates harsher conditions, we find empirically that rye on poor soil is still more robust under drought conditions in the region than wheat is on good soil – based on both impact datasets. The cropped area of rye decreased by about 30 % between 2013 and 2022 in Brandenburg though, and the area for winter wheat increased by 19 % in the same time. Such choices of crop types simultaneously affect exposure and vulnerability and thus risk.
3.3.2 Limitations and future research
From the monthly hazard features, the models can learn interactions that resemble accumulation – however, we did not include predictors from a previous year or even longer lag times. The only information from a longer time period is SMI-Total (Fig. 8 shows the lag of 1 year compared to SPEI). As agricultural crops, as opposed to, for example, trees, are replaced every season, it does not seem logical to include longer lag times, but future research might investigate this. Groundwater and streamflow indicators have not been used, as both are highly managed in Brandenburg, and at the same time irrigation is very limited (confirmed during a workshop with local experts at HU Berlin on 25 November 2022), but we acknowledge that Rossi et al. (2023) found streamflow indicators relevant in the case of agriculture across Europe. Further improvements in modelling observed impacts likely require more detailed spatially explicit data on vulnerability; land use change; and landscape organization, e.g. hedgerows, agroforestry systems, and (farm)land management (such as cover crops, fertilizer use, and irrigation). Agriculture in Brandenburg is predominantly rainfed, and we found no reliable spatially explicit dataset on irrigation. This gap could be closed in the future via remote sensing studies. Most socio-economic variables used in our study, and in general in drought-related vulnerability studies (e.g. Meza et al., 2019; Stephan et al., 2023a), might exhibit direct influence not on crop loss but rather on the propagation of indirect impacts further down the impact chain. Substantiating such theoretical assumptions with quantitative investigations is an important topic for future research that requires novel datasets and methods, e.g. from the field of socio-hydrology (Wens et al., 2019).
The choice of impact variables, and the pre-processing thereof, might introduce biases. The LST NDVI anomaly is a commonly used indicator for drought-related crop health, but other indicators are possible, such as the radar vegetation index (Kim et al., 2012), hyperspectral metrics (Dao et al., 2021), fractional cover time series (Kowalski et al., 2023), or multimodal techniques (Karmakar et al., 2024). Regressions on the county level are based on relative yield gaps. Although we did not identify rapid agrotechnological changes within the investigated 10 years of yield data, the methodology could be improved to account for such potential jumps, particularly when investigating a longer time series. Directly regressing economic loss would also be possible and could lead to different insights (e.g. into the effect of price shocks). Both impact variables used in our regression are continuous rather than binary, which could affect the nonlinearities captured by the models.
We chose the algorithm XGBoost, which, compared to random forest, limits the amount of variability between the individual decision trees. It is assumed this avoids erratic behaviour, but, on the other hand, it could also limit the potential damaging processes discovered by the models. For the models on the county level, predictive features were derived by computing the relative area above and below evenly spaced thresholds. Alternatives here would be to use quantiles or to automate the feature engineering by deep learning algorithms. Stronger AI methods, not only in the regression but also in the feature learning step (i.e. deep learning), could improve the predictive skill. While the R2 scores obtained by our models are in the range of similar studies (e.g. Peichl et al., 2021; Tanguy et al., 2023), they are still rather low for a predictive use case (which was not our aim in this study). Reasons for this often low to moderate model skill of such studies include uncertainty in the regression target, the spatial and temporal resolution of the predictors, missing predictors and/or imperfect feature engineering, and a lack of representative training samples covering all the nonlinearities and interactions in the natural processes.
3.3.3 Recommendations
To prepare the agricultural sector, rural population, and society for an uncertain future climate with an increased frequency of extreme hydrometeorological events, monitoring systems with early warnings are needed. Given that most decision-makers, e.g. local authorities, disaster managers, or farmers, react to information about impacts (Dutt and Gonzales, 2010), such monitoring and early warning systems should be impact-based, rather than being informative only about hazards. In particular we recommend
-
fostering the implementation of impact-based monitoring and early warning systems for droughts to reduce impacts;
-
establishing the use of interactive visualization tools in education and training to advance adaptation;
-
selecting drought-robust crops (farmer responsibility), e.g. rye over wheat, and avoiding adverse incentives (policymaker responsibility);
-
providing water storage or other capacities for ad hoc measures during the decisive summer months (here, June).
Our analysis of spatiotemporal patterns of agricultural drought hazard, exposure, vulnerability, and impact indicators for Brandenburg in 2013–2022 empirically shows that the links between these components are complex and, consequently, that risk mapping and monitoring need to be supported by thorough investigations from multiple datasets. We present agricultural impact indicators on two spatial levels – the crop health indicator LST NDVI applied to individual fields and empirical yield gaps on the county level – and apply XGBoost regression to relate both of them to hazard and vulnerability indicators. Finding more detailed data on vulnerability and farmland management is still challenging but needed to improve the skill of the models. Stronger remote sensing indicators of drought impacts, beyond LST NDVI, seem necessary as well. Data-driven techniques from the AI domain can capture complex interactions in human environments such as agriculture. SHAP plots uncover which factors drive the prediction of impact indicators in the models. This does not necessarily relate to causal effects in nature though. We thus suggest cross-checking results obtained from different model setups, different regression targets, and ideally also different algorithms. Model inspection in this study shows that features are generally used in a physically meaningful direction, which is a prerequisite if data-driven models are to be trusted. Models from both impact datasets agree on the importance of meteorological drought in June, soil quality, and the type of crop. No single feature explains all the data though, and in fact such simplified interpretations are against the logic of using a strongly nonlinear machine learning (ML) algorithm to tackle complex regression problems. Rather than attempting to weight indicators manually, empirical impact data should be the benchmark for evaluating hazard and vulnerability indicators for the purpose of risk mapping. Interactive visualization tools should enter the education system at all levels to train the risk and climate literacy of future citizens and demonstrate impacts of hazards rather than hazards only. Ultimately, interactive impact-based forecasting tools would offer a basis for science communication with policymakers and participatory modelling approaches to develop better climate policies and raise awareness for feasible adaptation options.
Table A1Average yields [dt ha−1] per LBG in 2010–2014, as used to estimate expected yields. Compiled from LELF (2016).
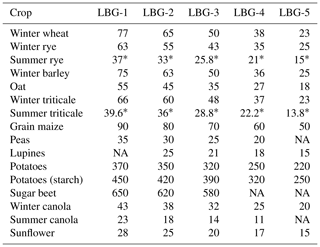
* Assumption, based on 60 % of winter variety. NA: not available.
Table C1Model setups on the field level (y = LST NDVI-anom.). The indicators denoted with an “x” are included in the respective setup. Performance initially assessed on 10 % of the data to check the relative differences.

a As a categorical feature rather than one-hot-encoded. b Re-trained on the full dataset.
Table C2Model setups on the county level (target is the relative empirical yield gap) using all available samples per setup (scores on holdout data). The indicators denoted with an “x” are included in the respective setup.

a As a categorical feature rather than one-hot-encoded. b Trained only on samples where empirical yield gap > 0.
All data and scripts needed to reproduce the figures, as well as the full processed dataset and scripts used to conduct the pre-processing and analysis, are publicly available via GitHub at https://github.com/fabiobrill/brandenburg-drought-study/ (last access: 20 November 2024) and are permanently archived on Zenodo at https://doi.org/10.5281/zenodo.13373271 (Brill, 2024a). Except for the crop prices, which were obtained from AMI under a commercial license, all other raw data used in this study either are open (see Table 1) or can be made available upon reasonable request to the authors. The interactive data exploration app in R Shiny is also available via the GitHub repository and can be run locally. An independent publicly hosted version is accessible online: https://fabiobrill.shinyapps.io/agrdrought-explorer-brandenburg/, Brill, 2024b.
FaB: conceptualization, methodology, software, formal analysis, validation, visualization, writing (original draft). PHLA: resources, writing (review and editing). HZ: resources, writing (review and editing). FrB: resources, writing (review and editing). SH: resources, writing (review and editing). TL: conceptualization, resources, writing (review and editing), funding acquisition. All authors have read and agreed to the submitted version of the paper.
At least one of the (co-)authors is a guest member of the editorial board of Natural Hazards and Earth System Sciences for the special issue “Current and future water-related risks in the Berlin–Brandenburg region”. The peer-review process was guided by an independent editor, and the authors also have no other competing interests to declare.
Publisher’s note: Copernicus Publications remains neutral with regard to jurisdictional claims made in the text, published maps, institutional affiliations, or any other geographical representation in this paper. While Copernicus Publications makes every effort to include appropriate place names, the final responsibility lies with the authors.
This article is part of the special issue “Current and future water-related risks in the Berlin–Brandenburg region”. It is not associated with a conference.
This research was conducted in the context of the Einstein Research Unit “Climate and Water under Change”, the Collaborative Research Center DETECT, and the Research Unit FORLand. We wish to thank the funding agencies, colleagues, and data providers involved. In particular we thank Jan Sodoge for providing the newspaper text-mining data for the full investigated period of time, and we acknowledge the preliminary work conducted by Thomas Hoffmann and Marlen Laudien during their theses at HU Berlin. We further thank both reviewers for adding important points to the discussion.
This research has been supported by the Einstein Stiftung Berlin and Berlin University Alliance (grant no. ERU-2020-609) and the Deutsche Forschungsgemeinschaft (grant no. SFB 1502/1–2022, project no. 450058266).
This paper was edited by Katrin Nissen and reviewed by Marthe Wens and one anonymous referee.
Abdullah, M. F., Siraj, S., and Hodgett, R. E.: An Overview of Multi-Criteria Decision Analysis (MCDA) Application in Managing Water-Related Disaster Events: Analyzing 20 Years of Literature for Flood and Drought Events, Water-Sui, 13, 1–27, https://doi.org/10.3390/w13101358, 2021.
Abunyewah, M., Okyere, S. A., Opoku Mensah, S., Erdiaw-Kwasie, M., Gajendran, T., and Byrne, M. K.: Drought impact on peri-urban farmers' mental health in semi-arid Ghana: The moderating role of personal social capital, Environmental Development, 49, 1–18, https://doi.org/10.1016/j.envdev.2023.100960, 2024.
Agrarheute: https://www.agrarheute.com/pflanze/brandenburg-rekordernte-gerste-raps-446957 (last access: 6 March 2024), 2014.
Agrarheute: https://www.agrarheute.com/markt/marktfruechte/erste-bilanzen-neue-prognosen-katastrophale-ernte-norden-545961 (last access: 6 March 2024), 2018.
Albers, H., Gornott, C., and Hüttel, S.: How do inputs and weather drive wheat yield volatility? The example of Germany, Food Policy, 70, 50–61, https://doi.org/10.1016/j.foodpol.2017.05.001, 2017.
Alencar, P. H. L. and Paton, E. N.: How do we identify flash droughts? A case study in Central European Croplands, Hydrol. Res., 53, 1150–1165, https://doi.org/10.2166/nh.2022.003, 2022.
Amt für Statistik Berlin-Brandenburg: Kommunalwahlen Im Land Brandenburg: Endgültiges Ergebnis Der Wahlen Zu Den Kreistagen Der Landkreise Und Stadtverordnetenversammlungen Der Kreisfreien Städte, https://www.statistik-berlin-brandenburg.de/kommunalwahlen-brandenburg (last access: 29 March 2024), 2019a.
Amt für Statistik Berlin-Brandenburg: Regionaler Sozialbericht Berlin Und Brandenburg 2019, https://web.statistik-berlin-brandenburg.de/instantatlas/interaktivekarten/sozialbericht/atlas.html (last access: 29 March 2024), 2019b.
Amt für Statistik Berlin-Brandenburg: Ernteberichterstattung über Feldfrüchte und Grünland in Brandenburg, https://www.statistik-berlin-brandenburg.de/c-ii-1-m (last access: 29 March 2024), 2022.
Austin, E. K., Handley, T., Kiem, A. S., Rich, J. L., Lewin, T. J., Askland, H. H., Askarimarnani, S. S., Perkins, D. A., and Kelly, B. J.: Drought-related stress among farmers: findings from the Australian Rural Mental Health Study, The Medical Journal of Australia, 209, 159–165, https://doi.org/10.5694/mja17.01200, 2018.
Bachmair, S., Stahl, K., Collins, K., Hannaford, J., Acreman, M., Svoboda, M., Knutson, C., Smith, K. H., Wall, N., Fuchs, B., Crossman, N. D., and Overton, I. C.: Drought indicators revisited: the need for a wider consideration of environment and society, WIREs Water, 3, 516–536, https://doi.org/10.1002/wat2.1154, 2016.
Berg, A., Sheffield, J., and Milly, P. C. D.: Divergent surface and total soil moisture projections under global warming. Geophys. Res. Lett., 44, 236–244, https://doi.org/10.1002/2016gl071921, 2017.
BGR (Bundesanstalt für Geowissenschaften und Rohstoffe): Potentielle Erosionsgefährdung Der Ackerböden Durch Wasser in Deutschland Auf Basis von Klimaszenarien, https://geoportal.bgr.de/mapapps/resources/apps/geoportal/index.html?lang=de#/datasets/portal/35d9601a-84f3-4e33-9436-69509bfd48c4 (last access: 29 March 2024), 2014a.
BGR (Bundesanstalt für Geowissenschaften und Rohstoffe): Potentielle Erosionsgefährdung Der Ackerböden Durch Wind in Deutschland, https://www.bgr.bund.de/DE/Themen/Boden/Ressourcenbewertung/Bodenerosion/Wind/PEG_wind_node.html (last access: 29 March 2024), 2014b.
BGR (Bundesanstalt für Geowissenschaften und Rohstoffe): Nutzbare Feldkapazität Im Effektiven Wurzelraum in Deutschland, https://www.bgr.bund.de/DE/Themen/Boden/Produkte/produktkatalog_node.html;jsessionid=78D8CD03B9D125DBDF2B089280CFCB6E.internet942 (last access: 29 March 2024), 2015a.
BGR (Bundesanstalt für Geowissenschaften und Rohstoffe): Physiologische Gründigkeit Der Böden Deutschlands (PhysGru1000_250 V1.0), https://www.govdata.de/daten/-/details/physiologische-grundigkeit-der-boden-deutschlands (last access: 29 March 2024), 2015b.
BGR (Bundesanstalt für Geowissenschaften und Rohstoffe): Austauschhäufigkeit Des Bodenwassers in Landwirtschaftlich Genutzten Böden Deutschlands, https://geoportal.bgr.de/mapapps/resources/apps/geoportal/index.html?lang=de#/datasets/portal/3bfef3bf-855a-435f-9d88-553b10000a4c (last access: 29 March 2024), 2015c.
BKG (Bundesanstalt für Kartographie und Geodäsie): Digitales Geländemodell Gitterweite 200 M, https://mis.bkg.bund.de/trefferanzeige?docuuid=eaaa67a1-5ecb-4e57-af38-b5f1d6d57e2a (last access: 29 March 2024), 2017.
Blauhut, V.: The triple complexity of drought risk analysis and its visualisation via mapping: a review across scales and sectors, Earth-Sci. Rev., 210, 1–22, https://doi.org/10.1016/j.earscirev.2020.103345, 2020.
Blauhut, V., Stahl, K., Stagge, J. H., Tallaksen, L. M., De Stefano, L., and Vogt, J.: Estimating drought risk across Europe from reported drought impacts, drought indices, and vulnerability factors, Hydrol. Earth Syst. Sci., 20, 2779–2800, https://doi.org/10.5194/hess-20-2779-2016, 2016.
Brill, F.: fabiobrill/brandenburg-drought-study: v1.0 (v1.0), Zenodo [data set] and [code], https://doi.org/10.5281/zenodo.13373271, 2024a.
Brill, F.: Drought hazard, vulnerability, and impacts to agriculture in Brandenburg, shinyapps [code], https://fabiobrill.shinyapps.io/agrdrought-explorer-brandenburg/ (last accessed 18 November 2024), 2024b.
Brill, F., Passuni Pineda, S., Espichán Cuya, B., and Kreibich, H.: A data-mining approach towards damage modelling for El Niño events in Peru, Geomat. Nat. Haz. Risk, 11, 1966–1990, https://doi.org/10.1080/19475705.2020.1818636, 2020.
Boeing, F., Rakovec, O., Kumar, R., Samaniego, L., Schrön, M., Hildebrandt, A., Rebmann, C., Thober, S., Müller, S., Zacharias, S., Bogena, H., Schneider, K., Kiese, R., Attinger, S., and Marx, A.: High-resolution drought simulations and comparison to soil moisture observations in Germany, Hydrol. Earth Syst. Sci., 26, 5137–5161, https://doi.org/10.5194/hess-26-5137-2022, 2022.
Chen, T. and Guestrin, C.: XGBoost: A Scalable Tree Boosting System, 22nd ACM SIGKDD International Conference on Knowledge Discovery and Data Mining, San Francisco, USA, 13–17 August 2016, 785-794, https://doi.org/10.1145/2939672.2939785, 2016.
Contreras, D.: The Integrated Spatial Pattern of Child Mortality during the 2012–2016 Drought in La Guajira, Colombia, Sustainability-Basel, 11, 1–23, https://doi.org/10.3390/su11247190, 2019.
Crocetti, L., Forkel, M., Fischer, M., Jurečka, F., Grlj, A., Salentinig, A., Trnka, M., Anderson, M., Ng, W.-T., Kokalj, Ž., Bucur, A., and Dorigo, W.: Earth Observation for agricultural drought monitoring in the Pannonian Basin (southeastern Europe): current state and future directions, Reg. Environ. Change, 20, 1–17, https://doi.org/10.1007/s10113-020-01710-w, 2020.
Cook, M., Schott, J. R., Mandel, J., and Raqueno, N.: Development of an Operational Calibration Methodology for the Landsat Thermal Data Archive and Initial Testing of the Atmospheric Compensation Component of a Land Surface Temperature (LST) Product from the Archive, Remote Sens., 6, 11244–11266, https://doi.org/10.3390/rs61111244, 2014.
Cook, B. I., Mankin, J. S., and Anchukaitis, K. J.: Climate change and drought: From past to future, Current Climate Change Reports, 4, 164–179, https://doi.org/10.1007/s40641-018-0093-2, 2018.
Coppola, E., Nogherotto, R., Ciarlo, J. M., Giorgi, F., van Meijgaard, E., Kadygrov, N., Iles, C., Corre, L., Sandstad, M., Somot, S., Nabat, P., Vautard, R., Levavasseur, G., Schwingshackl, C., Sillmann, J., Kjellström, E., Nikulin, G., Aalbers, E., Lenderink, G., Christensen, O. B., Boberg, F., Sørland, S. L., Demory, M.-E., Bülow, K., Teichmann, C., Warrach-Sagi, K., and Wulfmeyer, V.: Assessment of the European Climate Projections as Simulated by the Large EURO-CORDEX Regional and Global Climate Model Ensemble, J. Geophys. Res.-Atmos., 126, e2019JD032356, https://doi.org/10.1029/2019JD032356, 2021.
Cornes, R. C., van der Schrier, G., van den Besselaar, E. J. M., and Jones, P. D.: An ensemble version of the E-OBS temperature and precipitation data sets, J. Geophys. Res.-Atmos., 123, 9391–9409, https://doi.org/10.1029/2017JD028200, 2018.
Dabanli, I.: Drought hazard, vulnerability, and risk assessment in Turkey, Arab. J. Geosci., 11, 1–12, https://doi.org/10.1007/s12517-018-3867-x, 2018.
de Brito, M. M., Kuhlicke, C., and Marx, A.: Near-real-time drought impact assessment: a text mining approach on the 2018/19 drought in Germany, Environ. Res. Lett., 15, 1040a9, https://doi.org/10.1088/1748-9326/aba4ca, 2020.
Dao, P. D., He, Y., and Proctor, C.: Plant drought impact detection using ultra-high spatial resolution hyperspectral images and machine learning, Int. J. Appl. Earth Obs., 102, 102364, https://doi.org/10.1016/j.jag.2021.102364, 2021.
De Stefano, L., González Tánago, I., Ballesteros, M., Urquijo, J., Blauhut, Ve., Stagge, J. H. and Stahl, K.: Methodological approach considering different factors influencing vulnerability – pan-European scale, Technical Report No. 26, https://www.researchgate.net/publication/331919810_Methodological_approach_considering_different_factors_influencing_vulnerability_-_pan-European_scale (last access: 15 November 2024), 2015.
De Wit, A., Boogaard, H., Fumagalli, D., Janssen, S., Knapen, R., van Kraalingen, D., Supit, I., van der Wijngaart, R., and van Diepen, K.: 25 years of the WOFOST cropping systems model, Agr. Syst., 168, 154–167, https://doi.org/10.1016/j.agsy.2018.06.018, 2019.
DLF (Deutschlandfunk): https://www.deutschlandfunkkultur.de/duerre-in-brandenburg-noch-schlimmer-als-letztes-jahr-100.html (last access: 6 March 2024), 2019.
Dutt, V. and Gonzalez, C.: Why do we want to delay actions on climate change? Effects of probability and timing of climate consequences, J. Behav. Decis. Making, 25, 154–164, https://doi.org/10.1002/bdm.721, 2010.
Eurostat: Population on 1 January by Age Group, Sex and NUTS 3 Region (demo_r_pjangrp3), https://ec.europa.eu/eurostat/databrowser/product/page/DEMO_R_PJANGRP3$DEFAULTVIEW (last access: 29 March 2024), 2021.
Eurostat: Gross Domestic Product (GDP) at Current Market Prices by NUTS 3 Regions (nama_10r_3gdp), https://ec.europa.eu/eurostat/databrowser/product/page/NAMA_10R_3GDP__custom_2867669 (last access: 29 March 2024), 2022.
Erfurt, M., Glaser, R., and Blauhut, V.: Changing impacts and societal responses to drought in southwestern Germany since 1800, Reg. Environ. Change, 19, 2311–2323, https://doi.org/10.1007/s10113-019-01522-7, 2019.
European Commission: EUR 430 million of EU funds to support the EU agricultural sector, press release, Brussels, 1–3 https://ec.europa.eu/commission/presscorner/detail/en/IP_23_3189 (last access: 15 November 2024), 2023.
Frischen, J., Meza, I., Rupp, D., Wietler, K., and Hagenlocher, M.: Drought Risk to Agricultural Systems in Zimbabwe: A Spatial Analysis of Hazard, Exposure, and Vulnerability, Sustainability-Basel, 12, 1–23, https://doi.org/10.3390/su12030752, 2020.
Germer, S., Kaiser, K., Bens, O., and Hüttl, R. F.: Water Balance Changes and Responses of Ecosystems and Society in the Berlin-Brandenburg Region – a Review, DIE ERDE – Journal of the Geographical Society of Berlin, 142, 65–95, https://www.die-erde.org/index.php/die-erde/article/view/43 (last access: 15 November 2024), 2011.
Ghazaryan, G., König, S., Rezaei, E. E., Siebert, S., and Dubovyk, O.: Analysis of Drought Impact on Croplands from Global to Regional Scale: A Remote Sensing Approach, Remote Sens.-Basel, 12, 1–17, https://doi.org/10.3390/rs12244030, 2020.
Ghazaryan, G., Ernst, S., Sempel, F., and Nendel, C.: Field-Level Irrigation Monitoring with Integrated Use of Optical and Radar Time Series in Temperate Regions, in: Proceedings of the International Geoscience and Remote Sensing Symposium (IGARSS), Kuala Lumpur, Malaysia, 17–22 July 2022, 5448–5451, https://doi.org/10.1109/IGARSS46834.2022.9884067, 2022.
Gorelick, N., Hancher, M., Dixon, M., Ilyushchenko, S., Thau, D., and Moore, R.: Google Earth Engine: Planetary-scale geospatial analysis for everyone, Remote Sens. Environ., 202, 18–27, https://doi.org/10.1016/j.rse.2017.06.031, 2017.
Hagenlocher, M., Meza, I., Anderson, C. C., Min, A., Renaud, F. G., Walz, Y., Siebert, S., and Sebesvari, Z.: Drought vulnerability and risk assessments: state of the art, persistent gaps, and research agenda, Environ. Res. Lett., 14, 1–13, https://doi.org/10.1088/1748-9326/ab225d, 2019.
Hanel, M., Rakovec, O., Markonis, Y., Máca, P., Samaniego, L., Kyselý, J., and Kumar, R.: Revisiting the recent European droughts from a long-term perspective, Sci. Rep.-UK, 8, 1–11, https://doi.org/10.1038/s41598-018-27464-4, 2018.
Hari, V., Rakovec, O., Markonis, Y., Hanel, M., and Kumar, R.: Increased future occurrences of the exceptional 2018–2019 Central European drought under global warming, Sci. Rep.-UK, 10, 1–10, https://doi.org/10.1038/s41598-020-68872-9, 2020.
Holsten, A., Vetter, T., Vohland, K. and Krysanova, V.: Impact of climate change on soil moisture dynamics in Brandenburg with a focus on nature conservation areas, Ecol. Model., 220, 2076-2087, https://doi.org/10.1016/j.ecolmodel.2009.04.038, 2009.
Houmma, I. H., El Mansouri, L., Gadal, S., Garba, M., and Hadria, R.: Modelling agricultural drought: a review of latest advances in big data technologies, Geomat. Nat. Haz. Risk, 13, 2737–2776, https://doi.org/10.1080/19475705.2022.2131471, 2022.
Ihinegbu, C. and Ogunwumi, T.: Multi-criteria modelling of drought: a study of Brandenburg Federal State, Germany, Modeling Earth Systems and Environment, 8, 2035–2049, https://doi.org/10.1007/s40808-021-01197-2, 2022.
Jacob, D., Petersen, J., Eggert, B., Alias, A., Christensen, O. B., Bouwer, L. M., Braun, A., Colette, A., Déqué, M., Georgievski, G., Georgopoulou, E., Gobiet, A., Menut, L., Nikulin, G., Haensler, A., Hempelmann, N., Jones, C., Keuler, K., Kovats, S., Kröner, N., Kotlarski, S., Kriegsmann, A., Martin, E., van Meijgaard, E., Moseley, C., Pfeifer, S., Preuschmann, S., Radermacher, C., Radtke, K., Rechid, D., Rounsevell, M., Samuelsson, P., Somot, S., Soussana, J.-F., Teichmann, C., Valentini, R., Vautard, R., Weber, B., and Yiou, P.: EURO-CORDEX: new high-resolution climate change projections for European impact research. Reg. Environ. Change, 14, 563–578, https://doi.org/10.1007/s10113-013-0499-2, 2014.
Jakob, M., Stein, D., and Ulmi, M.: Vulnerability of buildings to debris flow impact, Nat. Hazards, 60, 241–261, https://doi.org/10.1007/s11069-011-0007-2, 2012.
Jänicke, B., Meier, F., Fenner, D., Fehrenbach, U., Holtmann, A., and Scherer, D.: Urban–rural differences in near-surface air temperature as resolved by the Central Europe Refined analysis (CER): sensitivity to planetary boundary layer schemes and urban canopy models, Int. J. Climatol., 37, 2063–2079, https://doi.org/10.1002/joc.4835, 2017.
Jena, R., Shanableh, A., Al-Ruzouq, R., Pradhan, B., Gibril, M. B. A., Khalil, M. A., Ghorbanzadeh, O., Ganapathy, G. P., and Ghamisi, P.: Explainable Artificial Intelligence (XAI) Model for Earthquake Spatial Probability Assessment in Arabian Peninsula, Remote Sens., 15, 2248, https://doi.org/10.3390/rs15092248, 2023.
Jhan, H.-T., Ballinger, R., Jaleel, A., and Ting, K.-H.: Development and application of a Socioeconomic Vulnerability Indicator Framework (SVIF) for Local Climate Change Adaptation in Taiwan, Sustainability-Basel, 12, 1–27, https://doi.org/10.3390/su12041585, 2020.
Kahlenborn, W., Porst, L., Voss, M., Fritsch, U., Renner, K., Zebisch, M., Wolf, M., Schönthaler, K., and Schauser, I.: Climate Impact and Risk Assessment 2021 for Germany – Summary, Umweltbundesamt, Dessau-Roßlau, https://www.umweltbundesamt.de/sites/default/files/medien/479/publikationen/cc_27-2021_climate_impact_and_risk_assessment_2021_for_germany_english_summary_bf.pdf (last access: 15 November 2024), 2021.
Karmakar, R., Teng, S.W., Murshed, M., Pang, S., Li, Y., and Lin, H.: Crop monitoring by multimodal remote sensing: A review, Remote Sensing Applications: Society and Environment, 33, 101093, https://doi.org/10.1016/j.rsase.2023.101093, 2024.
Karnieli, A., Agam, N., Pinker, R. T., Anderson, M., Imhoff, M. L., Gutman, G. G., Panov, N., and Goldberg, A.: Use of NDVI and Land Surface and Temperature for Drought and Assessment: and Merits and Limitations, J. Climate, 23, 618–633, https://doi.org/10.1175/2009JCLI2900.1, 2010.
Khoshnazar, A., Perez, G. C., and Sajjad, M.: Characterizing spatial-temporal drought risk heterogeneities: A hazard, vulnerability and resilience-based modeling, J. Hydrol., 619, 1–16, https://doi.org/10.1016/j.jhydrol.2023.129321, 2023.
Kim, H., Park, J., Yoo, J., and Kim, T.-W.: Assessment of drought hazard, vulnerability, and risk: A case study for administrative districts in South Korea, J. Hydro-Environ. Res., 9, 28–35, https://doi.org/10.1016/j.jher.2013.07.003, 2015.
Kim, S. J., Park, S., Lee, S. J., Shaimerdenova, A., Kim, J., Park, E., Lee, W., Kim, G. S., Kim, N., Kim, T. H., Lim, C.-H., Choi, Y., and Lee, W.-K.: Developing spatial agricultural drought risk index with controllable geo-spatial indicators: A case study for South Korea and Kazakhstan, Int. J. Disast. Risk Re., 54, 1–12, https://doi.org/10.1016/j.ijdrr.2021.102056, 2021.
Kim, Y., Jackson, T., Bindlish, R., Lee, H., and Hong, S.: Radar Vegetation Index for Estimating the Vegetation Water Content of Rice and Soybean, IEEE Geosci. Remote S., 9, 564–568, https://doi.org/10.1109/LGRS.2011.2174772, 2012.
Kondylatos, S., Prapas, I., Ronco, M., Papoutsis, I., Camps-Valls, G., Piles, M., Fernández-Torres, M.-Á., and Carvalhais, N.: Wildfire Danger Prediction and Understanding With Deep Learning, Geophys. Res. Lett., 49, 1–11, https://doi.org/10.1029/2022gl099368, 2022.
Kowalski, K., Okujeni, A., and Hostert, P.: A generalized framework for drought monitoring across Central European grassland gradients with Sentinel-2 time series, Remote Sens. Environ., 286, 113449, https://doi.org/10.1016/j.rse.2022.113449, 2023.
Kreibich, H., Van Loon, A. F., Schröter, K., Ward, P. J., Mazzoleni, M., Sairam, N., Abeshu, G. W., Agafonova, S., AghaKouchak, A., Aksoy, H., Alvarez-Garreton, C., Aznar, B., Balkhi, L., Barendrecht, M. H., Biancamaria, S., Bos-Burgering, L., Bradley, C., Budiyono, Y., Buytaert, W., Capewell, L., Carlson, H., Cavus, Y., Couasnon, A., Coxon, G., Daliakopoulos, I., de Ruiter, M. C., Delus, C., Erfurt, M., Esposito, G., François, D., Frappart, F., Freer, J., Frolova, N., Gain, A. K., Grillakis, M., Grima, J. O., Guzmán, D. A., Huning, L. S., Ionita, M., Kharlamov, M., Khoi, D. N., Kieboom, N., Kireeva, M., Koutroulis, A., Lavado-Casimiro, W., Li, H.-Y., LLasat, M. C., Macdonald, D., Mård, J., Mathew-Richards, H., McKenzie, A., Mejia, A., Mendiondo, E. M., Mens, M., Mobini, S., Mohor, G. S., Nagavciuc, V., Ngo-Duc, T., Huynh, T. T. N., Nhi, P. T. T., Petrucci, O., Nguyen, H. Q., Quintana-Seguí, P., Razavi, S., Ridolfi, E., Riegel, J., Sadik, M. S., Savelli, E., Sazonov, A., Sharma, S., Sörensen, J., Souza, F. A. A., Stahl, K., Steinhausen, M., Stoelzle, M., Szalińska, W., Tang, Q., Tian, F., Tokarczyk, T., Tovar, C., Tran, T. V. T., Van Huijgevoort, M. H. J., van Vliet, M. T. H., Vorogushyn, S., Wagener, T., Wang, Y., Wendt, D. E., Wickham, E., Yang, L., Zambrano-Bigiarini, M., Blöschl, G., and Di Baldassarre, G.: The challenge of unprecedented floods and droughts in risk management, Nature, 608, 80–86, https://doi.org/10.1038/s41586-022-04917-5, 2022.
Krishnamurthy R, P. K., Fisher, J. B., Choularton, R. J., and Kareiva, P. M.: Anticipating drought-related food security changes, Nature Sustainability, 5, 956–964, https://doi.org/10.1038/s41893-022-00962-0, 2022.
LBGR (Landesamt für Bergbau, Geologie und Rohstoffe Brandenburg): Atlas zur Geologie von Brandenburg, Cottbus, 1–69, ISBN 978-3-9808157-4-1, https://lbgr.brandenburg.de/sixcms/media.php/9/4_Geoatlas_1-69.pdf (last access: 15 November 2024), 2010.
LBV (Landesbauernverband Brandenburg e.V.): Ackerbau in Brandenburg, https://www.lbv-brandenburg.de/50-themen/ackerbau/209-ackerbau-in-Brandenburg, last access: 27 February 2024.
LELF (Landesamt für Ländliche Entwicklung, Landwirtschaft und Flurneuordnung): Richtwerte zur Bewertung von Aufwuchsschäden an landwirtschaftlichen Kulturen im Land Brandenburg, https://lelf.brandenburg.de/sixcms/media.php/9/Richtwerte-Aufwuchsschaeden-BB-2024.pdf (last access: 15 November 2024), 2016.
LELF (Landesamt für Ländliche Entwicklung, Landwirtschaft und Flurneuordnung): Datensammlung für die betriebswirtschaftliche Bewertung landwirtschaftlicher Produktionsverfahren im Land Brandenburg, https://lelf.brandenburg.de/sixcms/media.php/9/Datensammlung-2021-web.pdf (last access: 6 March 2024), 2021.
Leonhardt, H., Hüttel, S., Lakes, T., Wesemeyer, M., and Wolff, S.: Use Cases of the Integrated Administration and Control System's Plot-Level Data: Protocol and Pilot Analysis for a Systematic Mapping Review, Ger. J. Agr. Econ., 72, 168–184, https://doi.org/10.30430/gjae.2023.0385, 2023.
LfU (Landesamt für Umwelt Brandenburg): Schutzgebiete Nach Naturschutzrecht Des Landes Brandenburg, https://geobroker.geobasis-bb.de/gbss.php?MODE=GetProductInformation&PRODUCTID=AB2F53A4-A68E-413F-84C4-A972D2A2DA0B (last access: 29 March 2024), 2020.
Li, H., Vulova, S., Rocha, A. D., and Kleinschmit, B.: Spatio-temporal feature attribution of European summer wildfires with Explainable Artificial Intelligence (XAI), Sci. Total Environ., 916, 1–13, https://doi.org/10.1016/j.scitotenv.2024.170330, 2024.
Lundberg, S. M. and Lee, S.-I.: A Unified Approach to Interpreting Model Predictions, 1–9, arXiv [preprint], https://doi.org/10.48550/arXiv.1705.07874, 2017.
Lüttger, A. B. and Feike, T.: Development of heat and drought related extreme weather events and their effect on winter wheat yields in Germany, Theor. Appl. Climatol., 132, 15–29, https://doi.org/10.1007/s00704-017-2076-y, 2018.
McVicar, T. R. and Bierwirth, P. N.: Rapidly assessing the 1997 drought in Papua New Guinea using composite AVHRR imagery, Int. J. Remote Sens., 22, 2109–2128, https://doi.org/10.1080/01431160120728, 2001.
Merz, B., Kreibich, H., and Lall, U.: Multi-variate flood damage assessment: a tree-based data-mining approach, Nat. Hazards Earth Syst. Sci., 13, 53–64, https://doi.org/10.5194/nhess-13-53-2013, 2013.
Meza, I., Hagenlocher, M., Naumann, G., Vogt, J. V., and Frischen, J.: Drought vulnerability indicators for global-scale drought risk assessments: global expert survey results report, Publications Office of the European Union, Luxembourg, 1–56, https://doi.org/10.2760/73844, 2019.
Mishra, A. K. and Singh, V. P.: Drought modeling – A review, J. Hydrol., 403, 157–175, https://doi.org/10.1016/j.jhydrol.2011.03.049, 2011.
Mishra, V., Tiwari, A. D., Aadhar, S., Shah, R., Xiao, M., Pai, D. S., and Lettenmaier, D.: Drought and famine in India, 1870–2016, Geophys. Res. Lett., 46, 2075–2083, https://doi.org/10.1029/2018GL081477, 2019.
MLUK (Ministerium für Landwirtschaft, Umwelt und Klimaschutz): Berechenbar: Dürrehilfen 2018 abgeschlossen – rund 72 Millionen Euro für notleidende Agrarbetriebe, Pressemappe, agrar presseportal, Potsdam, https://www.agrar-presseportal.de/landwirtschaft/agrarpolitik/berechenbar-duerrehilfen-2018-abgeschlossen-rund-72-millionen-euro-fuer-notleidende-agrarbetriebe-27692.pdf (last access: 15 November 2024), 2019.
MLUK (Ministerium für Landwirtschaft, Umwelt und Klimaschutz): Agrarbericht Des Ministeriums Für Landwirtschaft, Umwelt Und Klimaschutz Des Landes Brandenburg, https://agrarbericht.brandenburg.de/abo/de/start/agrarstruktur/natuerliche-bedingungen/ (last access: 29 March 2024), 2022a.
MLUK (Ministerium für Landwirtschaft, Umwelt und Klimaschutz): Benachteiligtes Gebiet, https://geoportal.brandenburg.de/detailansichtdienst/render?view=gdibb&url=https://geoportal.brandenburg.de/gs-json/xml?fileid=f901b82c-54b7-4ef1-8365-2205da79c79b (last access: 29 March 2024), 2022b.
MLUK (Ministerium für Landwirtschaft, Umwelt und Klimaschutz): Daten aus dem Agrarförderantrag, https://geoportal.brandenburg.de/detailansichtdienst/render?view=gdibb&url=https://geoportal.brandenburg.de/gs-json/xml?fileid=996f8fd1-c662-4975-b680-3b611fcb5d1f (last access: 29 March 2024), 2022c.
MLUK (Ministerium für Landwirtschaft, Umwelt und Klimaschutz): Strategie des Landes Brandenburg zur Anpassung an die Folgen des Klimawandels, 1–177, https://mluk.brandenburg.de/sixcms/media.php/9/Klimaanpassungsstrategie-Brandenburg-LF.pdf (last access: 15 November 2024), 2023.
Naumann, G., Cammalleri, C., Mentaschi, L., and Feyen, L.: Increased economic drought impacts in Europe with anthropogenic warming, Nat. Clim. Change, 11, 485–491, https://doi.org/10.1038/s41558-021-01044-3, 2021.
Peichl, M., Thober, S., Samaniego, L., Hansjürgens, B., and Marx, A.: Machine-learning methods to assess the effects of a non-linear damage spectrum taking into account soil moisture on winter wheat yields in Germany, Hydrol. Earth Syst. Sci., 25, 6523–6545, https://doi.org/10.5194/hess-25-6523-2021, 2021.
Poljanšek, K., Casajus Valles, A., Marin Ferrer, M., De Jager, A., Dottori, F., Galbusera, L., Garcia Puerta, B., Giannopoulos, G., Girgin, S., Hernandez Ceballos, M., Iurlaro, G., Karlos, V., Krausmann, E., Larcher, M., Lequarre, A., Theocharidou, M., Montero Prieto, M., Naumann, G., Necci, A., Salamon, P., Sangiorgi, M., Sousa, M. L, Trueba Alonso, C., Tsionis, G., Vogt, J., and Wood, M.: Recommendations for National Risk Assessment for Disaster Risk Management in EU, EUR 29557 EN, Publications Office of the European Union, Luxembourg, JRC114650, ISBN 978-92-79-98366-5, https://doi.org/10.2760/084707, 2021.
Prodhan, F. A., Zhang, J., Hasan, S. S., Pangali Sharma, T. P., and Mohana, H. P.: A review of machine learning methods for drought hazard monitoring and forecasting: Current research trends, challenges, and future research directions, Environ. Modell. Softw., 149, 105327, https://doi.org/10.1016/j.envsoft.2022.105327, 2022.
Raihan, M. J., Khan, M. AM., Kee, S.-H., and Al Nahid, A.: Detection of the chronic kidney disease using XGBoost classifier and explaining the influence of the attributes on the model using SHAP, Sci. Rep.-UK, 13, 6263, https://doi.org/10.1038/s41598-023-33525-0, 2023.
Reinermann, S., Gessner, U., Asam, S., Kuenzer, C., and Dech, S.: The Effect of Droughts on Vegetation Condition in Germany: An Analysis Based on Two Decades of Satellite Earth Observation Time Series and Crop Yield Statistics, Remote Sens.-Basel, 11, 1–21, https://doi.org/10.3390/rs11151783, 2019.
Reisinger, A., Howden, M., Vera, C., Garschagen, M., Hurlbert, M., Kreibiehl, S., Mach, K. J., Mintenbeck, K., O'Neill, B., Pathak, M., Pedace, R., Pörtner, H.-O., Poloczanska, E., Corradi, M. R., Sillmann, J., van Aalst, M., Viner, D., Jones, R., Ruane, A. C., and Ranasinghe, R.: The concept of risk in the IPCC Sixth Assessment Report: A Summary of Cross-Working Group Discussions, Intergovernmental Panel on Climate Change, Geneva, Switzerland, 15 pp., https://www.ipcc.ch/site/assets/uploads/2021/02/Risk-guidance-FINAL_15Feb2021.pdf (last access: 15 November 2024), 2020.
Rossi, L., Wens, M., De Moel, H., Cotti, D., Sabino Siemons, A., Toreti, A., Maetens, W., Masante, D., van Loon, A., Hagenlocher, M., Rudari, R., Naumann, G., Meroni, M., Avanzi, F., Isabellon, M., and Barbosa, P.: European Drought Risk Atlas, Publications Office of the European Union, Luxembourg, 1–101, https://doi.org/10.2760/33211, 2023.
Şalap-Ayça, S. and Goto, E. A.: Beware the Rise of Models When They Are Wrong: A Look at Heat Vulnerability Modeling Through the Lens of Sensitivity (Short Paper), in: 12th International Conference on Geographic Information Science (GIScience 2023), Schloss-Dagstuhl-Leibniz Zentrum für Informatik, Germany, 12–15 September 2023, Leibniz International Proceedings in Informatics (LIPIcs), 277, 64:1–64:6, https://doi.org/10.4230/LIPICS.GISCIENCE.2023.64, 2023.
Samaniego, L., Kumar, R., and Zink, M.: Implications of Parameter Uncertainty on Soil Moisture Drought Analysis in Germany, J. Hydrometeorol., 14, 47–68, https://doi.org/10.1175/JHM-D-12-075.1, 2013.
Santini, M., Noce, S., Antonelli, M., and Caporaso, L.: Complex drought patterns robustly explain global yield loss for major crops, Sci. Rep.-UK, 12, 1–17, https://doi.org/10.1038/s41598-022-09611-0, 2022.
Satoh, Y., Yoshimura, K., Pokhrel, Y., Kim, H., Shiogama, H., Yokohata, T., Hanasaki, N., Wada, Y., Burek, P., Byers, E., Müller Schmied, H., Gerten, D., Ostberg, S., Newland Gosling, S., Stanslas Boulange, J. E., and Oki, T.: The timing of unprecedented hydrological drought under climate change, Nat. Commun., 13, 1–11, https://doi.org/10.1038/s41467-022-30729-2, 2022.
Schmitz, T. and Müller, D.: Digitale Karte der Bodenwertzahlen für Brandenburg, FORLand Technisches Papier 01, AgEcon Search, Germany, 1–13, https://doi.org/10.22004/ag.econ.308812, 2020.
Shapley, L. S.: A value for n-person games, in: Contributions to the Theory of Games, Volume II, Annals of Mathematics Studies, edited by: Kuhn, H. and Tucker, A. W., Princeton University Press, Princeton, NJ, 307–317, https://doi.org/10.1073/pnas.39.10.1095, 1953.
Sieg, T., Vogel, K., Merz, B., and Kreibich, H.: Tree-based flood damage modeling of companies: Damage processes and model performance, Water Resour. Res., 53, 6050–6068, https://doi.org/10.1002/2017wr020784, 2017.
Söder, M., Berg-Mohnicke, M., Bittner, M., Ernst, S., Feike, T., Frühauf, C., Golla, B., Jänicke, C., Jorzig, C., Leppelt, T., Liedtke, M., Möller, M., Nendel, C., Offermann, F., Riedesel, L., Romanova, V., Schmitt, J., Schulz, S., Seserman, D.-M., and Shawon, A. R.: Klimawandelbedingte Ertragsveränderungen und Flächennutzung (KlimErtrag), Thünen Working Paper 198, AgEcon Search, Johann Heinrich von Thünen-Institut, Braunschweig, Germany, 234 pp., https://doi.org/10.22004/ag.econ.324625, 2022.
Sodoge, J., Kuhlicke, C., and de Brito, M. M.: Automatized spatio-temporal detection of drought impacts from newspaper articles using natural language processing and machine learning, Weather and Climate Extremes, 41, 1–9, https://doi.org/10.1016/j.wace.2023.100574, 2023.
Svoboda, M., LeComte, D., Hayes, M., Heim, R., Gleason, K., Angel, J., Rippey, B., Tinker, R., Palecki, M., Stooksbury, D., Miskus, D., and Stephens, S.: The Drought Monitor, B. Am. Meteorol. Soc., 83, 1181–1190, https://doi.org/10.1175/1520-0477-83.8.1181, 2002.
Stahl, K., Kohn, I., Blauhut, V., Urquijo, J., De Stefano, L., Acácio, V., Dias, S., Stagge, J. H., Tallaksen, L. M., Kampragou, E., Van Loon, A. F., Barker, L. J., Melsen, L. A., Bifulco, C., Musolino, D., de Carli, A., Massarutto, A., Assimacopoulos, D., and Van Lanen, H. A. J.: Impacts of European drought events: insights from an international database of text-based reports, Nat. Hazards Earth Syst. Sci., 16, 801–819, https://doi.org/10.5194/nhess-16-801-2016, 2016.
Statistische Ämter des Bundes und der Länder: Arbeitskräfte Und Deren Arbeitsleistung in Landwirtschaftlichen Betrieben, https://www.regionalstatistik.de/genesis/online?operation=table&code=41141-08-02-4-B&bypass=true&levelindex=1&levelid=1657801475190#abreadcrumb (last access: 29 March 2024), 2010.
Statistische Ämter des Bundes und der Länder: Bodenfläche Nach Art Der Tatsächlichen Nutzung, https://www.regionalstatistik.de/genesis//online?operation=table&code=33111-01-02-4&bypass=true&levelindex=0&levelid=1659007696599#abreadcrumb (last access: 29 March 2024), 2020a.
Statistische Ämter des Bundes und der Länder: Landwirtschaftliche Betriebe Insgesamt Sowie Mit Ökologischem Landbau Und Deren Landwirtschaftlich Genutzte Fläche (LF) Und Viehbestand, https://www.regionalstatistik.de/genesis/online?operation=table&code=41141-04-02-4&bypass=true&levelindex=0&levelid=1660746074321#abreadcrumb (last access: 29 March 2024), 2020b.
Statistische Ämter des Bundes und der Länder: Landwirtschaftliche Betriebe Mit Hofnachfolge, https://www.regionalstatistik.de/genesis//online?operation=table&code=41141-09-01-4&bypass=true&levelindex=0&levelid=1663767785139#abreadcrumb (last access: 29 March 2024), 2020c.
Statistische Ämter des Bundes und der Länder: Landwirtschaftliche Betriebe Nach Rechtsform Und Sozialökonomische Betriebstypen, https://www.regionalstatistik.de/genesis//online?operation=table&code=41141-07-01-4&bypass=true&levelindex=0&levelid=1661699406158#abreadcrumb (last access: 29 March 2024), 2020d.
Statistische Ämter des Bundes und der Länder: Schulabgangsquote an Allgemeinbildenden Schulen VIII, https://www.bildungsmonitoring.de/bildung/online?operation=table&code=BBD15.1i&bypass=true&levelindex=0&levelid=1660318442403#abreadcrumb (last access: 12 August 2022, no longer available online), 2021.
Statistische Ämter des Bundes und der Länder: Arbeitslosenquote Regionalatlas Deutschland, https://regionalatlas.statistikportal.de/?BL=DE&TCode=AI008-1-5&ICode=AI0801 (last access: 11 August 2022), 2022.
Stephan, R., Terzi, S., Erfurt, M., Cocuccioni, S., Stahl, K., and Zebisch, M.: Assessing agriculture's vulnerability to drought in European pre-Alpine regions, Nat. Hazards Earth Syst. Sci., 23, 45–64, https://doi.org/10.5194/nhess-23-45-2023, 2023a.
Stephan, R., Stahl, K., and Dormann, C. F.: Drought impact prediction across time and space: limits and potentials of text reports, Environ. Res. Lett., 18, 074004, https://doi.org/10.1088/1748-9326/acd8da, 2023b.
Sutanto, S. J., van der Weert, M., Wanders, N., Blauhut, V., and van Lanen, H. A. J.: Moving from drought hazard to impact forecasts, Nat. Commun., 10, 1–7, https://doi.org/10.1038/s41467-019-12840-z, 2019.
Tagesschau: https://www.tagesschau.de/wirtschaft/unternehmen/landwirtschaft-erntebilanz-bauern-duerre-101.html (last access: 6 March 2024), 2022.
Tanguy, M., Eastman, M., Magee, E., Barker, L. J., Chitson, T., Ekkawatpanit, C., Goodwin, D., Hannaford, J., Holman, I., Pardthaisong, L., Parry, S., Rey Vicario, D., and Visessri, S.: Indicator-to-impact links to help improve agricultural drought preparedness in Thailand, Nat. Hazards Earth Syst. Sci., 23, 2419–2441, https://doi.org/10.5194/nhess-23-2419-2023, 2023.
Tellman, B., Schank, C., Schwarz, B., Howe, P. D., and de Sherbinin, A.: Using Disaster Outcomes to Validate Components of Social Vulnerability to Floods: Flood Deaths and Property Damage across the USA, Sustainability-Basel, 12, 1–28, https://doi.org/10.3390/su12156006, 2020.
Vicente-Serrano, S. M., Beguería, S., and López-Moreno, J. I.: A Multiscalar Drought Index Sensitive to Global Warming: The Standardized Precipitation Evapotranspiration Index, J. Climate, 23, 1696–1718, https://doi.org/10.1175/2009jcli2909.1, 2010.
Wagenaar, D., de Jong, J., and Bouwer, L. M.: Multi-variable flood damage modelling with limited data using supervised learning approaches, Nat. Hazards Earth Syst. Sci., 17, 1683–1696, https://doi.org/10.5194/nhess-17-1683-2017, 2017.
Walz, Y., Dall, K., Graw, V., Villagran de Leon, J.-C., Haas, S., Kussul, N., and Jordaan, A.: Understanding and reducing agricultural drought risk: Examples from South Africa and Ukraine, Policy Report No. 3, United Nations University – Institute for Environment and Human Security (UNU-EHS), Bonn, 1–29, https://collections.unu.edu/eserv/UNU:6688/PolicyReport_181213_EN_META.pdf (last access: 15 November 2024), 2018.
Wang, Q., Zeng, J., Qi, J., Zhang, X., Zeng, Y., Shui, W., Xu, Z., Zhang, R., Wu, X., and Cong, J.: A multi-scale daily SPEI dataset for drought characterization at observation stations over mainland China from 1961 to 2018, Earth Syst. Sci. Data, 13, 331–341, https://doi.org/10.5194/essd-13-331-2021, 2021.
Wens, M., Johnson, J. M., Zagaria, C., and Veldkamp, T. I. E.: Integrating human behavior dynamics into drought risk assessment – A sociohydrologic, agent-based approach, WIREs Water, 6, e1345, https://doi.org/10.1002/wat2.1345, 2019.
Wilhite, D. A. and Glantz, M. H.: Understanding: the Drought Phenomenon: The Role of Definitions, Water Int., 10, 111–120, https://doi.org/10.1080/02508068508686328, 1985.
Yang, C., Chen. M., and Yuan, Q.: The application of XGBoost and SHAP to examining the factors in freight truck-related crashes: An exploratory analysis, Accid. Anal. Prev., 158, 106153, https://doi.org/10.1016/j.aap.2021.106153, 2021.
Zhang, H., Loaiciga, H. A., and Sauter, T.: A Novel Fusion-Based Methodology for Drought Forecasting, Remote Sens., 16, 828, https://doi.org/10.3390/rs16050828, 2024.
Zhou, R., Jin, J., Cui, Y., Ning, S., Bai, X., Zhang, L., Zhou, Y., Wu, C., and Tong, F.: Agricultural drought vulnerability assessment and diagnosis based on entropy fuzzy pattern recognition and subtraction set pair potential, Alexandria Engineering Journal, 61, 51–63, https://doi.org/10.1016/j.aej.2021.04.090, 2022.
Zink, M., Samaniego, L., Kumar, R., Thober, S., Mai, J., Schäfer, D., and Marx, A.: The German drought monitor, Environ. Res. Lett., 11, 1–9, https://doi.org/10.1088/1748-9326/11/7/074002, 2016.


