the Creative Commons Attribution 4.0 License.
the Creative Commons Attribution 4.0 License.
Optimizing rainfall-triggered landslide thresholds for daily landslide hazard warning in the Three Gorges Reservoir area
Bo Peng
Xueling Wu
Rainfall is intrinsically linked to the occurrence of landslide catastrophes. Identifying the most suitable rainfall threshold model for an area is crucial for establishing effective daily landslide hazard warnings, which are essential for the precise prevention and management of local landslides. This study introduces a novel approach that utilizes multilayer perceptron (MLP) regression to calculate rainfall thresholds for 453 rainfall-induced landslides. This research represents the first attempt to integrate MLP and ordinary least squares methods for determining the optimal rainfall threshold model tailored to distinct subregions, categorized by topographical and climatic conditions. Additionally, an innovative application of a three-dimensional convolutional neural network (CNN-3D) model is introduced to enhance the accuracy of landslide susceptibility predictions. Finally, a comprehensive methodology is developed to integrate daily rainfall warning levels with landslide susceptibility predictions using a superposition matrix, thus offering daily landslide hazard warning results for the study area. The key findings of this study are as follows. (1) The optimal rainfall threshold models and calculation methods vary across different subregions, underscoring the necessity for tailored approaches. (2) The CNN-3D model substantially improves the accuracy of landslide susceptibility predictions. (3) The daily landslide hazard warnings were validated using anticipated rainfall data from 19 July 2020, thereby demonstrating the reliability of both the landslide hazard warning results and the rainfall threshold model. This study presents a substantial advancement in the precise prediction and management of landslide hazards by employing innovative modeling techniques.
- Article
(21627 KB) - Full-text XML
- BibTeX
- EndNote
According to the China Statistical Yearbook, landslides accounted for 71.55 % of geological disasters in China between 2005 and 2021 (http://www.stats.gov.cn/sj/ndsj/, last access: 10 October 2023). Frequent landslides pose significant risks to both lives and property (Xing et al., 2021). Rainfall triggers landslides by altering pore pressure in the soil (Zhao et al., 2022) and reducing the shear strength of the geotechnical materials (Chan et al., 2018). Research indicates that rainfall is intrinsically linked to the majority of landslide deformations and instabilities (Marin et al., 2020; Yuniawan et al., 2022). Therefore, it is crucial to delineate the rainfall thresholds for various conditions and regions to improve landslide hazard warnings and disaster prevention efforts. Landslide hazard warning is described as the conditional prediction of the temporal and spatial probabilities of landslide occurrence based on triggering and inducing factors (Budimir et al., 2015). In this study, the rainfall warning level (i.e., the temporal probability of landslide occurrence) derived from the rainfall threshold model serves as the triggering factor, while the landslide susceptibility predictions (i.e., the spatial probability of occurrence) act as the inducing factor.
Landslide susceptibility reflects the spatial probability of landslide occurrence (Huang et al., 2022b). Methods for predicting landslide susceptibility include general linear models (Aksha et al., 2020), information value models (Yu et al., 2022), and various machine learning models. Machine learning models are more effective than other types in capturing and predicting the nonlinear relationships between landslide susceptibility and predisposing factors (Guo et al., 2021). Commonly used machine learning models include logistic regression (Baharvand et al., 2020), artificial neural networks (Jiang et al., 2014), support vector machines (SVMs) (Zhu and Hu, 2013; Chang et al., 2023), random forest (RF) (Chen et al., 2014; Huang et al., 2024), Bayesian algorithms (He et al., 2019), and deep learning algorithms (Huang et al., 2020). However, selecting the most suitable model for landslide susceptibility prediction remains challenging, and significant uncertainty exists in the results obtained from different machine learning models (Xia et al., 2020). Even small improvements in prediction accuracy can significantly impact landslide susceptibility zoning (Chen et al., 2018). Therefore, to reduce uncertainty in landslide susceptibility results, multiple susceptibility models are often applied, and the model with the highest accuracy is selected for the study area.
Rainfall threshold modeling approaches primarily include deterministic methods based on physical and hydrological models, as well as empirical methods based on landslide cataloguing and rainfall event statistics (Wu et al., 2015; Chung et al., 2017). Deterministic methods establish the relationship between rainfall and landslide stability through dynamic hydrological models and determine the critical rainfall threshold for landslide instability (Ciurleo et al., 2019). However, due to the challenges of accurately obtaining hydrological and geotechnical parameters on a large scale, this method is primarily applicable to smaller study areas (Wu and Yeh, 2020). Empirical methods are mainly derived by calculating the relationship between historical landslide and rainfall data (Pradhan et al., 2019; Abraham et al., 2020b). This approach is widely used due to its advantages in data acquisition convenience, applicability, and effectiveness (Martinovic et al., 2018). Commonly used rainfall threshold models include the intensity and duration (I–D) threshold model (Lee et al., 2014; Abraham et al., 2019) and the effective rainfall and duration of rainfall (E–D) threshold model (Peruccacci et al., 2017; Abraham et al., 2020a). Regression methods used to calculate the rainfall threshold model include logistic regression (Mathew et al., 2014), ordinary least squares (OLS) regression (Rossi et al., 2017), and quantile regression (Salee et al., 2022). The applicability of various rainfall threshold models and regression methods differs across regions (Segoni et al., 2018; Marin, 2020). Therefore, to reduce uncertainty in landslide hazard warnings, multiple regression methods and rainfall threshold models should be employed to determine the most appropriate threshold for a specific location.
Given that many researchers have employed the log–log coordinate system for regression analysis of rainfall threshold models (He et al., 2020), this study proposes to use of the multilayer perceptron (MLP) regression method to examine rainfall thresholds under various rainfall durations. Additionally, the third-dimension indicator, daily rainfall (R), was incorporated to develop the E–D–R rainfall threshold model, extending the E–D rainfall threshold model (Liu et al., 2022).
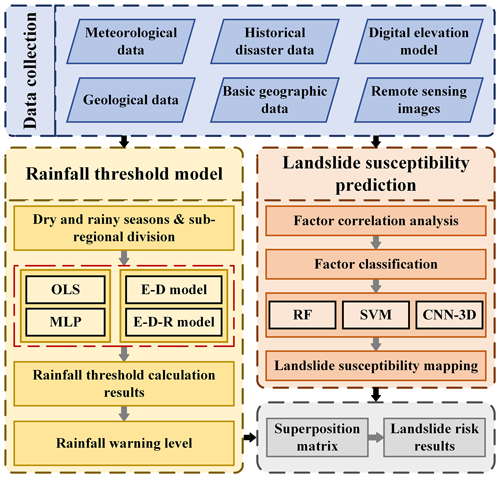
In this study, the Three Gorges Reservoir area was selected as the study area. Landslides were catalogued to obtain the E and D data for the 5 d preceding each landslide, as well as the R data at the time of the landslides. Subsequently, the rainfall thresholds corresponding to the E–D and E–D–R models for varying landslide occurrence probabilities were calculated using both OLS and MLP regression methods. The study aims to explore the optimal rainfall threshold model for the study area, assess the feasibility of neural networks in rainfall threshold modeling, and categorize rainfall warning levels based on the optimal model. Landslide-inducing factors were selected, and landslide susceptibility was predicted using RF, SVM, and 3D convolutional neural network (CNN-3D) models. The most accurate susceptibility results were used as the spatial probability of landslide occurrence in the study area. Finally, the daily rainfall warning level was combined with the landslide susceptibility results using a superposition matrix to generate daily landslide hazard warnings, providing a reference for the precise prevention and management of local landslide disasters. The study flowchart is shown in Fig. 1.
2.1 Rainfall threshold model
2.1.1 OLS regression
OLS regression is a widely used linear regression technique for establishing a linear relationship between an independent variable (x) and a dependent variable (y). It minimizes the difference between the predicted and observed value by finding the slope and intercept that best fit the data (Lim et al., 2023).
The basic form of the OLS regression model is expressed as
where y denotes the dependent variable, xi denotes the independent variable, n denotes the number of independent variables, βi denotes the coefficients of the independent variables, and β0 denotes the constant intercept.
2.1.2 MLP regression
MLP is a commonly used neural network capable of nonlinear mapping, enabling it to learn complex nonlinear functional relationships through multiple layers of nodes. It has been widely applied in various fields, including geospatial analysis (Hasan et al., 2023; X. B. Wang et al., 2023), aerodynamics (Barcenas et al., 2023), atmospheric science (Hoffman and Jasinski, 2023), rainfall prediction (Narimani et al., 2023), and image fusion (Mei et al., 2023). In regression analysis of scatter data, a scatter data set is treated as a collection of input–output data pairs. The model adjusts its weights by minimizing the error between predicted and actual data, ultimately achieving accurate regression.
2.1.3 E–D–R rainfall threshold model
The E–D–R rainfall threshold model builds upon the E–D rainfall threshold model by introducing the R metric as a third dimension to optimize the original model. To analyze the E–D–R rainfall threshold model, it is essential first to establish the E–D rainfall threshold model.
The E–D rainfall threshold model examines the relationship between effective rainfall and the duration of rainfall (Teja et al., 2019). The scatter plot is typically analyzed using regression in a log–log coordinate system, with the resulting fitted line then transformed into a Cartesian coordinate system. The expression for this is
Assume the linear equation fitted in the log–log coordinate system has an intercept of b and a slope of a. Then, in this context, α=10b; β=a, where D denotes the duration of rainfall (in days); and E is the effective rainfall (in mm), defined as the total rainfall that infiltrates and impacts the landslide, excluding slope runoff and evaporation (Huang et al., 2022a). The effective rainfall formula applied in this study is
where E denotes the effective rainfall, Ei is the rainfall on the previous i days, and k is the effective rainfall coefficient, typically set to 0.8 (Huang et al., 2022a). Additionally, it has been demonstrated that effective rainfall within the first 5 d in the Three Gorges Reservoir area is strongly correlated with landslide events (Zhou et al., 2022). Therefore, the number of days n considered for rainfall statistics in this study is set to 5.
The indicator R is introduced as a third dimension to extend the E–D rainfall threshold model from two to three dimensions, resulting in a model that satisfies the following relational equation:
where T denotes the final rainfall warning level, while GE and GR denote the rainfall warning levels for the E–D model and R dimension, respectively.
2.2 CNN-3D model
A convolutional neural network (CNN) is a deep learning algorithm extensively utilized in image recognition (Fan et al., 2022; Gill et al., 2022), natural language processing (Jin et al., 2023; Kaliyar et al., 2021), and various other domains. The core principle of CNN involves extracting features from input data through convolution operations (Youssef et al., 2022). However, in one- and two-dimensional CNNs, feature extraction for induced factor data is typically performed at a single raster point. Both methods overlook the spatial information surrounding the raster points (Yang et al., 2022). Consequently, this study introduces CNN-3D to fully leverage the rich spatial information surrounding raster points, thereby enhancing the prediction accuracy of landslide susceptibility. The structure of CNN-3D mirrors that of traditional CNN, but due to the inclusion of additional spatial data, CNN-3D can yield more accurate results (Liu et al., 2023).
A three-dimensional structure was selected to generate samples in this experiment. Prior to sample generation, an n-channel image is created by superimposing n components. Each pixel is then extended outward by 7 pixels, resulting in a 15 × 15 × n image used as input. Subsequently, high-level features are mapped to a low-dimensional space through operations such as convolution and pooling in the hidden layer, and these features are then stored in the neural units of the fully connected layer. Finally, classification is performed using the softmax function to determine landslide and non-landslide outcomes.
3.1 Physical and geographical characteristics
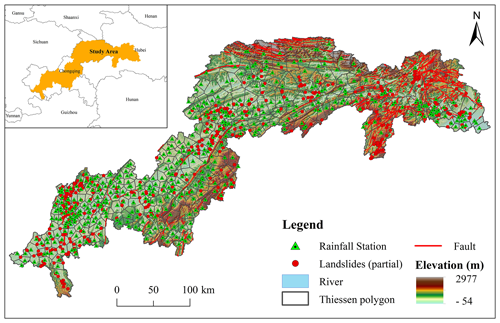
The study area is located in the upper reaches of the Yangtze River, extending from Sandouping in Yichang city to Jiangjin District in Chongqing. It lies between longitudes 105°50′ and 111°42′ E and latitudes 28°30′ and 31°45′ N (Cheng et al., 2022). This area encompasses 29 administrative districts and counties, including 7 in Hubei Province and 22 in Chongqing municipality, covering a total area of 5.67 × 10⁴ km2 (Fig. 2).The region experiences a subtropical monsoon climate, with average annual precipitation ranging from 445 to 1813 mm (Long et al., 2021). The abundant rainfall in the region is a significant factor contributing to landslide occurrences (Guo et al., 2022).
3.2 Landslide data cataloguing and study area subdivision
Cataloging landslide data is crucial for studying rainfall thresholds (Gariano et al., 2021). This process involves recording essential information, including the time of occurrence, geographic location, and associated rainfall stations for each landslide event. The historical landslide data used in this study were provided by the Wuhan Geological Survey Center (http://www.wuhan.cgs.gov.cn/, last access: 3 June 2023). To identify the corresponding rainfall stations for each historical landslide, the Thiessen polygon method was employed to match each landslide point with the nearest rainfall station (Zhao et al., 2019), thereby obtaining the pre-landslide rainfall data (see Fig. 2, Thiessen polygons).
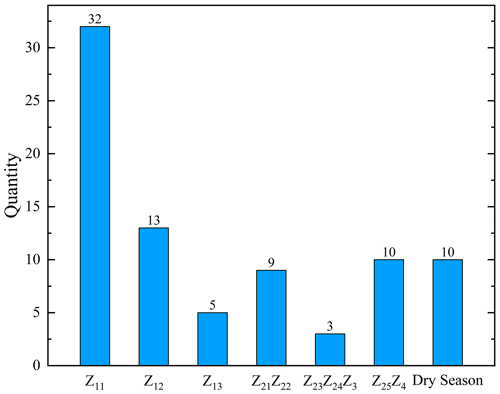
After filtering and cleaning, a total of 453 historical landslides with accurate rainfall information, dates, and locations were identified (see Fig. 2, landslides). Historical rainfall data indicate that precipitation in the study area is primarily concentrated between May and October. The differing climatic conditions between the dry and rainy seasons may lead to varying impacts of rainfall on landslide movements (Soralump et al., 2021). Based on this information, the historical landslides were classified into rainy season and dry season landslides according to their occurrence times (Fig. 3b).
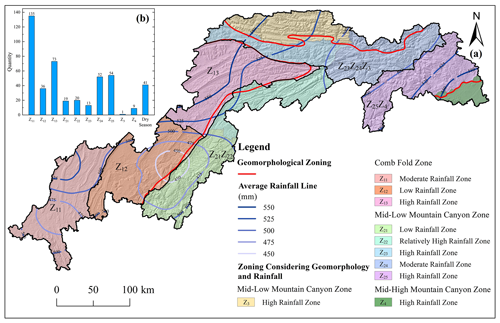
Figure 3Zoning map of the study area. (a) Schematic diagram of the subregion merger; (b) number of historical landslide hazard sites in each subregion.
Given the substantial influence of geomorphological, geological, and climatic conditions on landslide triggers during the rainy season (Dahal and Hasegawa, 2008), rainfall thresholds can vary across different regions. Accordingly, this study further subdivided the landslide data from the rainy season. The study area was divided into several subregions based on terrain and climatic conditions, with rainfall thresholds calculated for each region. However, due to the limited historical landslide data in regions Z21, Z22, Z23, Z3, and Z4, adjacent regions were merged to mitigate potential inaccuracies in rainfall threshold calculations caused by insufficient data. Specifically, Z21 and Z22 were combined; Z23, Z24, and Z3 were combined; and Z25 and Z4 were combined. The final regional subdivision is illustrated in Fig. 3a. For dry season landslides, due to relatively uniform rainfall and the small number of events, no further subdivision was performed, and the rainfall threshold was calculated for the entire study area.
4.1 Rainfall threshold model results
4.1.1 E–D rainfall threshold model
Rainfall-triggered landslides are rare and probabilistic events. Relying solely on the minimum threshold for geological hazard warnings can result in numerous ineffective warnings (i.e., false-positive error) (Sarkar et al., 2023). This not only diminishes public trust in disaster warning, but also leads to wasted resources on preventive and control activities, impeding progress in disaster prevention and mitigation. Consequently, most current studies on rainfall threshold models utilize various threshold curves with different landslide probabilities (Sheng et al., 2022) to enhance the reliability and accuracy of rainfall warnings. Typically, landslide probability refers to the proportion of landslides triggered by rainfall exceeding a specified threshold relative to the total number of landslides (Yang et al., 2020).
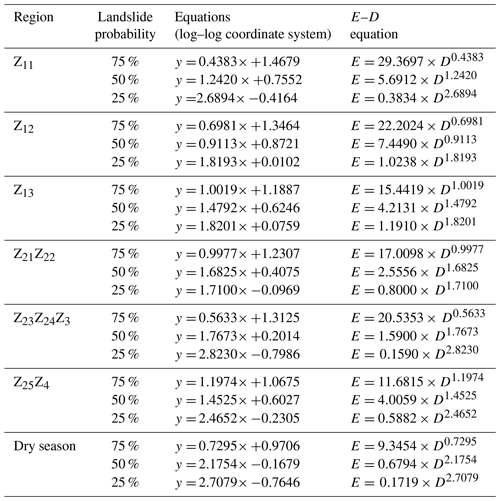
For OLS regression calculation, the E and D data from historical landslide hazard locations were initially plotted in the E–D log–log coordinate system. The 50 % landslide probability rainfall threshold curve was then derived by fitting these data using OLS regression. The fitted curves were subsequently employed to perform OLS regression analysis on historical landslide hazard points above and below these curves, resulting in the 75 % and 25 % landslide probability rainfall threshold curves (Fig. 4). Finally, the straight lines from the log–log coordinate system were converted into curves in the Cartesian coordinate system (Table 1).
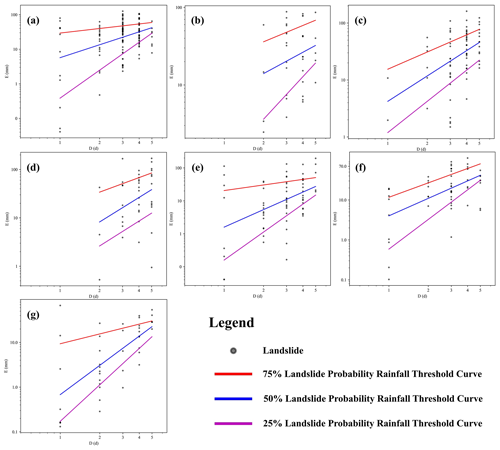
Figure 4E–D rainfall threshold model results plotted in the log–log coordinate system using OLS regression. In the figure, regions are labeled as follows: panel (a) represents the Z11 region, panel (b) represents the Z12 region, panel (c) represents the Z13 region, panel (d) represents the Z21Z22 region, panel (e) represents the Z23Z24Z3 region, panel (f) represents the Z25Z4 region, and panel (g) represents the dry season.
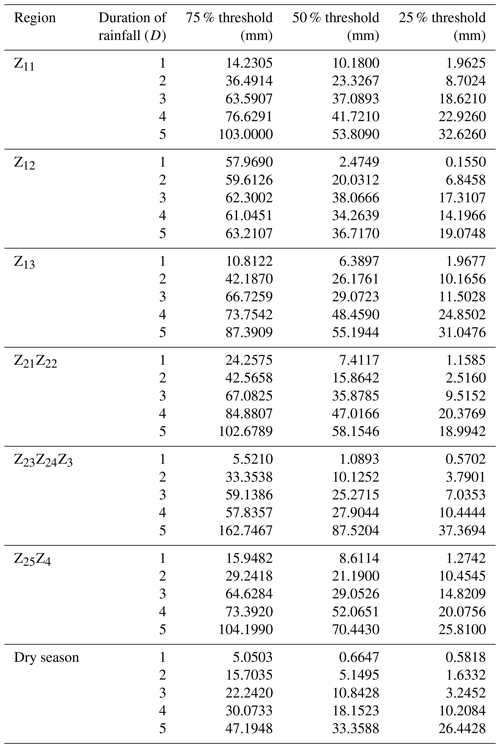
In the MLP regression analysis, the rainfall thresholds for a 50 % landslide probability were initially fitted separately for each duration of rainfall (D). MLP regression was then applied to historical landslide data above and below these thresholds to determine the rainfall thresholds for 75 % and 25 % landslide probabilities for each D. Limited historical landslide data for a D of 1 in some regions (e.g., Z12) and insufficient data for a D of 5 in other regions (e.g., Z11) may lead to inaccuracies in the fitted rainfall thresholds. To address this issue, Gaussian regression (Kumar and Kavitha, 2021) and the GM(1,1) gray prediction model (Chen and Huang, 2013) were employed to correct the rainfall thresholds derived from MLP regression. The corrected results are shown in Fig. 5 and Table 2.
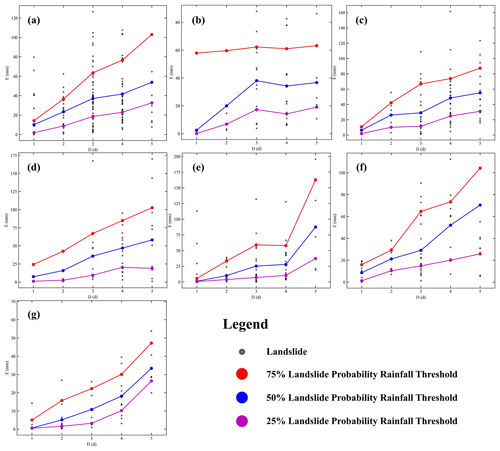
Figure 5E–D rainfall threshold model results plotted using MLP regression. In the figure, regions are labeled as follows: panel (a) represents the Z11 region, panel (b) represents the Z12 region, panel (c) represents the Z13 region, panel (d) represents the Z21Z22 region, panel (e) represents the Z23Z24Z3 region, panel (f) represents the Z25Z4 region, and panel (g) represents the dry season. The red, blue, and purple points denote rainfall threshold values fitted for various landslide probabilities. Line segments are included solely for visual clarity and do not convey any practical information.
The threshold curves derived from OLS regression in the log–log coordinate system typically display an upward trend, as illustrated in Fig. 4, with the slopes of the rainfall threshold curves for 25 %, 50 %, and 75 % landslide probabilities decreasing progressively. As shown in Fig. 5, the rainfall thresholds obtained from MLP regression for various landslide probabilities generally exhibit an increasing trend. However, the limited historical landslide data in some subregions leads to less accurate rainfall thresholds (e.g., the rainfall threshold for the Z23Z24Z3 region shows a large increase when D is 5).
4.1.2 E–D–R rainfall threshold model
Building on the E–D rainfall threshold model, the third-dimension indicator R was incorporated to develop the E–D–R rainfall threshold model. In this model, the value of R is set to the rainfall threshold corresponding to a duration of D equal to 1 in the E–D rainfall threshold model. These three indicators collectively form a closed “box” (Fig. 6), demonstrating nested relationships among different landslide probability levels.
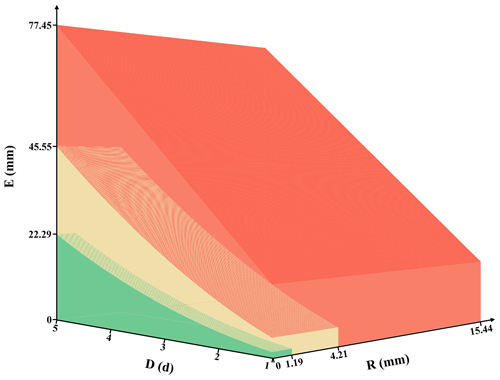
Figure 6Schematic diagram of the E–D–R rainfall threshold model illustrated using the OLS regression results from the Z13 region as an example. The green, yellow, and red boxes in the figure represent landslide probabilities corresponding to rainfall thresholds of < 25 %, 25 %–50%, and 50 %–75 %, respectively.
4.1.3 Model accuracy verification
The accuracy of the model was evaluated using 82 landslide hazard events from 2019 and 2020 that were not included in the rainfall threshold model calculations. Figure 7 shows the distribution of landslide hazard events across different regions.
In practical landslide prevention, real-time future rainfall data are unavailable and must be substituted with forecasted rainfall. To enhance the realism of the validation data for the rainfall threshold model, this study used numerous rainfall forecast stations within the study area to gather forecasted rainfall amounts for the 82 landslide events on the day of occurrence and for the 5 d prior. Notably, the rainfall forecast stations used here were established later and differ from the rainfall stations used in the landslide cataloguing (Fig. 2, Rainfall Station). These forecast stations, covering the entire study area at 0.05° intervals, provide real-time updates on forecasted rainfall.
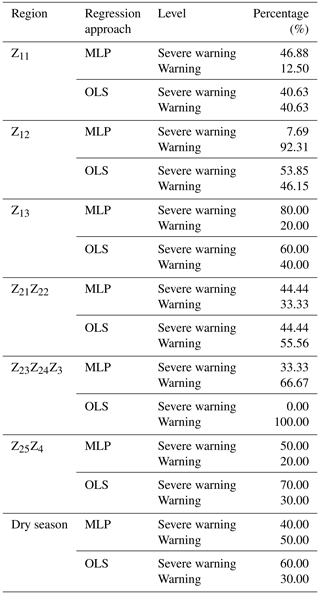
The study area was classified into four warning categories based on the rainfall threshold results: “attention” (< 25 %), “special attention” (25 %–50 %), “warning” (50 %–75 %), and “severe warning” (≥ 75 %). Figure 8 presents the results of the validation process for each region's rainfall threshold model categories. Additionally, Table 3 shows the proportion of hazardous situations corresponding to the severe warning and warning levels in the E–D–R rainfall threshold model validation results.
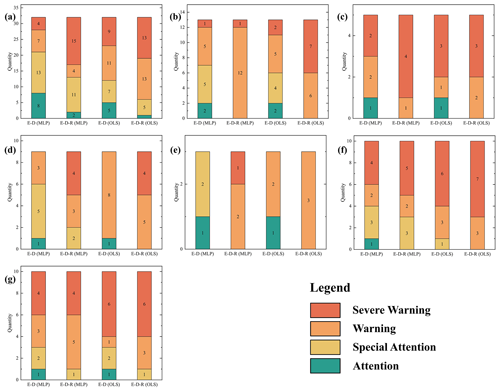
Figure 8Distribution of warning levels in the validation set for each partitioned region. Regions are labeled as follows: panel (a) represents the Z11 region, panel (b) represents the Z12 region, panel (c) represents the Z13 region, panel (d) represents the Z21Z22 region, panel (e) represents the Z23Z24Z3 region, panel (f) represents the Z25Z4 region, and panel (g) represents the dry season.
Table 3Proportion of hazard events corresponding to the severe warning and warning levels in the E–D–R rainfall threshold model for each partitioned region.
The following conclusions can be drawn from analyzing the prediction accuracy of the four categories of rainfall threshold models.
-
The accuracy of the E–D–R rainfall threshold model, as computed using both MLP regression and OLS regression, significantly surpasses that of the comparable E–D rainfall threshold model. With the inclusion of the R indicator in the third dimension, the E–D–R rainfall threshold model's predictions no longer include the attention warning level for all areas (except Z11). Moreover, there has been an increase in the percentage of hazard incidents classified under the warning and severe warning categories across all regions. Compared to the E–D model, the proportion of hazardous conditions categorized as warning and severe warning in the E–D–R rainfall threshold model increased from 41.46 % to 76.82 %, while the proportion for OLS regression rose from 69.51 % to 91.46 %.
-
Although the prediction accuracies of the E–D–R rainfall threshold model vary slightly between MLP regression and OLS regression for each region, the overall proportion of hazardous conditions in the warning and severe warning levels remains similar.
-
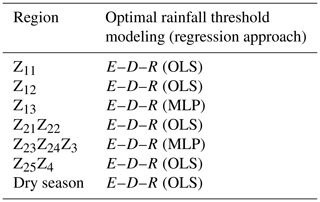
Table 4 presents the optimal rainfall threshold model for each region. The E–D–R models obtained from MLP regression are identified as the optimal models for the Z13 and Z23Z24Z3 regions, demonstrating the feasibility of utilizing neural networks (MLP) for rainfall threshold model research.
4.2 Landslide susceptibility results
4.2.1 Landslide-inducing factor selection
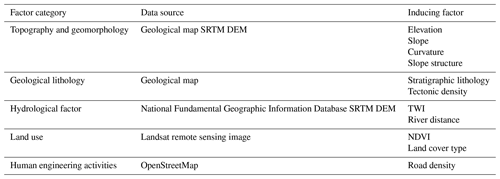
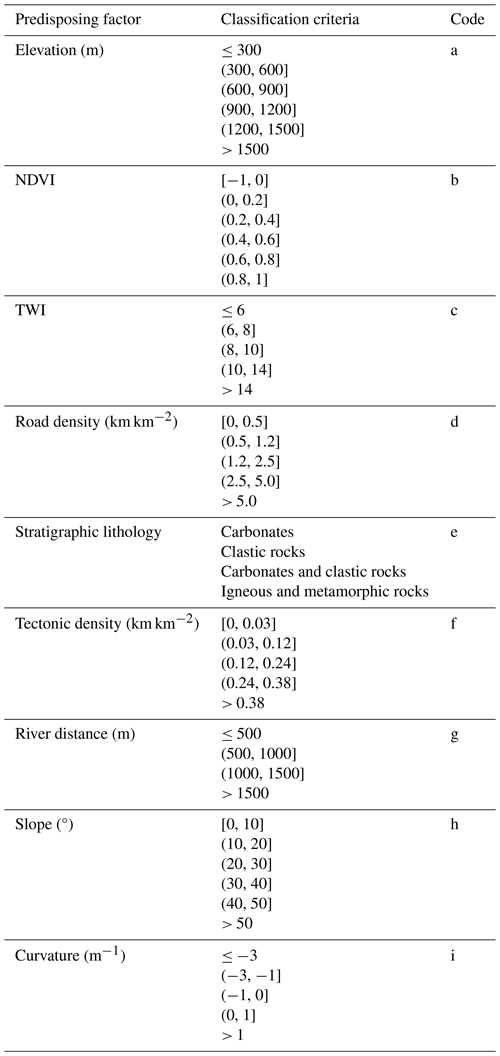
Based on the research findings of previous scholars (Habumugisha et al., 2022; Rohan et al., 2023; Chen et al., 2020; Li et al., 2022; Chen et al., 2021; Li et al., 2020) and considering the specific conditions of the study area, this study selected a total of 11 factors that potentially induce landslides. These factors include elevation, the normalized difference vegetation index (NDVI), the topographic wetness index (TWI), road density, stratigraphic lithology, tectonic density, river distance, slope, curvature, land cover, and slope structure (Table 5).
Among these factors, slope structure refers to the relationship between the slope aspect of the inclination of the rock formation (Niu et al., 2014). Different types of slope structures can result in variations in landslide size and intensity. Based on the slope gradient (σ), slope direction (γ), and inclination (α) and tendency (β) of the rock formation, slope structures are classified into the following eight types (Table 6).
Table 6Classification of slope structure types and their respective percentages within the study area.
Stratigraphic lithology data were obtained by vectorizing and classifying geological maps at a 1:200 000 scale. Each lithology is associated with distinct pedogenic environments, leading to variations in composition and stability, which in turn influence landslide occurrence (Cobos-Mora et al., 2023). In this study, the area was classified into four lithological categories: carbonate, clastic, carbonate and clastic, and igneous and metamorphic rocks. Furthermore, in large study areas where tectonic features are highly intertwined, the distance to tectonic structures becomes less relevant as a correlating factor; instead, tectonic density should be considered (Wang et al., 2014).
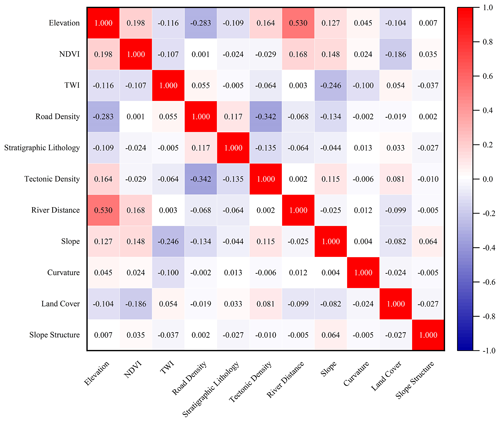
To ensure the rational selection of landslide-inducing factors, Pearson correlation analysis was employed to examine the degree of correlation among the selected factors (Zhang et al., 2022) (Fig. 9). The correlation coefficient ranges from −1 to 1, where values closer to 1 or −1 indicate a stronger correlation between the variables, and values closer to 0 indicate a weaker correlation (Cao et al., 2023).
As shown in Fig. 9, the correlation coefficients between most inducing factors are low, with the exception of a somewhat higher correlation between elevation and river distance (0.53). Elevation and river distance are both critical factors in landslide occurrence, and elevation is fundamental to landslide susceptibility assessment (Z. Y. Wang et al., 2022), affecting the distribution of submerged layers and the intensity of human activities, while river erosion can destabilize slopes by undercutting the base and softening rock and soil masses (Selamat et al., 2022). Therefore, this study retains elevation and river distance as two factors in the landslide sensitivity assessment. Ultimately, 11 inducing factors were selected for landslide susceptibility assessment in the study area.
4.2.2 Grading of landslide susceptibility factors
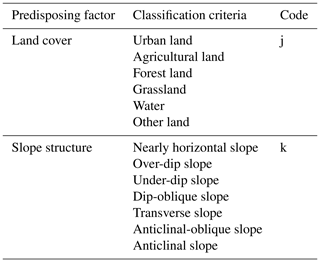
Considering the specific conditions of the study area and insights from previous research, the classification of each landslide predisposing factor, along with the corresponding result map, is presented in Table 7 and Fig. 10. The landslide susceptibility evaluation was conducted using raster cells with dimensions of 30 m × 30 m. It is important to emphasize that the historical landslide data used for susceptibility prediction encompass all 6888 recorded landslide events, not just the 453 events filtered for inclusion in the rainfall threshold model calculations.
4.2.3 Landslide susceptibility evaluation results
In this study, three models, CNN-3D, RF, and SVM, were employed to evaluate the landslide susceptibility of the study area. The optimal landslide susceptibility results obtained from these models were then selected for subsequent daily landslide hazard warnings. The relevant performance metrics from the training of the three models are presented in Table 8.
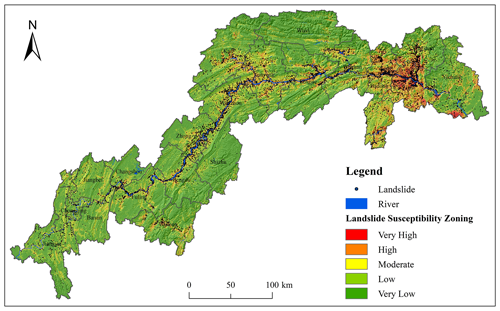
Table 8 indicates that the AUC values for the CNN-3D, RF, and SVM models are 0.96, 0.82, and 0.83, respectively. These AUC values demonstrate that all three models effectively predict the probability of landslide occurrence in the study area, with the CNN-3D model exhibiting superior predictive accuracy compared to the RF and SVM models. Furthermore, the CNN-3D model outperforms the RF and SVM models across the other four metrics. Consequently, the landslide susceptibility results from the CNN-3D model were classified into five categories using the natural breaks method (Fig. 11) and were subsequently utilized for daily landslide hazard warnings.
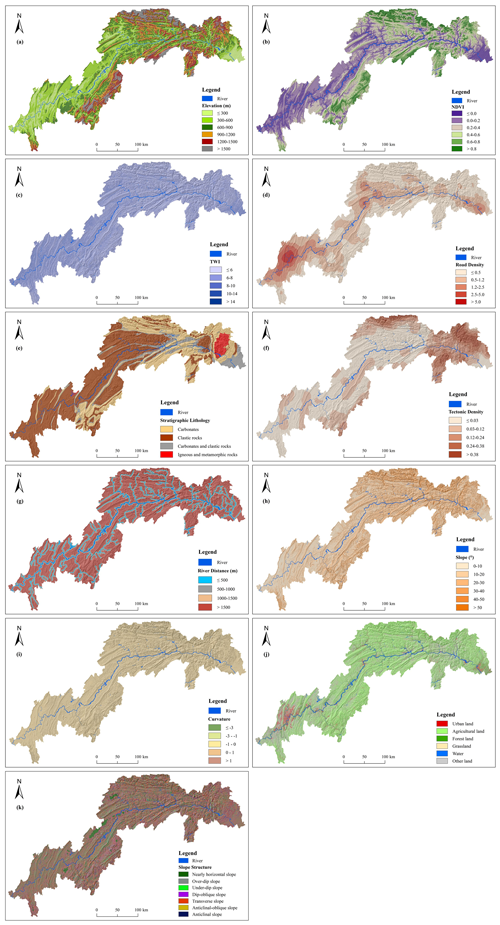
Figure 10Grading results for landslide-inducing factors. (a) Elevation; (b) NDVI; (c) TWI; (d) road density; (e) stratigraphic lithology; (f) tectonic density; (g) river distance; (h) slope; (i) curvature; (j) land cover; (k) slope structure.
Overall, areas of high landslide susceptibility in the study region are predominantly located along riverbanks and in the central and eastern sections. Within the district and county boundaries, high-susceptibility areas are primarily concentrated in Zigui, the northern part of Badong, the southern part of Xingshan, the central part of Fengjie, the central part of Wanzhou, and the southeastern part of Zhongxian.
4.3 Landslide hazard warning
4.3.1 Landslide hazard results for each rainfall warning level
In this study, a superposition matrix (Table 9) was created to integrate the daily rainfall warning level with the landslide susceptibility results, thereby generating daily landslide hazard warnings.
Table 9Superposition matrix of landslide susceptibility and rainfall warning levels. In the table, the numerical codes represent the following zones: 1, relatively stable zone; 2, general prevention zone; 3, secondary prevention zone; and 4, priority prevention zone.

Based on the landslide susceptibility results depicted in Fig. 11 and utilizing the superposition matrix from Table 9, the landslide hazard warning outcomes corresponding to each rainfall level were determined (Fig. 12).
4.3.2 Daily landslide hazard warning
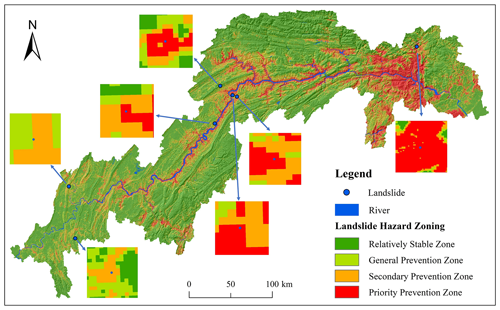
In 2020, continuous rainfall not only caused the Yangtze River to experience the most severe basin-wide flood since 1998, but also triggered multiple landslides, with rainfall reaching its peak on 19 July. Thus, 19 July 2020 was selected as a case study for landslide hazard warning and validation (Fig. 13). Using the superposition matrix in Table 9, Fig. 13d was overlaid on Fig. 12 to derive the landslide hazard warning results for 19 July 2020 (Fig. 14).
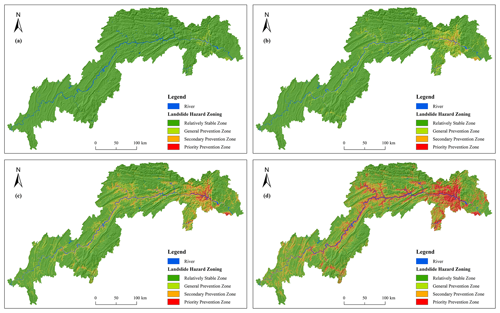
Figure 12Landslide hazard maps for each rainfall warning level. (a) Attention level hazard; (b) special attention level hazard; (c) warning level hazard; (d) severe warning level hazard.
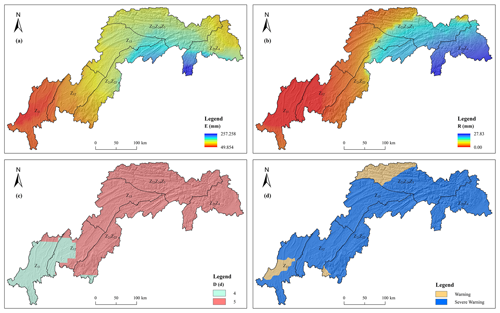
Figure 13Various rainfall parameters and rainfall warning levels for 19 July 2020. (a) Effective rainfall interpolated by Kriging; (b) daily rainfall interpolated by Kriging; (c) duration of rainfall estimated using Thiessen polygons; (d) rainfall warning levels calculated using the optimal rainfall threshold model.
On 19 July 2020, seven landslide hazards were identified, as depicted in Fig. 14. Of these, five were classified within the priority prevention zone and two within the secondary prevention zone, which confirms the accuracy of both the landslide hazard warning results and the rainfall threshold model.
5.1 Discussion of the rainfall threshold model
To identify the most effective rainfall thresholds in the study area, this study employs two regression methods, OLS and MLP, alongside two rainfall threshold models, E–D and E–D–R. Regardless of the regression method used, the results reveal that the E–D–R model exhibits superior warning accuracy compared to the E–D model. Additionally, the optimal rainfall threshold models for the Z13 and Z23Z24Z3 areas are the E–D–R models derived from the MLP regression, demonstrating the viability of neural networks (MLP) in rainfall threshold modeling. However, given that the data set in this study is relatively small (comprising only 453 landslides) and simple (involving only three variables), it may not fully capture the advantages of neural networks for rainfall threshold modeling. Nevertheless, we consider this a valuable effort. Future studies could incorporate additional variables, such as peak rainfall and rainfall intensity, and applying neural networks is likely to enhance the accuracy of rainfall warning models.
To explore the reasons for the E–D–R model's superior warning accuracy, this study examines area Z12 as a case study and illustrates points where the rainfall warning level has been modified (i.e., landslides with increased warning levels) in the R–E plane view (Fig. 15).
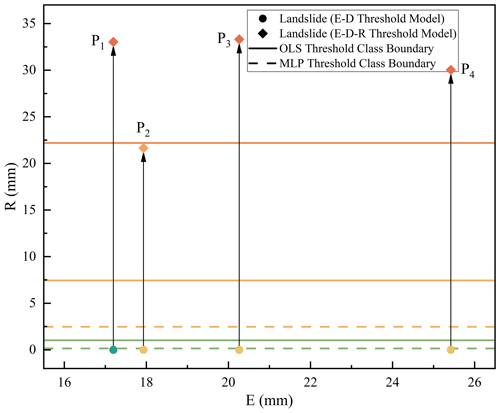
Figure 15Transition process of rainfall warning levels in the Z12 region. The green line indicates the boundary between the special attention and attention levels, the yellow line denotes the boundary between the warning and special attention levels, and the orange line marks the boundary between the severe warning and warning levels.
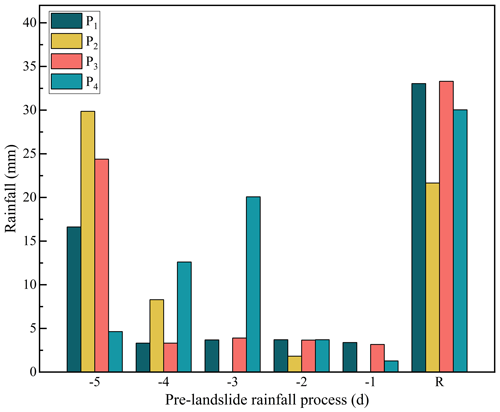
The chart illustrates that the inclusion of the R indication significantly elevated the rainfall warning level for the four landslides. In the E–D model, P1 was classified as attention, while the other three landslides were categorized as special attention. However, in the E–D–R model with OLS regression, the warning level of P2 was upgraded to warning, and the warning levels of the remaining three landslides were elevated to severe warning. Similarly, all four landslides were classified as warning in the E–D–R model using the MLP regression. The transitions in rainfall warning levels for these landslides directly contributed to the improved accuracy of the E–D–R model in the Z12 region.
An in-depth analysis of the rainfall processes for these four landslides prior to their occurrence (Fig. 16) reveals that they experienced relatively low rainfall in the 4 d leading up to the landslide, resulting in a lower E value, but substantial rainfall on the day of the landslide. These characteristics resulted in higher warning accuracy for these four landslides within the E–D–R rainfall threshold model, suggesting that the R indicator has notable sensitivity to landslides triggered by heavy rainfall.
5.2 Discussion of daily landslide hazard warning
In this study, RF, SVM, and CNN-3D models were used to predict landslide susceptibility in the Three Gorges Reservoir area. A comparative analysis revealed that the CNN-3D model offers superior predictive accuracy for landslide susceptibility within the study area. Further examination of the CNN-3D model's results shows that the regions with high landslide susceptibility are predominantly located in areas with sparse vegetation, with fragile stratigraphic lithology, close to rivers, and with active human engineering activities, which is similar to the results reported by X. N. Wang et al. (2022).
Regarding daily landslide hazard warnings, rainfall warning levels were calculated using the optimal rainfall threshold model for each subdistrict based on forecast rainfall data from rainfall stations. The daily landslide hazard warning results were then generated by employing a superposition matrix to integrate the rainfall warning levels with the landslide susceptibility results. On 19 July 2020, all seven identified landslide hazards were confirmed to be within the priority and secondary prevention zones. This indicates that the landslide hazard warning results derived from the rainfall threshold model are highly accurate and significantly contribute to effective landslide disaster prevention and control. Moreover, the process of translating landslide susceptibility results into hazard warnings through the rainfall warning levels and superposition matrix serves as a refinement mechanism. This correction reduces the areas requiring focused prevention and attention, thereby optimizing the allocation of resources for landslide management.
It is also important to note that the spatial probability of landslide occurrence may vary between dry and rainy seasons, and the influence of different landslide-inducing factors may change under varying climatic conditions. This study primarily focused on the differences in rainfall thresholds across various climatic and topographic conditions, while the variations in spatial probability of landslide occurrence were not extensively explored. Additionally, changes in reservoir water levels and groundwater fluctuations in the Three Gorges Reservoir area are significant factors influencing landslide occurrence; however, these factors were not included in this study due to data limitations.
5.3 Practical application of the rainfall threshold model and daily landslide hazard warning
In the practical prevention and control of landslide hazards, cost considerations are inevitable (C. Wang et al., 2023). To maximize the protection of lives and property within a constrained budget, it is essential to prioritize and refine the areas that require focused attention, while maintaining the accuracy of landslide hazard warning results.
The E–D–R rainfall threshold model, by incorporating the benefits of the E–D model, enhances sensitivity to landslides induced by heavy rainfall on the same day and achieves higher warning accuracy. Concurrently, the CNN-3D model, which effectively integrates spatial information around each raster point, provides more accurate landslide susceptibility predictions compared to the RF and SVM models. Thus, both the E–D–R rainfall threshold model and the CNN-3D model hold significant potential for application and development in landslide warning and prevention. The combination of these models' results through superposition can ensure high accuracy in landslide hazard warnings while also narrowing the focus areas using the rainfall warning levels derived from the rainfall threshold model. This approach helps meet the demands of effective landslide disaster prevention and control.
Nevertheless, despite the high accuracy of the E–D–R rainfall threshold model and the CNN-3D model, certain uncertainties persist. For the rainfall threshold model, (1) rainfall stations provide localized data, and there may be inaccuracies when extending these data to the entire study area using interpolation or Thiessen polygon methods. (2) Historical landslide data significantly influence the results of the rainfall threshold model; insufficient data or extreme rainfall conditions can lead to uncertainties in the final rainfall warning levels. (3) Although this study analyzed 10 regions across both dry and rainy seasons, the broad regional scope introduces uncertainty in rainfall thresholds due to varying topographic and geomorphological conditions. For the CNN-3D model, uncertainties may arise from the selection of landslide-inducing factors, the size of the evaluation unit, and the division ratio of the training and test set.
Therefore, in practical landslide prevention and control applications, it is crucial to tailor the predisposing factors and evaluation units to the specific local context to ensure the accuracy of the landslide susceptibility results (Zhang et al., 2023). Simultaneously, constructing a comprehensive historical landslide database is recommended. This database should be updated with new landslide events and corresponding rainfall data to recalibrate the area's rainfall threshold and refine the rainfall warning levels. As the historical landslide data accumulate, the uncertainty in the rainfall threshold model is expected to decrease, leading to more precise rainfall thresholds. With a sufficiently rich historical data set, further regional subdivision may enhance rainfall warning accuracy. Ultimately, this approach will improve the precision of landslide hazard warnings and provide valuable technical support for vulnerability assessment and disaster preventive and mitigation efforts.
Landslide disaster warning is a critical tool for the prevention and management of landslides. To enhance the accuracy of landslide warning, this study employed two regression methods – MLP and OLS – and two rainfall threshold models – E–D and E–D–R. The study area was divided into two seasons, dry and rainy, as well as several subdistricts based on topography and rainfall patterns, to identify the optimal rainfall threshold model for the region and determine the daily rainfall warning levels. Additionally, 11 inducing factors were selected to assess landslide susceptibility in the study area using three models: RF, SVM, and CNN-3D. The final step involved integrating the rainfall warning levels with the landslide susceptibility results using a superposition matrix to produce daily landslide hazard warnings for the Three Gorges Reservoir area.
The results indicate that the E–D–R rainfall threshold model exhibits superior sensitivity to landslides triggered by heavy rainfall, resulting in higher rainfall warning accuracy compared to the E–D model when either regression method is applied. Specifically, for subdistricts Z11, Z12, Z21Z22, Z25Z4, and dry season, the optimal rainfall threshold model is the E–D–R model derived from OLS regression. Conversely, for subdistricts Z13 and Z23Z24Z3, the optimal model is the E–D–R threshold obtained through MLP regression. Regarding landslide susceptibility, the CNN-3D model achieved an AUC of 0.96 and an accuracy of 0.9003, outperforming the RF and SVM models in prediction accuracy.
Daily landslide hazard warnings were calculated by combining the daily rainfall warning levels with the landslide susceptibility results. The accuracy of these warnings was validated using data from the landslide event on 19 July 2020. Of the seven landslides on that date, five occurred in the priority prevention zone and two in the secondary prevention zone, confirming the reliability of the landslide hazard warning results and the effectiveness of the rainfall threshold model.
The integration of rainfall warning levels with landslide susceptibility results provides actionable guidance for local landslide disaster prevention and control efforts. Moreover, the introduction of MLP into the regression analysis of rainfall thresholds in this study contributes to the development of rainfall threshold models and offers a valuable approach for broader application.
The data and code can be accessed at https://doi.org/10.5281/zenodo.11311851 (Peng, 2024).
BP: writing (original draft), writing (review and editing), data curation, formal analysis, and validation. XW: writing (review and editing), funding acquisition, conceptualization, and methodology.
The contact author has declared that none of the authors has any competing interests.
Publisher's note: Copernicus Publications remains neutral with regard to jurisdictional claims made in the text, published maps, institutional affiliations, or any other geographical representation in this paper. While Copernicus Publications makes every effort to include appropriate place names, the final responsibility lies with the authors.
This research has been supported by the National Natural Science Foundation of China (grant no. 42071429).
This paper was edited by Dan Li and reviewed by two anonymous referees.
Abraham, M. T., Pothuraju, D., and Satyam, N.: Rainfall Thresholds for Prediction of Landslides in Idukki, India: An Empirical Approach, Water, 11, 2113, https://doi.org/10.3390/w11102113, 2019.
Abraham, M. T., Satyam, N., Pradhan, B., and Alamri, A. M.: Forecasting of Landslides Using Rainfall Severity and Soil Wetness: A Probabilistic Approach for Darjeeling Himalayas, Water, 12, 804, https://doi.org/10.3390/w12030804, 2020a.
Abraham, M. T., Satyam, N., Kushal, S., Rosi, A., Pradhan, B., and Segoni, S.: Rainfall Threshold Estimation and Landslide Forecasting for Kalimpong, India Using SIGMA Model, Water, 12, 1195, https://doi.org/10.3390/w12041195, 2020b.
Aksha, S. K., Resler, L. M., Juran, L., and Carstensen, L. W.: A geospatial analysis of multi-hazard risk in Dharan, Nepal, Geomat. Nat. Haz. Risk, 11, 88–111, https://doi.org/10.1080/19475705.2019.1710580, 2020.
Baharvand, S., Rahnamarad, J., Soori, S., and Saadatkhah, N.: Landslide susceptibility zoning in a catchment of Zagros Mountains using fuzzy logic and GIS, Environ. Earth Sci., 79, 204, https://doi.org/10.1007/s12665-020-08957-w, 2020.
Barcenas, O. U. E., Pioquinto, J. G. Q., Kurkina, E., and Lukyanov, O.: Surrogate Aerodynamic Wing Modeling Based on a Multilayer Perceptron, Aerospace, 10, 149, https://doi.org/10.3390/aerospace10020149, 2023.
Budimir, M. E. A., Atkinson, P. M., and Lewis, H. G.: A systematic review of landslide probability mapping using logistic regression, Landslides, 12, 419–436, https://doi.org/10.1007/s10346-014-0550-5, 2015.
Cao, J. S., Qin, S. W., Yao, J. Y., Zhang, C. B., Liu, G. D., Zhao, Y. Y., and Zhang, R. C.: Debris flow susceptibility assessment based on information value and machine learning coupling method: from the perspective of sustainable development, Environ. Sci. Pollut. R., 30, 87500–87516, https://doi.org/10.1007/s11356-023-28575-w, 2023.
Chan, H. C., Chen, P. A., and Lee, J. T.: Rainfall-Induced Landslide Susceptibility Using a Rainfall-Runoff Model and Logistic Regression, Water, 10, 1354, https://doi.org/10.3390/w10101354, 2018.
Chang, Z. L., Huang, F. M., Huang, J. S., Jiang, S. H., Liu, Y. T., Meena, S. R., and Catani, F.: An updating of landslide susceptibility prediction from the perspective of space and time, Geosci. Front., 14, 101619, https://doi.org/10.1016/j.gsf.2023.101619, 2023.
Chen, C. I. and Huang, S. J.: The necessary and sufficient condition for GM(1,1) grey prediction model, Appl. Math. Comput., 219, 6152–6162, https://doi.org/10.1016/j.amc.2012.12.015, 2013.
Chen, L. F., Guo, H. X., Gong, P. S., Yang, Y. Y., Zuo, Z. L., and Gu, M. Y.: Landslide susceptibility assessment using weights-of-evidence model and cluster analysis along the highways in the Hubei section of the Three Gorges Reservoir Area, Comput. Geosci., 156, 104899, https://doi.org/10.1016/j.cageo.2021.104899, 2021.
Chen, T., Zhu, L., Niu, R. Q., Trinder, C. J., Peng, L., and Lei, T.: Mapping landslide susceptibility at the Three Gorges Reservoir, China, using gradient boosting decision tree, random forest and information value models, J. Mt. Sci., 17, 670–685, https://doi.org/10.1007/s11629-019-5839-3, 2020.
Chen, W., Peng, J. B., Hong, H. Y., Shahabi, H., Pradhan, B., Liu, J. Z., Zhu, A. X., Pei, X. J., and Duan, Z.: Landslide susceptibility modelling using GIS-based machine learning techniques for Chongren County, Jiangxi Province, China, Sci. Total Environ., 626, 1121–1135, https://doi.org/10.1016/j.scitotenv.2018.01.124, 2018.
Chen, W. T., Li, X. J., Wang, Y. X., Chen, G., and Liu, S. W.: Forested landslide detection using LiDAR data and the random forest algorithm: A case study of the Three Gorges, China, Remote Sens. Environ., 152, 291–301, https://doi.org/10.1016/j.rse.2014.07.004, 2014.
Cheng, J. Y., Dai, X. A., Wang, Z. K., Li, J. Z., Qu, G., Li, W. L., She, J. X., and Wang, Y. L.: Landslide Susceptibility Assessment Model Construction Using Typical Machine Learning for the Three Gorges Reservoir Area in China, Remote Sens., 14, 2257, https://doi.org/10.3390/rs14092257, 2022.
Chung, M. C., Tan, C. H., and Chen, C. H.: Local rainfall thresholds for forecasting landslide occurrence: Taipingshan landslide triggered by Typhoon Saola, Landslides, 14, 19–33, https://doi.org/10.1007/s10346-016-0698-2, 2017.
Ciurleo, M., Mandaglio, M. C., and Moraci, N.: Landslide susceptibility assessment by TRIGRS in a frequently affected shallow instability area, Landslides, 16, 175-188, https://doi.org/10.1007/s10346-018-1072-3, 2019.
Cobos-Mora, S. L., Rodriguez-Galiano, V., and Lima, A.: Analysis of landslide explicative factors and susceptibility mapping in an andean context: The case of Azuay province (Ecuador), Heliyon, 9, e20170, https://doi.org/10.1016/j.heliyon.2023.e20170, 2023.
Dahal, R. K. and Hasegawa, S.: Representative rainfall thresholds for landslides in the Nepal Himalaya, Geomorphology, 100, 429–443, https://doi.org/10.1016/j.geomorph.2008.01.014, 2008.
Fan, X. L., Feng, X. F., Dong, Y. Y., and Hou, H. C.: COVID-19 CT image recognition algorithm based on transformer and CNN, Displays, 72, 102150, https://doi.org/10.1016/j.displa.2022.102150, 2022.
Gariano, S. L., Supplizi, G. V., Ardizzone, F., Salvati, P., Bianchi, C., Morbidelli, R., and Saltalippi, C.: Long-term analysis of rainfall-induced landslides in Umbria, central Italy, Nat. Hazards, 106, 2207–2225, https://doi.org/10.1007/s11069-021-04539-6, 2021.
Gill, H. S., Khalaf, O. I., Alotaibi, Y., Alghamdi, S., and Alassery, F.: Multi-Model CNN-RNN-LSTM Based Fruit Recognition and Classification, Intell. Autom. Soft Co., 33, 637–650, https://doi.org/10.32604/iasc.2022.022589, 2022.
Guo, B., Pei, X. J., Xu, M., and Li, T. T.: Analyzing Rainfall Threshold for Shallow Landslides Using Physically Based Modeling in Rasuwa District, Nepal, Water, 14, 4074, https://doi.org/10.3390/w14244074, 2022.
Guo, Z. Z., Shi, Y., Huang, F. M., Fan, X. M., and Huang, J. S.: Landslide susceptibility zonation method based on C5.0 decision tree and K-means cluster algorithms to improve the efficiency of risk management, Geosci. Front., 12, 101249, https://doi.org/10.1016/j.gsf.2021.101249, 2021.
Habumugisha, J. M., Chen, N. S., Rahman, M., Islam, M. M., Ahmad, H., Elbeltagi, A., Sharma, G., Liza, S. N., and Dewan, A.: Landslide Susceptibility Mapping with Deep Learning Algorithms, Sustainability, 14, 1734, https://doi.org/10.3390/su14031734, 2022.
Hasan, M. M., Nilay, M. S. M., Jibon, N. H., and Rahman, R. M.: LULC changes to riverine flooding: A case study on the Jamuna River, Bangladesh using the multilayer perceptron model, Results Eng., 18, 101079, https://doi.org/10.1016/j.rineng.2023.101079, 2023.
He, Q. F., Shahabi, H., Shirzadi, A., Li, S. J., Chen, W., Wang, N. Q., Chai, H. C., Bian, H. Y., Ma, J. Q., Chen, Y. T., Wang, X. J., Chapi, K., and Bin Ahmad, B.: Landslide spatial modelling using novel bivariate statistical based Naive Bayes, RBF Classifier, and RBF Network machine learning algorithms, Sci. Total Environ., 663, 1–15, https://doi.org/10.1016/j.scitotenv.2019.01.329, 2019.
He, S. S., Wang, J., and Liu, S. N.: Rainfall Event-Duration Thresholds for Landslide Occurrences in China, Water, 12, 494, https://doi.org/10.3390/w12020494, 2020.
Hoffman, S. and Jasinski, R.: The Use of Multilayer Perceptrons to Model PM2.5 Concentrations at Air Monitoring Stations in Poland, Atmosphere, 14, 96, https://doi.org/10.3390/atmos14010096, 2023.
Huang, F. M., Cao, Z. S., Jiang, S. H., Zhou, C. B., Huang, J. S., and Guo, Z. Z.: Landslide susceptibility prediction based on a semi-supervised multiple-layer perceptron model, Landslides, 17, 2919–2930, https://doi.org/10.1007/s10346-020-01473-9, 2020.
Huang, F. M., Chen, J. W., Liu, W. P., Huang, J. S., Hong, H. Y., and Chen, W.: Regional rainfall-induced landslide hazard warning based on landslide susceptibility mapping and a critical rainfall threshold, Geomorphology, 408, 108236, https://doi.org/10.1016/j.geomorph.2022.108236, 2022a.
Huang, F. M., Yan, J., Fan, X. M., Yao, C., Huang, J. S., Chen, W., and Hong, H. Y.: Uncertainty pattern in landslide susceptibility prediction modelling: Effects of different landslide boundaries and spatial shape expressions, Geosci. Front., 13, 101317, https://doi.org/10.1016/j.gsf.2021.101317, 2022b.
Huang, F. M., Teng, Z. K., Yao, C., Jiang, S. H., Catani, F., Chen, W., and Huang, J. S.: Uncertainties of landslide susceptibility prediction: Influences of random errors in landslide conditioning factors and errors reduction by low pass filter method, J. Rock Mech. Geotech. Eng., 16, 213–230, https://doi.org/10.1016/j.jrmge.2023.11.001, 2024.
Jiang, P., Zeng, Z. G., Chen, J. J., Tang, H. M., and Ieee: A PSOGSA method to optimize the T-S fuzzy neural network for displacement prediction of landslide, IEEE International Conference on Systems, Man, and Cybernetics (SMC), San Diego, CA, 5–8 October, WOS:000370963701057, 1216–1221, https://doi.org/10.1109/SMC.2014.6974080, 2014.
Jin, L., Li, Z. C., and Tang, J. H.: Deep Semantic Multimodal Hashing Network for Scalable Image-Text and Video-Text Retrievals, IEEE T. Neural Networ., 34, 1838–1851, https://doi.org/10.1109/tnnls.2020.2997020, 2023.
Kaliyar, R. K., Goswami, A., and Narang, P.: FakeBERT: Fake news detection in social media with a BERT-based deep learning approach, Multimed. Tools Appl., 80, 11765–11788, https://doi.org/10.1007/s11042-020-10183-2, 2021.
Kumar, P. C. M. and Kavitha, R.: Prediction of nanofluid viscosity using multilayer perceptron and Gaussian process regression, J. Therm. Anal. Calorim., 144, 1151–1160, https://doi.org/10.1007/s10973-020-09990-4, 2021.
Lee, M. L., Ng, K. Y., Huang, Y. F., and Li, W. C.: Rainfall-induced landslides in Hulu Kelang area, Malaysia, Nat. Hazards, 70, 353–375, https://doi.org/10.1007/s11069-013-0814-8, 2014.
Li, W. J., Fang, Z. C., and Wang, Y.: Stacking ensemble of deep learning methods for landslide susceptibility mapping in the Three Gorges Reservoir area, China, Stoch. Env. Res. Risk A., 36, 2207–2228, https://doi.org/10.1007/s00477-021-02032-x, 2022.
Li, Y. W., Wang, X. M., and Mao, H.: Influence of human activity on landslide susceptibility development in the Three Gorges area, Nat. Hazards, 104, 2115–2151, https://doi.org/10.1007/s11069-020-04264-6, 2020.
Lim, D. H., Na, W. J., Hong, W. H., and Bae, Y. H.: Development of a fire prediction model at the urban planning stage: Ordinary least squares regression analysis of the area of urban land use and fire damage data in South Korea, Fire Saf. J., 136, 103761, https://doi.org/10.1016/j.firesaf.2023.103761, 2023.
Liu, M. M., Liu, J. P., Xu, S. H., Chen, C., Bao, S., Wang, Z. L., and Du, J.: 3DCNN landslide susceptibility considering spatial-factor features, Front. Environ. Sci., 11, 12, https://doi.org/10.3389/fenvs.2023.1177891, 2023.
Liu, X., Yin, K., Xiao, C., Chen, L., Zeng, T., Li, Y., Liu, Z., Gong, Q., and Chen, W.: Meteorological early warning of landslide based on I-D-R threshold model, Earth Sci., 49, 1–15, 2022 (in Chinese).
Long, J. J., Liu, Y., Li, C. D., Fu, Z. Y., and Zhang, H. K.: A novel model for regional susceptibility mapping of rainfall-reservoir induced landslides in Jurassic slide-prone strata of western Hubei Province, Three Gorges Reservoir area, Stoch. Env. Res. Risk A., 35, 1403–1426, https://doi.org/10.1007/s00477-020-01892-z, 2021.
Marin, R. J.: Physically based and distributed rainfall intensity and duration thresholds for shallow landslides, Landslides, 17, 2907–2917, https://doi.org/10.1007/s10346-020-01481-9, 2020.
Marin, R. J., Garcia, E. F., and Aristizabal, E.: Effect of basin morphometric parameters on physically-based rainfall thresholds for shallow landslides, Eng. Geol., 278, 105855, https://doi.org/10.1016/j.enggeo.2020.105855, 2020.
Martinovic, K., Gavin, K., Reale, C., and Mangan, C.: Rainfall thresholds as a landslide indicator for engineered slopes on the Irish Rail network, Geomorphology, 306, 40–50, https://doi.org/10.1016/j.geomorph.2018.01.006, 2018.
Mathew, J., Babu, D. G., Kundu, S., Kumar, K. V., and Pant, C. C.: Integrating intensity-duration-based rainfall threshold and antecedent rainfall-based probability estimate towards generating early warning for rainfall-induced landslides in parts of the Garhwal Himalaya, India, Landslides, 11, 575–588, https://doi.org/10.1007/s10346-013-0408-2, 2014.
Mei, J. Q., Chen, W. Y., Li, B. Y., Li, S. X., Zhang, J., and Yan, J.: Adaptive fusion of multi-exposure images based on perceptron model, Appl. Math. Nonlinear Sci., 9, 1–14, https://doi.org/10.2478/amns.2023.1.00053, 2023.
Narimani, R., Jun, C. H. Y., De Michele, C., Gan, T. Y., Nezhad, S. M., and Byun, J.: Multilayer perceptron-based predictive model using wavelet transform for the reconstruction of missing rainfall data, Stoch. Env. Res. Risk A., 37, 2791–2802, https://doi.org/10.1007/s00477-023-02471-8, 2023.
Niu, R. Q., Wu, X. L., Yao, D. K., Peng, L., Ai, L., and Peng, J. H.: Susceptibility Assessment of Landslides Triggered by the Lushan Earthquake, April 20, 2013, China, IEEE J. Sel. Top. Appl., 7, 3979–3992, https://doi.org/10.1109/jstars.2014.2308553, 2014.
Peng, B.: Rainfall threshold data for landslides in the Three Gorges reservoir area, Zenodo [code and data set], https://doi.org/10.5281/zenodo.11311851, 2024.
Peruccacci, S., Brunetti, M. T., Gariano, S. L., Melillo, M., Rossi, M., and Guzzetti, F.: Rainfall thresholds for possible landslide occurrence in Italy, Geomorphology, 290, 39–57, https://doi.org/10.1016/j.geomorph.2017.03.031, 2017.
Pradhan, A. M. S., Kang, H. S., Lee, J. S., and Kim, Y. T.: An ensemble landslide hazard model incorporating rainfall threshold for Mt. Umyeon, South Korea, B. Eng. Geol. Environ., 78, 131–146, https://doi.org/10.1007/s10064-017-1055-y, 2019.
Rohan, T., Shelef, E., Mirus, B., and Coleman, T.: Prolonged influence of urbanization on landslide susceptibility, Landslides, 20, 1433–1447, https://doi.org/10.1007/s10346-023-02050-6, 2023.
Rossi, M., Luciani, S., Valigi, D., Kirschbaum, D., Brunetti, M. T., Peruccacci, S., and Guzzetti, F.: Statistical approaches for the definition of landslide rainfall thresholds and their uncertainty using rain gauge and satellite data, Geomorphology, 285, 16–27, https://doi.org/10.1016/j.geomorph.2017.02.001, 2017.
Salee, R., Chinkulkijniwat, A., Yubonchit, S., Horpibulsuk, S., Wangfaoklang, C., and Soisompong, S.: New threshold for landslide warning in the southern part of Thailand integrates cumulative rainfall with event rainfall depth-duration, Nat. Hazards, 113, 125–141, https://doi.org/10.1007/s11069-022-05292-0, 2022.
Sarkar, S., Chandna, P., Pandit, K., and Dahiya, N.: An event-duration based rainfall threshold model for landslide prediction in Uttarkashi region, North-West Himalayas, India, Int. J. Earth Sci., 17, 1923–1939, https://doi.org/10.1007/s00531-023-02337-y, 2023.
Segoni, S., Tofani, V., Rosi, A., Catani, F., and Casagli, N.: Combination of Rainfall Thresholds and Susceptibility Maps for Dynamic Landslide Hazard Assessment at Regional Scale, Front. Earth Sci., 6, 11, https://doi.org/10.3389/feart.2018.00085, 2018.
Selamat, S. N., Abd Majid, N., Taha, M. R., and Osman, A.: Landslide Susceptibility Model Using Artificial Neural Network (ANN) Approach in Langat River Basin, Selangor, Malaysia, Land, 11, 833, https://doi.org/10.3390/land11060833, 2022.
Sheng, Y. F., Li, Y. Y., Xu, G. L., and Li, Z. G.: Threshold assessment of rainfall-induced landslides in Sangzhi County: statistical analysis and physical model, B. Eng. Geol. Environ., 81, 388, https://doi.org/10.1007/s10064-022-02890-x, 2022.
Soralump, S., Shrestha, A., Thowiwat, W., Sukjaroen, R., Chaithong, T., Yangsanphu, S., Koirala, A., and Jotisankasa, A.: Assessment of landslide behaviour in colluvium deposit at Doi Chang, Thailand, Sci. Rep., 11, 22960, https://doi.org/10.1038/s41598-021-02363-3, 2021.
Teja, T. S., Dikshit, A., and Satyam, N.: Determination of Rainfall Thresholds for Landslide Prediction Using an Algorithm-Based Approach: Case Study in the Darjeeling Himalayas, India, Geosciences, 9, 302, https://doi.org/10.3390/geosciences9070302, 2019.
Wang, C., Wang, X. D., Zhang, H. Y., Meng, F. Q., and Li, X. L.: Assessment of environmental geological disaster susceptibility under a multimodel comparison to aid in the sustainable development of the regional economy, Environ. Sci. Pollut. R., 30, 6573–6591, https://doi.org/10.1007/s11356-022-22649-x, 2023.
Wang, X. B., Zhao, Y. Q., and Li, W. F.: Recognition of Commercial Vehicle Driving Cycles Based on Multilayer Perceptron Model, Sustainability, 15, 2644, https://doi.org/10.3390/su15032644, 2023.
Wang, X. L., Zhang, L. Q., Wang, S. J., and Lari, S.: Regional landslide susceptibility zoning with considering the aggregation of landslide points and the weights of factors, Landslides, 11, 399–409, https://doi.org/10.1007/s10346-013-0392-6, 2014.
Wang, X. N., Zhang, X. L., Bi, J., Zhang, X. D., Deng, S. Q., Liu, Z. W., Wang, L. Z., and Guo, H. X.: Landslide Susceptibility Evaluation Based on Potential Disaster Identification and Ensemble Learning, Int. J. Env. Res. Pub. He., 19, 14241, https://doi.org/10.3390/ijerph192114241, 2022.
Wang, Z. Y., Ma, C. M., Qiu, Y., Xiong, H. X., and Li, M. H.: Refined Zoning of Landslide Susceptibility: A Case Study in Enshi County, Hubei, China, Int. J. Env. Res. Pub. He., 19, 9412, https://doi.org/10.3390/ijerph19159412, 2022.
Wu, C. Y. and Yeh, Y. C.: A Landslide Probability Model Based on a Long-Term Landslide Inventory and Rainfall Factors, Water, 12, 937, https://doi.org/10.3390/w12040937, 2020.
Wu, Y. M., Lan, H. X., Gao, X., Li, L. P., and Yang, Z. H.: A simplified physically based coupled rainfall threshold model for triggering landslides, Eng. Geol., 195, 63–69, https://doi.org/10.1016/j.enggeo.2015.05.022, 2015.
Xia, P., Hu, X. L., Wu, S. S., Ying, C. Y., and Liu, C.: Slope Stability Analysis Based on Group Decision Theory and Fuzzy Comprehensive Evaluation, J. Earth Sci., 31, 1121–1132, https://doi.org/10.1007/s12583-020-1101-8, 2020.
Xing, X. F., Wu, C. L., Li, J. H., Li, X. Y., Zhang, L. M., and He, R. J.: Susceptibility assessment for rainfall-induced landslides using a revised logistic regression method, Nat. Hazards, 106, 97–117, https://doi.org/10.1007/s11069-020-04452-4, 2021.
Yang, H. J., Wei, F. Q., Ma, Z. F., Guo, H. Y., Su, P. C., and Zhang, S. J.: Rainfall threshold for landslide activity in Dazhou, southwest China, Landslides, 17, 61–77, https://doi.org/10.1007/s10346-019-01270-z, 2020.
Yang, Z. Q., Xu, C., Shao, X. Y., Ma, S. Y., and Li, L.: Landslide susceptibility mapping based on CNN-3D algorithm with attention module embedded, B. Eng. Geol. Environ., 81, 412, https://doi.org/10.1007/s10064-022-02889-4, 2022.
Youssef, A. M., Pradhan, B., Dikshit, A., Al-Katheri, M. M., Matar, S. S., and Mahdi, A. M.: Landslide susceptibility mapping using CNN-1D and 2D deep learning algorithms: comparison of their performance at Asir Region, KSA, B. Eng. Geol. Environ., 81, 165, https://doi.org/10.1007/s10064-022-02657-4, 2022.
Yu, L. B., Zhou, C., Wang, Y., Cao, Y., and Peres, D. J.: Coupling Data- and Knowledge-Driven Methods for Landslide Susceptibility Mapping in Human-Modified Environments: A Case Study from Wanzhou County, Three Gorges Reservoir Area, China, Remote Sens., 14, 774, https://doi.org/10.3390/rs14030774, 2022.
Yuniawan, R. A., Rifa'i, A., Faris, F., Subiyantoro, A., Satyaningsih, R., Hidayah, A. N., Hidayat, R., Mushthofa, A., Ridwan, B. W., Priangga, E., Muntohar, A. S., Jetten, V. G., van Westen, C. J., den Bout, B. V., and Sutanto, S. J.: Revised Rainfall Threshold in the Indonesian Landslide Early Warning System, Geosciences, 12, 129, https://doi.org/10.3390/geosciences12030129, 2022.
Zhang, H., Yin, C., Wang, S. P., and Guo, B.: Landslide susceptibility mapping based on landslide classification and improved convolutional neural networks, Nat. Hazards, 41, 1931–1971, https://doi.org/10.1007/s11069-022-05748-3, 2022.
Zhang, J. Y., Ma, X. L., Zhang, J. L., Sun, D. L., Zhou, X. Z., Mi, C. L., and Wen, H. J.: Insights into geospatial heterogeneity of landslide susceptibility based on the SHAP-XGBoost model, J. Environ. Manage., 332, 117357, https://doi.org/10.1016/j.jenvman.2023.117357, 2023.
Zhao, B. R., Dai, Q., Han, D. W., Dai, H. C., Mao, J. Q., and Zhuo, L.: Probabilistic thresholds for landslides warning by integrating soil moisture conditions with rainfall thresholds, J. Hydrol., 574, 276–287, https://doi.org/10.1016/j.jhydrol.2019.04.062, 2019.
Zhao, L. H., Liu, M., Song, Z. C., Wang, S. G., Zhao, Z. G., and Zuo, S.: Regional-scale modeling of rainfall-induced landslides under random rainfall patterns, Environ. Modell. Softw., 155, 105454, https://doi.org/10.1016/j.envsoft.2022.105454, 2022.
Zhou, C., Cao, Y., Hu, X., Yin, K. L., Wang, Y., and Catani, F.: Enhanced dynamic landslide hazard mapping using MT-InSAR method in the Three Gorges Reservoir Area, Landslides, 19, 1585–1597, https://doi.org/10.1007/s10346-021-01796-1, 2022.
Zhu, C. H. and Hu, G. D.: Time Series Prediction of Landslide Displacement Using SVM Model: Application to Baishuihe Landslide in Three Gorges Reservoir Area, China, Appl. Mech. Mater., 239, 1413–1420, https://doi.org/10.4028/www.scientific.net/AMM.239-240.1413, 2013.


