the Creative Commons Attribution 4.0 License.
the Creative Commons Attribution 4.0 License.
 | 09 Oct 2024
GTDI: a game-theory-based integrated drought index implying hazard-causing and hazard-bearing impact change
Xiaowei Zhao
Tianzeng Yang
Hongbo Zhang
Tian Lan
Chaowei Xue
Tongfang Li
Zhaoxia Ye
Zhifang Yang
Yurou Zhang
Developing an effective and reliable integrated drought index is crucial for tracking and identifying droughts. The study employs game theory to create a spatially variable weight drought index (game-theory-based drought index, GTDI) by combining two single-type indices: an agricultural drought index (standardized soil moisture index, SSMI), which implies drought hazard-bearing conditions, and a meteorological drought index (standardized precipitation evapotranspiration index, SPEI), which implies drought hazard-causing conditions. In addition, the entropy-theory-based drought index (ETDI) is introduced to incorporate a spatial comparison with GTDI to illustrate the rationality of gaming weight integration, as both entropy theory and game theory belong to linear combination methods in the development of the integrated drought index and entropy theory has been applied in related research. Leaf area index (LAI) data are employed to confirm the reliability of GTDI in identifying drought by comparing it with SPEI, SSMI, and ETDI. Furthermore, a comparative analysis is conducted on the temporal trajectories and spatial evolution of the GTDI-identified drought to discuss GTDI's level of advancement in monitoring changes in hazard-causing and hazard-bearing impacts. The results show that GTDI has a very high correlation with single-type drought indices (SPEI and SSMI), and its gaming weight integration is more logical and trustworthy than that of ETDI. As a result, it outperforms ETDI, SPEI, and SSMI in recognizing drought spatiotemporally and is projected to replace single-type drought indices to provide a more accurate picture of actual drought. Additionally, GTDI exhibits the gaming feature, indicating a distinct benefit in monitoring changes in hazard-causing and hazard-bearing impacts. The case studies show that drought events in the Wei River basin are dominated by a lack of precipitation. The hazard-causing index, SPEI, dominates the early stages of a drought event, whereas the hazard-bearing index, SSMI, dominates the later stages. This study surely serves as a helpful reference for the development of integrated drought indices as well as regional drought prevention and monitoring.
- Article
(5783 KB) - Full-text XML
-
Supplement
(487 KB) - BibTeX
- EndNote


Drought is one of the most widespread and frequent natural hazards, commonly associated with inadequate rainfall, a deficit in soil moisture, and reduced streamflow (Berg and Sheffield, 2018; Q. Zhang et al., 2022; AghaKouchak et al., 2023). Due to the combined pressures of climate change and human activities, the intensity of global drought and the area of arid land have expanded dramatically since the 21st century (Dai, 2013; Huang et al., 2016), severely constraining socioeconomic development and human livelihoods. Moreover, global warming is projected to increase the frequency and severity of future drought occurrences (Trenberth et al., 2014; Vicente-Serrano et al., 2020).
China, with its complex terrain and diverse climate types, is one of the countries that is suffering the most severe drought-related losses worldwide (Dai, 2011; Y. Zhang et al., 2021). Drought is responsible for more than half of the economic losses caused by climatic hazards in China (Wang et al., 2023). According to the Ministry of Water Resources of China (2023), the average annual impacted area of crops and grain loss due to drought was 19.51×10⁶ ha and 15.8×10⁹ kg, respectively, from 1950 to 2022. The loss has become increasingly severe, particularly after 2006, resulting in direct economic losses of more than USD 160 billion in China. For example, the severe drought event that occurred in southern China from autumn 2009 to spring 2010 deprived almost 21 million people of drinking water, with direct economic losses of nearly USD 3 billion (Yang et al., 2012). Furthermore, the ongoing drought in China may worsen in the future (Leng et al., 2015; Wang et al., 2018), with drought becoming more frequent, intense, and extended. As a result, scientifically identifying regional drought risks and clarifying regional drought development and evolution patterns can assist in actively developing drought mitigation and disaster reduction strategies, assuring the security of food supply and water use.
Drought is currently categorized into four types based on distinct description objects: meteorological, agricultural, hydrological, and socioeconomic droughts (Wilhite and Glantz, 1985; Shah and Mishra, 2020; Ding et al., 2011). Despite differing definitions and emphasis, meteorological drought is always regarded as the root cause of the other three types of drought (Ma et al., 2020). In terms of the driving mechanism of drought occurrences, meteorological drought indicates the causative attribute of drought (Zhang et al., 2023), whereas the other three types primarily reflect the state of hazard-bearing entities. Concurrently examining the hazard-causing and hazard-bearing components of drought is essential for effective estimation and management of drought risk.
Drought is frequently identified using drought indices. The standardized precipitation index (SPI; McKee et al., 1993) for meteorological drought, the standardized soil moisture index (SSMI; Hao and AghaKouchak, 2013) for agricultural drought, and the standardized runoff index (SRI; Shukla and Wood, 2008) for hydrological drought are currently the most commonly used drought indices. These single-type drought indices are primarily used for one-dimensional(-type) drought measurement and evaluation. However, due to the complex causes and wide-ranging impacts of drought events, a single-type drought index usually cannot fully and effectively reflect the spatiotemporal development process of drought events (Chang et al., 2016; Wei et al., 2023). As a result, much effort has been expended in developing comprehensive drought indices, such as the Palmer drought severity index (PDSI; Palmer, 1965). However, these indices are not very successful at distinguishing between meteorological and agricultural drought influences and evaluating changes in regional patterns. Because of this, some works refer to constructing a composite or integrated drought index in two or more dimensions (Chang et al., 2016; Won et al., 2020; Wei et al., 2023), employing both linear and nonlinear combination approaches.
The copula function is commonly employed in the nonlinear approach. Won et al. (2020) proposed a copula-based joint drought index (CJDI) by combining SPI and the evaporative demand drought index (EDDI); Wei et al. (2023) used the copula function to connect precipitation, the normalized difference vegetation index (NDVI), and runoff and then constructed the standardized comprehensive drought index (SCDI), which had been applied to drought assessment in China's Yangtze River basin. It should be noted that copula functions are possibly reliant on the assumption that samples follow a specific probability density function (Zhang et al., 2019). However, due to the complicated interactions between the atmosphere, vegetation, soil, and groundwater, this assumption is not generally valid for the drought. If the copula function is used to estimate drought quantiles, significant biases may be introduced, affecting the reliability of the copula-based integrated drought indices (Huang et al., 2015).
An integrated drought index can also be generated by linearly mixing single-type drought indices, such as the entropy weight method (Huang et al., 2015) and the method of principal component analysis (Liu et al., 2019). In the relevant research, it is highly emphasized that the weighting of different types of drought indices is critical, since it has a significant impact on the reliability of drought monitoring results (Liu et al., 2019; Wei et al., 2023). Furthermore, it has been revealed that the impacts of different factors on drought (Blauhut et al., 2016; X. Zhang et al., 2022), such as hazard-causing and hazard-bearing factors, are changing spatially and confrontational, necessitating the development of effective linear combination methods for measuring their spatial heterogeneity in contribution to drought. Therefore, game theory is suggested for the integration of drought indices because it can comprehensively consider the opinions of each party to achieve a distribution pattern that satisfies each participant (Lai et al., 2015; Jato-Espino and Ruiz-Puente, 2021); it is superior to the entropy weight method in weight allocation, and its calculation process is simpler than copula functions. It has been widely applied in water resource management (Madani, 2010; Khorshidi et al., 2019; Batabyal and Beladi, 2021).
This study proposes a game-theory-based drought index (GTDI), which integrates a meteorological drought index (standardized precipitation evapotranspiration index, SPEI), implying a hazard-causing impact, and an agricultural drought index (standardized soil moisture index, SSMI), implying a hazard-bearing impact, through the game theory method. The structure of this study is as follows: Sect. 2 introduces the research topic and data sources. Section 3 describes the SPEI, SSMI, GTDI, and ETDI (entropy-theory-based drought index) calculation procedures, as well as the verification and analysis methodologies. Section 4 investigates the evolutionary features of GTDI, examines its rationality of integrated weight in comparison to ETDI, and validates its usefulness in identifying drought occurrences using leaf area index (LAI) data. Furthermore, the impact of hazard-causing and hazard-bearing indices on GTDI's spatiotemporal evolution is explored through the synergistic analysis of GTDI, SPEI, and SSMI. Finally, Sect. 5 highlights the study's significant findings.
2.1 Study area
The Wei River is the largest tributary of the Yellow River, with a drainage area of 134 800 km2 (Fig. 1). It rises to the north of Niaoshu Mountain in Gansu Province, at about 33.5–37.5° N in latitude and 103.5–110.5° E in longitude, and runs primarily through Shaanxi, Gansu, and Ningxia provinces. The Wei River basin (WRB) is high in the west and low in the east, with a geographical elevation ranging from 322 to 3777 m. The WRB has a continental monsoon climate with large seasonal fluctuations, with average annual temperatures and precipitation ranging from 7.8 to 13.5 °C and 500 to 800 mm, respectively (T. Zhang et al., 2022). Precipitation in the WRB accounts for over 60 % of the total annual amount, and its spatial distribution shows a steady decrease from southeast to northwest. Furthermore, evaporation is significant in the WRB, with annual water surface evaporation ranging from 660 to 1600 mm. As a result of its specific climate characteristics, the WRB is a typical place for drought research.
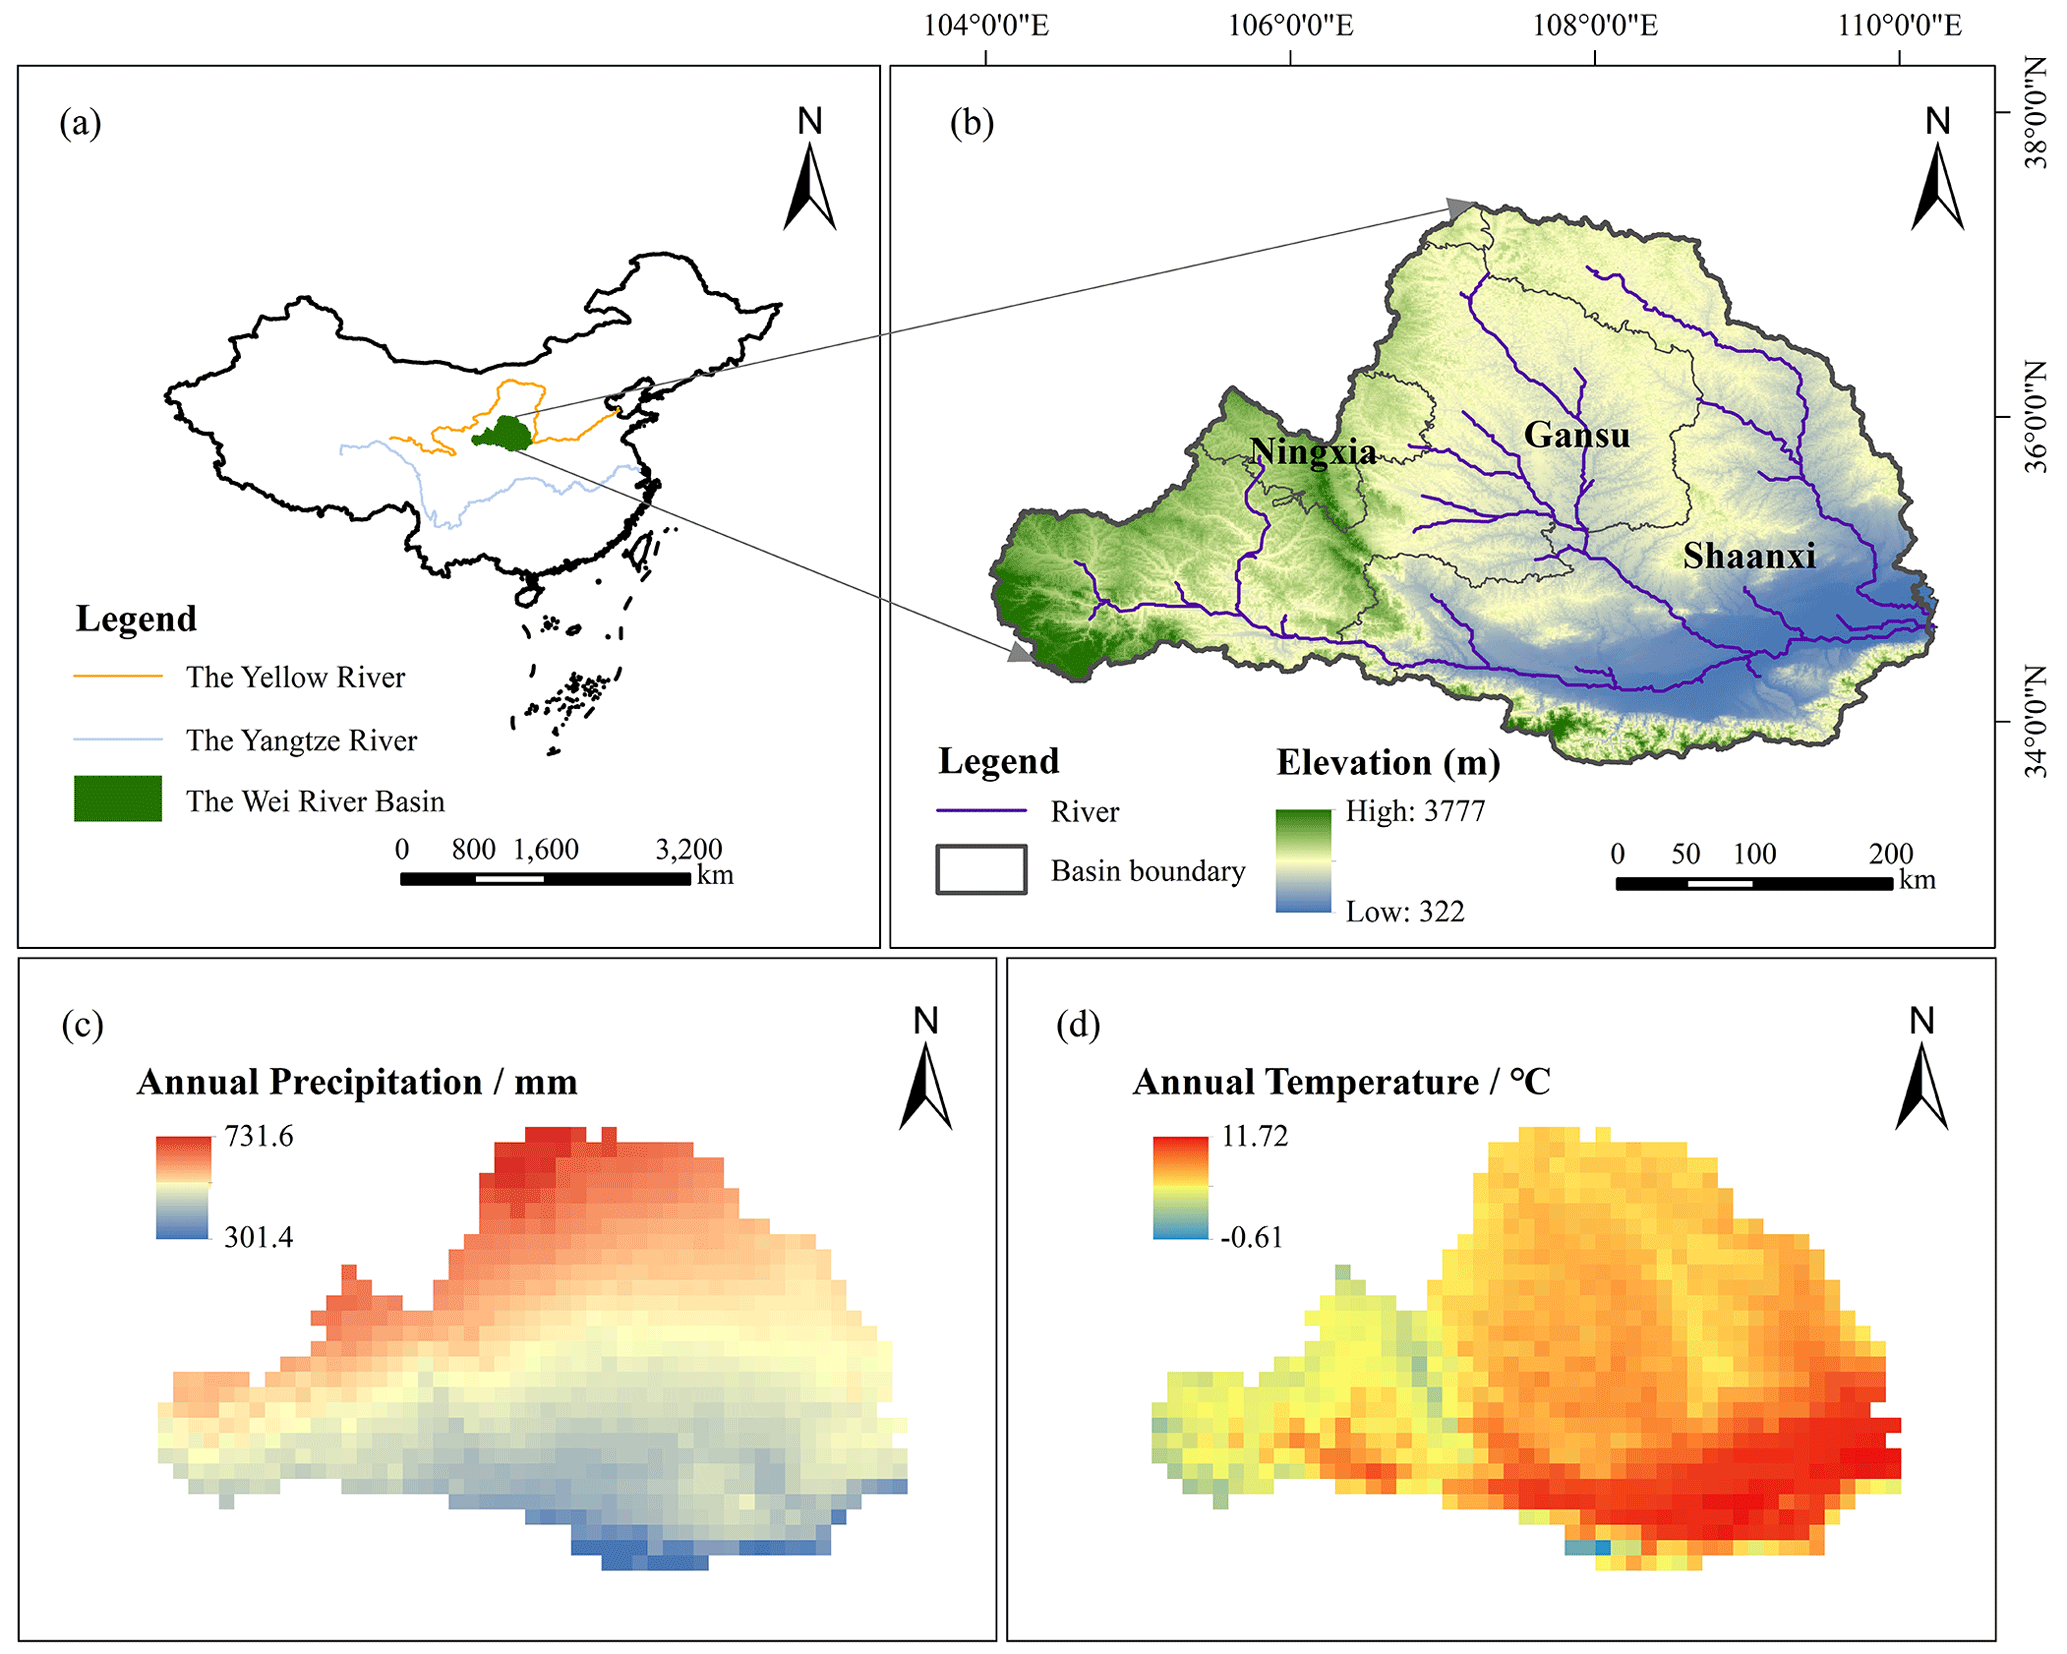
Figure 1A map of the Wei River basin. Panel (a) shows the geographical location of the Wei River basin in China, panel (b) displays the spatial distribution of elevation (Zhang, 2021) in the Wei River basin, and panels (c) and (d) demonstrate the annual precipitation and temperature (Peng et al., 2019) of the WRB.
2.2 Data source
The data used in this study comprise (1) DEM data (Zhang, 2021) with a grid size of 30 m; (2) monthly precipitation and temperature datasets (Peng et al., 2019) from 1950 to 2020 with a grid size of 1 km; (3) the GLDAS_NOAH025_3H_2.0 and GLDAS_NOAH025_3H_2.1 soil moisture dataset for 0 to 10 cm of the soil surface layer, with a spatial resolution of 0.25° and data period from 1950 to 2020; and (4) the GLOBMAP leaf area index dataset (Version 3) with a period of 1981 to 2019 and a spatial resolution of 0.08° (Liu et al., 2012). Additionally, in order to facilitate calculation and analysis, precipitation, air temperature, soil moisture, and leaf area index (LAI) data were all resampled to the same spatial resolution of 0.125° using the bilinear interpolation method in this study. The data source is shown in Table 1.
Table 1Data sources.
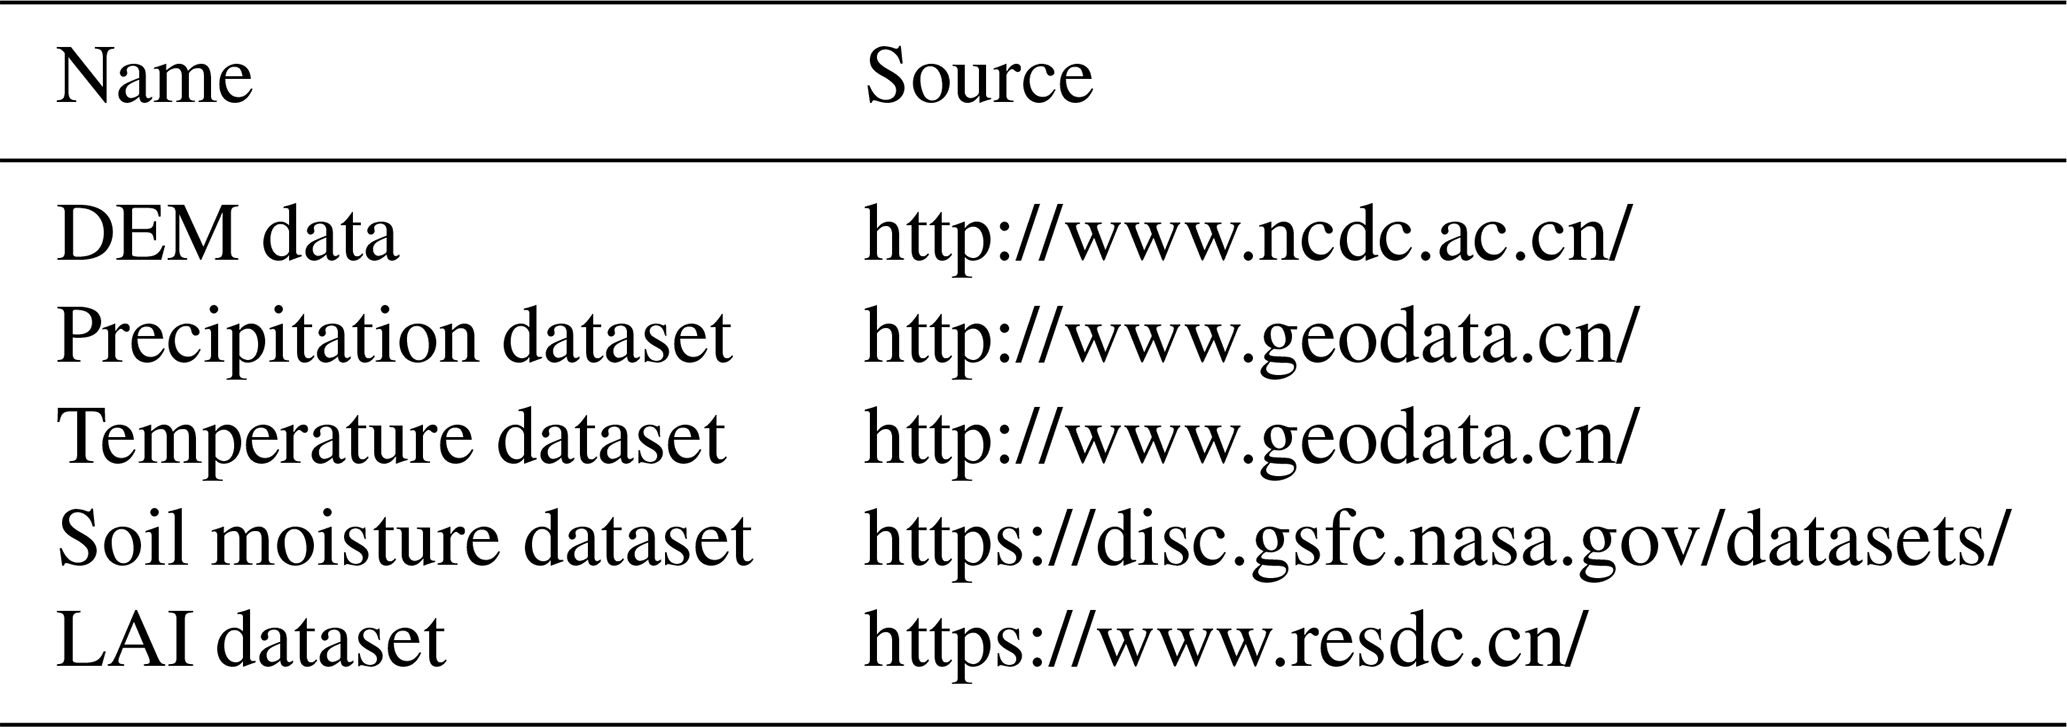
All links were accessed on 14 November 2023.
3.1 Calculation of single-type drought indices
3.1.1 SPEI
The standardized precipitation evapotranspiration index (SPEI) was first introduced by Vicente Serrano et al. (2010). As a meteorological drought index, SPEI primarily characterizes the hazard-causing attribute of drought (Zhang et al., 2023). On the basis of the standardized precipitation index (SPI), SPEI takes potential evapotranspiration (PET) into account and demonstrates superior effectiveness and applicability (Labudová et al., 2017; Li et al., 2020; Tan et al., 2023). The Thornthwaite method, which can better reflect the potential surface evapotranspiration, is employed to calculate PET in this paper. As is well known, drought indices on different timescales can reflect the dry and wet conditions of the study area during different periods. The 3-month drought index can reflect short- and medium-term dry and wet conditions and is more sensitive to seasonal drought, which helps us identify and analyze seasonal drought in the Wei River basin. Therefore, we calculated the SPEI series over a 3-month timescale in this study. The detailed calculation method of SPEI can be found in Sect. S1 in the Supplement.
3.1.2 SSMI
Drought can have a direct impact on the growth state of hazard-bearing bodies such as crops (Zhang et al., 2023), making agricultural drought hazard-bearing. The standardized soil moisture index (SSMI) is one of the most effective indices for predicting agricultural drought (Hao and AghaKouchak, 2013), and its calculation method is comparable to that of SPI (Xu et al., 2021; You et al., 2022). Meanwhile, it has been revealed that the log-logistic probability distribution function with three parameters is better suited to soil moisture data series than the original gamma probability distribution function (Oertel et al., 2018). As a result, in this study, we employed the calculation method proposed by Oertel et al. (2018) for the agricultural drought index, SSMI, with a 3-month timescale, just like SPEI. The calculation method of SSMI is detailed in Sect. S2.
3.2 Construction of integrated drought indices
In this study, two integrated drought indices, GTDI and ETDI, are built utilizing game theory and the entropy weight method for index weight allocation, respectively, and both combine SPEI and SSMI. ETDI serves as a comparison with GTDI in this study, and Sect. S3 introduces the calculation process of ETDI.
As a subset of optimality modeling, game theory (GT) investigates the interacting outcomes of resource conflicts and cooperation between two or more entities (Lai et al., 2015). It attempts to follow an optimal allocation approach that maximizes the interests of each participant through mathematical analysis (Jato-Espino and Ruiz-Puente, 2021). To date, GT has been widely applied in the fields of hydrology and water resources, such as water price equilibrium (Batabyal and Beladi, 2021), reservoir scheduling policy (Khorshidi et al., 2019), and subjective–objective weighting issues (Liu et al., 2020). In this study, the hazard-causing index (SPEI) and the hazard-bearing index (SSMI) are regarded as two opponents in the game. Through confrontation, the GT technique obtains the ideal weight allocation for both sides and then uses this to produce the integrated drought index (GTDI) at each grid point. The following text outlines the methods for creating GTDI using game theory.
Step 1. A possible weight set is combined by SPEI and SSMI in the form of an arbitrary linear combination as follows:
where V is a possible combined vector, Vspei and Vssmi are the weight vectors of SPEI and SSMI, and αspei and αssmi are the weight coefficients.
Step 2. Minimize the deviation between V and Vk using the following formula:
Step 3. According to the differentiation property of the matrix, transform formula (2) into a first-order system of linear equations:
Step 4. Solve the weight coefficients αspei and αssmi in Eq. (3) and normalize them:
Step 5. Calculate GTDI:
where Vgtdi is the combined vector of GTDI and and are the normalized weight coefficients of SPEI and SSMI, respectively.
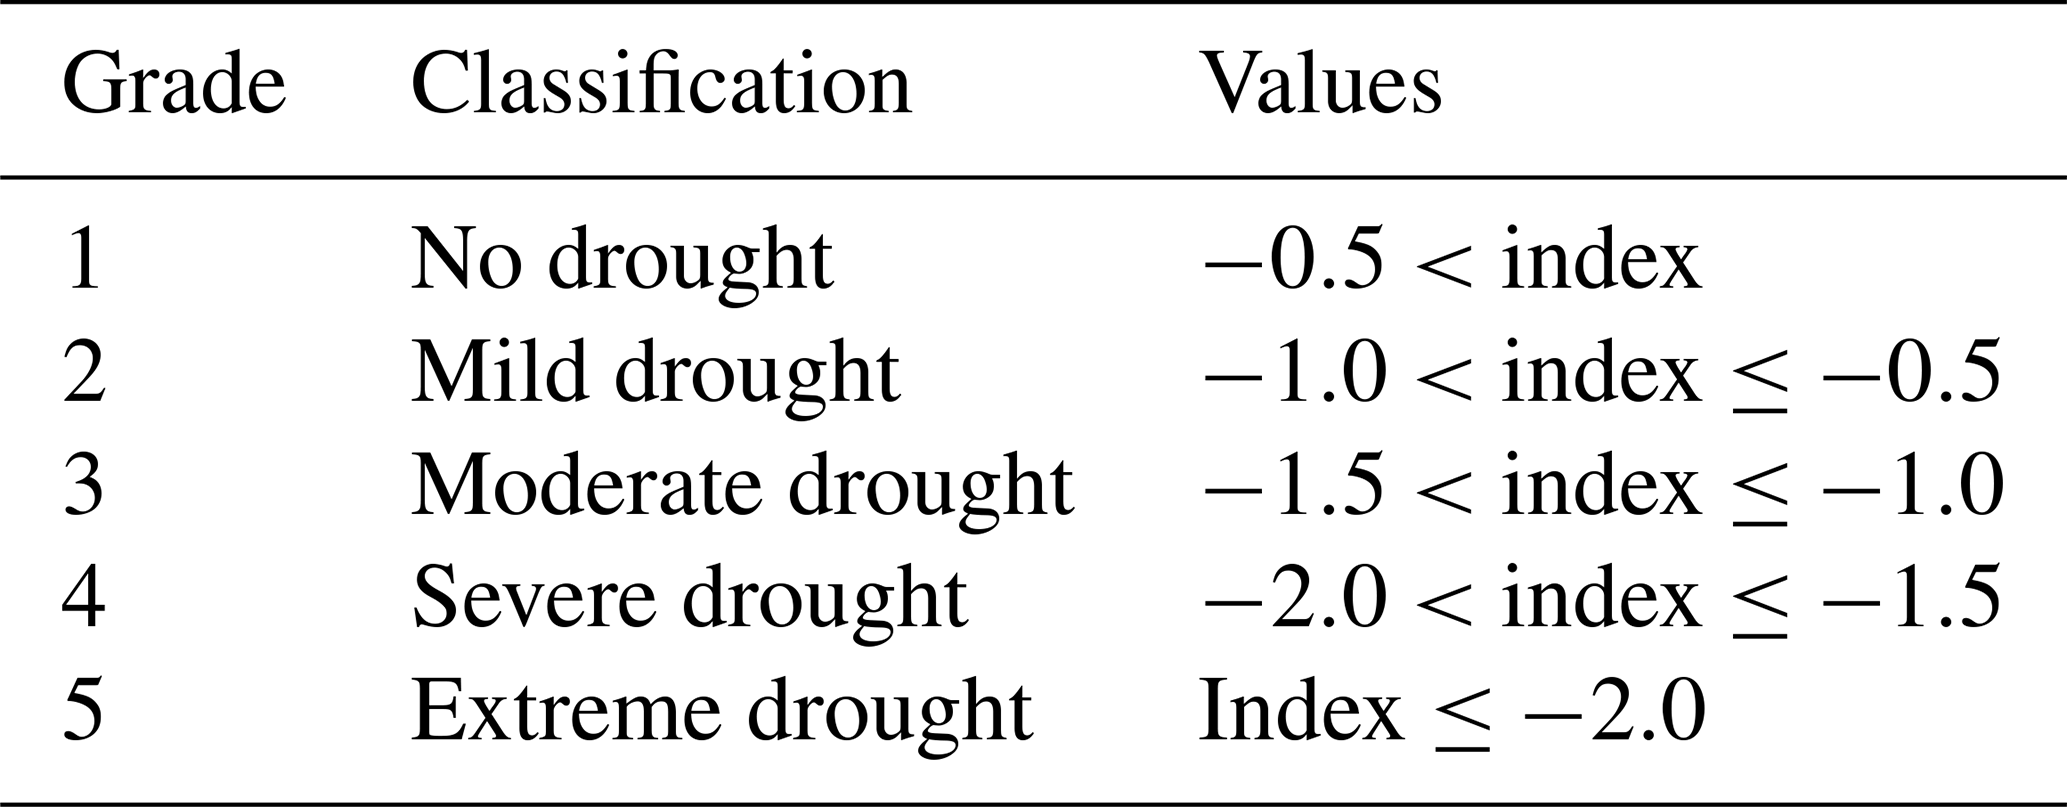
3.3 Classification criteria for drought
The calculating approach of SSMI in this study is comparable to that of SPEI, while GTDI and ETDI are built on SSMI and SPEI. As a result, as indicated in Table 2, SSMI, GTDI, and ETDI use the same grading criteria as SPEI.
Table 2Drought classification criteria for SPEI, SSMI, GTDI and ETDI (Huang et al., 2023).
3.4 Reliability verification
3.4.1 Evaluation of correlation
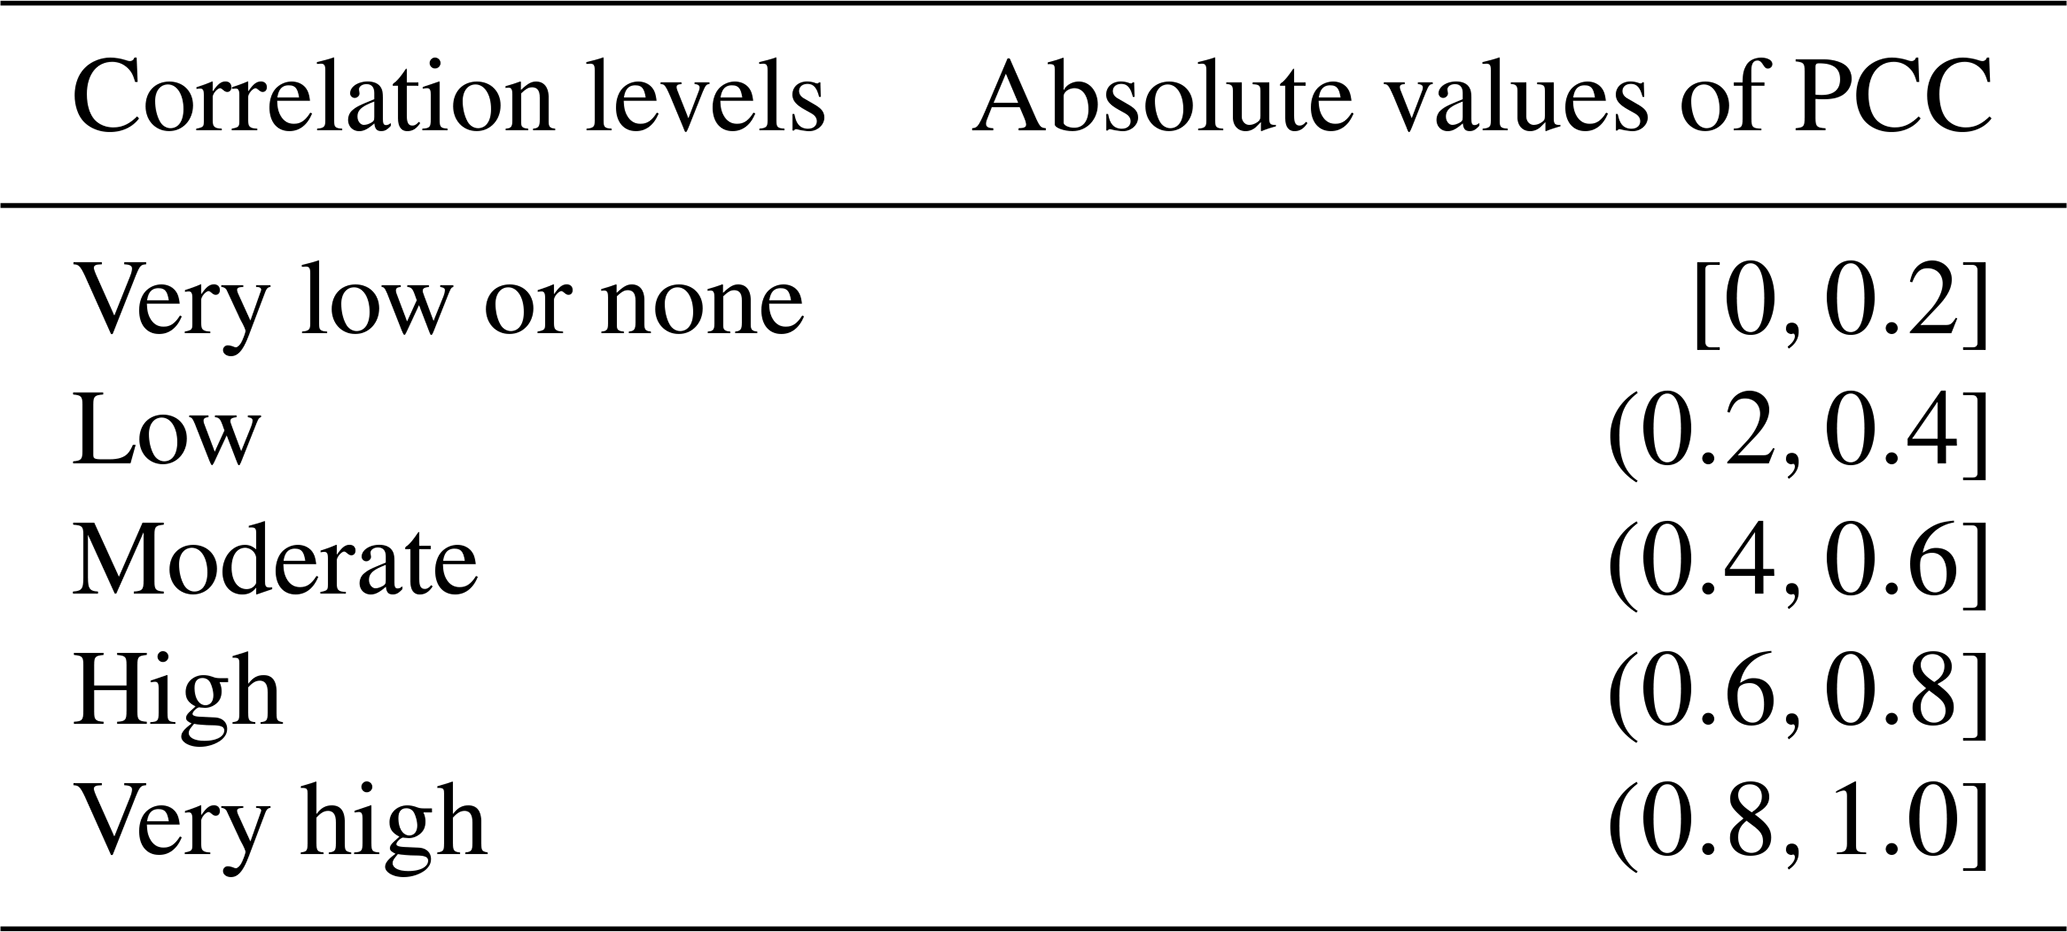
A correlation analysis of the integrated drought index with two single-type drought indices is necessary to assess the consistency of indicators before and after coupling. Thus, Pearson's correlation coefficients (PCCs) (Panda et al., 2018) between GTDI or ETDI and SPEI or SSMI are calculated for each grid (Eq. 6), and their correlation in different locations is explored. Table 3 shows the correlation levels and corresponding absolute value range of PCCs.
where n denotes the sample size; xi and yi are data samples of x and y, respectively; and and are arithmetic average of x and y, respectively.
Table 3The absolute value range of PCCs and correlation levels (Yang and He, 2022).
3.4.2 Efficacy verification in identifying drought
Because surface vegetation is highly sensitive to soil moisture (Li et al., 2022), drought usually leads to a decrease in the vegetation leaf area index (LAI; Fang et al., 2019; Bock et al., 2023). In light of this, LAI data are used to evaluate the drought recognition capabilities of various indices to further validate their dependability. The leaf area index dataset used is the GLOBMAP leaf area index product (https://www.resdc.cn/, last access: 14 November 2023).
Significant disparities in LAI trends can be identified in the WRB around 1999, as illustrated in Fig. 2a. Prior to 1999, the average annual growth rate of LAI was only 0.21 a−1, but it skyrocketed to 1.93 a−1 after 1999, owing mostly to “Grain for Green” (Li et al., 2019; Tian et al., 2022). In order to mitigate the potential inaccuracy resulting from the regional LAI trend change, we selected the validation years of 1981 to 1999, during which the growth trend was relatively weak. In addition, LAI in the WRB rises significantly from March to August, falls fast from September to November, and then remains low from December to January of the following year (Fig. 2b). It can be discovered that LAI's trend change in autumn and winter is the result of vegetation's natural growth cycle, resulting in a reduced sensitivity of LAI to soil moisture and its further failure to identify drought. As a result, the autumn and winter months (September to January) should also be excluded from the validation period.
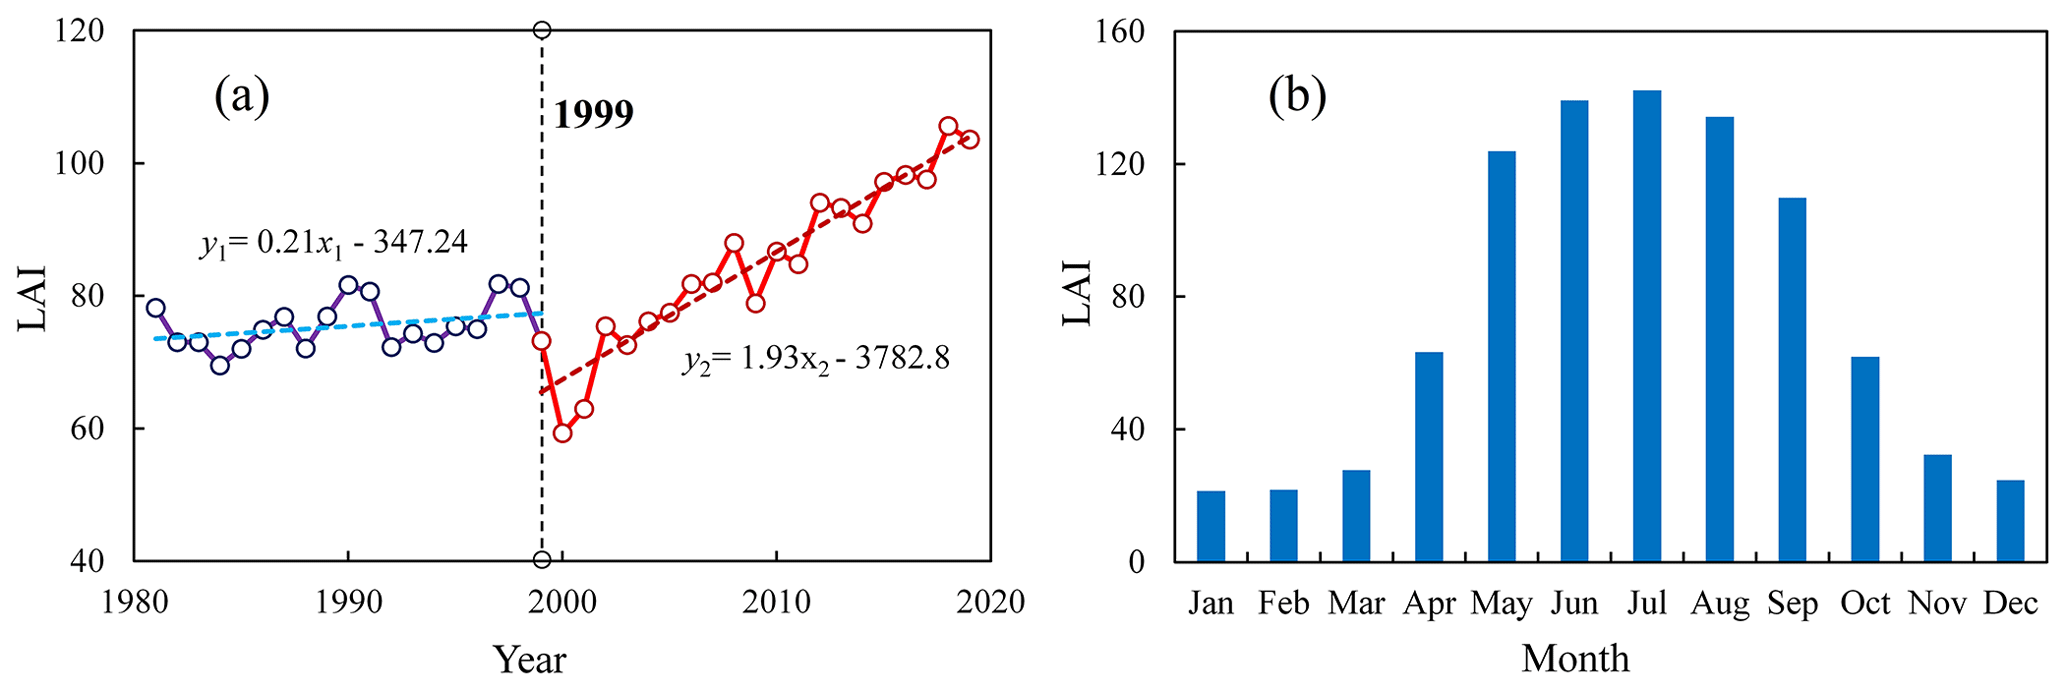
Figure 2The plot graphs of the leaf area index (LAI) in the Wei River basin with an interannual trend spanning 1981 to 2019 (a) and the average monthly allocation from 1981 to 1999 (b).
In summary, LAI raster data from March to August (spring and summer) of the period from 1981 to 1999 were selected to verify the drought identification efficacy of drought indices. Meanwhile, the image from the mid-month of each month is regarded as the representative data of the month. If the occurrence of drought has been discovered, it can be determined by comparing the mean values of LAI during arid months with non-arid months. The specific process is as follows:
where Md,i and Mn,i represent the average values of LAI in the ith grid during arid and non-arid months, respectively; m and n are the number of arid and non-arid months, respectively; Ii,j and Ii,l represent the value of LAI of the ith grid during the jth arid month and the lth non-arid month, respectively; and Ri represents the drought recognition performance of the drought index in the ith grid, with a value of 1 indicating fine and 0 indicating poor.
3.5 Analysis methods for drought characteristics
3.5.1 Mann–Kendall test
The Mann–Kendall (M–K) test is a non-parametric statistical test method with a simple computational process (Yue and Wang, 2002). It has been extensively utilized for the analysis of hydrological and meteorological sequences (F. Zhang et al., 2021; Agbo et al., 2023). In this study, the M–K test method is used to perform trend testing on the drought index sequences, and Cai et al. (2022) can be referred to for the calculation principle.
3.5.2 Drought identification
Drought is often identified by two factors: the drought index threshold and the drought area threshold. In this study, we used −1 as the drought index threshold, which is compatible with current research (Deng et al., 2021; Feng et al., 2023), and 1.6 % as the area threshold (Wang et al., 2011). Furthermore, a spatiotemporal continuity technique is used to detect drought occurrences, with specific procedures available in Deng et al. (2021). Briefly, as long as the drought index value at a grid point is lower than the drought index threshold of −1, we determine it as a drought grid point. When the total area of drought grid points in a certain month exceeds the drought area threshold, we determine that month to be a drought month. Furthermore, when multiple consecutive months are determined to be drought months, if the overlapping area of drought areas in space between two adjacent consecutive drought months exceeds the drought area threshold, we determine these two months as belonging to the same drought event; otherwise, they belong to different drought events.
3.5.3 Spatiotemporal characteristics of drought
The spatiotemporal characteristics of drought mostly manifest in variables such as drought intensity, drought area, drought duration, and the drought centroid (Wen et al., 2020). Based on the current research methods for studying the spatiotemporal characteristics of drought, we divided the variables representing drought characteristics into two scales: grid point and monthly, in order to systematically analyze and describe the drought characteristics of the WRB.
-
The grid point's drought characteristic variable.
The drought intensity Si of the grid point is calculated by
where Ii is the value of the ith drought grid point and S0 is the threshold of the drought index.
-
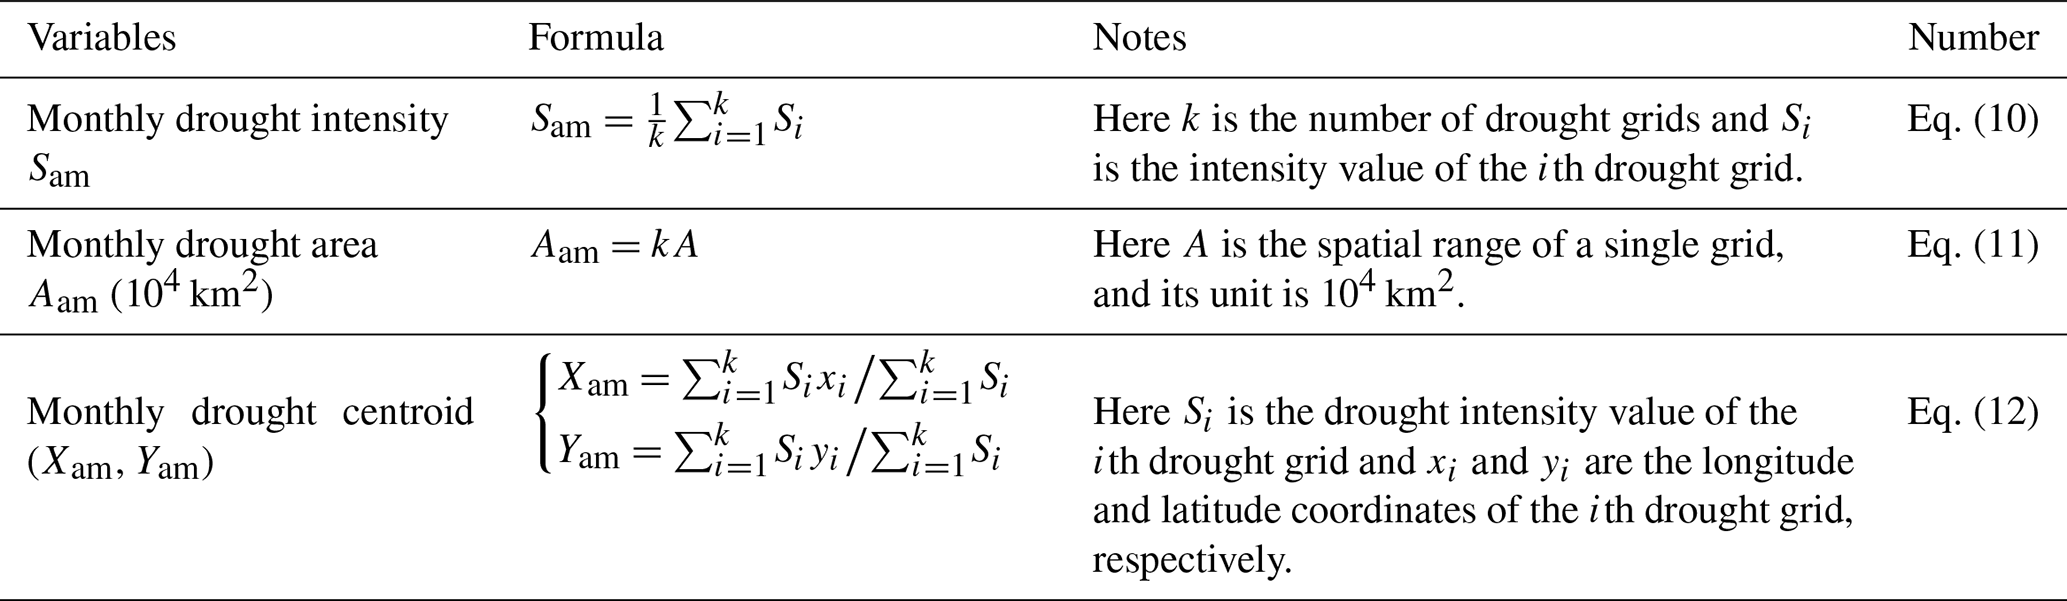
Monthly drought characteristic variables.
The monthly drought characteristic variables consist of the monthly drought intensity Sam, the monthly drought area Aam, and the monthly drought centroid (Xam, Yam), as shown in Table 4.
4.1 Evolutionary characteristics of the integrated drought index (GTDI)
Using the game theory method, the monthly GTDI of the WRB was calculated based on SPEI and SSMI. Meanwhile, considering the WRB's seasonal characteristics, GTDI sequences from May, August, November, and February of the next year were chosen to represent the drought conditions of spring, summer, autumn, and winter, respectively.
Figure 3a demonstrates the temporal evolution characteristics of the monthly GTDI in the WRB from 1950 to 2020. Therein, the linear tendency rate of GTDI is −0.024 per 10 a, illustrating that the drought in the WRB is aggravating, which is also mentioned in Wang et al. (2020). Particularly since the 1990s, the frequency of moderate and severe drought months and their average drought intensity have increased by 5.1 percentage points (from 34.1 % to 39.2 %) and 0.043 (from 0.242 to 0.285), respectively. In terms of seasonal change, drought in the WRB showed an increasing trend in spring, summer, and autumn (Fig. 3b–d). In the eastern half of the WRB, the significantly aggravated area of spring drought accounts for 29.98 % of the overall basin, while most places in summer and autumn show a non-significant aggravation in drought severity. Winter is an exception, as most areas experience a reduction in drought, especially in the eastern and northern regions of the WRB (Fig. 3e).
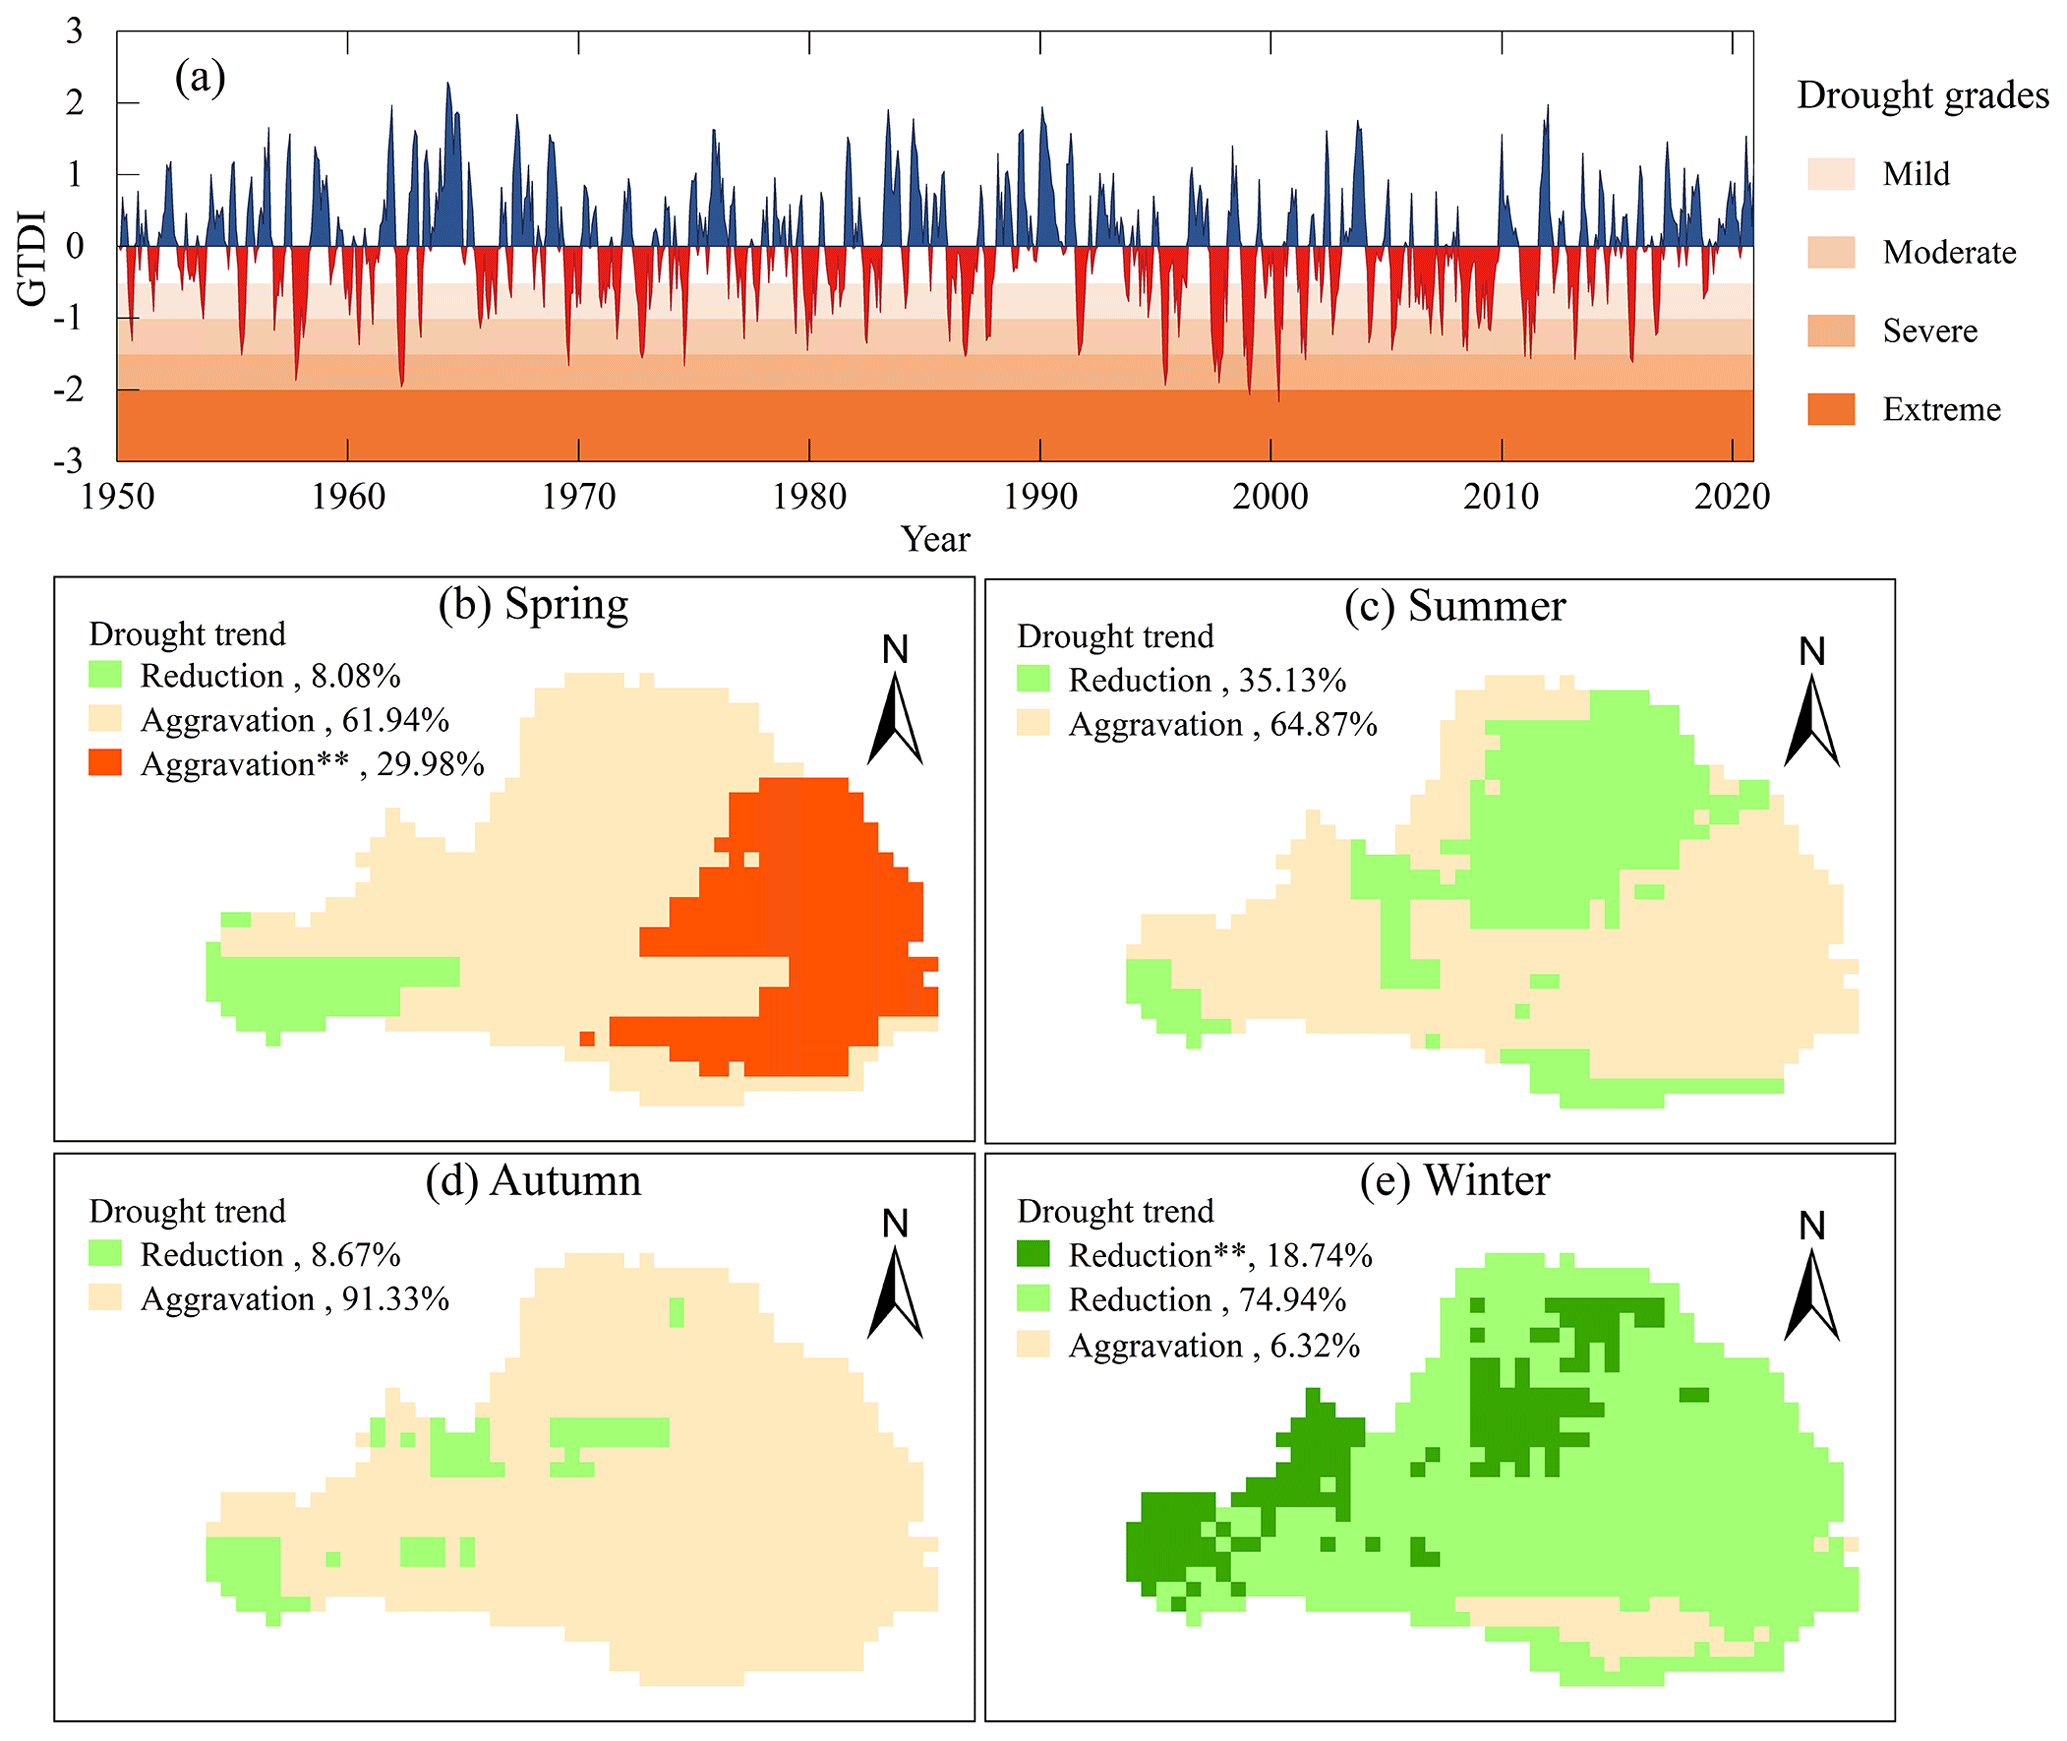
Figure 3Temporal evolution characteristics of integrated drought in the Wei River basin from 1950 to 2020 (a) and spatial distribution of drought trends in different seasons (b–e). The symbol “**” denotes the change is significant, and the percentage means the area proportion of different trend types.
4.2 Reliability verification of GTDI
4.2.1 The evaluation of correlation
Table 5 illustrates the grid proportions of different correlation levels between the integrated drought indices (GTDI and ETDI) and the single-type drought indices (SPEI and SSMI), whereas Fig. 5 depicts the spatial distribution of their correlation coefficients in different seasons.
Table 5Grid proportions of integrated drought indices (GTDI, ETDI) and single-type drought indices (SPEI, SSMI) at different correlation levels.
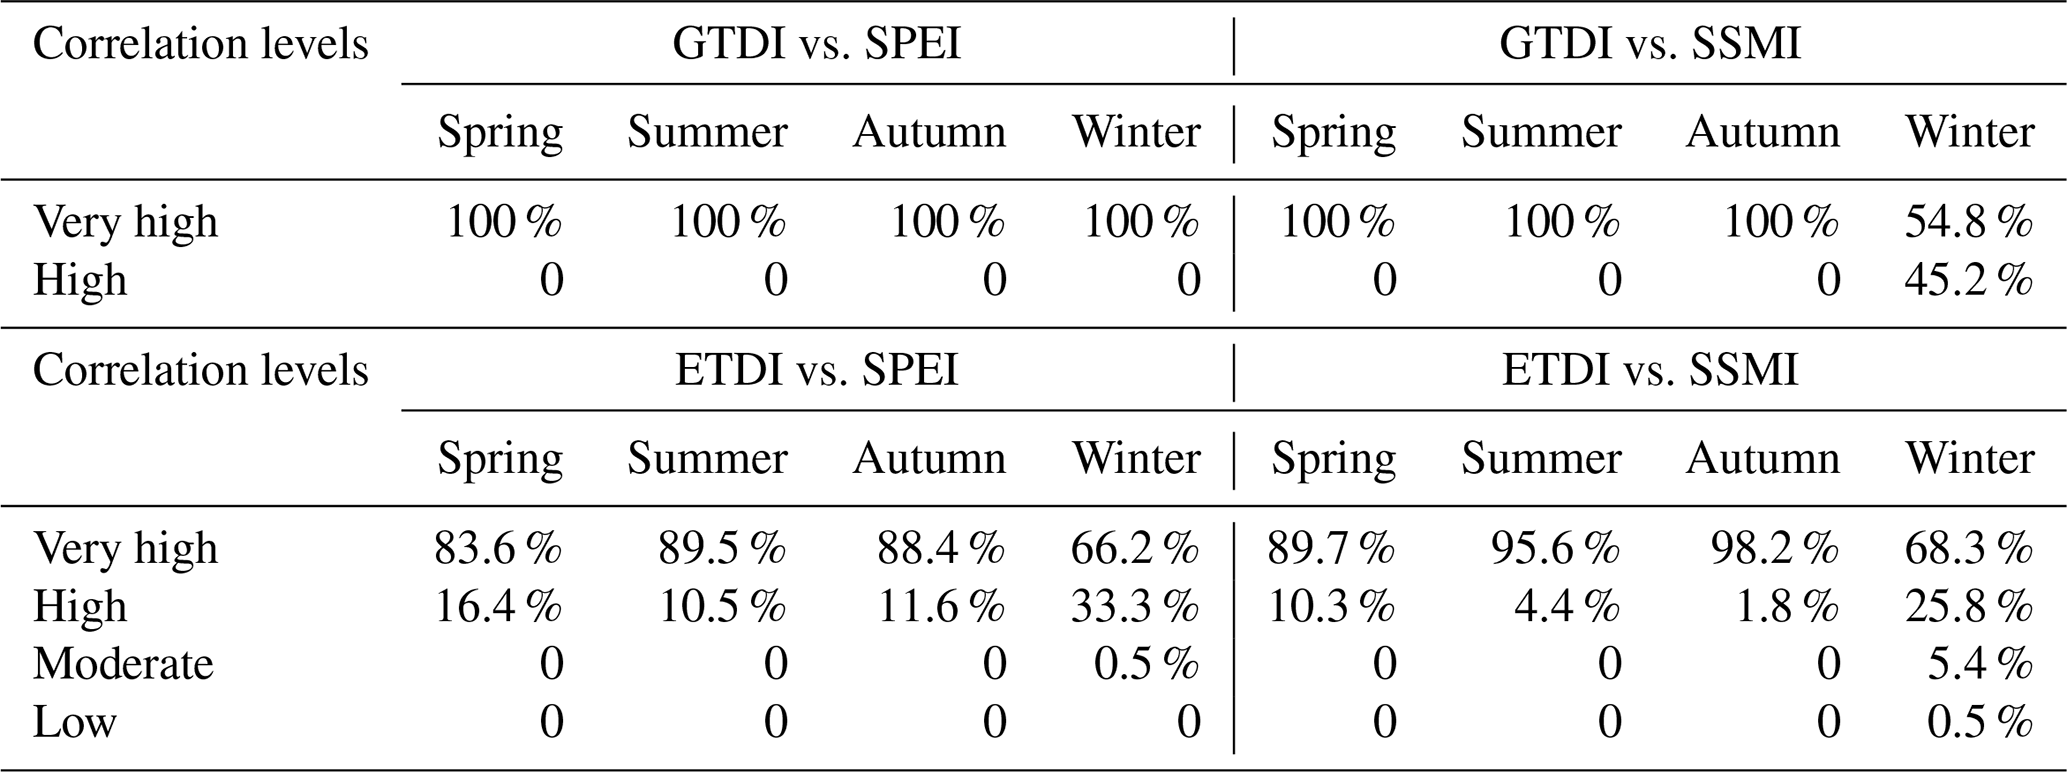
As shown in Table 5 and Fig. 4, the correlation between GTDI and SPEI or SSMI in the entire WRB is quite significant, and the correlation coefficients (PCCs) are close to 1 in spring, summer, and autumn but slightly lower in winter (Fig. 4a–h). The correlation coefficients in the western and northern areas of the WRB are lower in winter (Fig. 4d, h, l, and p), but the minimal correlation coefficients between GTDI and SPEI or SSMI are still above 0.83 and 0.67, respectively (Fig. 4d and h). It is worth noting that GTDI and SPEI have a very high correlation across the WRB over all four seasons, whereas 45.2 % of locations only have a good correlation between GTDI and SSMI in winter (Table 5). As a result, the correlation between GTDI and SPEI is stronger than that of SSMI, especially during the winter season.
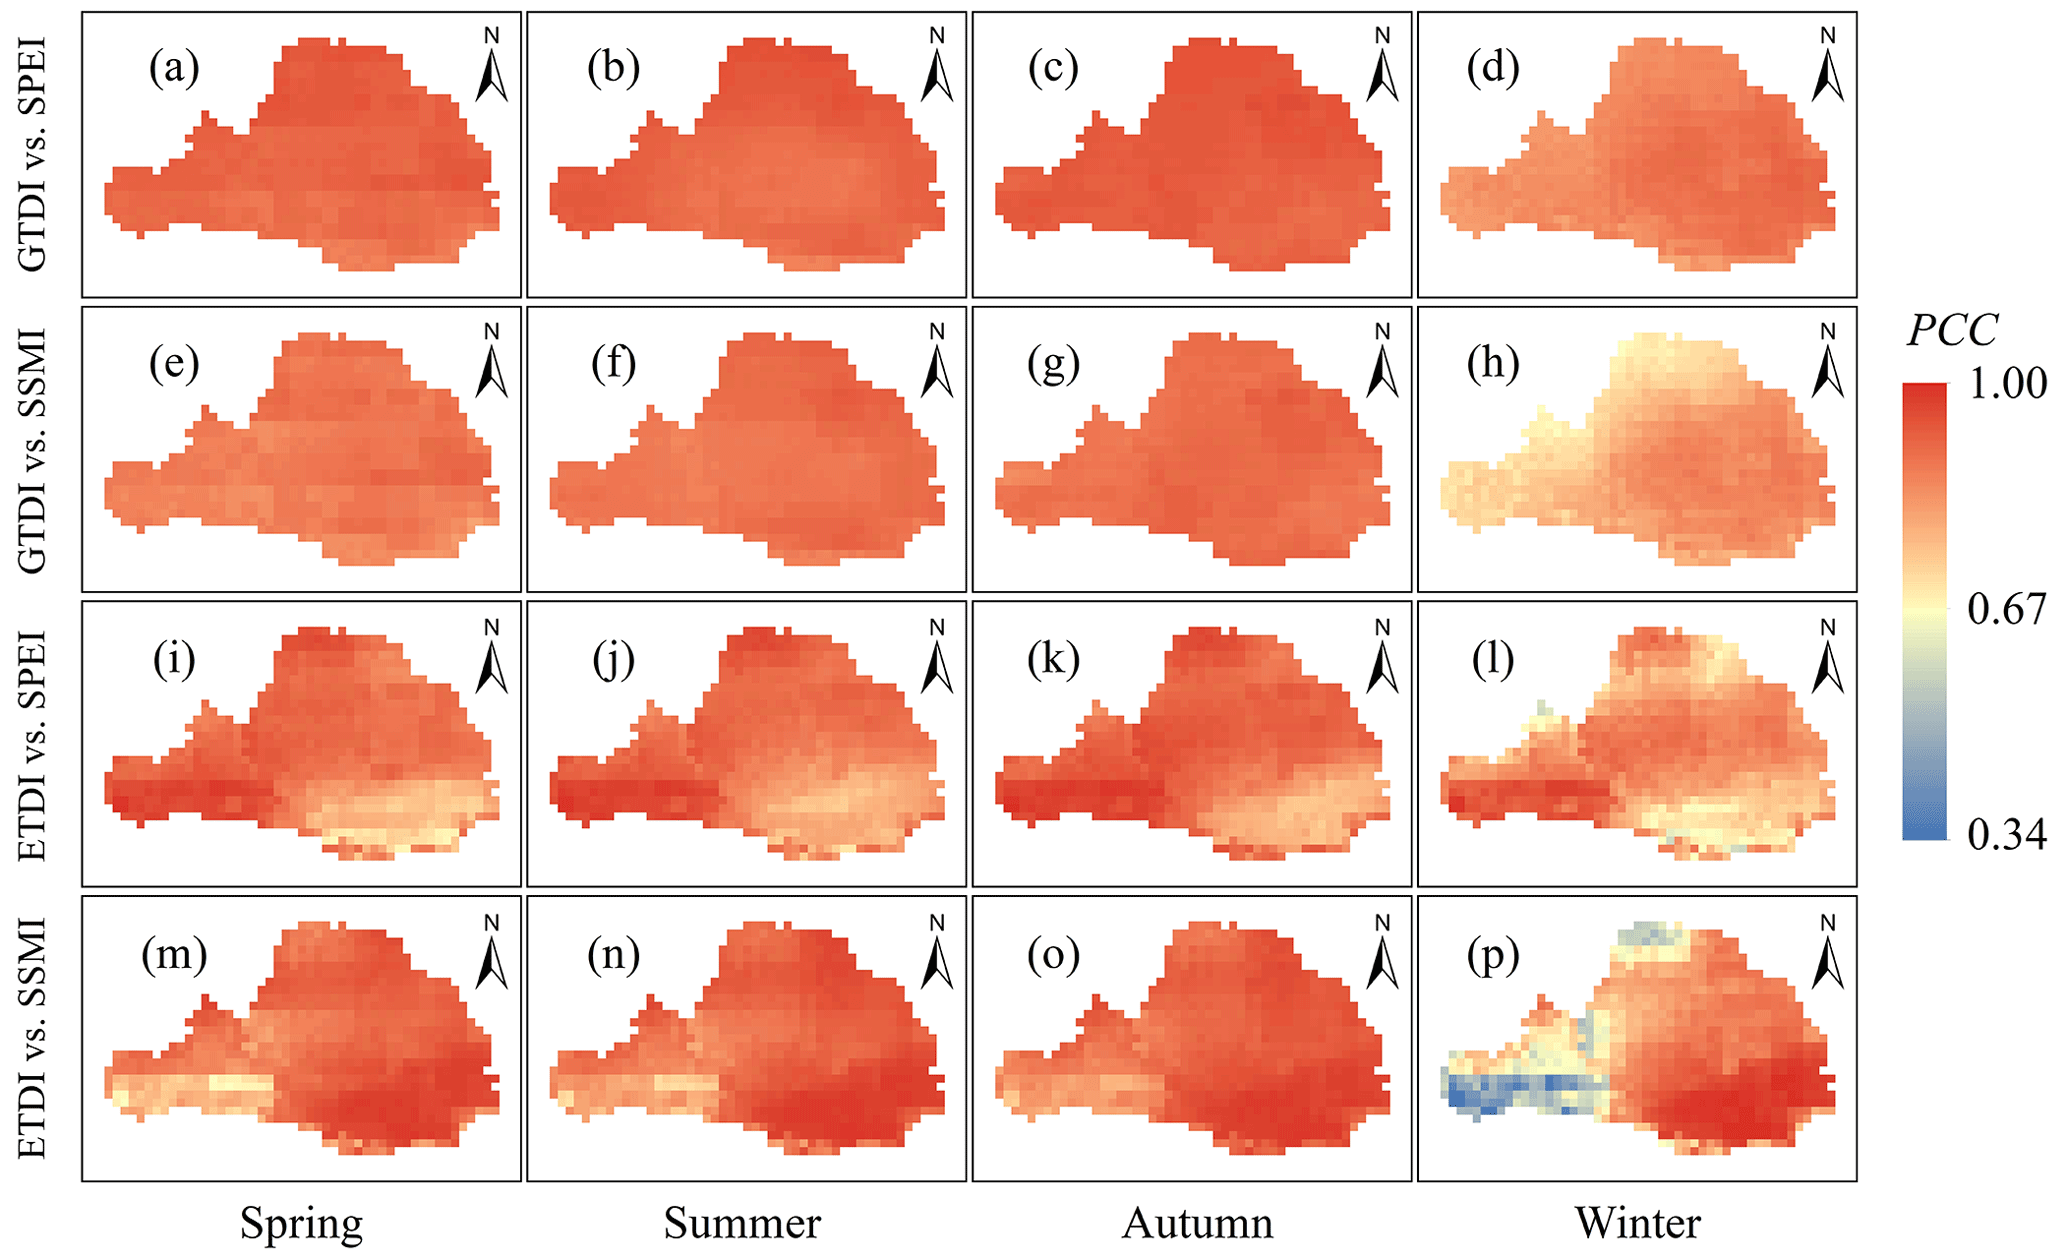
Figure 4Spatial distribution of correlation coefficients in different seasons. The color bar on the right denotes Pearson's correlation coefficients.
The graph also shows that the integrated drought index (ETDI) demonstrates spatially opposite correlations to SPEI and SSMI. For instance, in the southeastern area of the Wei River basin, there is the worst association between ETDI and SPEI, but the correlation between ETDI and SSMI is the strongest (Fig. 4i–p). Similarly to GTDI, the correlation between ETDI and SPEI or SSMI is slightly higher in spring, summer, and autumn than in winter. However, as compared to GTDI, the geographical variability in the correlation coefficients between ETDI and SPEI or SSMI is more pronounced in the same season (Fig. 4). As seen in winter (Fig. 4p), the highest correlation coefficient between ETDI and SSMI is approximately 1, while the lowest value is around 0.34. In terms of grid proportions at various levels of correlation, the correlations between ETDI and SPEI or SSMI do not achieve a very high level in certain regions over the four seasons (Table 5), resulting in its performance falling short compared to GTDI.
Overall, GTDI exhibits superior performance to ETDI, particularly in terms of the homogeneity of the spatial distribution of correlation coefficients, indicating that the integrated drought index (GTDI) constructed in this study has more reliable consistency with single-type drought indices (SPEI and SSMI).
4.2.2 Comparison of the integrated weight of GTDI and ETDI
To contrast the weight allocation of SPEI and SSMI in creating the integrated drought indices (GTDI and ETDI), the spatial distribution of their weight ratios (SPEI SSMI) in the WRB is plotted, as shown in Fig. 5.
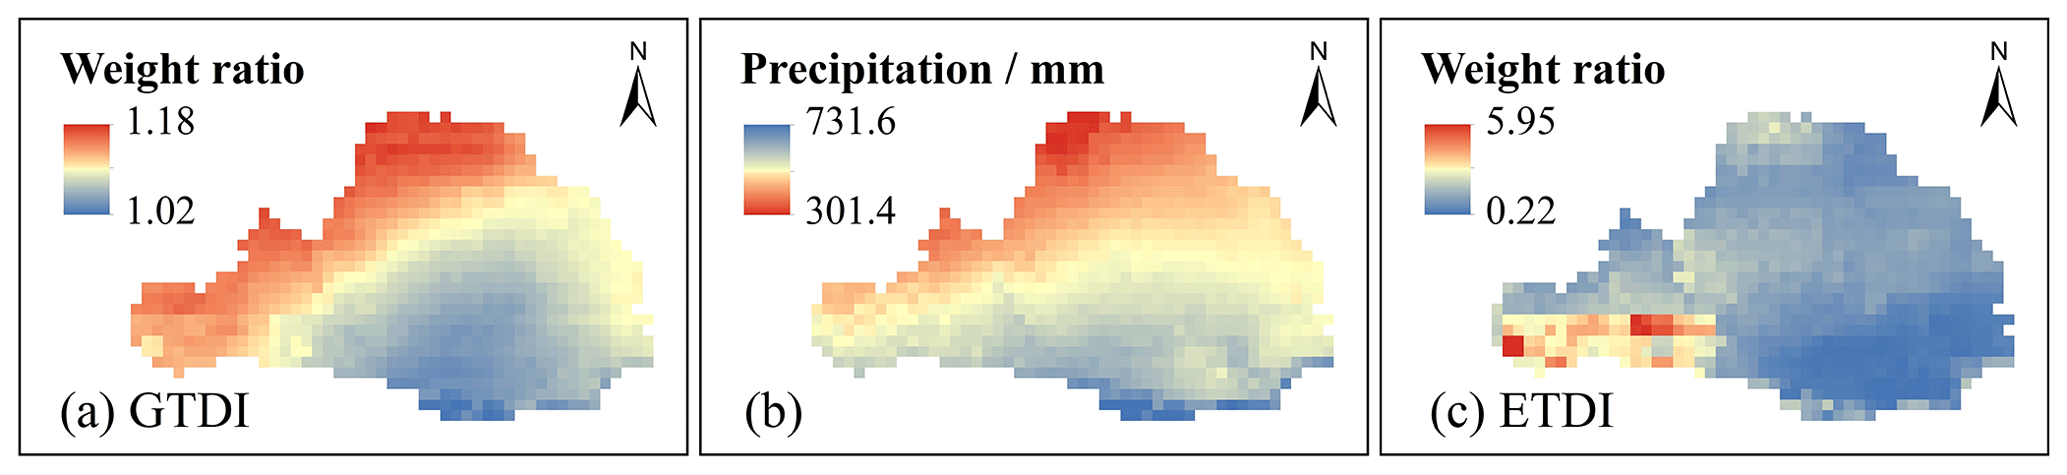
Figure 5Comparison of the integrated weights of GTDI and ETDI. Panels (a) and (c) demonstrate the spatial distribution of weight ratio (SPEI SSMI) in the construction process of GTDI and ETDI, respectively, and panel (b) is a spatial distribution map of the average annual precipitation in the Wei River basin.
GTDI, an integrated drought index constructed using the game theory method, exhibits a spatial distribution of the weight ratio (SPEI SSMI) that gradually decreases from northwest to southeast (Fig. 5a). Furthermore, the weight ratio in GTDI ranges from 1.02 to 1.18, showing a substantially balanced weight allocation between the hazard-causing index (SPEI) and the hazard-bearing index (SSMI). Meanwhile, the weight ratio of SPEI to SSMI is closer to 1 in places with greater precipitation (Fig. 5a and b). It is noteworthy that the change in weight ratio (SPEI SSMI) in GTDI closely resembles the spatial distribution pattern of the average annual precipitation in the WRB, as evidenced by a correlation coefficient of −0.88, indicating a significant negative relationship.
The entropy-theory-based drought index (ETDI), on the other hand, does not show a distinct spatial distribution pattern for the weight ratio of SPEI to SSMI. Its weight ratio greatly fluctuates between locations, ranging from 0.22 to 5.95 (Fig. 5c), implying that entropy theory fails to establish a consistently stable allocation of weights in the integrated drought index (ETDI) development process. Furthermore, the weight ratio (SPEI, SSMI) in ETDI has only a minor relationship with annual average precipitation, as evidenced by a correlation coefficient of only
As a consequence of comparing GTDI and ETDI, it was discovered that the game theory approach gives an integrated weight geographic distribution compatible with the precipitation-dominated natural drought pattern, which is essentially congruent with the drought generation mechanism in this basin. As a result, it is thought that the weighting of SPEI and SSMI in GTDI is more reasonable and reliable.
4.2.3 Efficacy verification in identifying drought
To further investigate the reliability of the integrated drought index (GTDI), the leaf area index (LAI) data are used to assess its efficacy in identifying drought, and the drought recognition performance of GTDI is evaluated by Eq. (8) and presented in Fig. 6. To compare, Fig. 7 depicts the spatial distribution of efficacy in recognizing drought using ETDI, SPEI, and SSMI, and Table 6 provides a statistical list of the efficacy ratios of four drought indices in different validation months.
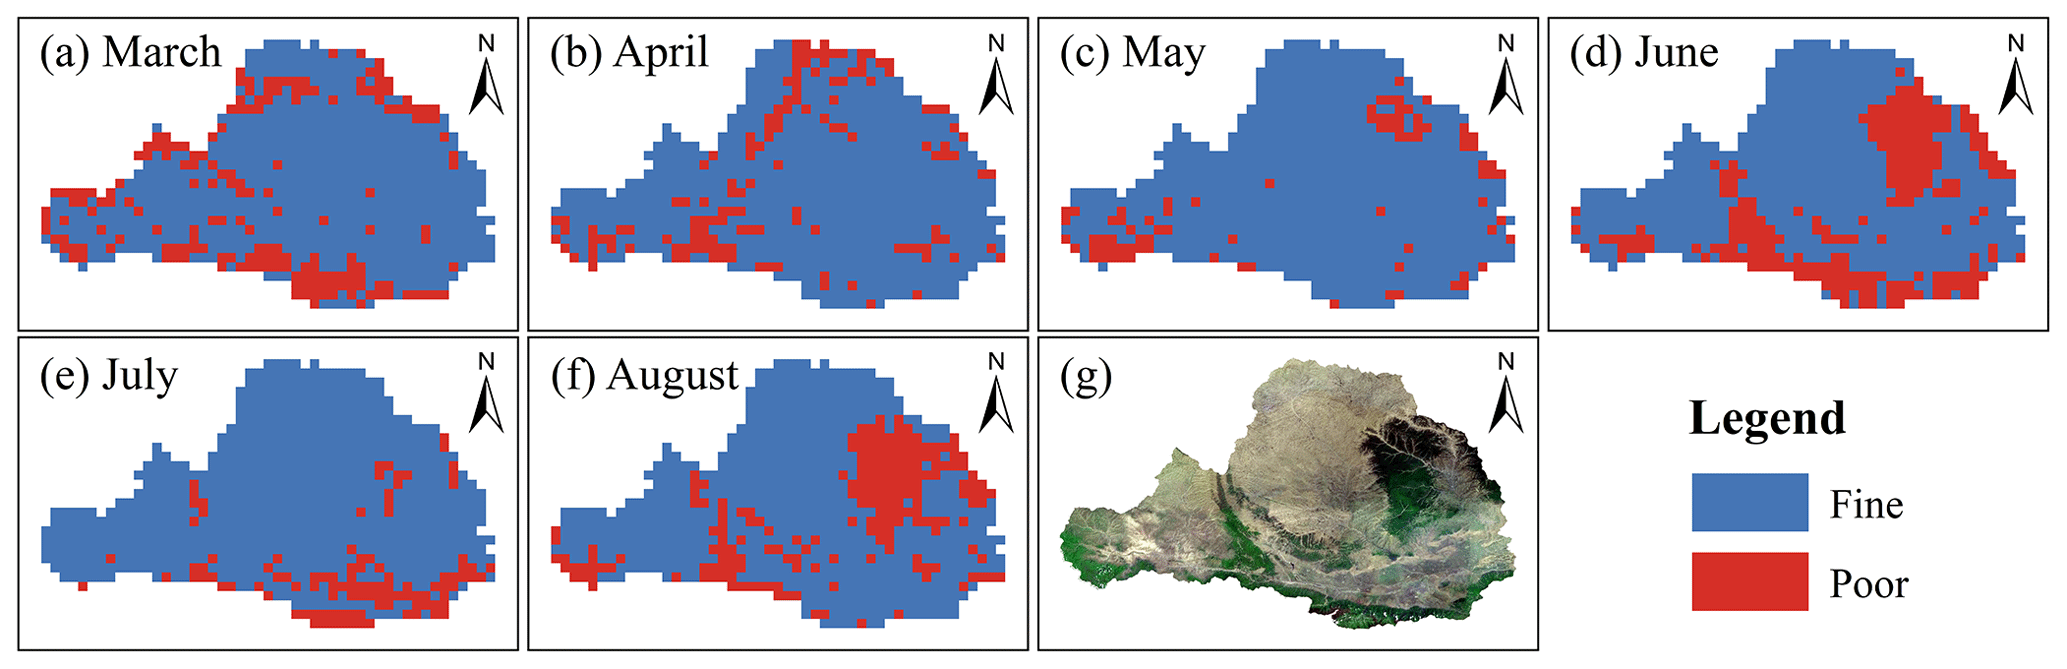
Figure 6The spatial distribution of GTDI's efficacy in identifying drought in the Wei River basin. Panels (a)–(f) depict the findings from March to August, and panel (g) displays a satellite image of the Wei River basin. “Fine” means that the drought index accurately captured the occurrence of drought, while “Poor” means that the drought index did not capture the occurrence of drought.
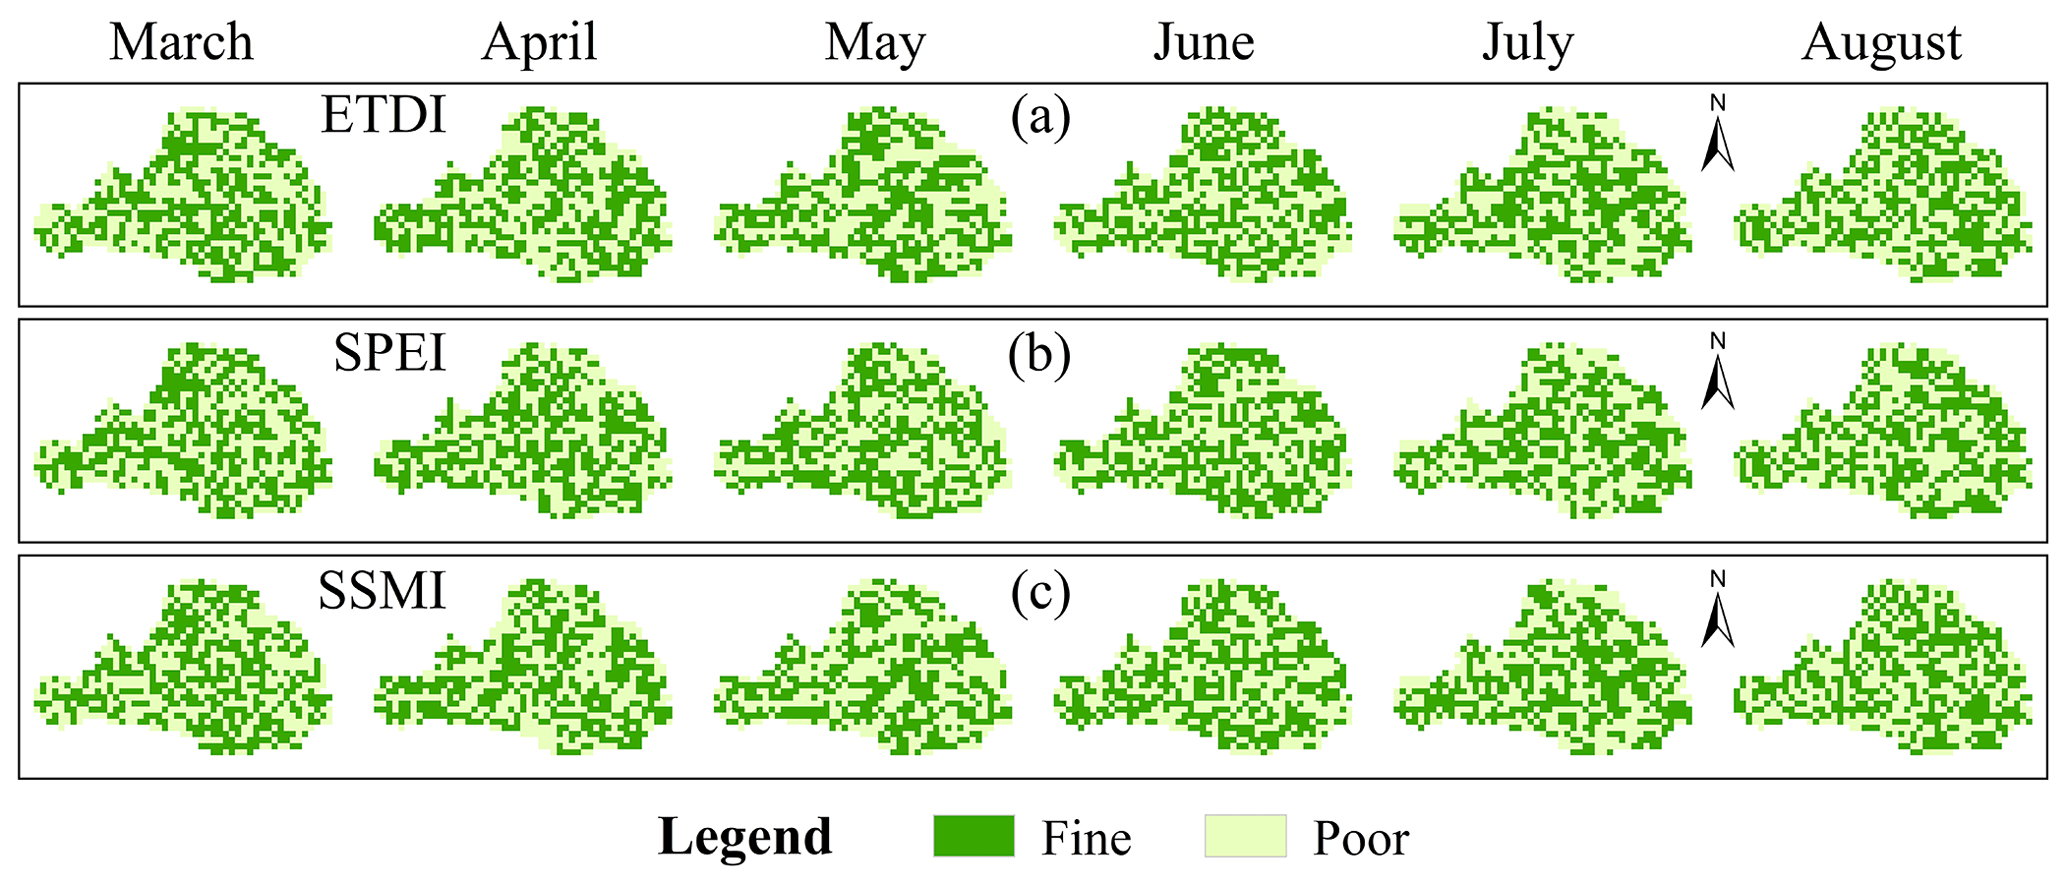
Figure 7The spatial distribution of efficacy in identifying drought of ETDI, SPEI and SSMI. “Fine” means that the drought index accurately captured the occurrence of drought, while “Poor” means that the drought index did not capture the occurrence of drought.
Table 6The efficacy ratios of four drought indices in different validation months.
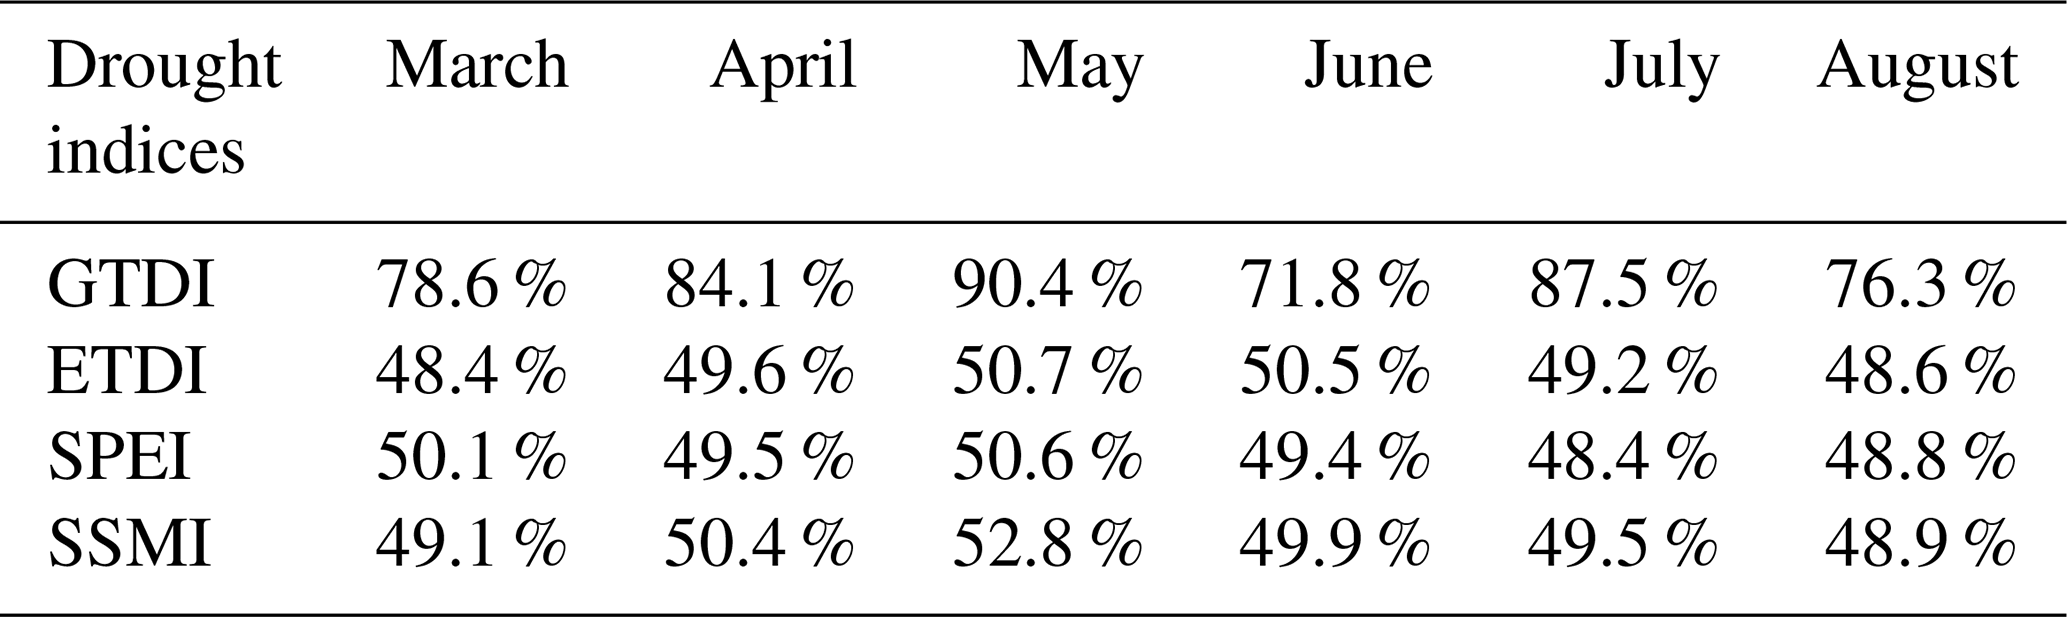
During the validation period from March to August, GTDI performs well in recognizing drought (Fig. 6), particularly in May, when it captures 90.28 % of the drought in the WRB (Table 6). GTDI, on the other hand, performs relatively badly in June (Fig. 6d) and August (Fig. 6f), with only 71.8 % and 76.3 % of effective recognition grid points, respectively (Table 6). In conjunction with Fig. 6g, it is discovered that the grid points with poor performance in June and August are concentrated in the forest area, which is the dark-green area in the WRB's northeast hinterland. As is widely known, forests have more access to deeper soil moisture than farming land and grassland (Xu et al., 2018; Bai et al., 2023), resulting in forests having higher drought tolerance than other terrestrial vegetation types (Jiang et al., 2020; Chen et al., 2022). However, the soil moisture data used in this study are only from 0 to 10 cm of the soil surface layer, which could explain why GTDI's drought diagnosis ability in the forest region is skewed. Even with the defect in forest regions, GTDI has exhibited strong drought monitoring capabilities in the WRB and can effectively capture the occurrence of drought.
In contrast to GTDI, the effectiveness of drought detection by ETDI, SPEI, and SSMI is geographically random and chaotic, as illustrated in Fig. 7. Furthermore, in all validation months, ETDI, SPEI, and SSMI only provide efficacy ratios of around 50 %, indicating a lack of significant usefulness in identifying drought (Table 6). As a result, when compared to ETDI, SPEI, and SSMI, it is clear that GTDI provides significant advantages in the field of drought monitoring. To summarize, GTDI does not simply combine the hazard-causing index (SPEI) and the hazard-bearing index (SSMI) like ETDI, but it can indeed capture drought occurrence in most areas, addressing the issue of single-type drought indices' insufficient responsiveness to actual drought events.
4.3 Comparison of temporal trajectories of drought identified by GTDI, SPEI, and SSMI
The drought identification trajectories of the integrated drought index (GTDI) and single-type drought indices (SPEI and SSMI) during the study period are depicted in Fig. 8. Out of the 850 months spanning March 1950 to December 2020, merely 345 months are devoid of any drought, accounting for approximately 40.6 % of the total, which contradicts our common understanding of drought incidents. Among the 505 dry months, 409 months experience agricultural drought (SSMI, 48.1 %), 356 months experience meteorological drought (SPEI, 41.9 %), and 260 months (30.6 %) experience both simultaneously. GTDI identifies just 308 arid months (36.2 %) out of 850 months, which is lower than SSMI and SPEI. According to the data presented above, agricultural drought has been the most common occurrence in the WRB over the last 70 years, followed by meteorological drought, with GTDI identifying the lowest number of drought months.
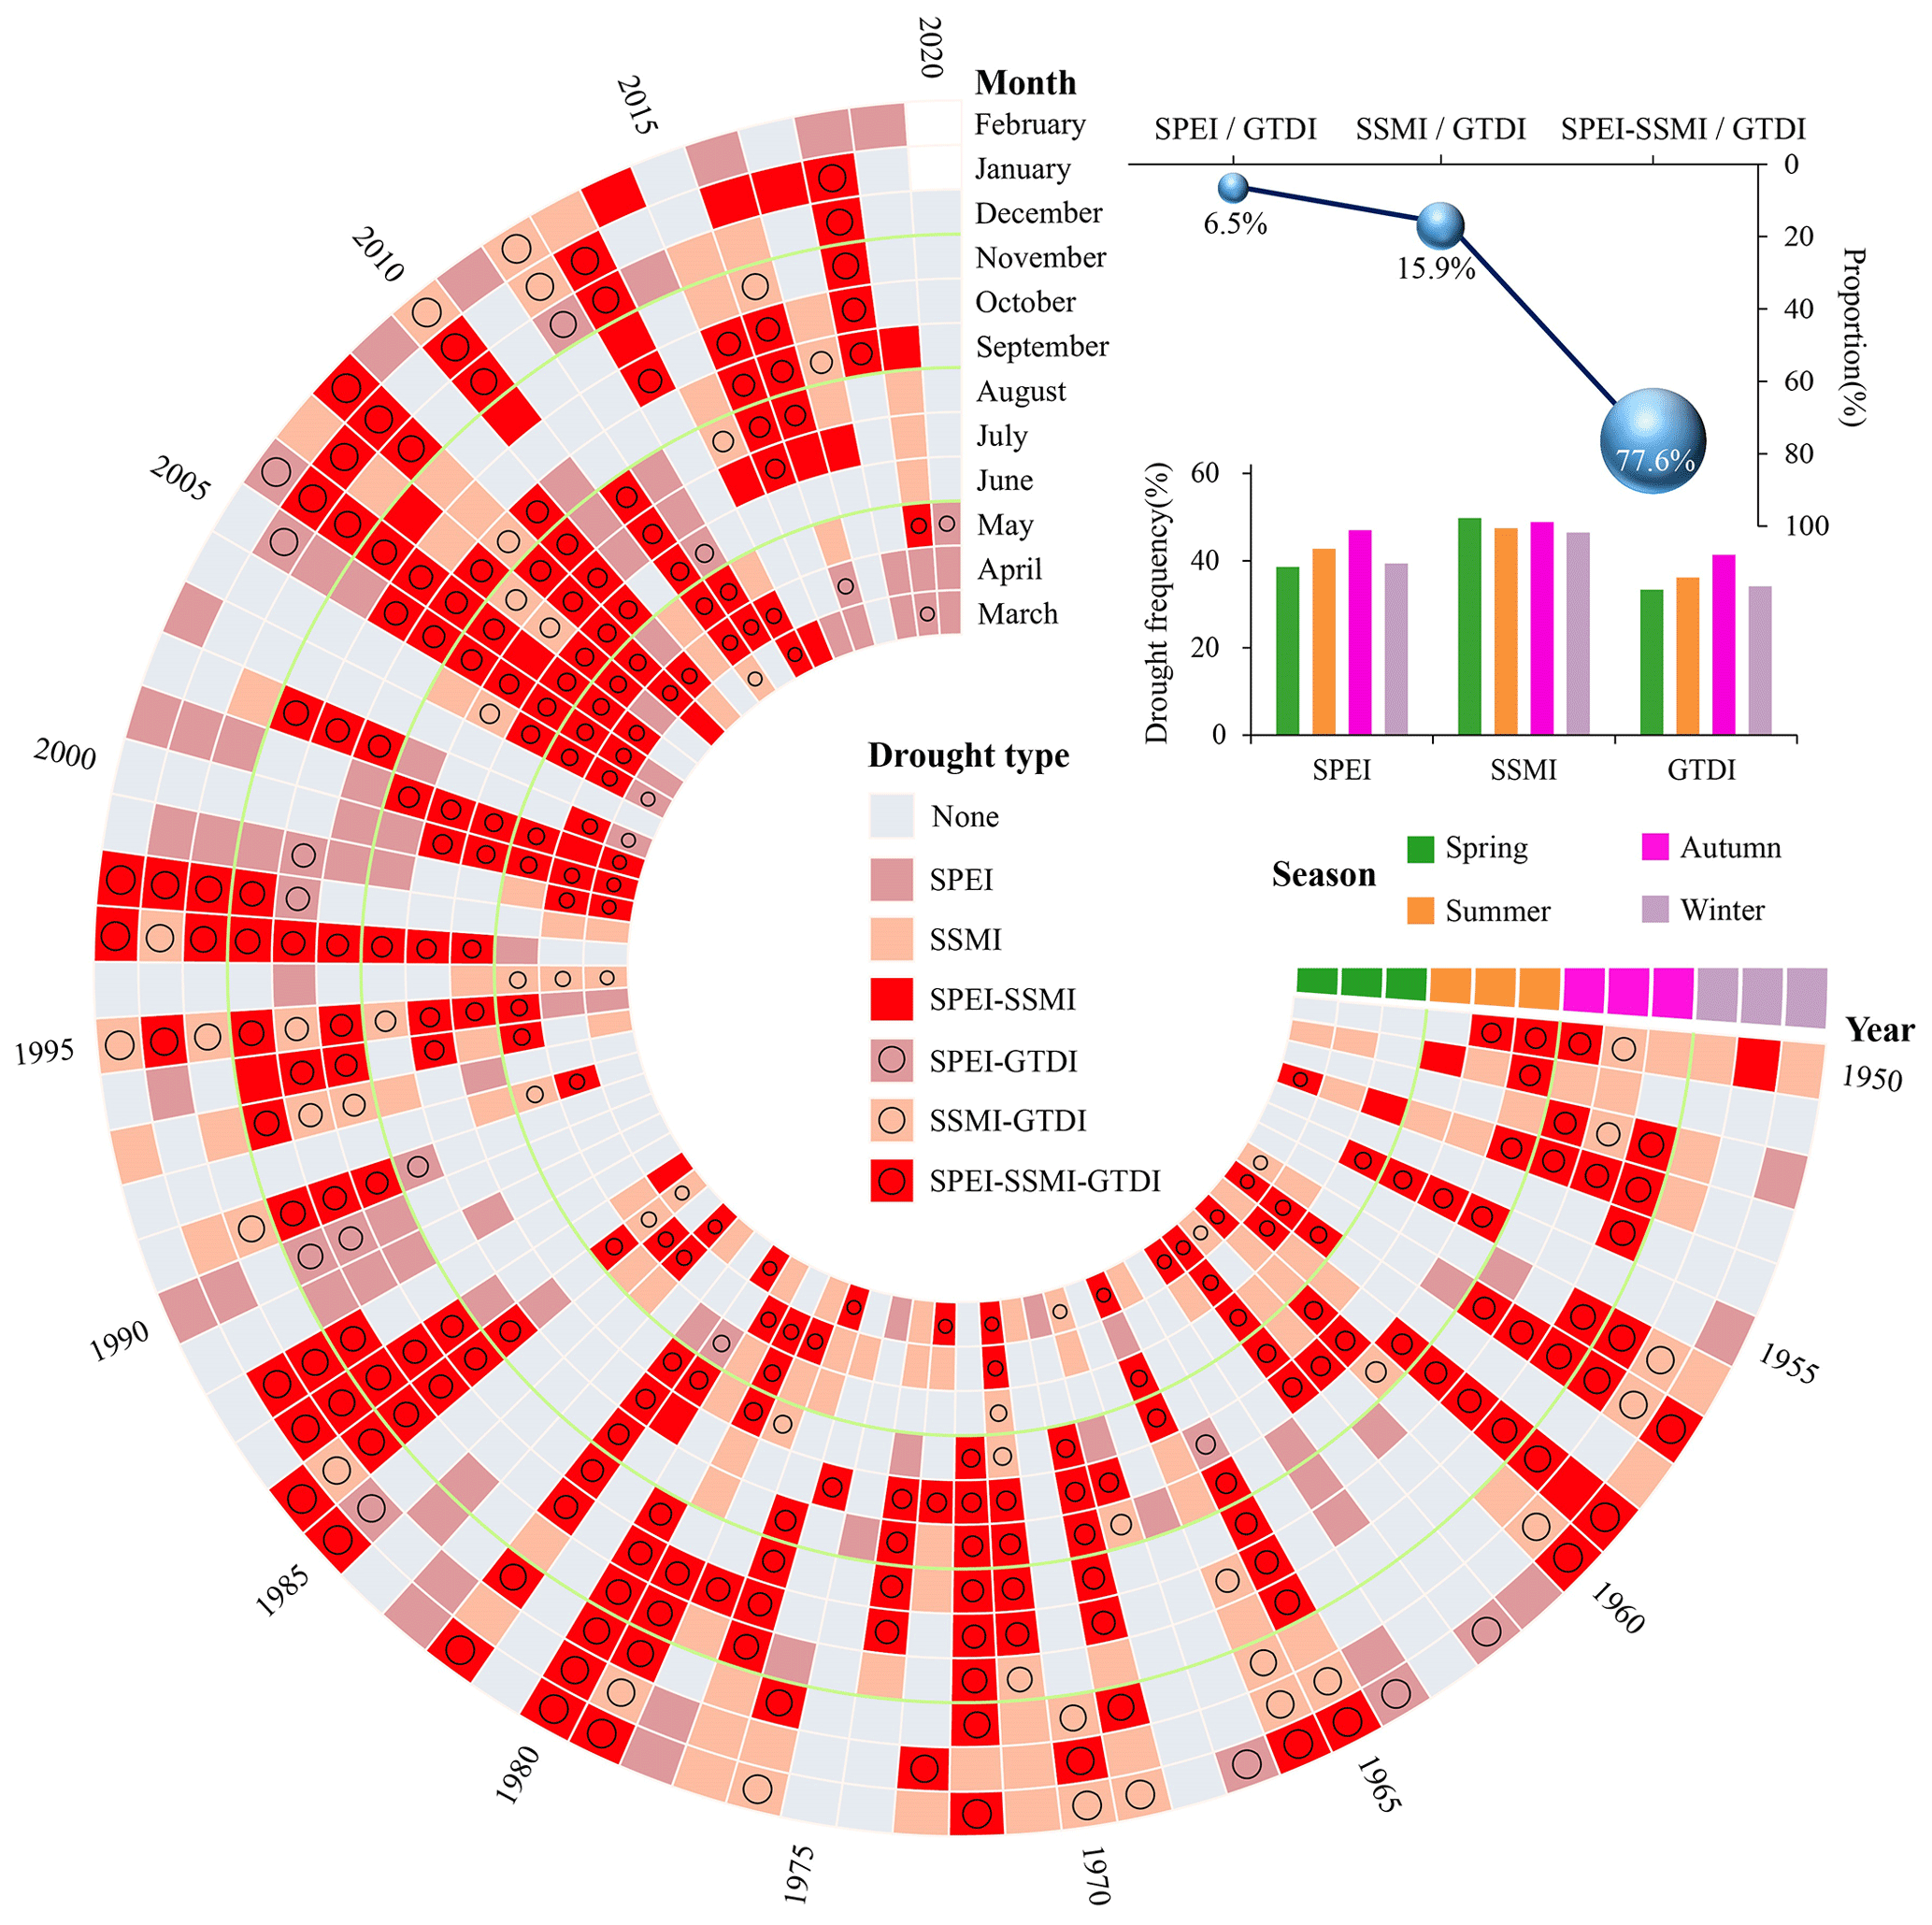
Figure 8Comparison of SPEI, SSMI, and GTDI in temporal drought trajectories. “SPEI-SSMI” means that it is recognized as a drought month by SPEI and SSMI simultaneously, and the other drought types are denoted similarly.
Out of the GTDI-identified drought months, the proportion of meteorological drought occurring alone is 6.5 % and the proportion of agricultural drought occurring alone is 15.9 %, possibly due to high temperatures, while the proportion of meteorological drought and agricultural drought occurring simultaneously is up to 77.6 %. Thus, it is clear that GTDI is closely related to the hazard-causing index (SPEI) and the hazard-bearing index (SSMI) and is caused by both in most cases. It corresponds to the general public's understanding of drought incidents. Furthermore, because it is calculated by weighting SPEI and SSMI, GTDI has an advantage in depicting the temporal gaming evolution of SPEI and SSMI. From the perspective of seasonal distribution, meteorological drought occurs most commonly in the summer and autumn, with a frequency of more than 40 %, but less frequently in the winter and spring. At the same time, agricultural drought (SSMI) occurs at a frequency of over 45 % in all seasons, with a very similar frequency in the four seasons. The seasonal allocation mode of drought identified by GTDI is similar to that of SPEI, with the similarity being that it occurs more frequently in summer and autumn than in winter and spring. However, the frequency of drought determined by SPEI is slightly higher than that determined by GTDI in each season.
The above explanation suggests that using SPEI, SSMI, and GTDI for monthly-scale drought identification may result in various drought trajectories. Meanwhile, GTDI is a hybrid of the hazard-causing index (SPEI) and the hazard-bearing index (SSMI), as it has a higher overlap with SSMI in terms of drought trajectory, implying changes in the hazard-bearing body during the dry period, while being closer to SPEI in terms of drought seasonal allocation, responding to the fluctuation in hazard-causing factors. When paired with the GTDI reliability analysis in Sect. 4.2, it is concluded that the occurrence of drought events in the Wei River basin is still dominated by precipitation deficiency, as the region is located in a dry location with low rainfall.
4.4 Comparison of the spatial evolution of drought events identified by GTDI, SPEI, and SSMI
To explore the spatial development process of drought occurrences recognized by GTDI, SPEI, and SSMI while eliminating the randomness of a single event, we selected three drought events that lasted for a duration of 5 months for spatial evolution analysis. Figure 9 shows the spatial evolution processes of three drought events identified by GTDI, SPEI, and SSMI, spanning June to October 1982, March to July 2000, and September 2018 to January 2019, respectively. Table 7 shows the drought intensity and the percentage of drought area for each month of the three drought events.
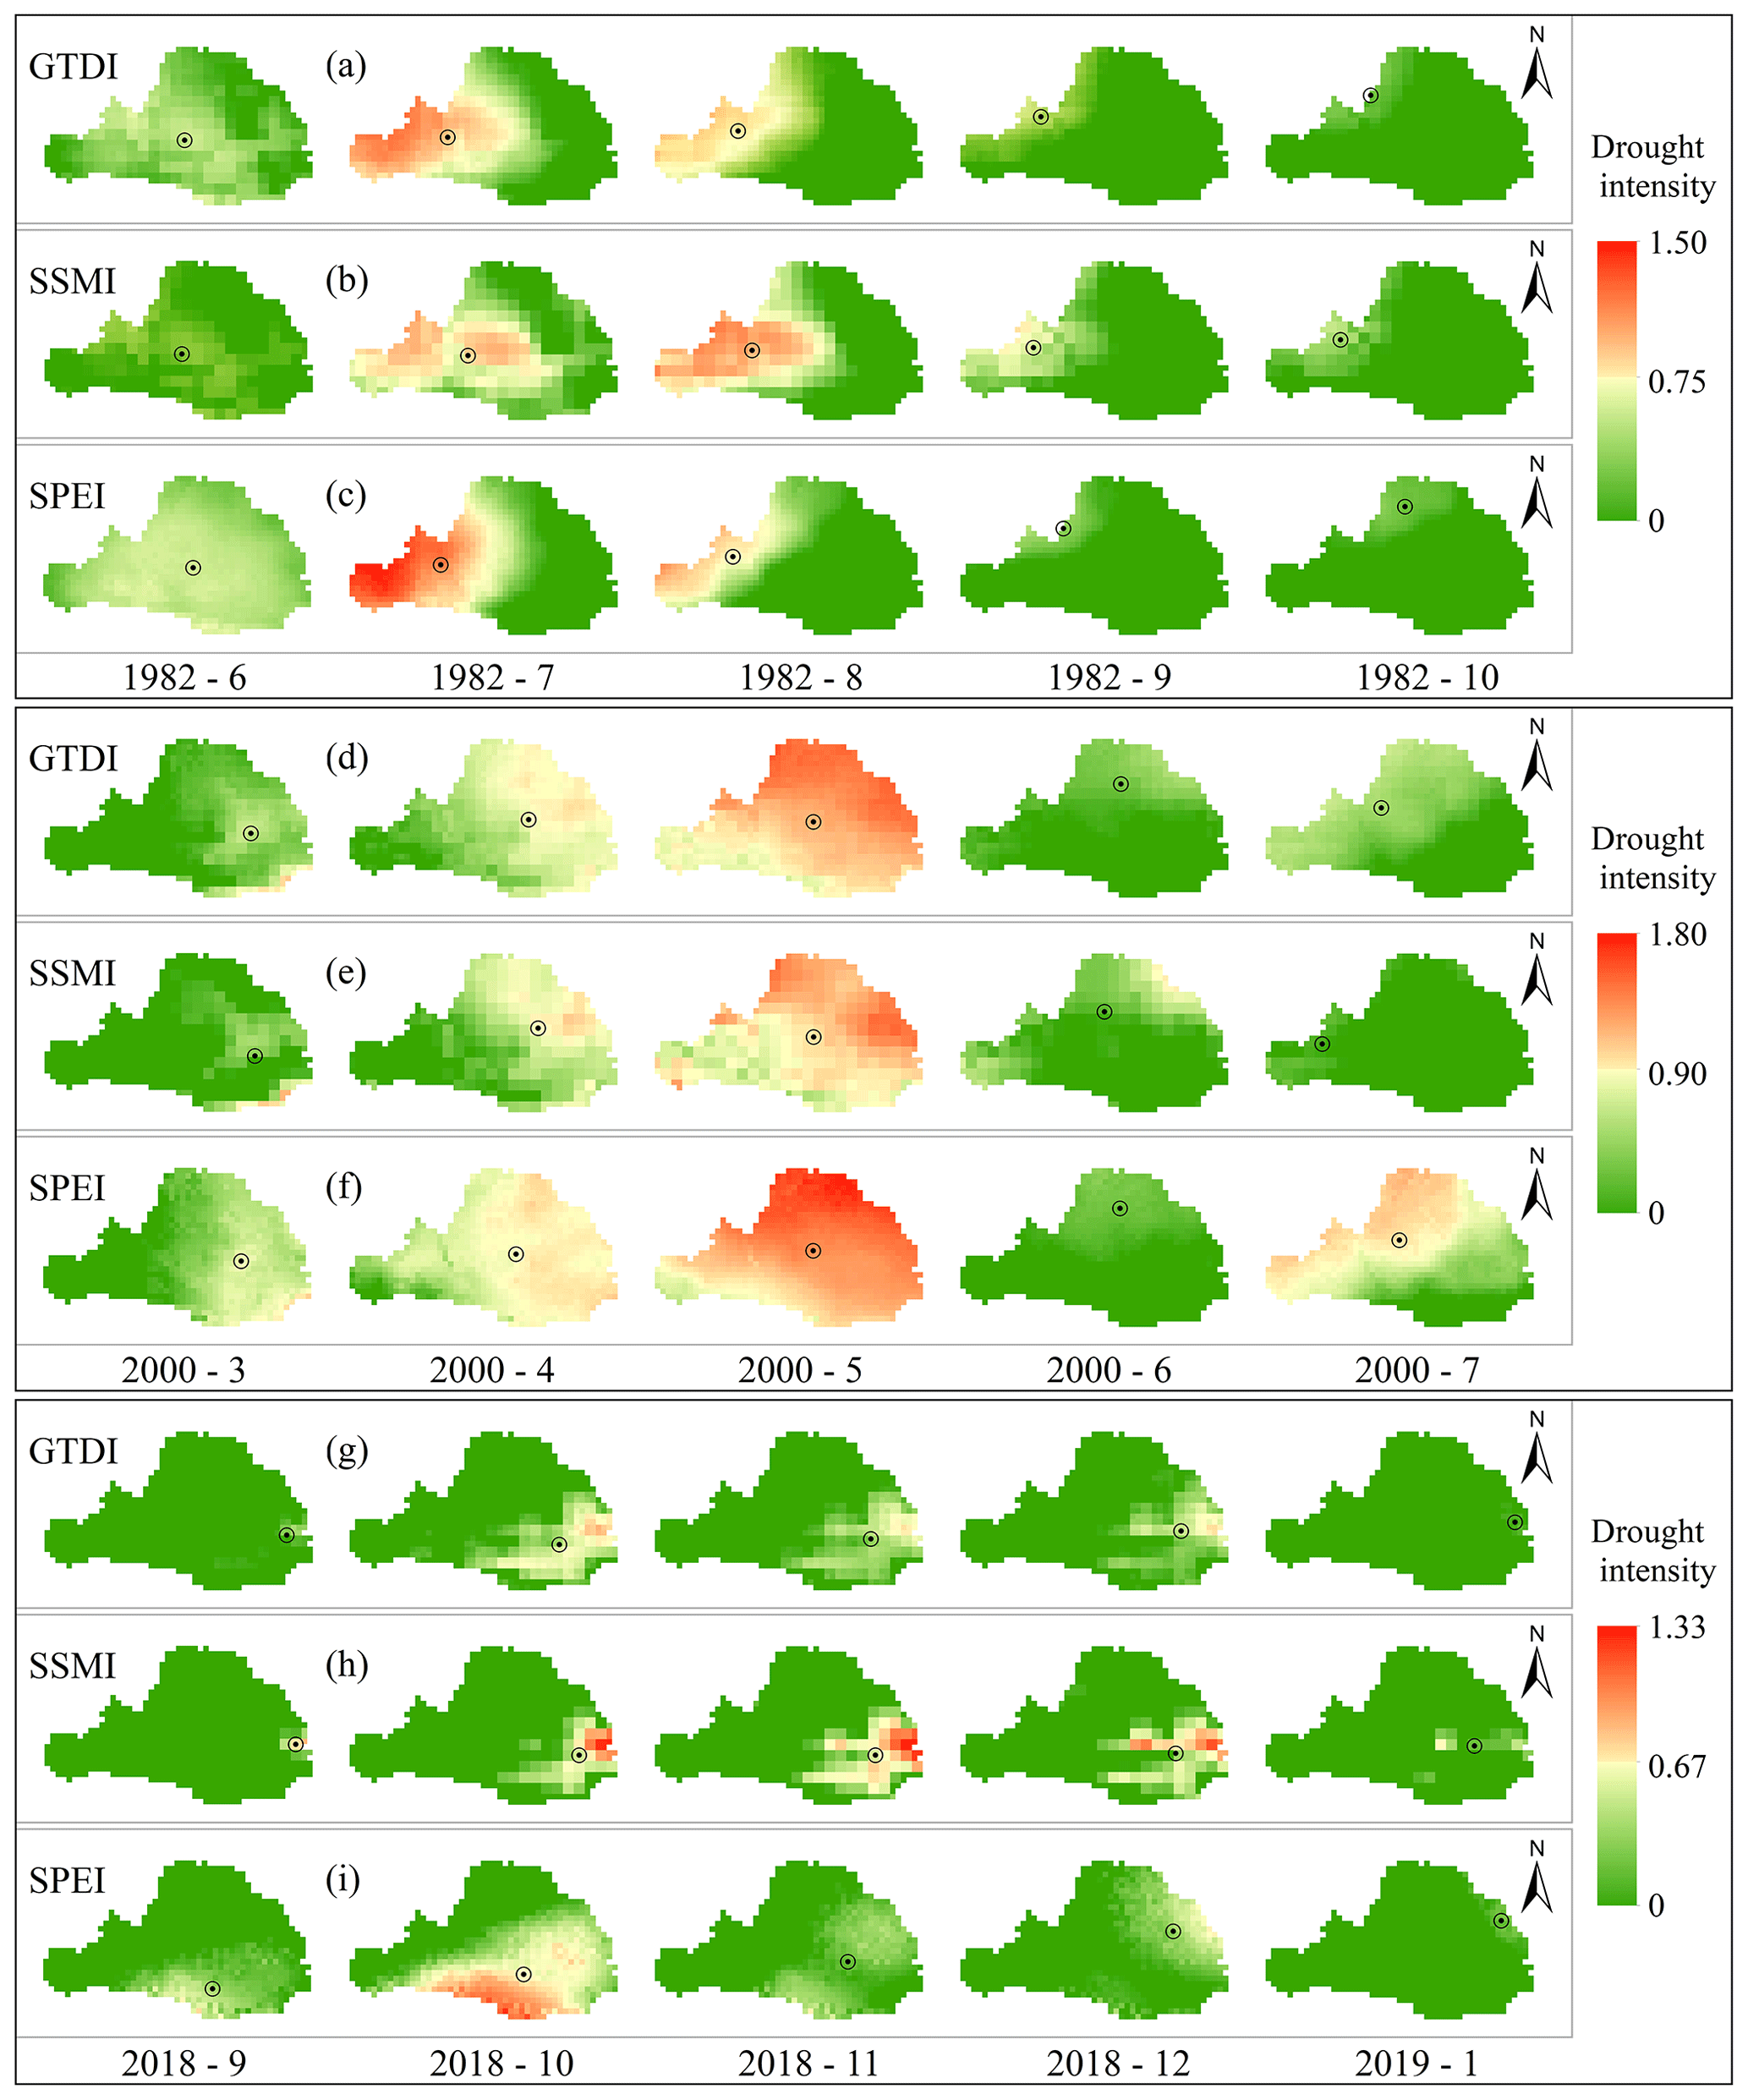
Figure 9Comparison of SPEI, SSMI, and GTDI in terms of the spatial evolution of three drought events. The black circle denotes the monthly drought centroid. The time format is given as the year followed by the month.
Table 7Comparison of SPEI, SSMI, and GTDI in terms of drought intensity and percentage of drought area during three drought events.
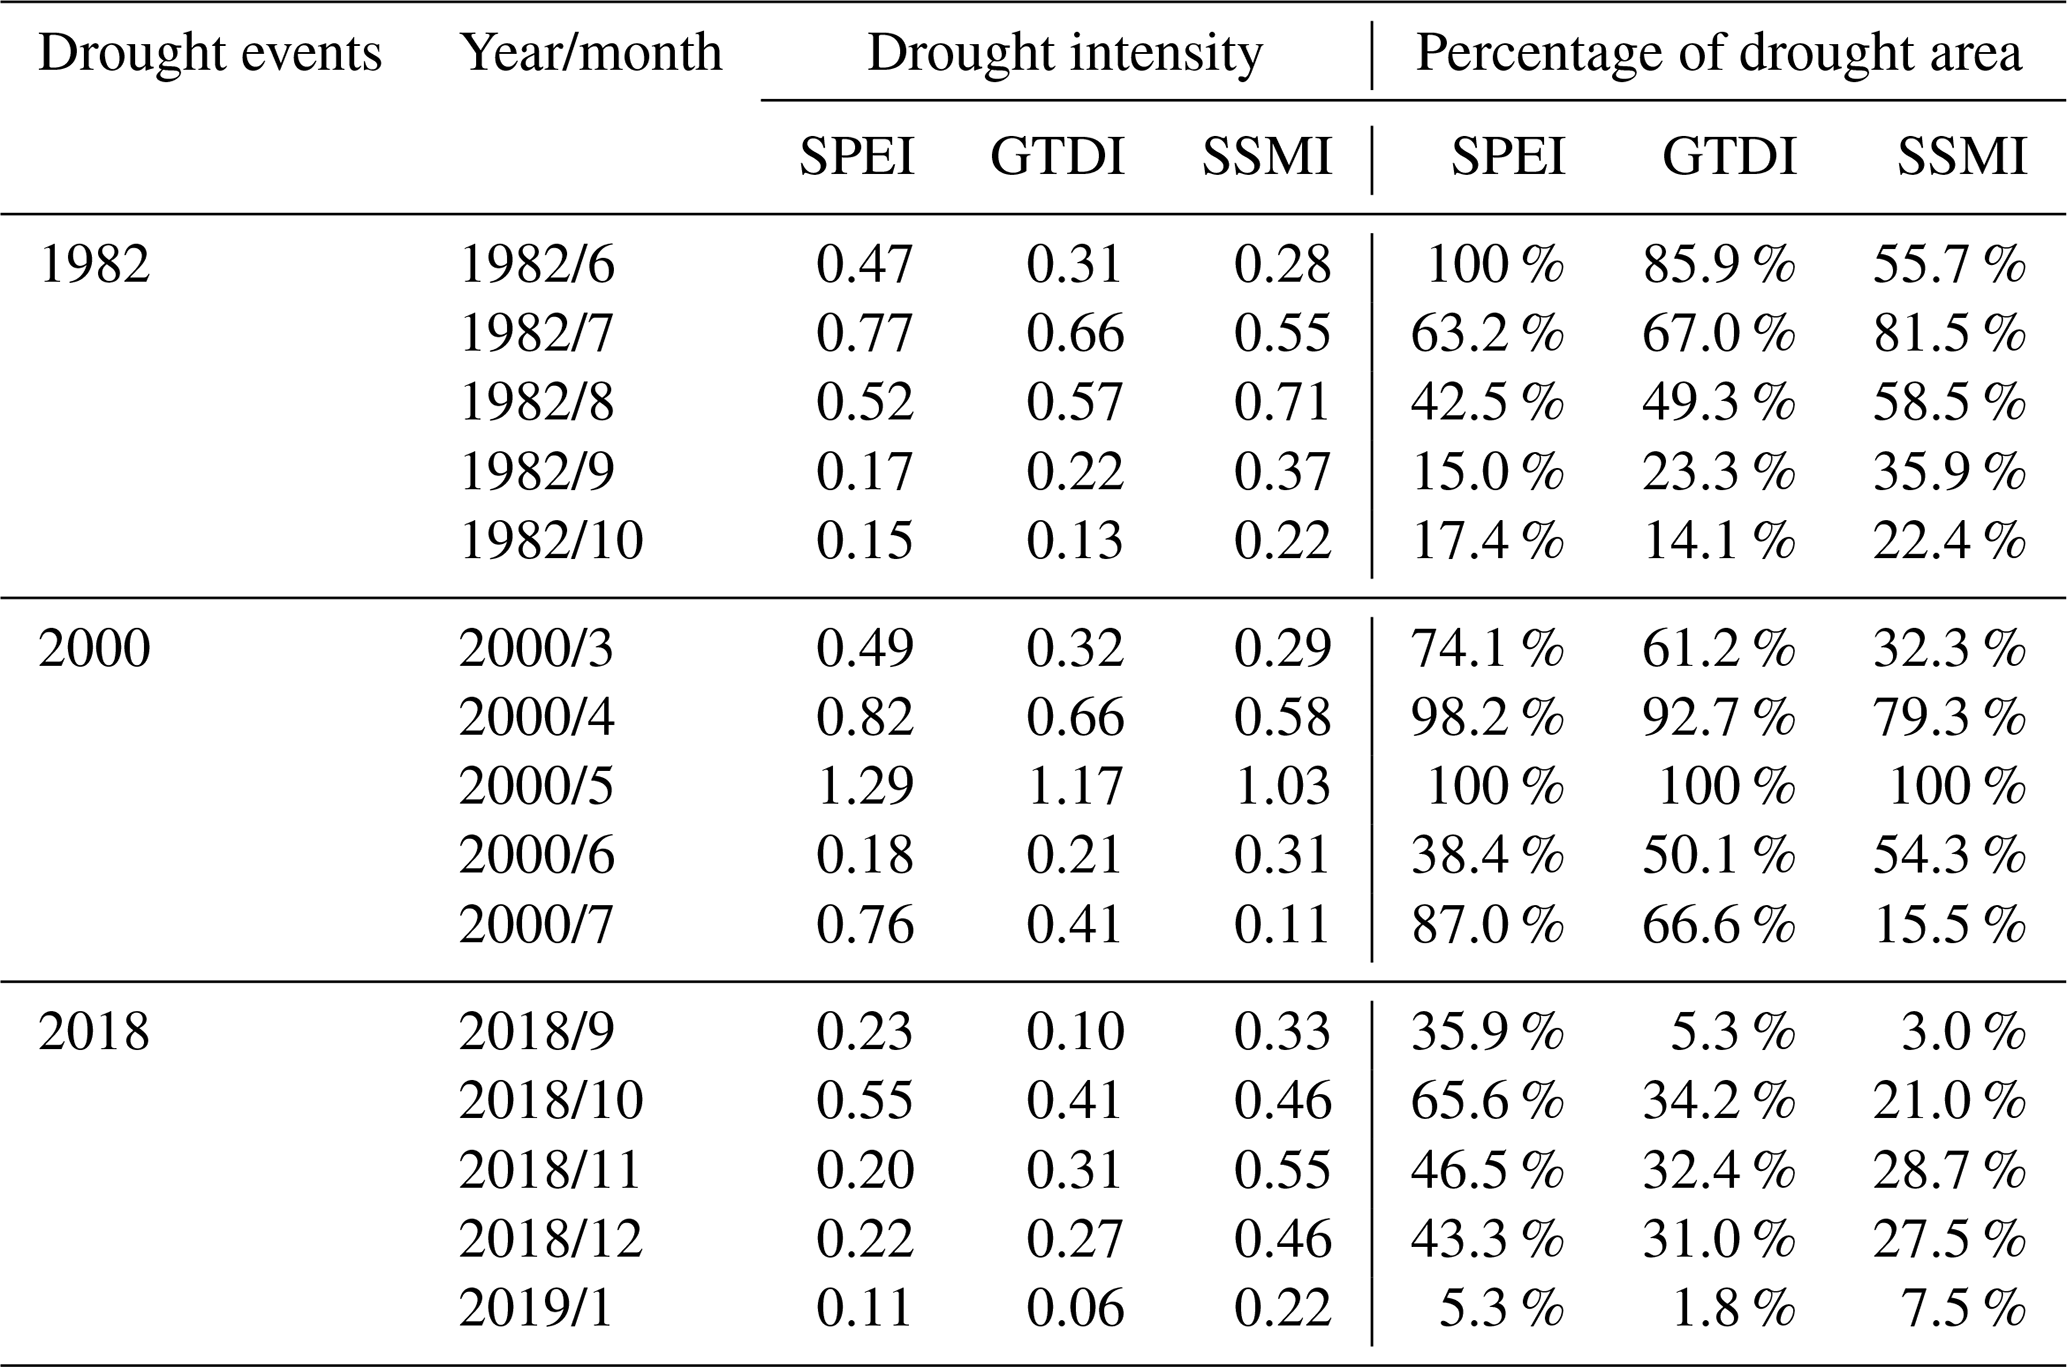
Taking the 1982 drought event as an example, the meteorological drought emerges initially, followed by a steady decrease in its impact areas (Fig. 9c). However, the overall drought intensity increases and subsequently decreases (Table 7), and the drought centroid migrates from the WRB's center to the northwest. It is worth noting that concurrent agricultural drought lags behind meteorological drought. When comparing the drought geographic evolution processes identified by SSMI and SPEI (Fig. 9b and c), the lag period is approximately 1 month, which is similarly observed in the other two drought events (Fig. 9d–i). For the entire spatial evolution process of a drought event identified by GTDI, it is clear that its spatial pattern is the result of a compromise between SPEI and SSMI, including the migration path of the drought centroid (Fig. 9a–c), the evolution process of drought area percentage, and drought intensity (Table 7).
From March to July 2000, the WRB experienced a fully covered drought event (Fig. 9d–f), which began with a meteorological drought. The fusion description of SPEI and SSMI produced by GTDI during this event, which incorporates the spatial evolution trends of SPEI and SSMI to evaluate the current drought status at each grid point, may be observed. The value of GTDI consistently falls between SPEI and SSMI, regardless of whether it is evaluated by the drought area ratio, drought intensity, or drought centroid.
The 2018 drought event is the mildest of the three, but it most fully depicts the process of a drought event from emergence to spread to eventual extinction (Fig. 9g–i). In the early stages of this drought event, in October 2018, the meteorological drought in the southeastern part of the WRB was the most severe, whilst the agricultural drought was relatively negligible. In this case, the spatial drought pattern determined by GTDI was closer to the development of the hazard-causing index (SPEI). However, during the later stages of the drought event, the situation reversed and the spatial evolution of drought began to be dominated by the hazard-bearing index (SSMI), illustrating GTDI possesses more realistic and intelligent features for performing drought identification. This also demonstrates the importance of including game theory in this study, which has a distinct benefit in monitoring changes in hazard-causing and hazard-bearing impacts.
Based on the foregoing text, it is worth noting that the GTDI-identified spatial drought process combines the evolutionary features of hazard-causing and hazard-bearing indices (SPEI and SSMI). Merging SPEI and SSMI via their game relationship, rather than simply putting them together, makes GTDI a superior technique for representing the spatial and temporal evolution of droughts. Furthermore, it has been discovered that GTDI exhibits the gaming feature of the drought hazard-causing and hazard-bearing index. This is evidenced by the fact that the hazard-causing index (SPEI) primarily drives the early stages of drought events in the WRB, while the hazard-bearing index (SSMI) primarily drives the later stages.
This study integrated the SPEI (meteorological index and drought hazard-causing index) and SSMI (agricultural index and drought hazard-bearing index) to propose a game-theory-based drought index (GTDI). The integration performance and weight allocation of GTDI were demonstrated by evaluating the correlations with SPEI and SSMI and comparing the integrated weight to ETDI (entropy-theory-based drought index); the reliability of GTDI was confirmed by the leaf area index (LAI) data; and the GTDI level of advancement was examined by contrasting the temporal trajectories and spatial evolution characteristics of GTDI, SPEI, and SSMI. The following text lists our primary conclusions.
The single-type drought indices (SPEI and SSMI) and the integrated drought index (GTDI) exhibit dependable spatial consistency. The entropy-theory-based drought index (ETDI) performs worse than GTDI, particularly when it comes to the regional distribution of correlation coefficient homogeneity. Specially, the game theory technique provides an integrated weight geographic distribution in the integrated index (GTDI) that is consistent with the precipitation-dominated natural drought pattern, as there is a strong negative spatial relationship between the weight ratio of SPEI to SSMI and the average annual precipitation in the Wei River basin. ETDI, on the other hand, has a very weak connection with the annual mean precipitation. This indicates that GTDI's weight allocation of SPEI and SSMI is more logical and trustworthy.
GTDI has superior efficacy for identifying drought when compared to ETDI, SPEI, and SSMI, as GTDI efficiently captures drought with an efficacy ratio of over 70 % in all validation months, whereas ETDI, SPEI, and SSMI catch it with an efficacy ratio of approximately 50 %. Thus, GTDI is expected to replace single-type drought indices to provide a more accurate portrayal of actual drought.
GTDI merges SPEI and SSMI via their game relationship rather than simply putting them together, making it a superior technique for representing the spatial and temporal evolution of droughts. In particular, it has a higher overlap with SSMI in terms of drought trajectory, implying changes in the hazard-bearing body during the dry period, while it is closer to SPEI in terms of drought seasonal allocation, responding to the fluctuation in hazard-causing factors.
Additionally, it has been discovered that GTDI exhibits the gaming feature of the drought hazard-causing and hazard-bearing index, having a distinct benefit in monitoring changes in their impacts. The hazard-causing index (SPEI) dominates the early stages of a drought event, whereas the hazard-bearing index (SSMI) dominates the later stages.
The data required to reproduce the analysis in this paper are available upon request.
The supplement related to this article is available online at: https://doi.org/10.5194/nhess-24-3479-2024-supplement.
Conceptualization: HZ; methodology: XZ and TY; investigation: XZ; data curation: YZ, ZYa, and ZYe; writing – original draft preparation: XZ; writing – review and editing: TiL and ToL; project administration: HZ; funding acquisition: HZ; supervision: HZ; visualization: CX. All authors have read and agreed to the published version of the paper.
The contact author has declared that none of the authors has any competing interests.
Publisher's note: Copernicus Publications remains neutral with regard to jurisdictional claims made in the text, published maps, institutional affiliations, or any other geographical representation in this paper. While Copernicus Publications makes every effort to include appropriate place names, the final responsibility lies with the authors.
This article is part of the special issue “Drought, society, and ecosystems (NHESS/BG/GC/HESS inter-journal SI)”. It is not associated with a conference.
Our cordial thanks are extended to the editor and anonymous reviewers for their pertinent and professional suggestions and comments, which were very helpful for further improvement to the quality of this paper.
This research has been supported by the National Natural Science Foundation of China (grant no. 51979005), the Natural Science Basic Research Program of Shaanxi Province (grant no. 2022JC-LHJJ-03), and the Fundamental Research Funds for the Central Universities (grant no. 300102293201).
This paper was edited by Shreedhar Maskey and reviewed by four anonymous referees.
Agbo, E. P., Nkajoe, U., and Edet, C. O.: Comparison of Mann–Kendall and Şen's innovative trend method for climatic parameters over Nigeria's climatic zones, Clim. Dynam., 60, 3385–3401, https://doi.org/10.1007/s00382-022-06521-9, 2023.
AghaKouchak, A., Huning, L. S., Sadegh, M., Qin, Y., Markonis, Y., Vahedifard, F., Love, C. A., Mishra, A., Mehran, A., Obringer, R., Hjelmstad, A., Pallickara, S., Jiwa, S., Hanel, M., Zhao, Y., Pendergrass, A. G., Arabi, M., Davis, S. J., Ward, P. J., Svoboda, M., Pulwarty, R., and Kreibich, H.: Toward impact-based monitoring of drought and its cascading hazards, Nat. Rev. Earth Environ., 4, 582–595, https://doi.org/10.1038/s43017-023-00457-2, 2023.
Bai, Y., Liu, M., Guo, Q., Wu, G., Wang, W., and Li, S.: Diverse responses of gross primary production and leaf area index to drought on the Mongolian Plateau, Sci. Total Environ., 902, 166507, https://doi.org/10.1016/j.scitotenv.2023.166507, 2023.
Batabyal, A. A. and Beladi, H.: A game-theoretic model of water theft during a drought, Agr. Water Manage., 255, 107044, https://doi.org/10.1016/j.agwat.2021.107044, 2021.
Berg, A. and Sheffield, J.: Climate change and drought: the soil moisture perspective, Curr. Clim. Chang. Rep., 4, 180–191, https://doi.org/10.1007/s40641-018-0095-0, 2018.
Blauhut, V., Stahl, K., Stagge, J. H., Tallaksen, L. M., De Stefano, L., and Vogt, J.: Estimating drought risk across Europe from reported drought impacts, drought indices, and vulnerability factors, Hydrol. Earth Syst. Sci., 20, 2779–2800, https://doi.org/10.5194/hess-20-2779-2016, 2016.
Bock, A. D., Belmans, B., Vanlanduit, S., Blom, J., Alvarado-Alvarado, A. A., and Audenaert, A.: A review on the leaf area index (LAI) in vertical greening systems, Build. Environ., 229, 109926, https://doi.org/10.1016/j.buildenv.2022.109926, 2023.
Cai, Y., Zhang, F., Duan, P., Jim, C. Y., Chan, N. W., Shi, J., Liu, C., Wang, J., Bahtebay, J., and Ma, X.: Vegetation cover changes in China induced by ecological restoration-protection projects and land-use changes from 2000 to 2020, Catena, 217, 106530, https://doi.org/10.1016/j.catena.2022.106530, 2022.
Chang, J., Li, Y., Wang, Y., and Yuan, M.: Copula-based drought risk assessment combined with an integrated index in the Wei River Basin, China, J. Hydrol., 540, 824–834, https://doi.org/10.1016/j.jhydrol.2016.06.064, 2016.
Chen, Q., Timmermans, J., Wen, W., and van Bodegom, P. M.: A multi-metric assessment of drought vulnerability across different vegetation types using high resolution remote sensing, Sci. Total Environ., 832, 154970, https://doi.org/10.1016/j.scitotenv.2022.154970, 2022.
Dai, A.: Drought under global warming: a review, WIRes Clim. Change, 2, 45–65, https://doi.org/10.1002/wcc.81, 2011.
Dai, A.: Increasing drought under global warming in observations and models, Nat. Clim. Change, 3, 52–58, https://doi.org/10.1038/nclimate1633, 2013.
Deng, C. L., She, D. X., Zhang, L. P., Zhang, Q., Liu, X., and Wang, S. X.: Characteristics of drought events using three-dimensional graph connectedness recognition method in the Yangtze River Basin, China, Trans. Chin. Soc. Agric. Eng., 37, 131–139, 2021.
Ding, Y., Gong, X., Xing, Z., Cai, H., Zhou, Z., Zhang, D., Sun, P., and Shi, H.: Attribution of meteorological, hydrological and agricultural drought propagation in different climatic regions of China, Agr. Water Manage., 255, 106996, https://doi.org/10.1016/j.agwat.2021.106996, 2021.
Fang, H., Baret, F., Plummer, S., and Schaepman-Strub, G.: An overview of global leaf area index (LAI): Methods, products, validation, and applications, Rev. Geophys., 57, 739–799, https://doi.org/10.1029/2018RG000608, 2019.
Feng, K., Yan, Z., Li, Y., Wang, F., Zhang, Z., Su, X., Wu, H., Zhang, G., and Wang, Y.: Spatio-temporal dynamic evaluation of agricultural drought based on a three-dimensional identification method in Northwest China, Agr. Water Manage., 284, 108325, https://doi.org/10.1016/j.agwat.2023.108325, 2023.
Hao, Z. and AghaKouchak, A.: Multivariate standardized drought index: a parametric multi-index model, Adv. Water Resour., 57, 12–18, https://doi.org/10.1016/j.advwatres.2013.03.009, 2013.
Huang, F., Liu, L., Gao, J., Yin, Z., Zhang, Y., Jiang, Y., and Fang, W.: Effects of extreme drought events on vegetation activity from the perspectives of meteorological and soil droughts in southwestern China, Sci. Total Environ., 903, 166562, https://doi.org/10.1016/j.scitotenv.2023.166562, 2023.
Huang, J., Yu, H., Guan, X., Wang, G., and Guo, R.: Accelerated dryland expansion under climate change, Nat. Clim. Change, 6, 166–171, https://doi.org/10.1038/nclimate2837, 2016.
Huang, S., Chang, J., Leng, G., and Huang, Q.: Integrated index for drought assessment based on variable fuzzy set theory: a case study in the Yellow River basin, China, J. Hydrol., 527, 608–618, https://doi.org/10.1016/j.jhydrol.2015.05.032, 2015.
Jato-Espino, D. and Ruiz-Puente, C.: Bringing Facilitated Industrial Symbiosis and Game Theory together to strengthen waste exchange in industrial parks, Sci. Total Environ., 771, 145400, https://doi.org/10.1016/j.scitotenv.2021.145400, 2021.
Jiang, W., Wang, L., Feng, L., Zhang, M., and Yao, R.: Drought characteristics and its impact on changes in surface vegetation from 1981 to 2015 in the Yangtze River Basin, China, Int. J. Climatol., 40, 3380–3397, https://doi.org/10.1002/joc.6403, 2020.
Khorshidi, M. S., Nikoo, M. R., Sadegh, M., and Nematollahi, B.: A multi-objective risk-based game theoretic approach to reservoir operation policy in potential future drought condition, Water Resour. Manag., 33, 1999–2014, https://doi.org/10.1007/s11269-019-02223-w, 2019.
Labudová, L., Labuda, M., and Takáč, J.: Comparison of SPI and SPEI applicability for drought impact assessment on crop production in the Danubian Lowland and the East Slovakian Lowland, Theor. Appl. Climatol., 128, 491–506, https://doi.org/10.1007/s00704-016-1870-2, 2017.
Lai, C., Chen, X., Chen, X., Chen, X., Wang, Z., Wu, X., and Zhao, S.: A fuzzy comprehensive evaluation model for flood risk based on the combination weight of game theory, Nat. Hazards, 77, 1243–1259, https://doi.org/10.1007/s11069-015-1645-6, 2015.
Leng, G., Tang, Q., and Rayburg, S.: Climate change impacts on meteorological, agricultural and hydrological droughts in China, Global Planet. Change, 126, 23–34, https://doi.org/10.1016/j.gloplacha.2015.01.003, 2015.
Li, G., Sun, S., Han, J., Yan, J., Liu, W., Wei, Y., Lu, N., and Sun, Y.: Impacts of Chinese Grain for Green program and climate change on vegetation in the Loess Plateau during 1982–2015, Sci. Total Environ., 660, 177–187, https://doi.org/10.1016/j.scitotenv.2019.01.028, 2019.
Li, L., She, D., Zheng, H., Lin, P., and Yang, Z.: Elucidating diverse drought characteristics from two meteorological drought indices (SPI and SPEI) in China, J. Hydrometeorol., 21, 1513–1530, https://doi.org/10.1175/JHM-D-19-0290.1, 2020.
Li, W., Migliavacca, M., Forkel, M., Denissen, J. M. C., Reichstein, M., Yang, H., Duveiller, G., Weber, U., and Orth, R.: Widespread increasing vegetation sensitivity to soil moisture, Nat. Commun., 13, 3959, https://doi.org/10.1038/s41467-022-31667-9, 2022.
Liu, B., Huang, J. J., McBean, E., and Li, Y.: Risk assessment of hybrid rain harvesting system and other small drinking water supply systems by game theory and fuzzy logic modeling, Sci. Total Environ., 708, 134436, https://doi.org/10.1016/j.scitotenv.2019.134436, 2020.
Liu, Y., Liu, R., and Chen, J. M.: Retrospective retrieval of long-term consistent global leaf area index (1981–2011) from combined AVHRR and MODIS data, J. Geophys. Res., 117, G04003, https://doi.org/10.1029/2012JG002084, 2012.
Liu, Y., Zhu, Y., Ren, L., Yong, B., Singh, V. P., Yuan, F., Jiang, S., and Yang, X.: On the mechanisms of two composite methods for construction of multivariate drought indices, Sci. Total Environ., 647, 981–991, https://doi.org/10.1016/j.scitotenv.2018.07.273, 2019.
Ma, B., Zhang, B., Jia, L., and Huang, H.: Conditional distribution selection for SPEI-daily and its revealed meteorological drought characteristics in China from 1961 to 2017, Atmos. Res., 246, 105108, https://doi.org/10.1016/j.atmosres.2020.105108, 2020.
Madani, K.: Game theory and water resources, J. Hydrol., 381, 225–238, https://doi.org/10.1016/j.jhydrol.2009.11.045, 2010.
McKee, T. B., Doesken, N. J., and Kleist, J.: The relationship of drought frequency and duration to time scales, Paper Presented at Proceedings of the 8th Conference on Applied Climatology 1993 Jan 17 Anaheim California, 17, 179–183, https://clima1.cptec.inpe.br/~rclima1/pdf/paper_spi.pdf (last access: 27 September 2024), 1993.
McKee, T. B., Doesken, N. J., and Kleist, J.: The relationship of drought frequency and duration to time scales, Paper Presented at Proceedings of the 8th Conference on Applied Climatology, 17, 179–183, 2010.
Ministry of Water Resources of China: China Flood and Drought Disaster Prevention Bulletin 2022, China Water Power Press, Beijing, China, ISBN 9787522618418, 2023.
Oertel, M., Meza, F. J., Gironás, J., Scott, C. A., Rojas, F., and Pineda-Pablos, N.: Drought propagation in semi-arid river basins in Latin America: lessons from Mexico to the Southern Cone, Water, 10, 1564, https://doi.org/10.3390/w10111564, 2018.
Palmer, W. C.: Meteorological drought, US Department of Commerce, Weather Bureau, Washington, DC, https://scholar.google.com/scholar_lookup?title=Meteorological+drought&author=W.+Palmer&publication_year=1965 (last access: 27 September 2024), 1965.
Panda, P. K., Panda, R. B., and Dash, P. K.: The study of water quality and pearson's correlation coefficients among different physico-chemical parameters of River Salandi, Bhadrak, Odisha, India, Am. J. Water Resour., 6, 146–155, 2018.
Peng, S., Ding, Y., Liu, W., and Li, Z.: 1 km monthly temperature and precipitation dataset for China from 1901 to 2017, Earth Syst. Sci. Data, 11, 1931–1946, https://doi.org/10.5194/essd-11-1931-2019, 2019.
Shah, D. and Mishra, V.: Integrated Drought Index (IDI) for drought monitoring and assessment in India, Water Resour. Res., 56, e2019WR026284, https://doi.org/10.1029/2019WR026284, 2020.
Shukla, S. and Wood, A. W.: Use of a standardized runoff index for characterizing hydrologic drought, Geophys. Res. Lett., 35, L02405, https://doi.org/10.1029/2007GL032487, 2008.
Tan, Y. X., Ng, J. L., and Huang, Y. F.: Quantitative analysis of input data uncertainty for SPI and SPEI in Peninsular Malaysia based on the bootstrap method, Hydrolog. Sci. J., 68, 1724–1737, https://doi.org/10.1080/02626667.2023.2232348, 2023.
Tian, P., Liu, L., Tian, X., Zhao, G., Klik, A., Wang, R., Lu, X., Mu, X., and Bai, Y.: Sediment yields variation and response to the controlling factors in the Wei River Basin, China, Catena, 213, 106181, https://doi.org/10.1016/j.catena.2022.106181, 2022.
Trenberth, K. E., Dai, A., and van der Schrier, G.: Global warming and changes in drought, Nat. Clim. Change, 4, 17–22, https://doi.org/10.1038/nclimate2067, 2014.
Vicente-Serrano, S. M., Beguería, S., and López-Moreno, J. I.: A multiscalar drought index sensitive to global warming: the standardized precipitation evapotranspiration index, J. Climate, 23, 1696–1718, https://doi.org/10.1175/2009JCLI2909.1, 2010.
Vicente-Serrano, S. M., Quiring, S. M., Pena-Gallardo, M., Yuan, S., and Domínguez-Castro, F.: A review of environmental droughts: Increased risk under global warming?, Earth-Sci. Rev., 201, 102953, https://doi.org/10.1016/j.earscirev.2019.102953, 2020.
Wang, A., Lettenmaier, D. P., and Sheffield, J.: Soil moisture drought in China, 1950–2006, J. Climate, 24, 3257–3271, https://doi.org/10.1175/2011JCLI3733.1, 2011.
Wang, F., Wang, Z., Yang, H., Di, D., Zhao, Y., Liang, Q., and Hussain, Z.: Comprehensive evaluation of hydrological drought and its relationships with meteorological drought in the Yellow River basin, China, J. Hydrol., 584, 124751, https://doi.org/10.1016/j.jhydrol.2020.124751, 2020.
Wang, X., Luo, P., Zheng, Y., Duan, W., Wang, S., Zhu, W., Zhang, Y., and Nover, D.: Drought Disasters in China from 1991 to 2018: Analysis of Spatiotemporal Trends and Characteristics, Remote Sens.-Basel, 15, 1708, https://doi.org/10.3390/rs15061708, 2023.
Wang, Z., Zhong, R., Lai, C., Zeng, Z., Lian, Y., and Bai, X.: Climate change enhances the severity and variability of drought in the Pearl River Basin in South China in the 21st century, Agr. Forest Meteorol., 249, 149–162, https://doi.org/10.1016/j.agrformet.2017.12.077, 2018.
Wei, H., Liu, X., Hua, W., Zhang, W., Ji, C., and Han, S.: Copula-Based Joint Drought Index Using Precipitation, NDVI, and Runoff and Its Application in the Yangtze River Basin, China, Remote Sens.-Basel, 15, 4484, https://doi.org/10.3390/rs15184484, 2023.
Wen, X., Tu, Y., Tan, Q., Li, W., Fang, G., Ding, Z., and Wang, Z.: Construction of 3D drought structures of meteorological drought events and their spatio-temporal evolution characteristics, J. Hydrol., 590, 125539, https://doi.org/10.1016/j.jhydrol.2020.125539, 2020.
Wilhite, D. A. and Glantz, M. H.: Understanding: the drought phenomenon: the role of definitions, Water Int., 10, 111–120, 1985.
Won, J., Choi, J., Lee, O., and Kim, S.: Copula-based Joint Drought Index using SPI and EDDI and its application to climate change, Sci. Total Environ., 744, 140701, https://doi.org/10.1016/j.scitotenv.2020.140701, 2020.
Xu, H., Wang, X., Zhao, C., and Yang, X.: Diverse responses of vegetation growth to meteorological drought across climate zones and land biomes in northern China from 1981 to 2014, Agr. Forest Meteorol., 262, 1–13, https://doi.org/10.1016/j.agrformet.2018.06.027, 2018.
Xu, Y., Zhang, X., Hao, Z., Singh, V. P., and Hao, F.: Characterization of agricultural drought propagation over China based on bivariate probabilistic quantification, J. Hydrol., 598, 126194, https://doi.org/10.1016/j.jhydrol.2021.126194, 2021.
Yang, J., Gong, D., Wang, W., Hu, M., and Mao, R.: Extreme drought event of 2009/2010 over southwestern China, Meteorol. Atmos. Phys., 115, 173–184, https://doi.org/10.1007/s00703-011-0172-6, 2012.
Yang, Y. and He, Y.: A fault identification method based on an ensemble deep neural network and a correlation coefficient, Soft Comput., 26, 9199–9214, https://doi.org/10.1007/s00500-022-07343-x, 2022.
You, M., He, Z. H., Zhang, L., Yang, M. K., and Pi, G. N.: Characteristics of agricultural and meteorological drought in Guizhou Province and their response relationship, J. Soil Water Conserv., 36, 255–264, 2022.
Yue, S. and Wang, C. Y.: Applicability of prewhitening to eliminate the influence of serial correlation on the Mann-Kendall test, Water Resour. Res., 38, 4-1–4-7, https://doi.org/10.1029/2001WR000861, 2002.
Zhang, F., Biederman, J. A., Dannenberg, M. P., Yan, D., Reed, S. C., and Smith, W. K.: Five decades of observed daily precipitation reveal longer and more variable drought events across much of the western United States, Geophys. Res. Lett., 48, e2020GL092293, https://doi.org/10.1029/2020GL092293, 2021.
Zhang, J., Wang, J., Chen, S., Wang, M., Tang, S., and Zhao, W.: Integrated Risk Assessment of Agricultural Drought Disasters in the Major Grain-Producing Areas of Jilin Province, China, Land, 12, 160, https://doi.org/10.3390/land12010160, 2023.
Zhang, Q., Shi, R., Singh, V. P., Xu, C., Yu, H., Fan, K., and Wu, Z.: Droughts across China: Drought factors, prediction and impacts, Sci. Total Environ., 803, 150018, https://doi.org/10.1016/j.scitotenv.2021.150018, 2022.
Zhang, T., Su, X., Zhang, G., Wu, H., Wang, G., and Chu, J.: Evaluation of the impacts of human activities on propagation from meteorological drought to hydrological drought in the Weihe River Basin, China, Sci. Total Environ., 819, 153030, https://doi.org/10.1016/j.scitotenv.2022.153030, 2022.
Zhang, X., Hao, Z., Singh, V. P., Zhang, Y., Feng, S., Xu, Y., and Hao, F.: Drought propagation under global warming: Characteristics, approaches, processes, and controlling factors, Sci. Total Environ., 838, 156021, https://doi.org/10.1016/j.scitotenv.2022.156021, 2022.
Zhang, Y.: 30 m resolution digital elevation model (DEM) data of Weihe River Basin, National Cryosphere Desert Data Center, https://doi.org/10.12072/ncdc.WRiver.db0009.2021, 2021.
Zhang, Y., Huang, S., Huang, Q., Leng, G., Wang, H., and Wang, L.: Assessment of drought evolution characteristics based on a nonparametric and trivariate integrated drought index, J. Hydrol., 579, 124230, https://doi.org/10.1016/j.jhydrol.2019.124230, 2019.
Zhang, Y., Hao, Z., Feng, S., Zhang, X., Xu, Y., and Hao, F.: Agricultural drought prediction in China based on drought propagation and large-scale drivers, Agr. Water Manage., 255, 107028, https://doi.org/10.1016/j.agwat.2021.107028, 2021.