the Creative Commons Attribution 4.0 License.
the Creative Commons Attribution 4.0 License.
 | 08 Oct 2024
Insurance loss model vs. meteorological loss index – how comparable are their loss estimates for European windstorms?
Inovasita Alifdini
Alexandre M. Ramos
Alexandros Georgiadis
Aidan Brocklehurst
Lukas Braun
Joaquim G. Pinto
Windstorms affecting Europe are among the natural hazards with the largest socio-economic impacts. Therefore, many sectors like society, the economy, or the insurance industry are highly interested in reliable information on associated impacts and losses. In this study, we compare – for the first time – estimated windstorm losses using a simplified meteorological loss index (LI) with losses obtained from a complex insurance loss (catastrophe) model, namely the European Windstorm Model of Aon Impact Forecasting. To test the sensitivity of LI to different meteorological input data, we furthermore contrast LI based on the reanalysis dataset ERA5 and its predecessor ERA-Interim. We focus on similarities and differences between the datasets in terms of loss values and storm rank for specific historical storm events in the common reanalysis period across 11 European countries.
Our results reveal higher LI values for ERA5 than for ERA-Interim for all of Europe (by roughly a factor of 10), coming mostly from the higher spatial resolution in ERA5. The storm ranking is comparable for western and central European countries for both reanalyses, confirmed by high correlation values between 0.6 and 0.89. Compared to the Aon Impact Forecasting model, LI ERA5 shows comparable storm ranks, with correlation values ranging between 0.45 and 0.8. In terms of normalized loss, LI exhibits overall lower values and smaller regional differences. Compared to the market perspective represented by the insurance loss model, LI seems to have particular difficulty in distinguishing between high-impact events at the tail of the wind gust distribution and moderate-impact events. Thus, the loss distribution in LI is likely not steep enough, and the tail is probably underestimated. Nevertheless, it is an effective index that is suitable for estimating the impacts of storm events and ranking storm events, precisely because of its simplicity.
- Article
(7400 KB) - Full-text XML
-
Supplement
(3215 KB) - BibTeX
- EndNote


In central and western Europe, windstorms are among the major natural hazards. They regularly lead to high economic and insured losses (Munich Re, 2022), causing damage to natural and human-made environments like infrastructure, buildings, forestry and agriculture (Mitchell-Wallace et al., 2017; Pinto et al., 2019; Gliksman et al., 2023). In 2022, losses from European windstorms were well above average, with insured losses of USD 5.7 billion and economic losses of USD 7.5 billion (Aon, 2023a). In fact, European windstorms were among the five largest weather-related perils in 2022 (Swiss Re, 2023). The high losses were mainly caused by the windstorm series Ylenia–Zeynep–Antonia1 (international: Dudley–Eunice–Franklin) in February 2022, which resulted in insured losses of USD 4.7 billion (Aon, 2023a). The storm series affected the British Isles and continental Europe (Mühr et al., 2022), with the highest losses in Germany, the Benelux countries, the United Kingdom and France (PERILS, 2023). While there have been a large number of impactful storms in recent decades from a market perspective, in meteorological terms there is no clear trend, with mostly decadal variability apparent over the last hundred years (see review in Feser et al., 2015).
For the insurance industry, as well as for society and the economy, it is crucial to assess wind-related risk, determine the return periods of historical storms, and forecast the impacts of extreme storms in order to adapt to and mitigate windstorm losses (Mitchell-Wallace et al., 2017; Pinto et al., 2019; Merz et al., 2020; Raschke, 2022; Gliksman et al., 2023). In this context, risk is usually defined as the interaction between hazard, exposure and vulnerability (e.g., IPCC, 2022). The hazard component is defined as the occurrence of a natural event (in our case a windstorm), the exposure component represents the presence of people/livelihoods/ecosystems or economic/social assets, and the vulnerability component describes the disposition to be affected (IPCC, 2022). The information on windstorm risk and associated losses is provided by various types of datasets (Gliksman et al., 2023; Moemken et al., 2024), both for present and future climate conditions. These datasets do not always account for all three risk components. Meteorological indices/storm severity indices (e.g., Klawa and Ulbrich, 2003) combine meteorological variables and insurance aspects, usually only considering the hazard component. The more complex storm loss models – developed, among others, by the insurance industry (catastrophe modeling) – consider all three risk components. These models relate meteorological wind data to actual building damage data, using so-called damage functions that define the relationship between wind and damage (Prahl et al., 2015; Gliksman et al., 2023). Commonly used damage functions assume either a power law or an exponential form.
Moemken et al. (2024) recently compared several examples of loss datasets for windstorms across Europe, including a natural hazard database, insurance loss reports and various meteorological indices. Focusing on storm numbers and the ranking of specific storm events, they conclude that the datasets provide different perspectives on windstorm impacts and suggest that a combination of different types of datasets might be used to assign an uncertainty range to windstorm losses. A recent review paper by Gliksman et al. (2023) discusses open research questions related to damage from European windstorms. One issue raised is the lack of a clear methodology to select the most suitable index to assess windstorm losses for both present and future climate conditions. Moreover, loss calculations are affected by uncertainties, for example related to the (meteorological) input data used. They further point out that there is a need for a thorough comparison between meteorological loss indices and catastrophe models (used in insurance) to better understand loss estimates from different perspectives.
In this study, we try to answer two of these questions:
-
How sensitive are the loss estimates of a meteorological index to the meteorological input data?
-
How comparable are windstorm loss estimates from this meteorological index and an insurance loss model?
With this aim, we first calculate the loss index (LI) by Pinto et al. (2012) in the adaptation of Karremann et al. (2014a) using ERA5 (Hersbach et al., 2020) and its predecessor ERA-Interim (Dee et al., 2011a). In a second step, we compare the loss estimates from LI to the output of an insurance loss (catastrophe) model for a set of historical European windstorms. Here, we use, for the first time in a scientific study, the European Windstorm Model of Aon Impact Forecasting (hereafter Aon's IF Euro WS model). We analyze the differences and similarities, focusing on loss values and storm ranks of individual events. The study is restricted to 11 European countries covered by Aon's IF Euro WS model (see Sect. 3.2) and the extended winter season of October–March (ONDJFM). For proprietary reasons, we only show country-aggregated and normalized losses. Throughout this study, we use the terms “extreme” and “severe” interchangeably when referring to storm events with high losses.
The paper is organized as follows: Sect. 2 describes the datasets, and Sect. 3 describes the methods/models. Section 4 focuses on the sensitivity of LI to different reanalysis datasets, while Sect. 5 presents the comparison between LI and Aon's IF Euro WS model. Section 6 concludes this paper with a summary and discussion of results.
2.1 Meteorological input data
For the calculation of LI (Sect. 3.1.1), gridded datasets are needed. As we are interested in historical windstorms, we use reanalysis data – namely ERA5 (Hersbach et al., 2020) and its predecessor ERA-Interim (Dee et al., 2011a). ERA5 is the latest reanalysis product of the European Centre for Medium-Range Weather Forecasts (ECMWF). Wind gust data are available at hourly temporal and 30 km (0.25°) horizontal resolution for the period of 1959–2021. For ERA-Interim, wind gust data are available with 3-hourly temporal and 83 km (0.75°) horizontal resolution for the period of 1979–2019. In both datasets, wind gusts are defined as the maximum 3 s wind at 10 m height following the definition of the World Meteorological Organization (WMO). For both datasets, ECMWF publishes post-processed wind gust, which is the maximum gust computed in every time step following the standard parameterization approach by Panofsky et al. (1977) and Bechthold and Bidlot (2009). We use the datasets in their native resolutions in order to test the sensitivity of LI to the resolution of the input data, considering only the common period of 1979–2019. Additionally, we repeated some of the analyses with ERA5 data regridded to the coarser ERA-Interim grid using a conservative remapping.
2.2 Insurance data – PERILS
For the insurance perspective of the impacts of the windstorms, we use PERILS data (https://www.perils.org, last access: 21 May 2024). PERILS is a joint-stock company owned by 10 shareholders from the insurance industry, which collects, homogenizes and provides aggregated anonymized insurance data for different weather-related perils (see Moemken et al., 2024, for a detailed description). The data provide for selected events with a sizable financial footprint, a market estimation for the loss per country and CRESTA zone (a geographical data aggregation standard used by the global insurance industry; https://www.cresta.org, last access: 21 May 2024), property premium data per country, and the exposure (total sum of insured property) per country and CRESTA zone. For extratropical windstorms in Europe, PERILS provides data for 12 countries, 11 of which are also covered by Aon's IF Euro WS model, namely Austria, Belgium, Denmark, France, Germany, Ireland, Luxembourg, the Netherlands, Norway, the United Kingdom and Sweden. Following Pinto et al. (2012), we additionally focus on the region of Core Europe, which is of special interest for the insurance industry in terms of windstorm risk and consists of Belgium, Denmark, France, Germany, Ireland, Luxembourg, the Netherlands and the United Kingdom. The insurance data are supplied by PERILS on an annual subscription basis. In our study, we use the exposure data of PERILS for the exposure component in the Aon IF model (Sect. 3.2) and the loss data as reference data for some of the analyses.
2.3 Storm names
We assign a name to each storm event based on the date of its occurrence, referring to those given by the Freie Universität Berlin and used by the German Weather Service (DWD; https://www.wetterpate.de/namenslisten/tiefdruckgebiete/index.html) (in German). For events prior to 1999, we also refer to the Extreme Windstorms (XWS) catalogue described in Roberts et al. (2014) and the windstorm documentation by Deutsche Rück for the years 1997–2004 (Deutsche Rück, 2005).
3.1 Meteorological loss index
Meteorological loss indices, also referred to as storm severity indices, are typically used to identify severe windstorms, study their magnitude and likelihood of occurrence, and estimate the associated losses. There exists a wide variety of indices, ranging from more general ones to those targeting specific sectors like forestry, agriculture or transport (see Gliksman et al., 2023, for a detailed overview). The key variable for many of these indices is the daily maximum wind speed or peak wind gust, which is regarded as relevant for storm losses (Lamb, 1991; Klawa and Ulbrich, 2003; Leckebusch et al., 2008; Pardowitz et al., 2016). The assumption behind this is that the loss can be primarily attributed to the maximum gust, which causes damage by generating “pressure” on the infrastructure (Klawa and Ulbrich, 2003).
3.1.1 Loss index (LI)
In our study, we use the loss index (LI) by Pinto et al. (2012) in the extended version by Karremann et al. (2014a). LI is built from the widely used storm loss model by Klawa and Ulbrich (2003) and is based on the following assumptions.
-
Losses increase with the cube of wind speed/gust (Palutikof and Skellern, 1991; Lamb, 1991), which – from a physical perspective – is proportional to the wind power or the wind kinetic energy flux.
-
Infrastructure and other assets are adapted to the local wind conditions. Therefore, it can be assumed that only the top 2 % of wind gusts (corresponding to beaufort 8, circa 17–20 m s−1) cause damage to buildings (Palutikof and Skellern, 1991). This is taken into account by scaling the daily peak gust with the local 98th percentile.
-
In the case that no insurance data are available, population density can be used as a proxy for the insured value (exposure component).
-
The (re-)insurance clause for natural hazards is typically 72 h. This also corresponds to the period during which an average storm crosses Europe and produces damaging winds (Hewson and Neu, 2015).
Hence, LI is calculated as
with ,
where v is the maximum wind gust in 72 h at grid point ij, v98 is the local 98th percentile and P is the population density. Here, we use gridded population density data for the year 2020 at a spatial resolution of 0.25° (see Fig. 1a), downloaded from the Center for International Earth Science Information Network (CIESIN) at Columbia University, USA.
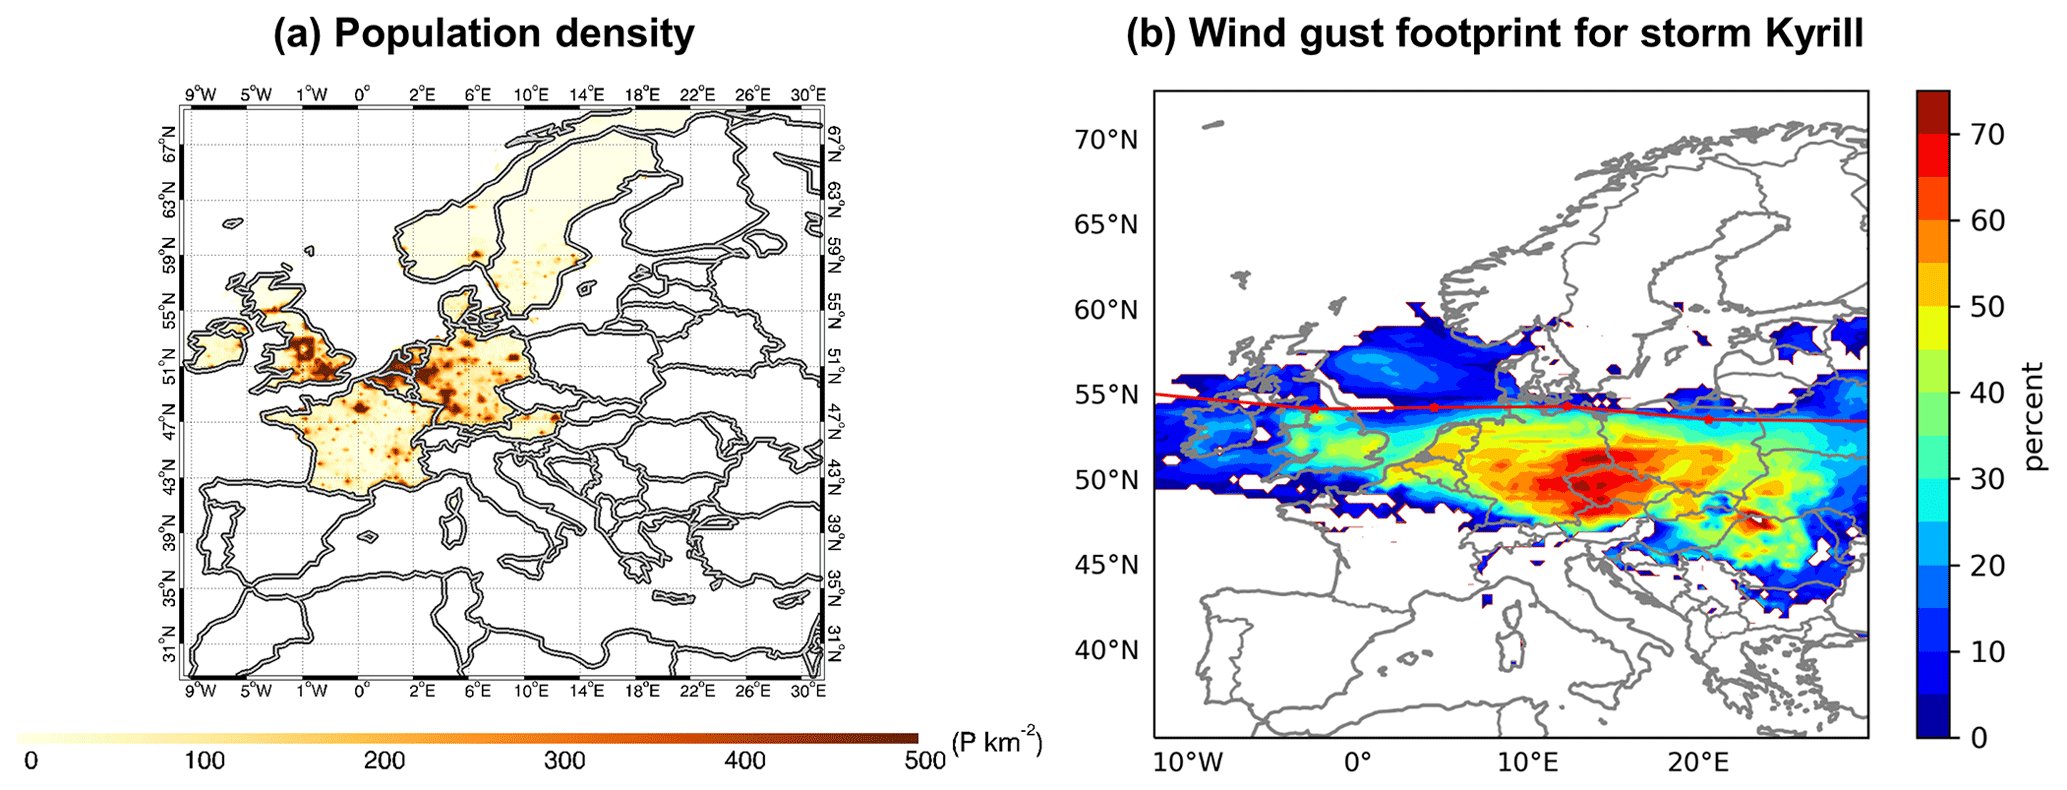
Figure 1(a) Population density for 2020 derived from CIESIN for the 11 countries covered in this study. (b) Wind gust footprint for Storm Kyrill in January 2007 based on ERA5. Shown is the largest exceedance (in percent) of the 98th percentile of daily maximum wind gust within 72 h. The red line and dots denote the cyclone track derived from ERA5 using the tracking algorithm of Pinto et al. (2005). Refer to Sect. 3 for detailed information on the methods.
To separate individual events per extended winter season (October–March, ONDJFM), overlapping 72 h sliding time windows (shifted every 6 h) are used, and the temporal local maximum of each 72 h time window is analyzed (Karremann et al., 2014a). We are particularly interested in extreme storm events. Therefore, we only consider events with LI values above a certain threshold, which corresponds to the selection of an average of five events per season (Pinto et al., 2012; Karremann et al., 2014a). This results in 205 storm events (41 years × 5 events) per dataset (LI ERA5 and LI ERA-Interim).
3.1.2 Windstorm footprints
For the hazard component, windstorm footprints are required. Following the WMO and Haylock (2011), the footprint is defined as the percentage of wind gust values that exceed the local 98th percentile per 72 h period:
where vmax is the maximum wind gust in 72 h at each grid point, and v98 is the local 98th percentile. We use the same 72 h periods as for the LI calculation. The corresponding cyclone tracks were derived following the tracking algorithm by Murray and Simmonds (1991) and Pinto et al. (2005). As an example, Fig. 1b shows the footprint and cyclone track for windstorm Kyrill in January 2007 (Fink et al., 2009).
3.1.3 Original and normalized loss values
For the comparison between LI ERA5 and LI ERA-Interim, we use both original loss estimates and normalized losses. The normalization is done with a min–max scaling approach, which scales the loss values between 0.0 and 1.0. The top storm event corresponds to the value 1.0, and the event with the lowest impact corresponds to the value 0.0. The normalized losses of all other events relate to the top event (relative ranking). We only focus on losses aggregated at country level (cf. Sect. 3.2.1).
3.2 Insurance loss model
Storm loss (catastrophe) models determine the windstorm risk to residential and commercial buildings by relating wind speed to building damage (Palutikof and Skellern, 1991; Dorland et al., 1999; Gliksman et al., 2023), usually by implementing statistical modeling. As for storm severity indices, the maximum daily wind gust speed is assumed to be the most relevant factor in these models (Dorland et al., 1999; Klawa and Ulbrich, 2003; Donat et al., 2011; Koks and Haer, 2020) and is used as the basis for the hazard component. The building damage data are usually represented using so-called loss ratios, which are the amount of insured loss occurring per district divided by the corresponding sum of the insured value (Klawa and Ulbrich, 2003; Prahl et al., 2015). For the relationship between wind and damage, also referred to as damage functions, various formulations exist in the literature (see Prahl et al., 2015, for a detailed overview). These damage functions aim at describing the non-linear relation between storm intensity and actual (monetary) damage. Typically used damage functions range from exponential to power law to excess-over-threshold formulations.
3.2.1 Aon Impact Forecasting European Windstorm Model
In our study, we use the European Windstorm Model of Aon Impact Forecasting (Aon's IF Euro WS model), which is implemented in ELEMENTS, Aon's loss modeling platform (Aon, 2023b). The model covers 22 countries in western, northern and central Europe. The aim of this catastrophe model is to provide a quantification of financial losses from windstorm risk in Europe. The model consists of three main components, namely hazard, vulnerability and exposure, as well as a financial part (see Supplement Sect. S1).
The hazard component has two parts: a historical and a stochastic event set. The historical event set comprises 26 historical storms (see Supplement Table S1; Born et al., 2012), based on wind gust footprints built from weather station data. The stochastic event set covers 4731 years of simulated events (Karremann et al., 2014a). The stochastic events represent physically consistent storm events and are based on outputs of the ECHAM5 global climate model (Jungclaus et al., 2006). A combination of dynamical downscaling and statistical downscaling (Haas and Pinto, 2012) is used to produce the final high-resolution stochastic event set that is implemented in Aon's IF Euro WS model.
The exposure component typically uses a combination of Aon's client data and the PERILS industry exposure database. The component comprises five lines of business: residential, commercial, industrial, agricultural, motor and forestry (only Norway, Sweden and Finland). For our study, we only use the PERILS data for 2022 for the exposure.
The vulnerability component is divided into chance of loss (COL) and conditional mean damage ratio (CMDR), thereby giving a more realistic view of loss than a single mean damage ratio. The COL is applied first, rating the probability of loss for a certain wind speed and a given building. If the building is determined to have suffered a loss, then the CMDR is applied. The vulnerability component of the model applies IF's proprietary damage curves to calculate the physical loss for each event at each insured location. Original limits and other policy conditions are then applied per event to calculate the gross loss and the net loss, thus obtaining the value of insured loss in the financial component of the model.
The model is calibrated against insurance data, including PERILS data as the primary benchmark. For this reason, we assume that it represents a market perspective for the purpose of our paper. A more detailed description of the model is available in Sect. S1. For proprietary reasons, the comparison to LI is restricted to losses at country level and normalized loss values.
We first analyze the sensitivity of LI to the meteorological input data. To this end, we compare ERA5 and ERA-Interim in terms of wind gust as the relevant input variable for LI. We then use both datasets to derive LI for our study domain and compare the results with respect to storm loss and storm rank.
4.1 Wind gust climatology
We use the 98th and 99.9th percentiles of daily maximum wind gust to compare ERA5 and ERA-Interim. The percentiles are calculated for the winter half year, ONDJFM, for 1979–2019, the period common to both datasets. Figure 2 shows both percentiles for ERA5 (left) and ERA-Interim (middle), as well as the absolute difference between the datasets (right). For the 98th percentile (Fig. 2, upper row), both datasets show a similar spatial pattern: for most of Europe, the 98th percentile ranges between 16 and 30 m s−1, with the highest values over the North and Baltic seas and the British Isles. Except for Sweden and the Baltic region, values are in general higher for ERA5 compared to ERA-Interim. Differences reach the highest values (over 4 m s−1) over mountainous regions like the Alps, the Pyrenees and the Scandinavian mountains, while they are in the range of 2 m s−1 for Core Europe. This suggests a slight shift towards higher gust speeds in the wind gust distribution of ERA5 compared to ERA-Interim for large parts of central Europe. For the 99.9th percentile (Fig. 2, lower row), differences between the datasets are larger for all of Europe – not only in terms of magnitude but also regarding the spatial pattern. This not only confirms the overall shift in the wind gust distribution, but also indicates a longer tail of the wind gust distribution for ERA5 over continental Europe. Differences most likely result from the different ECMWF model version used for the reanalysis and the overall better representation of resolution and physical processes in the ERA5 setup (see Hersbach et al., 2020, for detailed information).
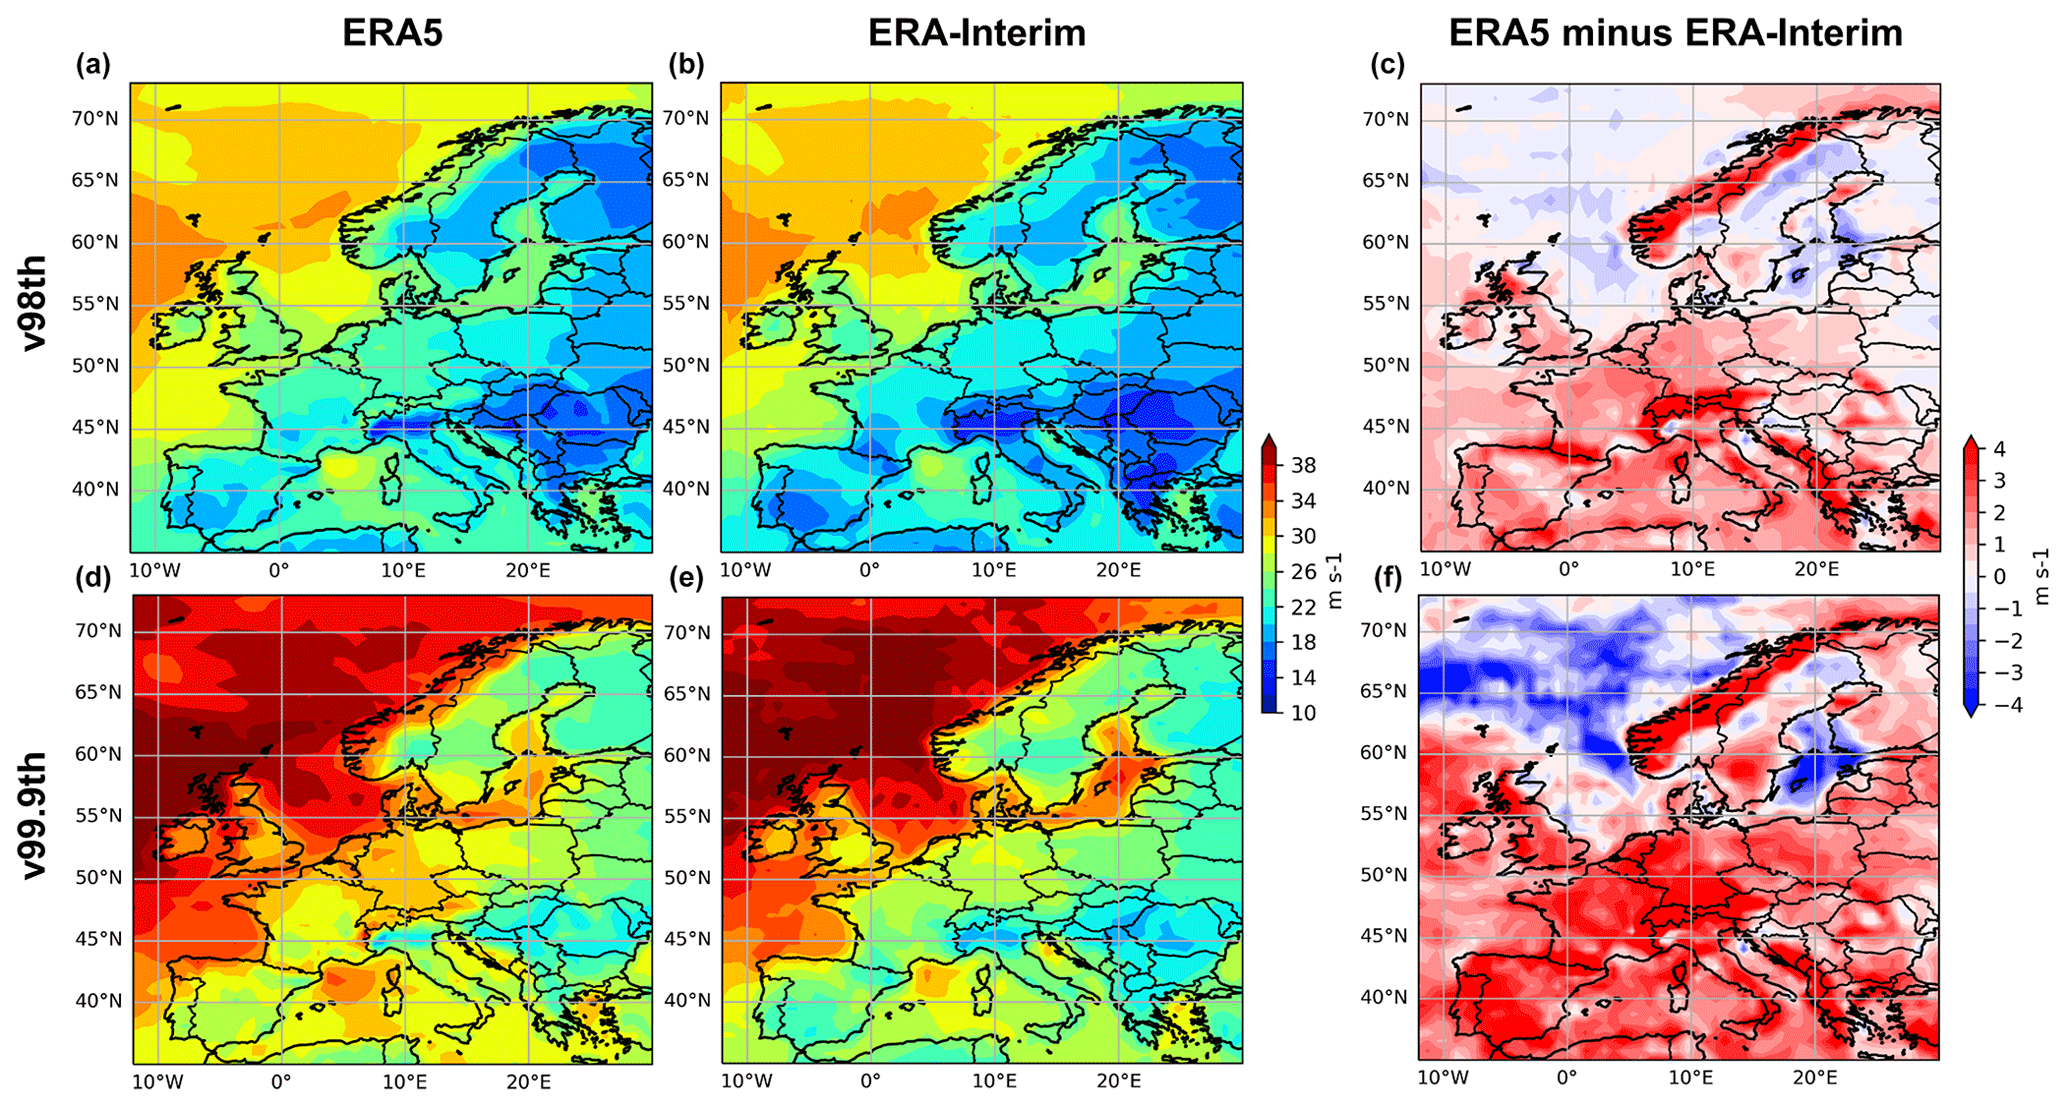
Figure 2The 98th percentile (a, b, c) and 99.9th percentile (d, e, f) of daily maximum wind gust for the winter half year (October–March, ONDJFM) for the 1979–2019 period derived from ERA5 (a, d) and ERA-Interim (b, e). Difference between ERA5 and ERA-Interim (c, f).
4.2 Storm losses and storm ranking
In the next step, we compare the loss values and the storm ranking for the common 20 most extreme storms (Top 20) in the 1979–2019 period. The Top 20 storms are derived separately for each country as well as for Core Europe. The storm list for Core Europe can be found in Tables S2 and S3. Figure 3 presents the comparison of normalized loss values derived from LI ERA5 (x axis) and LI ERA-Interim (y axis) for four different regions/countries, namely Core Europe, the United Kingdom, Germany and France. For most events and countries, the datasets show comparable normalized losses. Moreover, the ratio between extreme storms with high losses to extreme storms with moderate losses is similar in both datasets. This is confirmed by the fact that most events are grouped closely around the linear regression line. Only Storm Irina (October 2002) is classified as an outlier for the United Kingdom, i.e., that the difference in loss value is large, based on the interquartile range (IQR; Dodge, 2008). The large difference between ERA5 and ERA-Interim for Storm Irina can be explained by looking at the storm footprint (Fig. S1 in the Supplement): it is flatter overall in ERA5 compared to ERA-Interim. This is particularly the case for the United Kingdom, where the mean wind gust over land is 12.1 m s−1 for ERA5 and 24.6 m s−1 for ERA-Interim. Therefore, the LI for Storm Irina is higher in ERA-Interim due to the cumulative effect (summation of ; see Sect. 3.1.1).
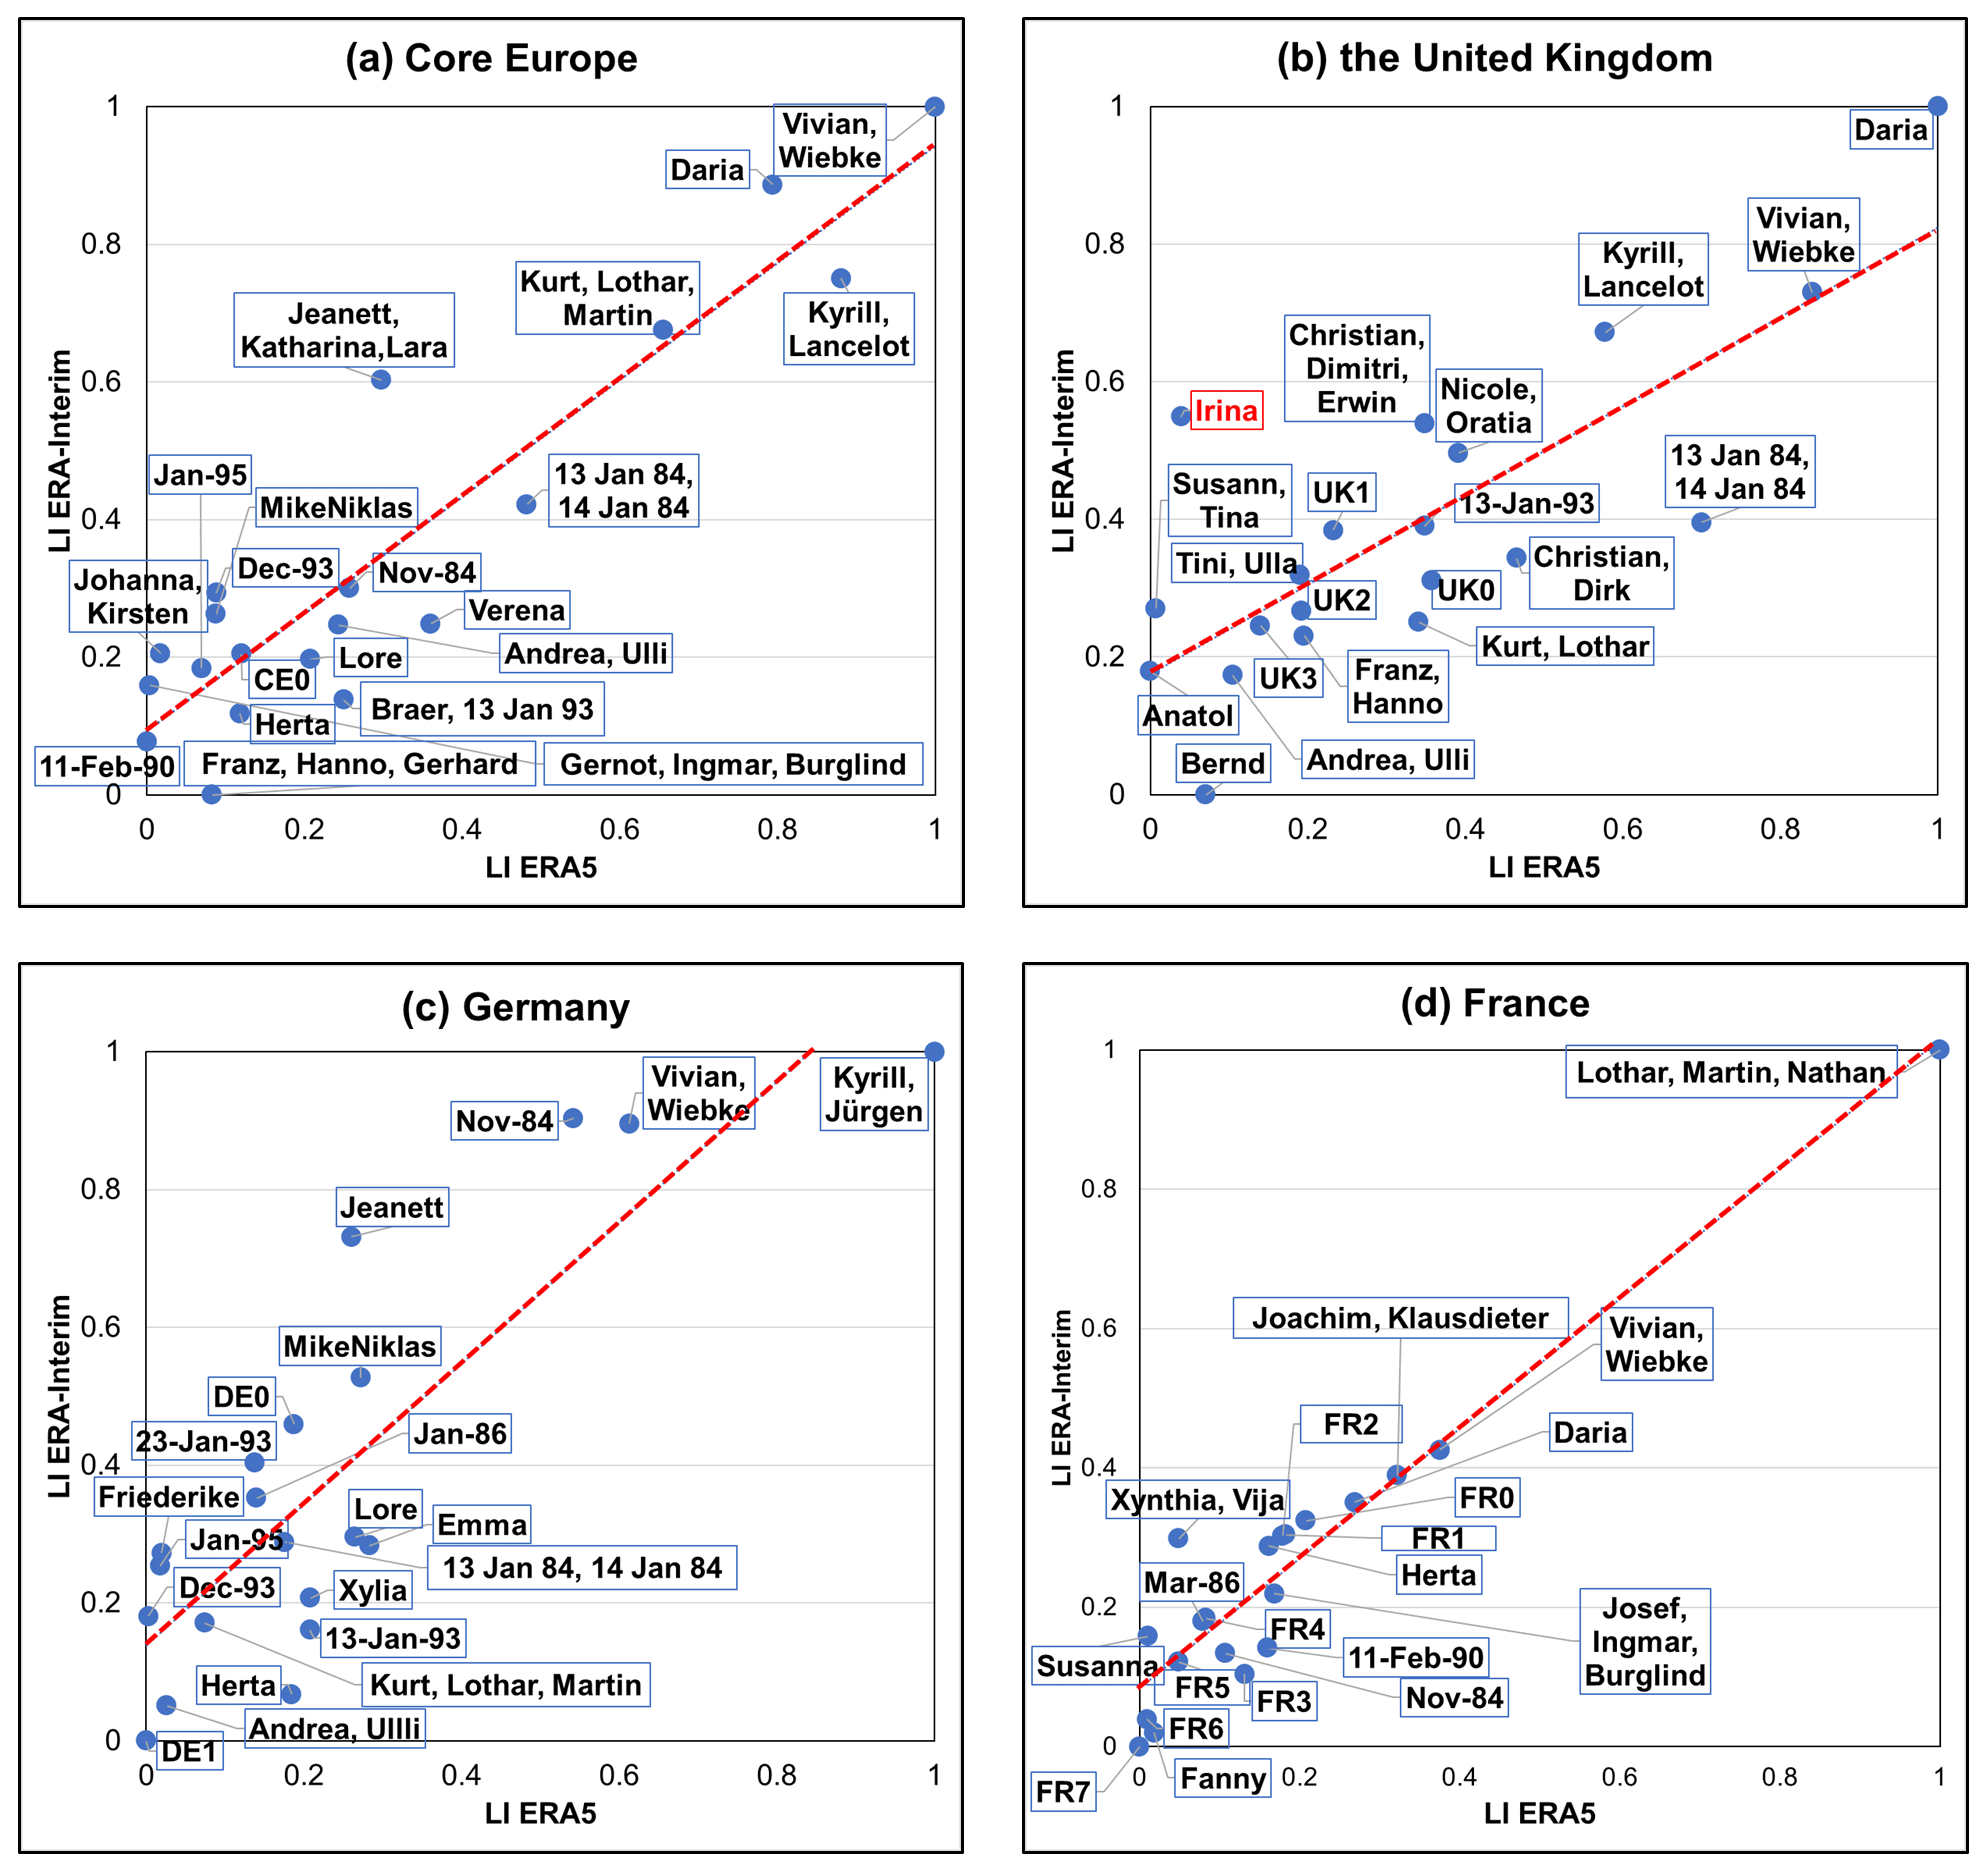
Figure 3Comparison of normalized loss values based on LI ERA5 (x axis) and LI ERA-Interim (y axis). Depicted are the common 20 most extreme storms in the 1979–2019 period for (a) Core Europe, (b) the United Kingdom, (c) Germany and (d) France. Storm names corresponding to each data point are marked with a blue line. Storms without a formal name are named based on the region (e.g., CE for Core Europe) and the loss value (starting from zero for the storm with the highest loss). The dashed red line denotes the linear regression line. Outlier storms based on the IQR method (see Sect. 4.2) are marked in red.
When comparing the original loss values (Fig. S2), the values based on ERA5 are approximately 10 times larger than those for ERA-Interim. The most obvious reason is the higher spatial resolution of ERA5 compared to ERA-Interim (roughly 3 times higher): as LI sums over all grid points with wind gusts above the 98th percentile, a higher number of grid points results in an overall higher value of LI. This is confirmed by a sensitivity study, in which we regridded ERA5 data to the coarser ERA-Interim resolution before calculating LI (Fig. S3). After regridding, LI ERA5 and LI ERA-Interim are of the same order of magnitude, while the overall behavior/order of storms does not change (cf. Figs. S2 and S3). The main reason for the remaining differences between LI ERA5 and LI ERA-Interim is most likely the shift towards higher gust speeds and the longer tail in the wind gust distribution of ERA5 compared to ERA-Interim as discussed in Sect. 4.1.
The comparison of storm ranks between LI ERA5 and LI ERA-Interim is presented in Fig. 4. Differences are generally larger than for the loss values. This is confirmed both by a higher number of outlier storms in individual countries such as France and by an overall larger spread of events along the linear regression line.
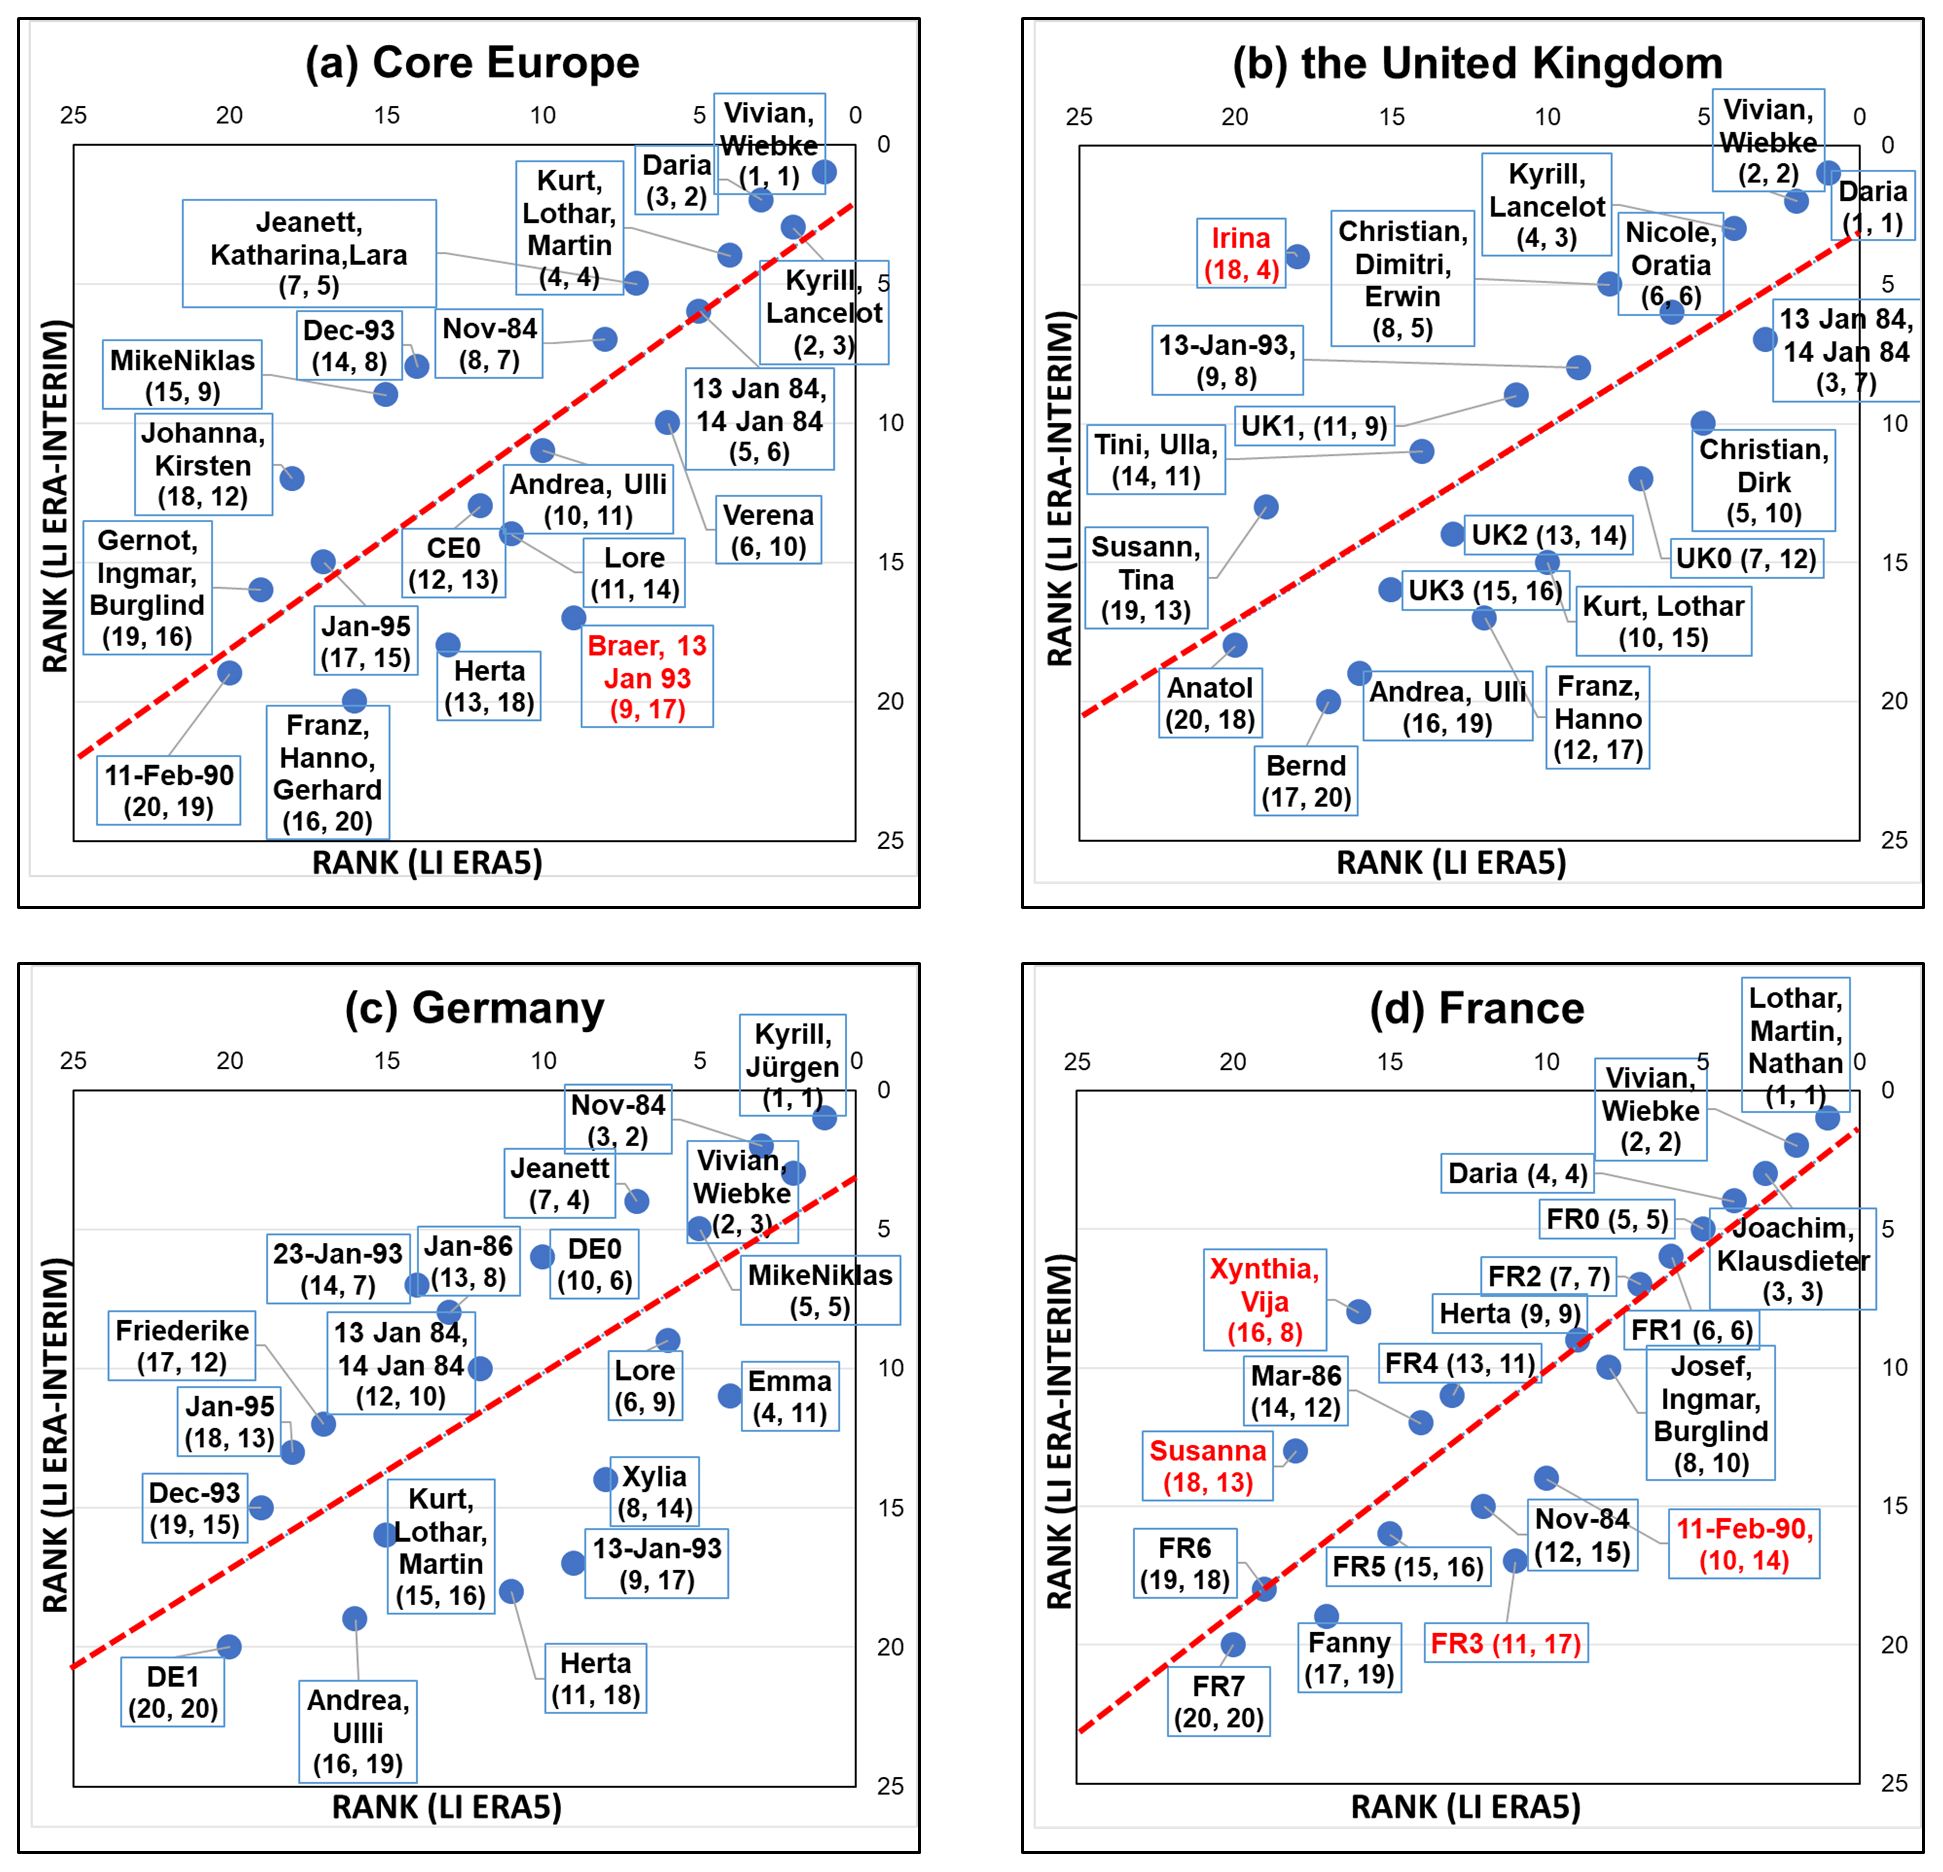
Figure 4The same as Fig. 3 but for the comparison of storm ranks. The values in brackets indicate the rank (first value – ERA5, second value – ERA-Interim).
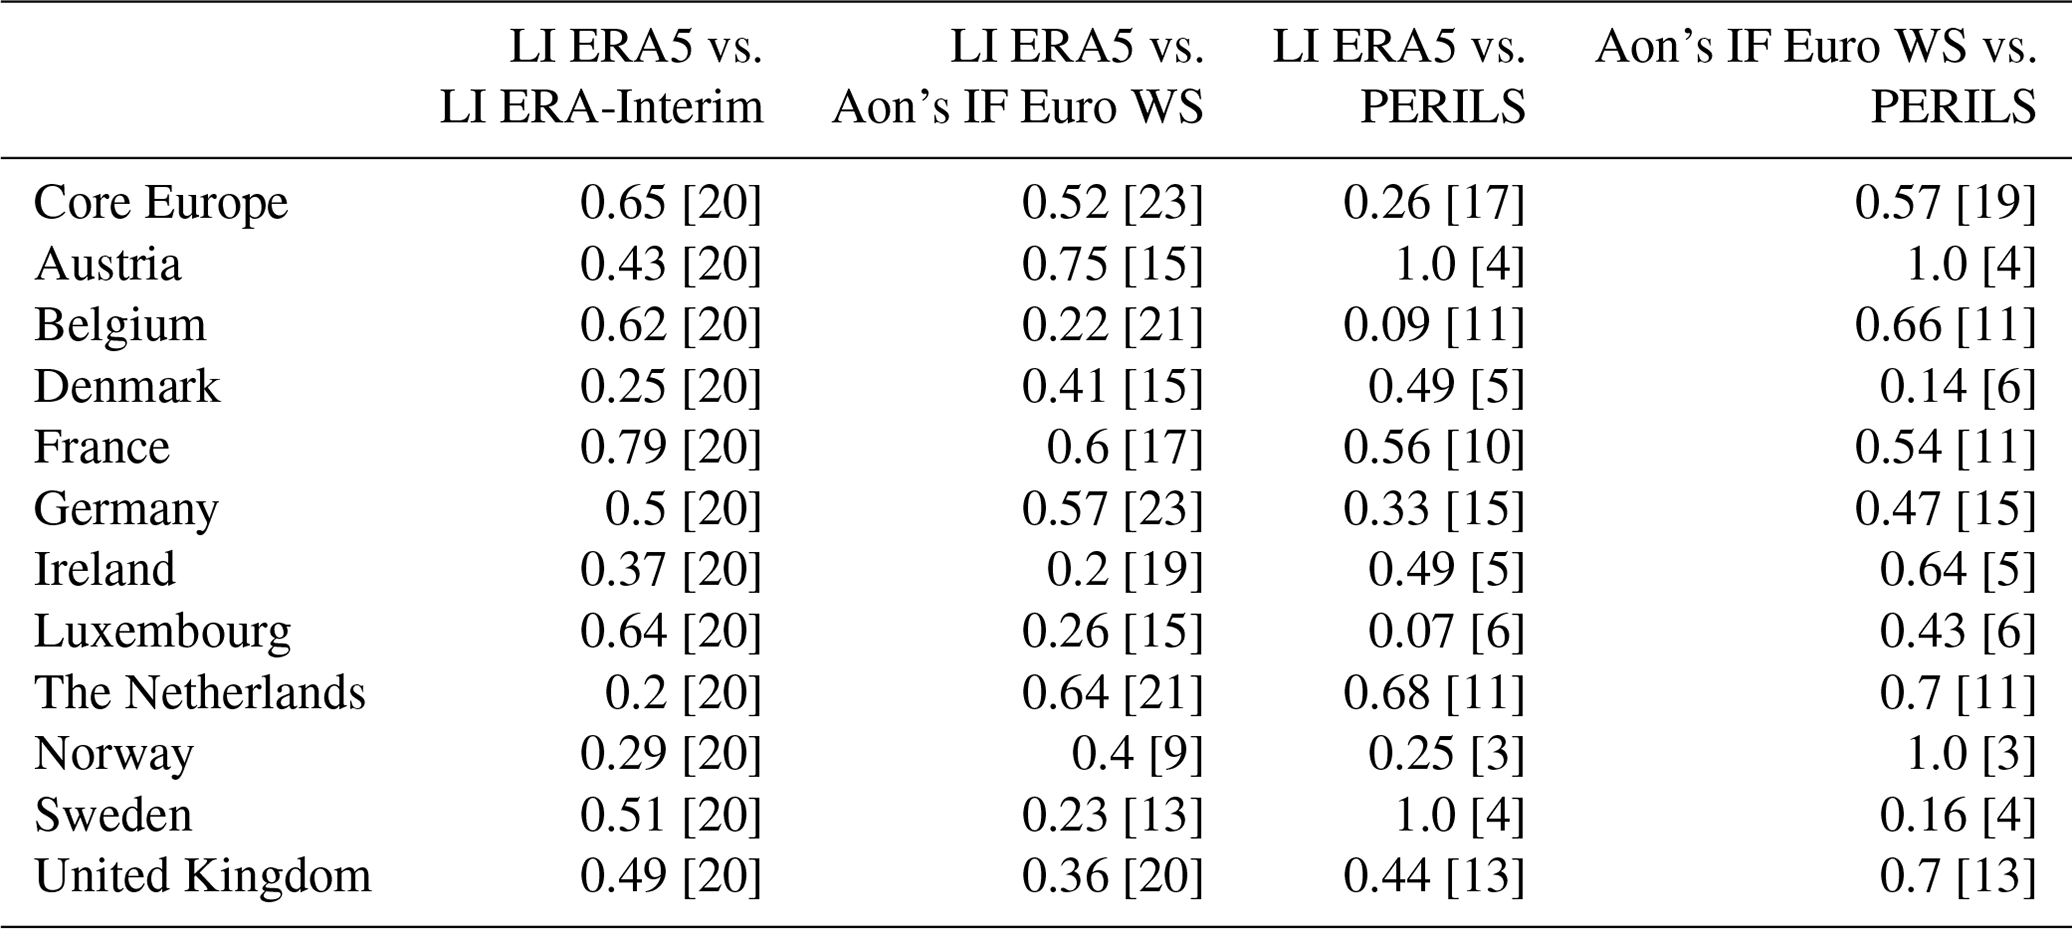
In general, LI ERA5 and LI ERA-Interim show good agreement. This is supported by overall high Spearman's rank correlation coefficients (Spearman, 1904; Dodge, 2008), which we computed to quantify and map the differences between the datasets across countries. In addition to the value of Spearman's rank correlation, which measures the strength and direction of the relationship, we use the R2 of Spearman's rank correlation that indicates the proportion of variance in the ranks of one variable that is predictable from the ranks of the other variable. For most countries, the correlations between LI ERA5 and LI ERA-Interim exceed 0.5, thereby confirming the good agreement between the datasets (Fig. 5). Moreover, more than half of the countries have R2 values above 0.40, indicating that more than 40 % of the variance in the ranks of LI ERA5 is explained by the variance in the ranks of the LI ERA-Interim (Table 1). Based on these results, we focus only on LI ERA5 in the following section in order to benefit from the higher spatial and temporal resolution and the more recent data.
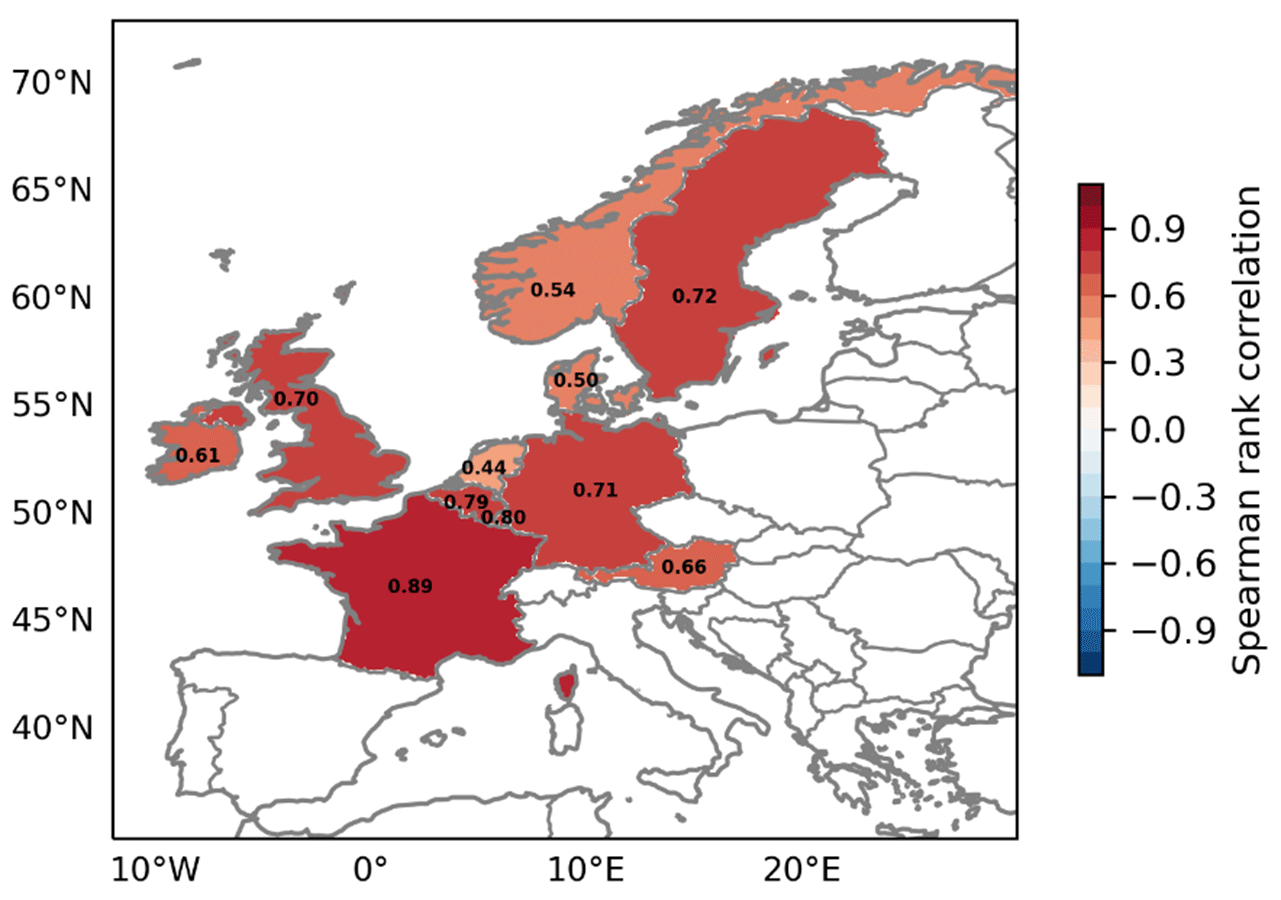
Figure 5Spearman's rank correlation coefficient at country level for LI ERA5 vs. LI ERA-Interim. The ranking is based on common storms per country (see Table 1 and Fig. S4).
Table 1Explained variance (R2) of Spearman's rank correlation coefficient between LI ERA5 and LI ERA-Interim (second column), LI ERA5 and Aon's IF Euro WS model (third column), LI ERA5 and PERILS (fourth column), and Aon's IF Euro WS model and PERILS (last column). The number of common storms per country is given in brackets.
In the second part of our study, we compare LI ERA5 to the output from Aon's IF Euro WS model, focusing on normalized losses and storm ranks at country level. The analysis is based on Aon's historical event set of insured storms in the 1990–2020 period (see Table S1). Thus, the number of common storms between Aon's IF Euro WS model and LI ERA5 can differ in the individual countries (see Table 1 and Fig. S4). Note that some events cannot be clearly separated based on LI ERA5 (e.g., Lothar and Martin; see Fig. 3 and Table S2), whereas they are single events in Aon's IF Euro WS model. In these cases, we assign the same LI value to both storm events for the comparison between LI ERA5 and Aon's IF Euro WS model.
5.1 Case study – Storm Sabine
First, we analyze one case study in detail, namely Storm Sabine, which hit Europe in February 2020. We compare the normalized losses (relative ranking) and storm ranks (ordinal ranking) at country level, additionally including PERILS as a reference (Fig. 6). All three datasets agree with regard to the region affected by the storm, which closely follows Sabine's cyclone track (black line and dots in the left column of Fig. 6). However, the normalized loss values can differ significantly in the three datasets. Values are generally higher for LI ERA5 for all countries, except for Norway, where all datasets show the same normalized loss. Aon's IF Euro WS model and PERILS show good agreement in terms of the relative ranking of Storm Sabine in the different countries. In terms of the ordinal ranking (Fig. 6, lower row), Sabine is among the Top 6 storms in all three datasets. However, while the ranking for Aon's IF Euro WS model and PERILS differs by no more than one position, differences are larger between LI ERA5 and Aon's IF Euro WS model/PERILS and can reach up to five positions, e.g., for the United Kingdom. In general, the agreement/disagreement between LI ERA5 on the one hand and Aon's IF Euro WS model/PERILS on the other hand is different for each country, and systematic differences are not apparent. Nevertheless, the results suggest that LI ERA5 might have difficulties in clearly distinguishing individual storms from one another, i.e., that the loss values of the most extreme events are too close together. This is examined in more detail in the following sections.
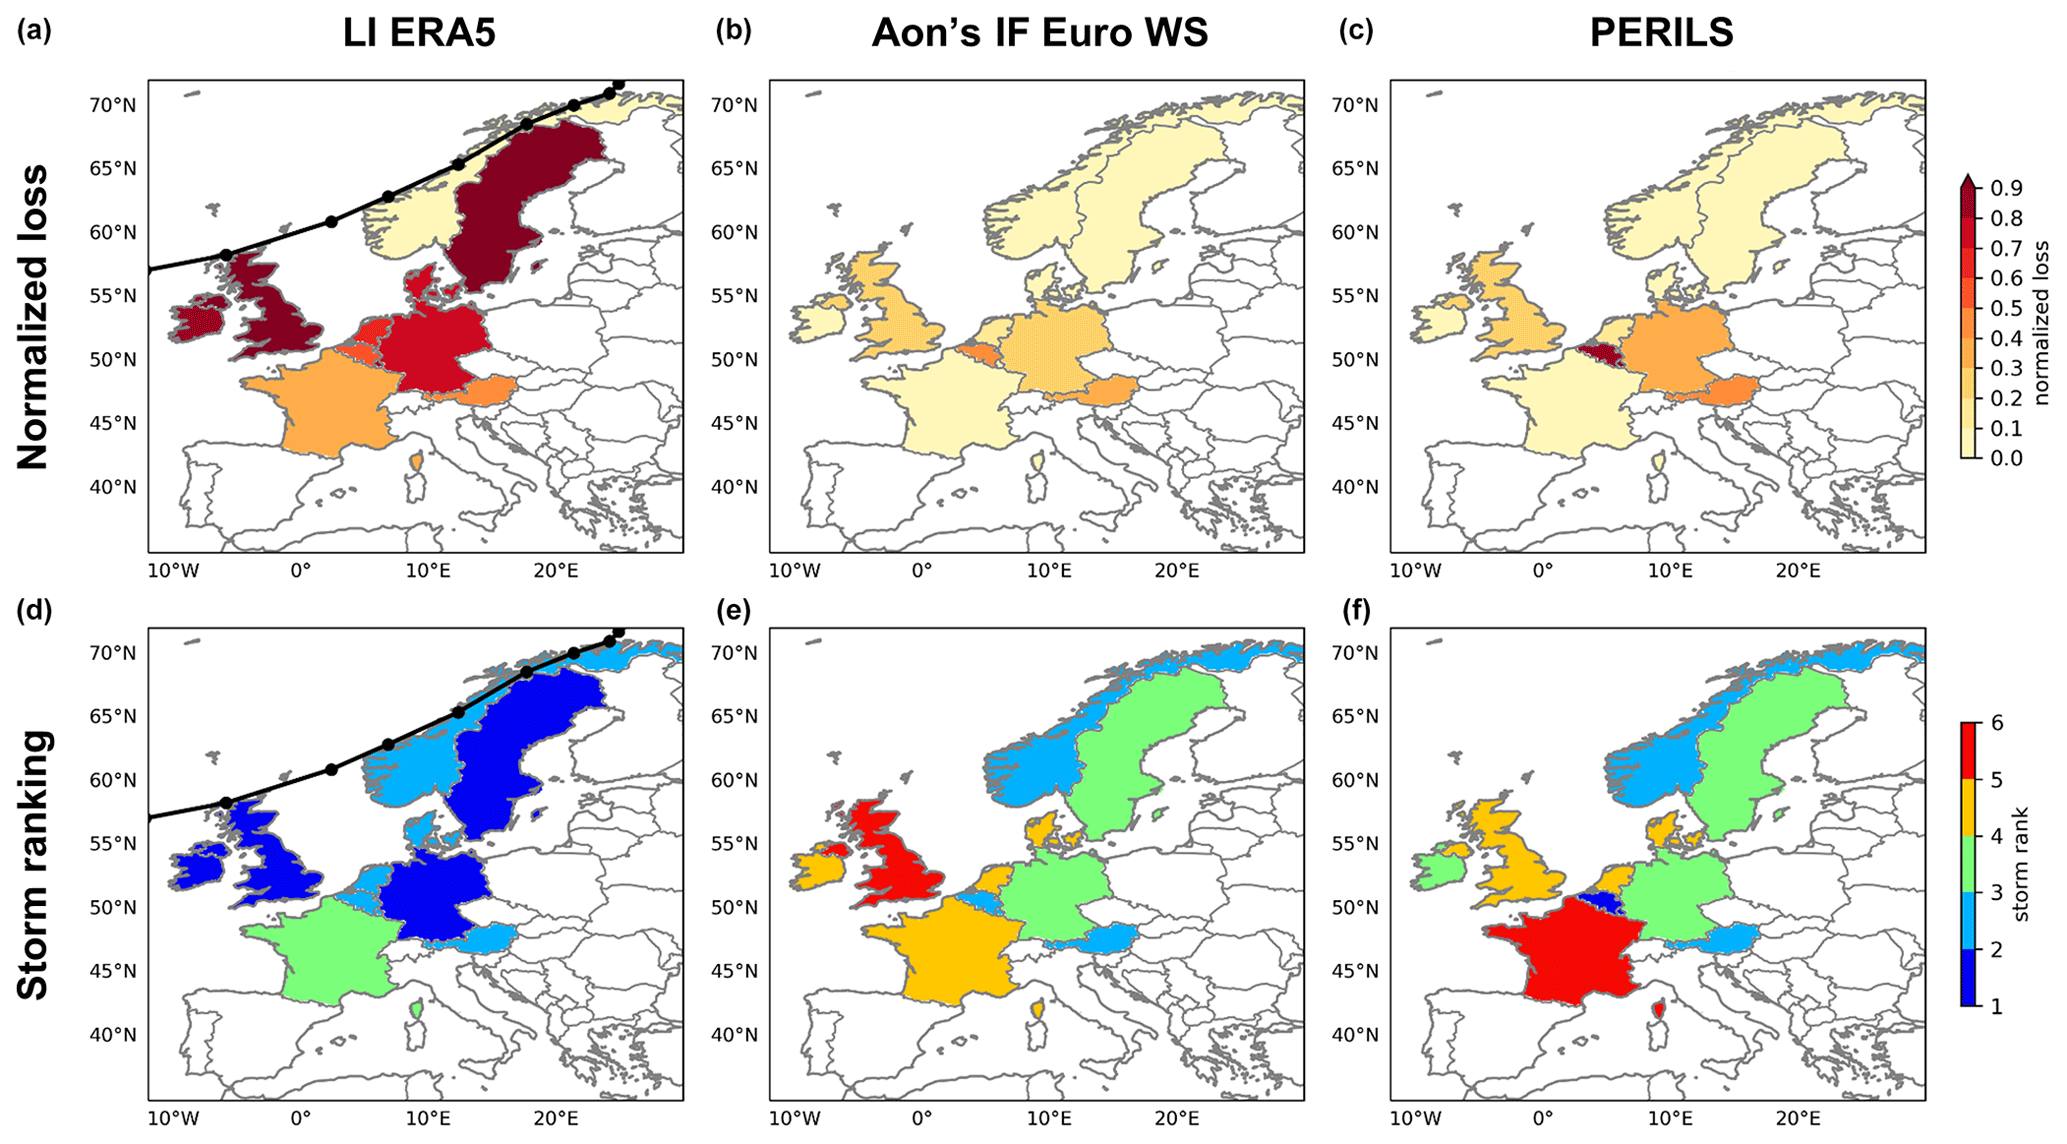
Figure 6Normalized losses (a–c) and storm ranking (d–f) at country level for Storm Sabine in February 2020. Losses are derived from LI ERA5 (a, d), Aon's IF Euro WS model (b, e) and PERILS (c, f). The black line and dots in the left column denote the cyclone track derived from ERA5 using the tracking algorithm of Pinto et al. (2005). Losses are only shown for the 11 countries covered by Aon. The ranking is based on common storms per country (see Table 1 and Fig. S4).
5.2 Windstorm loss
In this section, we compare the normalized loss values derived from Aon's IF Euro WS model (x axis) and LI ERA5 (y axis) for all common storms for four different regions/countries: Core Europe, the United Kingdom, Germany and France (Fig. 7). In general, the two datasets reveal large differences. Only individual storm events like Daria in January 1990 or Kyrill in January 2007 show comparable normalized losses. This is supported by a rather large spread of storm events along the regression line (Fig. 7). Nevertheless, only a small number of storms are identified as outliers based on the IQR method – for example, Sabine in Core Europe or Martin in France. For LI ERA5, the range of loss values is quite similar between larger regions like Core Europe and smaller regions (individual countries). Aon's IF Euro WS model, on the other hand, reveals a different range of loss values for different regions. Within individual regions, Aon's IF Euro WS model shows a clear distinction between extreme high-loss storm events such as Daria and events with moderate losses (e.g., Isaias). Normalized loss values between those events can differ by a factor of up to 1000 for single countries. This distinction is less pronounced in LI ERA5 (see, e.g., Fig. 7b), where the individual storm events are closer together and usually differ by a factor of less than 100 in terms of their respective normalized loss. Such differences are not uncommon when comparing loss datasets (Moemken et al., 2024).
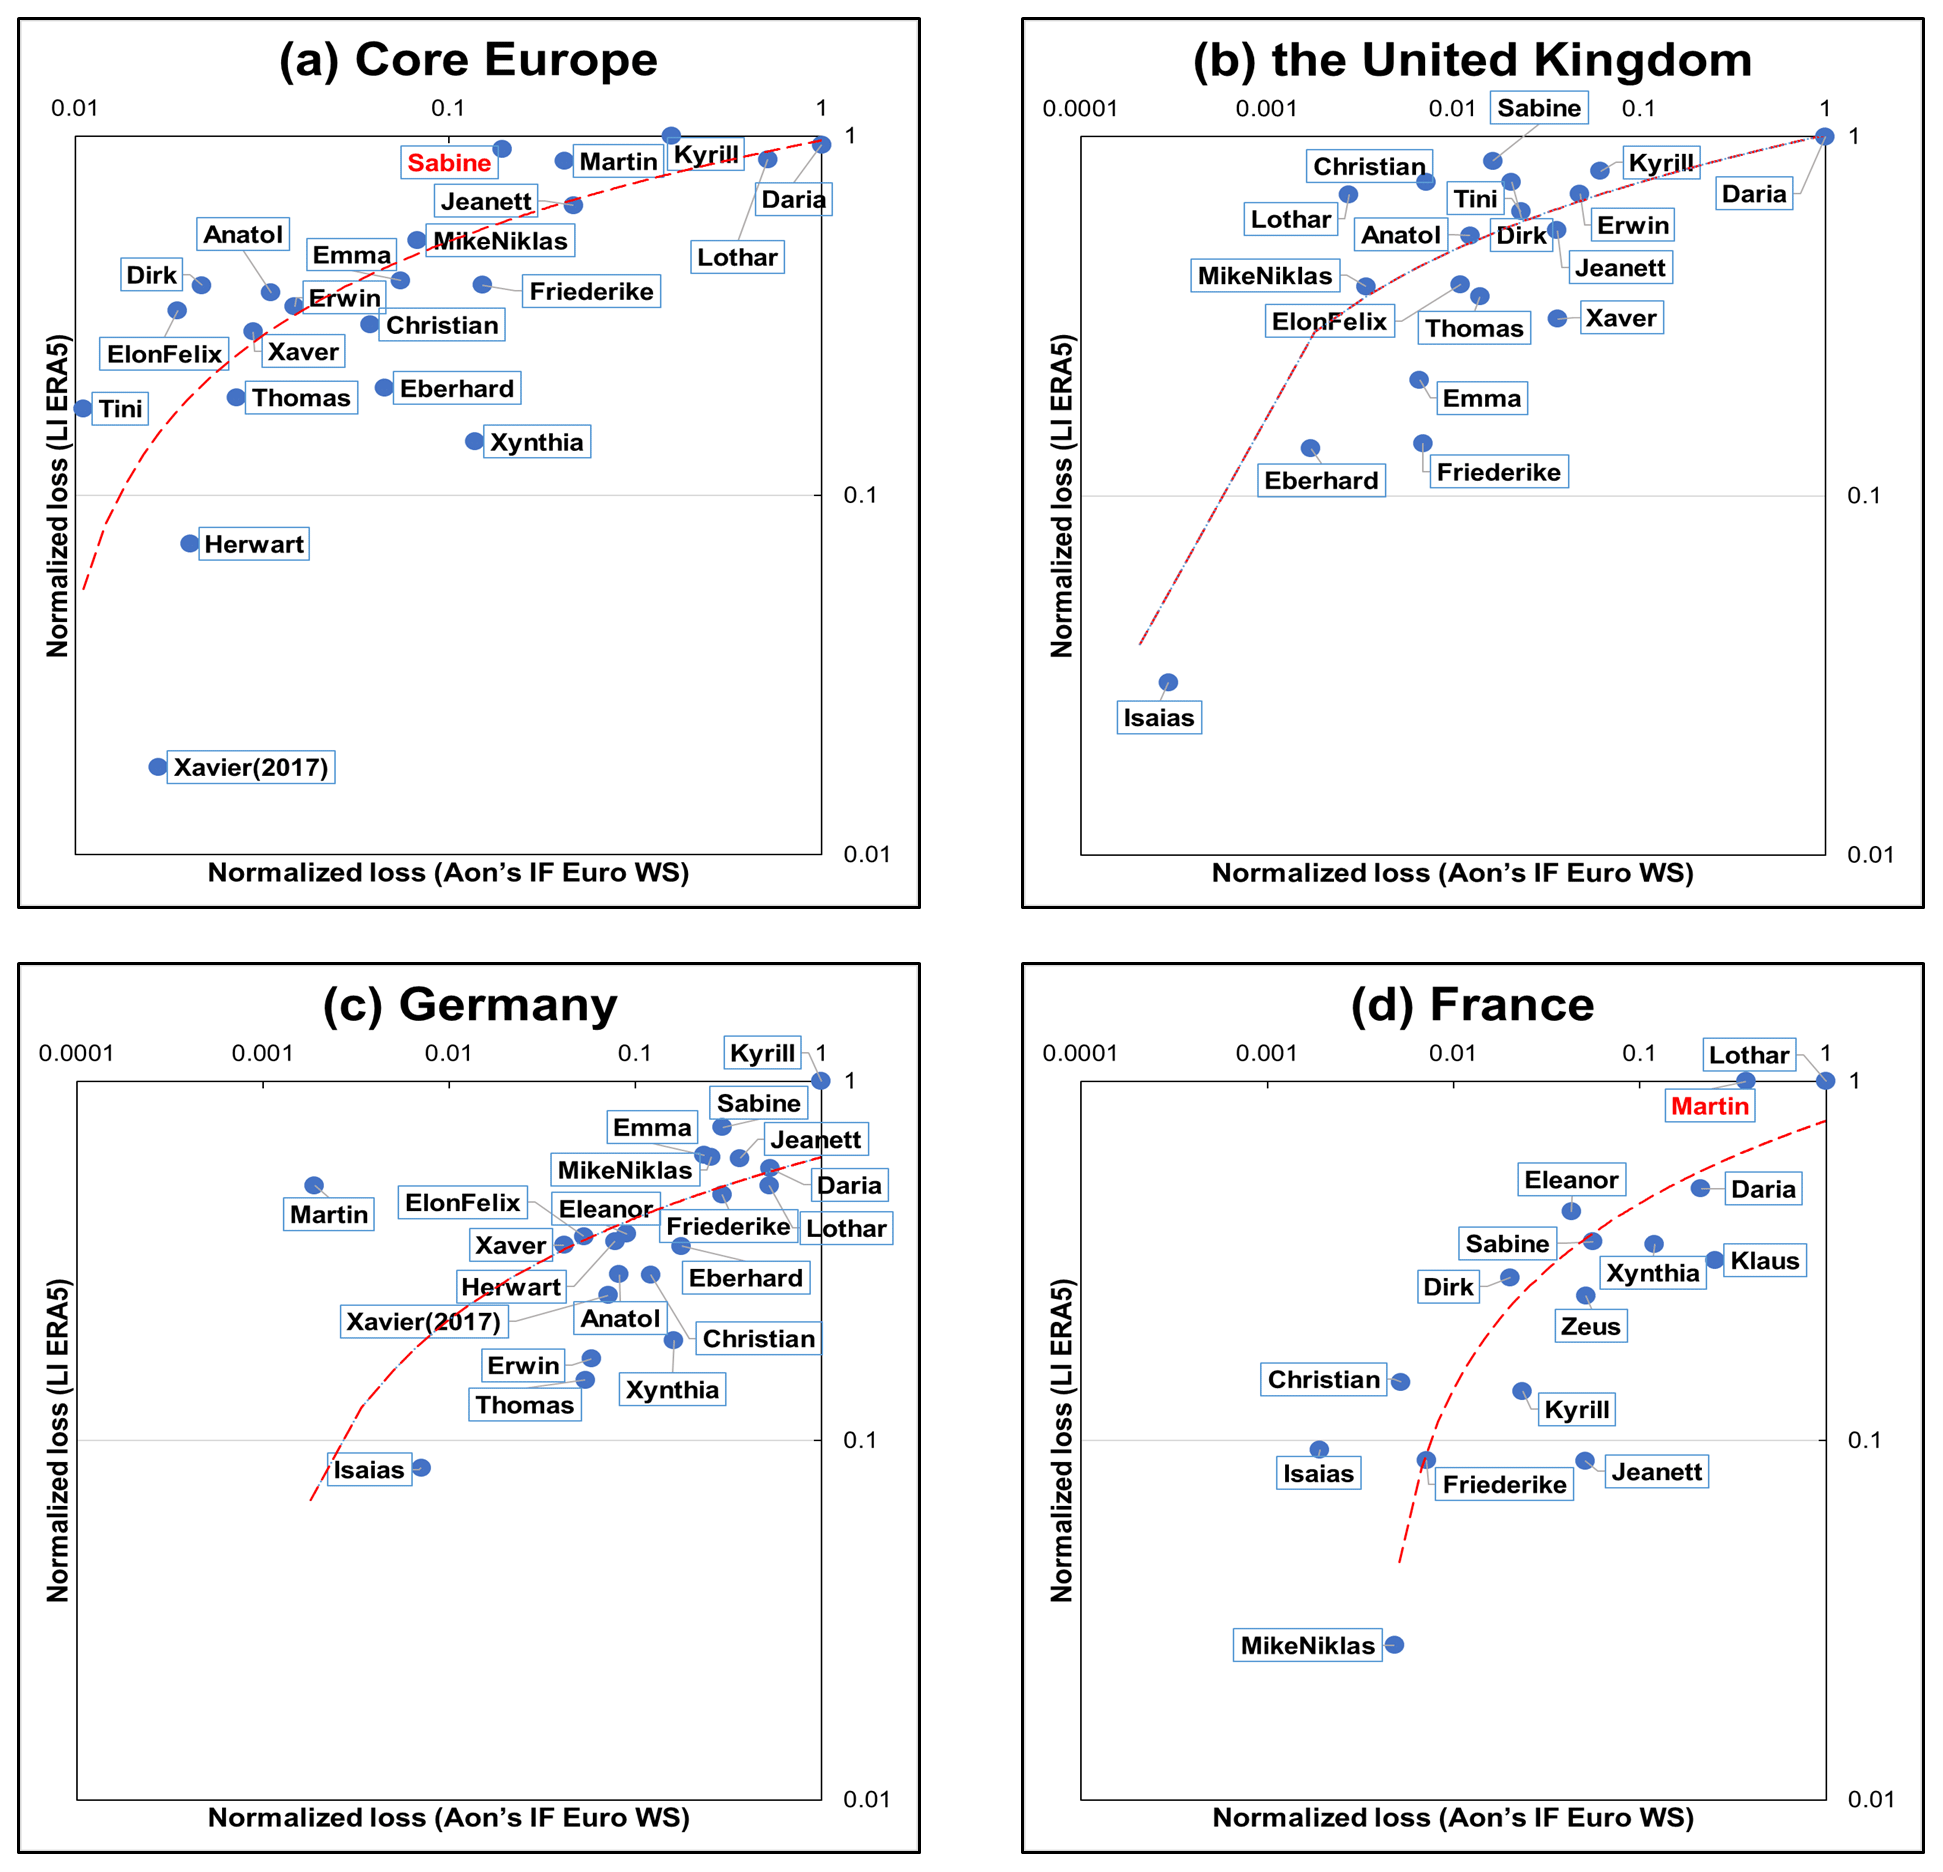
Figure 7Comparison of normalized loss values between Aon's IF Euro WS model (x axis) and LI ERA5 (y axis). Depicted are the common most extreme storms for the 1990–2020 period for (a) Core Europe, (b) the United Kingdom, (c) Germany and (d) France. A logarithmic scale is used for the axes. The dashed red line denotes the logarithmic regression. Outlier storms based on the IQR method are marked in red. Please note the different scales.
In a sensitivity study, we tested whether the differences between LI ERA5 and Aon's IF Euro WS model result from the different event definitions – 72 h periods vs. 24 h periods. With this aim, we calculated LI ERA5 for running 24 h windows. The comparison of normalized loss values is shown in Fig. S5 (see Fig. S6 for storm ranks). Overall, we find no systematic reduction in the differences between LI ERA5 and Aon's IF Euro WS model when using 24 h windows instead of 72 h windows. For some storms and/or countries, differences decrease with a shorter event definition (e.g., for Germany), while for others they increase (e.g., Core Europe). Moreover, the number of common storm events decreases with a shorter event definition for LI ERA5 (not shown).
5.3 Storm ranking
We also compare LI ERA5 and Aon's IF Euro WS model in terms of storm ranks for the common most extreme storms per country. Figure 8 shows this comparison for Core Europe, the United Kingdom, Germany and France. As for the normalized losses, we see rather large differences between the datasets, though less pronounced. Most events show rank differences in the range of zero to three positions. Only in the case of individual storms, such as Klaus in Core Europe or Martin in Germany, can rank differences reach up to 16 positions. These events are also marked as outliers based on the IQR method.
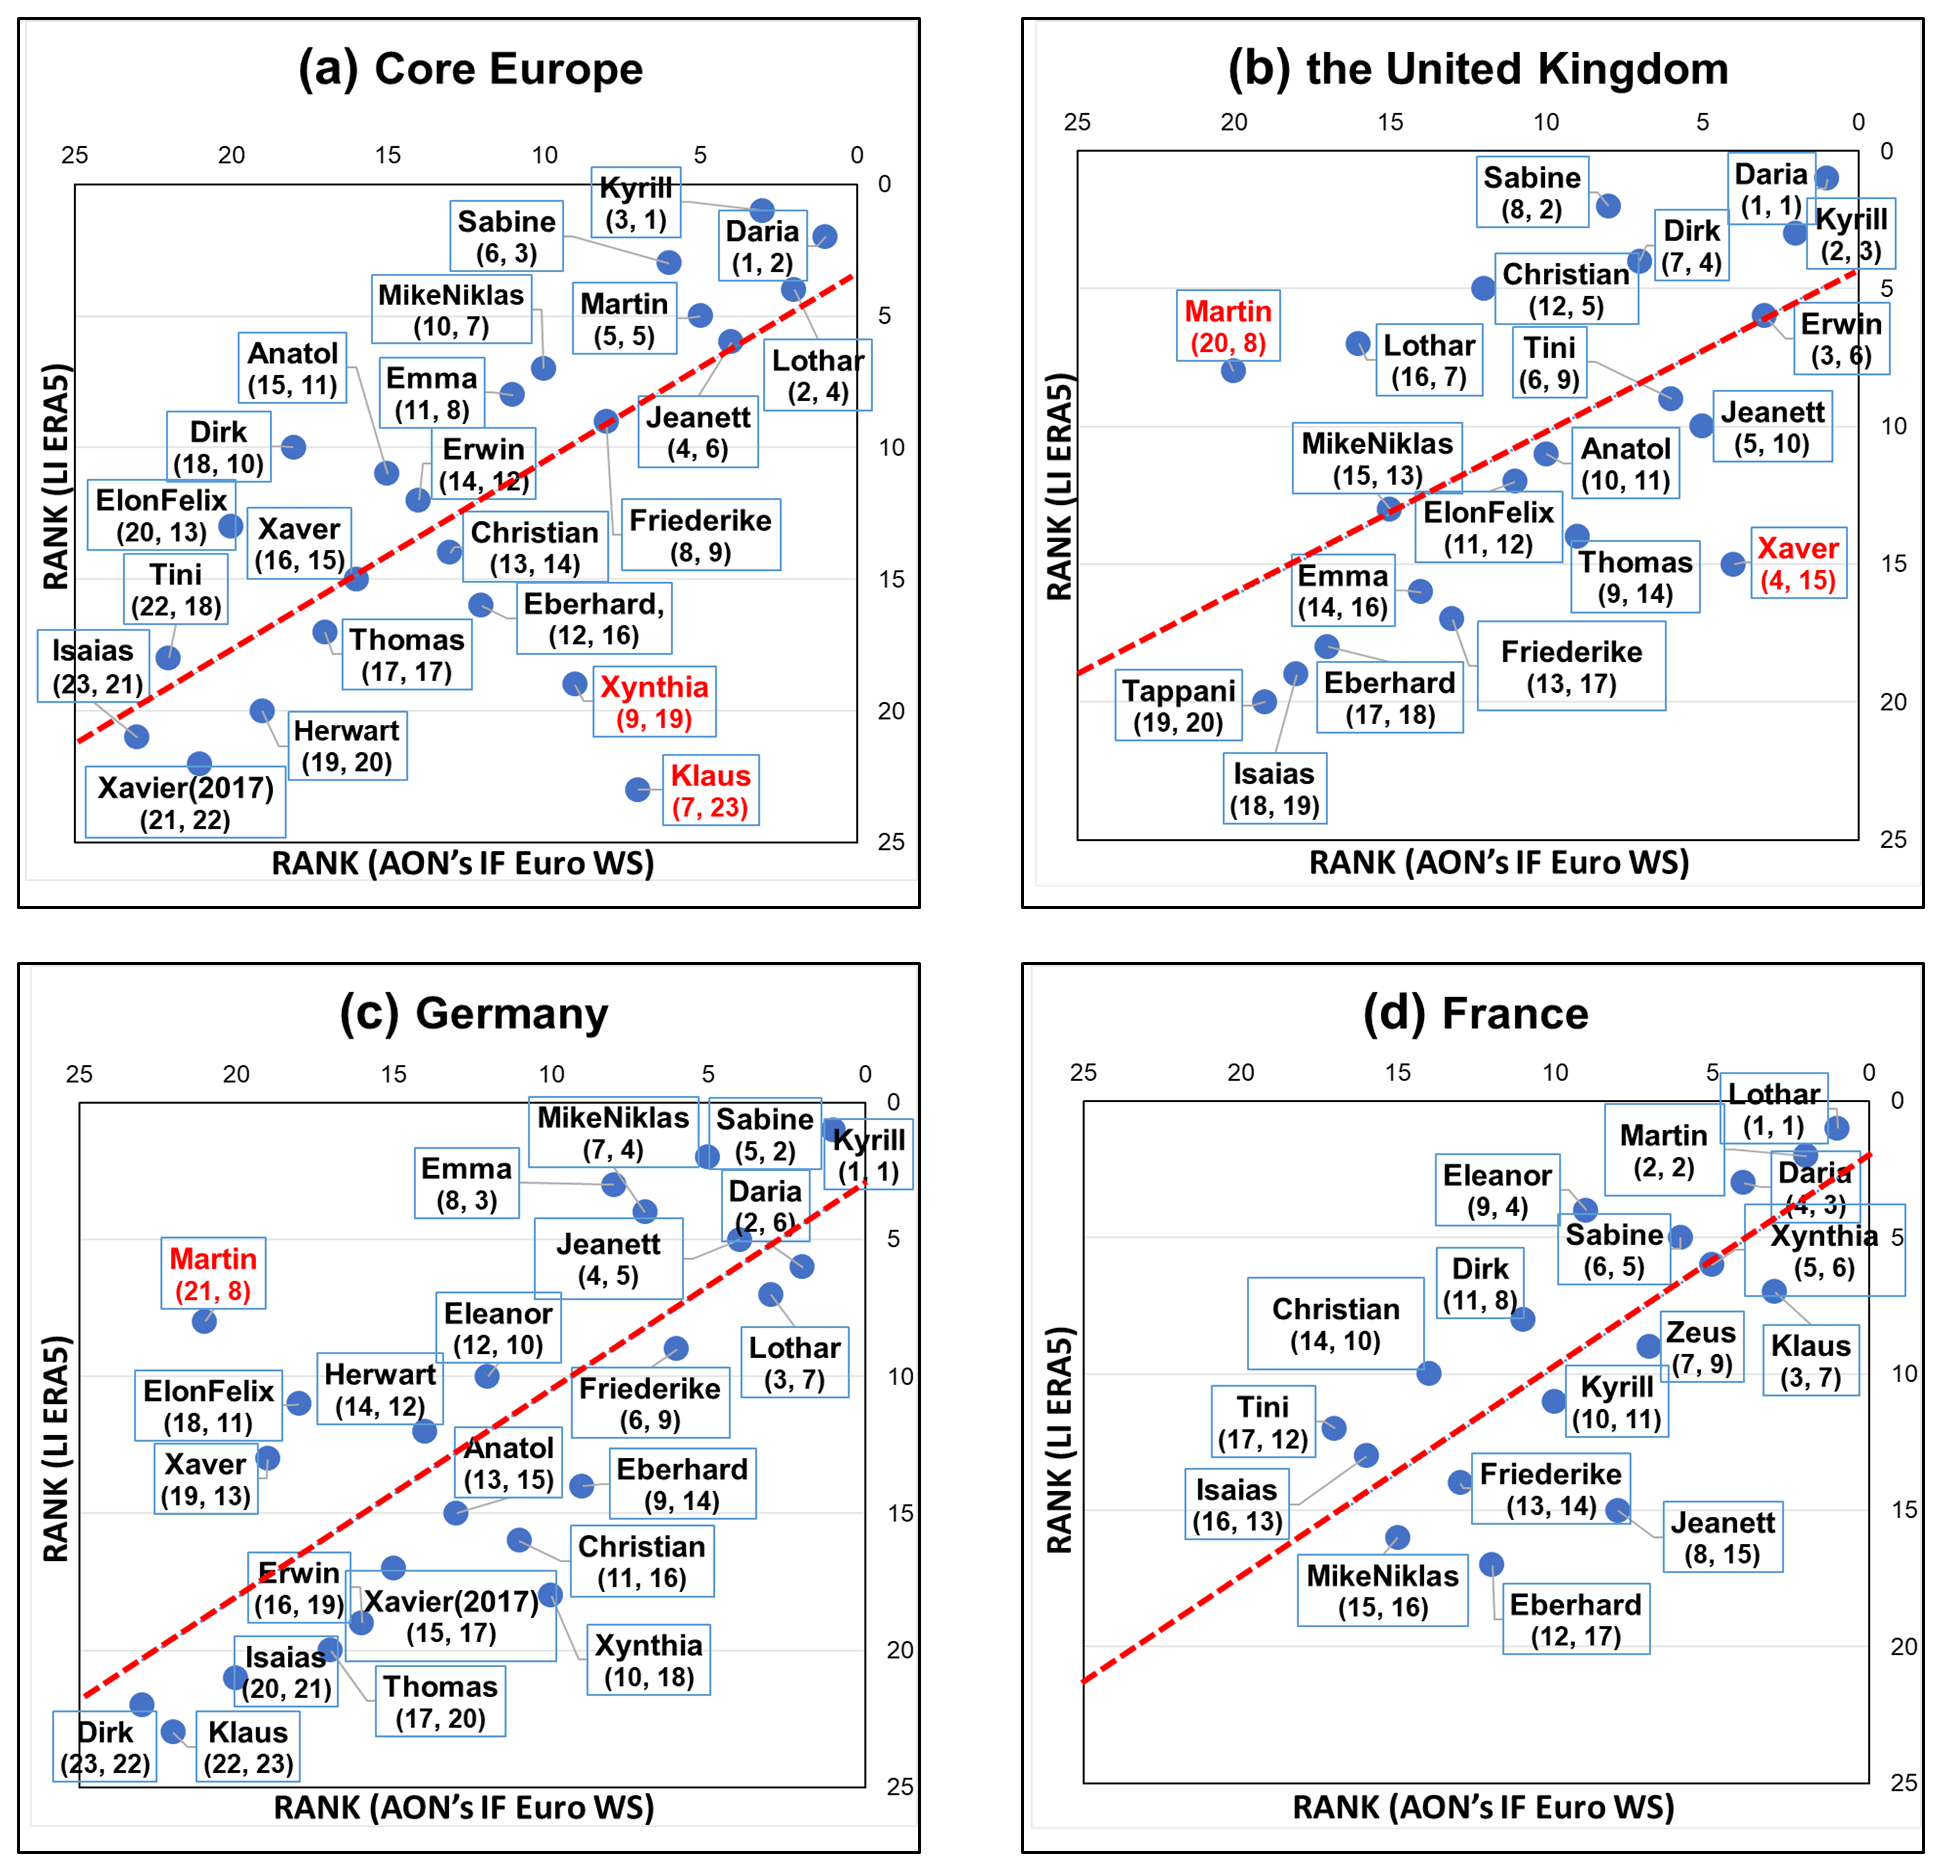
Figure 8The same as Fig. 7 but for the comparison of storm ranks. The values in brackets indicate the rank (first value – Aon's model, second value – ERA5).
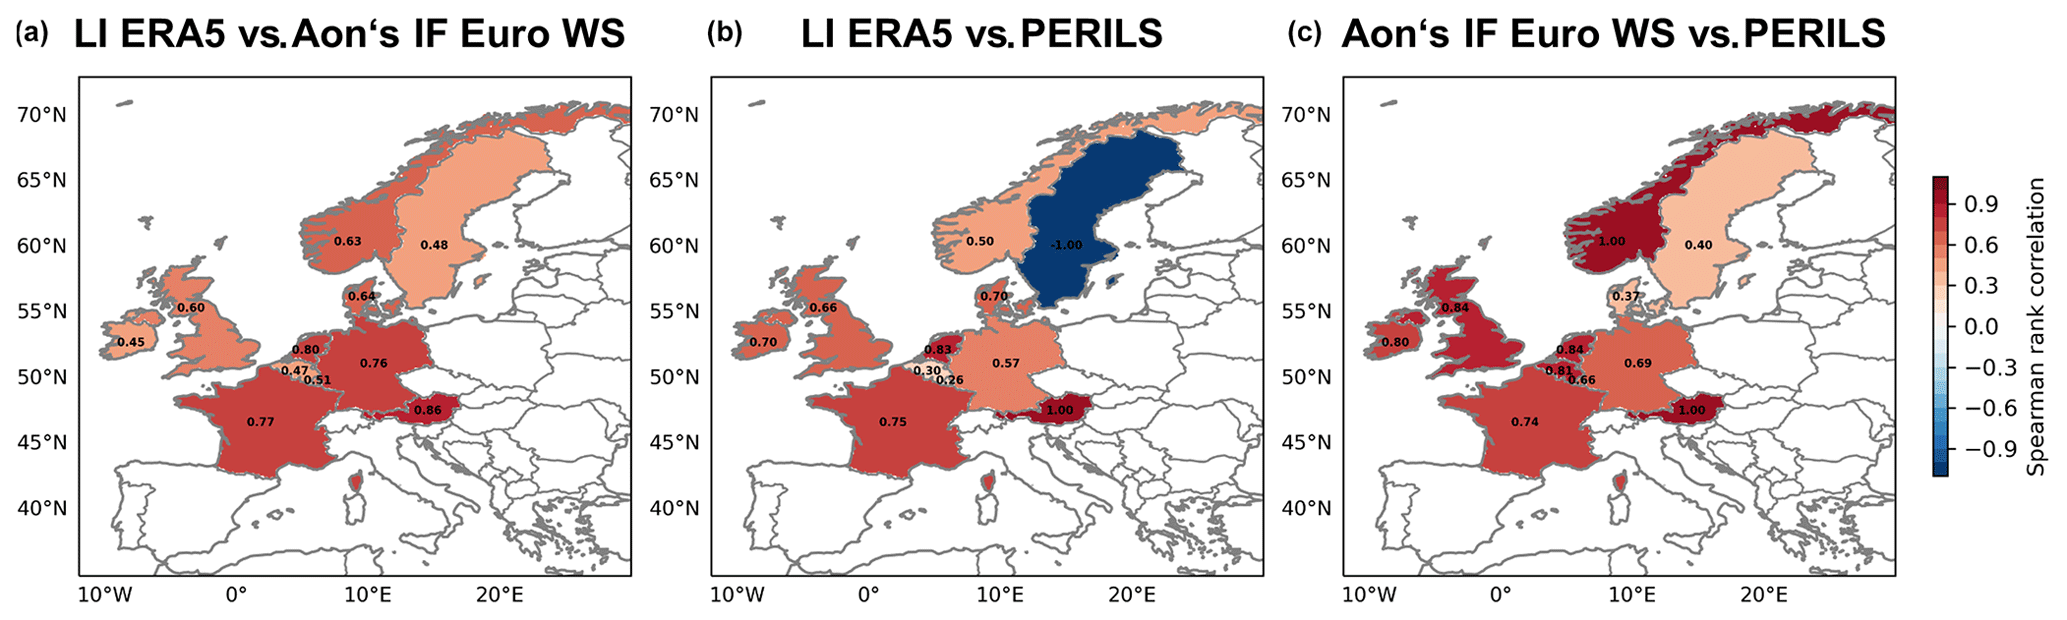
Figure 9Spearman's rank correlation coefficient at country level for LI ERA5 vs. Aon's IF Euro WS model (a), LI ERA5 vs. PERILS (b) and Aon's IF Euro WS model vs. PERILS (c). The ranking is based on common storms per country (see Table 1 and Fig. S4).
Finally, we compare Spearman's rank correlation coefficients (Fig. 9) and the corresponding explained variance (R2; Table 1), again including PERILS as a reference. Figure 9 displays the correlation coefficients for each country, providing a clear depiction of the agreement or disagreement between LI ERA5, Aon's IF Euro WS model and PERILS. For most parts of central Europe, LI ERA5 and Aon's IF Euro WS model show a high agreement, with correlation values reaching up to 0.86 for Austria. Lower correlations with values below 0.5 and therefore larger differences can be found for Ireland, Belgium and Sweden. The correlation pattern between LI ERA5 and PERILS looks similar, with overall lower values. Only the perfect anti-correlation for Sweden and the perfect correlation for Austria are striking. However, these values could be due to the small sample of common storms (see Fig. S4) and should therefore be viewed with caution. The comparison of Aon's IF Euro WS model and PERILS reveals mostly high correlation coefficients, ranging between 0.69 for Germany and 1.0 for Austria and Norway. In terms of the explained variance, Austria exhibits the highest R2 value when comparing LI ERA5 against Aon's IF Euro WS model and PERILS (Table 1). This result suggests that for Austria, over 70 % of the variation in the ranks of loss from one dataset can be explained by the variation in the ranks of the other loss values. Due to the small sample of common events in some countries, some correlation values in this comparison should also be treated with care.
In this study, we compared estimated windstorm losses over Europe from the meteorological loss index (LI) and the catastrophe windstorm model of Aon Impact Forecasting, used in insurance. Furthermore, we tested the sensitivity of LI to the meteorological input data by using both ERA5 and its predecessor ERA-Interim. The main results can be summarized as follows.
-
For all of Europe, LI values are higher for ERA5 than for ERA-Interim (by roughly a factor of 10). The main reason is the higher spatial resolution in ERA5. Additionally, the wind gust distribution in ERA5 is slightly shifted towards higher values and has a longer tail. With regard to normalized losses and storm ranks, LI ERA5 and LI ERA-Interim show a comparable behavior for Core Europe, with Spearman's rank correlation mostly ranging between 0.61 (Ireland) and 0.89 (France).
-
Compared to Aon's IF Euro WS model, LI ERA5 shows overall lower normalized loss values, while the storm ranks are comparable for most of Core Europe (correlations between 0.45 and 0.8). Moreover, Aon's IF Euro WS model reveals a clearer distinction between high- and moderate-impact events. The difference between the highest and lowest insured loss, as given by Aon's IF Euro WS model (e.g., Daria vs. Isaias in the United Kingdom; see Fig. 7b), is 3 orders of magnitude, while the corresponding LI ERA5 difference is typically 1 to 1.5 orders of magnitude. In addition, the catastrophe model shows a clear regional dependency of loss values. This regional dependence is less pronounced in LI ERA5.
In previous studies, LI has been calculated and analyzed for a variety of reanalysis datasets with different spatial and temporal resolutions: ERA-40 with 1.125° and 6-hourly resolution in Pinto et al. (2012), NCEP with 1.875° and 6-hourly resolution in Karremann et al. (2014a), or ERA-Interim with 0.75° and 6-hourly resolution in Priestley et al. (2018). In line with our results, these studies show that the magnitude of LI is sensitive to the spatial resolution of the underlying dataset. Nevertheless, they all agree on the general (regional) behavior of LI. Another reason for the different LI values for ERA5 compared to ERA-Interim is a slight shift towards higher gust speeds and a longer tail in the wind gust distribution of ERA5. This is in line with Minola et al. (2020), who compared wind gust data from ERA-Interim and ERA5 with observational data across Sweden. They find an overall better agreement between observations and ERA5, although some discrepancies persist in regions with complex topography. We therefore conclude that it is adequate to use the recent ERA5 dataset for the comparison to the insurance model in the second part of our study.
One reason for the differences between the meteorological index and the catastrophe model of Aon Impact Forecasting is their different methodological design: first, Aon's IF Euro WS model uses a 1 d window for the loss calculation, while LI ERA5 is based on 72 h windows. Thus, Aon's IF Euro WS model is better able to separate storm events in short succession (like Lothar and Martin in December 1999). In a sensitivity study, we could show that using a 24 h event definition for LI ERA5 does not lead to a systematic reduction in the differences between LI ERA5 and Aon's IF Euro WS model (Sect. 5.2). Therefore, we decided to stick to the 72 h event definition in LI ERA5. This has several advantages: we are able to capture the entire windstorm footprint (Hewson and Neu, 2015). Additionally, the 72 h event definition corresponds to a definition often used in reinsurance treaties (the so-called 72 h clause; Klawa and Ulbrich, 2003; Karremann et al., 2014a). Finally, the correlations between LI ERA5 and Aon's IF Euro WS model are higher when using 72 h windows, especially for Core Europe. Another methodological difference is the consideration of different risk components. LI ERA5 only includes the hazard component and an estimate for the exposure component, while Aon's IF Euro WS model additionally includes a sophisticated engineering-based vulnerability component that takes, e.g., building resistance, loss frequency due to quasi-random effects and local societal adaptations into account.
Aside from that, our study reveals some shortcomings of the two approaches. As with all meteorological indices, LI relies upon the quality of both the underlying wind data and the impact function used for the calculation of loss. In the specific case of LI, the initial index was developed and evaluated for Germany by Klawa and Ulbrich (2003), employing insurance data of Munich Re and the Gesamtverband der Deutschen Versicherer (GDV) e.V. In a follow-up study, Karremann et al. (2014b) were able to demonstrate that the chosen 98th percentile is an appropriate threshold to identify extreme storm events over central and western Europe. Nevertheless, they also point out that the 98th percentile might be too low for southeastern Europe, the Mediterranean and Scandinavia. For these regions, Karremann et al. (2014b) suggest the use of a fixed, reasonable threshold below which losses are improbable. Moreover, the usage of present-day population density as a proxy for exposure levels might lead to an overestimation of loss values (Koks and Haer, 2020). Furthermore, LI depends on the gust data used. The ERA5 wind gust data we use here are based on the parameterization approach by Panofsky et al. (1977). While this approach performs well in flat terrain, it is sensitive to the local parameterization of the roughness length (Born et al., 2012; van den Brink, 2019). Finally, the LI lacks a detailed damage component. The applied cubic relation tries to mimic the non-linear response of buildings to wind gusts. However, compared to the market perspective of Aon's IF Euro WS model, LI ERA5 seems to struggle with capturing this non-linearity, especially for the high-impact events at the tail of the gust spectrum. In some extreme cases, certain exposures (e.g., greenhouses, timber building or agricultural buildings) may have vulnerability functions approximating a step function. Various studies have tested different formulations of meteorological indices, also considering different exponents (e.g., Klawa and Ulbrich, 2003; Pinto et al., 2012; Prahl et al., 2015; Gliksman et al., 2023). All these studies agree that the performance of the different indices depends on the underlying event set. For some events, formulations with higher exponents seem to estimate windstorm losses better, while for other events, the cubic relationship provides results that are more realistic. In this sense, no formulation clearly outperforms the others. Aon's IF Euro WS model, on the other hand, includes no information on uninsured market loss. Additionally, insurance data in general depend on the insurance coverage and policy in single countries. Both factors might result in an overrepresentation of windstorms that hit countries with high market coverage (Moemken et al., 2024).
The current study is, to our knowledge, the first to compare a full insurance windstorm model (which is not publicly available) to a simplified meteorological loss index. For this reason, and due to some proprietary restrictions, we decided to focus on a straightforward comparison of the two methods. Overall, our results suggest that the loss distribution in LI is not steep enough, and accordingly the tail is too short, leading to an underestimation of high-impact windstorms compared to the market perspective derived from the insurance catastrophe model. Nonetheless, LI is an effective index precisely because of its simplicity since it only considers wind gust and population density. Although it cannot be used to estimate the cost of a storm (due to the missing vulnerability information), it is suitable for estimating the impacts and rank events. The first comparison between a meteorological index and a full commercial windstorm model could serve as a reference for future studies focusing on the development and improvement of both storm loss models and storm severity indices.
The ERA5 reanalysis data were retrieved from the Copernicus Climate Change Service (C3S) Climate Data Store (https://doi.org/10.24381/cds.143582cf, Hersbach et al., 2017). The ERA-Interim reanalysis data were retrieved from the ECMWF (https://doi.org/10.24381/cds.f2f5241d, Dee et al., 2011b). Access to PERILS is granted via an annual subscription in accordance with the PERILS database license.
The supplement related to this article is available online at: https://doi.org/10.5194/nhess-24-3445-2024-supplement.
JM, AMR and JGP conceived and designed the study. IA performed the data analysis and made the figures with the help of AG, AB and LB. JM wrote the initial paper draft. All authors discussed the results and contributed with paper revisions.
At least one of the (co-)authors is a member of the editorial board of Natural Hazards and Earth System Sciences. The peer-review process was guided by an independent editor, and the authors also have no other competing interests to declare.
Publisher’s note: Copernicus Publications remains neutral with regard to jurisdictional claims made in the text, published maps, institutional affiliations, or any other geographical representation in this paper. While Copernicus Publications makes every effort to include appropriate place names, the final responsibility lies with the authors.
Inovasita Alifdini was funded by the European Union's Horizon 2020 research and innovation program under the Marie Skłodowska-Curie Actions (grant no. 956396; EDIPI project). Julia Moemken was funded by the Bundesministerium für Bildung und Forschung (BMBF; German Ministry for Education and Research) under the RegIKlim-NUKLEUS project (01LR2002B and 01LR2002B1). Joaquim G. Pinto thanks the AXA Research Fund for support. Alexandre M. Ramos was supported by the Helmholtz Changing Earth program. We thank the German Climate Computing Center (DKRZ; Hamburg) for computing and storage resources. Inovasita Alifdini thanks Petr Svoboda and the Aon Impact Forecasting team for support during her stay in Prague. We thank Ting-Chen Chen for preparing the cyclone track data, Jisesh Sethunadh for discussions about the LI calculations and Federico Stainoh (all KIT) for suggestions on the statistical analysis methods. We thank the three reviewers and the editor for their valuable comments.
This research has been supported by the H2020 Marie Skłodowska-Curie Actions (grant no. 956396), the Bundesministerium für Bildung und Forschung (grant nos. 01LR2002B and 01LR2002B1), and the AXA Research Fund.
The article processing charges for this open-access publication were covered by the Karlsruhe Institute of Technology (KIT).
This paper was edited by Ricardo Trigo and reviewed by three anonymous referees.
Aon: 2023 – Weather, Climate and Catastrophe Insight, https://www.aon.com/getmedia/f34ec133-3175-406c-9e0b-25cea768c5cf/20230125-weather-climate-catastrophe-insight.pdf (last access: 4 October 2023), 2023a.
Aon: Impact Forecasting – Transparent and Customizable Catastrophe Models and Platform, https://assets.aon.com/-/media/files/aon/capabilities/reinsurance/aon-impact-forecasting.pdf (last access: 23 November 2023), 2023b.
Bechthold, P. and Bidlot, J. R.: Parametrization of convective gusts, ECMWF Newsletter, 199, 15–18, https://doi.org/10.21957/kfr42kfp8c, 2009.
Born, K., Ludwig, P., and Pinto, J. G.: Wind gust estimation for Mid-European winter storms: towards a probabilistic view, Tellus A, 64, 17471, https://doi.org/10.3402/tellusa.v64i0.17471, 2012.
Dee, D. P., Uppala, S. M., Simmons, A. J., Berrisford, P., Poli, P., Kobayashi, S., Andrae, U., Balmaseda, M. A., Balsamo, G., Bauer, P., Bechtold, P., Beljaars, A. C. M., van de Berg, L., Bidlot, J., Bormann, N., Delsol, C., Dragani, R., Fuentes, M., Geer, A. J., Haimberger, L., Healy, S. B., Hersbach, H., Hólm, E. V., Isaksen, L., Kållberg, P., Köhler, M., Matricardi, M., McNally, A. P., Monge-Sanz, B. M., Morcrette, J.-J., Park, B.-K., Peubey, C., de Rosnay, P., Tavolato, C., Thépaut, J.-N., and Vitart, F.: The ERA-Interim reanalysis: configuration and performance of the data assimilation system, Q. J. Roy. Meteor. Soc., 137, 553–597, https://doi.org/10.1002/qj.828, 2011a.
Dee, D. P., Uppala, S. M., Simmons, A. J., Berrisford, P., Poli, P., Kobayashi, S., Andrae, U., Balmaseda, M. A., Balsamo, G., Bauer, P., Bechtold, P., Beljaars, A. C. M., van de Berg, L., Bidlot, J., Bormann, N., Delsol, C., Dragani, R., Fuentes, M., Geer, A. J., Haimberger, L., Healy, S. B., Hersbach, H., Hólm, E. V., Isaksen, L., Kållberg, P., Köhler, M., Matricardi, M., McNally, A. P., Monge-Sanz, B. M., Morcrette, J. J., Park, B. K., Peubey, C., de Rosnay, P., Tavolato, C., Thépaut, J. N., and Vitart, F.: ERA-Interim global atmospheric reanalysis, Copernicus Climate Change Service (C3S) Climate Data Store (CDS) [data set], https://doi.org/10.24381/cds.f2f5241d, 2011b.
Deutsche Rück: Sturmdokumentationen 1997–2004, Publication of the Deutsche Rück Reinsurance Company. Düsseldorf, Germany, https://www.deutscherueck.de/fileadmin/Downloads/Sturmdoku_1997_2004_web.pdf (last access: 20 December 2023), 2005 (in German).
Dodge, Y.: The Concise Encyclopaedia of Statistics, Springer, New York, NY, https://doi.org/10.1007/978-0-387-32833-1_379, 2008.
Donat, M. G., Pardowitz, T., Leckebusch, G. C., Ulbrich, U., and Burghoff, O.: High-resolution refinement of a storm loss model and estimation of return periods of loss-intensive storms over Germany, Nat. Hazards Earth Syst. Sci., 11, 2821–2833, https://doi.org/10.5194/nhess-11-2821-2011, 2011.
Dorland, C., Tol, R. S. J., and Palutikof, J.: Vulnerability of the Netherlands and Northwest Europe to storm damage under climate change, Climatic Change, 43, 513–535, https://doi.org/10.1023/A:1005492126814, 1999.
Feser, F., Barcikowska, M., Krueger, O., Schenk, F., Weisse, R., and Xia, L.: Storminess over the North Atlantic and northwestern Europe – A review, Q. J. Roy. Meteor. Soc., 141, 350–382, https://doi.org/10.1002/qj.2364, 2015.
Fink, A. H., Brücher, T., Ermert, V., Krüger, A., and Pinto, J. G.: The European storm Kyrill in January 2007: synoptic evolution, meteorological impacts and some considerations with respect to climate change, Nat. Hazards Earth Syst. Sci., 9, 405–423, https://doi.org/10.5194/nhess-9-405-2009, 2009.
Gliksman, D., Averbeck, P., Becker, N., Gardiner, B., Goldberg, V., Grieger, J., Handorf, D., Haustein, K., Karwat, A., Knutzen, F., Lentink, H. S., Lorenz, R., Niermann, D., Pinto, J. G., Queck, R., Ziemann, A., and Franzke, C. L. E.: Review article: A European perspective on wind and storm damage – from the meteorological background to index-based approaches to assess impacts, Nat. Hazards Earth Syst. Sci., 23, 2171–2201, https://doi.org/10.5194/nhess-23-2171-2023, 2023.
Haas, R. and Pinto, J. G.: A combined statistical and dynamical approach for downscaling large-scale footprints of European windstorms, Geophys. Res. Lett., 39, L23804, https://doi.org/10.1029/2012GL054014, 2012.
Haylock, M. R.: European extra-tropical storm damage risk from a multi-model ensemble of dynamically-downscaled global climate models, Nat. Hazards Earth Syst. Sci., 11, 2847–2857, https://doi.org/10.5194/nhess-11-2847-2011, 2011.
Hersbach, H., Bell, B., Berrisford, P., Hirahara, S., Horányi, A., Muñoz-Sabater, J., Nicolas, J., Peubey, C., Radu, R., Schepers, D., Simmons, A., Soci, C., Abdalla, S., Abellan, X., Balsamo, G., Bechtold, P., Biavati, G., Bidlot, J., Bonavita, M., De Chiara, G., Dahlgren, P., Dee, D., Diamantakis, M., Dragani, R., Flemming, J., Forbes, R., Fuentes, M., Geer, A., Haimberger, L., Healy, S., Hogan, R. J., Hólm, E., Janisková, M., Keeley, S., Laloyaux, P., Lopez, P., Lupu, C., Radnoti, G., de Rosnay, P., Rozum, I., Vambord, F., Villaume, S., and Thépaut, J.-N.: The ERA5 global reanalysis, Q. J. Roy. Meteor. Soc., 146, 1999–2049, https://doi.org/10.1002/qj.3803, 2020.
Hersbach, H., Bell, B., Berrisford, P., Hirahara, S., Horányi, A., Muñoz-Sabater, J., Nicolas, J., Peubey, C. Radu, R., Schepers, D., Simmons, A., Soci, C., Abdalla, S., Abellan, X., Balsamo, G., Bechtold, P., Biavati, G., Bidlot, J., Bonavita, M., De Chiara, G., Dahlgren, P., Dee, D., Diamantakis, M., Dragani, R., Flemming, J., Forbes, R., Fuentes, M., Geer, A., Haimberger, L., Healy, S., Hogan, R.J., Hólm, E., Janisková, M., Keeley, S., Laloyaux, P., Lopez, P., Lupu, C., Radnoti, G., de Rosnay, P., Rozum, I., Vamborg, F., Villaume, S., and Thépaut, J.-N.: Complete ERA5 from 1940: Fifth generation of ECMWF atmospheric reanalyses of the global climate, Copernicus Climate Change Service (C3S) Data Store (CDS) [data set], https://doi.org/10.24381/cds.143582cf, 2017.
Hewson, T. and Neu, U.: Cyclones, windstorms and the IMILAST project, Tellus A, 67, 27128, https://doi.org/10.3402/tellusa.v67.27128, 2015.
IPCC: Summary for Policymakers, edited by: Pörtner, H.-O., Roberts, D. C., Poloczanska, E. S., Mintenbeck, K., Tignor, M., Alegría, A., Craig, M., Langsdorf, S., Löschke, S., Möller, V., and Okem, A., in: Climate Change 2022: Impacts, Adaptation, and Vulnerability. Contribution of Working Group II to the Sixth Assessment Report of the Intergovernmental Panel on Climate Change, edited by: Pörtner, H.-O., Roberts, D. C., Tignor, M., Poloczanska, E. S., Mintenbeck, K., Alegría, A., Craig, M., Langsdorf, S., Löschke, S., Möller, V., Okem, A., and Rama, B., Cambridge University Press, Cambridge, UK and New York, NY, USA, 3–33, https://doi.org/10.1017/9781009325844.001, 2022.
Jungclaus, J. H., Keenlyside, N., Botzet, M., Haak, H., Luo, J. J., Latif, M., Marotzke, J., Mikolajewicz, U., and Roeckner, E.: Ocean Circulation and Tropical Variability in the Coupled Model ECHAM5/MPI-OM, J. Climate, 19, 3952–3972, https://doi.org/10.1175/JCLI3827.1, 2006.
Karremann, M. K., Pinto, J. G., von Bomhard, P. J., and Klawa, M.: On the clustering of winter storm loss events over Germany, Nat. Hazards Earth Syst. Sci., 14, 2041–2052, https://doi.org/10.5194/nhess-14-2041-2014, 2014a.
Karremann, M. K., Pinto, J. G., Reyers, M., and Klawa, M.: Return periods of losses associated with European windstorm series in a changing climate, Environ. Res. Lett., 9, 124016, https://doi.org/10.1088/1748-9326/9/12/124016, 2014b.
Klawa, M. and Ulbrich, U.: A model for the estimation of storm losses and the identification of severe winter storms in Germany, Nat. Hazards Earth Syst. Sci., 3, 725–732, https://doi.org/10.5194/nhess-3-725-2003, 2003.
Koks, E. and Haer, T.: A high-resolution wind damage model for Europe, Sci. Rep., 10, 6866, https://doi.org/10.1038/s41598-020-63580-w, 2020.
Lamb, H.: Historic storms of the North Sea, British Isles, and Northwest Europe, Cambridge University Press, ISBN 0521375223, 1991.
Leckebusch, G. C., Renggli, D. and Ulbrich, U.: Development and application of an objective storm severity measure for the Northeast Atlantic region, Meteorol. Z., 17, 575–587, https://doi.org/10.1127/0941-2948/2008/0323, 2008.
Merz, B., Kuhlicke, C., Kunz, M., Pittore, M., Babeyko, A., Bresch, D. N., Domeisen, D. I. V., Feser, F., Koszalka, I., Kreibich, K., Pantillon, F., Parolai, S., Pinto, J. G., Punge, H. J., Rivalta, E., Schröter, K., Strehlow, K., Weisse, R., and Wurpts, A.: Impact Forecasting to Support Emergency Management of Natural Hazards, Rev. Geophys., 58, e2020RG000704, https://doi.org/10.1029/2020RG000704, 2020.
Minola, L., Zhang, F., Azorin-Molina, C., Safaei Pirooz, A.A., Flay, R.G.J., Hersbach, H., and Chen, D.: Near-surface mean and gust wind speeds in ERA5 across Sweden: towards an improved gust parametrization, Clim. Dynam., 55, 887–907, https://doi.org/10.1007/s00382-020-05302-6, 2020.
Mitchell-Wallace, K., Jones, M., Hillier, J., and Foote, M.: Natural Catastrophe Risk Management and Modelling: A Practitioner's Guide, John Wiley & Sons, ISBN 978-1-118-90604-0, 2017.
Moemken, J., Messori, G., and Pinto, J.G.: Windstorm losses in Europe – What to gain from damage datasets, Weather and Climate Extremes, 44, 100661, https://doi.org/10.1016/j.wace.2024.100661, 2024.
Mühr, B., Eisenstein, L., Pinto, J. G., Knippertz, P., Mohr, S., and Kunz, M.: CEDIM Forensic Disaster Analysis Group (FDA): Winter storm series: Ylenia, Zeynep, Antonia (int: Dudley, Eunice, Franklin) – February 2022 (NW & Central Europe), https://doi.org/10.5445/IR/1000143470, 2022.
Munich Re: Risks posed by natural disasters: Losses are trending upwards, https://www.munichre.com/en/risks/natural-disasters-losses-are-trending-upwards.html (last access: 3 February 2023), 2022.
Murray, R. J. and Simmonds, I.: A numerical scheme for tracking cyclone centres from digital data. Part I: development and operation of the scheme, Aust. Meteorol. Mag., 39, 155–166, 1991.
Palutikof, J. P. and Skellern, A. R.: Storm severity over Britain: a report to Commercial Union General Insurance, Climatic Research Unit, School of Environmental Science, University of East Anglia, Norwich, UK, 1991.
Panofsky, H. A., Tennekes, H., Lenschow, D. H., and Wyngaard, J. C.: The characteristics of turbulent velocity components in the surface layer under convective conditions, Bound.-Lay. Meteorol., 11, 355–361, https://doi.org/10.1007/BF02186086, 1977.
Pardowitz, T., Osinski, R., Kruschke, T., and Ulbrich, U.: An analysis of uncertainties and skill in forecasts of winter storm losses, Nat. Hazards Earth Syst. Sci., 16, 2391–2402, https://doi.org/10.5194/nhess-16-2391-2016, 2016.
PERILS: EUR 3,851m – PERILS releases final loss estimate for European Windstorm Series of February 2022, https://www.perils.org/files/News/2022/Loss-Announcements/EU-WS-Series-Feb.-2022/2023-02-21-PERILS-Press-Release-European-Windstorm-Series-Feb-2022.pdf (last access: 4 October 2023), 2023.
Pinto, J. G., Spangehl, T., Ulbrich, U., and Speth, P.: Sensitivities of a cyclone detection and tracking algorithm: individual tracks and climatology, Meteorol. Z., 14, 823–838, https://doi.org/10.1127/0941-2948/2005/0068, 2005.
Pinto, J. G., Karremann, M., Born, K., Della-Marta, P., and Klawa, M.: Loss potentials associated with European windstorms under future climate conditions, Clim. Res., 54, 1–20, https://doi.org/10.3354/cr01111, 2012.
Pinto, J. G., Pantillon, F., Ludwig, P., Déroche, M.-S., Leoncini, G., Raible, C. C., Shaffrey, L. C., and Stephenson, D. B.: From Atmospheric Dynamics to Insurance Losses: An Interdisciplinary Workshop on European Storms, B. Am. Meteorol. Soc., 100, ES175–ES178, https://doi.org/10.1175/BAMS-D-19-0026.1, 2019.
Prahl, B. F., Rybski, D., Burghoff, O., and Kropp, J. P.: Comparison of storm damage functions and their performance, Nat. Hazards Earth Syst. Sci., 15, 769–788, https://doi.org/10.5194/nhess-15-769-2015, 2015.
Priestley, M. D. K., Dacre, H. F., Shaffrey, L. C., Hodges, K. I., and Pinto, J. G.: The role of serial European windstorm clustering for extreme seasonal losses as determined from multi-centennial simulations of high-resolution global climate model data, Nat. Hazards Earth Syst. Sci., 18, 2991–3006, https://doi.org/10.5194/nhess-18-2991-2018, 2018.
Raschke, M.: About the return period of a catastrophe, Nat. Hazards Earth Syst. Sci., 22, 245–263, https://doi.org/10.5194/nhess-22-245-2022, 2022.
Roberts, J. F., Champion, A. J., Dawkins, L. C., Hodges, K. I., Shaffrey, L. C., Stephenson, D. B., Stringer, M. A., Thornton, H. E., and Youngman, B. D.: The XWS open access catalogue of extreme European windstorms from 1979 to 2012, Nat. Hazards Earth Syst. Sci., 14, 2487–2501, https://doi.org/10.5194/nhess-14-2487-2014, 2014.
Spearman, C.: The Proof and Measurement of Association between Two Things, Am. J. Psychol., 15, 72–101, https://doi.org/10.2307/1422689, 1904.
Swiss Re: Financial Report 2022, https://www.swissre.com/dam/jcr:ec822a14-a4d7-4b6b-b0e2-49ae6036058c/2022-financial-report-doc-en.pdf (last access: 4 October 2023), 2023.
van den Brink, H. W.: An effective parametrization of gust profiles during severe wind conditions, Environ. Res. Commun., 2, 011001, https://doi.org/10.1088/2515-7620/ab5777, 2019.
Storm names as given by the Freie Universität Berlin (https://www.wetterpate.de/namenslisten/tiefdruckgebiete/index.html, last access: 18 June 2024; in German) and used by the German Weather Service (DWD).
- Abstract
- Introduction
- Data
- Methods
- Comparison between ERA5 and ERA-Interim
- Comparison of loss estimates from LI ERA5 and Aon's IF Euro WS model
- Summary and discussion
- Data availability
- Author contributions
- Competing interests
- Disclaimer
- Acknowledgements
- Financial support
- Review statement
- References
- Supplement