the Creative Commons Attribution 4.0 License.
the Creative Commons Attribution 4.0 License.
 | 27 Sep 2024
Urban growth and spatial segregation increase disaster risk: lessons learned from the 2023 disaster on the North Coast of São Paulo, Brazil
Cassiano Bastos Moroz
Annegret H. Thieken
Urban growth and an increase in urban poverty are important drivers of disaster risk. However, to what extent these processes influence the dynamics of exposure and vulnerability remains uncertain. We hereby contribute to this discussion by presenting key lessons learned from the multi-hazard event that hit the North Coast of São Paulo (NCSP), Brazil, in February 2023. While the event was triggered by rainfall amounts of over 500 mm a day, urban development processes also influenced the impacts of the disaster. In this paper, we quantify these influences through a data integration approach combining empirical evidence on the historical evolution of urban settlements with damage mapping. We also evaluate the factors driving urban growth and spatial segregation in the region. We found that the impacts of the disaster were largely attributed to historical built-up land use changes, as 46 % fewer buildings would have been damaged if the same event had happened around 2 decades earlier, i.e., in 2001. Moreover, precarious urban settlements were considerably more exposed and vulnerable to the event, as evidenced by the density of damaged buildings, i.e., 12 times higher than in non-precarious settlements. We also observed strong patterns of spatial segregation in the NCSP. For instance, precarious settlements are much more frequent at hazardous locations, including on and at shorter distances from steep slopes. While this paper presents an analysis at the local level, the challenges of urbanization and growing intra-urban inequalities are global. Thus, these results reinforce the importance of accounting for such urban processes in disaster risk reduction interventions and the urgent need for research efforts that go beyond the hazard component, e.g., through an improvement of methods to simulate urban scenarios in the scope of disaster risk.
- Article
(9364 KB) - Full-text XML
- BibTeX
- EndNote


The Sendai Framework 2015–2030 (UNISDR, 2015) highlights the need for understanding risk in all its dimensions of hazard, exposure, and vulnerability. However, exposure remains an under-researched component of the risk equation (Sieg and Thieken, 2022). The current Intergovernmental Panel on Climate Change report highlights that in the near term, changes in exposure and vulnerability will increase risks to natural and human systems more than changes in hazard, driven by socioeconomic development, growing inequality, and urbanization (IPCC, 2022). These trends have already been observed over the last few decades. Tellman et al. (2021) demonstrated that the proportion of the global population occupying areas exposed to large riverine floods has increased by 20 % from 2000 to 2015. Similar findings of increasing global urban exposure to natural hazards in general were reported by Pesaresi et al. (2017). Thus, accounting for the dynamics of urban areas and their associated challenges has become essential in disaster risk reduction efforts. As highlighted by Portugali (2023), “the twenty-first century is to a large extent the Age of Cities: cities have become the most dominant form of human settlement and way of life as more than half the world's population live in cities” (p. 13). In fact, in 2018, 55.3 % of the global population was urban. Half of them lived in small- and medium-sized cities with less than 500 000 inhabitants (UN, 2018). Projections from the World Cities Report 2022 (UN-Habitat, 2022) estimate that the global population living in cities is expected to increase further to 68 % by 2050, with new urban residents mostly concentrated in low- and middle-income countries (LMICs).
Urban exposure to disaster risk is even more significant among the urban poor (IPCC, 2022). Worldwide, it is estimated that around 1.6 billion people live in inadequate housing and 1 billion in informal settlements (UN-Habitat, 2022). These intra-urban inequalities are often led by a complex system of competition between the housing market and the “informal city” (Maricato, 2017). As a result, the urban poor are driven towards areas that are less desirable to the market, frequently confined to hazardous locations such as floodplains and hillslopes (Maricato, 2017; UN-Habitat, 2022). This has severe consequences for urban exposure. Ozturk et al. (2022) demonstrated that informal settlements are between 20 % and 500 % more exposed to landslides as compared with formal urban areas based on an evaluation of the situation in five tropical cities across Africa and Asia. In another study conducted in the Kathmandu Valley, in Nepal, Mesta et al. (2022) predicted significantly higher amounts of urban expansion towards hazardous locations in urban neighborhoods of higher social vulnerability – often associated with lower socioeconomic status – compared with those of lower social vulnerability.
In addition to their associations with exposure, the patterns of urban growth and spatial inequalities are also linked with changes in hazard and vulnerability. Urban growth, especially the construction of irregular housing and settlements, can increase the probability of hazard occurrence due to human modifications to the environment. These modifications impact slope stability through processes such as vegetation deforesting, slope cutting, and inadequate drainage systems (Ozturk et al., 2022). They can also alter the hydrological behavior of catchment areas with an increase in the proportion of impermeable surfaces (Pumo et al., 2017). Vulnerability, both physical and social, is also influenced by the socioeconomic status of the urban residents. Hallegatte et al. (2020) highlighted key factors that make the urban poor more vulnerable to hazards: (a) a higher incidence of infectious diseases in the aftermath of events due to a lack of drinking water supply and sanitation, (b) more physical damage to precarious buildings with low-quality materials that do not follow formal construction standards, (c) higher (relative) income losses during the event for informal workers, and (d) less governmental support (including protection measures and financial subsidies) during the response and recovery phases.
A recent example of the large impacts of urban growth and inequalities on disaster risk is the event that hit the North Coast of São Paulo (NCSP) in southeastern Brazil in February 2023. Rainfall amounts of over 500 mm in a day triggered a multi-hazard event, displacing more than 2000 residents and killing 65 people, mostly among the urban poor (Queiroz et al., 2023). The disaster was classified as an unprecedented event in the São Sebastião region. To the best of our knowledge, the only event of a similar magnitude in the region was the 1967 disaster in Caraguatatuba, one of the cities that is part of the NCSP (Dias et al., 2016).
The severe impacts of the 2023 disaster were not only attributed to the extreme rainfall event. Fast urban expansion has been observed since the construction of the Rio-Santos highway, the main access to the region, boosted by investments in the tourism and energy industry sectors (CBH-LN, 2022; Daunt and Silva, 2019; Rosemback et al., 2010). Urban areas have been constrained by the mountainous topography of the region and the implementation of conservation policies (Rosemback et al., 2010), as roughly 80 % of the region's territory is strictly protected according to the North Coast Ecological–Economic Zoning Plan (São Paulo State, 2017). The attraction of tourists to the region has also contributed to strong patterns of spatial inequalities and urban segregation by inflating the land value (Rosemback et al., 2010). In many locations, beachfront gated communities for vacation purposes contrast with precarious settlements in environmentally fragile areas.
While the general picture of the disaster in the NCSP seems to be clear, we are unaware of any studies conducting quantitative analysis on the relationship between the extent of the disaster impacts and historical urban development in the region. In this context, the 2023 disaster provides an opportunity to understand how spatiotemporal patterns of urban growth, including urban segregation, have influenced the disaster impacts. We hereby present a few lessons learned from the event through a data integration approach combining empirical evidence on the historical evolution of urban areas with damage mapping. We also investigate the patterns and forces driving urban growth and segregation in the region. By doing so, we aim to support urban planning and disaster management practices through evidence-based analyses of the interplay between urban growth, segregation, and risk. We conduct this investigation by addressing the following research questions:
-
To what extent did urban segregation influence (unequal) exposure to the disaster?
-
How much of the disaster impacts could be attributed to changes in urban exposure?
-
How have urban growth and segregation manifested in the region over the last few decades?
The paper is structured as follows. First, we introduce the case study area with a brief description of its environmental and socioeconomic characteristics. In the “Methodology and data” section, we provide a detailed explanation of the key steps performed in the study: (1) the mapping of the physical damage to buildings during the event, (2) the attribution of this damage to changes in urban exposure and spatial segregation, and (3) the analysis of the historical patterns and drivers of urban growth and segregation. Then we present the main findings of our study for each research question, with further discussions. Finally, we discuss some lessons learned in the concluding section.
The North Coast of São Paulo (NCSP) is an administrative sub-region of the state of São Paulo in southeastern Brazil and encompasses four municipalities: Caraguatatuba, Ilhabela, São Sebastião, and Ubatuba (São Paulo State, 2012). Together, these municipalities were home to 344 383 inhabitants in 2022, distributed within over 1900 km2 (IBGE, 2022). The NCSP is located along the mountain ranges of Serra do Mar and Serra da Bocaina (Daunt and Silva, 2019), which contain some of the best-preserved fragments of the Brazilian Atlantic Forest (Ribeiro et al., 2009). The geomorphology of the region is characterized by three main landforms: 15.8 % of the area is formed by upland plateaus with elevations exceeding 1000 m; 12.7 % of the area is formed by low-lying fluvial and coastal plains adjacent to the coastline; and the remaining 71.5 % of the area is formed by mountains and escarpments, which connect the previous landforms with elevations ranging from sea level up to 1578 m (ASF DAAC, 2015; IBGE, 2023). The large prevalence of small-sized drainage areas with steep slopes makes the region highly susceptible to multiple hazards. Existing studies of the São Sebastião region – the most impacted by the 2023 event – classified a considerable number of areas as susceptible to landslides, flash floods, or debris flows or a combination of them (Arango Carmona et al., 2023). The region is also characterized by a tropical climate, with an average annual precipitation of over 1800 mm (CPRM, 2011), thus exacerbating the risks. Consequently, we address the event of 2023 as a multi-hazard event.
In addition to the high susceptibility, the NCSP also presents complex processes of urban development. The prevalence of steep slopes, together with existing spatial planning policies and the implementation of several conservation areas in the Atlantic Forest, has constrained urban growth towards the few flatter areas along the coastline, where most of the public infrastructure is located (Rosemback et al., 2010). As a result, over 81.6 % of the land was covered by rainforest and sandbank vegetation and only 3.9 % by urban areas, as of 2022 (MapBiomas Project, 2022).
Despite the great level of conservation, the NCSP has been pressured over the last few decades with increasing demands for new urban areas. Information from the Brazilian census shows an increase of 195 % in the population of the region from 1996 to 2022 (IBGE, 2022), which was accompanied by rapid expansion of urban areas (MapBiomas Project, 2022). The fast population and urban growth has been driven by two main forces: high tourist attractiveness, with increasing demands for housing (including summer houses) and services, and improvements in road and industrial infrastructure for the oil and gas sectors, leading to increasing accessibility to the region (Daunt et al., 2021; Daunt and Silva, 2019; Rosemback et al., 2010). While most of the urban settlements are located on flatter lands, newly urbanized areas have been expanding towards steeper slopes, on the transition zones between coastal plains and escarpments (Daunt et al., 2021; Daunt and Silva, 2019). The urban expansion towards hazardous locations such as steeper slopes has a strong impact on the exposure of urban settlements to disaster risk, as is evident with the disaster that hit the region in February 2023.
However, little is known about the patterns and drivers of urban dynamics in the NCSP, particularly in the context of disaster risk. The current study addresses this gap by investigating the interrelations between urban growth, segregation, and risk in the context of the February 2023 disaster in the NCSP. After an initial evaluation of the event (Arango Carmona et al., 2023), we decided to focus our analysis only on the region that was the most impacted by the disaster. Therefore, we selected as a study area part of the municipality of São Sebastião, where most of the damage and 64 out of the 65 fatalities occurred. This includes, from west to east, the coastal communities of Juquehy, Barra do Sahy, Baleia, Camburi, Camburizinho, and Boiçucanga, covering a total area of around 107 km2. Figure 1 introduces the NCSP in a Brazilian context and further characterizes the study area.
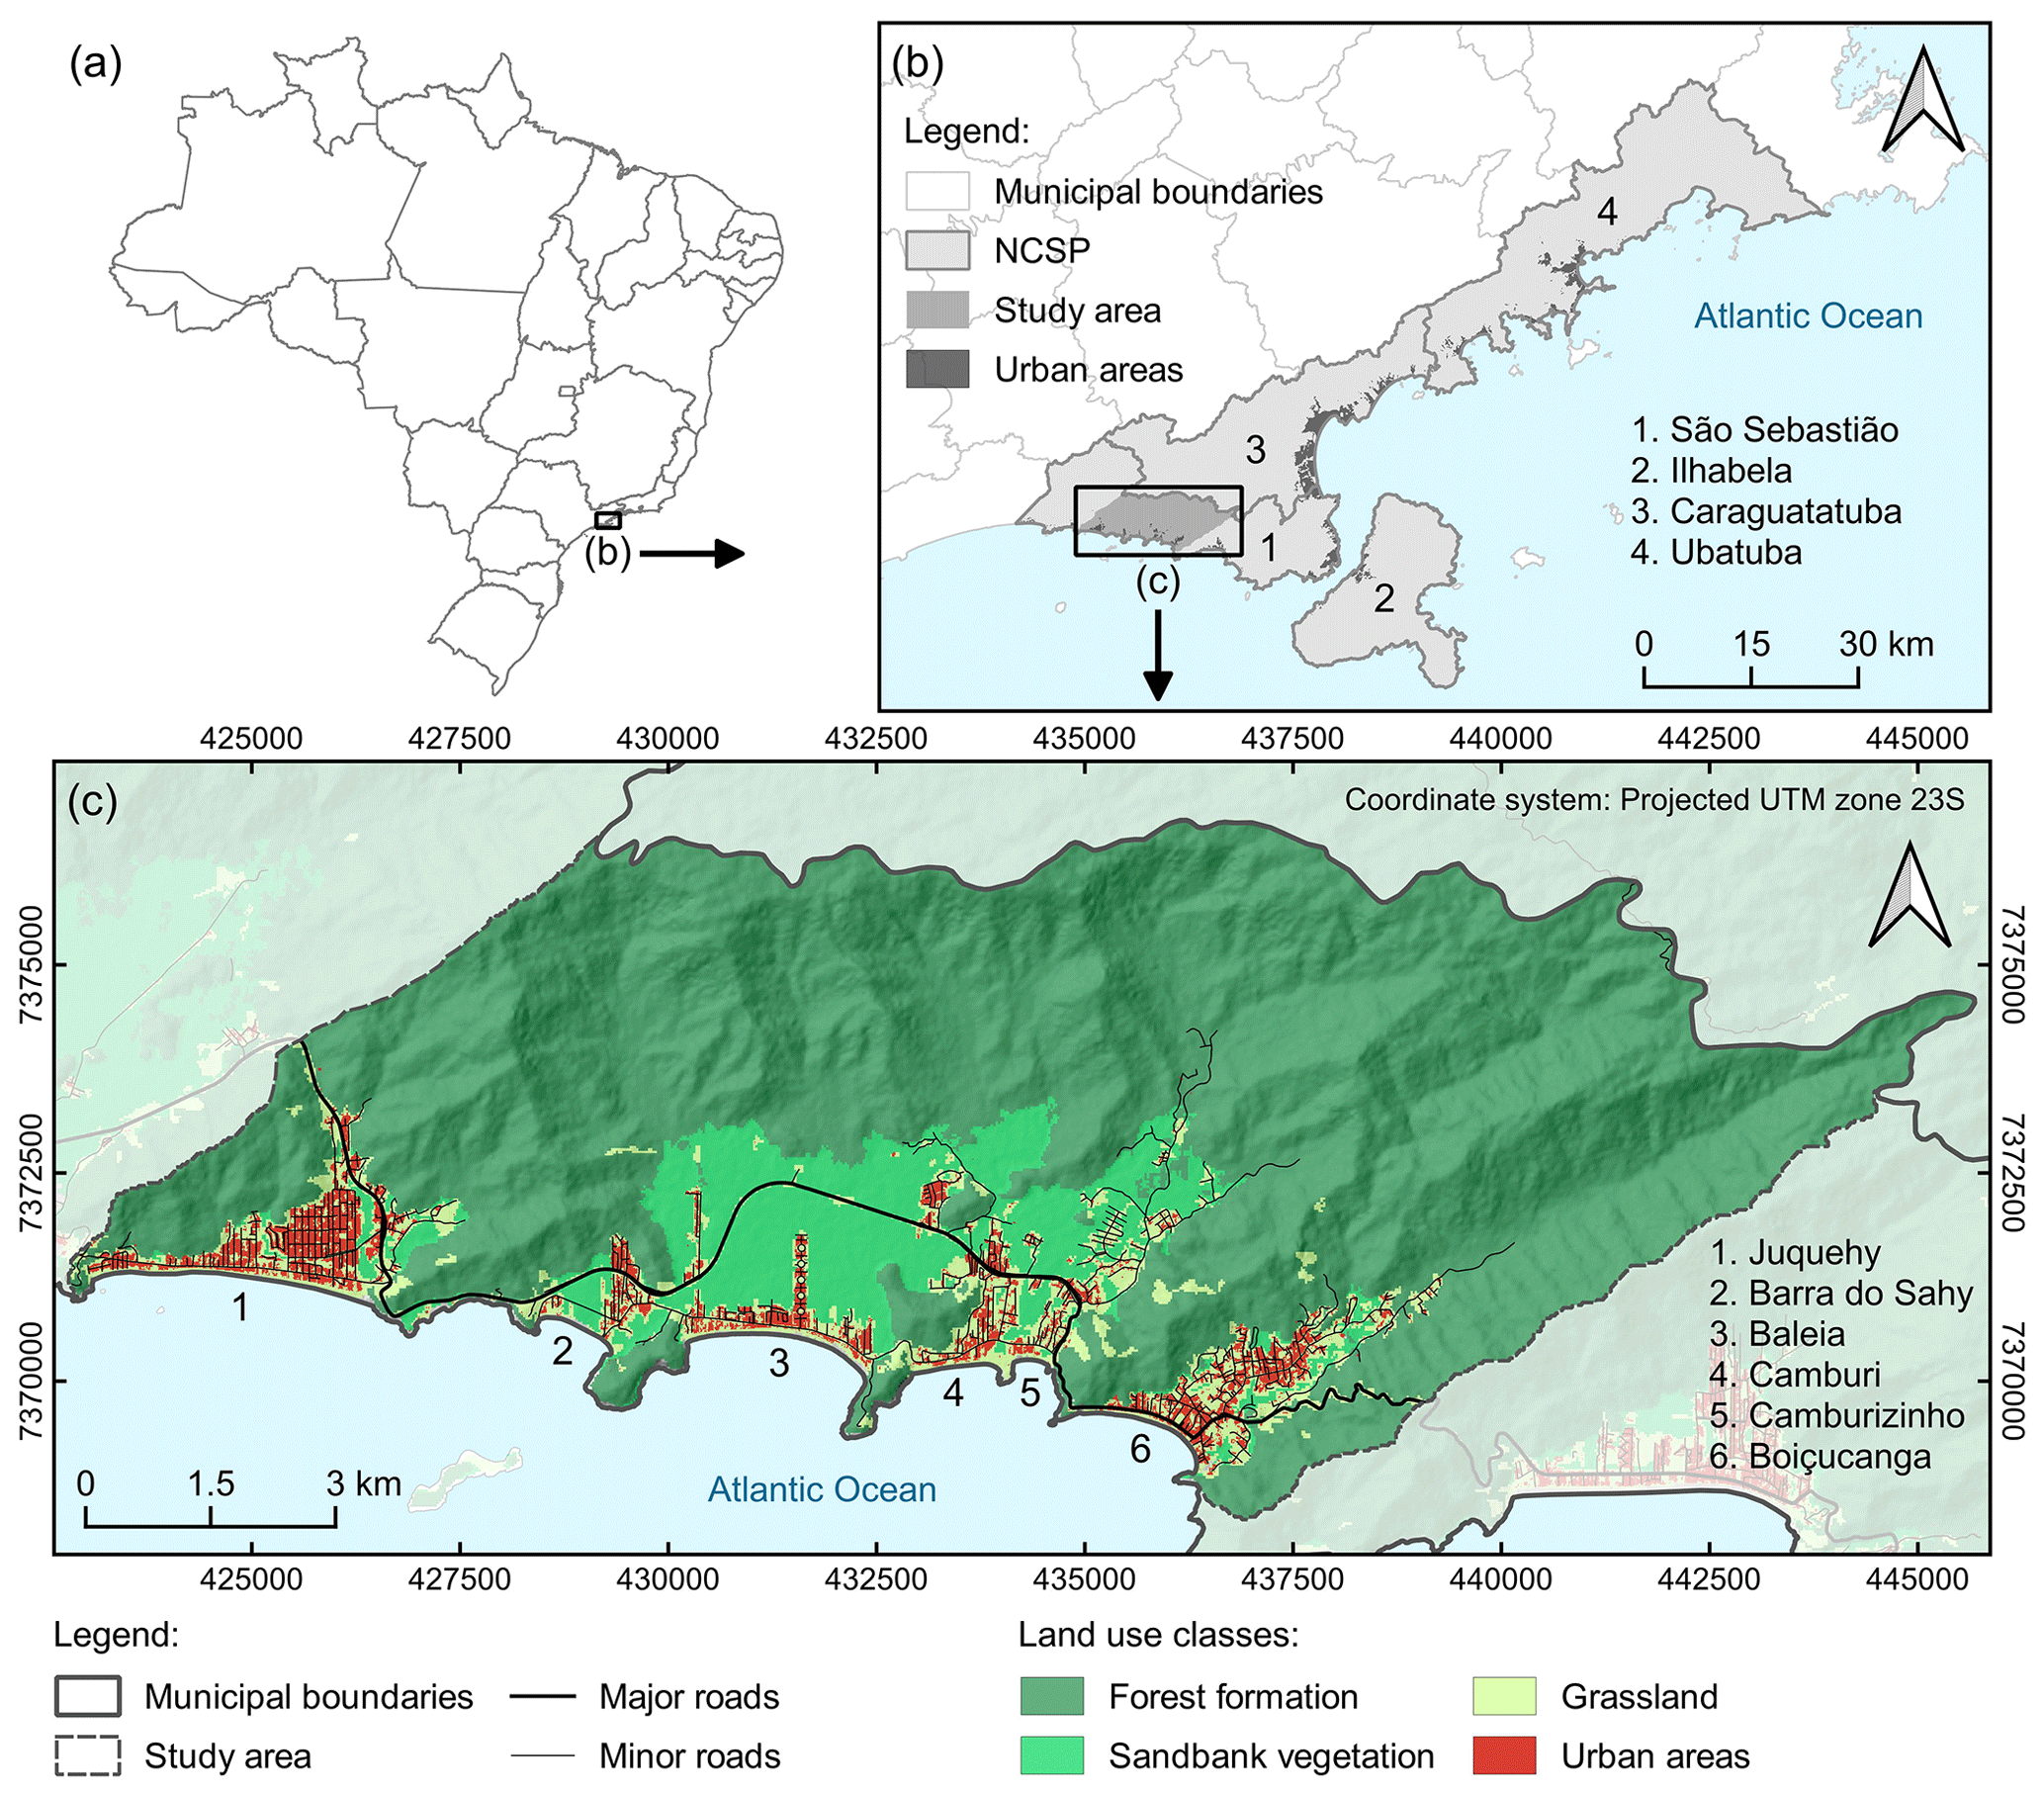
Figure 1Location map and characterization of the study area. (a) Location of the North Coast of São Paulo (NCSP) in Brazil, (b) location of the study area in the NCSP, and (c) characterization of the study area. Data sources: ASF DAAC (2015), MapBiomas Project (2022), and OpenStreetMap contributors (2023). © OpenStreetMap contributors 2023. Distributed under the Open Data Commons Open Database License (ODbL) v1.0.
Considering the availability and limitations of the data sources in the study area, we opted to structure our research methodology into two analyses. We first conducted an in-depth damage analysis to quantify and date the buildings damaged by the event, aiming to discuss the historical patterns of exposure and inequalities from the perspective of the 2023 disaster, as described in Sect. 3.1 and 3.2. We later complement this analysis by investigating the spatiotemporal patterns and drivers of urban growth and segregation in the region, as described in Sect. 3.3.
3.1 Mapping the physical damage to buildings
For the initial analysis, we mapped and identified the physical damage to buildings through a visual interpretation of pre- and post-disaster aerial imagery at a spatial resolution of 0.1 m. These images were obtained from DataGEO, the infrastructure of environmental geospatial data of the state of São Paulo (DataGEO, 2023), and correspond to aerial photographs taken in 2022 (pre-disaster) and 2023 (post-disaster). As a preliminary step, we split the study area into a grid of regular cells, on which each cell could be visually interpreted at a scale of 1 : 1000 in QGIS software. We adopted these cells as a reference during the visual interpretation of the images to ensure the completeness of our mapping approach. For the visual interpretation, we mapped the individual damage to buildings as a point layer following the classification presented in Table 1.
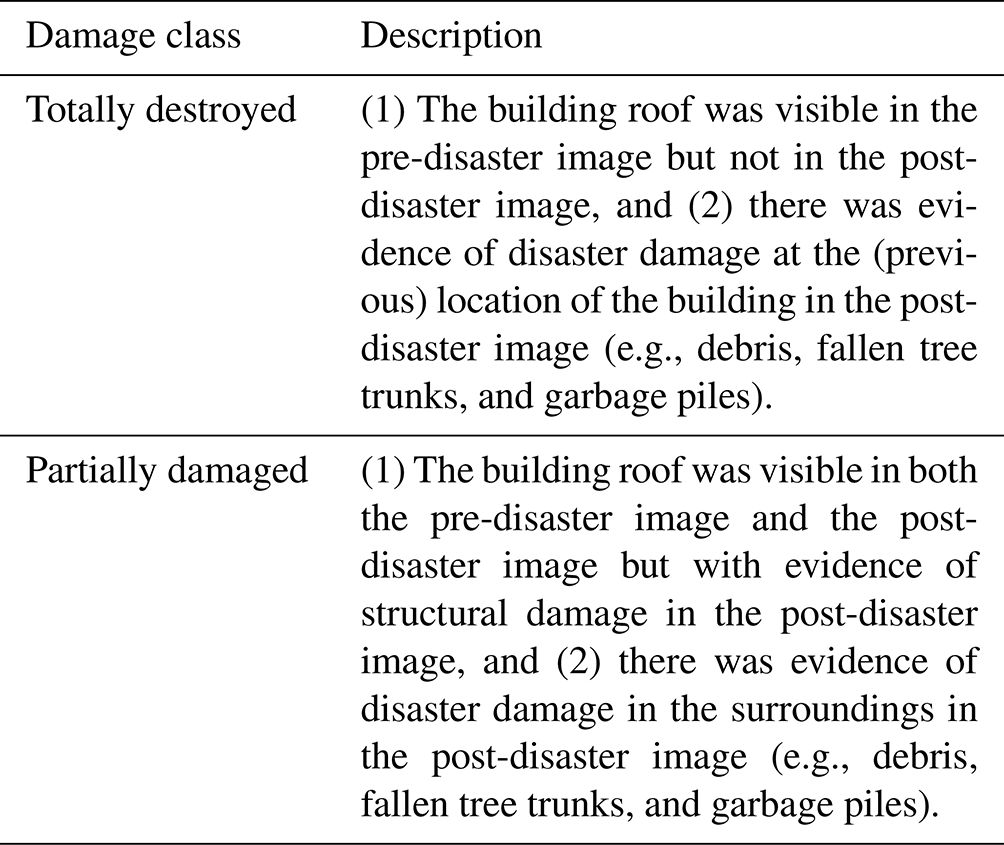
It is important to mention that the 2023 disaster on the NCSP was characterized as a multi-hazard event, combining different rainfall-triggered hazards, including landslides, mudflows, and flash floods (Arango Carmona et al., 2023). In most cases, we could not identify crisp boundaries separating these hazards as there were several areas of spatial intersection. However, these limitations did not influence our mapping of the physical damage to buildings since we did not focus on distinguishing hazardous processes. Thus, the comparison of very high-resolution pre- and post-disaster aerial images was adequate for our purposes.
For reference, Fig. 2 exemplifies the classification scheme presented in Table 1, with two cases representing one totally destroyed building and one partially damaged building. The aerial images in the figure are the same as those adopted for the visual interpretation. We based our mapping approach solely on the visual interpretation of the roof structure, which is the most distinguishable building element in aerial imagery. Mapping other structural damage cannot easily be interpreted from aerial imagery and would require additional efforts that are not possible in this study, for example, an in situ verification of the disaster impacts a few days after the event. Thus, our results do not represent any structural damage other than that to the building roof.
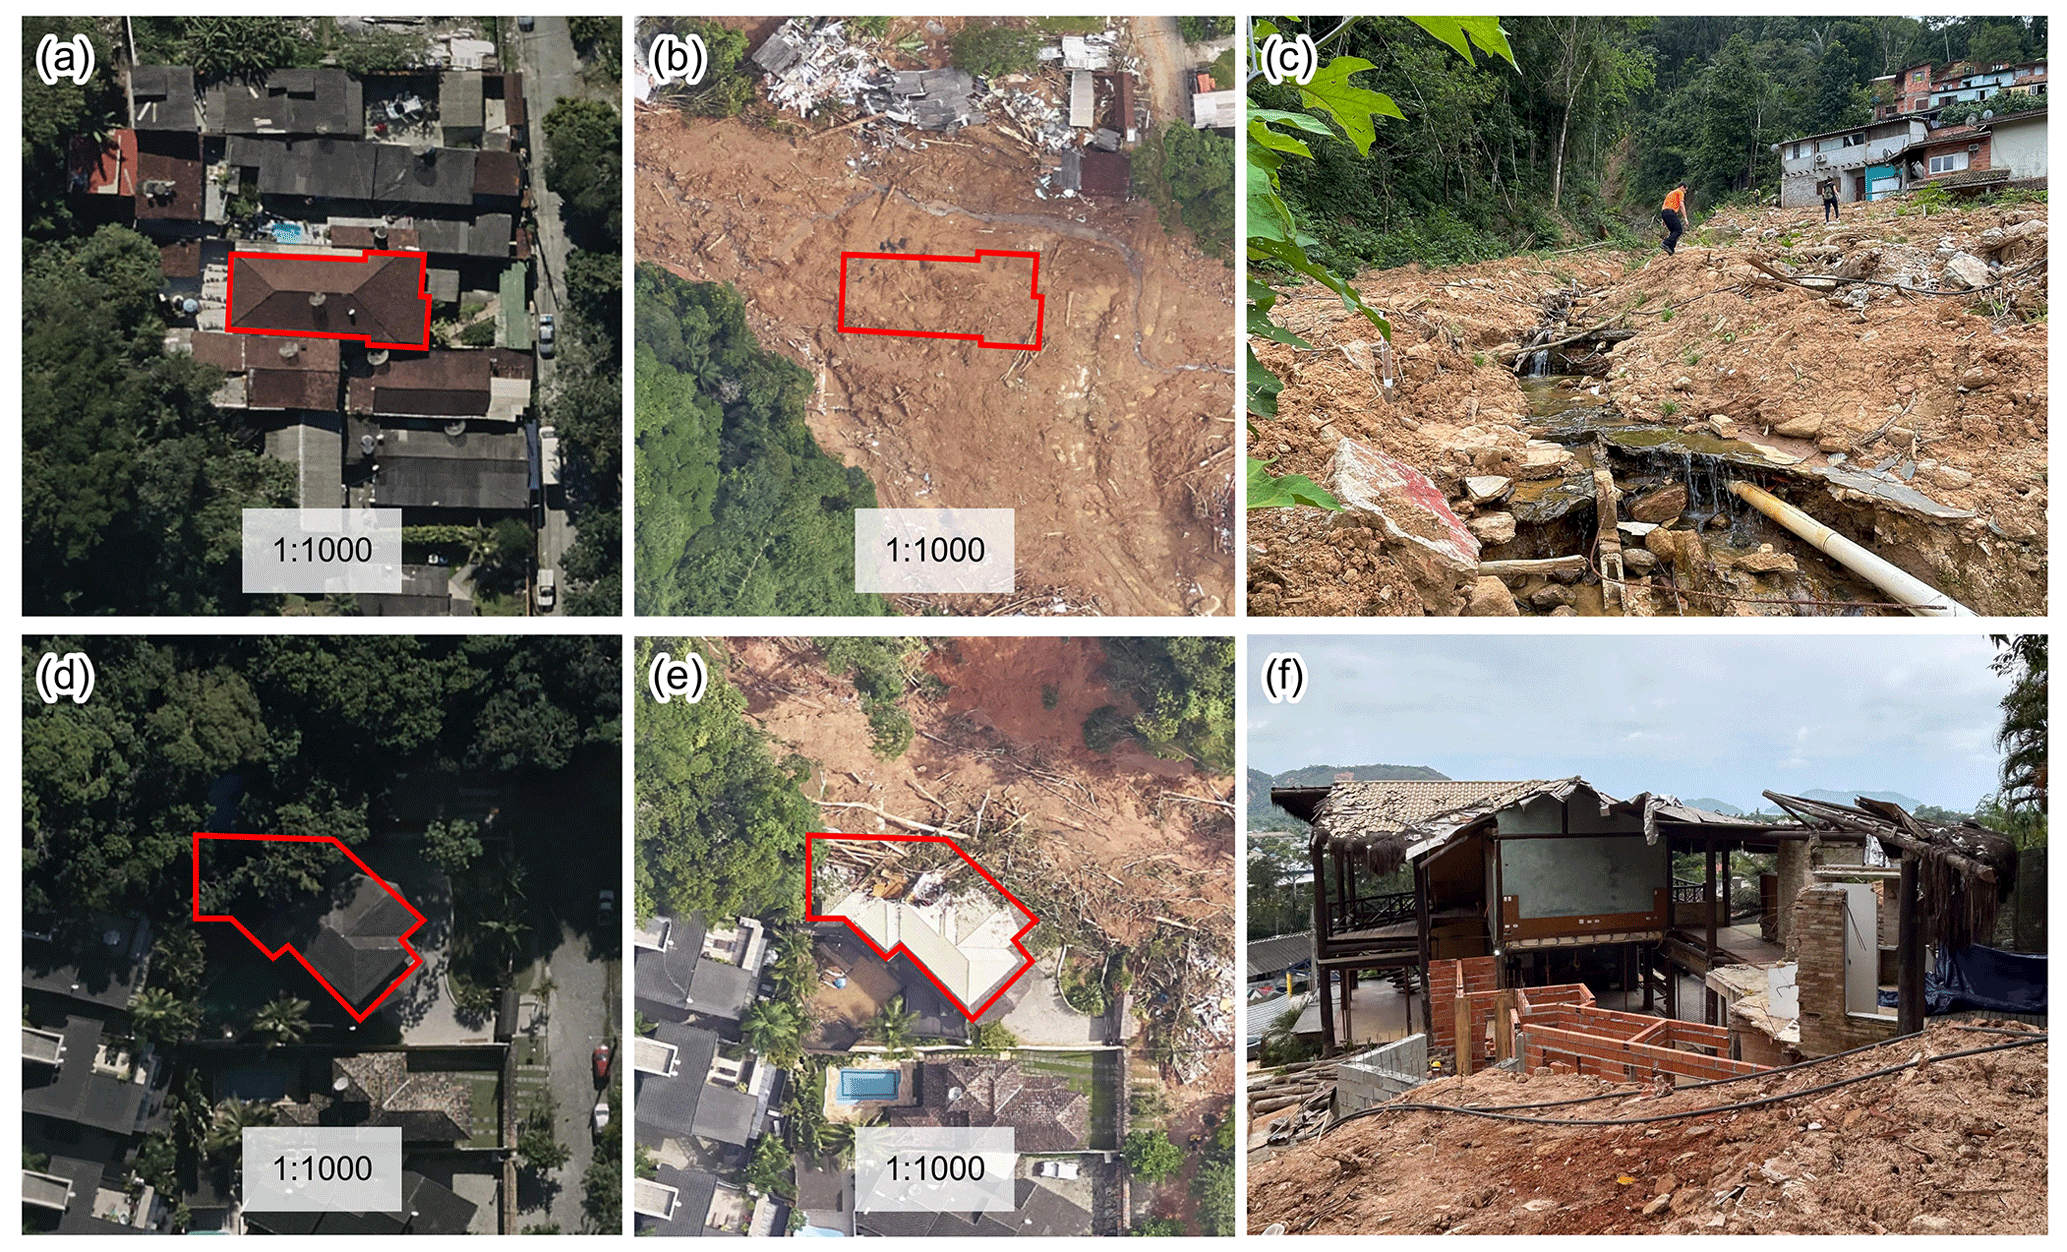
Figure 2Examples of total destruction and partial damage to buildings. (a) Pre-disaster aerial view of a building that was totally destroyed. (b) Post-disaster aerial view of the total destruction to the building in (a). (c) Photograph from a field visit at the site where the building in (a) was located, taken in November 2023. (d) Pre-disaster aerial view of a building that was partially damaged. (e) Post-disaster aerial view of the partial damage to the building in (d). (f) Photograph from a field visit of the remnants of the building in (d), taken in November 2023. Data source: aerial imagery from DataGEO (2023).
Having mapped the physical damage to buildings, we also integrated the spatial dimension of segregation into our analysis by classifying the mapped buildings according to the characteristics of the settlements where they are located. This classification was obtained through the intersection of the building points with the vector layer of subnormal agglomerates, as mapped by the Brazilian Institute of Geography and Statistics (IBGE, 2019b). Subnormal agglomerates were the official denomination adopted by the IBGE – recently replaced by the terms favelas and urban communities (IBGE, 2024) – to refer to substandard urban settlements consisting of 51 or more households without legal ownership and that fulfill at least one of the following criteria: lack or precarity of public infrastructure, predominance of self-built infrastructure and/or houses, and located in areas that are legally constrained by urban planning and/or environmental legislation (IBGE, 2019a). For easier comprehension, we hereby differentiate subnormal agglomerates from other urban settlements using the terms precarious and non-precarious urban settlements, respectively.
As a reference, Fig. 3 exemplifies the morphological differences between a precarious and a non-precarious urban settlement. The precarious settlement consists of smaller houses, mostly with fiber cement roofs, densely and irregularly arranged, with narrow distances between buildings and unpaved streets. In the case of the non-precarious settlement, houses are larger and covered by more resistant roof materials, mostly ceramic tiles. The urban layout is more regular, and land parcels are separated by crisp boundaries. While these examples increase our understanding of some common morphological differences between both settlement classes, it is important to acknowledge that urban areas are complex and heterogeneous. Thus, these figures only represent one case among many different configurations of precarious and non-precarious urban settlements.
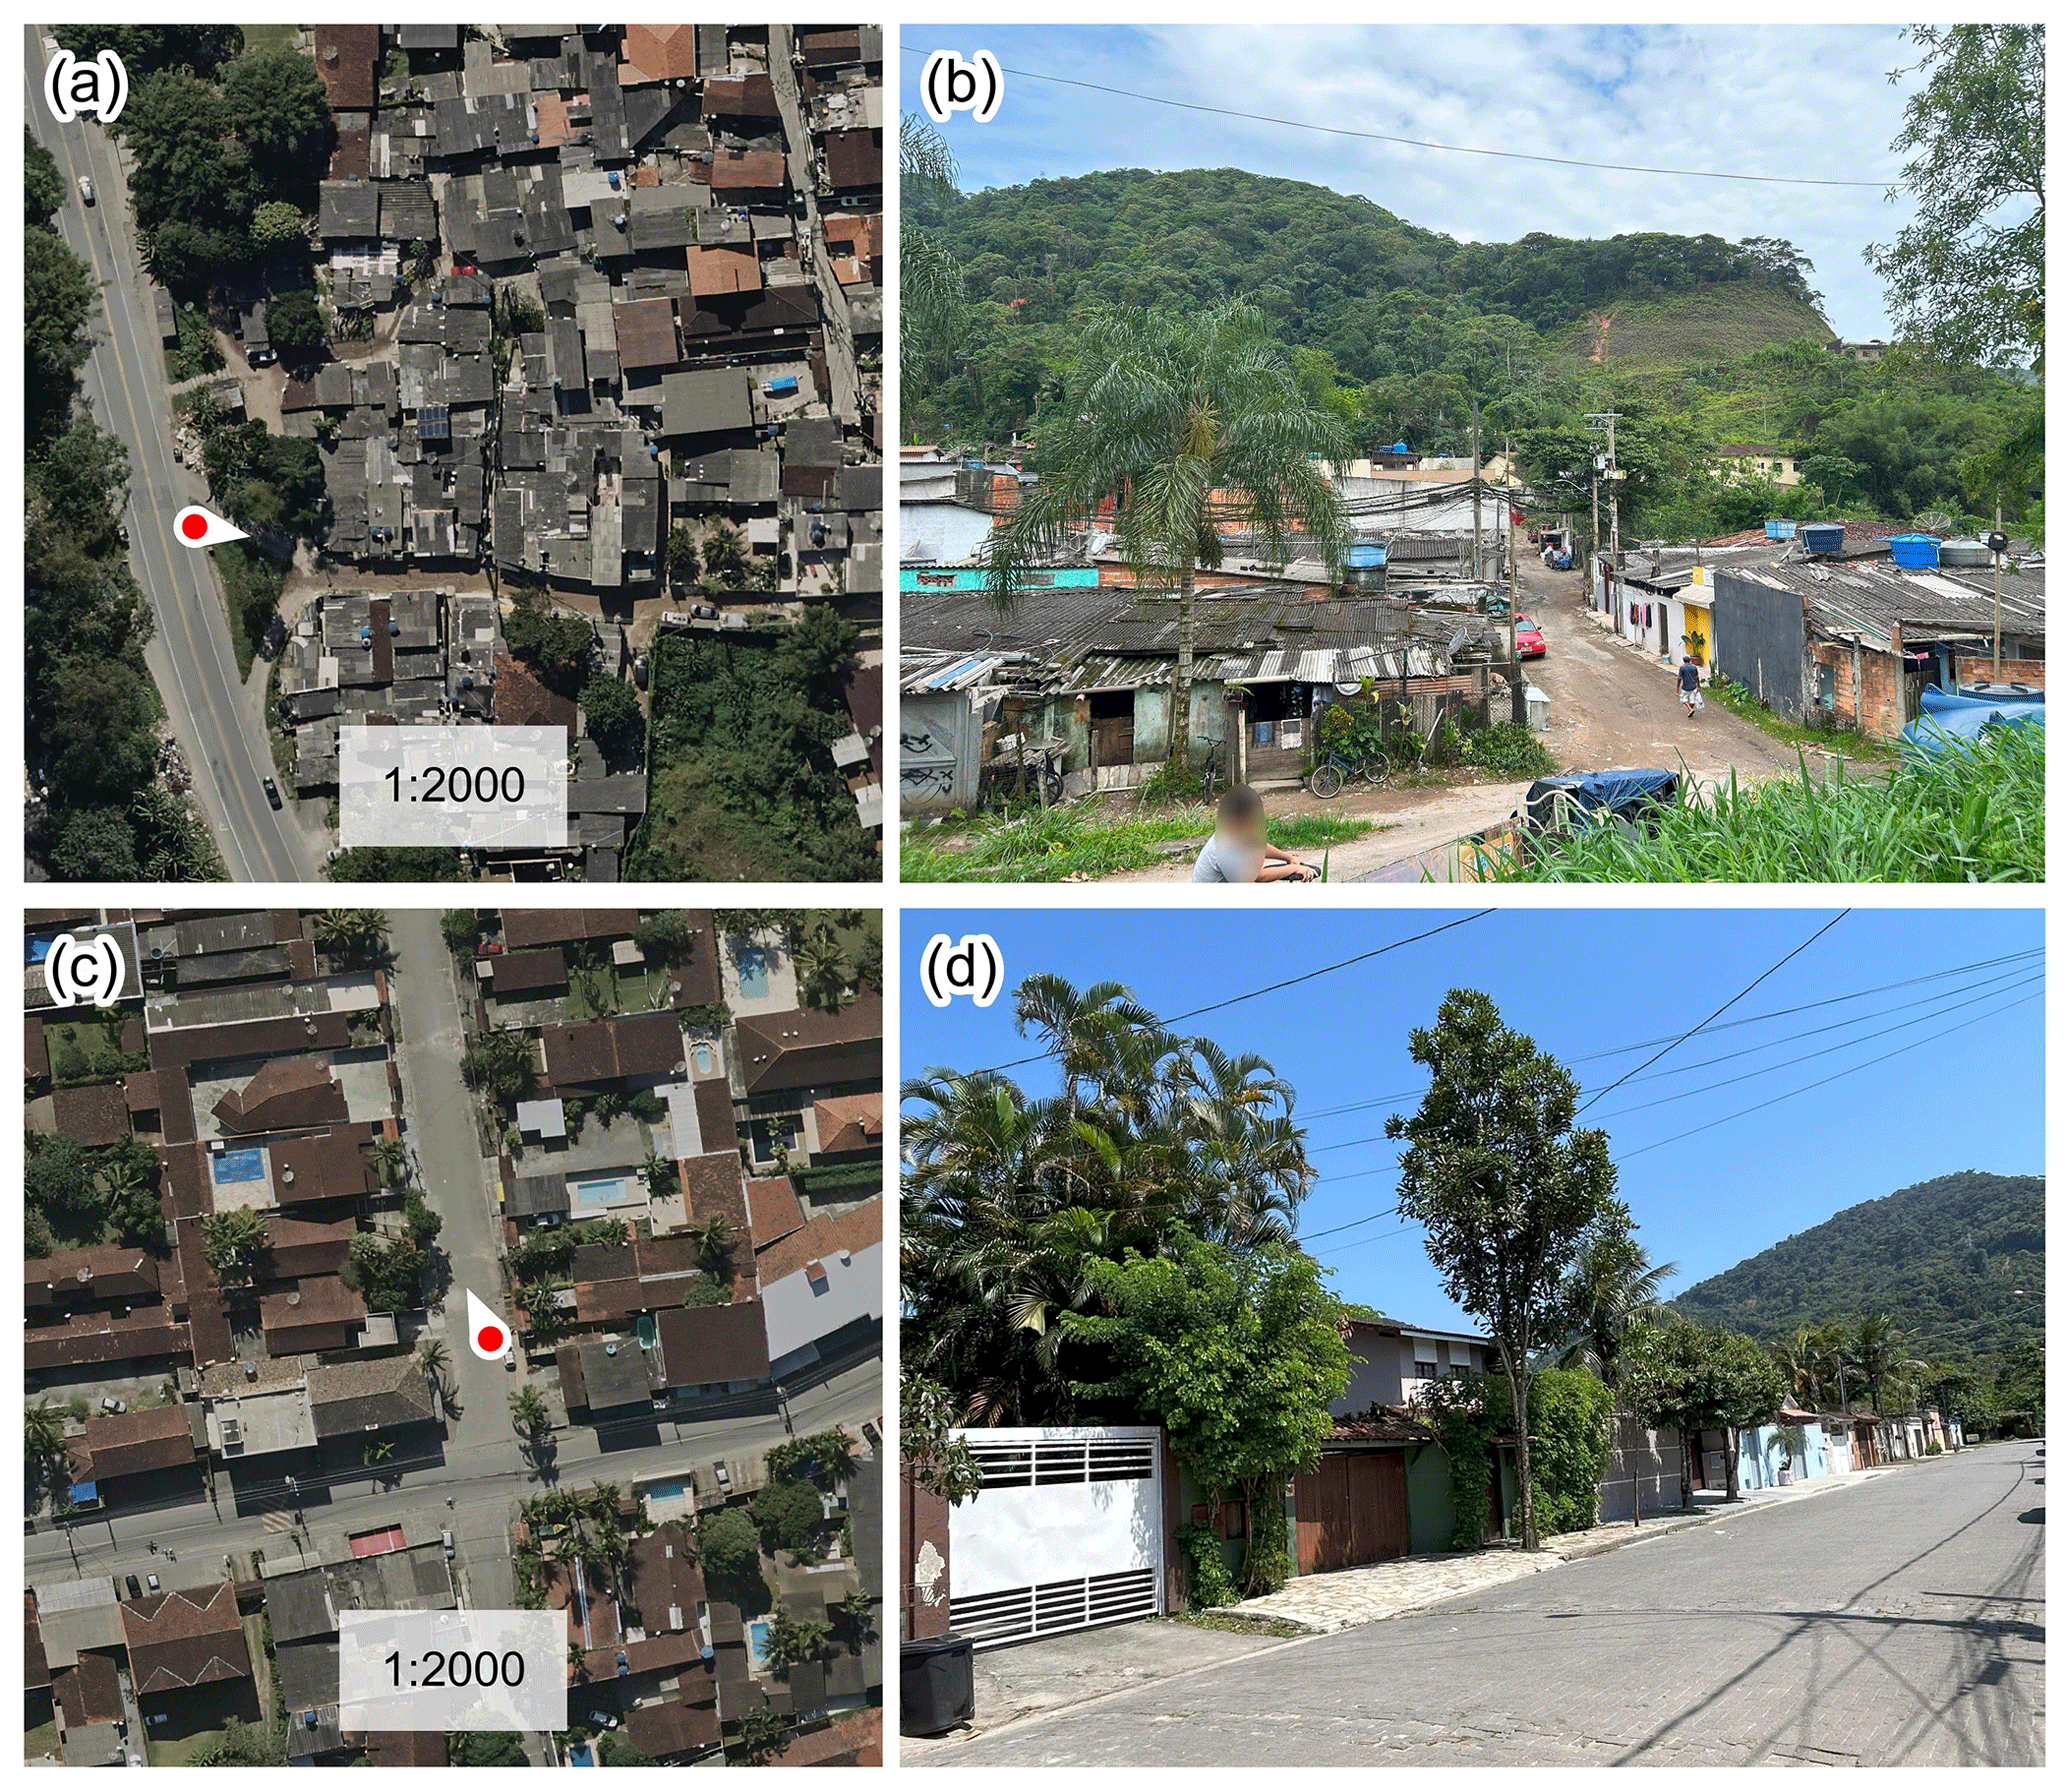
Figure 3Morphological differences between a precarious and a non-precarious urban settlement. The arrows indicate the direction of the visual field in the photographs. (a) Aerial view of a precarious settlement. (b) Photograph from a field visit at the location of (a), taken in November 2023. (c) Aerial view of a non-precarious settlement. (d) Photograph from a field visit at the location of (c), taken in November 2023. Data source: aerial imagery from DataGEO (2023).
It is important to outline that the adopted dataset of subnormal agglomerates represents the situation in 2019. Thus, our analysis does not account for changes in urban classes at a particular location over time (i.e., from precarious to non-precarious or vice versa). Instead, it attributes newly urbanized cells to the urban class, either precarious or non-precarious, corresponding to the year 2019. Despite this data limitation, this simplification seems reasonable in the specific context of the study area. An analysis of the historical imagery in Google Earth indicated that most urban morphologies (e.g., roof materials, size, and shape of buildings) have not changed over the last few decades, thus providing evidence that the patterns of segregation also persisted.
3.2 Attributing damage to changes in urban exposure and spatial segregation
The mapping approach enabled us to understand the spatial distribution of the disaster impacts and the differences between precarious and non-precarious urban settlements. However, the temporal dimension is also of great importance in evaluating to what extent the disaster impacts could be attributed to historical changes in exposure. Hence, we addressed this question by identifying the age of each building damaged by the event using very high-resolution aerial imagery. With these results, we could evaluate, with high confidence, how much damage would have occurred if the same disaster event had happened decades ago.
To identify the building age, we conducted a visual interpretation of a series of historical aerial imagery obtained from DataGEO (2023), the infrastructure of environmental geospatial data of the state of São Paulo. The series of images includes three sets representing the evolution of urban areas over 3 decades: two of them with a spatial resolution of 1 m, corresponding to the years 2001 and 2010, and the remaining one with a finer spatial resolution of 0.1 m, corresponding to the year 2022, a few months before the event. While it was not possible to identify the exact year of construction, the interpretation of these images enabled us to classify the buildings into three categories: buildings constructed (a) before 2001, (b) between 2001 and 2010, and (c) between 2010 and 2022. Finally, we adopted these classified buildings to investigate the historical patterns of changes in exposure in the context of the 2023 disaster, also addressing the differences between precarious and non-precarious urban settlements.
3.3 Understanding the patterns and drivers of urban growth and spatial segregation
So far, the previous analyses have enabled us to understand the extent of the disaster impacts and its relationship with spatiotemporal patterns of urban growth and segregation. However, little is known about the factors driving such urban development processes in the region and how these are associated with disaster exposure and vulnerability. In this study, we addressed this question by conducting a statistical analysis to investigate the influence of several spatial factors on the historical development of urban areas.
We started by mapping the historical footprint of urban growth and segregation in the study area based on two datasets. First, we applied the World Settlement Footprint (WSF) Evolution layer to represent the spatiotemporal patterns of urban growth on a yearly basis. The WSF Evolution layer is a 30 m resolution global dataset outlining the yearly spatial footprint of urban areas from 1985 to 2015. We then used the Brazilian national dataset of subnormal agglomerates (SAs) (IBGE, 2019b) to integrate the spatial dimension of segregation within the patterns of growth. We did this by intersecting the vector of SAs with the WSF map. To perform this analysis, we first converted the vector of SAs into a raster layer, adopting an overlap of at least 50 % as a minimum threshold to classify a raster cell as an SA. The raster was generated at the same spatial resolution (30 m) and extent as the WSF layer. We opted to use the spatial configurations of the WSF layer as a baseline to ensure the finest possible resolution for our analysis given the limitation of the datasets.
Having mapped the historical footprint of urban development, we later evaluated its interrelations with several spatial factors, thus aiming to identify the most important forces driving growth and segregation in the region. The objective was to understand in which direction urban areas have expanded and how these patterns have changed over the years and to identify potential differences between precarious and non-precarious urban settlements.
To do so, we first classified the urban footprint maps into four categories representing the temporal evolution of growth: cells urbanized before 1985, from 1986 to 1995, from 1996 to 2005, and from 2006 to 2015. We then extracted the value distribution of each spatial factor within the boundaries of the urban areas for each temporal category independently. Using this temporal classification, we could investigate how urban growth has manifested over the last few decades concerning the analyzed spatial factors. During this step, we made a distinction between the distributions of precarious and non-precarious urban settlements so that we could further elaborate on the patterns of segregation.
To perform these analyses, we identified and selected a list of factors that could be relevant to the explanation of the spatial trends in urban growth and segregation locally. We based our selection on the study of Allan et al. (2022), who presented a systematic review of the key factors influencing land use and land cover changes in urban areas. The selection resulted in a final list of six factors, which are presented in Table 2 together with the data sources used.
Table 2Adopted factors driving the spatial patterns of urban growth and segregation.
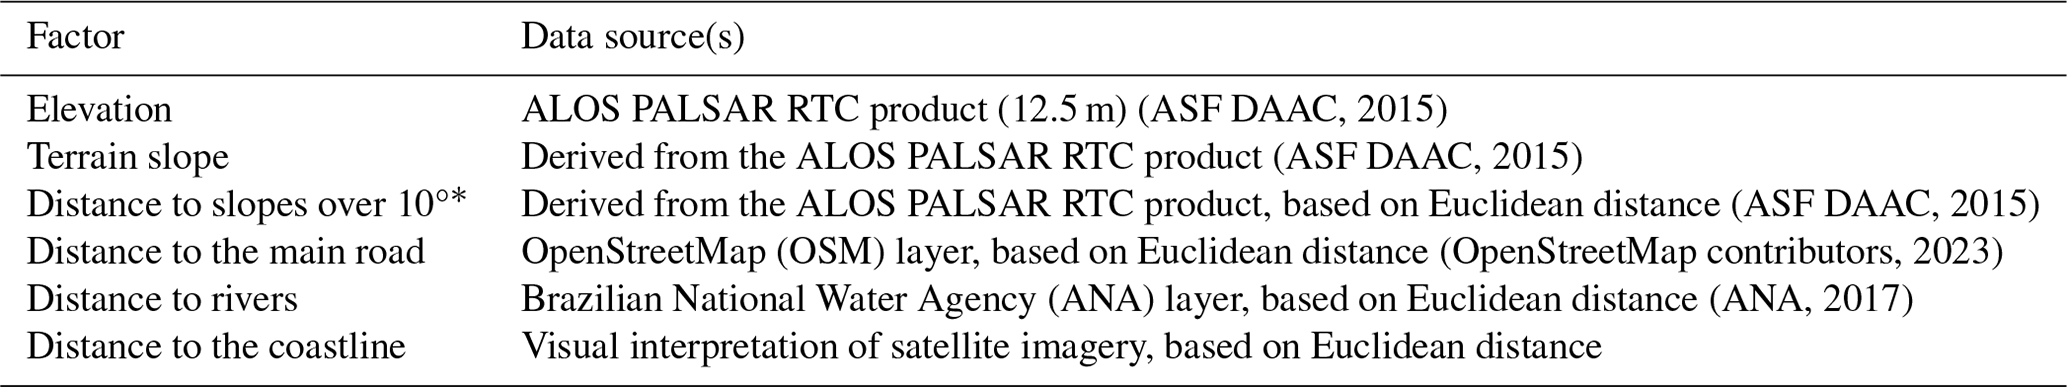
* Minimum threshold to characterize a hillside as landslide-susceptible, as presented by Ozturk et al. (2022).
The list of factors presented in Table 2 can be separated into two categories: topographical and contextual. The topographical factors include elevation, terrain slope, and distance to slopes over 10°. These factors are important proxies of disaster exposure, given that topographical features such as slope steepness are often correlated with landslide susceptibility. In this context, we also included the factor of distance to steep slopes (over 10°) to account for the impacts of the landslide runout. The runout refers to the landslide debris that may travel downhill during slope failure, reaching the areas surrounding the landslide initiation point. Additionally, the contextual factors include the distance to the main road, the distance to rivers, and the distance to the coastline. These factors represent the influence of infrastructure and natural features on the locational choice of urban areas, which might lead to patterns of urban segregation.
Finally, we also applied a Kolmogorov–Smirnov (KS) test to understand the influence of each factor on the patterns of segregation. The KS statistic is a metric that quantifies the (dis)similarity between two cumulative frequency distributions by calculating the maximum distance between them (Haslwanter, 2016). In our study, a great dissimilarity indicates that the analyzed factor has significant differences when comparing the distribution of precarious and non-precarious urban settlements. This provides evidence that such a factor has a major influence on the patterns of segregation. On the other hand, similar distributions indicate that the factor is less relevant to the explanation of differences in the location of both settlement classes.
4.1 Absolute urban growth from 1985 to 2015
To provide an initial overview of the urban growth situation in the study area, we first quantified the absolute growth of precarious and non-precarious urban settlements at yearly intervals from 1985 to 2015. The results are presented in Fig. 4.
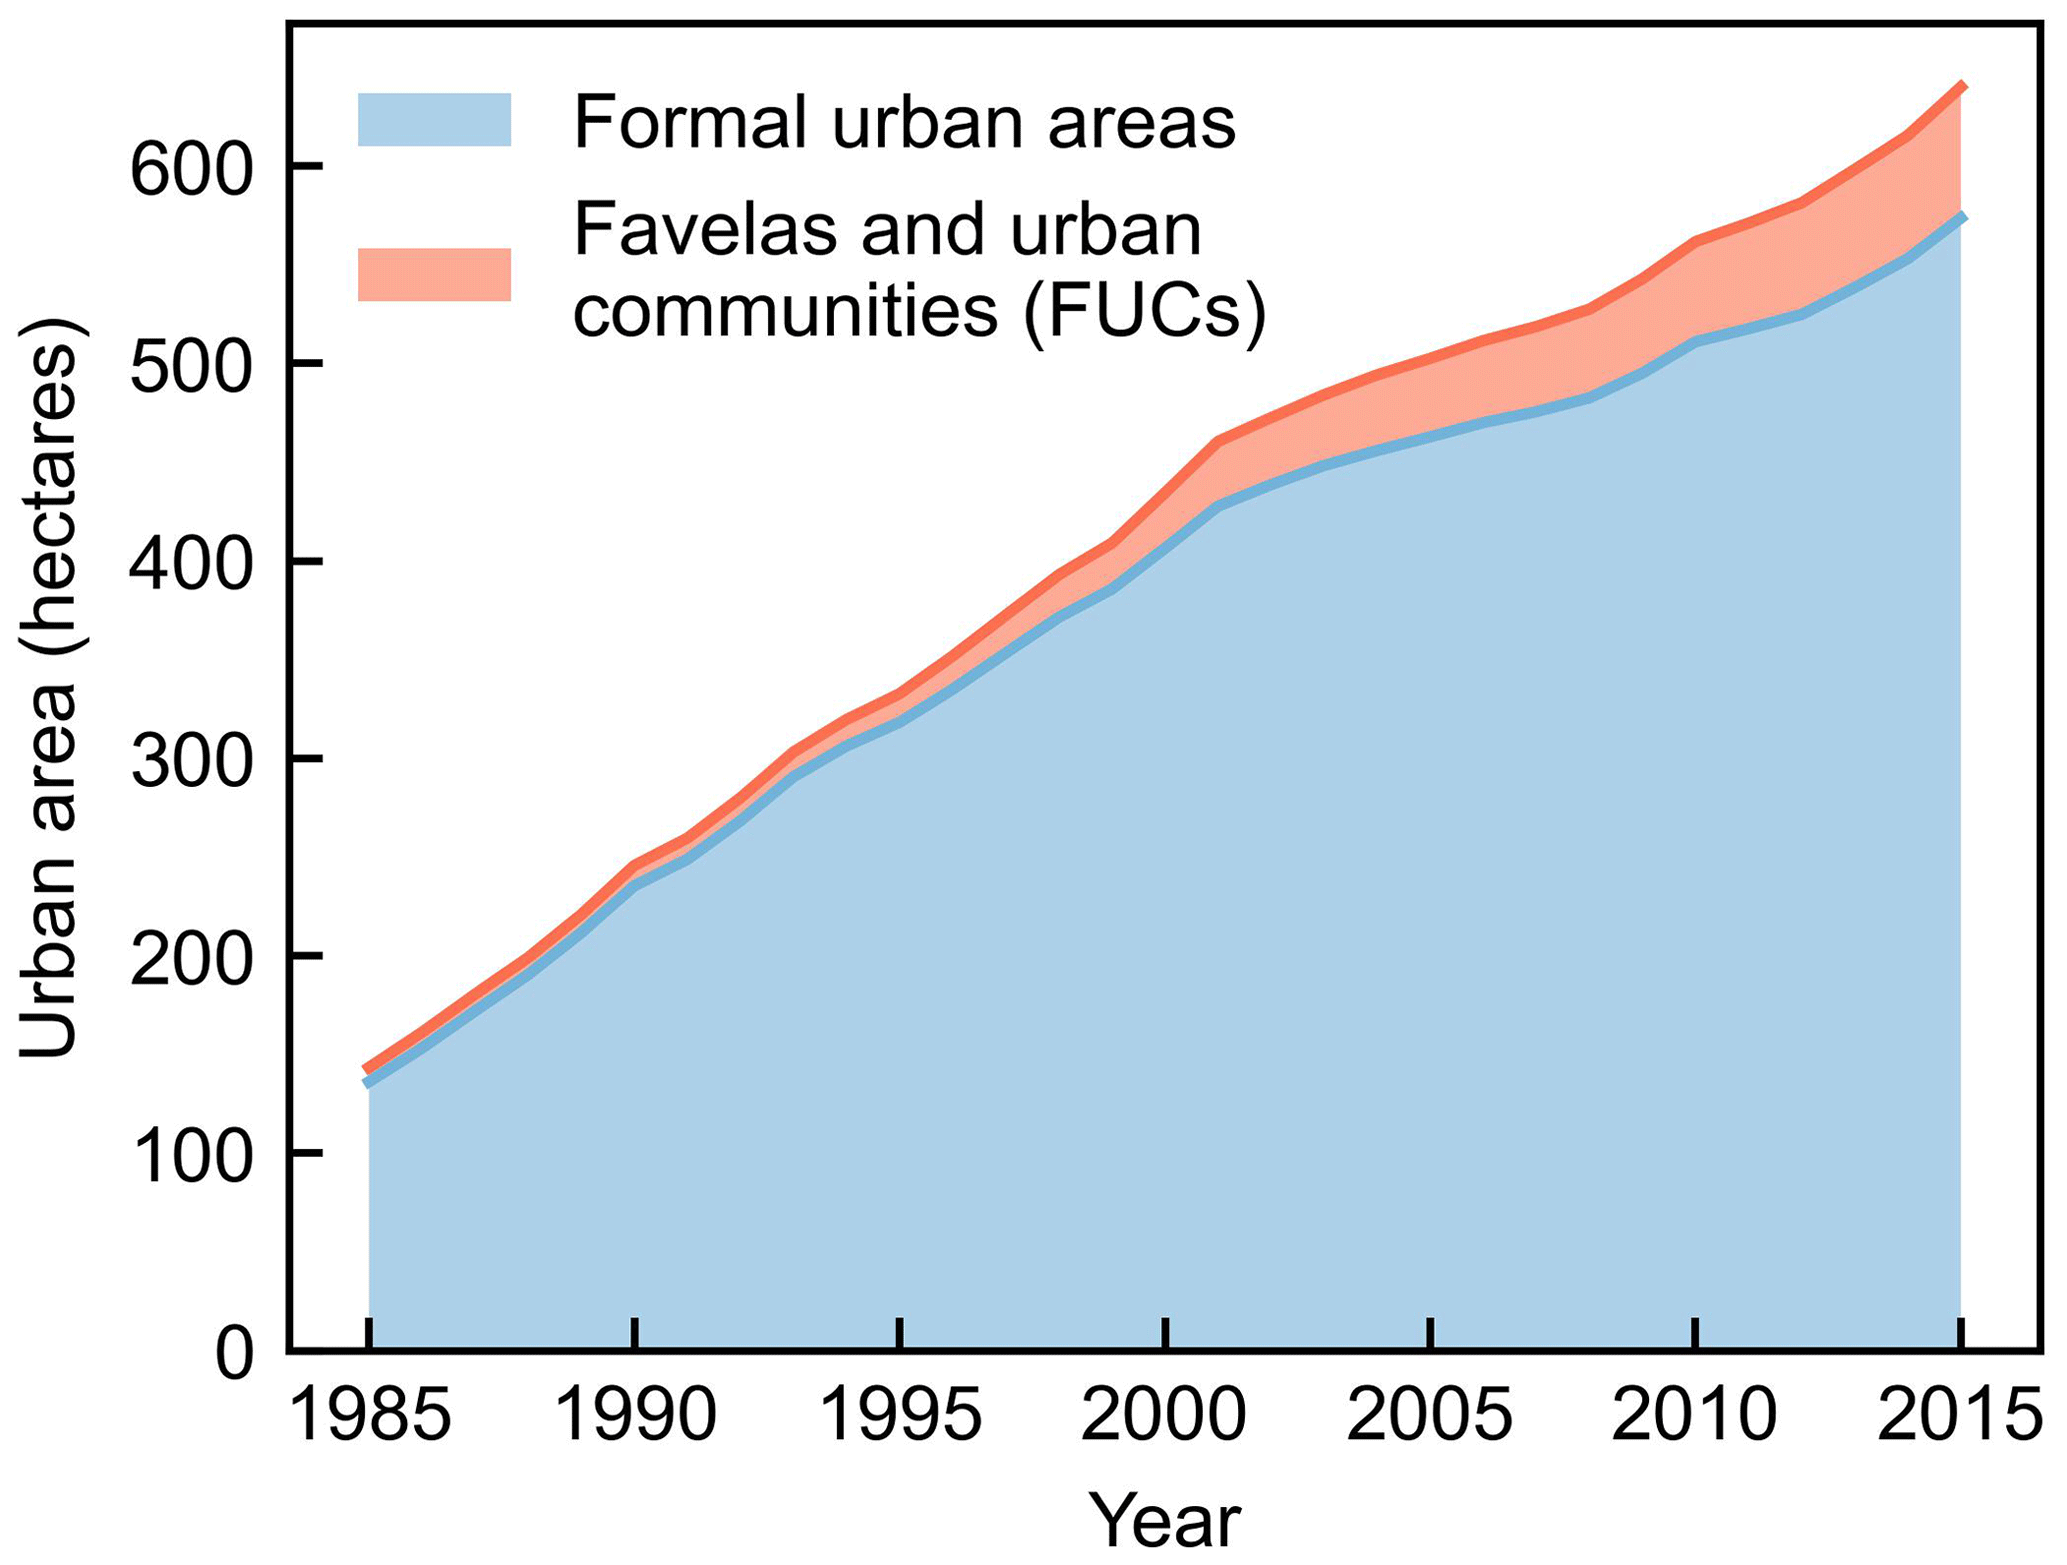
Figure 4Yearly absolute growth of non-precarious and precarious urban settlements from 1985 to 2015. Data sources: DLR (2023) and IBGE (2019b).
Figure 4 highlights an intense process of urban expansion in the study area. The total area of urban settlements increased 4.5 times from 1985 to 2015, i.e., from 143.5 to 640.0 ha. Thus, the expansion of urban areas is a recent process, with most urban settlements built over the last 3 decades.
As stated by Rosemback et al. (2010) and reinforced by Daunt et al. (2021), this fast expansion is largely attributed to the attraction of tourists and the increased accessibility to the region through the construction of the Rio-Santos highway in the late 1970s. This process was even more intensive when evaluating solely the expansion of precarious urban settlements. These settlements increased 9.2 times in the area from 1985 to 2015, i.e., from 7.2 to 66.3 ha. As a result, precarious urban settlements, which covered only 5.02 % of all urban areas in 1985, doubled their spatial coverage to 10.36 % in 2015. This evidences that urban poverty has increased in terms of spatial extent, with a considerable expansion of precarious urban settlements in the region.
4.2 Disaster impacts in the context of historical changes in (unequal) urban development
The quantification of urban growth has evidenced an intense urbanization process in the region over the last few decades, with rapid expansion of precarious urban settlements. This indicates that the impacts of the 2023 disaster were likely influenced by urban development processes. To investigate this hypothesis, we first identified and mapped the buildings damaged by the event, classifying the building condition into partial damage and total destruction. We made a distinction between buildings in precarious and non-precarious urban settlements. Table 3 summarizes the results obtained from this analysis.
Table 3Number of buildings damaged by the disaster, classified by damage class (partial damage or total destruction) and urban settlement class (precarious or non-precarious).
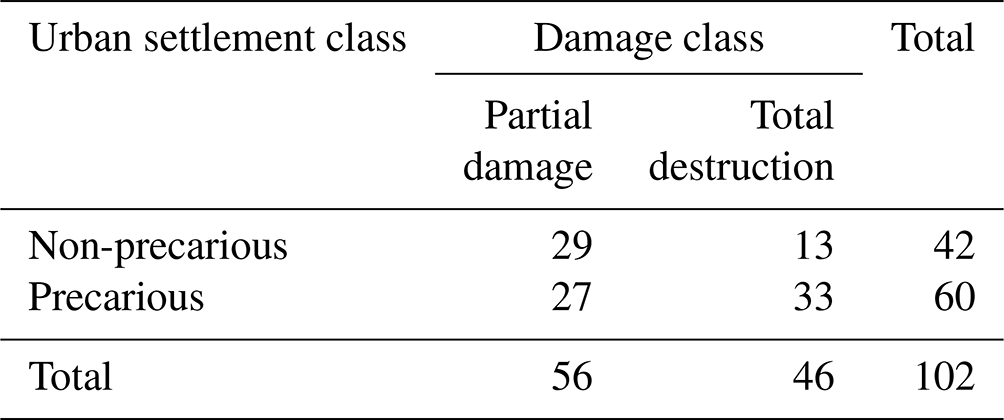
According to our analysis, the 2023 event damaged 102 buildings in the study area, of which 56 were identified as partially damaged and 46 as totally destroyed. We also observed that 60 out of the 102 damaged buildings (∼58 %) were in precarious urban settlements. These results highlight the strong influence of segregation on disaster exposure in the region, given that precarious settlements covered only 10.36 % of the total urban extent in 2015 (DLR, 2023; IBGE, 2019b), as presented in Fig. 4. Thus, the density of buildings damaged by the disaster was over 12 times higher in precarious settlements compared with non-precarious settlements. These findings are in line with Ozturk et al. (2022), who demonstrated that informal settlements are between 20 % and 500 % more exposed to landslides based on an evaluation of the situation in five tropical cities across Africa and Asia.
These patterns of segregation became even more evident when evaluating the damage severity. We observed that 27 out of the 56 buildings partially damaged by the disaster were in precarious urban settlements, which corresponds to around 48 %. In the case of total destruction, 33 out of the 46 buildings were in precarious settlements, i.e., almost 72 %. Thus, totally destructed buildings represented over 55 % of all damages in precarious urban settlements, against only 31 % in the case of non-precarious settlements. This demonstrates that not only were precarious urban settlements more exposed, but housing was also more physically vulnerable to the event.
For better visualization, Fig. 5 illustrates the spatial distribution of the buildings damaged by the disaster, with a distinction between the damage class and the urban settlement class. The size of the circle indicates the number of buildings at each location. For reference, the total number of damaged buildings at each location is also presented in white next to the circles.
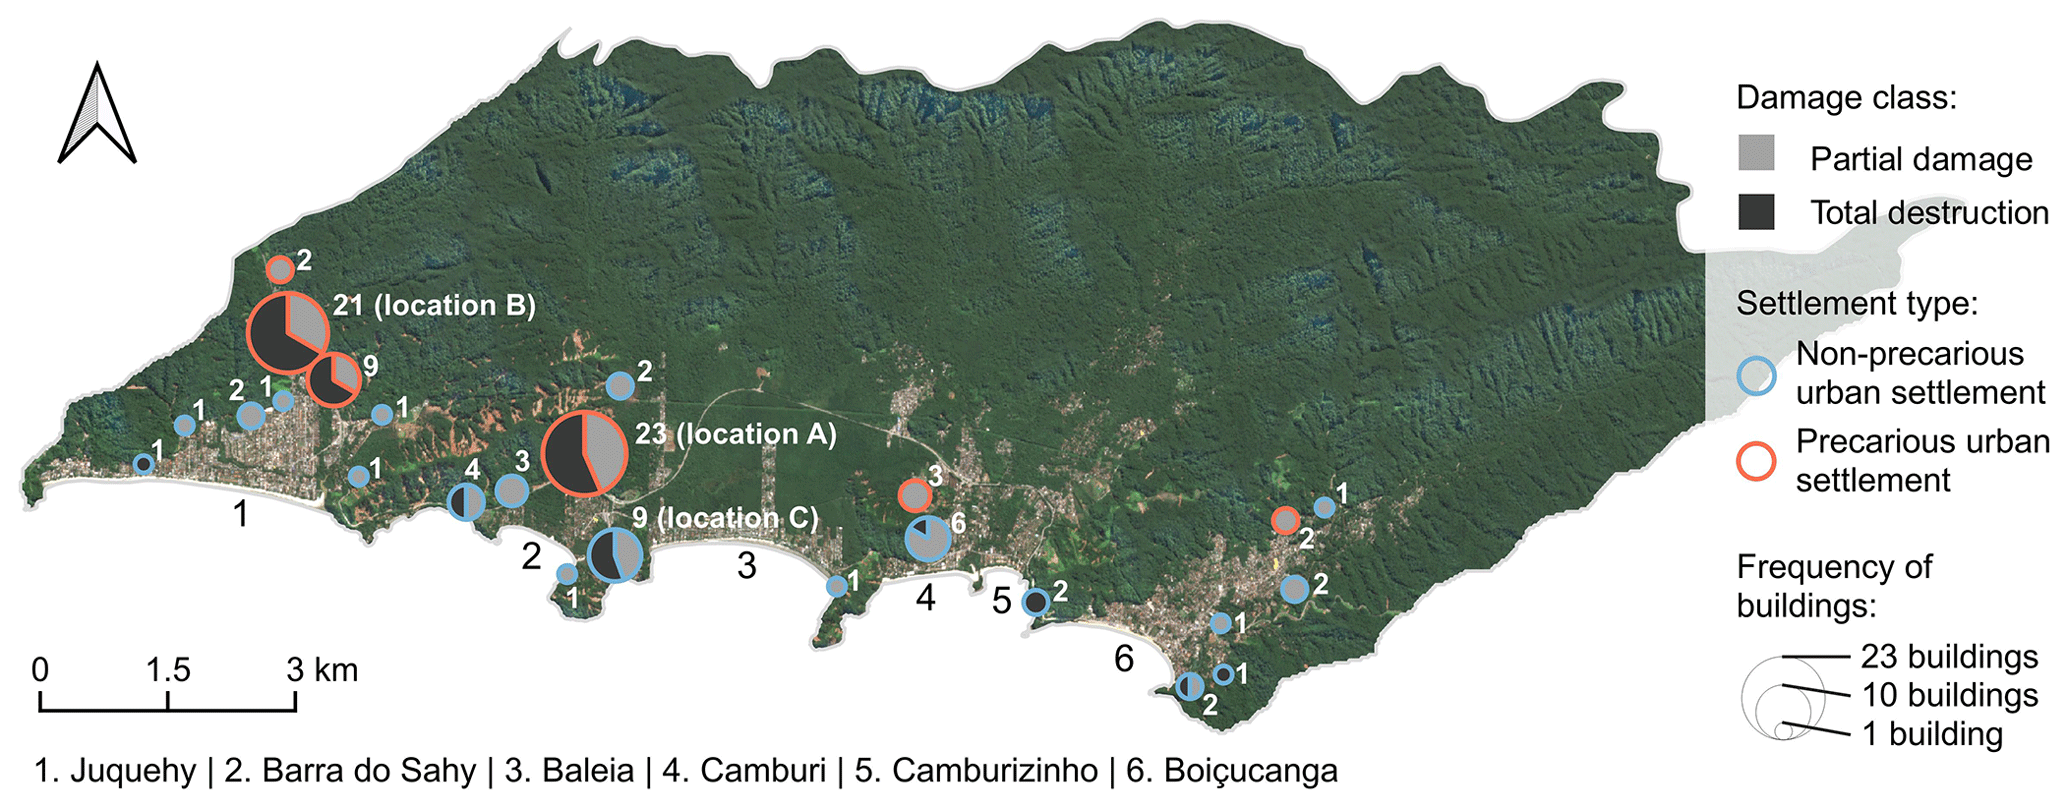
Figure 5Spatial distribution of the physical damage to buildings, classified by damage class (partial damage or total destruction) and urban settlement class (precarious or non-precarious). The groups of buildings were determined through cluster analysis, wherein building points within a maximum distance of 300 m were grouped. The highlighted locations (A, B, and C) are discussed in more detail in Figs. 6 and 7. Data sources: basemap from Image © 2023 Planet Labs PBC.
The extreme weather event that hit the NCSP in February 2023 triggered a severe multi-hazard event in the region. As a result, buildings were damaged at multiple locations, largely concentrated at the borders of existing urban settlements, as illustrated in Fig. 5. Regarding the patterns of segregation, we observed a few differences in the spatial distribution of the damage when comparing both classes of urban settlements. Non-precarious settlements were hit by the disaster at several locations but often with a low amount of damage at each of them. Another characteristic of non-precarious settlements is the predominance of buildings with partial damage. In contrast, the situation in precarious urban settlements was characterized by more intense and severe damage. For instance, precarious settlements had a considerably higher number of buildings damaged by the event, with a predominance of total destruction, as summarized in Table 3. An example can be observed in the two most impacted communities, highlighted as locations A and B in Fig. 5. Together, these communities encompassed 44 out of the 102 (∼43 %) buildings damaged by the event. Apart from the physical damage, Vila Sahy (location A in Fig. 5) was also the region that experienced most of the human losses (G1, 2023). To further elaborate on the causes leading to such extensive damage in these precarious communities, Fig. 6 presents an in-depth evaluation of both locations.
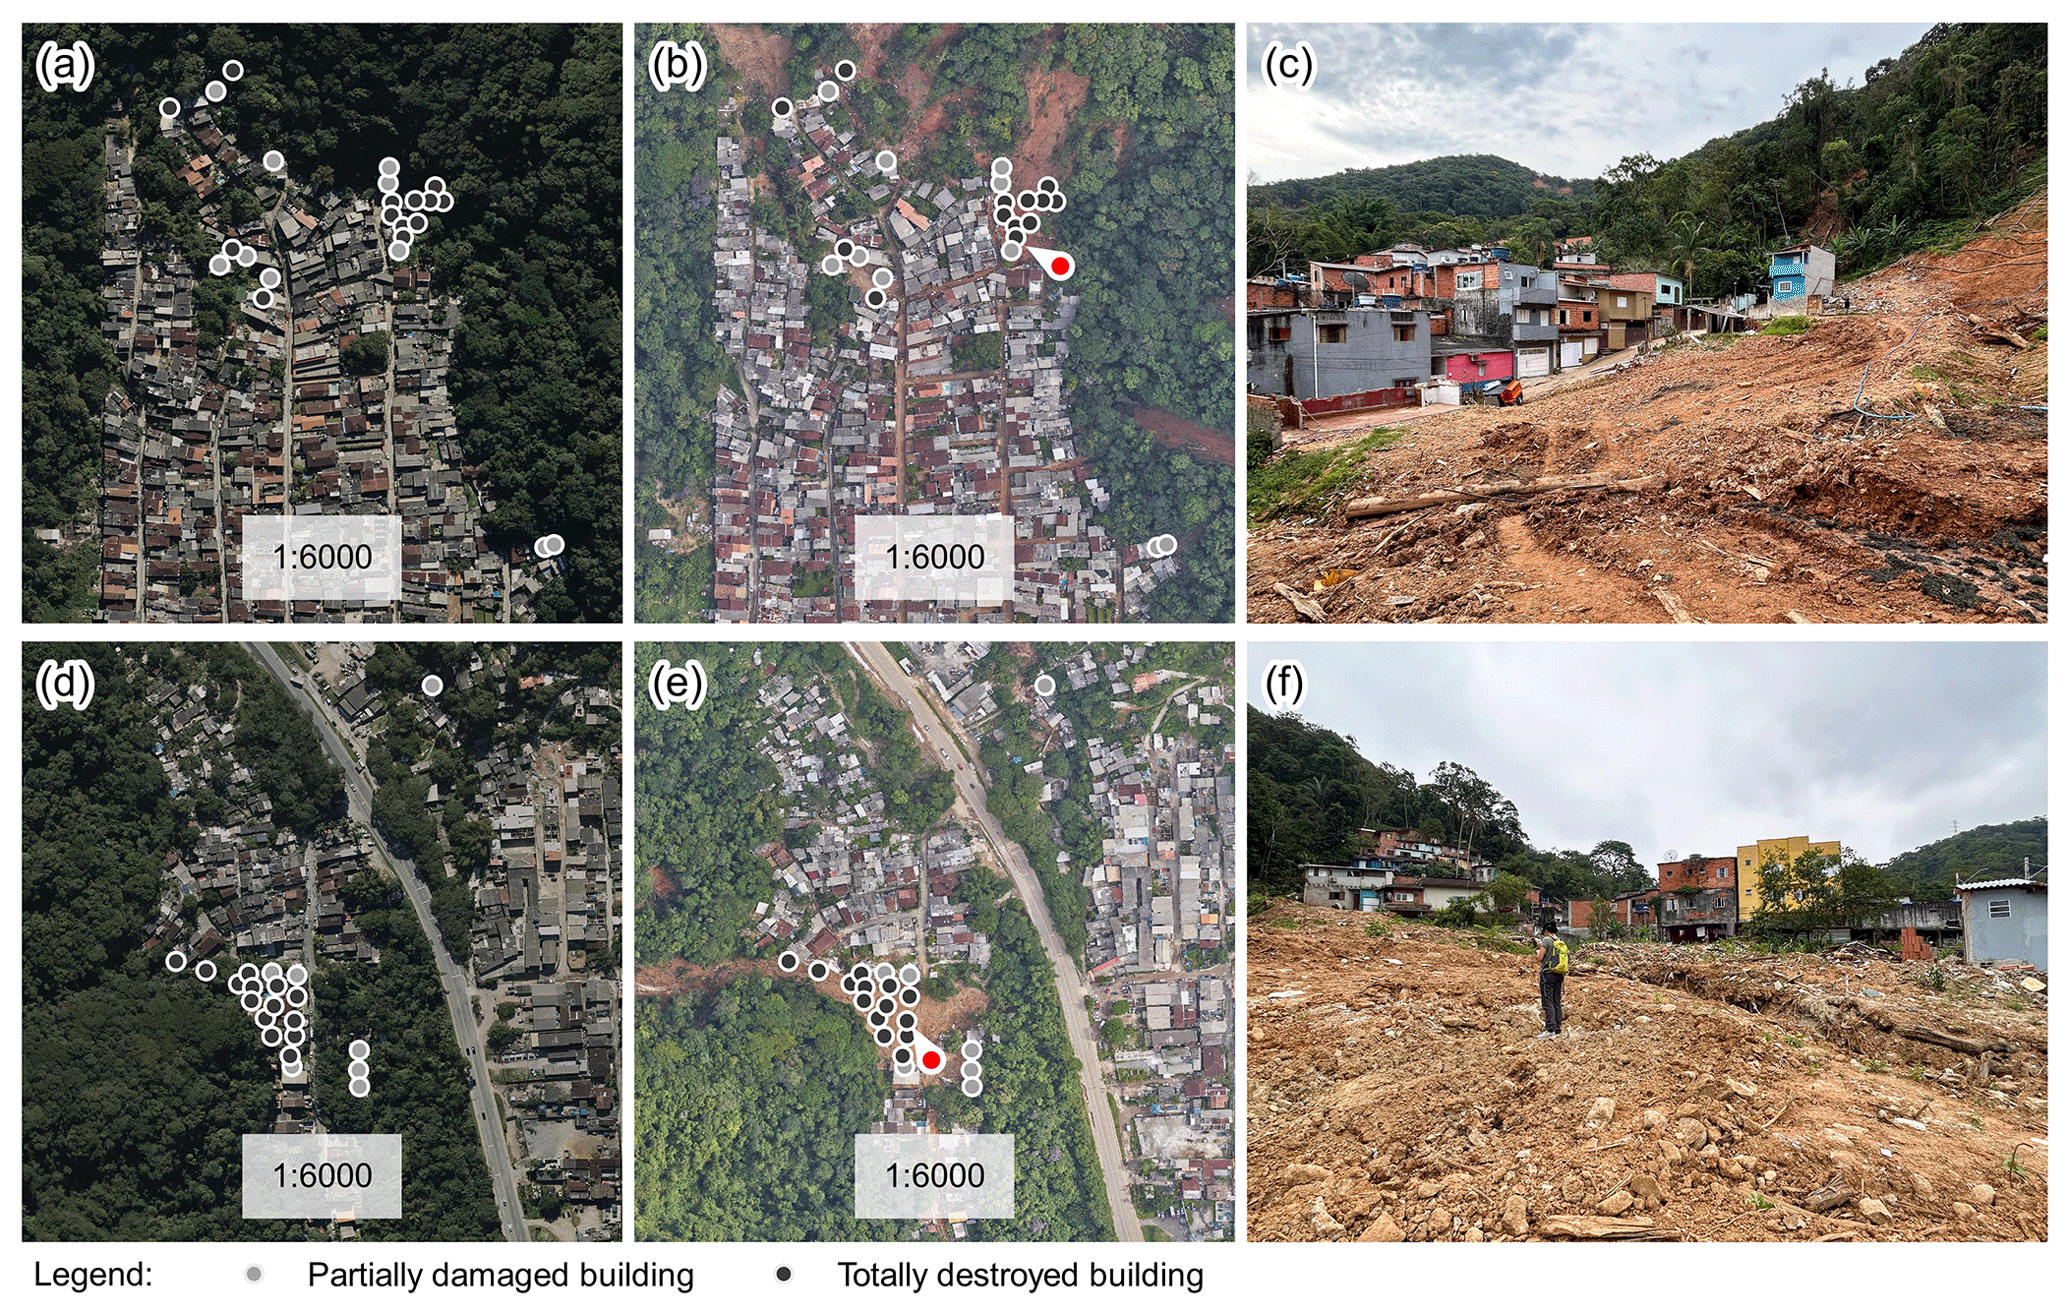
Figure 6Pre- and post-disaster damage analysis at the two most affected locations. The arrows indicate the direction of the visual field in the photographs. (a) Pre-disaster aerial view of a precarious urban settlement in Barra do Sahy (location A in Fig. 5). (b) Post-disaster aerial view at the location of (a). (c) Photograph from a field visit at the location of (a), taken in November 2023. (d) Pre-disaster aerial view of a precarious urban settlement in Juquehy (location B in Fig. 5). (e) Post-disaster aerial view at the location of (d). (f) Photograph from a field visit at the location of (d), taken in November 2023. Data source: aerial imagery from DataGEO (2023).
In the case of the community in Barra do Sahy (Fig. 6a to c), the severity of the damage was attributed to the overall impact of several landslides. As a result, 23 buildings were damaged in this region, of which 10 were classified as partially damaged and 13 as totally destroyed. The terrain topography also contributed to an intensification of the disaster impacts. The community occupies the lower elevations of a small catchment area; thus most of the surface-flowing water is drained towards the urban settlement. During the disaster, large amounts of mudflows and debris flows were channelized into the road network, as evidenced by the color of the street in the post-disaster image in Fig. 6b. During our field visit in November 2023, we observed marks on building walls reaching almost 1 m above street level. A different situation was observed in the second most impacted community in Juquehy (Fig. 6d to f). In this case, most of the damage was caused by the impacts of a single landslide on a densely populated urban area. This led to 21 damaged buildings, of which 7 were classified as partially damaged and 14 as totally destroyed.
Despite the differences in the hazard processes, these locations share certain characteristics that are possibly associated with higher damage to buildings. First, they are characterized as precarious urban settlements, which are often more physically vulnerable to disasters such as floods and landslides, as discussed by Hallegatte et al. (2020). For instance, houses in precarious settlements are typically self-built with poor-quality construction materials and do not follow formal building standards (Hallegatte et al., 2020). This difference in vulnerability was evidenced by the considerably higher percentage of totally destroyed buildings in precarious settlements compared with non-precarious settlements. The second shared characteristic is the built-up density, as observed in Fig. 6a and d. As previously illustrated in Fig. 3, precarious urban settlements are typically characterized by smaller houses and irregular land parcels, often leading to higher building densities compared with non-precarious settlements. Thus, it is expected that localized hazardous processes such as landslides might cause greater damage at these locations.
For comparative purposes, Fig. 7 illustrates the most impacted non-precarious urban settlement: a neighborhood of high-income households located between the beaches of Barra do Sahy and Baleia (location C in Fig. 5). A total of 9 buildings were damaged at this location, of which 5 were classified as totally destroyed and 4 as partially damaged. We also selected this location to reinforce that, although more frequent in precarious urban settlements, the occupation of hazardous locations such as steep slopes also occurs in non-precarious settlements. The urban area illustrated in Fig. 7 is settled on a hilly terrain, with elevations ranging from sea level up to 150 m and slopes of over 20°. Similar to the conditions in the precarious settlement in Barra do Sahy (Fig. 6a to c), this urban area was impacted by several landslides, causing damage all across the region (Fig. 7a and b). However, the low building density and the high quality of the building materials contributed to the decreased number of buildings destroyed by the event. For example, Fig. 7c represents a house settled on a steep slope in the region. The building walls are made of reinforced concrete, probably with equally strong foundations to bear the heavy loads of the construction. The building was hit by a landslide during the event, as evidenced by the presence of debris and tree branches in the surroundings, but its structure remained intact.
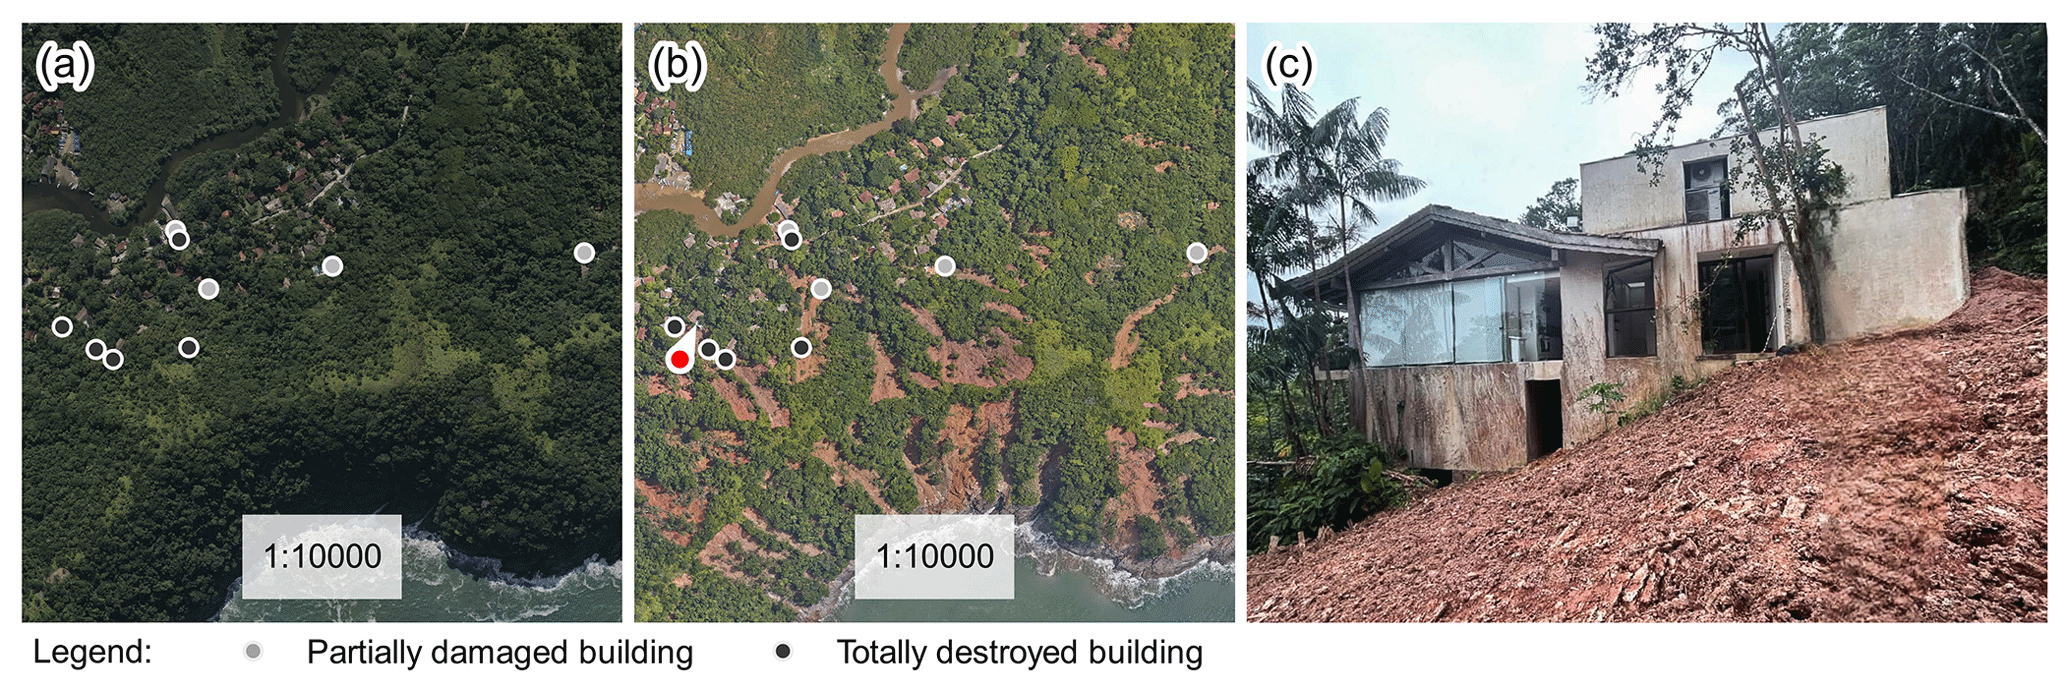
Figure 7Pre- and post-disaster damage analysis. The arrow indicates the direction of the visual field in the photograph. (a) Pre-disaster aerial view of a non-precarious urban settlement between Barra do Sahy and Baleia (location C in Fig. 5). (b) Post-disaster aerial view at the location of (a). (c) Photograph from a field visit at the location of (a), taken in November 2023. Data source: aerial imagery from DataGEO (2023).
As a second analysis, we evaluated to what extent the disaster impacts could be attributed to historical changes in urban exposure. We conducted this analysis by identifying the approximate age of each building damaged by the event, having as a reference a set of high-resolution aerial images from 2001, 2010, and 2022. We also made a distinction according to the urban settlement class (precarious or non-precarious) and damage class (partial damage or total destruction). The results are presented in Table 4.
Table 4Number of buildings damaged by the disaster, classified by urban settlement class (precarious or non-precarious), damage class (partial damage or total destruction), and period of construction (before 2001, from 2002 to 2010, or from 2011 to 2022).
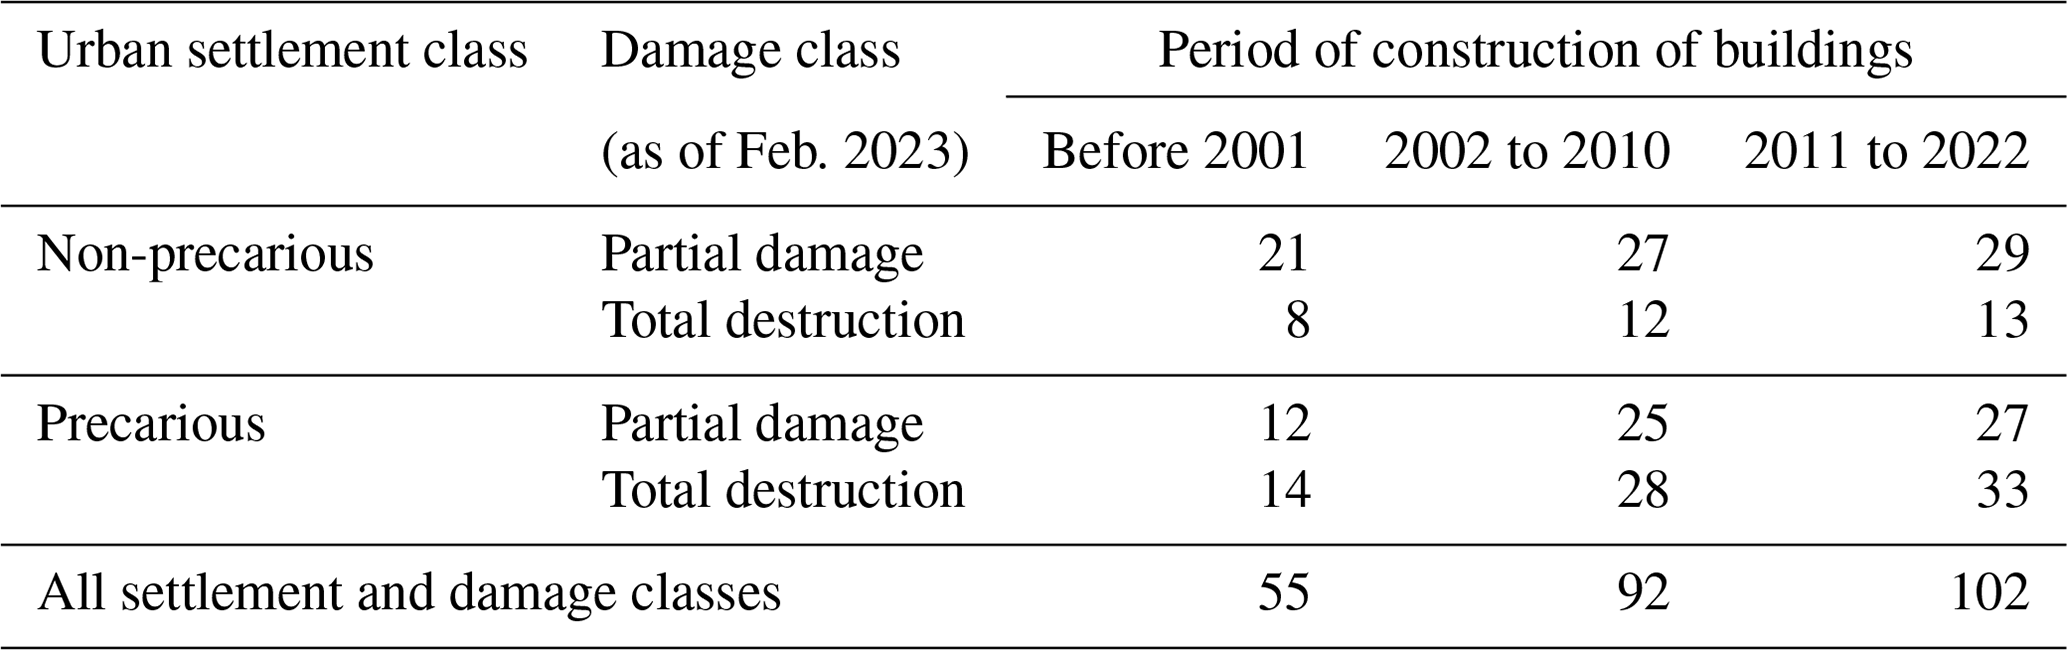
The results indicate a considerable influence of historical changes in exposure on the impacts of the 2023 disaster. We observed that 33 out of 56 buildings (∼59 %) partially damaged by the disaster already existed in 2001. This difference was even more significant when evaluating total destruction. Only 22 out of the 46 totally destroyed buildings (∼48 %) already existed in 2001. Thus, if the disaster event had happened in 2001, or a little more than 2 decades ago, it would have impacted only 55 out of the 102 buildings or 46 % fewer buildings compared with 2023. These findings highlight the criticality of the urban development process for disaster risk in the NCSP. Moreover, they corroborate previous studies that reported historical changes in global exposure to natural hazards (Pesaresi et al., 2017; Tellman et al., 2021). From 2000 to 2015, the increase in global population exposure was estimated to be 20 % for riverine floods (Tellman et al., 2021), 16 % for tsunamis, and 21 % for earthquakes (Pesaresi et al., 2017). Unfortunately, none of these studies included landslides among the analyzed hazards.
The results also highlight considerable differences in growth rates when evaluating the historical evolution of the number of buildings. We observed that 37 new buildings were constructed over 9 years from 2001 to 2010. In contrast, only 10 buildings were constructed over 12 years from 2010 to 2022. These figures point out the period from 2001 to 2010 as critical for the increase in the number of buildings exposed to the 2023 event. Unfortunately, we could not quantify the number of exposed buildings before 2001 because of the unavailability of high-resolution aerial imagery for comparison. However, it is important to mention that the analysis of urban growth patterns based on the WSF layer (see Fig. 4) provides strong evidence that the disaster impacts would have been even lower if the event had happened decades before, i.e., in 1985. For instance, the statistics of urban growth point out the period from 1985 to 2001 as having the highest growth rate, being around 20.5 ha yr−1. As a reference, the growth rate for the period from 2001 to 2010 was 12.0 ha yr−1.
Another relevant finding is the distribution of buildings according to the urban settlement class. Precarious urban settlements consisted of 34 out of the 47 buildings that were recently constructed, i.e., after 2001. These settlements also presented higher relative growth rates. From 2001 to 2022, the number of buildings increased by 2.3 times in precarious settlements and 1.4 times in non-precarious urban settlements. This faster expansion was previously discussed when evaluating the historical evolution of urban growth, as presented in Fig. 4. However, the findings presented in Table 4 demonstrate that the expansion of precarious settlements has been accompanied by an increasing occupation of hazardous locations.
4.3 Patterns and drivers of urban growth and segregation
The analysis of the disaster impacts highlighted the influence of urban growth and spatial segregation on disaster risk, especially concerning the historical evolution of urban areas. In this section, we further elaborate on this topic by investigating the factors driving these urban development processes in the region.
Figure 8 illustrates the spatiotemporal patterns of urban growth and segregation in the study area, classified at decadal intervals between 1985 and 2015. An initial evaluation of the map evidences existing patterns of segregation when comparing the location of non-precarious and precarious urban settlements. Overall, we observed a high concentration of precarious settlements along the main road that provides access to the region, the Rio-Santos highway. Figure 8 also suggests that this highway seems to act as a physical barrier segregating both settlement classes. While non-precarious urban areas occupy the high-valued lands located in closer proximity to the coastline, most precarious settlements are located further away from the ocean, on the opposite side of the highway. Figure 8 also demonstrates the temporal evolution of growth in the study area, with considerable expansion since 1985. This is particularly evident in the expansion of precarious urban settlements. For example, most of the precarious urban community in Barra do Sahy – the red area located at number 2 on the map – was built after 1996. This recently urbanized area was also the most impacted by the 2023 disaster, as previously illustrated in Fig. 6a to c.
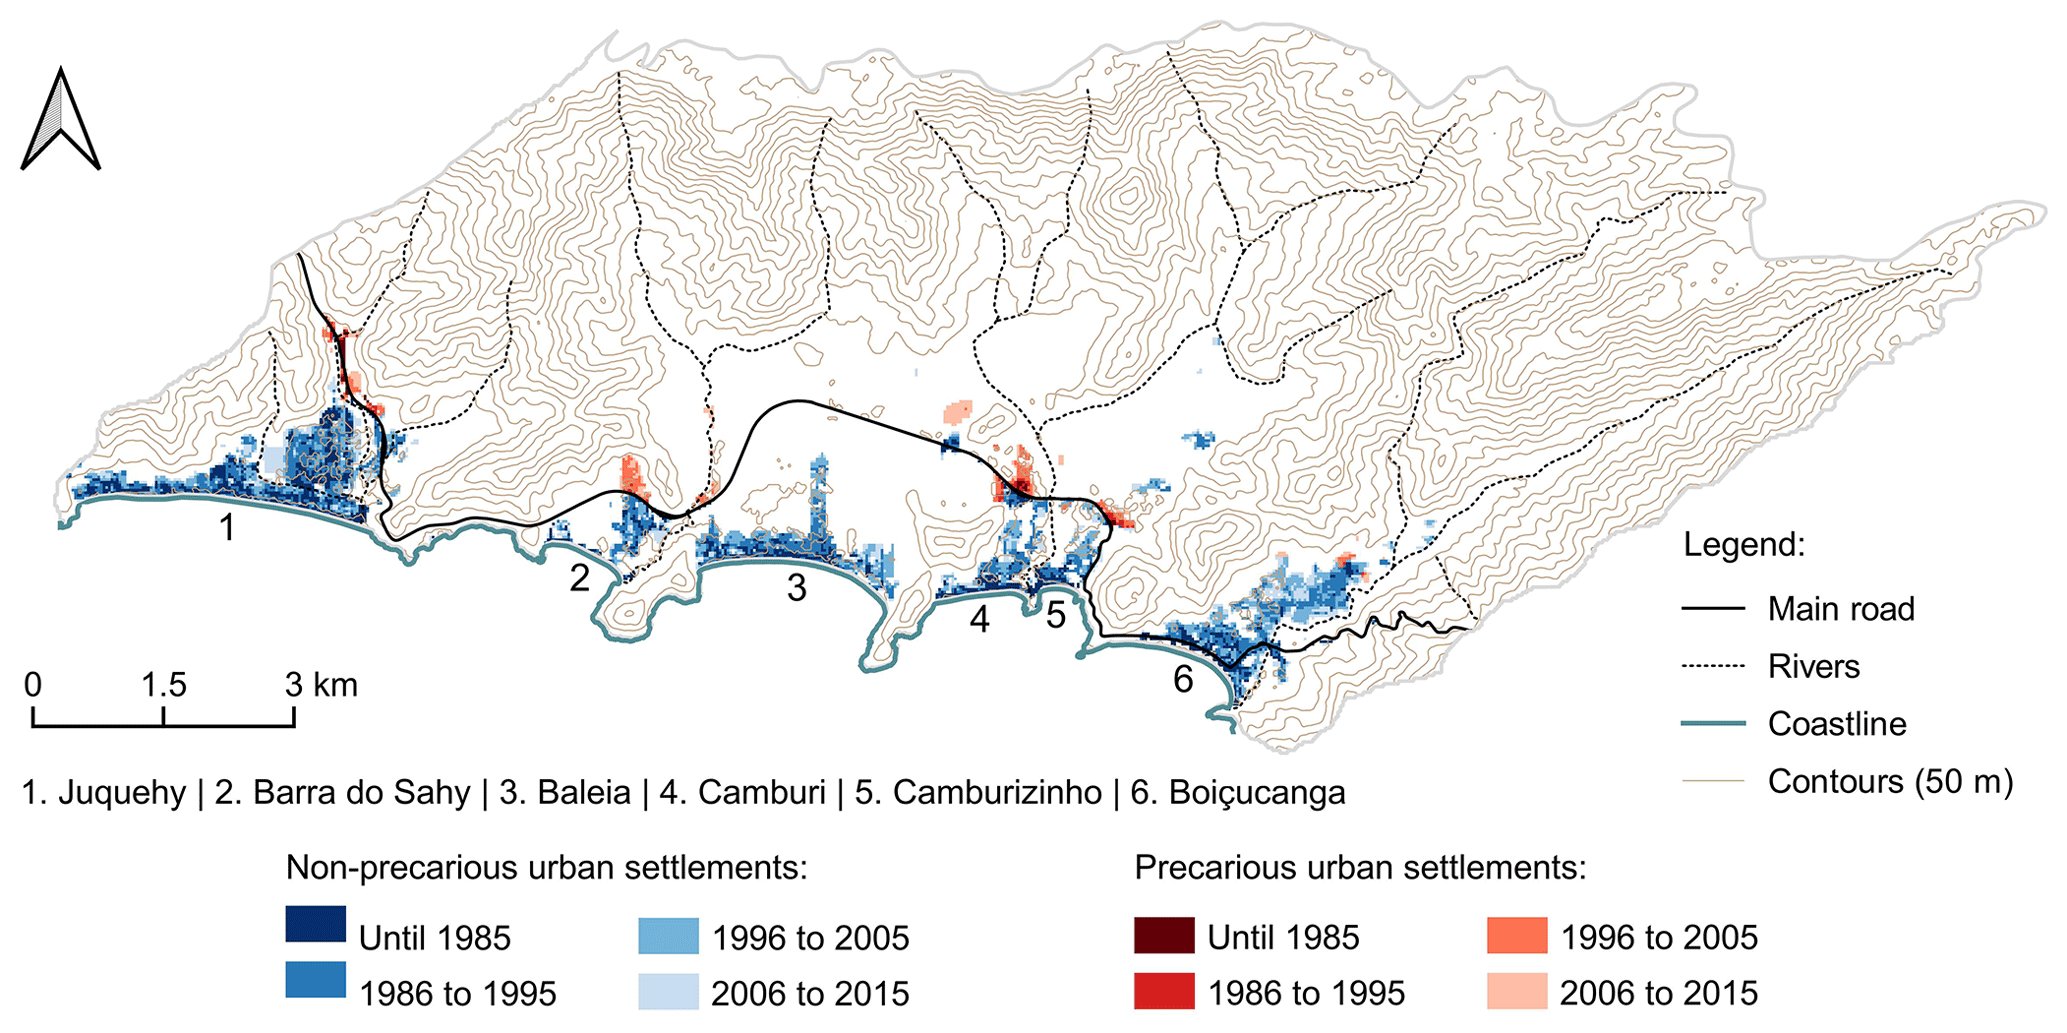
Figure 8Spatiotemporal patterns of growth of non-precarious and precarious urban settlements from 1985 to 2015. Data sources: ANA (2017), ASF DAAC (2015), DLR (2023), IBGE (2019b), and OpenStreetMap contributors (2023). © OpenStreetMap contributors 2023. Distributed under the Open Data Commons Open Database License (ODbL) v1.0.
To complement our analysis, Fig. 9 further explores the spatiotemporal patterns of growth and segregation by quantifying the statistical distribution of the urban footprint as a function of the selected spatial factors, as presented in Table 2. We conducted the analysis independently for precarious and non-precarious urban settlements so that we could further elaborate on the segregation patterns. For reference, all spatial factors are represented in Fig. 8.
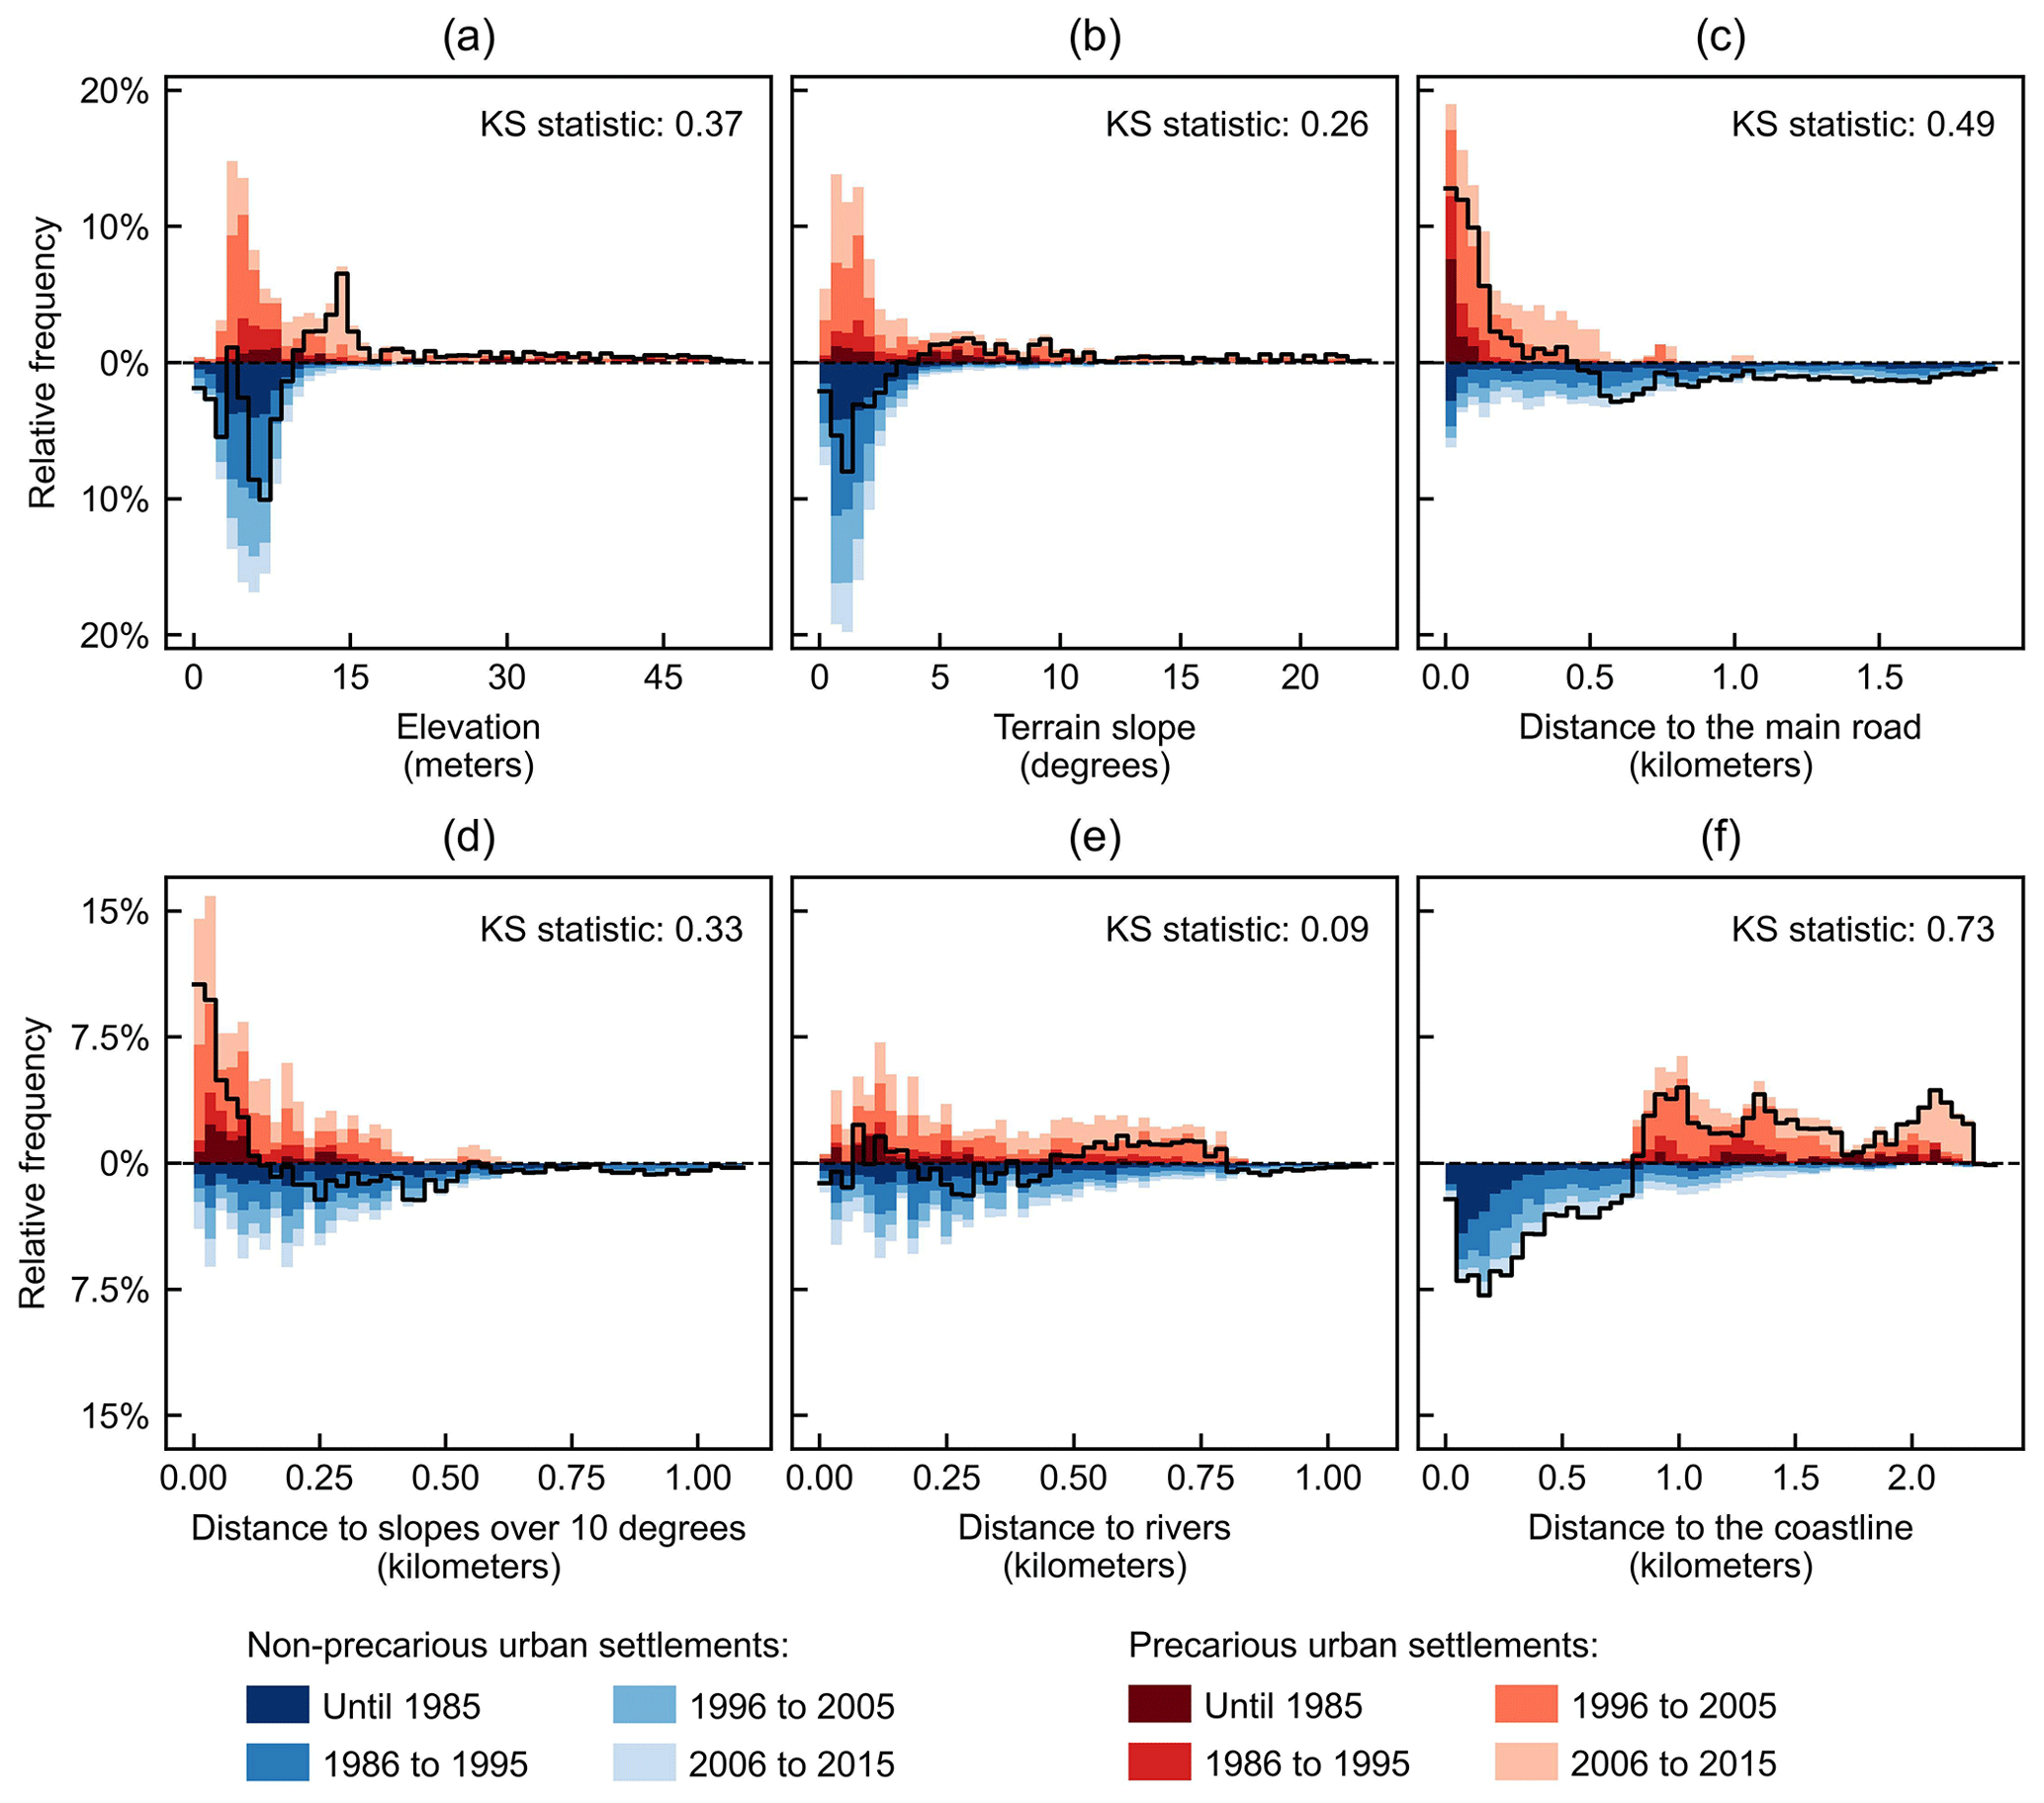
Figure 9Frequency distribution of the spatial footprint of non-precarious and precarious urban settlements, discretized in time frames, as a function of the following factors: (a) elevation, (b) terrain slope, (c) distance to the main road, (d) distance to slopes over 10°, (e) distance to rivers, and (f) distance to the coastline. The continuous black line indicates the difference between the percentages of non-precarious and precarious urban settlements. See Table 2 for data sources.
The distributions of urban areas presented in Fig. 9 highlight the existing patterns of segregation between non-precarious and precarious urban settlements. Regarding the topographical features, we observed that most urban areas, both non-precarious and precarious, are historically located at lower elevations (Fig. 9a) and on flatter terrains (Fig. 9b). This can be observed by the high number of urban cells at elevations ranging from 0 to 10 m and terrain slopes ranging from 0 to 4°. However, there is a crucial difference between both settlement classes. While non-precarious urban cells are almost entirely located within these low ranges, there is a non-negligible number of precarious urban cells at elevations of up to 52 m and slopes of up to 23° starting after 1985. For instance, the number of urban cells at slopes steeper than 10° is equivalent to 14 % of all precarious urban settlements compared to less than 3 % in the case of non-precarious settlements (Fig. 9b).
Another manifestation of spatial segregation was observed when evaluating the distance to slopes steeper than 10° (Fig. 9d). Precarious urban settlements at shorter distances from steep slopes are much more common than non-precarious urban settlements. The share of urban cells at distances shorter than 100 m from steep slopes represents 54.3 % of all precarious urban settlements, in contrast to only 22.5 % in the case of non-precarious settlements. This difference highlights the greater exposure of precarious urban settlements to landslide runouts, as evidenced by the evaluation of the impacts of the 2023 disaster. Another important observation is that most of the urban areas at shorter distances from steep slopes were recently built, i.e., from 1996. Similar trends in urban development were also observed when evaluating the increasing number of urban cells at higher elevations, i.e., since 2006 (Fig. 9a). These findings corroborate the studies of Daunt and Silva (2019) and Daunt et al. (2021), who discussed a recent tendency of urban expansion toward higher elevations and steeper slopes in the NCSP.
In addition to the frequency distributions, the results of the Kolmogorov–Smirnov (KS) test reinforce the relationship between topographical factors and urban segregation. Elevation, distance to slopes steeper than 10°, and terrain slope resulted in KS statistics of 0.37, 0.33, and 0.26, respectively. These values highlight existing dissimilarities between the distributions of precarious and non-precarious urban settlements as a function of these factors. Thus, we can affirm that these topographical factors are important variables for explaining the patterns of spatial segregation between both settlement classes.
Apart from topographical factors, contextual factors also proved to be of critical importance to understanding the patterns of growth and segregation in the NCSP. Particularly, the distance to the coastline (Fig. 9f) and the distance to the main road (Fig. 9c) proved to be key factors in orientating such patterns. However, we did not observe a clear pattern regarding the influence of the distance to rivers, as reinforced by a low dissimilarity between the distributions, i.e., a KS statistic of 0.09 (Fig. 9e). Thus, we restrict our discussion to the previous two factors.
In the context of the distance to the coastline (Fig. 9f), we observed a high concentration of precarious urban settlements at locations that are more distant from the ocean, occupying lands that are less valuable to the tourism industry. This is stated in the map presented in Fig. 8. For instance, 99.6 % of all precarious urban settlements are located at distances greater than 800 m from the coastline. The opposite situation is observed in the case of non-precarious settlements. The number of urban cells located at distances shorter than 800 m is equivalent to 73.5 % of all non-precarious urban settlements. The KS test also highlights the key influence of this contextual factor on the patterns of segregation. The distance to the coastline presented the greatest dissimilarity among all analyzed factors, as demonstrated by the KS statistic of 0.73. These figures highlight the importance of the distance to the coastline in orientating urban growth and segregation in this touristic area. In addition, we also observed a recent trend of inland urban expansion for both settlement classes, as demonstrated by the increasing concentration of urban cells at greater distances from the coastline from 1996 onwards. This trend is possibly explained by the scarcity of land available for construction, given the complex topography of the region.
We also observed patterns of spatial segregation when evaluating the influence of the distance to the main road (Fig. 9c). The number of urban cells at distances shorter than 250 m from the Rio-Santos highway is equivalent to 71.1 % of all precarious settlements compared with only 25.4 % in the case of non-precarious settlements. These differences in the locations of both settlement classes are also evidenced through the KS statistic of 0.49, the second highest among all analyzed factors. Two potential explanations for this pattern are the lower land values along the highway and the facilitated accessibility to the road system. For instance, certain areas of spontaneous growth, including precarious urban settlements, sometimes settle in closer proximity to existing public infrastructure, including along roads or railways (Kuffer et al., 2017). However, it is important to highlight that this pattern has been slowly changing over the last few decades, with recently urbanized precarious settlements moving away from the highway, i.e., since 1996. In contrast, the distance to the main road was demonstrated to be a factor of less importance in determining the location of non-precarious urban settlements. In this case, the number of urban cells is more consistently distributed across space, with the presence of urban areas at distances of up to 2 km from the highway.
4.4 Final discussions
The interrelations between the impacts of the 2023 multi-hazard event and the historical patterns in urban growth and spatial segregation pointed out key challenges associated with urban development processes in the NCSP. The increasing importance of the tourism industry in the region since the construction of the Rio-Santos highway in the late 1970s has contributed to a rapid process of urban expansion, evidenced by the high quantity of summer houses and services, e.g., hotels, restaurants, and others. This process has been accompanied by a growing population of workers to fulfill the demands of this industry (Daunt et al., 2021; Daunt and Silva, 2019; Rosemback et al., 2010). However, the inflated value of land along the coastline has limited the availability of affordable housing, thus orientating the expansion of lower-income neighborhoods towards low-valued areas. This became evident when evaluating the influence of the distance to the coastline on the location of precarious and non-precarious urban settlements. These challenges in the land market has led to strong patterns of spatial segregation, with unequal exposure and vulnerability to hazards. For instance, this study demonstrated that precarious urban settlements are considerably more frequent in hazardous locations, including on steep slopes and at short distances from steep slopes. They were also the most impacted by the disaster, as evidenced by the large number of damaged buildings, most of which were totally destroyed.
These results reinforce the multiple complexities in the disaster management cycle, especially in the context of LMICs. The expansion of precarious urban settlements towards hazardous locations and their higher physical and social vulnerability to disasters are not only a consequence of competition for urban space, as discussed by Maricato (2017), but also a repercussion of several institutional vulnerabilities. Papathoma-Köhle et al. (2021) describe institutional vulnerabilities as “an attribute that reflects the degree to which institutions can reduce the capacity of a system to withstand, cope [with] and recover from the impact of a natural hazardous process” (p. 03). This includes several dimensions of vulnerability, such as the sociopolitical (e.g., the population's risk perception and public awareness) and legal-regulatory arenas (e.g., the promulgation and, more importantly, consolidation of land use plans, building regulations, and others). Thus, urban development processes are intrinsically associated with the role of institutions.
In the Brazilian context, planning policies, including city and urban land use plans, are constitutionally compulsory for every municipality with at least 20 000 inhabitants. Nevertheless, the present study highlights strong intra-urban inequalities in the São Sebastião region, manifested as unequal exposure and vulnerability to the 2023 event. These patterns of spatial segregation indicate gaps in the effective consolidation of such policies, thus pointing out potential institutional vulnerabilities, as described by Papathoma-Köhle et al. (2021). These findings reiterate the need for instruments to address the challenge of disaster risk, taking into account the complex interrelations among institutions, the private sector, and society. From a quantitative research perspective, a potential path is the development of novel methods to integrate such dimensions into disaster risk assessments (e.g., with the use of agent-based models).
In this study, we quantified the effects of urban development processes on the impacts of the 2023 multi-hazard event on the North Coast of São Paulo in southern Brazil. The analysis evidenced that the disaster impacts were highly influenced by rapid urban expansion of 450 % from 1985 to 2015. Thus, if the same event had happened in 2001, it would have caused 46 % less physical damage to buildings. Spatial segregation also played a role in the disaster impacts. Precarious urban settlements have expanded more rapidly than non-precarious settlements. The results also indicated that precarious settlements were more exposed and vulnerable to hazard processes. The density of damaged buildings was around 12 times higher in precarious settlements compared with non-precarious settlements, with a predominance of totally destroyed buildings.
Several factors are associated with these unequal patterns of risk. First, precarious urban settlements are more common at hazardous locations, including on or at shorter distances from steep slopes, and this trend has increased over the last few decades. This segregation pattern is possibly explained by the high land values driven by the attraction of tourists to the NCSP, as evidenced by the significant influence of the distance to the coastline on the location of these urban settlements. In addition, precarious urban settlements are often characterized by urban and housing conditions that exacerbate risk, e.g., higher building densities and the prevalence of self-built houses with poor-quality construction materials.
These findings demonstrate the challenges of urban expansion in a touristic and environmentally constrained area such as the NCSP, particularly in the context of urban poverty. The high tourist attractiveness of the region leads to an expansion of urban areas and an increased need for a labor force to fulfill the demands of this industry. However, the inflated land values along the coastline limit the availability of affordable housing, thus pushing the expansion of urban settlements towards low-value inland areas. Due to the mountainous topography of the region, these settlements end up confined between existing urban areas and escarpments, often in hazardous locations.
Quantifying and acknowledging such spatial injustices in disaster exposure and vulnerability are essential for bringing awareness to the challenges facing urban areas worldwide, especially regarding urban poverty. While this study presented the main lessons learned from a local event in Brazil, the challenges of urbanization and growing intra-urban inequalities are global. Thus, there is an urgent need for more holistic research efforts that go beyond the hazard component and for more sensitive and democratic approaches and interventions in disaster risk reduction.
The data that support the findings of this study are openly available in Bastos Moroz and Thieken (2024, https://doi.org/10.17632/2s44zm5433.1).
CBM: conceptualization, methodology, software, formal analysis, writing (original draft). AHT: supervision, conceptualization, methodology, writing (review and editing).
The contact author has declared that neither of the authors has any competing interests.
Publisher’s note: Copernicus Publications remains neutral with regard to jurisdictional claims made in the text, published maps, institutional affiliations, or any other geographical representation in this paper. While Copernicus Publications makes every effort to include appropriate place names, the final responsibility lies with the authors.
This research has been supported by the Deutsche Forschungsgemeinschaft (grant no. GRK 2043/2).
This paper was edited by Sven Fuchs and reviewed by Julio Cesar Pedrassoli and one anonymous referee.
Allan, A., Soltani, A., Abdi, M. H., and Zarei, M.: Driving Forces behind land use and land cover change: A systematic and bibliometric review, Land, 11, 1222, https://doi.org/10.3390/land11081222, 2022.
ANA: Base hidrográfica multiescalas 2017 5k, ANA [data set], https://dadosabertos.ana.gov.br/datasets/5b97dc790ebc4307938d8a5b089c1aab_0/about (last access: 20 September 2024), 2017.
Arango Carmona, M. I., Moroz, C. B., Ferrer, J. V., Oberhagemann, L., Mohor, G. S., Skålevåg, A., Soares, N. S., Trojand, A., Jacome, F. V., and Thieken, A. H.: A multi-hazard perspective on the São Sebastião-SP event in February 2023: What made it a disaster?, in: XXV Brazilian Symposium on Water Resources (Aracaju, Brazil, 19–24 November 2023), https://anais.abrhidro.org.br/job.php?Job=14954 (last access: 20 September 2024), 2023.
ASF DAAC: ALOS PALSAR Radiometric Terrain Corrected (RTC), ASF [data set], https://doi.org/10.5067/JBYK3J6HFSVF, 2015.
Bastos Moroz, C. and Thieken, A. H.: Urban growth and spatial segregation increase disaster risk: Lessons learned from the 2023 disaster on the North Coast of São Paulo, Brazil, Mendeley Data, V1 [data set], https://doi.org/10.17632/2s44zm5433.1, 2024.
CBH-LN: Relatório de situação dos recursos hídricos do Litoral Norte, https://cbhln.com.br/relatorio-de-situacao-dos-recursos-hidricos (last access: 20 September 2024), 2022.
CPRM: Levantamento da geodiversidade: projeto atlas pluviométrico do Brasil: isoietas anuais médias: período 1977 a 2006, CPRM [data set], https://rigeo.cprm.gov.br/jspui/handle/doc/22220?mode=full (last access: 20 September 2024), 2011.
DataGEO: DataGEO. Sistema Ambiental Paulista, DataGEO [data set], https://datageo.ambiente.sp.gov.br/app/ (last access: 20 September 2024), 2023.
Daunt, A. B. P. and Silva, T. S. F.: Beyond the park and city dichotomy: Land use and land cover change in the northern coast of São Paulo (Brazil), Landscape Urban Plan., 189, 352–361, https://doi.org/10.1016/j.landurbplan.2019.05.003, 2019.
Daunt, A. B. P., Silva, T. S. F., Bürgi, M., and Hersperger, A. M.: Urban expansion and forest reserves: Drivers of change and persistence on the coast of São Paulo State (Brazil), Land Use policy, 101, 105189, https://doi.org/10.1016/j.landusepol.2020.105189, 2021.
Dias, H. C., Dias, V. C., and Vieira, B. C.: Landslides and morphological characterization in the Serra do Mar, Brazil, in: Landslides and engineered slopes. Experience, theory and practice: Proceedings of the 12th International Symposium on Landslides (Naples, Italy, 12–19 June 2016), https://doi.org/10.1201/9781315375007, 2016.
DLR: World Settlement Footprint (WSF) evolution (1985–2015), DLR [data set], https://download.geoservice.dlr.de/WSF_EVO/ (last access: 20 September 2024), 2023.
G1: Tragédia no litoral de SP: Mortes na Vila Sahy ocorreram no limite da área onde prefeitura permitiu ocupação, https://g1.globo.com/sp/sao-paulo/noticia/2023/02/24/tragedia-no-litoral-norte-de-sp-mapa-do-g1-mostra-o-rastro-de- destruicao-e-morte-na-vila-sahy-epicentro-do-desastre.ghtml (last access: 20 September 2024), 2023.
Hallegatte, S., Vogt-Schilb, A., Rozenberg, J., Bangalore, M., and Beaudet, C.: From poverty to disaster and back: A review of the literature, Econ. Disasters Clim. Chang., 4, 223–247, https://doi.org/10.1007/s41885-020-00060-5, 2020.
Haslwanter, T.: An introduction to statistics with Python: with applications in the life sciences, 1st ed., edited by: Härdle, W. K., Springer, Cham, https://doi.org/10.1007/978-3-319-28316-6, 2016.
IBGE: Aglomerados subnormais 2019: classificação preliminar e informações de saúde para o enfrentamento à COVID-19: notas técnicas, https://biblioteca.ibge.gov.br/index.php/biblioteca-catalogo?view=detalhes&id=2101717 (last access: 20 September 2024), 2019a.
IBGE: Favelas e comunidades urbanas, IBGE [data set], https://www.ibge.gov.br/geociencias/organizacao-do-territorio/tipologias-do-territorio/15788-favelas-e-comunidades-urbanas.html?edicao=27720 (last access: 20 September 2024), 2019b.
IBGE: IBGE cidades, https://cidades.ibge.gov.br/ (last access: 20 September 2024), 2022.
IBGE: Cartas sobre a geomorfologia na escala 1 : 250,000, IBGE [data set], https://www.ibge.gov.br/geociencias/informacoes-ambientais/geomorfologia/10870-geomorfologia.html?=&t=acesso-ao-produto (last access: 20 September 2024), 2023.
IBGE: Sobre a mudança de aglomerados subnormais para favelas e comunidades urbanas, https://biblioteca.ibge.gov.br/index.php/biblioteca-catalogo?view=detalhes&id=2102062 (last access: 20 September 2024), 2024.
IPCC: Climate change 2022: Impacts, adaptation and vulnerability, Geneva, Switzerland, https://www.ipcc.ch/report/ar6/wg2/ (last access: 20 September 2024), 2022.
Kuffer, M., Pfeffer, K., Sliuzas, R., Baud, I., and van Maarseveen, M.: Capturing the diversity of deprived areas with image-based features: The case of Mumbai, Remote Sens., 9, 384, https://doi.org/10.3390/rs9040384, 2017.
MapBiomas Project: Collection 8 of the annual land use land cover maps of Brazil, MapBiomas [data set], https://brasil.mapbiomas.org/en/colecoes-mapbiomas/ (last access: 20 September 2024), 2022.
Maricato, E.: The future of global peripherical cities, Lat. Am. Perspect., 44, 18–37, https://doi.org/10.1177/0094582X16685174, 2017.
Mesta, C., Cremen, G., and Galasso, C.: Urban growth modelling and social vulnerability assessment for a hazardous Kathmandu Valley, Sci. Rep., 12, 1–17, https://doi.org/10.1038/s41598-022-09347-x, 2022.
OpenStreetMap contributors: Planet dump, https://planet.openstreetmap.org/ (last access: 20 September 2024), 2023.
Ozturk, U., Bozzolan, E., Holcombe, E. A., Shukla, R., Pianosi, F., and Wagener, T.: How climate change and unplanned urban sprawl bring more landslides, Nature, 608, 262–265, https://doi.org/10.1038/d41586-022-02141-9, 2022.
Papathoma-Köhle, M., Thaler, T., and Fuchs, S.: An institutional approach to vulnerability: Evidence from natural hazard management in Europe, Environ. Res. Lett., 16, 044056, https://doi.org/10.1088/1748-9326/abe88c, 2021.
Pesaresi, M., Ehrlich, D., Kemper, T., Siragusa, A., Florczyk, A., Freire, S., and Corbane, C.: Atlas of the human planet 2017. Global exposure to natural hazards, Publications Office of the European Union, 92 pp., https://doi.org/10.2760/19837, 2017.
Portugali, J.: Cities, complexity and beyond, in: Handbook on cities and complexity, edited by: Portugali, J., Edward Elgar Publishing, 13–27, https://doi.org/https://doi.org/10.4337/9781789900125, 2023.
Pumo, D., Arnone, E., Francipane, A., Caracciolo, D., and Noto, L. V: Potential implications of climate change and urbanization on watershed hydrology, J. Hydrol., 554, 80–99, https://doi.org/10.1016/j.jhydrol.2017.09.002, 2017.
Queiroz, D., Lemos, L., Krunfli, M., Morimoto, T., and Araújo, Y.: Impactos da tragédia no Litoral Norte de São Paulo deixam rastros sociais e ambientais, https://aun.webhostusp.sti.usp.br/index.php/2023/07/18/impactos-da-tragedia-no-litoral-norte-de-sao-paulo-deixam-rastros-sociais- e-ambientais/ (last access: 20 September 2024), 2023.
Ribeiro, M. C., Metzger, J. P., Martensen, A. C., Ponzoni, F. J., and Hirota, M. M.: The Brazilian Atlantic Forest: How much is left, and how is the remaining forest distributed? Implications for conservation, Biol. Conserv., 142, 1141–1153, https://doi.org/10.1016/j.biocon.2009.02.021, 2009.
Rosemback, R., Monteiro, A. M. V., Novaes Jr., R. A., Feitosa, F. F., and Ramos, F. R.: Ampliando o olhar: Metodologia para estudo comparativo dos padrões de segregação socioespacial nas regiões de conurbação de São José dos Campos e Jacareí, no Vale do Paraíba e Ubatuba, Caraguatatuba e São Sebastião, no Litoral Norte de SP, in: XVII Encontro Nacional de Estudos Populacionais (Caxambú, Brazil, 20–24 September 2010), 2010.
São Paulo State: Lei complementar no 1.166, de 09 de janeiro de 2012. Cria a região metropolitana do Vale do Paraíba e Litoral Norte, e dá providências correlatas, https://www.al.sp.gov.br/repositorio/legislacao/lei.complementar/2012/lei.complementar-1166-09.01.2012.html (last access: 20 September 2024), 2012.
São Paulo State: Decreto no 62.913, de 08 de novembro de 2017. Dispõe sobre o Zoneamento Ecológico-Econômico do Setor do Litoral Norte, e dá providências correlatas, https://www.al.sp.gov.br/repositorio/legislacao/decreto/2017/decreto-62913-08.11.2017.html (last access: 20 September 2024), 2017.
Sieg, T. and Thieken, A. H.: Improving flood impact estimations, Environ. Res. Lett., 17, 064007, https://doi.org/10.1088/1748-9326/ac6d6c, 2022.
Tellman, B., Sullivan, J. A., Kuhn, C., Kettner, A. J., Doyle, C. S., Brakenridge, G. R., Erickson, T. A., and Slayback, D. A.: Satellite observations indicate increasing proportion of population exposed to floods, Nature, 596, 80–86, https://doi.org/10.1038/s41586-021-03695-w, 2021.
UN: World Urbanization Prospects: The 2018 Revision (ST/ESA/SER.A/420), United Nations, New York, https://doi.org/10.18356/b9e995fe-en, 2018.
UN-Habitat: World cities report 2022: Envisaging the future of cities, Nairobi, Kenya, https://unhabitat.org/world-cities-report-2022-envisaging-the-future-of-cities (last access: 20 September 2024), 2022.
UNISDR: Sendai framework for disaster risk reduction 2015–2030, Geneva, Switzerland, https://www.undrr.org/publication/sendai-framework-disaster-risk-reduction-2015-2030 (last access: 20 September 2024), 2015.