the Creative Commons Attribution 4.0 License.
the Creative Commons Attribution 4.0 License.
 | 10 Jan 2024
Compound flood impacts from Hurricane Sandy on New York City in climate-driven storylines
Henrique M. D. Goulart
Irene Benito Lazaro
Linda van Garderen
Karin van der Wiel
Dewi Le Bars
Elco Koks
Bart van den Hurk
High impact events like Hurricane Sandy (2012) significantly affect society and decision-making around weather/climate adaptation. Our understanding of the potential effects of such events is limited to their rare historical occurrences. Climate change might alter these events to an extent that current adaptation responses become insufficient. Furthermore, internal climate variability in the current climate might also lead to slightly different events with possible larger societal impacts. Therefore, exploring high impact events under different conditions becomes important for (future) impact assessment. In this study, we create storylines of Sandy to assess compound coastal flooding on critical infrastructure in New York City under different scenarios, including climate change effects (on the storm and through sea level rise) and internal variability (variations in the storm's intensity and location). We find that 1 m of sea level rise increases average flood volumes by 4.2 times, while maximised precipitation scenarios (internal variability) lead to a 2.5-fold increase in flood volumes. The maximised precipitation scenarios impact inland critical infrastructure assets with low water levels, while sea level rise impacts fewer coastal assets though with high water levels. The diversity in hazards and impacts demonstrates the importance of building a set of relevant scenarios, including those representing the effects of climate change and internal variability. The integration of a modelling framework connecting meteorological conditions to local hazards and impacts provides relevant and accessible information that can directly be integrated into high impact event assessments.
- Article
(6026 KB) - Full-text XML
- BibTeX
- EndNote


Coastal cities face significant exposure to storm induced compound coastal flooding (Wahl et al., 2015; IPCC, 2022; Woodruff et al., 2013; Dullaart et al., 2021). In the context of storms, compound coastal flooding often involves heavy precipitation and high storm surges (Wahl et al., 2015; Bevacqua et al., 2020). Impacts of coastal storms include fatalities and damage to buildings and critical infrastructure (CI) (Hallegatte et al., 2013; Chang, 2016; Hall et al., 2019). A recent example of a high impact event is Hurricane Sandy, which struck the east coast of the USA in October 2012. Coastal flooding in New York City (NYC) disrupted several CI systems, impacting millions of people (SIRR, 2013; Kunz et al., 2013). In the aftermath of the event, and similarly in extreme events around the world, society was activated to reduce vulnerability to similar events in the future (Rosenzweig and Solecki, 2014).
Climate change is projected to increase tropical cyclone (TC) precipitation rates and average intensity (Knutson et al., 2020), and rising sea levels are expected to exacerbate the impacts of coastal flooding (Nicholls and Cazenave, 2010; Hallegatte et al., 2013; Hinkel et al., 2014; Oppenheimer et al., 2019). However, significant uncertainties remain regarding the influence of climate change on individual events at regional scales, as global statistics and thermodynamic arguments may not fully apply to local climatological situations (Stott et al., 2016; Gutmann et al., 2018; Trenberth et al., 2018; Shepherd, 2019). Future projections of sea level rise (SLR) also carry significant uncertainties, especially regarding the timing of core processes, such as dynamical ice loss from Greenland and Antarctica (IPCC, 2021; Le Bars, 2018).
Besides climate change, internal variability within the climate system has a defining role in causing specific high impact events (Deser et al., 2012; Schwarzwald and Lenssen, 2022; Goulart et al., 2023; Hamed et al., 2023). For storms specifically, previous studies have noted that frequency, tracks, and landfall positions exhibit large internal variability (Done et al., 2014; Mei et al., 2015; Bony et al., 2015). Considering impacts rather than meteorological conditions, internal variability has been identified as a major driver of differences, surpassing differences between emission scenarios (Done et al., 2018).
High impact events, like Sandy, carry great significance for society and societal decision-making, as evident from NYC's intensified climate adaptation plans in response to Sandy (SIRR, 2013; Aerts et al., 2013; Rosenzweig and Solecki, 2014) and in policy-making processes elsewhere around the globe (Gerritsen, 2005; Martinez et al., 2019; Bartholomeus et al., 2023). However, our understanding of the potential impacts of these events is limited to their rare historical occurrences. The impacts of similar events in the future will be different, due to the combination of climate change and internal variability (Otto et al., 2018; Goulart et al., 2021, 2023), potentially hindering the effectiveness of adaptation measures based on historical events and outcomes (Mechler et al., 2010; Haasnoot et al., 2020; Bartholomeus et al., 2023). To comprehensively assess the risk of high impact events, it is essential to consider both climate change and internal variability, and develop a range of relevant and distinct scenarios (Sutton, 2019; Lehner and Deser, 2023). Storylines, plausible self-consistent developments of climatic events (Shepherd et al., 2018), have been previously used for impact assessment applications (van den Hurk et al., 2023a). For example, Qiu et al. (2022) combined a historical TC with global warming projections, sea level rise, and riverine flood to stress test compound floods in China’s Pearl River Delta, and Koks et al. (2023) combined historical high impact storms with different scenarios of sea level rise and future socioeconomic developments to assess coastal flooding damages on critical infrastructure and explore possible adaptation solutions.
In this paper, we employ an event based storyline approach to explore alternative realisations of Sandy and to assess the societal impacts of these alternative events. We study the unfolding of Hurricane Sandy under different conditions using a model chain including climate, compound flooding, and impact components to establish a clear connection between cause and effect and to obtain a comprehensive understanding of the potential implications associated with these events (Shepherd et al., 2018; Sillmann et al., 2020). We build storylines of Sandy, combining spectrally nudged storyline data, sea level rise scenarios, and storm track manipulation, which together account for the effects of climate change and internal variability (Fig. 1a; Table 1). Our modelling framework combines multiple models that cover the chain of events from the meteorological and climatological characteristics to their flood hazards and to the resulting societal impacts (Fig. 1b). As an impact metric, we focus on the exposure of buildings and critical infrastructure assets on the coast of the NYC metropolitan region.
Table 1Summary of the scenarios considered in this study, the corresponding numbers and names of members in each scenario (see text for acronym definitions), and in which section they are explained.
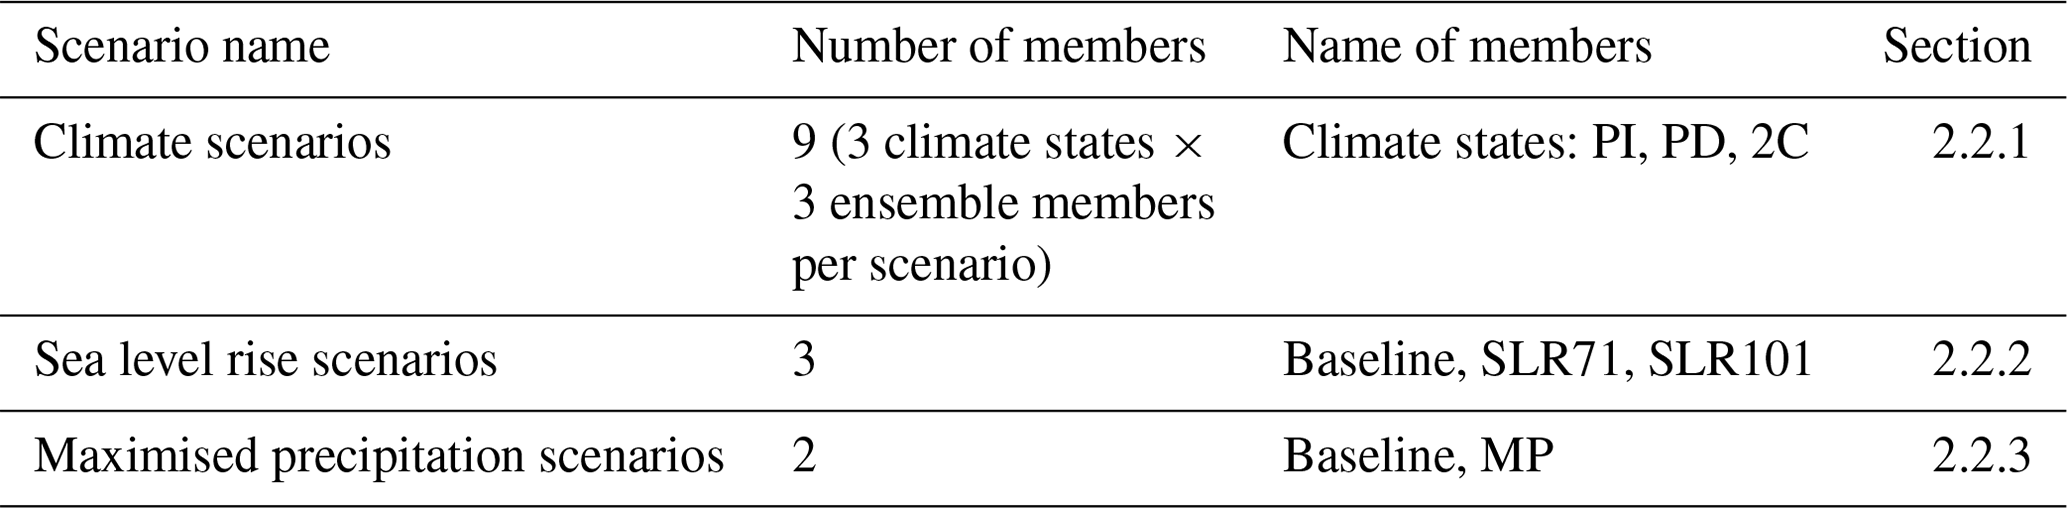
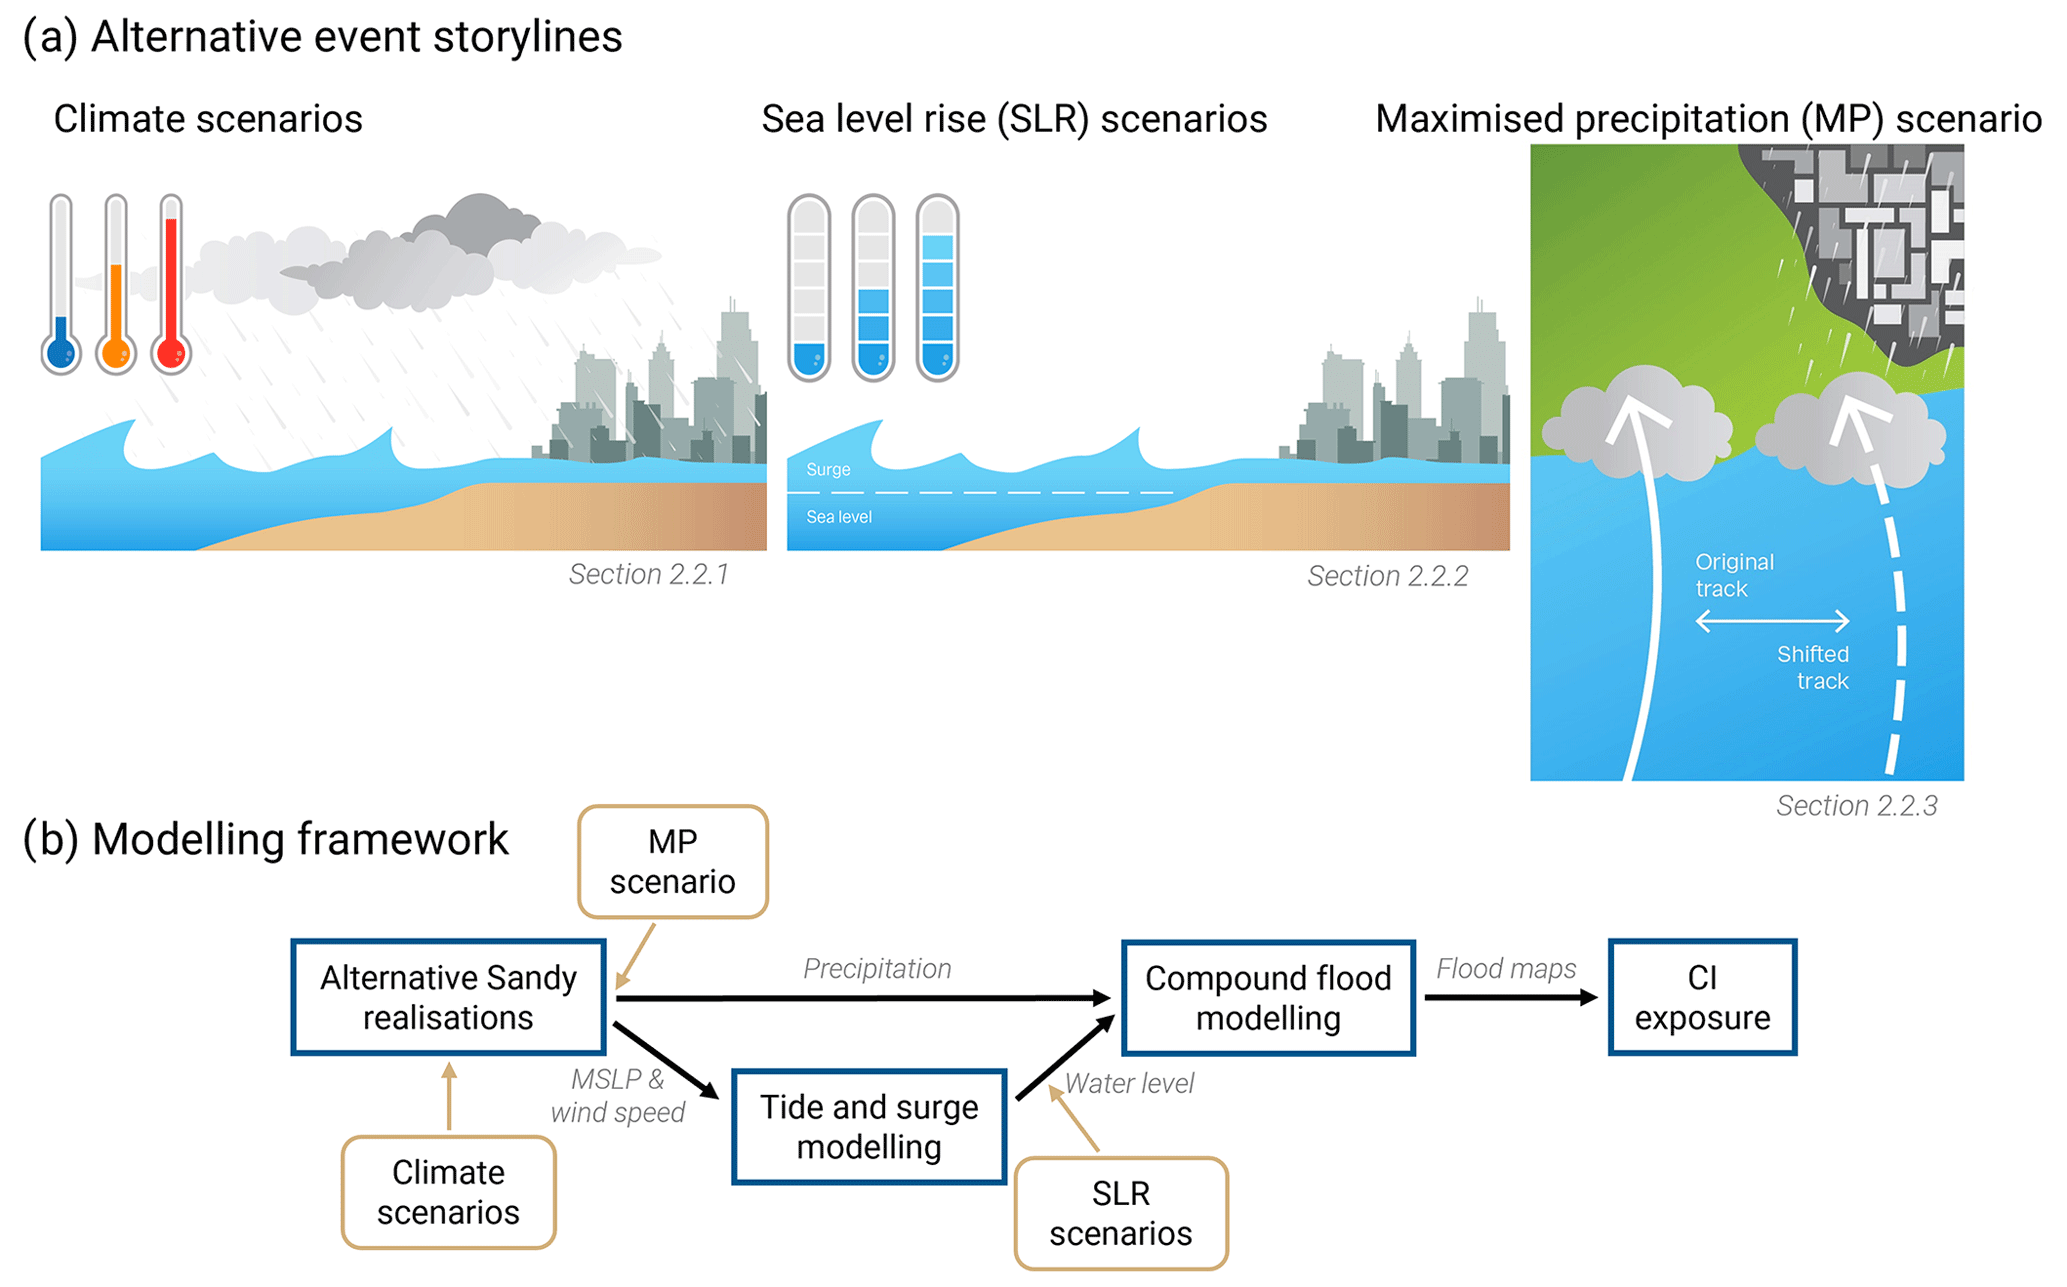
Figure 1Panel (a) is an illustration of the alternative event storylines considered in this study. Left: the spectrally nudged storylines with different levels of global warming (i.e. climate scenarios); middle: the sea level rise (SLR) scenarios; right: the maximised precipitation (MP) scenario. Panel (b) shows a modelling framework connecting meteorological and climatic conditions, such as wind speed and mean sea level pressure (MSLP), to flood modelling and critical infrastructure (CI) exposure.
2.1 Case study
Sandy began as a tropical depression in the southwestern Caribbean Sea on 22 October 2012 and intensified while moving northward. It peaked as a Category 3 hurricane over Jamaica and Cuba with wind speeds of 50 m s−1 and a minimum pressure of 954 hPa. The storm caused heavy rainfall and flooding in multiple countries. It encountered a blocking high and a low-pressure system, which halted its northward movement and caused it to turn westward and intensify again (Hall and Sobel, 2013; Kunz et al., 2013; SIRR, 2013).
On 29 October 2012, Hurricane Sandy hit the US east coast, causing unprecedented coastal flooding in the NYC metropolitan region. Most of the flooding was caused by a high storm surge, but inland precipitation also modestly contributed to the flooding (SIRR, 2013; Kunz et al., 2013; Yates et al., 2014). The event resulted in 43 fatalities and caused USD 19 billion in damage in NYC alone (Kunz et al., 2013). Power outages affected 21.3 million people due to cascading effects in the power system (SIRR, 2013; Kunz et al., 2013; Yates et al., 2014). In this work, we focus the analysis of the impacts of Sandy on the coastal area surrounding the NYC metropolitan region, including parts of New Jersey and Connecticut, as seen in Fig. A1.
2.2 Alternative event storylines
The scenarios used in this work to build alternative event storylines of Sandy are summarised in Table 1 and are explained in the following sections.
2.2.1 Climate scenarios: spectrally nudged storylines
Spectral nudging (von Storch et al., 2000) is a technique used to recreate historical climate events by forcing the large-scale atmospheric patterns in climate models with reanalysis data while allowing small-scale processes to respond freely (Schubert-Frisius et al., 2017). We use the event based spectrally nudged storylines dataset from van Garderen et al. (2021), created using the general circulation model (GCM) ECHAM version 6.1.00 (Stevens et al., 2013). In this setup, the large-scale free atmosphere (minimum wavelength of 2000 km at altitudes above 750 hPa) is spectrally nudged towards the atmospheric divergence and vorticity derived from the NCEP R1 reanalysis data (Kalnay et al., 1996) to reproduce historical climate events. By nudging the modelled atmospheric large-scale patterns towards reanalysis, the model simulations are reproductions of historical large-scale weather events, though leaving small-scale processes and the dynamics of the lower atmosphere to respond freely (van Garderen and Mindlin, 2022). This latter point enables the model to respond to different climatological background states which have been prescribed to the model. ECHAM6 is the atmospheric component of the MPI-ESM coupled model (Tebaldi et al., 2021) used in the Sixth Coupled Model Intercomparison Project (CMIP6). It has a T255 horizontal spectral resolution and 95 vertical levels (T255L95). More details on the ECHAM6 model and the spectral nudging technique are available in Schubert-Frisius et al. (2017).
The spectrally nudged storylines dataset consists of three climatic worlds governed by different global warming levels (van Garderen and Mindlin, 2022):
-
a counterfactual scenario assuming pre-industrial global temperature values (13.6 ∘C; referred to as “PI”)
-
a present-day scenario in which global temperature is prescribed from observed conditions in 2010 (14.28 ∘C; referred to as “PD”), and
-
a counterfactual scenario assuming a global temperature 2 ∘C above the pre-industrial value (15.15 ∘C; referred to as “2C”).
The different climatic scenarios were created by modifying model sea surface temperatures (SSTs) and greenhouse gas (GHG) concentrations. For the PD simulations, SSTs and sea ice concentrations were obtained from the NCEP R1 reanalysis data, and the GHG forcing (CO2, CH4, N20, and CFCs) was based on observed values (Meinshausen et al., 2011). For the PI simulations, the SST climatological warming pattern (calculated as the 2000–2009 average of CMIP6 historical simulations minus the average of CMIP6 piControl simulations) was subtracted from the NCEP R1 reanalysis pattern, and GHG forcing was based on observed concentrations from the year 1890. For the 2C simulations, SSTs and GHG values were obtained from outputs of the MPI-ESM model using the shared socioeconomic pathway (SSP) 5-8.5 scenario (O'Neill et al., 2016) between 2044 and 2053, which corresponds to a global temperature of 2 ∘C above pre-industrial levels. All simulations use the same land use and aerosol forcing. Each climatic scenario has three members (generated using different starting spin-up times; see van Garderen, 2022) which are used to investigate the consistence of forced changes and the influence of internal variability on the local and regional conditions within the large-scale nudged events. As such, we investigated three alternative realisations of Sandy (internal variability) within three distinct climate scenarios (climate change: PI, PD, and 2C). More details on the spectrally nudged storyline datasets are available in van Garderen et al. (2021) and van Garderen (2022).
2.2.2 Sea level rise scenarios
We explore the consequences of the Sandy landfall for different SLR scenarios (Fig. 1a) derived from the sixth assessment report (AR6) from the Intergovernmental Panel on Climate Change (IPCC, 2021). SLR projections have considerable uncertainties regarding the timing of core processes, which leads to different SLR estimations at distinct time periods despite the same global temperature increases (Le Bars, 2018; IPCC, 2021). Consequently, we explore local estimations of SLR for NYC under a global 2 ∘C warming at different time periods and considering only processes for which projections can be made with at least medium confidence (IPCC, 2021). The estimations result from multi-model projections with a global mean temperature increase between 1.75 and 2.25 ∘C during 2080–2100 with respect to pre-industrial levels. They also include different time frames to account for the temporal variability in SLR for the same temperature increase (IPCC, 2021). The median SLR values in NYC are 71 cm for 2100 (referred to as SLR71 scenario) and 101 cm for 2150 (referred to as SLR101 scenario). These increases are relative to local mean sea level from 1995–2014, which account for the effects of local land subsidence. The SLR scenarios are combined with the water levels from Sect. 2.3.1 to compute flood levels in the alternative realisations of Sandy under SLR.
2.2.3 Maximised precipitation scenarios
As discussed previously, the exact tracks of hurricanes are subject to substantial internal variability of the climate system (Done et al., 2014; Mei et al., 2015; Yamada et al., 2019), with varying consequences for society. It can be considered physically plausible that Sandy could have made landfall in a slightly different, but nearby, location, leading to potentially (very) different impacts. Considering this uncertainty, we explore worst-case scenarios resulting from internal variability to obtain impact-relevant outcomes (Sutton, 2019; Schwarzwald and Lenssen, 2022).
We manipulate each simulated storm track from Sect. 2.2.1 to create another alternative realisation of the event (Fig. 1a). These track manipulations are designed to explore the consequences of maximised precipitation over NYC, due to alternative landfall locations. For that, we calculate the precipitation sum aggregated in a zone of 4∘ surrounding the storm centre from 9 h before landfall to 9 h after landfall in the USA. We identify the grid cell on land with the highest cumulative precipitation during this time window and subsequently realign the entire storm track horizontally (shifting storm track latitudes and longitudes) to ensure that this precipitation maximum is located above the study area (Fig. A3). We refer to these projections as maximised precipitation scenarios.
We use a tracking algorithm based on Baatsen et al. (2015) and Bloemendaal et al. (2019). For every time step, the initial eye position of the storm is determined by the historical storm data from the IBTrACS dataset (Knapp et al., 2010). We then find the location of the maximum vorticity within a box around the eye position and update the location if it has a lower mean sea level pressure (MSLP) than the initial eye position. After that, we determine the minimum MSLP position within a box around the updated eye location and select it as the final eye position.
2.3 Modelling framework
2.3.1 Tides and storm surges modelling
Tides and storm surges are dynamically simulated using the Global Tide and Surge Model (GTSM) v4.1 (Muis et al., 2020). GTSM is a calibrated global hydrodynamic model based on Delft3D Flexible Mesh (Kernkamp et al., 2011). It has an unstructured grid with varying resolution, finer near the coasts (2 km in this study) and coarser in the deep ocean (25 km). We use data from the General Bathymetric Chart of Oceans (GEBCO) 2014 dataset (GEBCO, 2014) with a 30 arcsec resolution as input for the bathymetry. GTSM uses tide-generating forces and simulates storm surges based on wind speed and atmospheric pressure forcings. The combined effects of tides and storm surges determine the total water levels. We force the model with MSLP and wind speed data from Sect. 2.2.1 and 2.2.3 to generate water levels in the study area. We do not explicitly force the timing between peak surge and high tides, as all runs have peak surges occurring within the high tide period (Fig. A2).
2.3.2 Compound coastal flooding modelling
We simulate the compound flooding on the study area with the Super-Fast INundation of CoastS (SFINCS) model (Leijnse et al., 2021). SFINCS is a reduced-physics solver used to simulate compound (pluvial, fluvial, and coastal) flooding in coastal areas. It solves simplified equations of mass and momentum to simulate overland flow in two dimensions, accurately estimating flooding while being computationally efficient (Leijnse et al., 2021). SFINCS incorporates physical processes, such as spatially varying friction and infiltration, and has been used previously to assess the compound flood impact of TCs (Leijnse et al., 2021; Sebastian et al., 2021; Eilander et al., 2023b). A full description of the model is available in Leijnse et al. (2021).
In this study, we set up the SFINCS model and process the input data using the Python package HydroMT (Eilander et al., 2023a). For surface elevation we use modern and high resolution datasets publicly available: the Continuously Updated DEM (CUDEM, both and arcsec resolution) (Amante et al., 2023) and the 0.3048 m resolution NYC Topobathy Lidar DEM (OCM Partners, 2017) for the coastal topography and bathymetry of the NYC region. For the areas where those datasets are not available, we use the global datasets FABDEM (Hawker et al., 2022) and GEBCO (GEBCO, 2014) to fill missing data. The roughness coefficients used in our models are obtained from the Copernicus Global Land Service (Buchhorn et al., 2020) and infiltration data from the GCN250 dataset (Jaafar et al., 2019). We run SFINCS at 50 m resolution and we force the model with precipitation and water levels from the previous steps to obtain flood maps of the study area. We also simulate the events with precipitation and coastal water levels separately to estimate their contribution to compound flooding.
2.3.3 Societal impact modelling: critical infrastructure data and exposure
To assess the potential societal consequences of alternative realisations of Hurricane Sandy, we perform an exposure analysis of the built environment, accounting for both CI assets and buildings. The assessment involves overlaying geospatial information of buildings and assets with flooding maps, which allows evaluation of the built environment exposure to flooding.
Apart from all buildings within the study area, our study includes seven major CI systems as identified by Nirandjan et al. (2022): energy, transportation, telecommunication, water, waste, education, and health. To obtain the necessary CI data, we rely on the widely accessible OpenStreetMap (OSM) database (Haklay and Weber, 2008). This source has been utilised in multiple studies (Koks et al., 2019; Nirandjan et al., 2022; Koks et al., 2023; Liu et al., 2023), demonstrating its suitability for our purposes. Information gaps exist within OSM and the level of completeness varies substantially across the world (Herfort et al., 2023). For NYC, the fraction of buildings included has been estimated to be between 55 % (Zhou et al., 2022) and 80 % (Herfort et al., 2023). For CI assets, only very limited coverage estimates are available. More than 90 % of all roads in NYC are estimated to be included (Kazakov et al., 2023).
Different CI assets may exhibit varying responses to distinct flood levels. Unfortunately, comprehensive information regarding the vulnerability of CI assets to specific flood levels is limited (Zio, 2016) and, in particular, the cost of reconstruction and replacement of CI assets is not available for New York City. Inspired by (Koks et al., 2019), we adopted a discrete and qualitative approach by dividing water levels into three categories: low (0.15–0.5 m), medium (0.5–1 m), and high (> 1 m). This approach allows us to quantify the number of exposed assets in each water level category and how it changes under different scenarios, identifying hotspots of impacts, without trying to assign specific monetary value.
3.1 Alternative meteorological event realisations and climate change scenarios
We evaluate the potential impact of varying global warming levels and internal variability on Sandy. All nine runs (three storylines, three members each) have alternative realisations of Hurricane Sandy that are close to the observed event. The storm tracks begin over the Caribbean Sea, move along the US east coast, and turn towards the US west coast (Fig. 2a). All tracks have landfalls slightly north of the observed landfall, but their mutual differences are minor, and no coherent response of track position to the imposed warming levels is detected, which is to be expected when using spectrally nudged data as the tracks are conditioned by the large-scale weather systems of NCEP (von Storch et al., 2000). Meteorological features match the observed event well in the region of interest, with some minor underrepresentation of the maximum wind speed (Fig. 2b and c). The simulations miss the peak intensity of the storm over the Caribbean (between 24 and 26 October). This discrepancy is also present in other datasets, such as the spectrally nudged global historical dataset (ECHAM_SN) (Schubert-Frisius et al., 2017) and two modern reanalysis datasets (Fig. A4): ERA5 (Hersbach et al., 2020) and MERRA-2 (Gelaro et al., 2017).
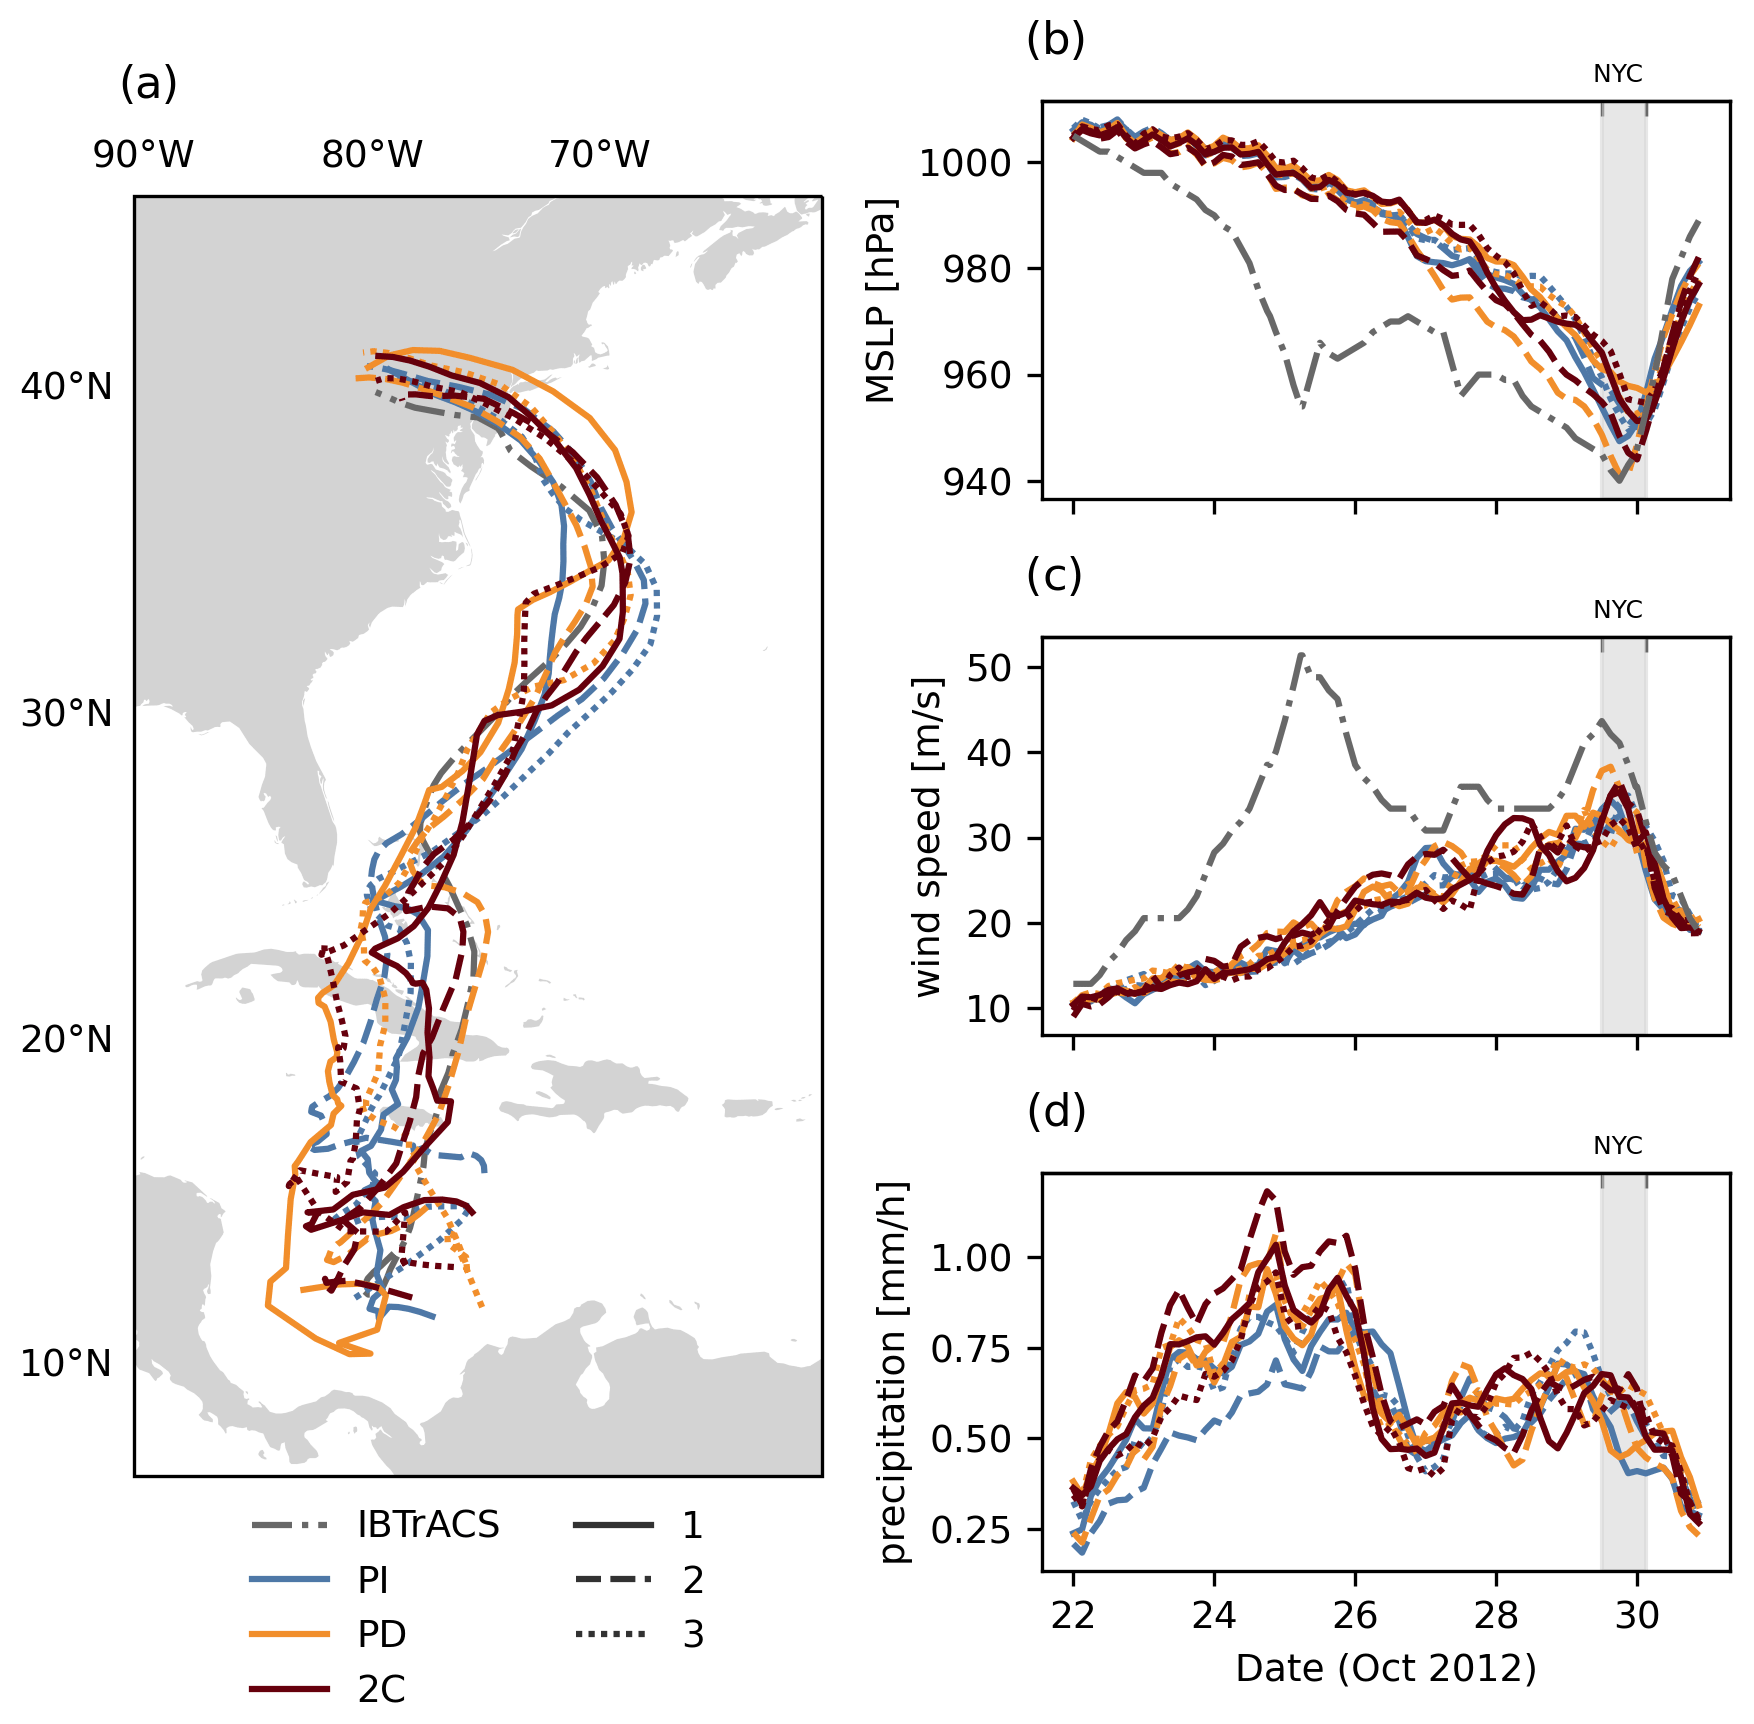
Figure 2Storm tracks of observed Sandy (IBTrACS, solid black line) and of alternative realisations of Sandy (a). Time series of the alternative realisations for minimum mean sea level pressure (MSLP) (b), maximum wind speed (c), and mean precipitation around the storm eye (d). PI, PD, and 2C climate scenarios are represented by blue, orange, and red, respectively, while the three members are represented by solid, dashed, and dotted lines. The grey dashed–dotted line represents the observed values for storm track, MSLP, and wind speed based on IBTrACS.
When averaged across each climate scenario, MSLP and maximum wind speed show no significant changes (Fig. 2b and c). Peak precipitation rates during 24–26 October show significant gains due to climate change (Fig. 2d where the PI members (blue) lie below the 2C members (brown) for days 24–26), with an ensemble mean 14 % increase from PI to PD and a 5 % increase from PD to 2C. During landfall over the study area, the ensemble mean increase from PI to PD is 4 % and the ensemble mean increase from PD to 2C is 9 %. However, the absolute changes are substantially smaller than during the peak period and there is overlapping between the different climate scenarios (shaded area in Fig. 2d). Increases in precipitation generally occur for the most extreme precipitation rates (Gutmann et al., 2018), but by this point, the storm is transitioning into an extratropical (ET) storm, resulting in overall lower precipitation intensity. Thus, we detect some potential climate change signals over the study area, but these signals may also be the result of internal variability. Notably, the considerable differences in the simulations, both across climate scenarios and within them, make them important for further investigation. We therefore focus our subsequent analyses on exploring this variability and its impacts on the study area, without attributing changes to climate change.
3.2 Flood hazards
The variability among the alternative realisations of Sandy results in a wide range of flooding events (see Fig. 3a). Some realisations exhibit up to 3.5 times more flooding volume in the study area than others. We illustrate the compound nature of the flood events produced by the storms, as both precipitation and surge contribute to the flooding volume in all cases. The varying characteristics of rainfall patterns and storm surge levels lead to a diversity in flood scenarios, some of which are primarily driven by precipitation, while others are dominated by storm surge. The compound effects of the storm indicate that for the flood volume, storm surge and inland precipitation have minimal interaction closely resembling the simple combination of each component modelled separately. In some coastal areas and wetlands the compound effects lead to a relatively small reduction in flood volume compared with the direct aggregation of precipitation- and surge-only events.
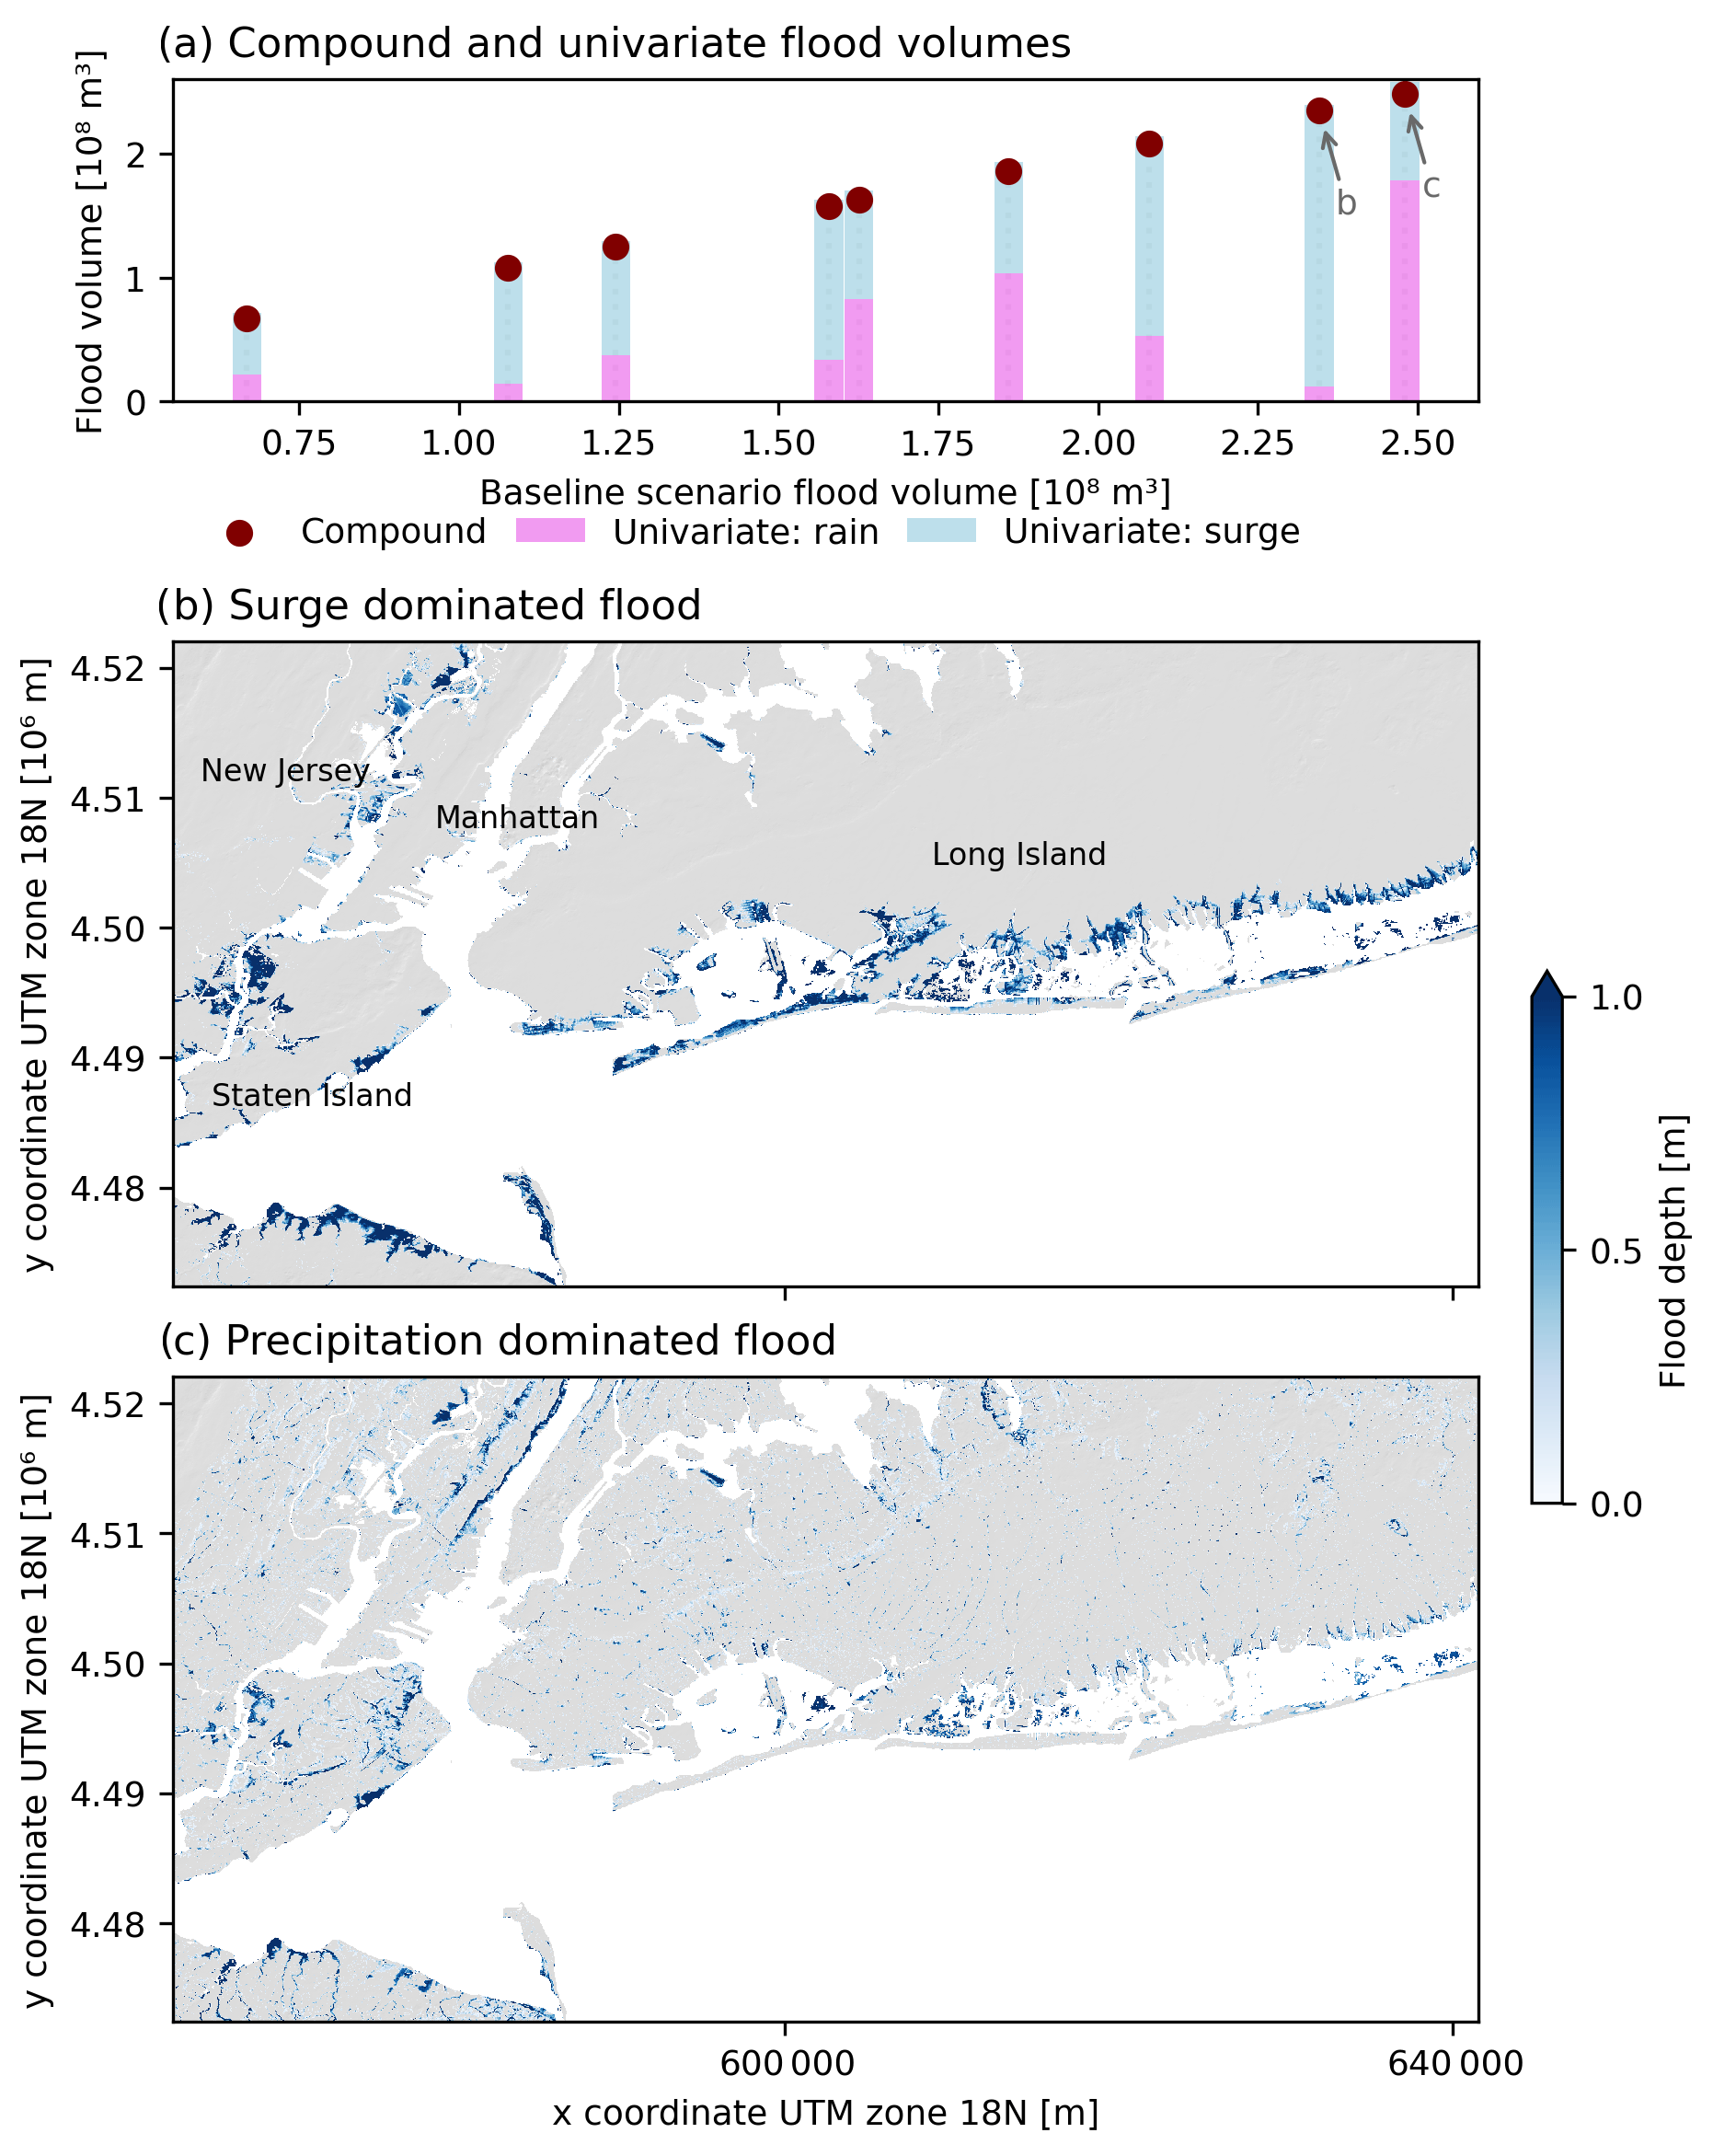
Figure 3Panel (a) shows compound flood volumes over the study area for each event (dark red dots), compared with the corresponding univariate surge or rain induced flood volumes represented by bars. Light blue and pink bars indicate surge- and precipitation-driven floods, respectively. Flood hazard maps for the largest surge dominated (b) and precipitation dominated (c) flooding volume storylines.
The spatial distribution of flood hazards exhibits distinct characteristics for surge dominated and precipitation dominated events. Surge dominated flood events primarily affect coastal areas and result in high flood levels (Fig. 3b). Conversely, precipitation dominated flood events have a broader spatial extent, reaching into inland areas, but typically exhibit lower flood depths (Fig. 3c).
3.3 Evaluation of sea level rise scenarios
Next we investigate the flood hazards of the alternative realisations of Sandy for the different SLR scenarios. All simulations present an increase in flood volume as sea levels rise (Fig. 4a). SLR71 results in an average increase in flood volume by approximately threefold, ranging from 2.2 to 3.7 times higher than the corresponding baseline simulations. SLR101 increases flood volume by 4.2 times, ranging from 3 to 5.6 times higher than the baseline simulations. For each SLR scenario, higher increases occur for higher initial flood volume caused by surges. (See bars, dashed lines, and slope coefficients in Fig. 4a.) Most of the flood volume increase occurs on the coast (Fig. 4b).
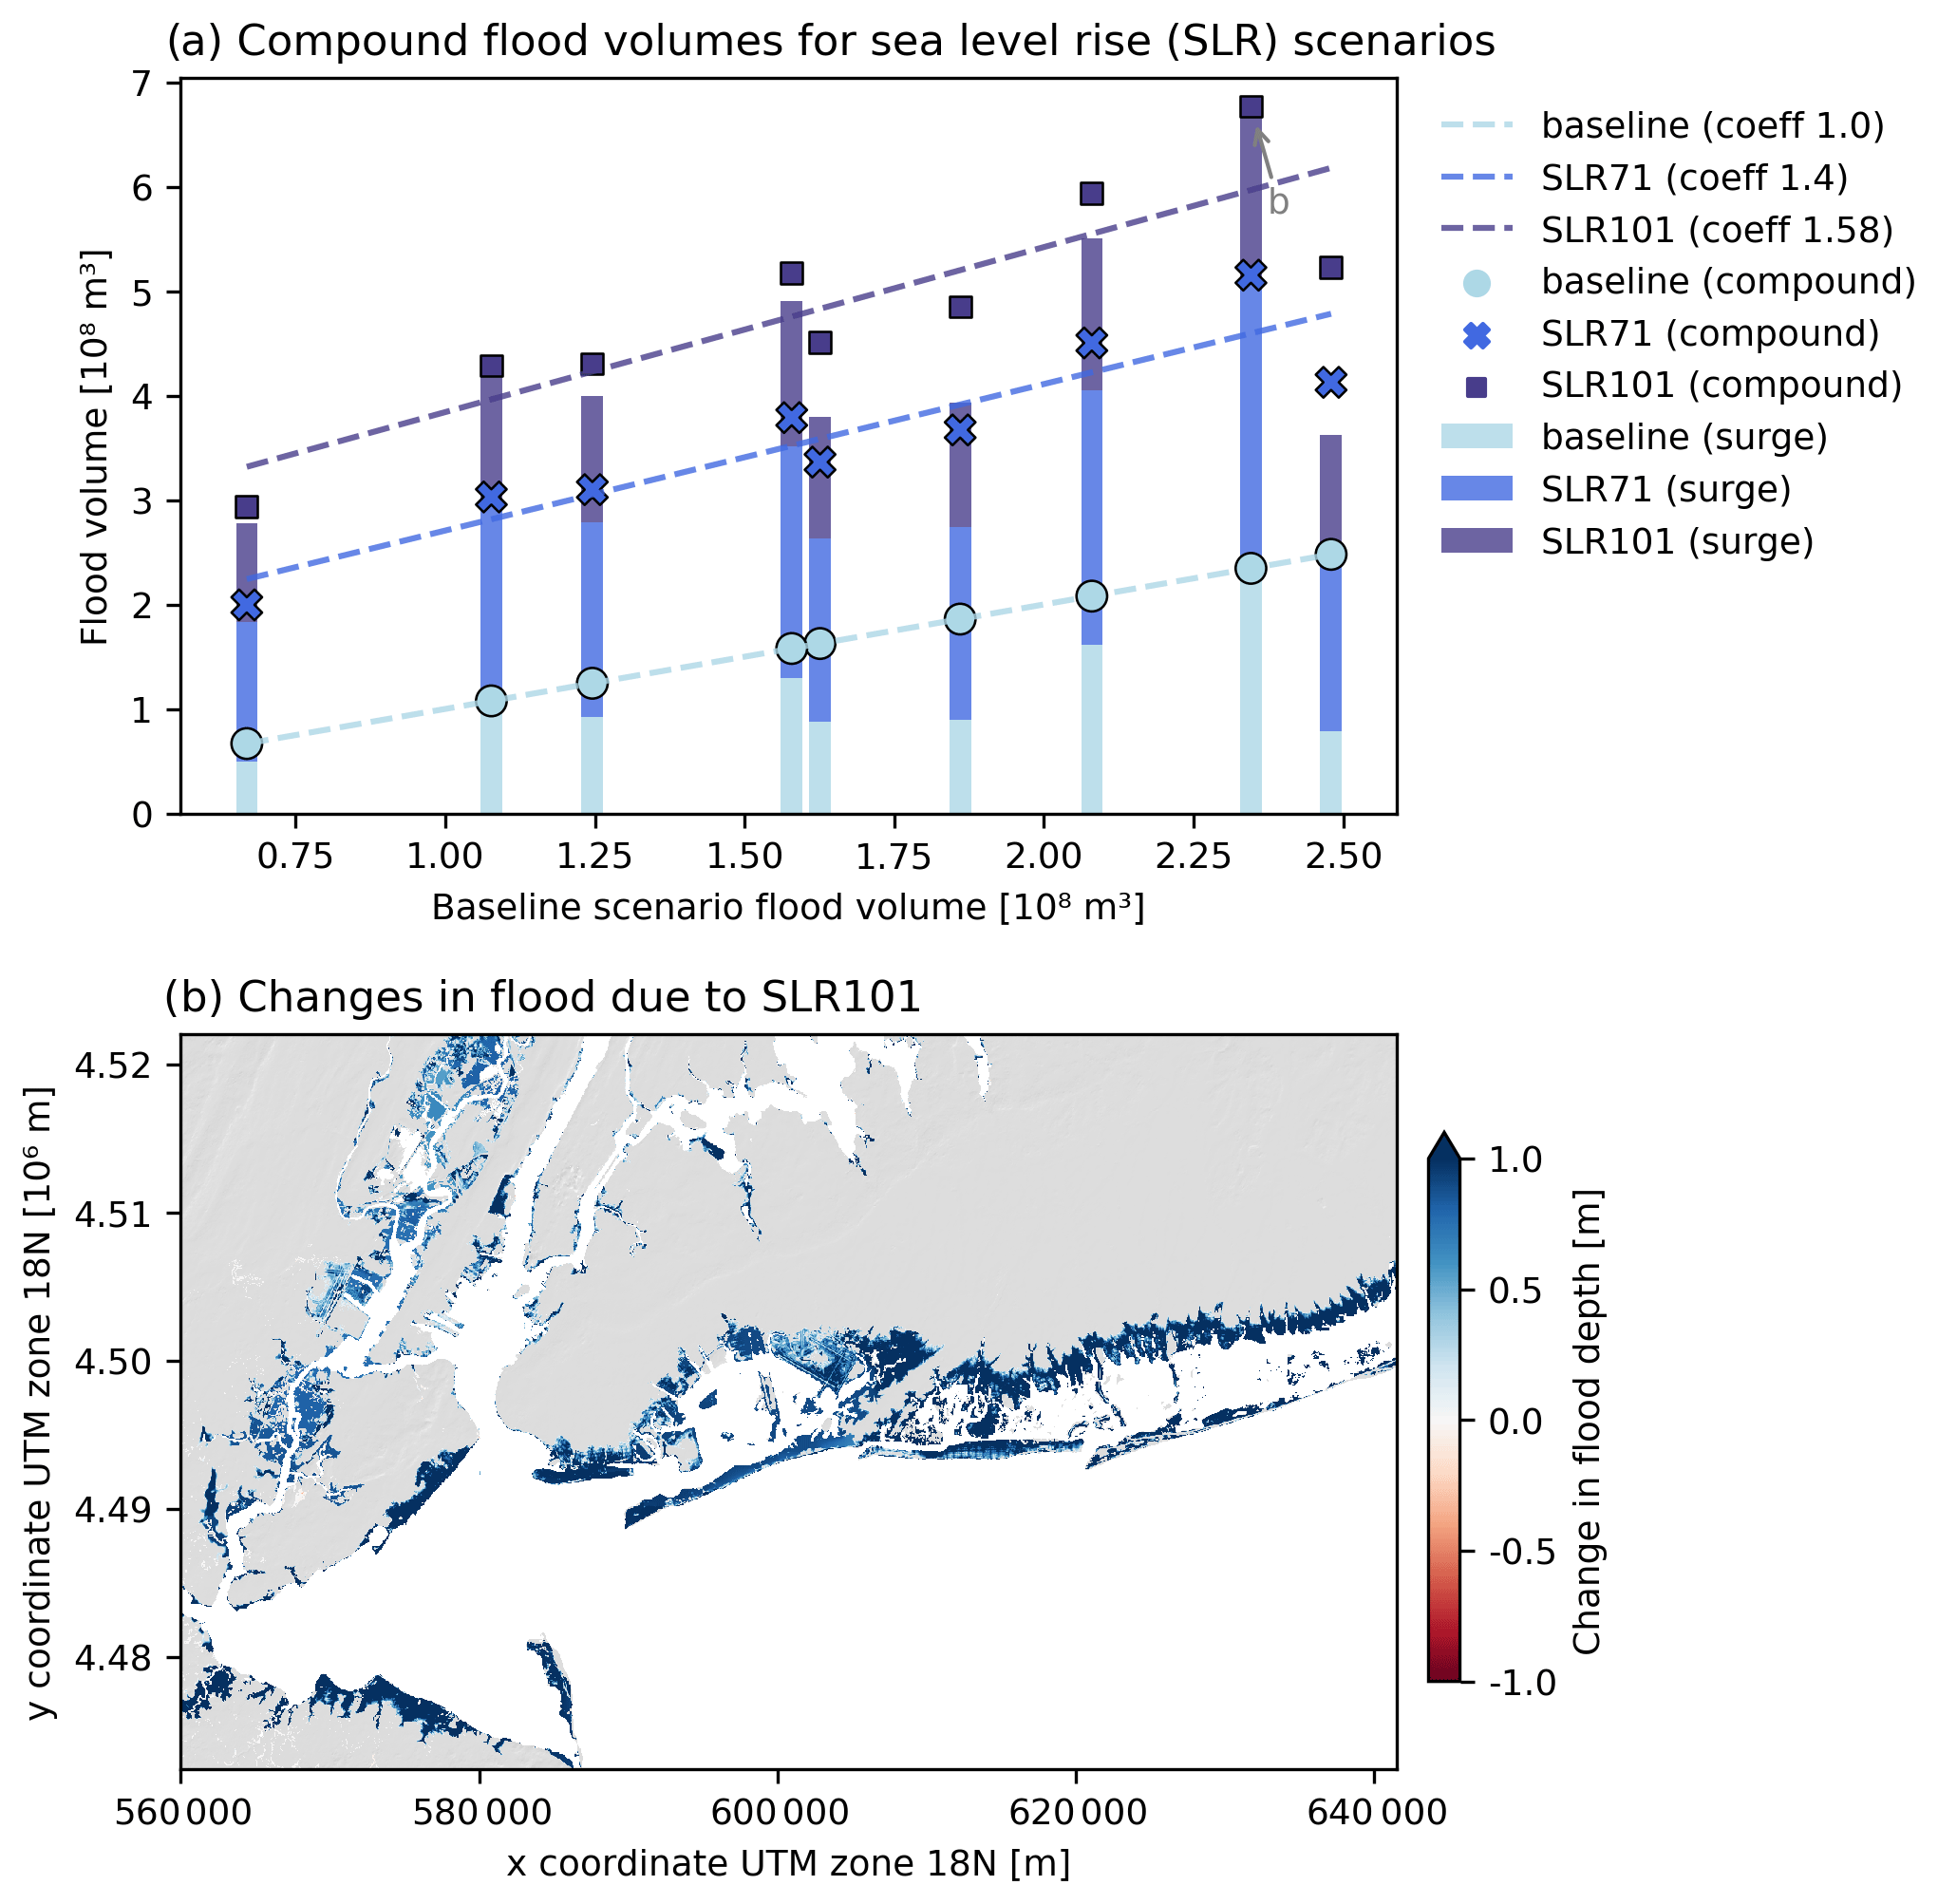
Figure 4Panel (a) shows compound flood volumes over the study area in each event for the baseline (light green circles), 71 cm sea level rise (SLR71) (blue crosses), and 101 cm sea level rise (SLR101) (dark blue squares) scenarios. The corresponding bars show the increase in flood volume for each scenario due to storm surge only. (The difference between bar and symbol is the flood volume by precipitation.) Dashed lines show the trends and regression coefficients for each SLR scenario. Panel (b) comprises flood hazard maps showing the difference in flood between SLR101 and baseline scenarios for the same event.
3.4 Evaluation of maximised precipitation scenarios
The effects of manipulating the tracks of the alternative realisations of Sandy to maximise the precipitation over the study area results in significant flood volume increases. The manipulated storm tracks are depicted in Fig. A5. Figure 5a shows that the average flood volume increases by a factor of 2.5, ranging from 1.6 to 3.7 times the volume in the corresponding events with original tracks (baseline). Additionally, there is significantly less variation in flood volume in the manipulated storms, with all realisations but one being in the range m3, while the baseline shows a range between 0.6 and 2.5×10⁸ m3. Therefore, although most realisations produce similar precipitation volumes, the landfall position determines the flood volumes in the study area. The increased flood volumes due to the MP scenario occur extensively across the study area, but coastal areas show a moderate decrease in inundation levels (Fig. 5b). This is due to the MP scenario setup, where inland precipitation over the study area is prioritised. In most realisations of Sandy, the heaviest precipitation occurs on the left-hand side of the storm, which is also characterised by winds blowing away from the coast, resulting in lower surge levels when moved over the study area.
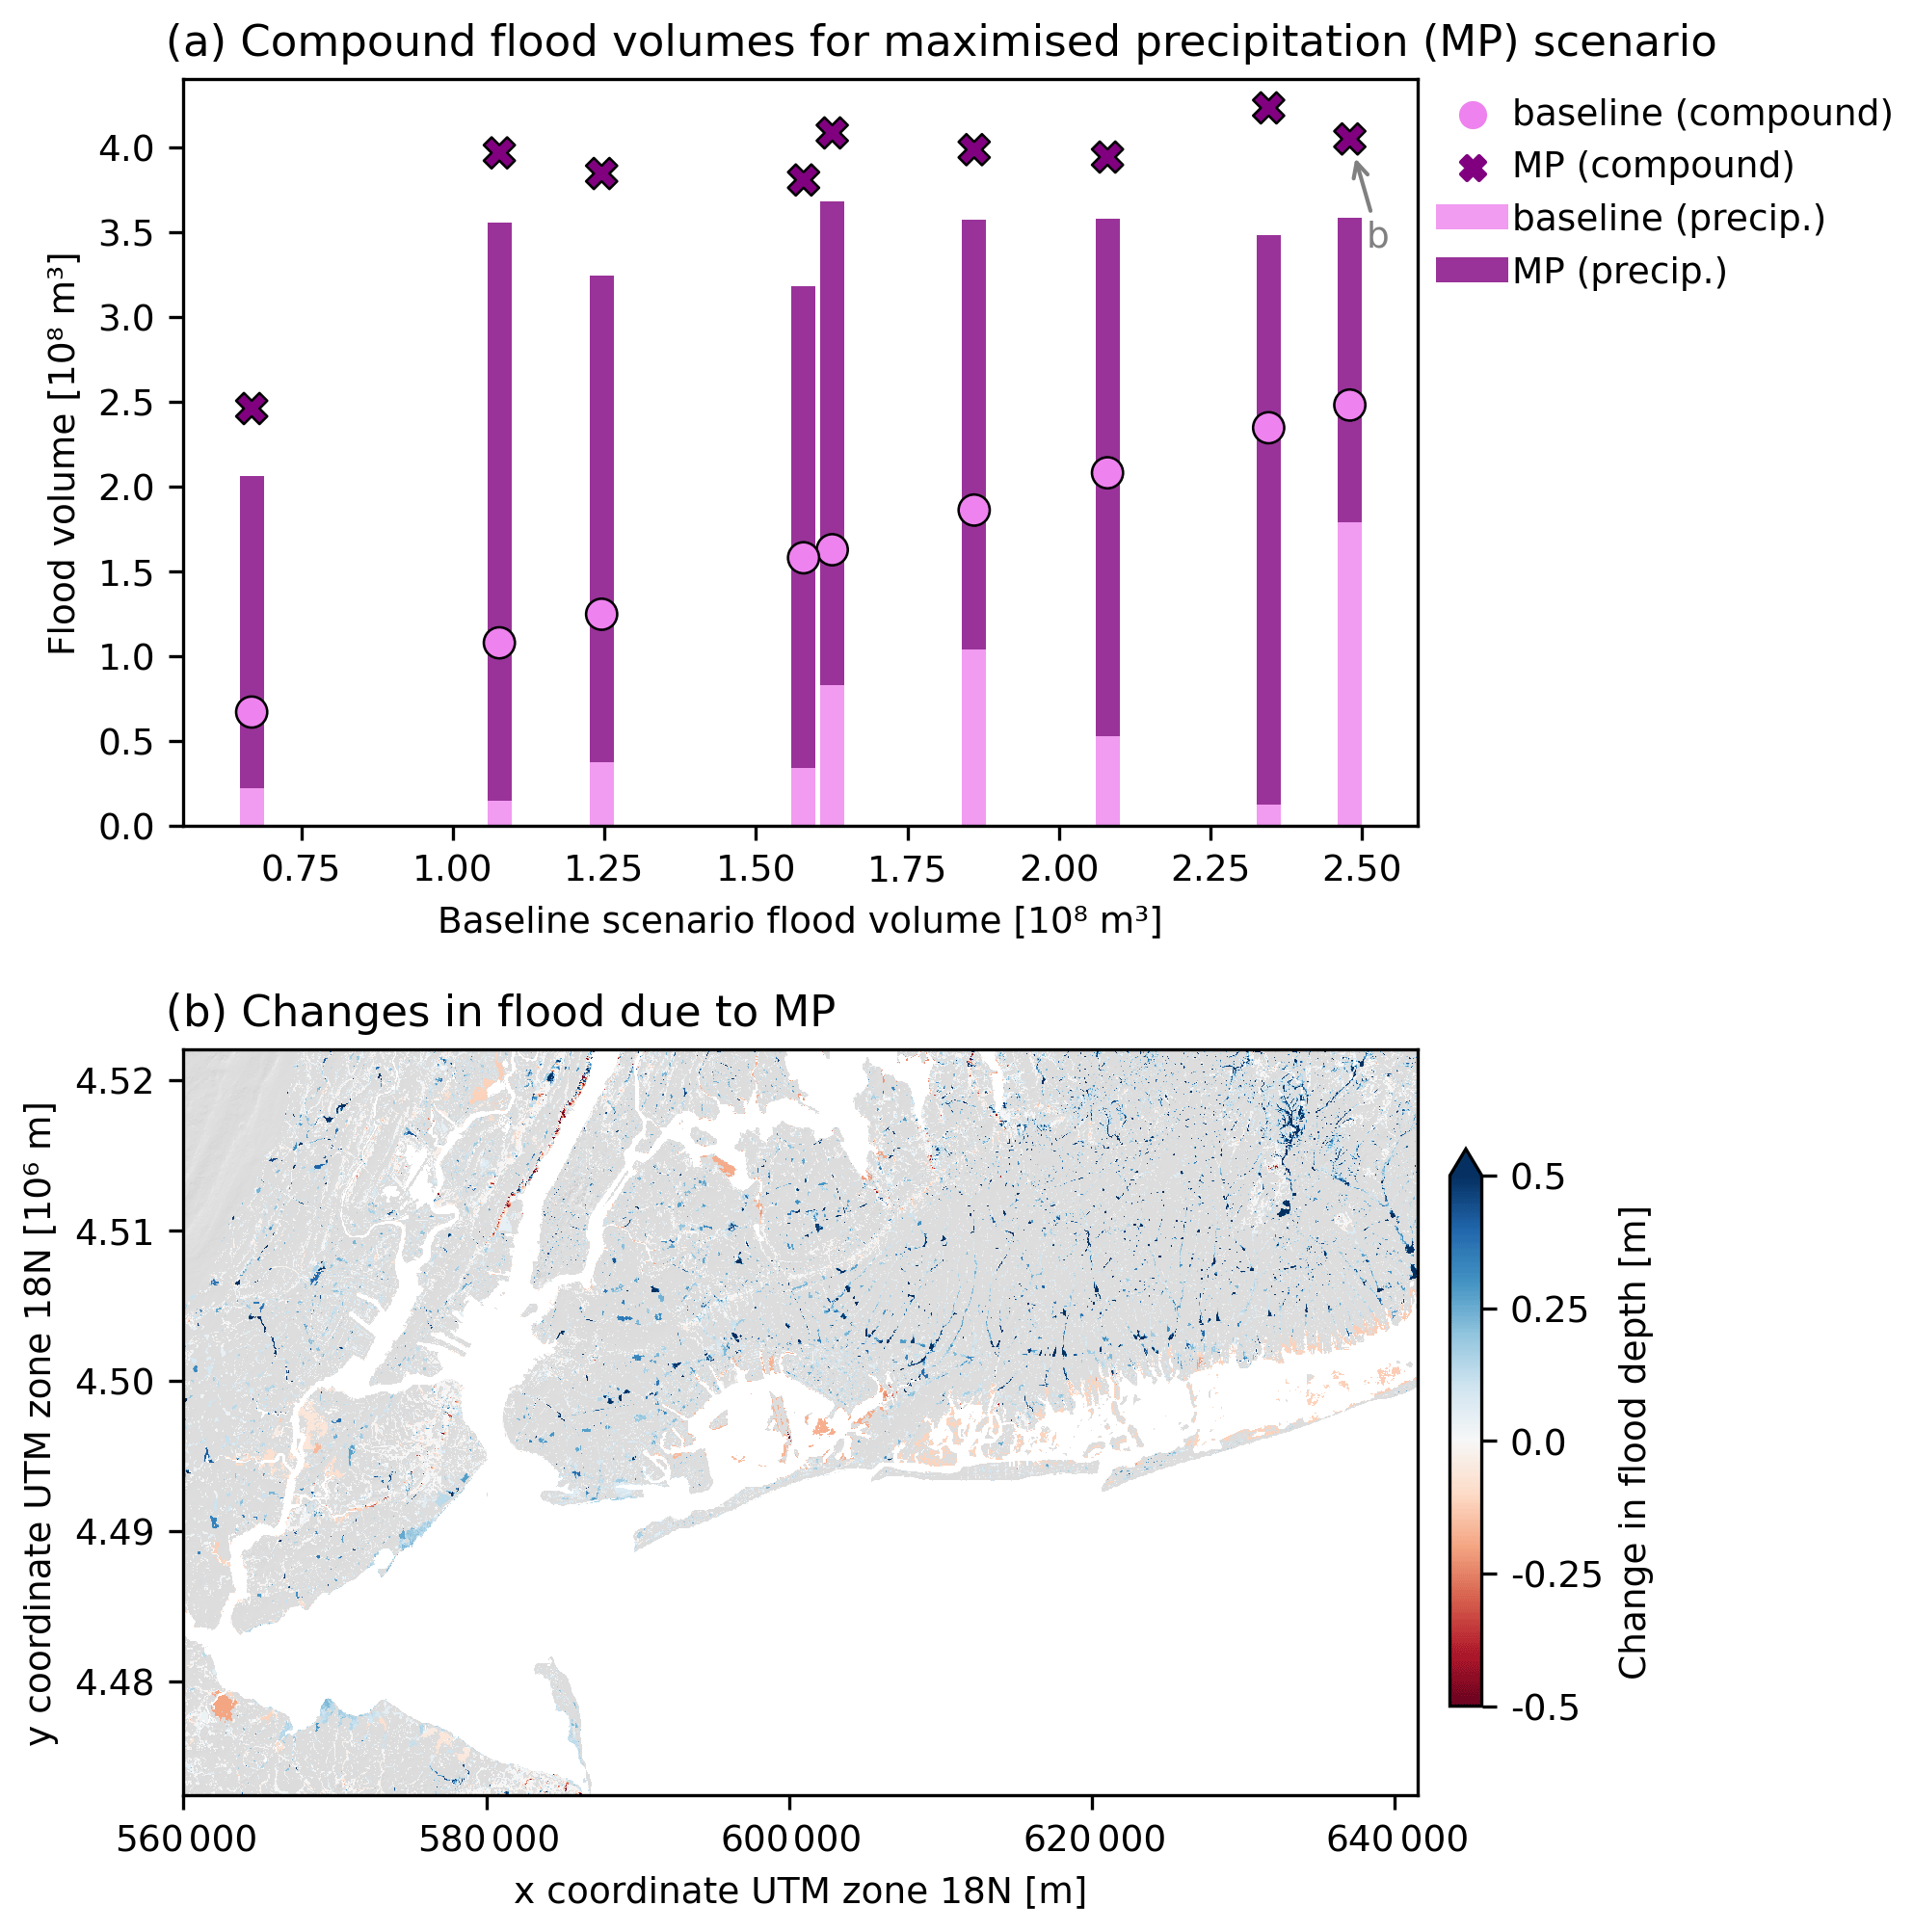
Figure 5Panel (a) is similar to Fig. 4a but for the maximised precipitation (MP) scenario. Compound flood volumes for baseline (violet circles) and MP (purple crosses). The corresponding bars indicate flood volume due to precipitation only. (The difference between bar and symbol is the flood volume by storm surge.) Panel (b) is similar to Fig. 4b, but the difference in flood is between MP and baseline scenarios for the same event.
3.5 Critical infrastructure exposure
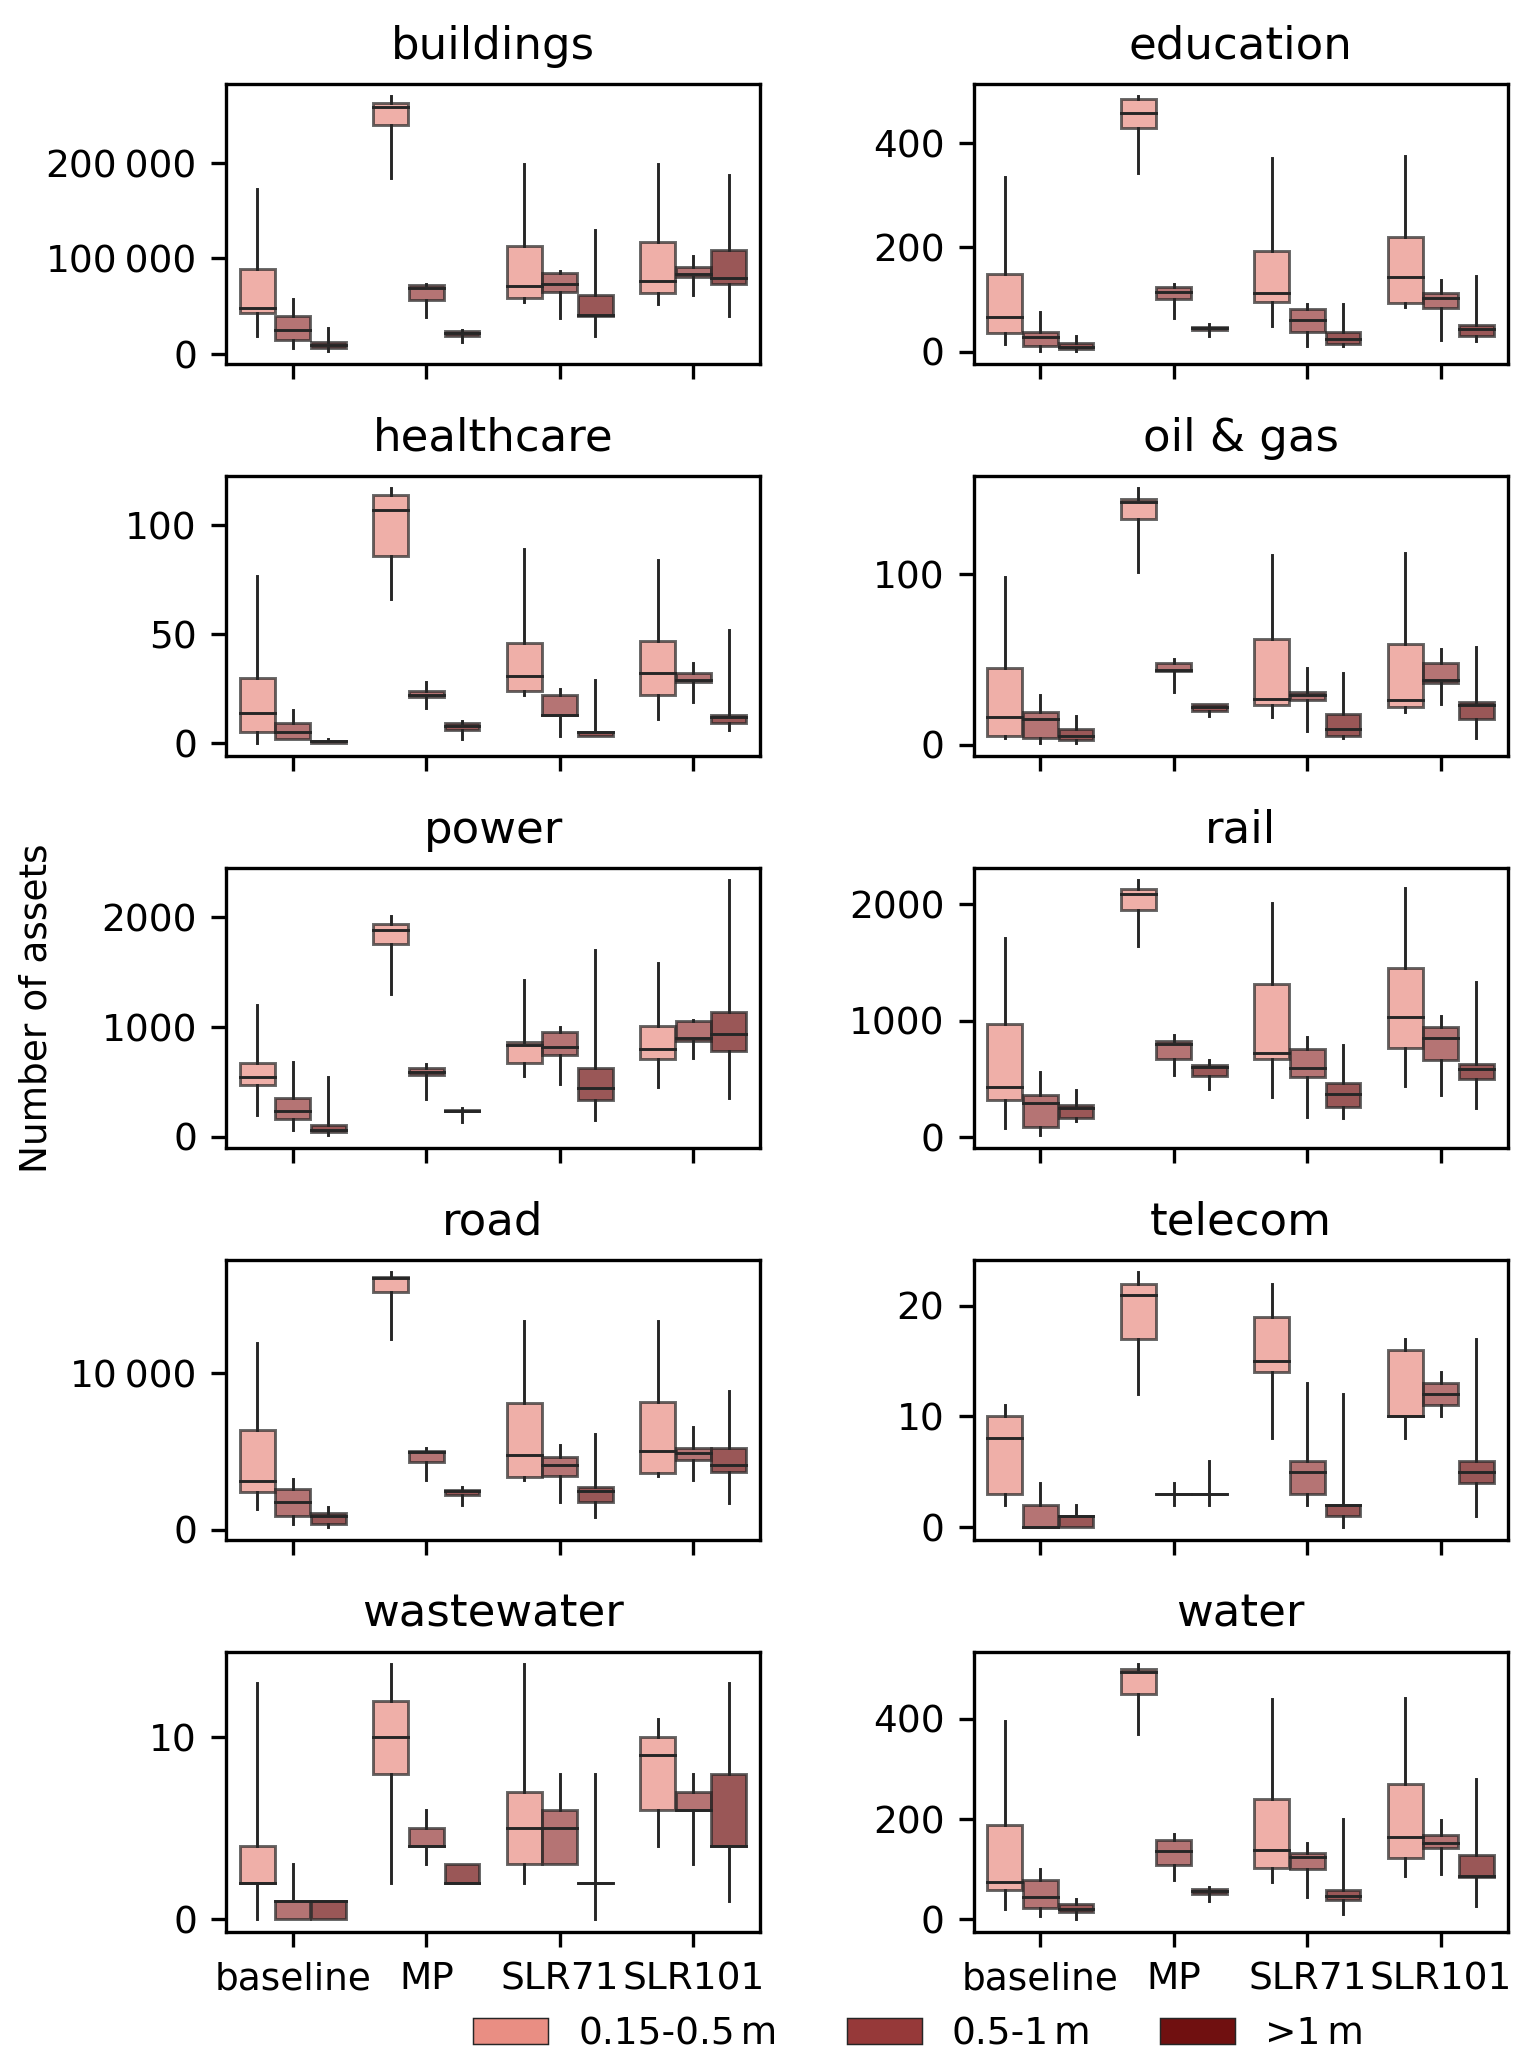
In this section, we assess the exposure of CI and buildings to flood hazards caused by the alternative realisations of Sandy. The MP scenario results in the highest number of flooded assets, typically 2.9 times the baseline (Fig. 6a). Following this is the SLR101, which shows a 2.2-fold increase, and the SLR71, with a 1.8-fold increase. This is due to the extensive reach of precipitation. As a result, most of the increase in the MP occurs in the low water level category (5.4 times), while SLR71 and SLR101, surge dominated scenarios, increase 1.5 and 1.6 times, respectively. For medium water levels, SLR71 (2.9 times) and SLR101 (3.3) show higher increases than MP (2.8). For high water levels, SLR101 shows the highest increase, 8.7 times the baseline. SLR71 follows with a 4.5-fold increase, and the MP, with a 2.6-fold increase. Among the CI systems, buildings and roads show the highest number of exposed assets (Fig. A6). SLR101 leads to the largest increase in number of flooded assets across the CI systems compared with the baseline (Fig. 6b). Power infrastructure has the highest increase in exposure, though education, telecom, and wastewater systems also see considerable increases. The impacts of SLR scenarios are predominantly driven by storm surges, impacting mostly coastal assets with high water levels (Fig. 6c). In contrast, the MP scenario, where flooding is primarily driven by precipitation, has a spatially extensive impact on assets but at low water levels (Fig. 6d).
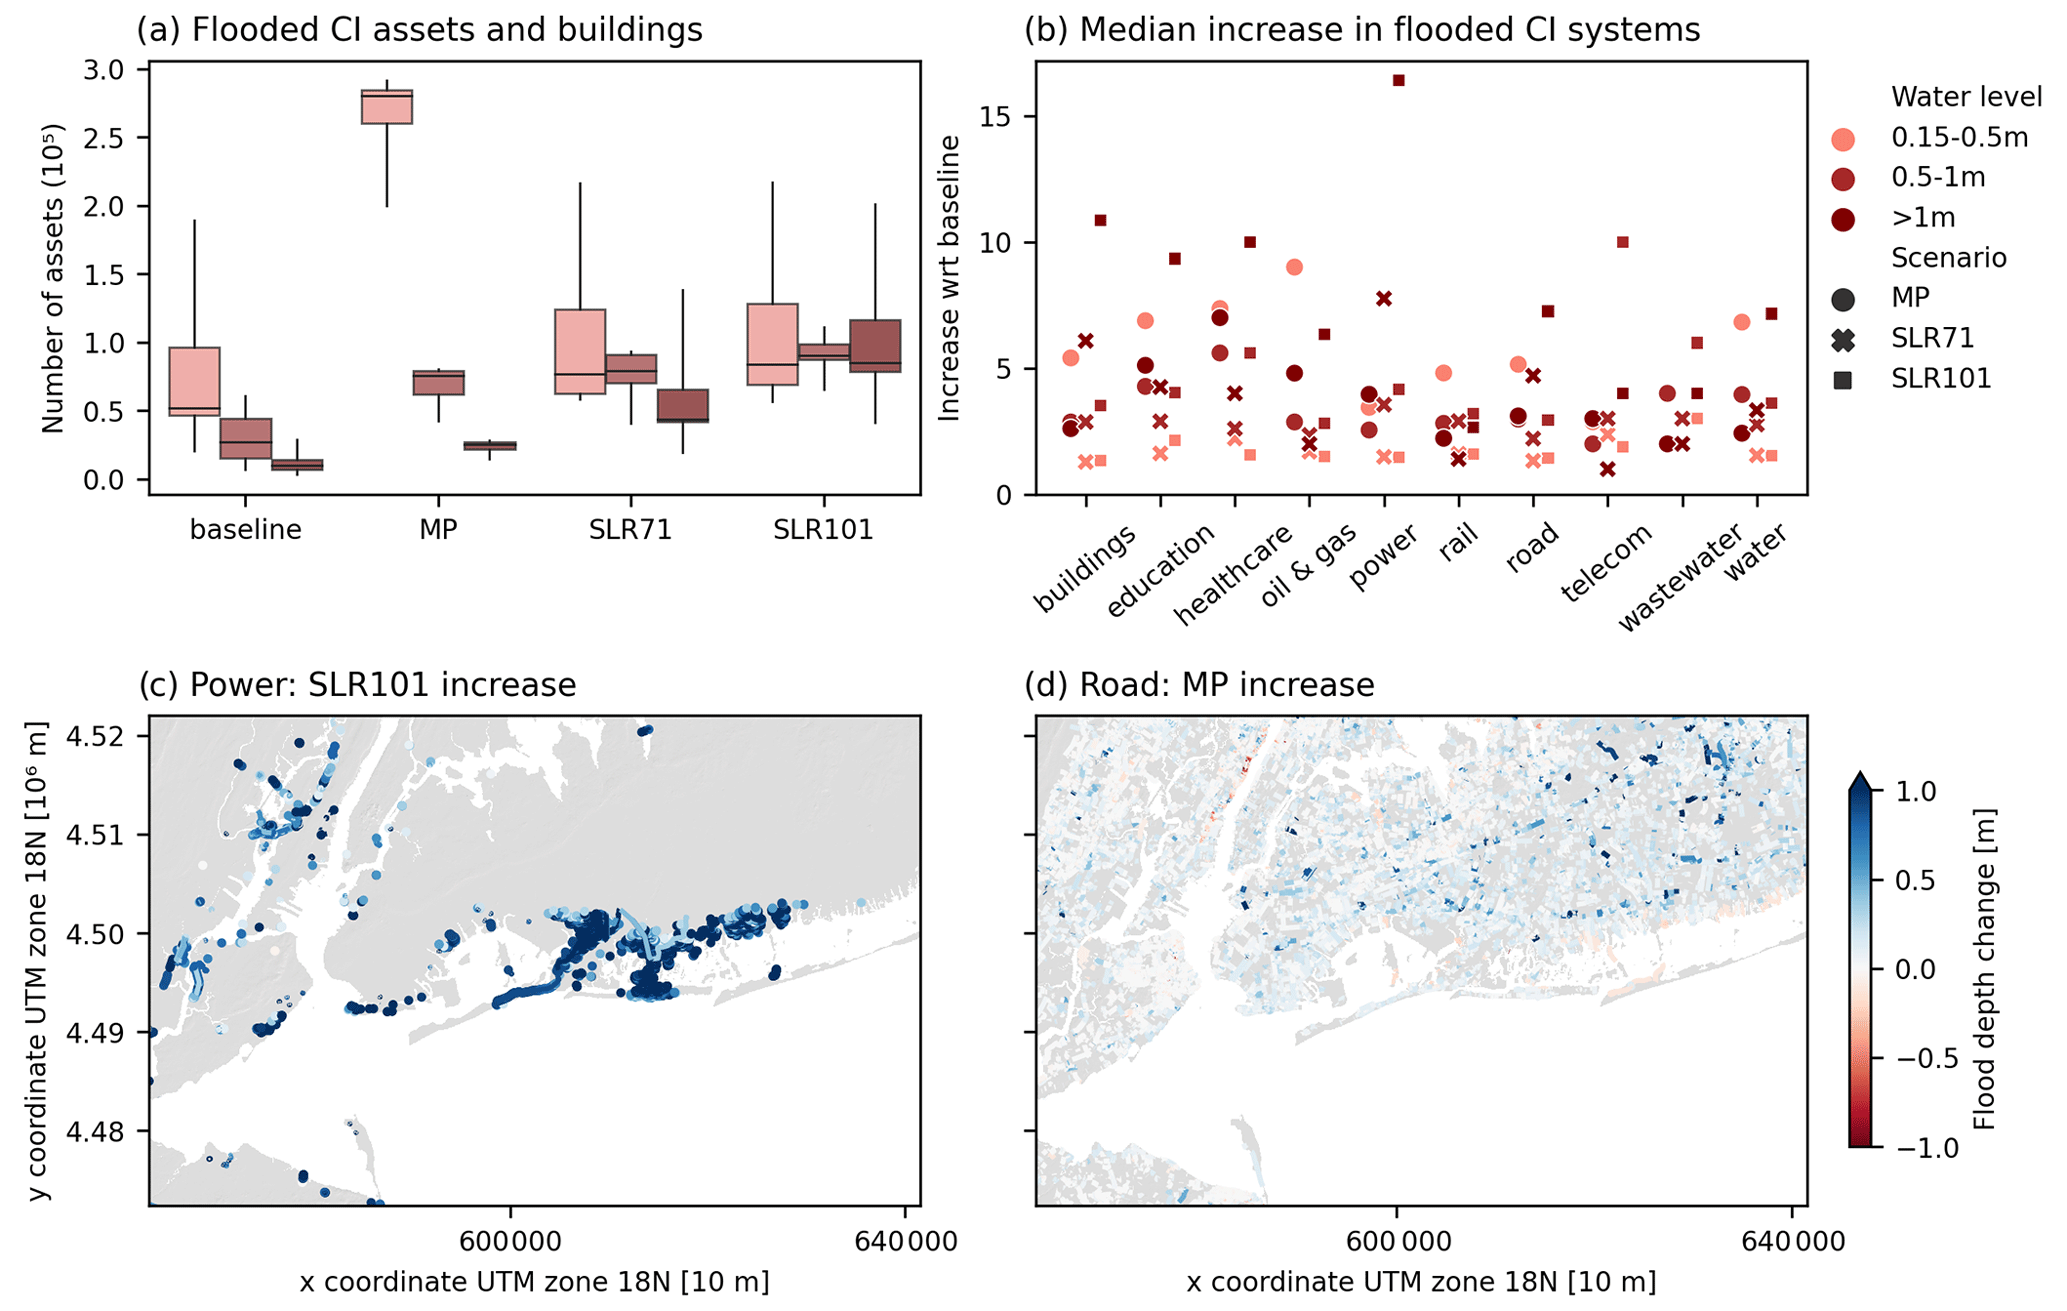
Figure 6Panel (a) shows the total number of flooded critical infrastructure (CI) assets under different water level categories for the baseline, maximised precipitation (MP), 71 cm sea level rise (SLR71), and 101 cm sea level rise (SLR101) scenarios. Low (0.05–0.5 m), medium (0.5–1 m), and high (> 1 m) water levels are represented by light pink, light red and dark red, respectively. Panel (b) shows the increase in the number of flooded CI assets with respect to the baseline. MP, SLR71, and SLR101 scenarios are represented by circles, crosses, and squares. The difference in exposed assets under various scenarios: (c) power assets between the SLR101 and baseline scenarios and (d) road assets between the MP and baseline scenarios.
In this paper, we use storylines to develop alternative yet plausible realisations of Hurricane Sandy as it made landfall in NYC, accounting for effects of climate change and internal variability. Our objective is to increase our understanding of Sandy and its impacts beyond the single historical occurrence and to obtain climate information that is relevant for risk assessment (Sutton, 2019). We develop a modelling framework spanning meteorological conditions, compound flooding, and CI flood exposure, allowing for a comprehensive analysis of the event onset and consequences.
Compound floods on the study area over the range of alternative realisations result from a combination of storm surges and precipitation. However, the contribution of each hazard differs substantially among the realisations and scenarios explored, demonstrating the importance of compound thinking in coastal flooding (van den Hurk et al., 2023b). Surge dominated floods concentrate in coastal regions with high water depths, while precipitation dominated floods cover widespread land areas with shallow water depths. We calculate the exposure of critical infrastructure assets to floods, as a proxy of potential societal impacts of alternative realisations of Sandy. Exposed CI assets vary according to the prevailing flood hazards of each event: precipitation dominated events result in a considerable increase in the number of exposed assets, mostly at low water levels. Conversely, surge dominated events concentrate exposure on coastal assets, particularly at high water levels. The variability in exposed CI assets illustrates the range of impacts that NYC could have experienced across different (plausible) event unfoldings.
We show that SLR substantially increases flood volumes for all alternative realisations of Sandy, with approximately 1 m of sea level rise leading to a 4.2-fold increase in flood volume. This is consistent with literature expressing high confidence in the role of sea level rise as a prominent climate change factor explaining tropical cyclone impacts (Lin et al., 2016; Knutson et al., 2020). We manipulate the tracks of the alternative realisations of Sandy to maximise precipitation during landfall over the study area. This way, we explore the internal variability of the landfall location to search for worst-case scenarios that are relevant for society (Sutton, 2019; Schwarzwald and Lenssen, 2022; Lehner and Deser, 2023). This approach leads to an average 2.5-fold increase in flood volume. In contrast to changes attributed to climate change, which occur over longer timescales, internal variability applies to present-day climate conditions. This requires a different risk impact perspective and demonstrates the importance of internal variability in quantifying risks of high impact events.
Sandy becomes wetter during its peak in the Caribbean in warmer scenarios, yet the precipitation increase over the NYC metropolitan area due to climate change is comparatively smaller and could result from internal variability. Previous studies have found a global increase in precipitation for TCs with climate change (Hill and Lackmann, 2011; Patricola and Wehner, 2018; Knutson et al., 2020), for extratropical cyclones (Liu et al., 2018), and specifically for Sandy (Yates et al., 2014; Gutmann et al., 2018). The largest increases in precipitation occur generally during extreme precipitation rates (Gutmann et al., 2018), which are not prevalent at Sandy's landfall over NYC. Yates et al. (2014) found higher precipitation during landfall under 4 ∘C warming but modest increases under 2 ∘C warming. We do not find significant changes for wind speed, MSLP, and track position, which could be due to the spectral nudging method where the divergence, vorticity, and large-scale weather systems are set to match the reanalysis (von Storch et al., 2000; Weisse and Feser, 2003). Yates et al. (2014) also found no significant changes in wind speed and MSLP, while other studies suggest that the core pressure of Sandy could decrease in warmer scenarios (Lackmann, 2015; Gutmann et al., 2018). Conversely, we observe significant differences between the alternative realisations of Sandy during landfall over the study area. Given our study aim of exploring societal impacts in alternative realisations of Sandy, we decided to focus on the internal variability of the simulations during landfall rather than on the direct effects of climate change on the entire storm lifetime.
We rely on the use of one single model for each step in our framework. More robust results can be achieved with a wider selection of models to account for model uncertainty. The spectrally nudged storylines have three ensemble members, and while they are suitable for the purposes of our study, more ensemble members improve results robustness. The simulated storms underrepresent the maximum wind speed and minimum MSLP during the TC peak over the Caribbean and to a lesser extent during landfall. Similar discrepancies are seen for the other reanalyses tested, indicating the data are within the same range of performance of other reanalyses and models. Peak TC activity is often underrepresented in reanalyses due to limited model resolution and dependence on parameterised processes (Hodges et al., 2017). ECHAM6.1 has an approximate resolution of 0.5∘, and studies have shown that higher horizontal resolutions lead to better modelled TCs (Knutson et al., 2020), higher surge heights (Bloemendaal et al., 2019), and better reproduction of precipitation extremes (Prein et al., 2016). However, spectrally nudged model simulations do resolve TCs better than free running simulations (Feser and Barcikowska, 2012; Schubert-Frisius et al., 2017). Our warmest storyline is based on SST and GHG projections of a 2 ∘C above pre-industrial levels scenario, but due to indirect aerosol influence, the actual temperature increase is 1.55 ∘C, making it a conservative estimation of the climate change signal (van Garderen and Mindlin, 2022). Warmer climate scenarios can provide extra insight into the effects of global warming on storms, as seen in Yates et al. (2014) where the strongest precipitation increases occurred for the +4 ∘C scenario. We assume temporal independence between the climate scenarios and the SLR scenarios because it allows us to explore more (yet plausible) scenarios. However, previous studies have found that assuming independence between SLR and TCs can underestimate flood hazard (Lockwood et al., 2022).
Assessing the risks of high impact events in a changing world requires methods that extend beyond historical observations (Otto et al., 2018; Sutton, 2019; van den Hurk et al., 2023b). Qiu et al. (2022) and Koks et al. (2023) showed that presenting impact changes in coastal flooding through alternative scenarios of historical storms provides clear and accessible information for decision makers. According to our findings, healthcare decision makers may focus on future asset exposure to surge levels of a future Sandy combined with sea level rise, while road infrastructure decision makers may prioritize the immediate exposure of roads to an alternative Sandy with high precipitation over the study area. Adaptation solutions would differ for each case, for example, sea barriers against surges and expanding urban green spaces for high precipitation. The use of societal-relevant scenarios, including climate change and internal variability scenarios, along with an impact-assessment framework, provides relevant and accessible information that can be integrated into decision-making to achieve effective adaptation solutions (Aerts et al., 2014; Jongman, 2018).
High impact events affect society and influence decision-making. In this study, we create alternative realisations of Sandy to understand the impacts of the event on critical infrastructure over the NYC metropolitan region under different scenarios. The scenarios are developed to account for the effects of climate change (on the storm and through sea level rise) and internal variability (random variations in the storm's location, intensity, and shape in present-day climate). Our framework allows us to simulate all the contributing factors of the event and to disentangle its main components, from driving meteorological and climatological conditions to compound flooding and impacts.
We find that sea level rise is the most consistent climate change component to increase Sandy's flood volumes, with an average 4.2-fold increase for 1 m of sea level rise. However, internal variability, represented by both results from a climate model ensemble and the manipulation of the storm's landfall position, also considerably increases flood volumes. For the maximised precipitation scenario, flood volumes exhibit an average increase of 2.5 times compared with the baseline. While all alternative realisations cause compound floods, the contribution of each flood hazard greatly influences the extent and depth of these events, resulting in distinct impacts on critical infrastructure. Precipitation dominated realisations lead to the highest number of exposed assets, but mainly at low water levels. Surge dominated events affect mostly coastal assets, with high water levels.
The considerable differences in hazards and impacts demonstrate the potential of building societal-relevant scenarios that provide plausible realisations of a historical high impact event under diverse circumstances. By understanding the potential changes in the event's impacts and their underlining scenarios, decision makers are better informed to make effective adaptation solutions, particularly in a changing climate.
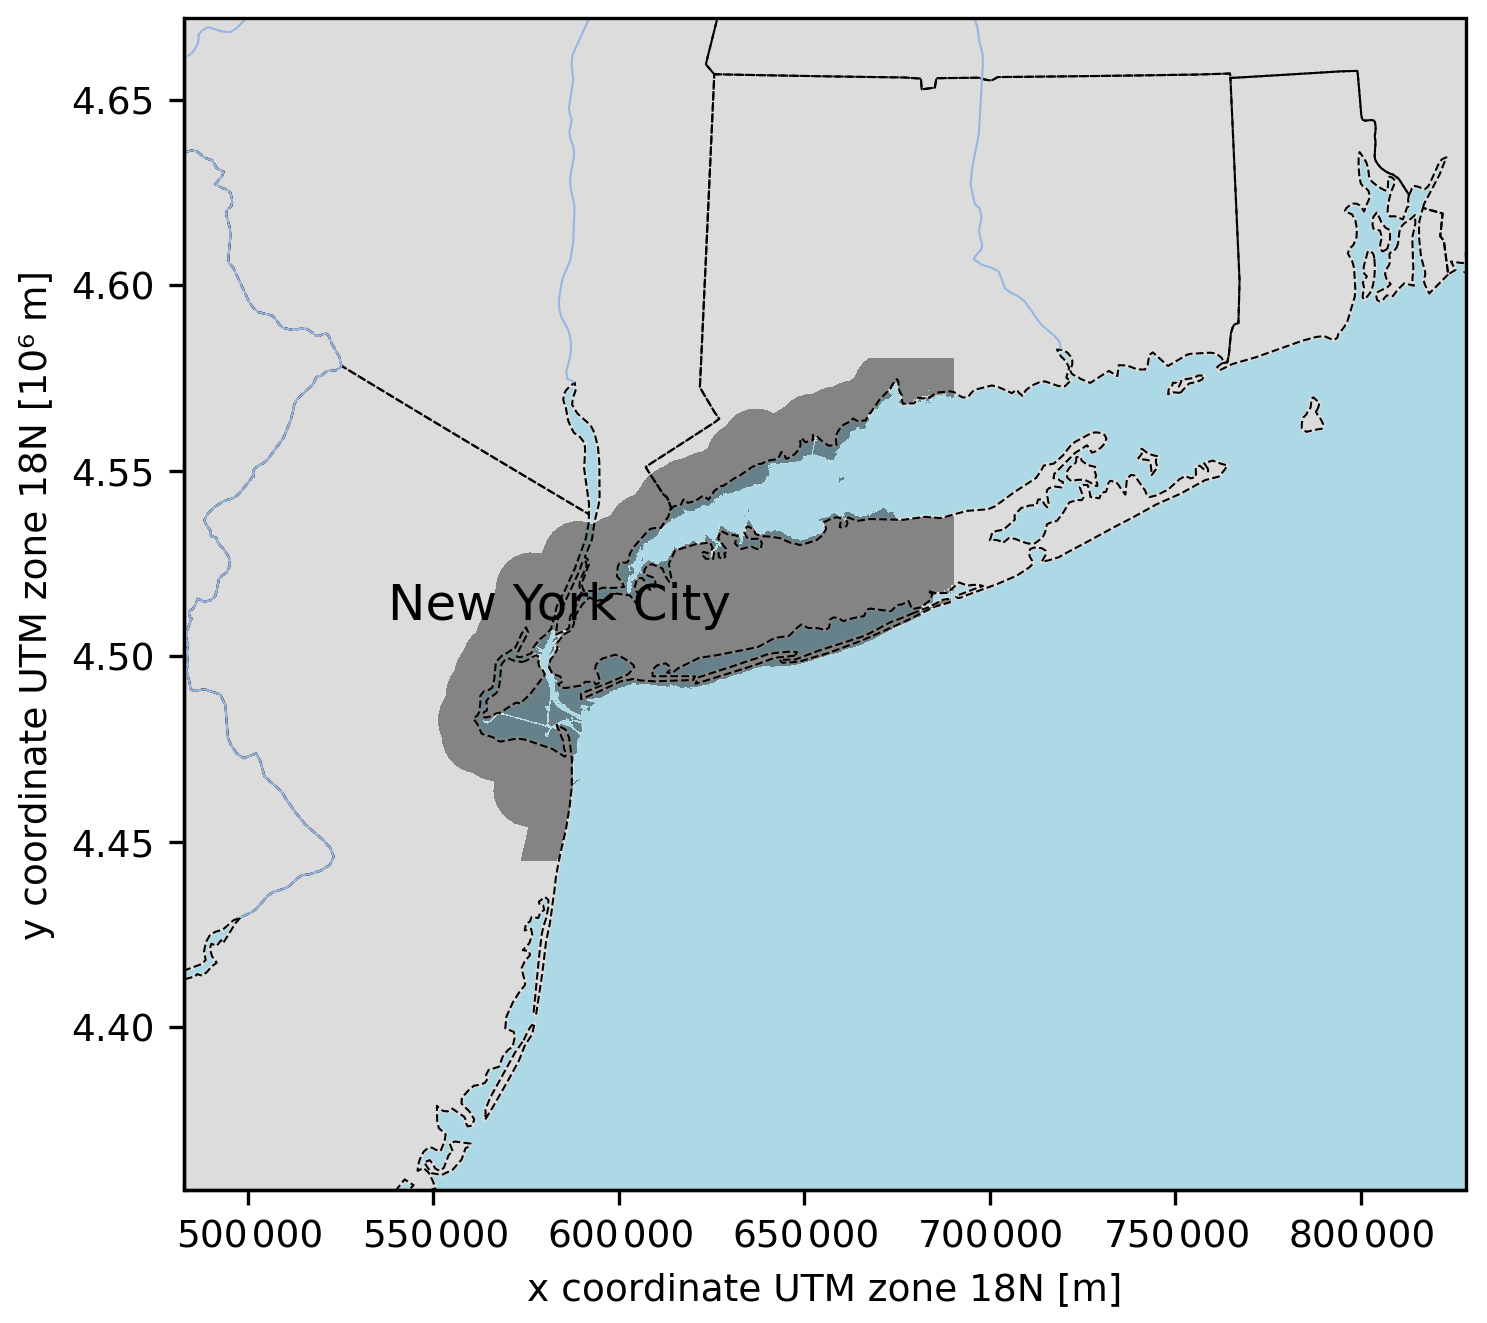
Figure A1Map of the northeast coast of the USA and our study area (shaded dark-grey area).
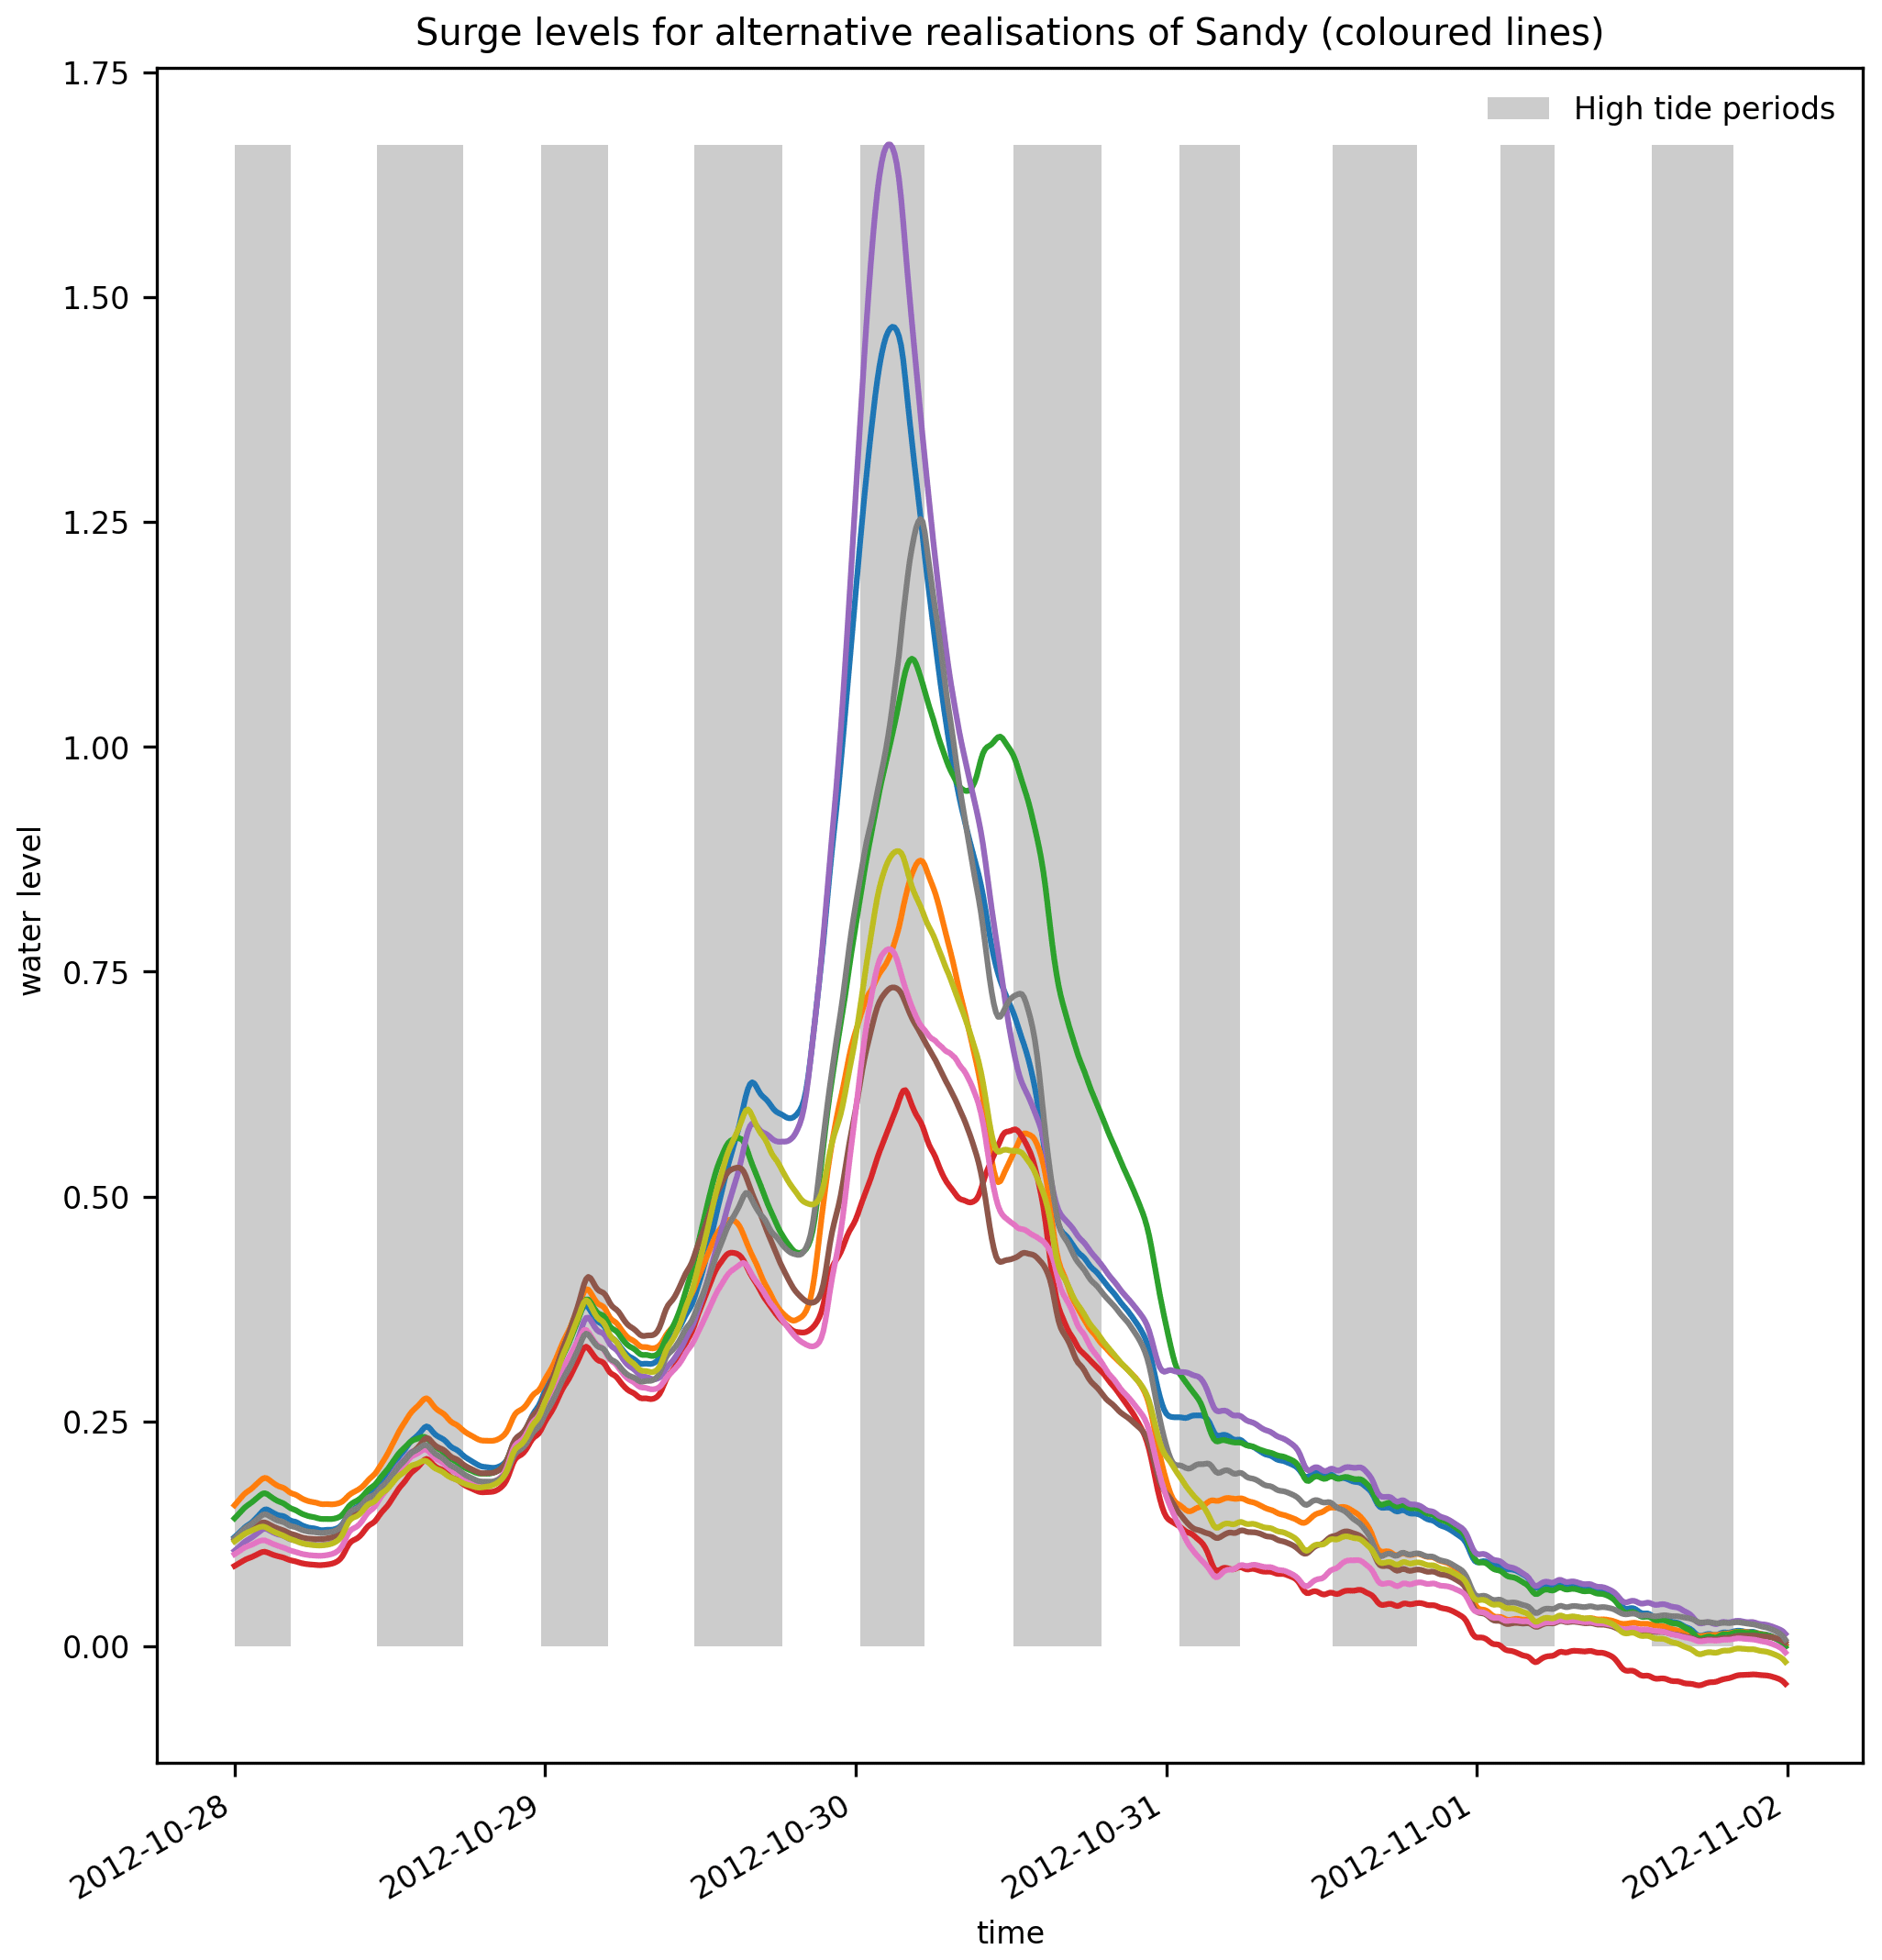
Figure A2Surge levels for alternative realisations of Sandy (coloured lines). The high tide periods are highlighted with grey background colour.
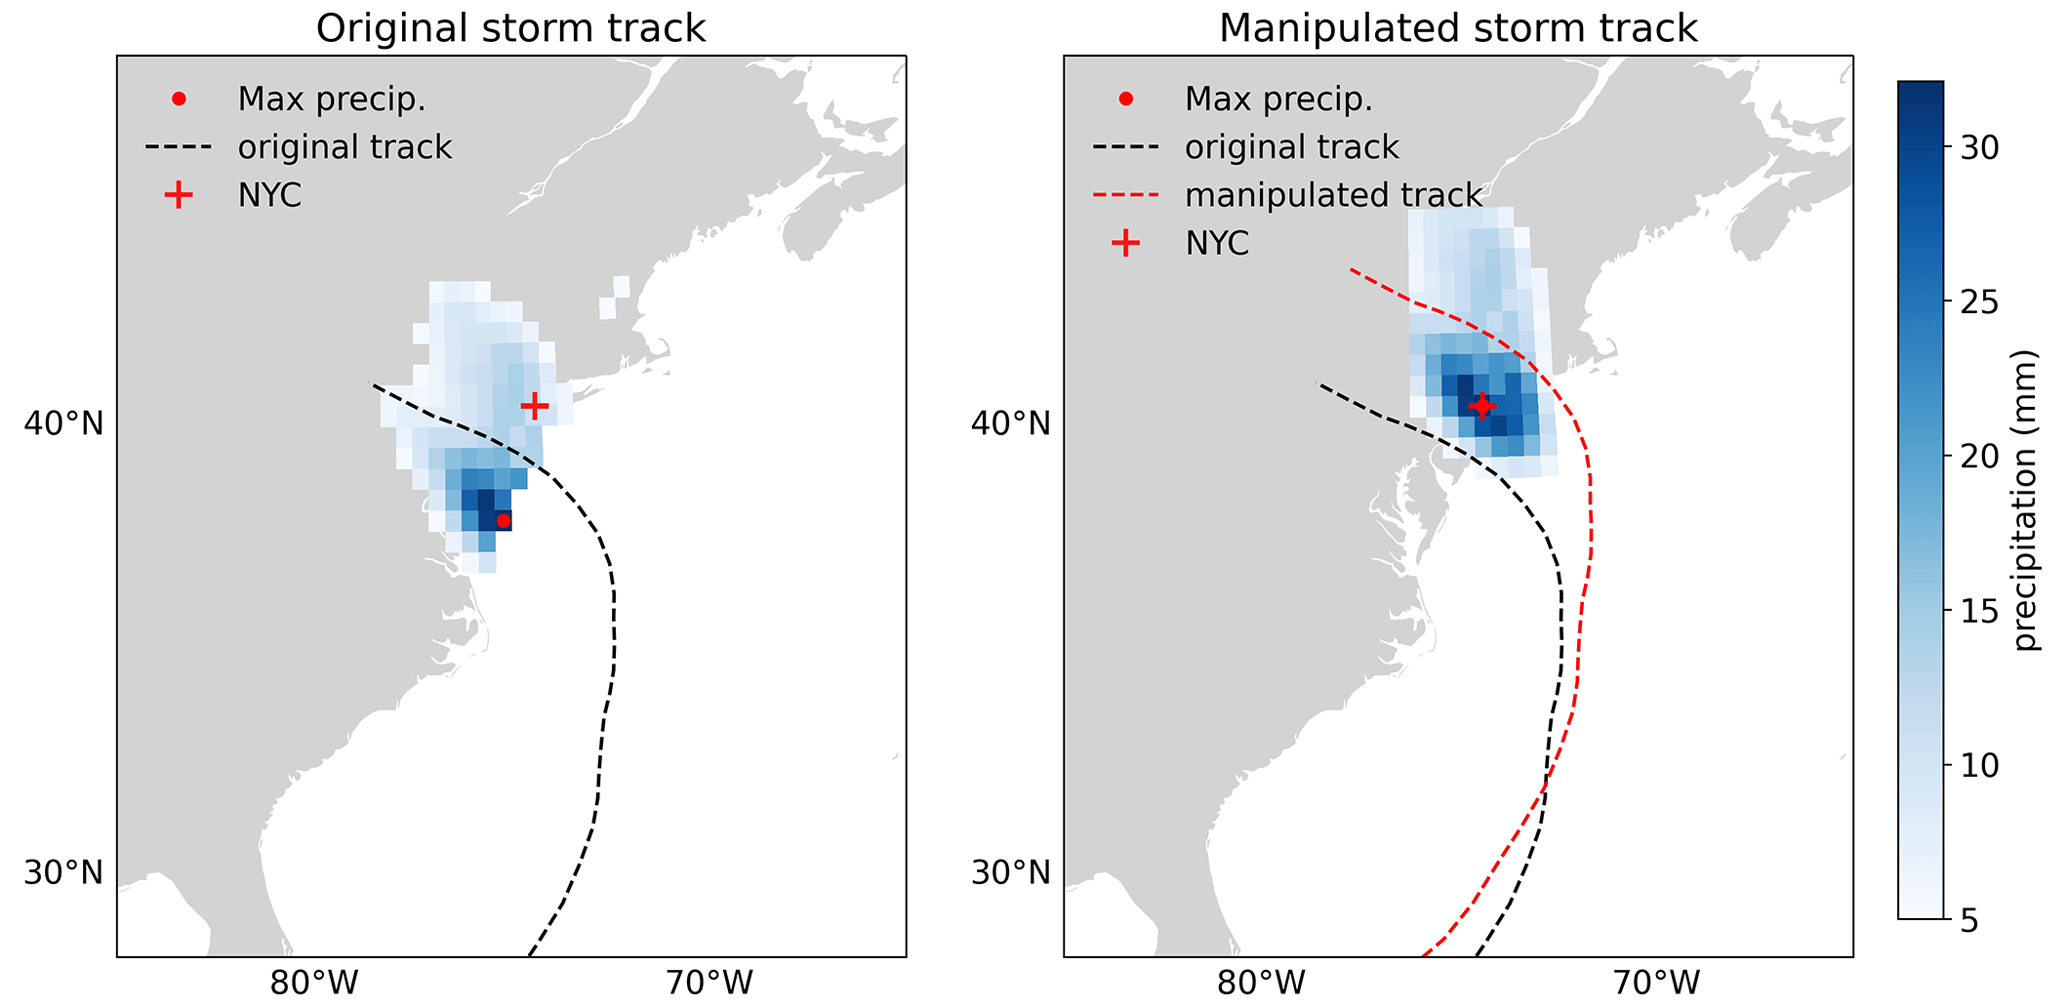
Figure A3Storm track manipulation based on the maximum precipitation location. Blue squares indicate precipitation levels (in millimetres), dashed lines indicate storm tracks, the red dot indicates maximum precipitation, and the cross shows the location of NYC. In the left-side panel, the two dashed lines overlap completely.
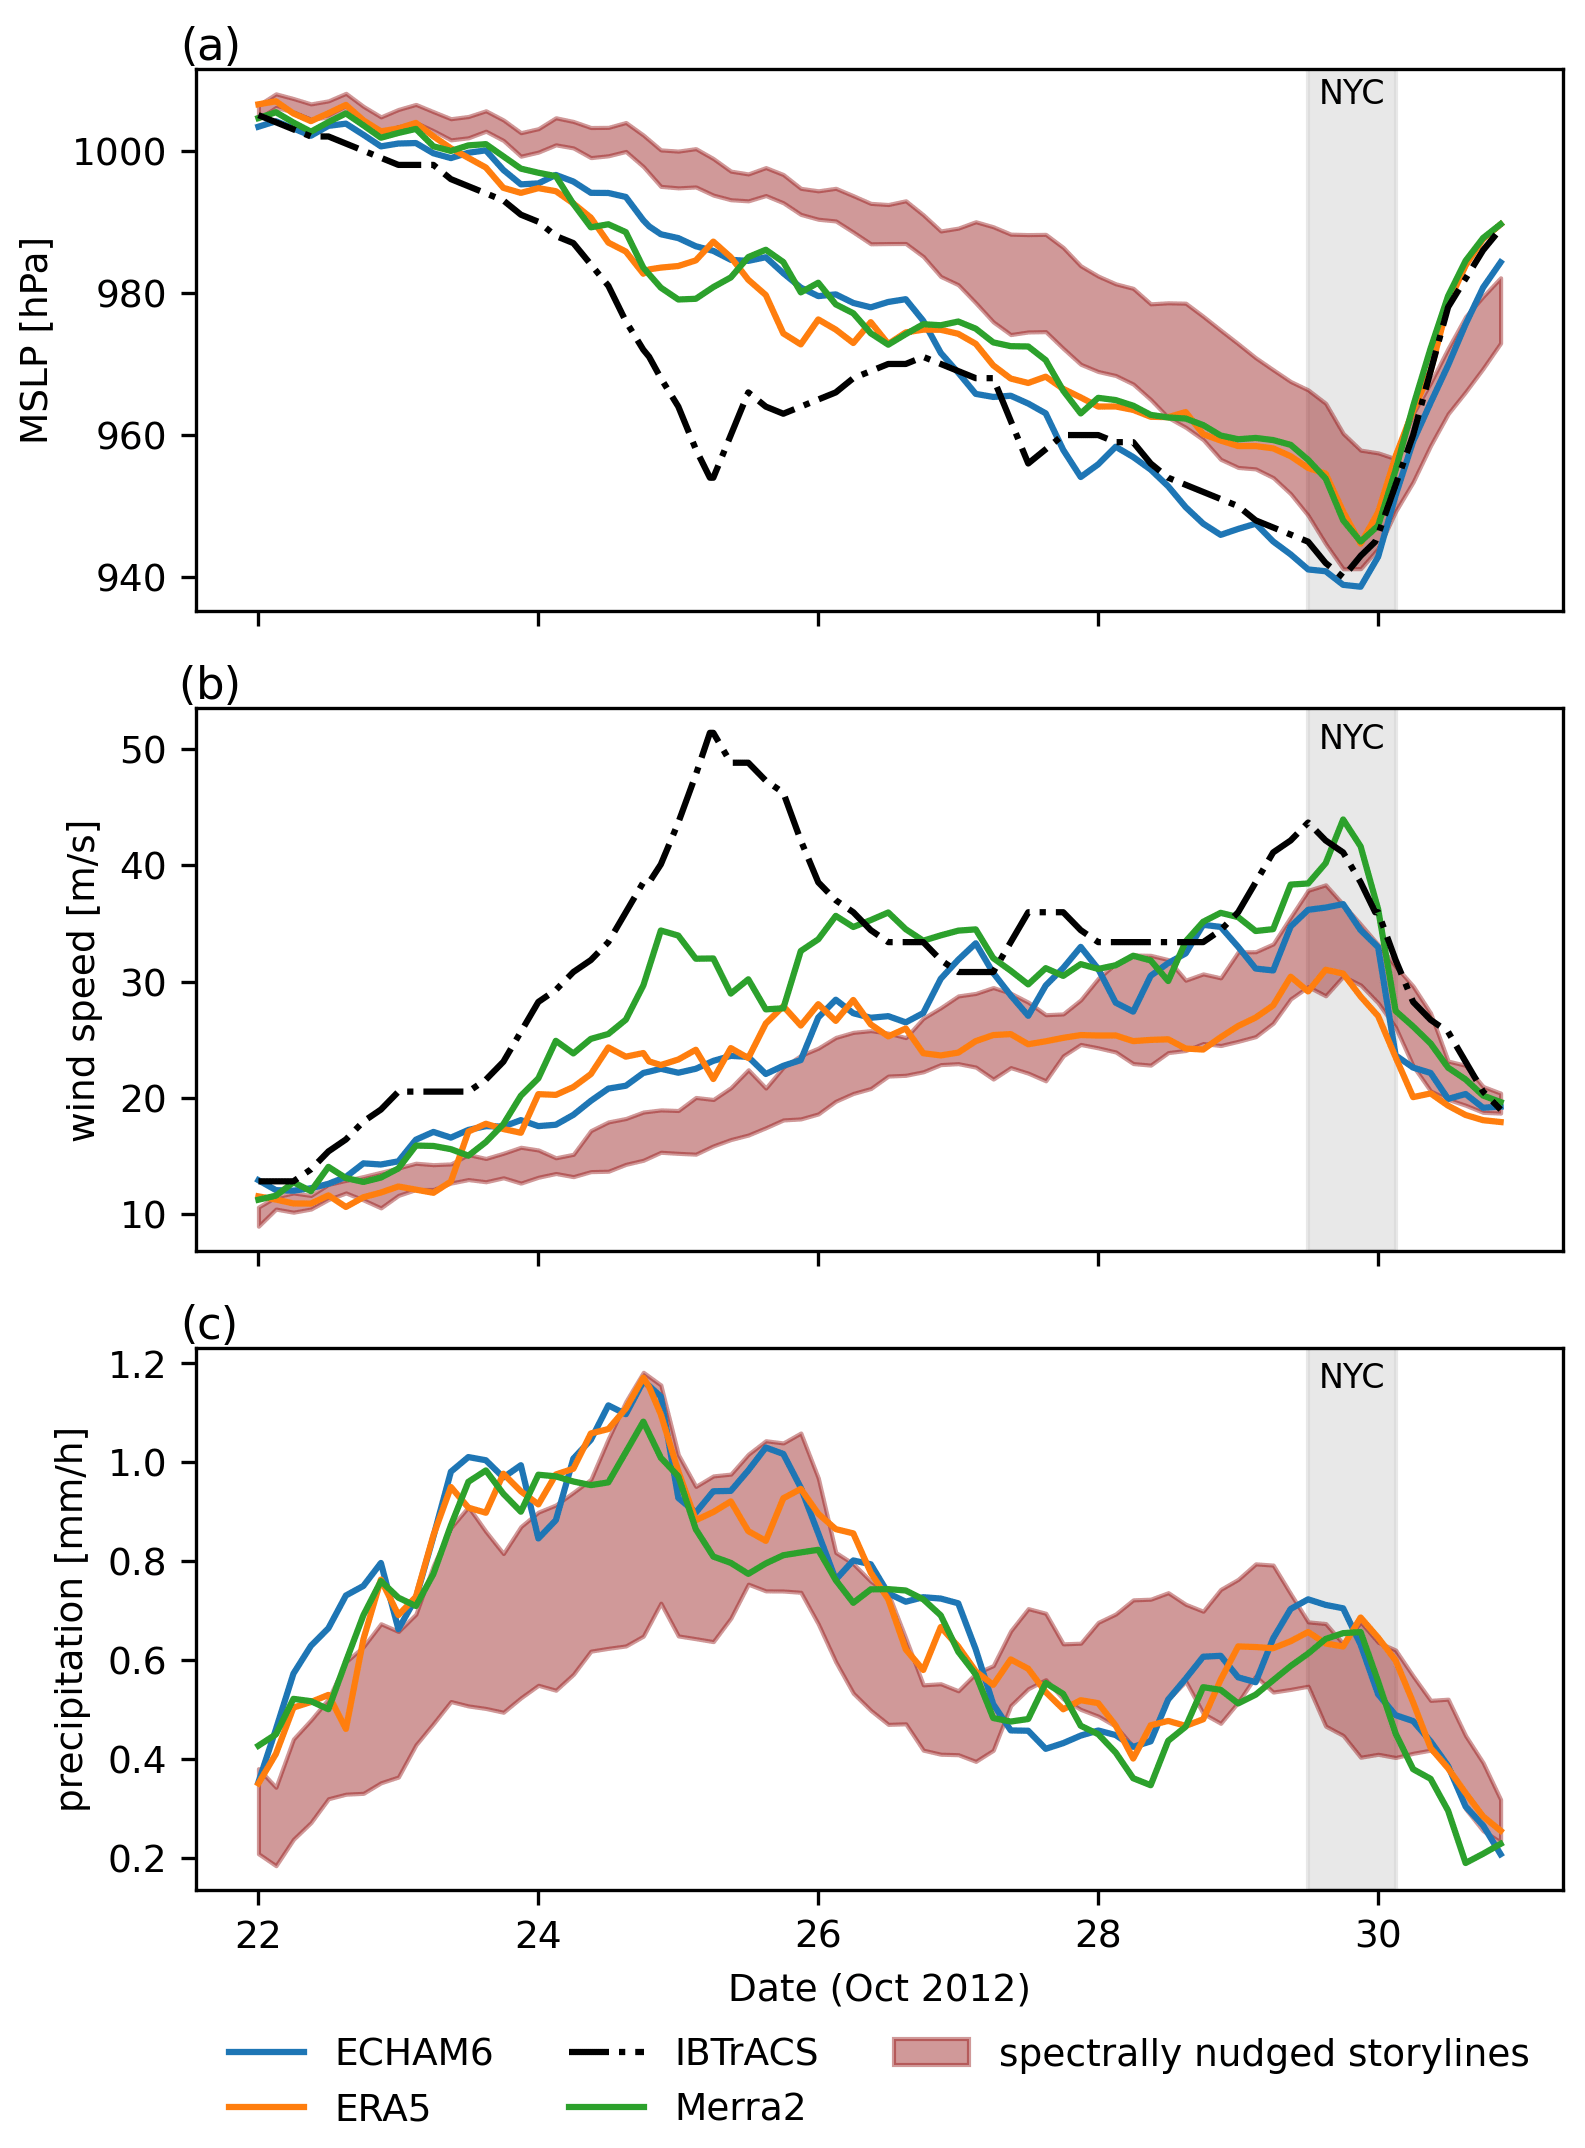
Figure A4Similar to Fig. 2. The historical spectrally nudged datasets (ECHAM_SN), ERA5, Merra2, and IBTrACS are represented by blue, orange, green, and dashed-dotted black lines, respectively. No IBTrACS information for precipitation.
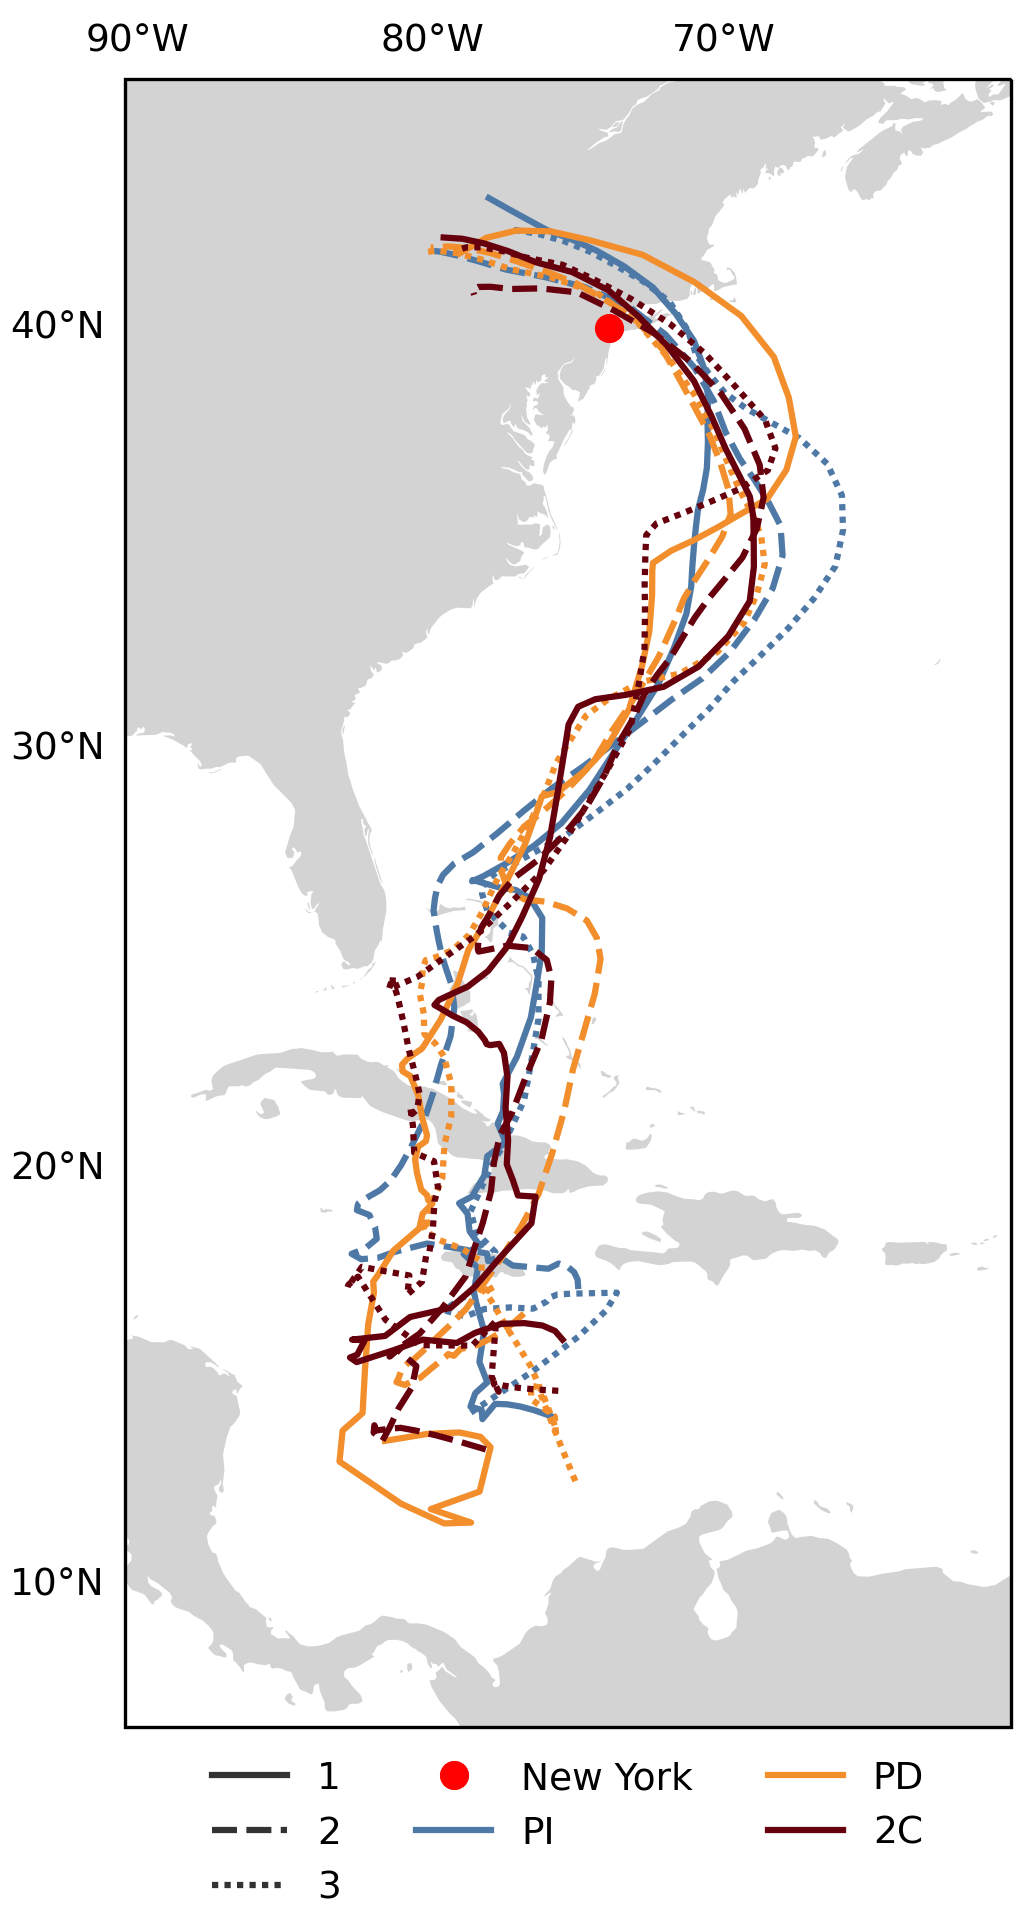
Figure A5Similar to Fig. 2a but for manipulated storm tracks from MP scenario.
The code for this experiment is available at https://github.com/dumontgoulart/sandy_impacts_storylines (last access: 12 December 2023; https://doi.org/10.5281/zenodo.10209795, Goulart, 2023). SFINCS is available at https://doi.org/10.5281/zenodo.10118583 (van Ormondt, 2023) and HydroMT is available at https://doi.org/10.5281/zenodo.10143631 (Eilander et al., 2023c).
GEBCO is available at https://www.gebco.net/data_and_products/gridded_bathymetry_data/#global (GEBCO, 2014), FABDEM at https://doi.org/10.5523/bris.25wfy0f9ukoge2gs7a5mqpq2j7 (Hawker and Neal, 2021), and CUDEM at https://doi.org/10.25921/ds9v-ky35 (Cooperative Institute for Research in Environmental Sciences at the University of Colorado, 2014). The spectrally nudged storylines are available upon request from Linda van Garderen.
HMDG, KvdV, and BvdH contributed to the concept of the study. HMDG conducted the research and edited the manuscript. LvG, DLB, EK, and IBL provided the data. IBL provided the GTSM model and EK the scripts for critical infrastructure. All authors discussed the analysis and results, and revised the manuscript. BvdH, KvdW, and EK supervised the work.
The contact author has declared that none of the authors has any competing interests.
Publisher’s note: Copernicus Publications remains neutral with regard to jurisdictional claims made in the text, published maps, institutional affiliations, or any other geographical representation in this paper. While Copernicus Publications makes every effort to include appropriate place names, the final responsibility lies with the authors.
This article is part of the special issue “Methodological innovations for the analysis and management of compound risk and multi-risk, including climate-related and geophysical hazards (NHESS/ESD/ESSD/GC/HESS inter-journal SI)”. It is not associated with a conference.
This research has been supported by the European Union’s Horizon 2020 research and innovation programme under grant agreement no. 820712 (project RECEIPT, REmote Climate Effects and their Impact on European sustainability, Policy and Trade). We thank Nadia Bloemendaal, Ted Buskop, Devi Purnamasari, Daniel Peregrina Gonzalez, Raed Hamed, Tamara Happe, Ben Poschhold, Aaron Alexander, Dirk Eilander, Tim Leijnse, Sanne Muis, and Frauke Feser for comments on previous versions of the manuscript.
This research has been supported by the Horizon 2020 Framework Programme, H2020 Societal Challenges (grant no. 820712).
This paper was edited by Robert Šakić Trogrlić and reviewed by two anonymous referees.
Aerts, J. C., Botzen, W. J., de Moel, H., and Bowman, M.: Cost estimates for flood resilience and protection strategies in New York City, Ann. NY Acad. Sci., 1294, 1–104, https://doi.org/10.1111/nyas.12200, 2013. a
Aerts, J. C. J. H., Botzen, W. J. W., Emanuel, K., Lin, N., de Moel, H., and Michel-Kerjan, E. O.: Evaluating Flood Resilience Strategies for Coastal Megacities, Science, 344, 473–475, https://doi.org/10.1126/science.1248222, 2014. a
Amante, C. J., Love, M., Carignan, K., Sutherland, M. G., MacFerrin, M., and Lim, E.: Continuously Updated Digital Elevation Models (CUDEMs) to Support Coastal Inundation Modeling, Remote Sensing, 15, 1702, https://doi.org/10.3390/rs15061702, 2023. a
Baatsen, M., Haarsma, R. J., Delden, A. J. V., and de Vries, H.: Severe Autumn storms in future Western Europe with a warmer Atlantic Ocean, Clim. Dynam., 45, 949–964, https://doi.org/10.1007/s00382-014-2329-8, 2015. a
Bartholomeus, R. P., van der Wiel, K., van Loon, A. F., van Huijgevoort, M. H., van Vliet, M. T., Mens, M., Muurling-van Geffen, S., Wanders, N., and Pot, W.: Managing water across the flood–drought spectrum: Experiences from and challenges for the Netherlands, Cambridge Prisms: Water, 1, e2, https://doi.org/10.1017/wat.2023.4, 2023. a, b
Bevacqua, E., Vousdoukas, M. I., Zappa, G., Hodges, K., Shepherd, T. G., Maraun, D., Mentaschi, L., and Feyen, L.: More meteorological events that drive compound coastal flooding are projected under climate change, Communications Earth & Environment, 1, 47, https://doi.org/10.1038/s43247-020-00044-z, 2020. a
Bloemendaal, N., Muis, S., Haarsma, R. J., Verlaan, M., Apecechea, M. I., de Moel, H., Ward, P. J., and Aerts, J. C.: Global modeling of tropical cyclone storm surges using high-resolution forecasts, Clim. Dynam., 52, 5031–5044, https://doi.org/10.1007/s00382-018-4430-x, 2019. a, b
Bony, S., Stevens, B., Frierson, D. M., Jakob, C., Kageyama, M., Pincus, R., Shepherd, T. G., Sherwood, S. C., Siebesma, A. P., Sobel, A. H., Watanabe, M., Webb, and Clouds, M. J.: Clouds, circulation and climate sensitivity, Nat. Geosci., 8, 261–268, 2015. a
Buchhorn, M., Smets, B., Bertels, L., Roo, B. D., Lesiv, M., Tsendbazar, N.-E., Herold, M., and Fritz, S.: Copernicus Global Land Service: Land Cover 100 m: collection 3: epoch 2015: Globe, Zenodo [data set], https://doi.org/10.5281/zenodo.3939038, 2020. a
Chang, S. E.: Socioeconomic impacts of infrastructure disruptions, in: Oxford research encyclopedia of natural hazard science, https://doi.org/10.1093/acrefore/9780199389407.013.66, 2016. a
Cooperative Institute for Research in Environmental Sciences (CIRES) at the University of Colorado: Continuously Updated Digital Elevation Model (CUDEM) – 1/9 Arc-Second Resolution Bathymetric-Topographic Tiles, NOAA National Centers for Environmental Information [data set], https://doi.org/10.25921/ds9v-ky35, 2014. a
Deser, C., Knutti, R., Solomon, S., and Phillips, A. S.: Communication of the role of natural variability in future North American climate, Nat. Clim. Change, 2, 775–779, https://doi.org/10.1038/nclimate1562, 2012. a
Done, J. M., Bruyère, C. L., Ge, M., and Jaye, A.: Internal variability of North Atlantic tropical cyclones, J. Geophys. Res.-Atmos., 119, 6506–6519, https://doi.org/10.1002/2014JD021542, 2014. a, b
Done, J. M., PaiMazumder, D., Towler, E., and Kishtawal, C. M.: Estimating impacts of North Atlantic tropical cyclones using an index of damage potential, Climatic Change, 146, 561–573, 2018. a
Dullaart, J. C., Muis, S., Bloemendaal, N., Chertova, M. V., Couasnon, A., and Aerts, J. C.: Accounting for tropical cyclones more than doubles the global population exposed to low-probability coastal flooding, Communications Earth & Environment, 2, 135, https://doi.org/10.1038/s43247-021-00204-9, 2021. a
Eilander, D., Boisgontier, H., Bouaziz, L. J. E., Buitink, J., Couasnon, A., Dalmijn, B., Hegnauer, M., de Jong, T., Loos, S., Marth, I., and van Verseveld, W.: HydroMT: Automated and reproducible model building and analysis, Journal of Open Source Software, 8, 4897, https://doi.org/10.21105/joss.04897, 2023a. a
Eilander, D., Couasnon, A., Sperna Weiland, F. C., Ligtvoet, W., Bouwman, A., Winsemius, H. C., and Ward, P. J.: Modeling compound flood risk and risk reduction using a globally applicable framework: a pilot in the Sofala province of Mozambique, Nat. Hazards Earth Syst. Sci., 23, 2251–2272, https://doi.org/10.5194/nhess-23-2251-2023, 2023b. a
Eilander, D., Boisgontier, H., Bouaziz, L. J. E., Buitink, J., Couasnon, A., Dalmijn, B., Hegnauer, M., de Jong, T., Loos, S., Marth, I., and van Verseveld, W.: HydroMT: Automated and reproducible model building and analysis (v0.9.1), Zenodo [code], https://doi.org/10.5281/zenodo.10143631, 2023c. a
Feser, F. and Barcikowska, M.: The influence of spectral nudging on typhoon formation in regional climate models, Environ. Res. Lett., 7, 014024, https://doi.org/10.1088/1748-9326/7/1/014024, 2012. a
GEBCO: General bathymetric chart of the oceans (GEBCO) 2014 Grid, https://www.gebco.net/data_and_products/gridded_bathymetry_data/#global (last access: 6 January 2024), 2014. a, b, c
Gelaro, R., McCarty, W., Suárez, M. J., Todling, R., Molod, A., Takacs, L., Randles, C. A., Darmenov, A., Bosilovich, M. G., Reichle, R., Wargan, K., Coy, L., Cullather, R., Draper, C., Akella, S., Buchard, V., Conaty, A., da Silva, A. M., Gu, W., Kim, G.-K., Koster, R., Lucchesi, R., Merkova, D., Nielsen, J. E., Partyka, G., Pawson, S., Putman, W., Rienecker, M., Schubert, S. D., Sienkiewicz, M., and Zhao, B.: The Modern-Era Retrospective Analysis for Research and Applications, Version 2 (MERRA-2), J. Climate, 30, 5419–5454, https://doi.org/10.1175/JCLI-D-16-0758.1, 2017. a
Gerritsen, H.: What happened in 1953? The Big Flood in the Netherlands in retrospect, Philos. T. R. Soc. A, 363, 1271–1291, https://doi.org/10.1098/rsta.2005.1568, 2005. a
Goulart, H. M. D.: dumontgoulart/sandy_impacts_storylines: v1.0.1 – publication initial version (v1.0.1), Zenodo [code], https://doi.org/10.5281/zenodo.10209795, 2023. a
Goulart, H. M. D., van der Wiel, K., Folberth, C., Balkovic, J., and van den Hurk, B.: Storylines of weather-induced crop failure events under climate change, Earth Syst. Dynam., 12, 1503–1527, https://doi.org/10.5194/esd-12-1503-2021, 2021. a
Goulart, H. M. D., van der Wiel, K., Folberth, C., Boere, E., and van den Hurk, B.: Increase of Simultaneous Soybean Failures Due To Climate Change, Earth's Future, 11, e2022EF003106, https://doi.org/10.1029/2022EF003106, 2023. a, b
Gutmann, E. D., Rasmussen, R. M., Liu, C., Ikeda, K., Bruyere, C. L., Done, J. M., Garrè, L., Friis-Hansen, P., and Veldore, V.: Changes in Hurricanes from a 13-Yr Convection-Permitting Pseudo–Global Warming Simulation, J. Climate, 31, 3643–3657, https://doi.org/10.1175/JCLI-D-17-0391.1, 2018. a, b, c, d, e
Haasnoot, M., Kwadijk, J., van Alphen, J., Bars, D. L., van den Hurk, B., Diermanse, F., van der Spek, A., Essink, G. O., Delsman, J., and Mens, M.: Adaptation to uncertain sea-level rise; how uncertainty in Antarctic mass-loss impacts the coastal adaptation strategy of the Netherlands, Environ. Res. Lett., 15, 034007, https://doi.org/10.1088/1748-9326/ab666c, 2020. a
Haklay, M. and Weber, P.: OpenStreetMap: User-Generated Street Maps, IEEE Pervasive Computing, 7, 12–18, https://doi.org/10.1109/MPRV.2008.80, 2008. a
Hall, J. W., Aerts, J. C. J. H., Ayyub, B. M., Hallegatte, S., Harvey, M., Hu, X., Koks, E. E., Lee, C., Liao, X., Mullan, M., Pant, R., Paszkowski, A., Rozenberg, J., Sheng, F., Stenek, V., Thacker, S., Väänänen, E., Vallejo, L., Veldkamp, T. I. E., van Vliet, M., Wada, Y., Ward, P., Watkins, G., and Zorn, C.: Adaptation of Infrastructure Systems: Background Paper for the Global Commission on Adaptation, Oxford: Environmental Change Institute, University of Oxford, http://www.gca.org/ (last access: 6 January 2024), 2019. a
Hall, T. M. and Sobel, A. H.: On the impact angle of Hurricane Sandy's New Jersey landfall, Geophys. Res. Lett., 40, 2312–2315, https://doi.org/10.1002/grl.50395, 2013. a
Hallegatte, S., Green, C., Nicholls, R. J., and Corfee-Morlot, J.: Future flood losses in major coastal cities, Nat. Clim. Change, 3, 802–806, 2013. a, b
Hamed, R., Vijverberg, S., Van Loon, A. F., Aerts, J., and Coumou, D.: Persistent La Niñas drive joint soybean harvest failures in North and South America, Earth Syst. Dynam., 14, 255–272, https://doi.org/10.5194/esd-14-255-2023, 2023. a
Hawker, L. and Neal, J.: FABDEM V1-0, University of Bristol [data set], https://doi.org/10.5523/bris.25wfy0f9ukoge2gs7a5mqpq2j7, 2021. a
Hawker, L., Uhe, P., Paulo, L., Sosa, J., Savage, J., Sampson, C., and Neal, J.: A 30 m global map of elevation with forests and buildings removed, Environ. Res. Lett., 17, 024016, https://doi.org/10.1088/1748-9326/ac4d4f, 2022. a
Herfort, B., Lautenbach, S., Porto de Albuquerque, J., Anderson, J., and Zipf, A.: A spatio-temporal analysis investigating completeness and inequalities of global urban building data in OpenStreetMap, Nat. Commun., 14, 3985, https://doi.org/10.1038/s41467-023-39698-6, 2023. a, b
Hersbach, H., Bell, B., Berrisford, P., Hirahara, S., Horányi, A., Muñoz-Sabater, J., Nicolas, J., Peubey, C., Radu, R., Schepers, D., Simmons, A., Soci, C., Abdalla, S., Abellan, X., Balsamo, G., Bechtold, P., Biavati, G., Bidlot, J., Bonavita, M., Chiara, G. D., Dahlgren, P., Dee, D., Diamantakis, M., Dragani, R., Flemming, J., Forbes, R., Fuentes, M., Geer, A., Haimberger, L., Healy, S., Hogan, R. J., Hólm, E., Janisková, M., Keeley, S., Laloyaux, P., Lopez, P., Lupu, C., Radnoti, G., de Rosnay, P., Rozum, I., Vamborg, F., Villaume, S., and Thépaut, J. N.: The ERA5 global reanalysis, Q. J. Roy. Meteor. Soc., 146, 1999–2049, https://doi.org/10.1002/qj.3803, 2020. a
Hill, K. A. and Lackmann, G. M.: The Impact of Future Climate Change on TC Intensity and Structure: A Downscaling Approach, J. Climate, 24, 4644–4661, https://doi.org/10.1175/2011JCLI3761.1, 2011. a
Hinkel, J., Lincke, D., Vafeidis, A. T., Perrette, M., Nicholls, R. J., Tol, R. S. J., Marzeion, B., Fettweis, X., Ionescu, C., and Levermann, A.: Coastal flood damage and adaptation costs under 21st century sea-level rise, P. Natl. Acad. Sci. USA, 111, 3292–3297, https://doi.org/10.1073/pnas.1222469111, 2014. a
Hodges, K., Cobb, A., and Vidale, P. L.: How well are tropical cyclones represented in reanalysis datasets?, J. Climate, 30, 5243–5264, 2017. a
IPCC, 2021: Climate Change 2021: The Physical Science Basis. Contribution of Working Group I to the Sixth Assessment Report of the Intergovernmental Panel on Climate Change, edited by: Masson-Delmotte, V., Zhai, P., Pirani, A., Connors, S. L., Péan, C., Berger, S., Caud, N., Chen, Y., Goldfarb, L., Gomis, M. I., Huang, M., Leitzell, K., Lonnoy, E., Matthews, J. B. R., Maycock, T. K., Waterfield, T., Yelekçi, O., Yu, R., and Zhou, B., Cambridge University Press, Cambridge, United Kingdom and New York, NY, USA, 2391 pp., https://doi.org/10.1017/9781009157896, 2021. a, b, c, d, e
IPCC: Climate Change 2022: Impacts, Adaptation and Vulnerability, Summary for Policymakers, Cambridge University Press, Cambridge, UK and New York, USA, ISBN 9781009325844, 2022. a
Jaafar, H. H., Ahmad, F. A., and El Beyrouthy, N.: GCN250, new global gridded curve numbers for hydrologic modeling and design, Sci. Data, 6, 145, https://doi.org/10.1038/s41597-019-0155-x, 2019. a
Jongman, B.: Effective adaptation to rising flood risk, Nat. Commun., 9, 1986, https://doi.org/10.1038/s41467-018-04396-1, 2018. a
Kalnay, E., Kanamitsu, M., Kistler, R., Collins, W., Deaven, D., Gandin, L., Iredell, M., Saha, S., White, G., Woollen, J., Zhu, Y., Chelliah, M., Ebisuzaki, W., Higgins, W., Janowiak, J., Mo, K. C., Ropelewski, C., Wang, J., Leetmaa, A., Reynolds, R., Jenne, R., and Joseph, D.: The NCEP/NCAR 40-year reanalysis project, B. Am. Meteorol. Soc., 77, 437–472, https://doi.org/10.1175/1520-0477(1996)077<0437:TNYRP>2.0.CO;2, 1996. a
Kazakov, E., Sekste, A., and Malikin, M.: OSM Road Completeness, https://www.kontur.io/blog/osm-road-completeness/ (last access: 28 August 2023), 2023. a
Kernkamp, H. W., Van Dam, A., Stelling, G. S., and de Goede, E. D.: Efficient scheme for the shallow water equations on unstructured grids with application to the Continental Shelf, Ocean Dynam., 61, 1175–1188, 2011. a
Knapp, K. R., Kruk, M. C., Levinson, D. H., Diamond, H. J., and Neumann, C. J.: The international best track archive for climate stewardship (IBTrACS) unifying tropical cyclone data, B. Am. Meteorol. Soc., 91, 363–376, 2010. a
Knutson, T., Camargo, S. J., Chan, J. C. L., Emanuel, K., Ho, C.-H., Kossin, J., Mohapatra, M., Satoh, M., Sugi, M., Walsh, K., and Wu, L.: Tropical Cyclones and Climate Change Assessment: Part II: Projected Response to Anthropogenic Warming, B. Am. Meteorol. Soc., 101, E303–E322, https://doi.org/10.1175/BAMS-D-18-0194.1, 2020. a, b, c, d
Koks, E. E., Rozenberg, J., Zorn, C., Tariverdi, M., Vousdoukas, M., Fraser, S. A., Hall, J., and Hallegatte, S.: A global multi-hazard risk analysis of road and railway infrastructure assets, Nat. Commun., 10, 2677, https://doi.org/10.1038/s41467-019-10442-3, 2019. a, b
Koks, E. E., Bars, D. L., Essenfelder, A., Nirandjan, S., and Sayers, P.: The impacts of coastal flooding and sea level rise on critical infrastructure: a novel storyline approach, Sustainable and Resilient Infrastructure, 8, 237–261, https://doi.org/10.1080/23789689.2022.2142741, 2023. a, b, c
Kunz, M., Mühr, B., Kunz-Plapp, T., Daniell, J. E., Khazai, B., Wenzel, F., Vannieuwenhuyse, M., Comes, T., Elmer, F., Schröter, K., Fohringer, J., Münzberg, T., Lucas, C., and Zschau, J.: Investigation of superstorm Sandy 2012 in a multi-disciplinary approach, Nat. Hazards Earth Syst. Sci., 13, 2579–2598, https://doi.org/10.5194/nhess-13-2579-2013, 2013. a, b, c, d, e
Lackmann, G. M.: Hurricane Sandy before 1900 and after 2100, B. Am. Meteorol. Soc., 96, 547–560, https://doi.org/10.1175/BAMS-D-14-00123.1, 2015. a
Le Bars, D.: Uncertainty in Sea Level Rise Projections Due to the Dependence Between Contributors, Earth's Future, 6, 1275–1291, https://doi.org/10.1029/2018EF000849, 2018. a, b
Lehner, F. and Deser, C.: Origin, importance, and predictive limits of internal climate variability, Environ. Res., 2, 023001, https://doi.org/10.1088/2752-5295/accf30, 2023. a, b
Leijnse, T., van Ormondt, M., Nederhoff, K., and van Dongeren, A.: Modeling compound flooding in coastal systems using a computationally efficient reduced-physics solver: Including fluvial, pluvial, tidal, wind- and wave-driven processes, Coast. Eng., 163, 103796, https://doi.org/10.1016/j.coastaleng.2020.103796, 2021. a, b, c, d
Lin, N., Kopp, R. E., Horton, B. P., and Donnelly, J. P.: Hurricane Sandy's flood frequency increasing from year 1800 to 2100, P. Natl. Acad. Sci. USA, 113, 12071–12075, https://doi.org/10.1073/pnas.1604386113, 2016. a
Liu, K., Wang, Q., Wang, M., and Koks, E. E.: Global transportation infrastructure exposure to the change of precipitation in a warmer world, Nat. Commun., 14, 2541, https://doi.org/10.1038/s41467-023-38203-3, 2023. a
Liu, M., Vecchi, G. A., Smith, J. A., and Murakami, H.: Projection of Landfalling–Tropical Cyclone Rainfall in the Eastern United States under Anthropogenic Warming, J. Climate, 31, 7269–7286, https://doi.org/10.1175/JCLI-D-17-0747.1, 2018. a
Lockwood, J. W., Oppenheimer, M., Lin, N., Kopp, R. E., Vecchi, G. A., and Gori, A.: Correlation Between Sea-Level Rise and Aspects of Future Tropical Cyclone Activity in CMIP6 Models, Earth's Future, 10, e2021EF002462, https://doi.org/10.1029/2021EF002462, 2022. a
Martinez, G. S., Linares, C., Ayuso, A., Kendrovski, V., Boeckmann, M., and Diaz, J.: Heat-health action plans in Europe: Challenges ahead and how to tackle them, Environ. Res., 176, 108548, https://doi.org/10.1016/j.envres.2019.108548, 2019. a
Mechler, R., Hochrainer, S., Aaheim, A., Salen, H., and Wreford, A.: Modelling economic impacts and adaptation to extreme events: Insights from European case studies, Mitig. Adapt. Strat. Gl., 15, 737–762, 2010. a
Mei, W., Xie, S.-P., Zhao, M., and Wang, Y.: Forced and Internal Variability of Tropical Cyclone Track Density in the Western North Pacific, J. Climate, 28, 143–167, https://doi.org/10.1175/JCLI-D-14-00164.1, 2015. a, b
Meinshausen, M., Smith, S. J., Calvin, K., Daniel, J. S., Kainuma, M. L., Lamarque, J.-F., Matsumoto, K., Montzka, S. A., Raper, S. C., Riahi, K., Thomson, A., Velders, G. J. M., and van Vuuren, D. P. P.: The RCP greenhouse gas concentrations and their extensions from 1765 to 2300, Climatic Change, 109, 213–241, 2011. a
Muis, S., Apecechea, M. I., Dullaart, J., de Lima Rego, J., Madsen, K. S., Su, J., Yan, K., and Verlaan, M.: A High-Resolution Global Dataset of Extreme Sea Levels, Tides, and Storm Surges, Including Future Projections, Front. Mar. Sci., 7, 263, https://doi.org/10.3389/fmars.2020.00263, 2020. a
Nicholls, R. J. and Cazenave, A.: Sea-level rise and its impact on coastal zones, Science, 328, 1517–1520, 2010. a
Nirandjan, S., Koks, E. E., Ward, P. J., and Aerts, J. C.: A spatially-explicit harmonized global dataset of critical infrastructure, Sci. Data, 9, 150, https://doi.org/10.1038/s41597-022-01218-4, 2022. a, b
OCM Partners: 2017 NYC Topobathy Lidar DEM: New York City, NOAA National Centers for Environmental Information, https://www.fisheries.noaa.gov/inport/item/64732 (last access: 6 January 2024), 2017. a
O'Neill, B. C., Tebaldi, C., van Vuuren, D. P., Eyring, V., Friedlingstein, P., Hurtt, G., Knutti, R., Kriegler, E., Lamarque, J.-F., Lowe, J., Meehl, G. A., Moss, R., Riahi, K., and Sanderson, B. M.: The Scenario Model Intercomparison Project (ScenarioMIP) for CMIP6, Geosci. Model Dev., 9, 3461–3482, https://doi.org/10.5194/gmd-9-3461-2016, 2016. a
Oppenheimer, M., Glavovic, B. C., Hinkel, J., van de Wal, R., Magnan, A. K., Abd-Elgawad, A., Cai, R., Cifuentes-Jara, M., DeConto, R. M., Ghosh, T., Hay, J., Isla, F., Marzeion, B., Meyssignac, B. , and Sebesvari, Z.: Sea Level Rise and Implications for Low-Lying Islands, Coasts and Communities, in: IPCC Special Report on the Ocean and Cryosphere in a Changing Climate, edited by: Pörtner, H.-O., Roberts, D. C., Masson-Delmotte, V., Zhai, P., Tignor, M., Poloczanska, E., Mintenbeck, K., Alegría, A., Nicolai, M., Okem, A., Petzold, J., Rama, B., and Weyer, N. M., Cambridge University Press, Cambridge, UK and New York, NY, USA, 321–445, https://doi.org/10.1017/9781009157964.006, 2019. a
Otto, F. E., Philip, S., Kew, S., Li, S., King, A., and Cullen, H.: Attributing high-impact extreme events across timescales – a case study of four different types of events, Climatic Change, 149, 399–412, 2018. a, b
Patricola, C. M. and Wehner, M. F.: Anthropogenic influences on major tropical cyclone events, Nature, 563, 339–346, https://doi.org/10.1038/s41586-018-0673-2, 2018. a
Prein, A., Gobiet, A., Truhetz, H., Keuler, K., Goergen, K., Teichmann, C., Fox Maule, C., Van Meijgaard, E., Déqué, M., Nikulin, G., Vautard, R., Colette, A., Kjellström, E., and Jacob, D.: Precipitation in the EURO-CORDEX 0.11∘ and 0.44∘ simulations: high resolution, high benefits?, Clim. Dynam., 46, 383–412, https://doi.org/10.1007/s00382-015-2589-y, 2016. a
Qiu, J., Liu, B., Yang, F., Wang, X., and He, X.: Quantitative Stress Test of Compound Coastal-Fluvial Floods in China's Pearl River Delta, Earth's Future, 10, e2021EF002638, https://doi.org/10.1029/2021EF002638, 2022. a, b
Rosenzweig, C. and Solecki, W.: Hurricane Sandy and adaptation pathways in New York: Lessons from a first-responder city, Global Environ. Chang., 28, 395–408, https://doi.org/10.1016/j.gloenvcha.2014.05.003, 2014. a, b
Schubert-Frisius, M., Feser, F., von Storch, H., and Rast, S.: Optimal Spectral Nudging for Global Dynamic Downscaling, Mon. Weather Rev., 145, 909–927, https://doi.org/10.1175/MWR-D-16-0036.1, 2017. a, b, c, d
Schwarzwald, K. and Lenssen, N.: The importance of internal climate variability in climate impact projections, P. Natl Acad. Sci. USA, 119, e2208095119, https://doi.org/10.1073/pnas.2208095119, 2022. a, b, c
Sebastian, A., Bader, D., Nederhoff, C., Leijnse, T., Bricker, J., and Aarninkhof, S.: Hindcast of pluvial, fluvial, and coastal flood damage in Houston, Texas during Hurricane Harvey (2017) using SFINCS, Nat. Hazards, 109, 2343–2362, 2021. a
Shepherd, T. G.: Storyline approach to the construction of regional climate change information, P. Roy. Soc. A-Math. Phy., 475, 20190013, https://doi.org/10.1098/rspa.2019.0013, 2019. a
Shepherd, T. G., Boyd, E., Calel, R. A., Chapman, S. C., Dessai, S., Dima-West, I. M., Fowler, H. J., James, R., Maraun, D., Martius, O., Senior, C. A., Sobel, A. H., Stainforth, D. A., Tett, S. F. B., Trenberth, K. E., van den Hurk, B. J. J. M., Watkins, N. W., Wilby, R. L., and Zenghelis, D. A.: Storylines: an alternative approach to representing uncertainty in physical aspects of climate change, Climatic Change, 151, 555–571, https://doi.org/10.1007/s10584-018-2317-9, 2018. a, b
Sillmann, J., Shepherd, T. G., van den Hurk, B., Hazeleger, W., Martius, O., Slingo, J., and Zscheischler, J.: Event‐based storylines to address climate risk, Earth's Future, 9, e2020EF001783, https://doi.org/10.1029/2020EF001783, 2020. a
SIRR: A Stronger, More Resilient New York, New York Special Initiative for Rebuilding and Resilience, https://www.nyc.gov/site/sirr/report/report.page (last access: 3 May 2023), 2013. a, b, c, d, e
Stevens, B., Giorgetta, M., Esch, M., Mauritsen, T., Crueger, T., Rast, S., Salzmann, M., Schmidt, H., Bader, J., Block, K., Brokopf, R., Fast, I., Kinne, S., Kornblueh, L., Lohmann, U., Pincus, R., Reichler, T., and Roeckner, E.: Atmospheric component of the MPI-M Earth System Model: ECHAM6, J. Adv. Model. Earth Sy., 5, 146–172, https://doi.org/10.1002/jame.20015, 2013. a
Stott, P. A., Christidis, N., Otto, F. E., Sun, Y., Vanderlinden, J. P., van Oldenborgh, G. J., Vautard, R., von Storch, H., Walton, P., Yiou, P., and Zwiers, F. W.: Attribution of extreme weather and climate-related events, Wires Clim. Change, 7, 23–41, https://doi.org/10.1002/wcc.380, 2016. a
Sutton, R. T.: Climate Science Needs to Take Risk Assessment Much More Seriously, B. Am. Meteorol. Soc., 100, 1637–1642, https://doi.org/10.1175/BAMS-D-18-0280.1, 2019. a, b, c, d, e
Tebaldi, C., Debeire, K., Eyring, V., Fischer, E., Fyfe, J., Friedlingstein, P., Knutti, R., Lowe, J., O'Neill, B., Sanderson, B., van Vuuren, D., Riahi, K., Meinshausen, M., Nicholls, Z., Tokarska, K. B., Hurtt, G., Kriegler, E., Lamarque, J.-F., Meehl, G., Moss, R., Bauer, S. E., Boucher, O., Brovkin, V., Byun, Y.-H., Dix, M., Gualdi, S., Guo, H., John, J. G., Kharin, S., Kim, Y., Koshiro, T., Ma, L., Olivié, D., Panickal, S., Qiao, F., Rong, X., Rosenbloom, N., Schupfner, M., Séférian, R., Sellar, A., Semmler, T., Shi, X., Song, Z., Steger, C., Stouffer, R., Swart, N., Tachiiri, K., Tang, Q., Tatebe, H., Voldoire, A., Volodin, E., Wyser, K., Xin, X., Yang, S., Yu, Y., and Ziehn, T.: Climate model projections from the Scenario Model Intercomparison Project (ScenarioMIP) of CMIP6, Earth Syst. Dynam., 12, 253–293, https://doi.org/10.5194/esd-12-253-2021, 2021. a
Trenberth, K. E., Cheng, L., Jacobs, P., Zhang, Y., and Fasullo, J.: Hurricane Harvey Links to Ocean Heat Content and Climate Change Adaptation, Earth's Future, 6, 730–744, https://doi.org/10.1029/2018EF000825, 2018. a
van den Hurk, B. J., Pacchetti, M. B., Boere, E., Ciullo, A., Coulter, L., Dessai, S., Ercin, E., Goulart, H. M., Hamed, R., Hochrainer-Stigler, S., Koks, E., Kubiczek, P., Levermann, A., Mechler, R., van Meersbergen, M., Mester, B., Middelanis, R., Minderhoud, K., Mysiak, J., Nirandjan, S., van den Oord, G., Otto, C., Sayers, P., Schewe, J., Shepherd, T. G., Sillmann, J., Stuparu, D., Vogt, T., and Witpas, K.: Climate impact storylines for assessing socio-economic responses to remote events, Climate Risk Management, 40, 100500, https://doi.org/10.1016/j.crm.2023.100500, 2023a. a
van den Hurk, B. J., White, C. J., Ramos, A. M., Ward, P. J., Martius, O., Olbert, I., Roscoe, K., Goulart, H. M., and Zscheischler, J.: Consideration of compound drivers and impacts in the disaster risk reduction cycle, Iscience, 26, 106030, https://doi.org/10.1016/j.isci.2023.106030, 2023b. a, b
van Garderen, L.: Climate change attribution of extreme weather events using spectrally nudged event storylines, PhD thesis, Staats-und Universitätsbibliothek Hamburg Carl von Ossietzky, https://ediss.sub.uni-hamburg.de/handle/ediss/9978 (last access: 6 January 2024), 2022. a, b
van Garderen, L. and Mindlin, J.: A storyline attribution of the 2011/2012 drought in Southeastern South America, Weather, 77, 212–218, https://doi.org/10.1002/wea.4185, 2022. a, b, c
van Garderen, L., Feser, F., and Shepherd, T. G.: A methodology for attributing the role of climate change in extreme events: a global spectrally nudged storyline, Nat. Hazards Earth Syst. Sci., 21, 171–186, https://doi.org/10.5194/nhess-21-171-2021, 2021. a, b
van Ormondt, M., Leijnse, T., Nederhoff, K., de Goede, R., van Dongeren, A., and Bovenschen, T.: SFINCS: Super-Fast INundation of CoastS model (2.0.3 Cauberg Release Q4 2023), Zenodo [code], https://doi.org/10.5281/zenodo.10118583, 2023. a
von Storch, H., Langenberg, H., and Feser, F.: A Spectral Nudging Technique for Dynamical Downscaling Purposes, Mon. Weather Rev., 128, 3664–3673, https://doi.org/10.1175/1520-0493(2000)128<3664:ASNTFD>2.0.CO;2, 2000. a, b, c
Wahl, T., Jain, S., Bender, J., Meyers, S. D., and Luther, M. E.: Increasing risk of compound flooding from storm surge and rainfall for major US cities, Nat. Clim. Change, 5, 1093–1097, 2015. a, b
Weisse, R. and Feser, F.: Evaluation of a method to reduce uncertainty in wind hindcasts performed with regional atmosphere models, Coast. Eng., 48, 211–225, https://doi.org/10.1016/S0378-3839(03)00027-9, 2003. a
Woodruff, J. D., Irish, J. L., and Camargo, S. J.: Coastal flooding by tropical cyclones and sea-level rise, Nature, 504, 44–52, 2013. a
Yamada, Y., Kodama, C., Satoh, M., Nakano, M., Nasuno, T., and Sugi, M.: High-Resolution Ensemble Simulations of Intense Tropical Cyclones and Their Internal Variability During the El Niños of 1997 and 2015, Geophys. Res. Lett., 46, 7592–7601, https://doi.org/10.1029/2019GL082086, 2019. a
Yates, D., Luna, B. Q., Rasmussen, R., Bratcher, D., Garre, L., Chen, F., Tewari, M., and Friis-Hansen, P.: Stormy Weather: Assessing Climate Change Hazards to Electric Power Infrastructure: A Sandy Case Study, IEEE Power and Energy Magazine, 12, 66–75, https://doi.org/10.1109/MPE.2014.2331901, 2014. a, b, c, d, e, f
Zhou, Q., Zhang, Y., Chang, K., and Brovelli, M. A.: Assessing OSM building completeness for almost 13,000 cities globally, Int. J. Digit. Earth, 15, 2400–2421, https://doi.org/10.1080/17538947.2022.2159550, 2022. a
Zio, E.: Challenges in the vulnerability and risk analysis of critical infrastructures, Reliab. Eng. Syst. Safe., 152, 137–150, https://doi.org/10.1016/j.ress.2016.02.009, 2016. a