the Creative Commons Attribution 4.0 License.
the Creative Commons Attribution 4.0 License.
 | 13 Aug 2024
Earthquake insurance in Iran: solvency of local insurers in light of current market practices
Mohsen Ghafory-Ashtiany
Hooman Motamed
Owing to its geographical position within one of the most seismically active zones globally, Iran has experienced numerous historically impactful earthquakes. To finance a part of these losses and reconstruction expenses, earthquake insurance has been offered as a rider on fire insurance policies by Iranian insurers. This mechanism, if operated well, can substantially contribute to disaster risk management. On the other hand, if the pricing and management of catastrophe risk lack sound, risk-modeling-based practices, it might add to the problems and act to the detriment of disaster risk management. In this paper, we first compare the current earthquake insurance pricing and risk management in the Iranian insurance industry to a state-of-the-art insurance regulation in the European Union (Solvency II). Then, we examine the consequences of following each approach in terms of business profitability and viability by conducting a numerical analysis on a hypothetical portfolio of property risks in Iran. In so doing, a seismic risk model has been developed by adopting the Earthquake Model of the Middle East (EMME) and a peer-reviewed vulnerability model and by developing an exposure model for residential dwellings in Iran. The results suggest that modeled earthquake premium rates are about 5 times larger than the rates currently used in the market. Furthermore, a comparison between solvency capital calculated following the methods specified by the European Solvency II policy and the Iranian Directive 69 indicates a visible underestimation of earthquake solvency capital by the Iranian insurers. It seems that maintaining the current insurance pricing and risk management practices in Iran will probably lead to a substantial accumulation of earthquake risk for domestic firms and eventually endanger the solvency of these companies in the event of large-scale earthquake losses in the future.
- Article
(5946 KB) - Full-text XML
- BibTeX
- EndNote


Being positioned in one of the most seismically active regions in the world, Iran has witnessed many devastating earthquakes throughout history, such as the 1978 M7.4 Tabas earthquake (USD 11 million), the 1990 M7.4 Manjil–Rudbar earthquake (USD 2.8 billion), the 2003 M6.6 Bam earthquake (USD 1.5 billion), and most recently the 2016 M7.3 Sar-e Pol-e Zahab earthquake (USD 5 billion; Ibrion et al., 2015; Maghsoudi and Moshtari, 2020). Although almost all these events occurred in rural areas or small-sized cities with less than 100 000 inhabitants, the resulting socioeconomic consequences have been substantial. If a similar-magnitude earthquake struck a major Iranian city with millions of inhabitants, the volume of physical and human losses would be much higher.
To compensate for a part of earthquake losses and facilitate the process of reconstruction, Iranian insurance firms offer earthquake insurance as a rider on fire insurance policies. However, despite the common practice in the global insurance market, almost none of the domestic insurers use catastrophe risk models to quantify seismic risk for pricing policies, purchasing reinsurance, and managing accumulated risks. Instead, old-fashioned and seemingly underestimated pricing tables are still utilized nationally to determine earthquake insurance policies based on the main construction materials and geographical locations of insured buildings. This pricing approach is likely to result in insurance companies collecting insufficient premiums to cover future catastrophic losses. In a similar way, on the regulatory side, the solvency capital for catastrophe properties is not risk-based and is determined according to the amount of premium collected (which seem not to be commensurate with risk) and history of the company's losses (which does not reflect long-return-period-event risks like earthquakes). To date, due to the low penetration rate of insurance in Iran (about 1.8 % in 2022), catastrophe risks assumed by Iranian insurance companies are not significant, implying that even in the event of medium-to-large natural catastrophes, the insurance losses are usually reimbursable by the insurers. With the Iran Building Catastrophe Insurance Pool (IBCIP) expected to start operating soon, all residential buildings will be covered under a national policy. As such, there will likely be considerable business opportunities for domestic insurers to extend their catastrophe property portfolio to provide coverage supplementary to the primary protection which IBCIP offers. These new business opportunities, although financially attractive, can dramatically expose Iranian insurance and reinsurance companies to natural hazard risks. In other words, in the event of major catastrophic events such as earthquakes in urban cities or widespread flooding, which are likely given the Iranian geography, many local insurers can quickly become insolvent. This said, it is essential to examine the adequacy of the current insurance rates and the effectiveness of the solvency capital requirements mandated by the Central Insurance of Iran (CII) to cover future catastrophic losses that may happen in Iran.
In so doing, two parallel approaches have been taken. First, a probabilistic event-based earthquake risk model was developed that helps calculate a risk-based pricing framework for earthquake insurance policies. The model entails components of a standard catastrophe risk model, namely exposure, hazard, and vulnerability, which are separately adopted, tailored, or developed based on the state-of-the-art methodologies and up-to-date data. These components are incorporated using the Global Earthquake Model's (GEM) OpenQuake as a probabilistic event-based risk assessment platform to generate risk outputs such as average annual loss (AAL) and loss exceedance probability (EP). In addition, a similar risk-based methodology to what has been employed by the European insurance solvency regime, Solvency II, was adopted to create a standard formula for determining solvency capital for given earthquake risk portfolios. A hypothetical portfolio of earthquake risks was adopted to compare the factor-based solvency capital (as mandated by CII) with a risk-modeling-based one (as determined following Solvency II methodology) to examine the adequacy of the current earthquake rates and solvency capital. Further, the profitability of the underwriting and the likelihood of solvency is benchmarked using the values generated using the risk-based pricing method and the standard formula of solvency capital.
This paper comprises six sections. First, a background on insurance solvency with a focus on the European Solvency II regulation and its proposed method for calculating risk-based earthquake solvency capital is provided in Sect. 2. Then, Sect. 3 describes the evolution of earthquake risk models in Iran. Section 3 also provides information on the methodology and data adopted or developed to calculate risk parameters such as AAL and EP (99.5 % percentile) and estimate risk-based solvency capital for a portfolio of risks with earthquake coverage. Numerical results of the proposed methodology are outlined in Sect. 4, where the solvency capital of a hypothetical portfolio of risks under earthquake policy is calculated using the current factor-based and the proposed risk-based methods. A discussion of the differences between the two methods and possible consequences for viability of Iranian insurers is given in Sect. 5. Finally, Sect. 6 concludes the process and its findings. A reference list is also provided at the end of the paper.
The initial ideas for this research topic emerged during meetings with managers from the Central Insurance of Iran, the country's insurance regulator. These discussions focused on the necessity of using catastrophe modeling in the industry. The research process then continued with presentations to insurance executives, sharing the challenges and potential solutions identified. This paper represents the final stage of this activity, with the aim of disseminating the findings at both the regional and international levels.
The significance of natural catastrophes and their impact on the viability of insurance firms has received increasing attention over time, and the occurrence of major catastrophic events such as Hurricane Andrew (1992), the Northridge earthquake (1994), Hurricane Katrina (2005), and the 2011 Great East Japan Earthquake and Tsunami has highlighted the issue. Catastrophe losses endanger the solvency of small and medium reinsurance firms and consume the accumulated capital of well-provisioned reinsurers (Anderson, 2002). While to many, the term catastrophe is closely associated with natural hazards (e.g., earthquake, flood, and windstorm), it can also be used to address intensive damages from human-made events (Lawson et al., 2001). Catastrophe risks have different characteristics compared to non-catastrophe losses. They cause intensive and correlated losses; however they occur so rarely that historical claims data cannot be efficiently utilized to predict future losses. As a result, the insurance industry has evolved to prepare for the consequences imposed by disasters by developing risk management rules and regulations. This section provides a brief history of the regulations regarding insurance solvency capital as a risk management measure in the insurance industry, focusing on the European Solvency II regime and the solvency regulations set by the Central Insurance of Iran (CII) as the national insurance regulator. In addition, technical aspects of calculating the solvency capital requirement (SCR) in the two abovementioned regulatory systems are briefly described.
2.1 European insurance solvency regulations
In 2004, Thorburn provided a history of the difficult times that catastrophic losses created for the insurance industry and the countries' responses to these challenges in the form of developing insurance regulatory institutions and adopting solvency mandates as an effective measure to manage catastrophe risks to which insurers are exposed (Thorburn, 2004).
In general, insurance supervision aims to protect policyholders' interests by ensuring sound financial operation and proper management in the insurance business. Therefore, effective regulations must be established to evaluate insurers' liabilities adequately and determine provisions to cover these commitments. It is also necessary to consider an extra layer of protection in the form of capital margin to respond to unexpected financial shocks, e.g., catastrophic losses. That is why solvency supervision regulations were established and improved over time.
Catastrophic losses, both natural and man-made, have resulted in higher claims provisions, reduced capital power, reduced profitability, and in some cases made insurance firms insolvent. Remarkable examples of such bankruptcies are the 1906 San Francisco earthquake with 12 insurance companies declared insolvent, Hurricane Andrew in 1992 with 9 firms being bankrupt, and the 2011 Christchurch earthquakes that resulted in the ruin of 2 insurance companies (Lichtenstein, 2022).
The first steps in harmonizing Europe-wide insurance supervision were the approval of the first non-life and life insurance1 directives in the 1970s (First Council Directive, 1973, 1979). These directives required the European member states to comply with standardized solvency capital requirements. The directives were later revised by adding a second and third amendment in 1982 and 1992 (Second Council Directive, 1988; Council Directive, 1990, 1992; Directive, 1992). The entirety of these regulations, which were later named Solvency 0 (Sandström, 2019), underwent a comparative examination in the 1990s, showing that they were not sufficiently taking into account the full spectrum of risks that insurance companies were exposed to. As such, new directives (known as Solvency I) were again introduced to both life and non-life insurance in 2002 to fortify the stance of insurers in the event of catastrophic losses (Directive, 2002a, b). Both the Solvency 0 and Solvency I regulations followed a similar approach in determining the solvency capital margin, which was mainly based on factoring the gross earned premium and gross incurred claims (Sandström, 2019). However, this was only a transitional measure to incorporate a risk-based approach into the insurance solvency capital requirement regulations, as Solvency I was still inefficient in terms of asset and liability valuation and capital allocation (Rae et al., 2018). A drastic reform to solvency regulation was introduced about a decade later as the Solvency II framework.
Influenced by the then-new risk-based banking regulation Basel II (Basel Committee on Banking Supervision, 2004), Solvency II, the latest European insurance supervision regime, replaced Solvency I in 2016. This new regime provides a more comprehensive risk-based approach for determining solvency requirements for insurance undertakings. The new regulation also includes a market-based valuation system for assessing companies' assets and liabilities (Directive, 2009). With a higher degree of confidence, this can potentially reduce the risk of insurance firms becoming insolvent. In addition, the directives contribute to the standardization of insurance supervision in the European market. Solvency II encompasses three pillars, namely Pillar I, Pillar II, and Pillar III. The first pillar focuses on the quantitative aspects of solvency capital that insurers must hold to cover their risks adequately. The second pillar addresses the qualitative aspects of solvency regulation, emphasizing risk management and governance, and the third pillar aims to enhance market discipline by promoting transparency and accountability. Two types of capital requirements are represented in Pillar I: the minimum capital requirement (MCR), which is the smallest amount of capital insurance companies are required to have by law, and SCR, which enables an insurance institution to absorb significant financial shocks, giving reasonable assurance to policyholders and beneficiaries. Under the underwriting risk category, the institution can use either a standard formula or an internal model, each having pros and cons regarding the level of sophistication and SCR size. Despite all the promising features and improvements in Solvency II, it has been subject to much research since its introduction (Rae et al., 2018; Linder and Ronkainen, 2004; Kousky and Cooke, 2012; Gurenko and Itigin, 2013; Clarke et al., 2014; Baione et al., 2018; Deligiannakis et al., 2021). This research mainly focused on areas such as economic justification of the then-new solvency regime, different results obtained using the standard formula of Solvency II and internal models, a comparison between the implications of Solvency II and Solvency I, and possible improvements to the new directive.
2.2 Iranian insurance solvency regulations
The Central Insurance of Iran (CII) is the regulator of the Iranian insurance market. As one of its principal duties, CII approves and enacts decrees and directives through the High Council of Insurance (HCI) to regulate different aspects of the insurance business in Iran. Before the approval of the first directive regarding solvency capital adequacy, CII supervised the operation of Iranian insurance firms by examining monthly reports on companies' collected premiums and paid claims (Hashemi et al., 2010). As the pricing system in the Iranian insurance market was then no longer tariff-based, new regulations needed to be developed and implemented by CII to monitor the financial solvency of insurance firms. Consequently, Directive 69 was approved and enacted by HCI in 2011, which required insurance firms to put aside factor-based solvency capital for four categories of risks: insurance, market, credit, and liquidity (High Council of Insurance, 2019). The directive also recognized market value (compared to book value) as the correct method of valuing one's own funds in the accounting system. This regulation, which is still in place, represents five classes of solvency. A company belongs to the first solvency capital level when it keeps solvency capital equal to or greater than the solvency capital margin (SCM). Should an insurance company fail to maintain a sufficient solvency margin, it enters levels 2 to 5 depending on the capital deficit. At level 5 of solvency, CII can officially cancel the business license of the insolvent firm. For natural catastrophe policies (fire, engineering, automobile, and life), the SCM is the larger of gross earned premium and gross incurred claims, each multiplied by a fixed risk factor (similar to Solvency 0). These fixed factors are calculated based on an assessment carried out on the financial statements of Iranian insurance firms and the financial time series of the Iranian real estate and stock market. The computed solvency capital of the named risks are ultimately combined, assuming zero correlation between risks, to form the company's SCM. Directive no. 69 was reviewed by Shahriar et al. (2016) and a number of improvements such as changing the risk metric to value at risk (VaR), using a 99 % confidence level for calculating SCM, and considering linear correlation for different risks were suggested.
This section describes the theoretical framework of the quantitative comparison between the methods for calculating earthquake risk solvency in the Solvency II directive and Directive 69 of the Iranian insurance regulations. In doing so, mathematical formulations are detailed for both methodologies, encompassing the selection of risk metrics, risk factors, and implementation of the risk diversification effect. Then, as a pre-requisite for calculating the solvency capital, components of a stochastic earthquake risk model for Iran are outlined, covering seismic hazard, vulnerability, exposure, and financial calculation models. The introduced earthquake risk model estimates the 99.5 loss percentile and average annual loss (AAL) of earthquakes in Iran as inputs for the Solvency II formulas. As inputs for Directive 69, the conventional earthquake risk pricing table of the industry is utilized.
A hypothetical portfolio of 1500 residential dwellings evenly distributed between three main construction types (steel, reinforced concrete, and masonry) and across five provincial capital cities (Tehran, Esfahan, Tabriz, Ahvaz, and Kerman) has been considered to compare the earthquake risk solvency charge calculated by each methodology. The reason for selecting these capital cities is that they are located in various seismicity zones and contain different construction type compositions. This allows us to consider the effect of diversification in the comparison process.
3.1 Calculation of earthquake solvency capital
3.1.1 Directive 69
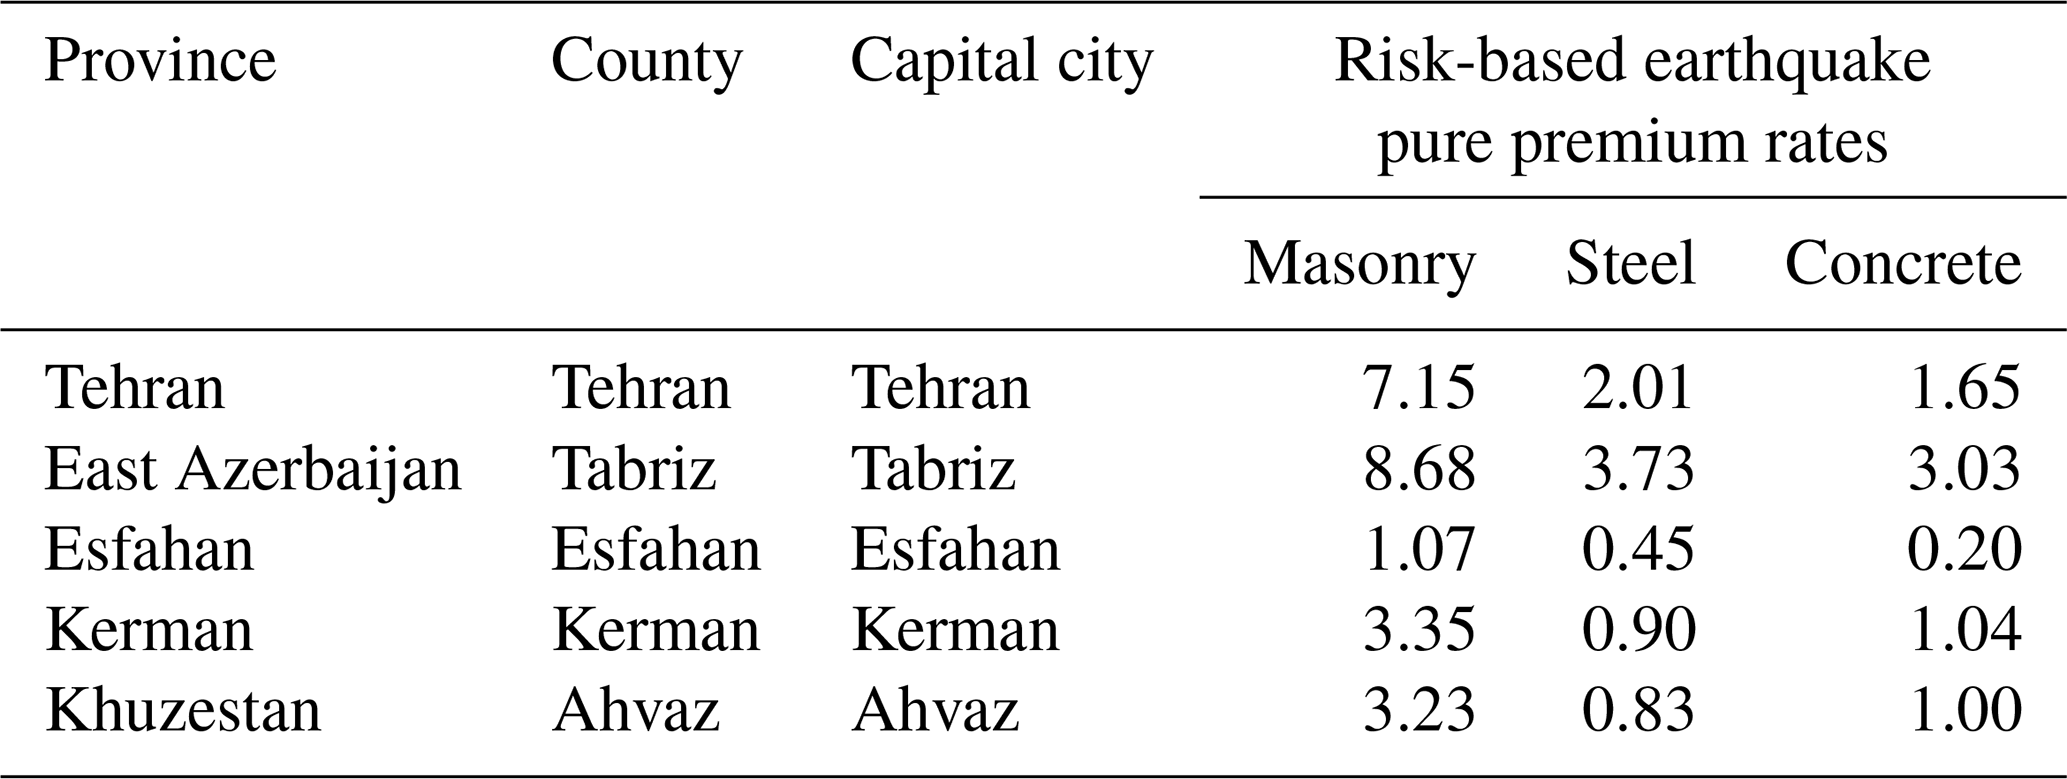
The High Council of Insurance (2019) requires insurance and reinsurance institutions to hold eligible funds as solvency capital using fixed factors determined for different types of risks, namely underwriting, market, credit, and liquidity risks. The directive provides risk factors for miscellaneous lines of business, including catastrophe fire insurance (non-life) without any distinction between various natural catastrophes in terms of fixed risk factors and assumes zero correlation between risks in different lines of business and locations (meaning that losses are deemed fully independent). According to this directive, to calculate the solvency charge of a property catastrophe portfolio, first, the products of gross earned premiums and gross incurred claims with their corresponding risk factors (0.580 and 0.841, respectively) are computed, and then the largest of these values is considered the solvency capital. Since no reliable information on the gross incurred earthquake loss claims was available to us at the time of writing this paper, we only use the term determined by gross earned premiums. Thus, average values of earthquake premium rates of five Iranian insurance firms, which were extracted from a popular Iranian insurance quote aggregator website (https://Azki.com, last access: 23 August 2022), were employed to calculate the premium-based part of the formula for the portfolio. These rates are still based on a study conducted by Ghafory-Ashtiany (1991), who determined the relative riskiness of different construction types in various seismic zones in Iran (see Table A1). Table 1 presents average market earthquake insurance premiums for masonry, concrete, and steel buildings of 10 years of age in five provincial capital cities. It seems that the rates provided do not accurately reflect the building class vulnerabilities and seismic risk profiles of the cities mentioned. An appropriate approach is to leverage catastrophe risk modeling to determine more reasonable premium rates, which is addressed in the following sections of the paper.
Table 1Market earthquake premium rates (per mille) for different building types in various provincial capital cities in Iran.
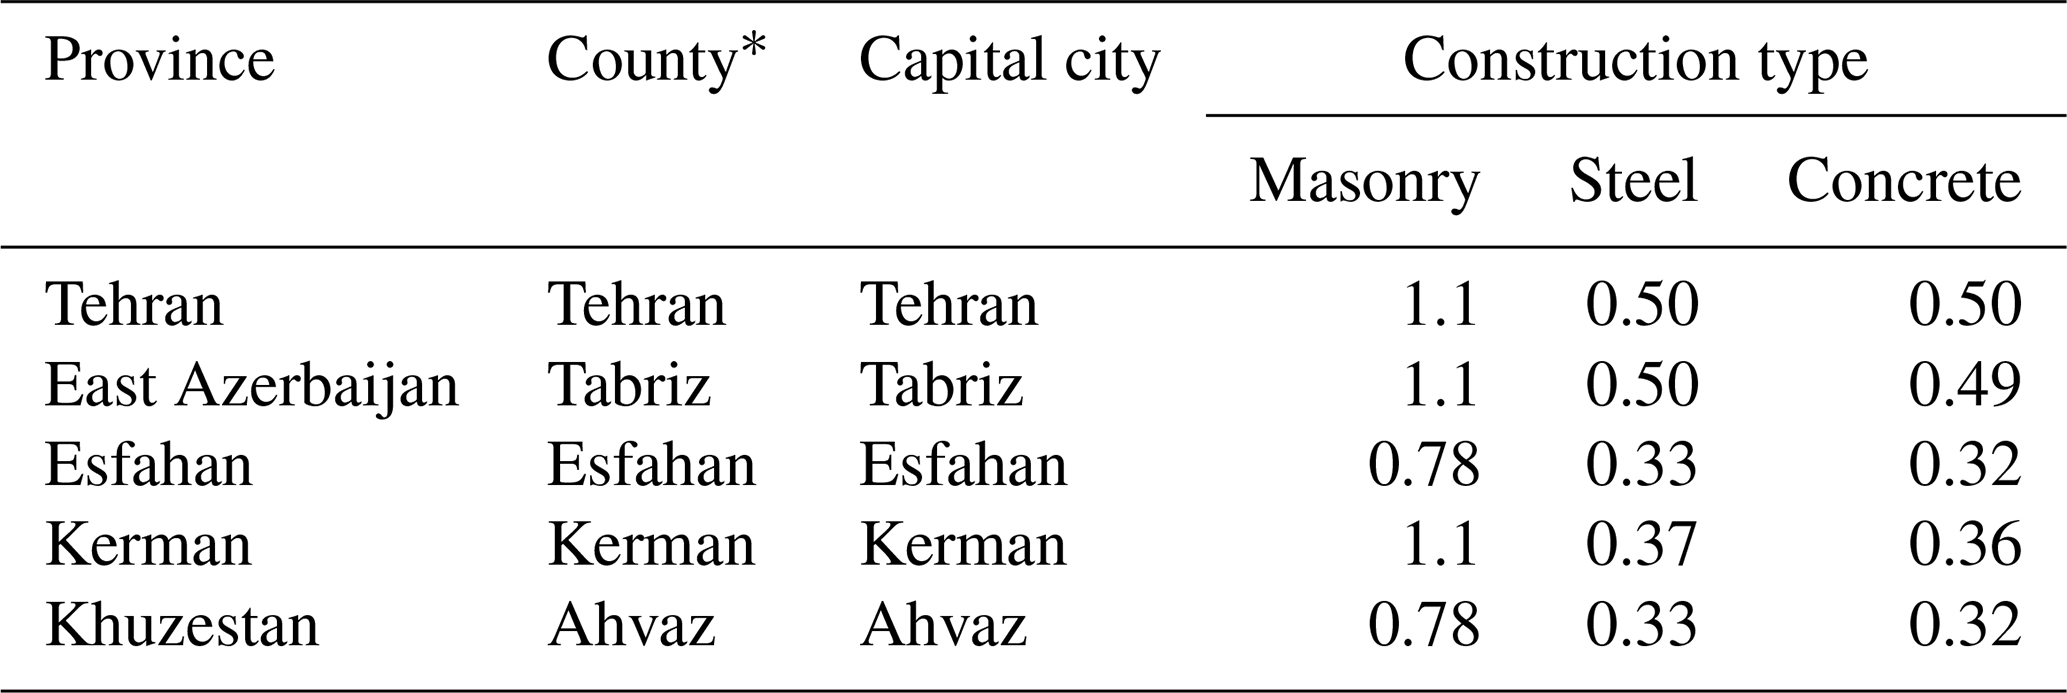
* County or shahrestan is a second-order administrative division in Iran.
It should be noted that we have selected these cities as being representative of different seismic zones in Iran: Tehran and Tabriz in the highly seismic Alborz zone in northern Iran, Esfahan in the low-seismicity central area, Khuzestan in low-seismicity southwestern Iran, and Kerman in the medium-high seismic zone of Zagros.
3.1.2 Solvency II
As outlined in Annex IV of Directive 2009/138/EC (2009) and the Committee of European Insurance and Occupational Pensions Supervisors (CEIOPS; 2010) on the application of natural catastrophe standardized scenarios (standard formula), to calculate earthquake charges, the weighted total value insured (WTIV) should be computed at the CRESTA2 level using the total insured value3 (TIV) for each line of business. Equation (1) presents the mathematical formula of this stage (Directive, 2009; CEIOPS, 2010).
Since the 99.5 % VaR as the risk factor is provided at the country level in CEIOPS (2010), a relativity factor (FZONE) takes the role of adjusting the national risk factor at the sub-national (CRESTA) level in the standardized scenario. The catastrophe capital charge (CATperil−ctry) is then calculated by applying the effect of the geographical aggregation of WTIVs of different CRESTA zones within the country of interest multiplied by QCTRY (the 1-in-200-year risk factor of earthquake at the country level). Equation (2) illustrates the calculation of solvency capital required for earthquake risk at the country level.
where WTIVZONE is the array presentation of WTIV within the country of interest and (WTIVZONE)T is its transposed form. AggMat is basically a correlation matrix determining how different CRESTA zones are correlated with each other in terms of experiencing simultaneous earthquake loss, and it comprises elements of 1 (fully correlated), 0.5 (semi correlated), 0.25 (slightly correlated), and 0 (no correlation). CEIOPS (2010) provides sub-country correlation matrices for European Economic Area (EEA) countries in an Excel spreadsheet.
To follow the procedure proposed by the Solvency II directive to calculate the catastrophe charge for earthquake risks in Iran, we use the output of a stochastic earthquake risk model developed in this study, presented separately in Sect. 3.2. This catastrophe model can produce risk results (e.g., AAL or 1-in-200-year loss) at finer administrative levels than CRESTA can. In accordance with local underwriting and risk management practice in Iran, we use the county-level resolution to calculate the solvency capital. Therefore, there is no need to use a relativity factor for TIV at the county level since we already have the Q factor for each county. That said, we can rewrite Eq. (1) to Eq. (3) as follows:
Here, we can directly calculate each county's catastrophe charge for earthquake risk. Following that, we aggregate these charges at the provincial and then the country level to determine the total solvency capital for a given portfolio of earthquake risks. Equations (4) and (5) exhibit the mathematical form of these calculations.
The symmetric aggregation matrices for province and country levels are constructed using 1 (fully correlated), 0.5 (semi-correlated), 0.25 (slightly correlated), or 0 (non-correlated) members. It is assumed, mainly considering the distance factor, that each county is fully correlated with itself and semi-correlated with its neighboring counties. In the case of provinces, due to the larger size, the neighboring provinces are assumed to be slightly correlated.
3.2 Modeling the earthquake risk in Iran
As a prerequisite for using a risk-based methodology in calculating the earthquake risk capital charge, for example, the method described by the Solvency II directive, it is necessary to have a stochastic catastrophe model for quantifying the required percentile of confidence of seismic losses (here, 99.5 %) at different locations and for various construction types. Section 3.2.1 explains how we developed an earthquake risk model for Iran utilizing the most reliable methodologies and the highest quality of data. The subsection describes the risk model components: the calculation platform, seismic hazard model, residential building exposure model, and vulnerability functions. Because this paper's main objective is to compare solvency capital calculation methods, efforts were made to keep the risk model development description as brief as possible.
The common practice for quantifying natural catastrophe risks in the insurance industry is (event-based) stochastic catastrophe modeling. The process incorporates three main components, hazard, exposure, and vulnerability, using a Monte Carlo simulation method to generate loss results. Loss results are then post-processed to calculate risk parameters such as average annual loss (AAL) and loss exceedance probability (EP) for the specific level of confidence that is employed by underwriting and risk management teams in the industry. The practice of modeling seismic risk in Iran is rather in its early stages and few studies have been conducted on catastrophe modeling over the last decade (Ghafory-Ashtiany and Nasserasadi, 2012; Pakdel-Lahiji et al., 2019; Motamed et al., 2019; Shahbazi et al., 2020; Bastami et al., 2022). In this study, the open-source OpenQuake platform developed by the Global Earthquake Model (GEM) foundation was utilized to perform the seismic risk modeling due to its recognition in the insurance market and its flexibility in terms of input data and generation of required risk parameters.
3.2.1 Seismic hazard model
After reviewing several available studies on the seismic hazards of Iran (Motamed et al., 2019; Mirzaei et al., 1997; Tavakoli and Ghafory-Ashtiany, 1999; Yazdani and Kowsari, 2013; Şeşetyan et al., 2018; Lotfi et al., 2022; Pagani et al., 2020), the Earthquake Model of the Middle East (EMME; Şeşetyan et al., 2018) was selected due to the availability of its OpenQuake-ready input data and credibility of the studies in the earthquake engineering community. The EMME seismic model comprises two models for line and area sources, prepared in collaboration with seismologists from Iran, the Middle East region, and Europe. In this study, only seismogenic sources within Iran and 300 km beyond its borders have been considered. Figure 1 illustrates the delineation of seismogenic zones and active faults used in the input seismicity model.
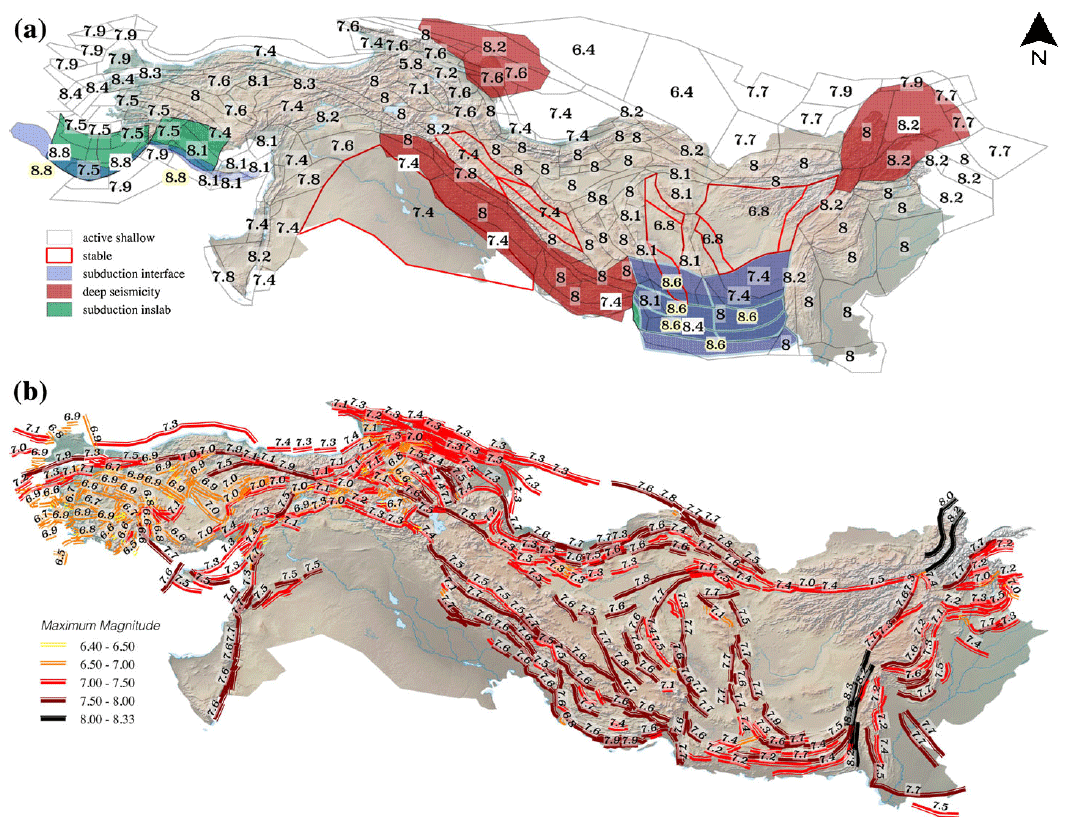
Figure 1Seismogenic sources of the EMME project used in the seismicity model: area sources (a) and fault sources (b). Original maps from Danciu et al. (2018).
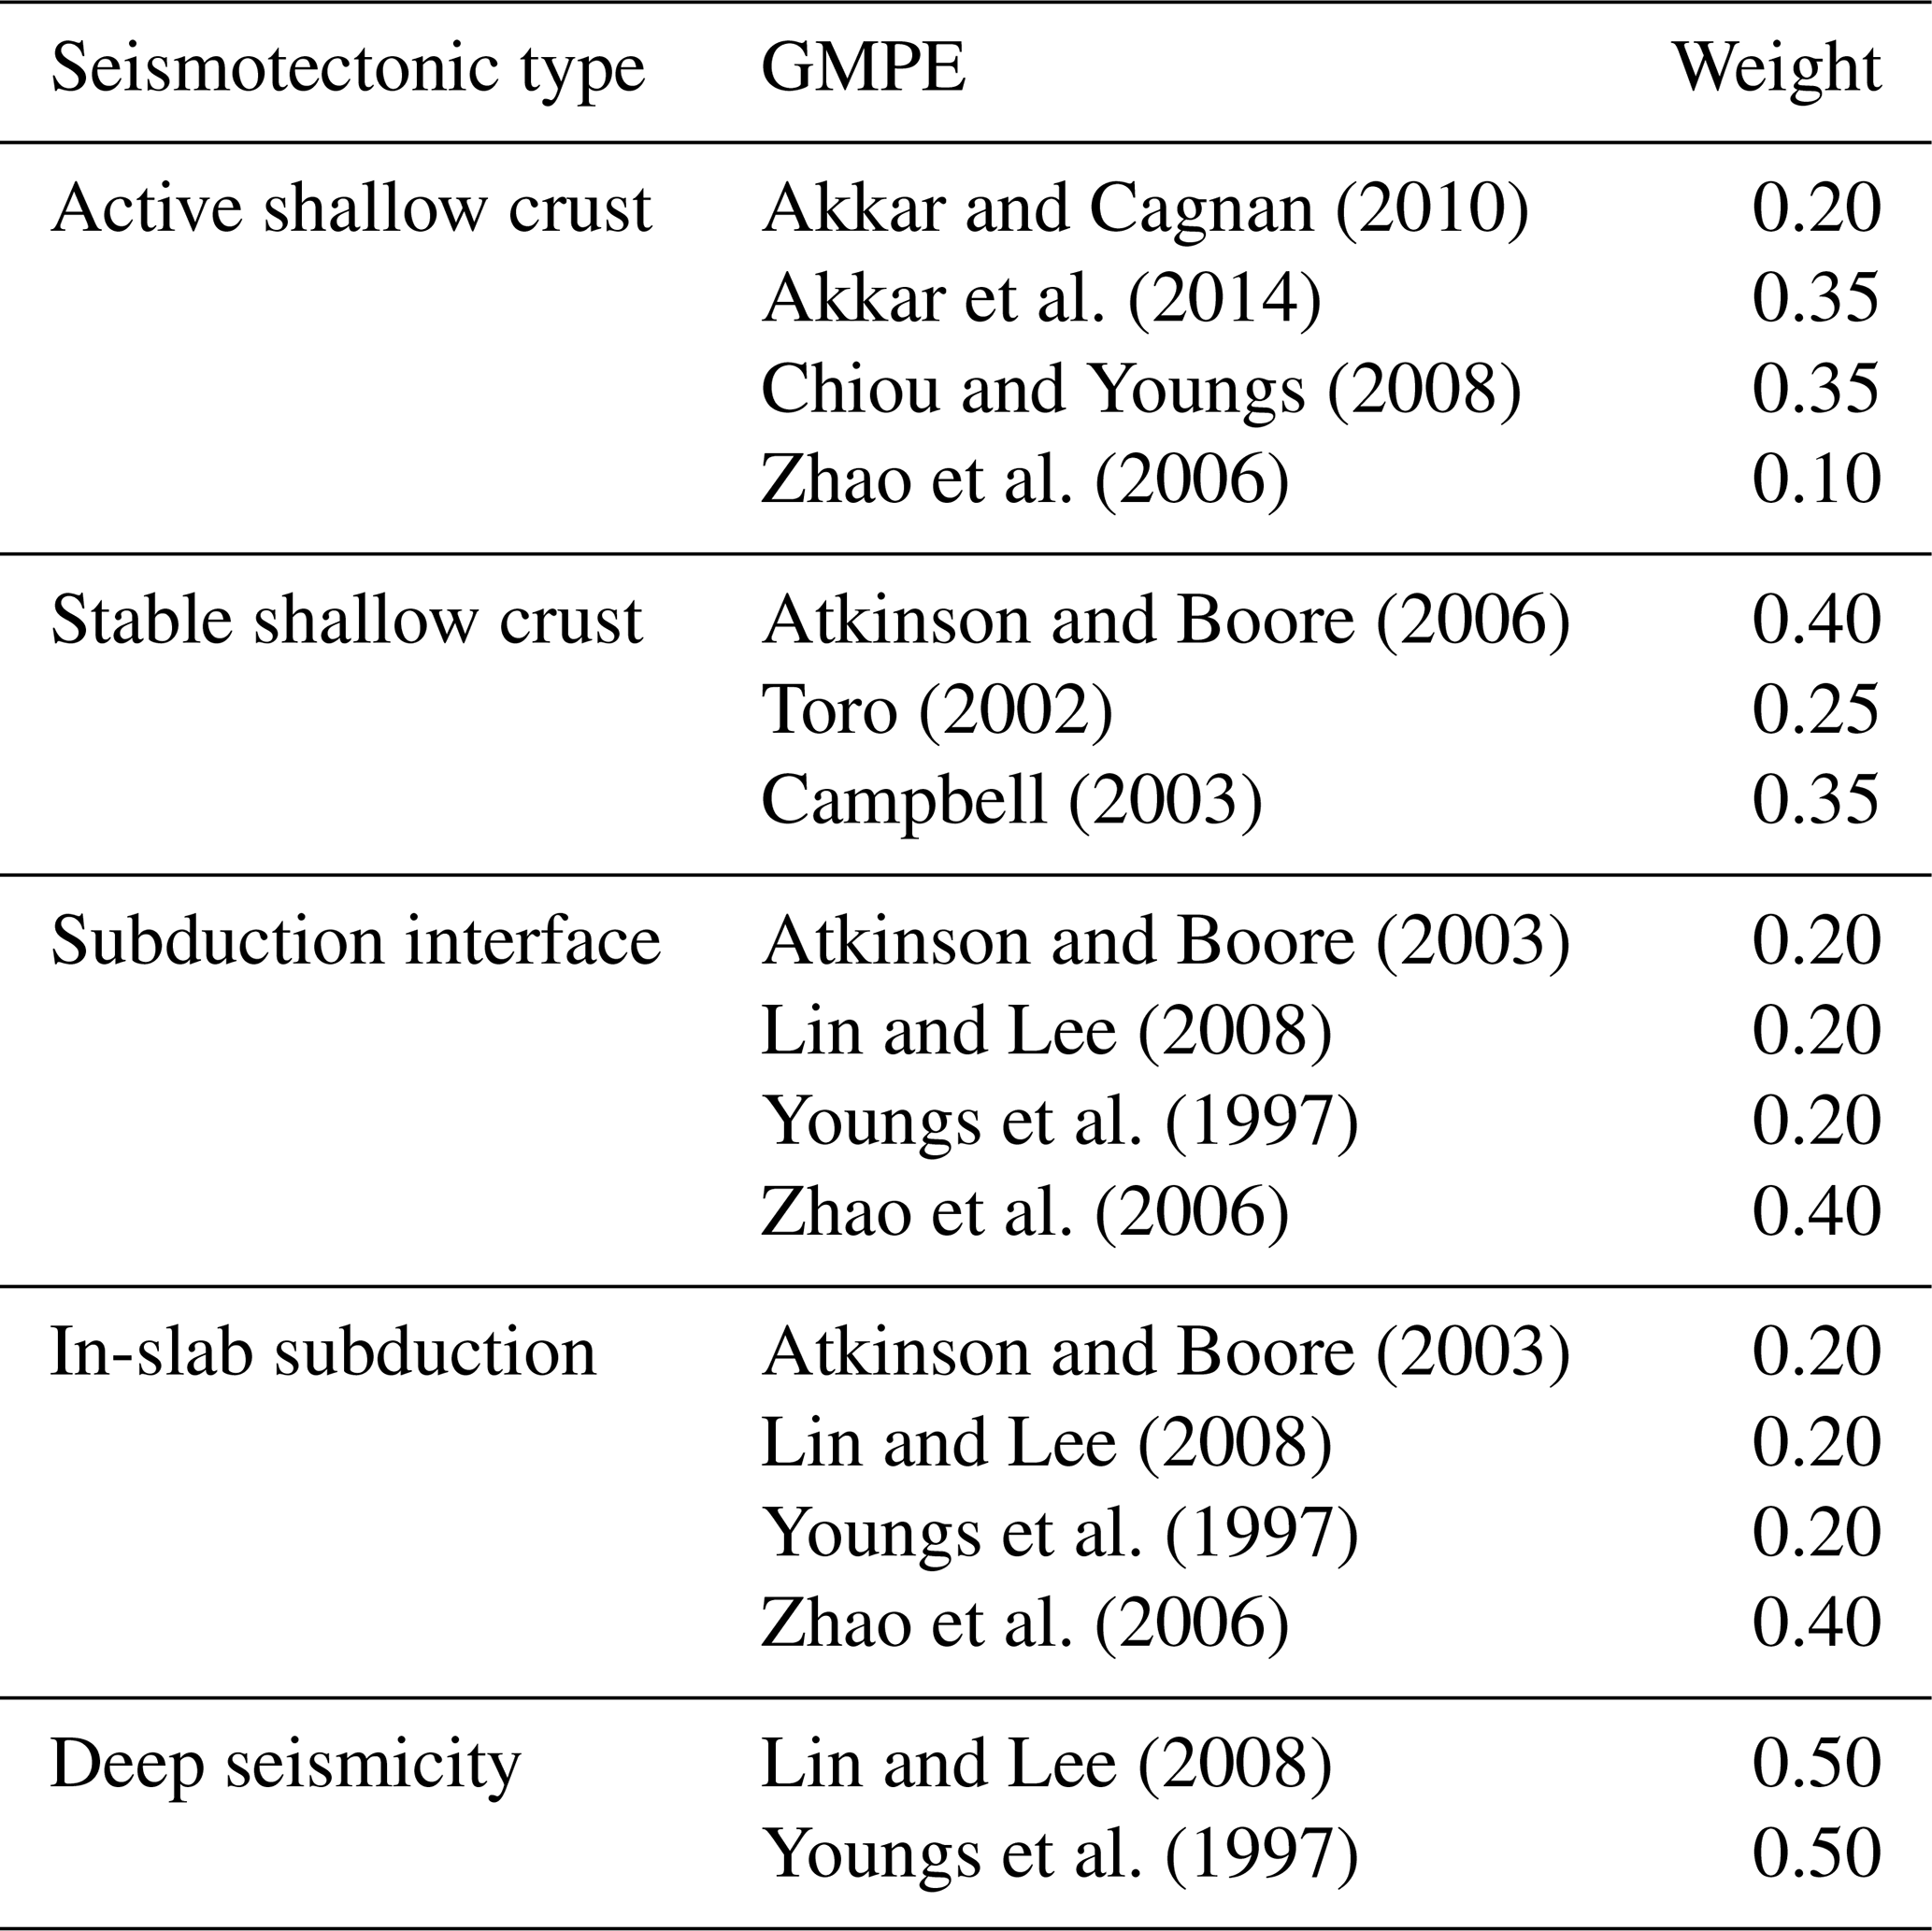
In addition, a set of ground motion prediction model equations (GMPE) for different seismotectonic characteristics in Iran (including active shallow crustal, stable shallow crustal, subduction, and deep seismicity sources), and two logic trees for treating epistemic seismic hazard uncertainty were utilized to calculate the ground motion intensity parameter (PGA) at exposure locations. Table 2 shows the structure of the GMPE logic tree and the attenuation relationships that were employed in the hazard model. A minimum magnitude of 5 was used in the analysis due to its impact on building damage and to optimize the computational demand. These are the same settings suggested in the EMME project; however, we used a more recent version of the GMPEs whenever possible.
Table 2GMPEs used in the hazard model and their corresponding weights.
To convert bedrock ground motion intensity to ground-level PGA, a soil model (shear velocity distribution) based on methodology suggested by Allen and Wald (2009) was used. Using the components adopted, an event-based probabilistic seismic hazard analysis was carried out using the GEM OpenQuake engine (Pagani et al., 2014), and 20 000 years of seismicity were simulated. Figure 2 illustrates the peak ground acceleration (PGA) distribution on the bedrock with an equivalent return period of 475 years in Iran, based on averaging several realizations of PGAs.
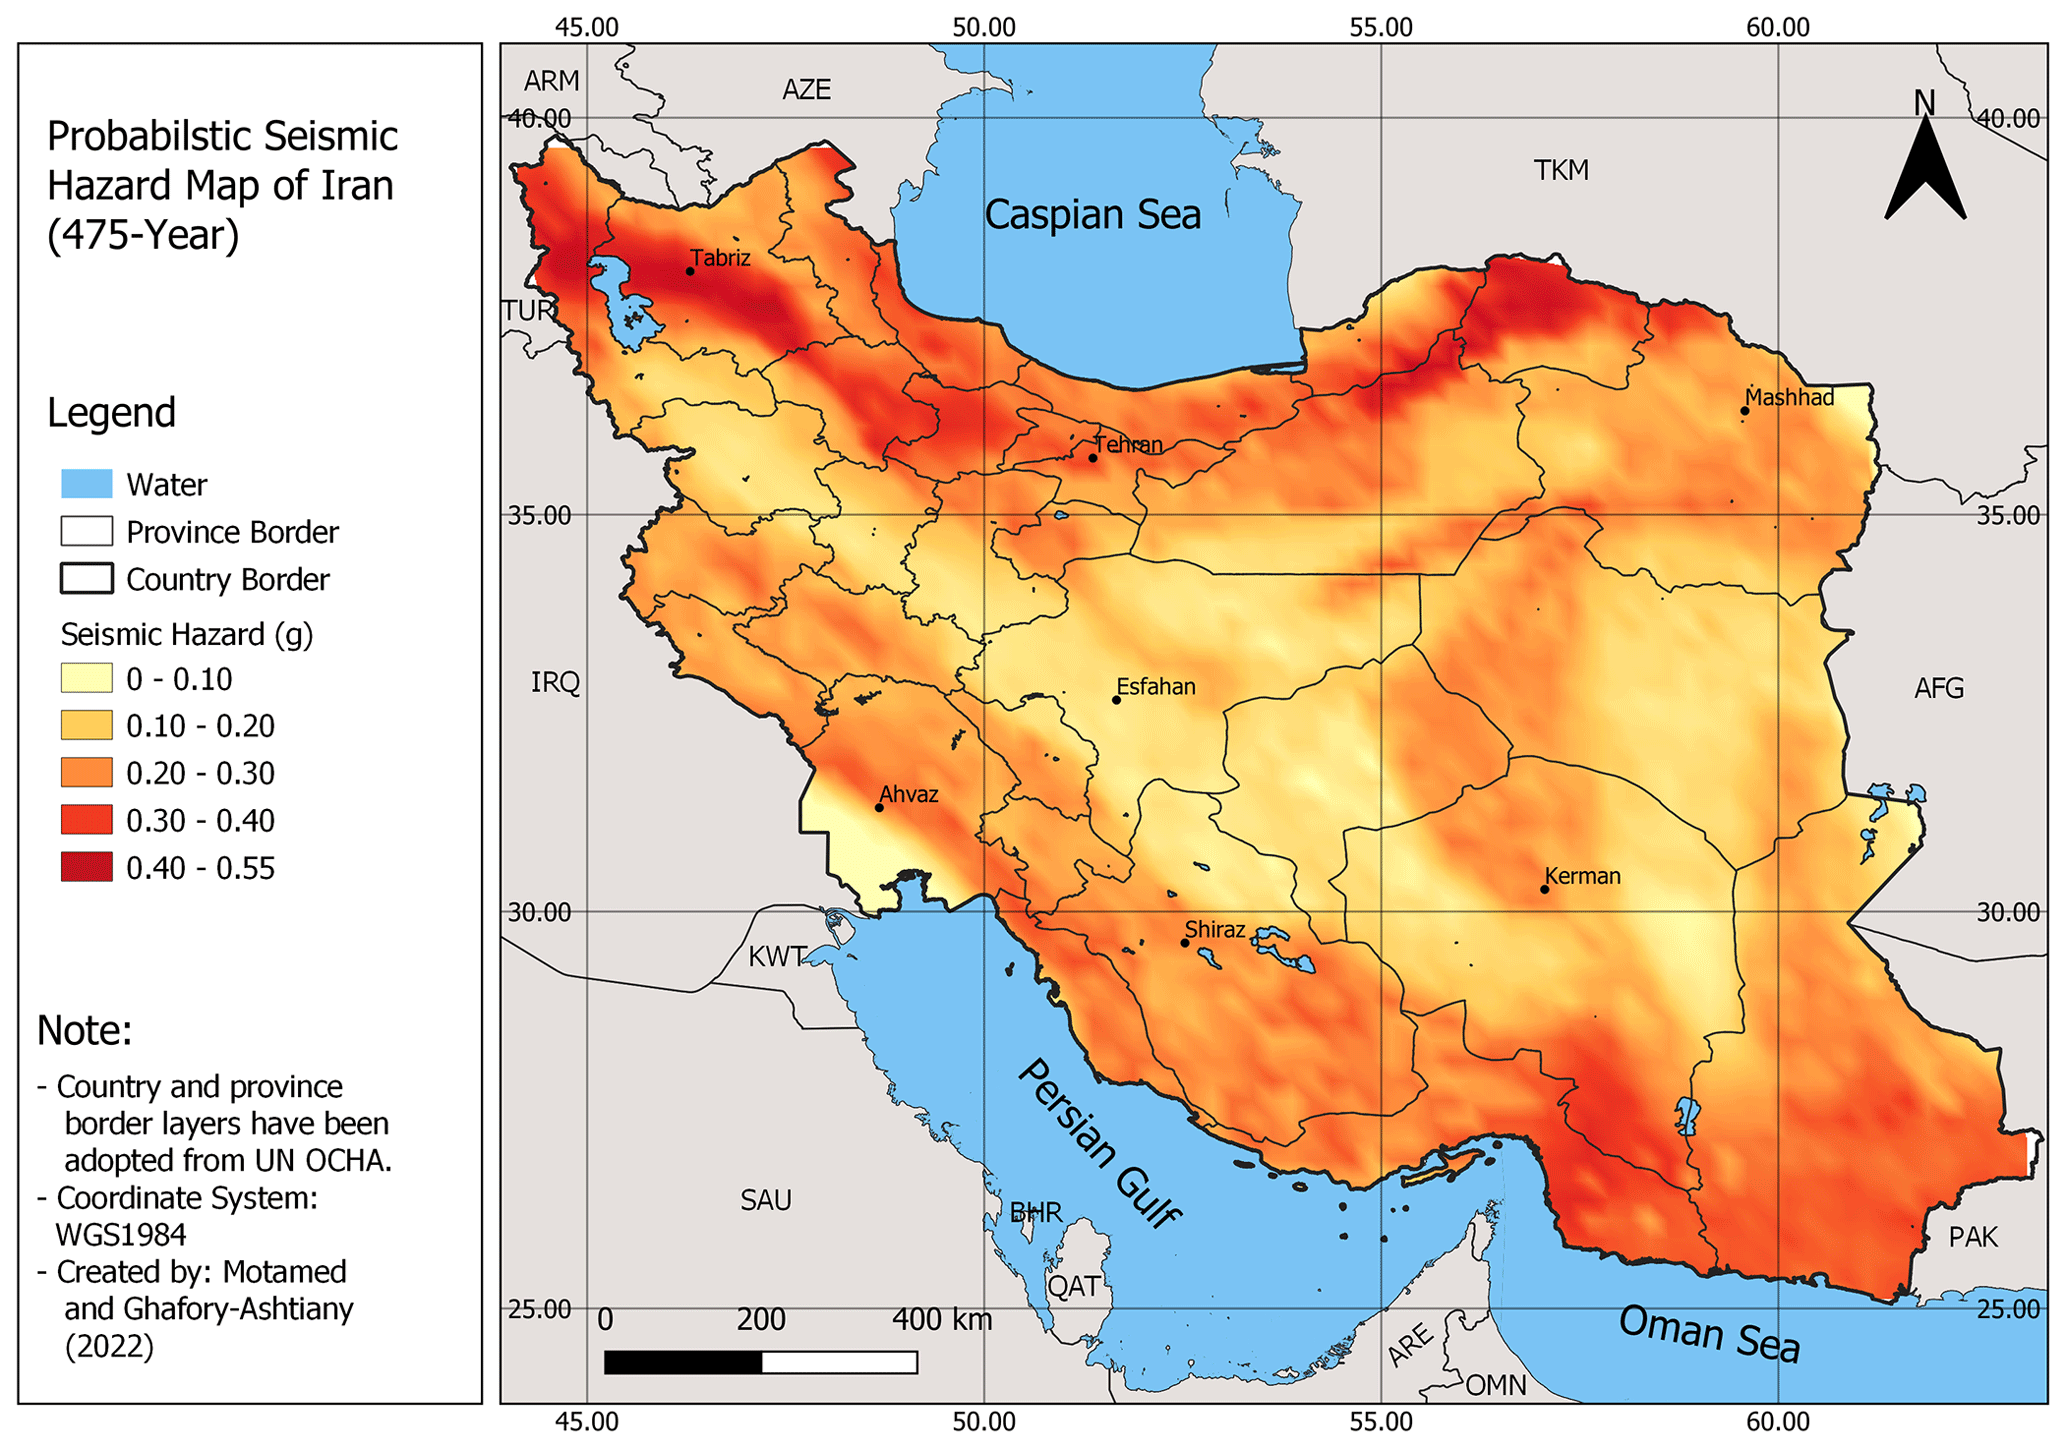
Figure 2Spatial distribution of hazard parameters (PGA) of the 475-year return period.
As seen in Fig. 2, the northern part of the country (the Alborz and Koppeh Dagh seismotectonic zones) including the cities of Tabriz and Tehran and southeastern regions (the central Iran and Makran zones) containing the city of Kerman show the highest levels of seismic hazard. In the Zagros zone in western–southwestern Iran, the PGA level is lower than in the northern and southeastern parts but is still high. On the other hand, the province of Esfahan in central Iran and southwestern parts of Khuzestan in southwestern Iran contain zones with the lowest PGA levels. The sharp contrast in PGA values in Khuzestan is due to the lack of seismic events and active faults in this region, which has been smoothed using the inverse distance-weighted (IDW) method. Other regions fall between these upper and lower seismicity limits.
Attention should be paid to the fact that this study has been carried out at the national level; therefore, the resolution is coarser than more-accurate local studies, and both the distribution and intensity of PGAs might be different to such works. To validate the results of the hazard model, we compared our results to some recent seismic hazard analysis studies conducted at national or regional levels for Iran in recent years, including Lotfi et al. (2022), Lloyd's and CAT Risk Solutions (2017), and Şeşetyan et al. (2018). Table 3 summarizes the results of seismic hazard analysis (10 % probability of exceedance in 50 years equal to a 475-year return period) for these studies and the present work.
Table 3Comparison of the seismic hazard analysis results in this research with other studies.
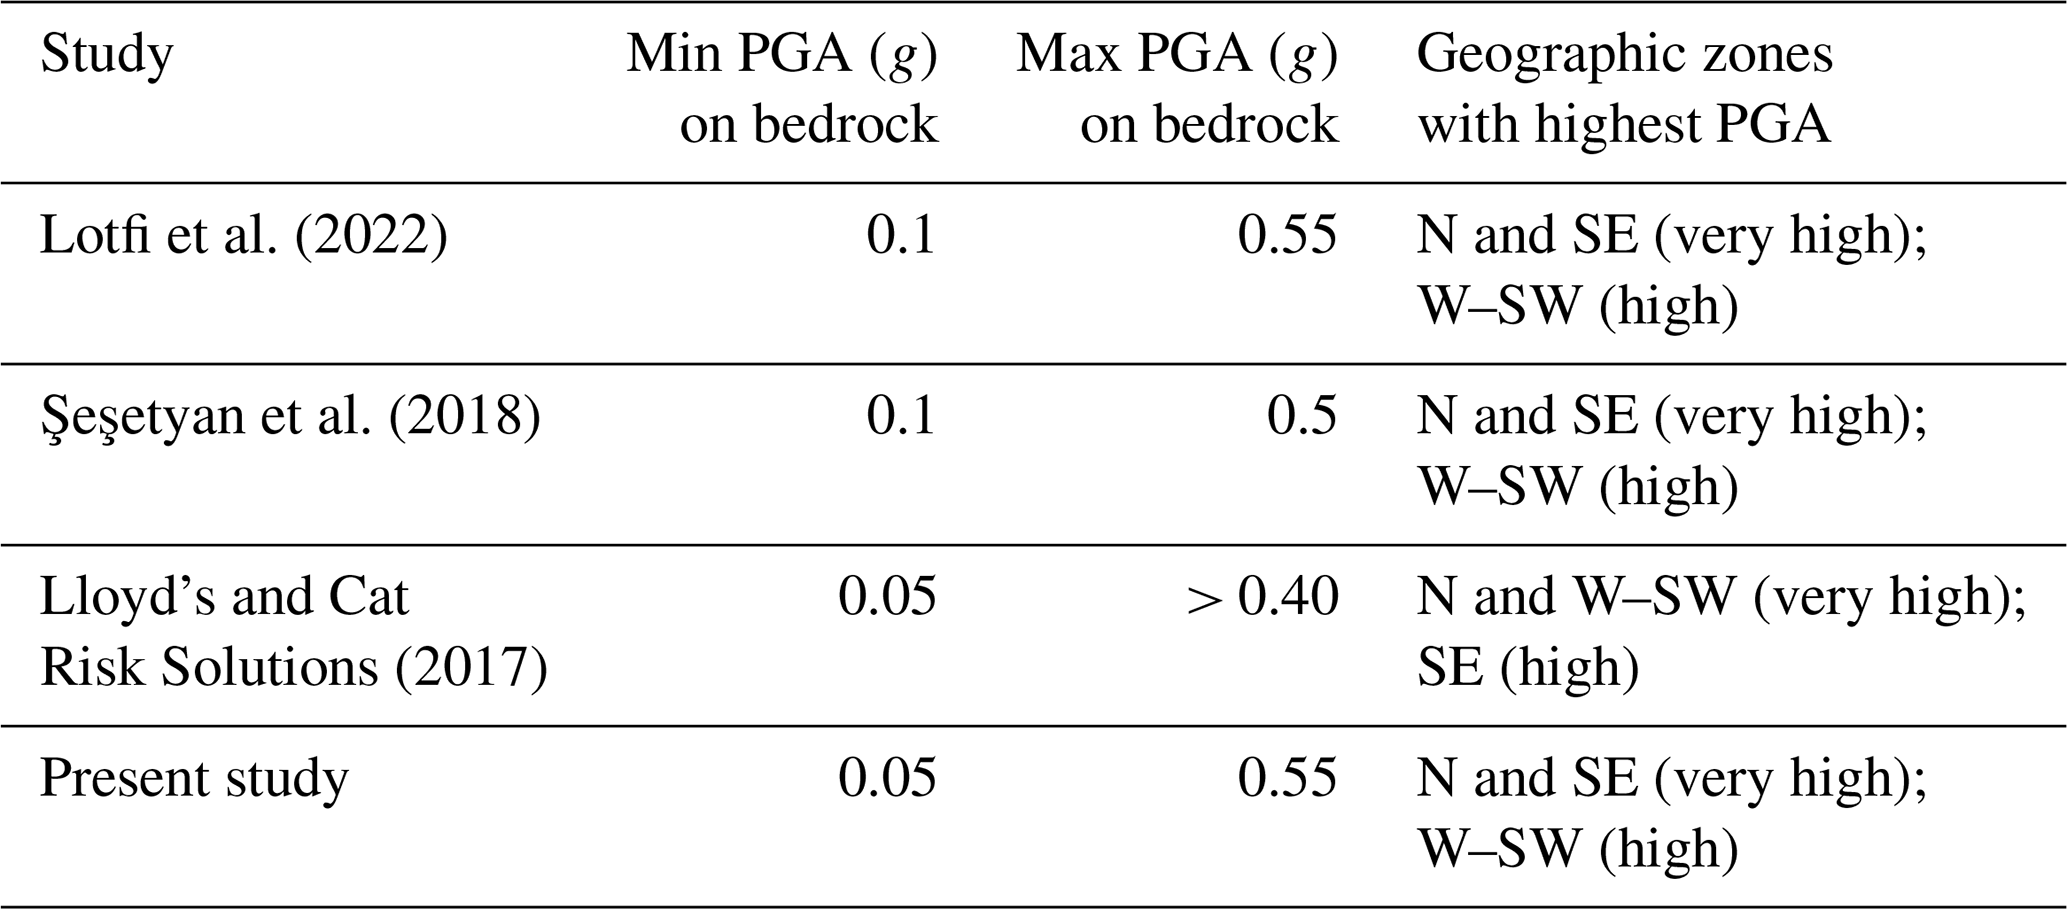
As seen, there is an acceptable similarity between the range of 475-year PGAs and spatial distribution at the national level.
3.2.2 Vulnerability model
To estimate the damage ratio of exposed assets under a given earthquake scenario with known intensity parameters (in this study, PGA), it is necessary to use vulnerability functions. These are typically functions or curves that relate various levels of hazard intensity to damage ratios or percentages for specified types of groups of assets (vulnerability classes). In this study, the vulnerability curves developed by Mansouri and Amini-Hosseini (2013) as one of the components of the Earthquake Model of the Middle East (EMME) project (Şeşetyan et al., 2018) were used due to the credibility of the methodology used (Mouroux et al., 2008), consistency with building attributes publicly available for Iranian buildings (see Sect. 3.2.3), and compatibility with past earthquake losses in Iran. In this study, 10 building vulnerability classes were defined based on construction material, height of the building, and construction date as a proxy for the ductility of the structure to earthquake loads. Table 4 summarizes the vulnerability classification of Iranian buildings based on their physical attributes.
Table 4Classification of Iranian building vulnerability based on physical attributes (Mansouri and Amini-Hosseini, 2013).
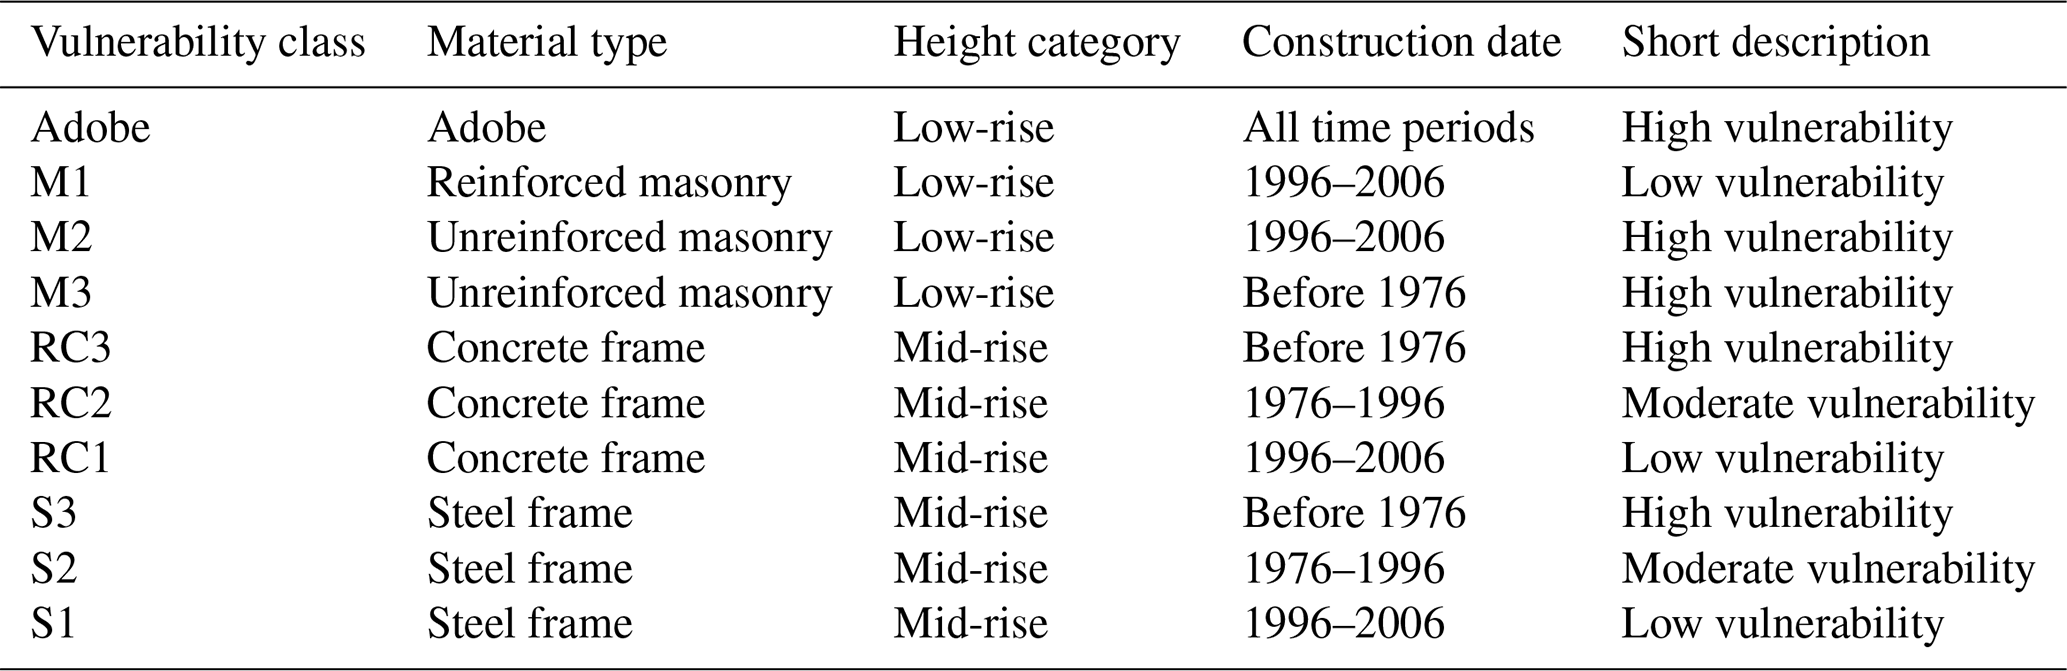
Since the newest buildings at the time of conducting this study were built in 2016, we shifted the original vulnerability (Table 4) by 10 years to pre-1986, 1986 to 2006, and post-2006. This is a valid modification because buildings have become 10 years older since the publication of the original paper, and since then a new version of the Iranian standard for seismic design of buildings came into force in 2014. These classes and their corresponding vulnerability curves represent the seismic vulnerability of 10 building classes: adobe (one class), masonry (three classes), steel (three classes), and reinforced concrete (three classes). Figure 3 exhibits examples of these curves for different types of buildings with medium-quality construction. The terms am, mm, rcm, and sm in this figure stand for medium-quality adobe, masonry, reinforced concrete, and steel buildings, respectively.
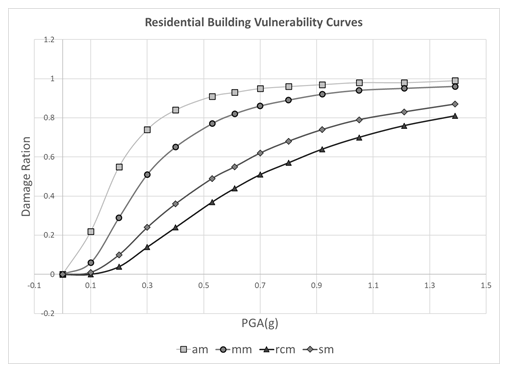
Figure 3Vulnerability curves for medium-quality adobe (am), masonry (mm), reinforced concrete (rcm), and steel (sm) buildings (Mansouri and Amini-Hosseini, 2013).
As shown in this diagram, adobe is the most vulnerable class of building to earthquakes, while reinforced concrete and steel buildings offer the highest resistance to seismic loads. Masonry buildings fall between these two ranges. Also, buildings with older dates of construction are considered more vulnerable to seismic forces.
3.2.3 Residential building exposure model
The exposure model provides attributes of the buildings at risk, such as physical attributes (material type, year built, and height of the building), their monetary value, and their geographic locations in terms of, for example, geographic coordinates. The Iranian census data classify the building materials into three main classes: steel, reinforced concrete, and masonry. The masonry class is furthered split into brick and steel or stone and steel, brick and wood or stone and wood, cement block (all kinds of roofs), all brick or brick and stone, and all wood. In this study, we only consider residential buildings because their attributes are collected on a regular basis in the national population and housing census and reported by the Statistical Center of Iran (SCI) every 5 years. The date of construction is expressed in 10-year, 5-year, and 1-year bins depending on the age of buildings since 1966. The census data are freely available at the SCI website at the county level. Due to the fact that the census data have not been updated since 2016, we have used 2016 datasets to develop the exposure model. Figure 4 illustrates common types of Iranian residential buildings in the city of Tehran.
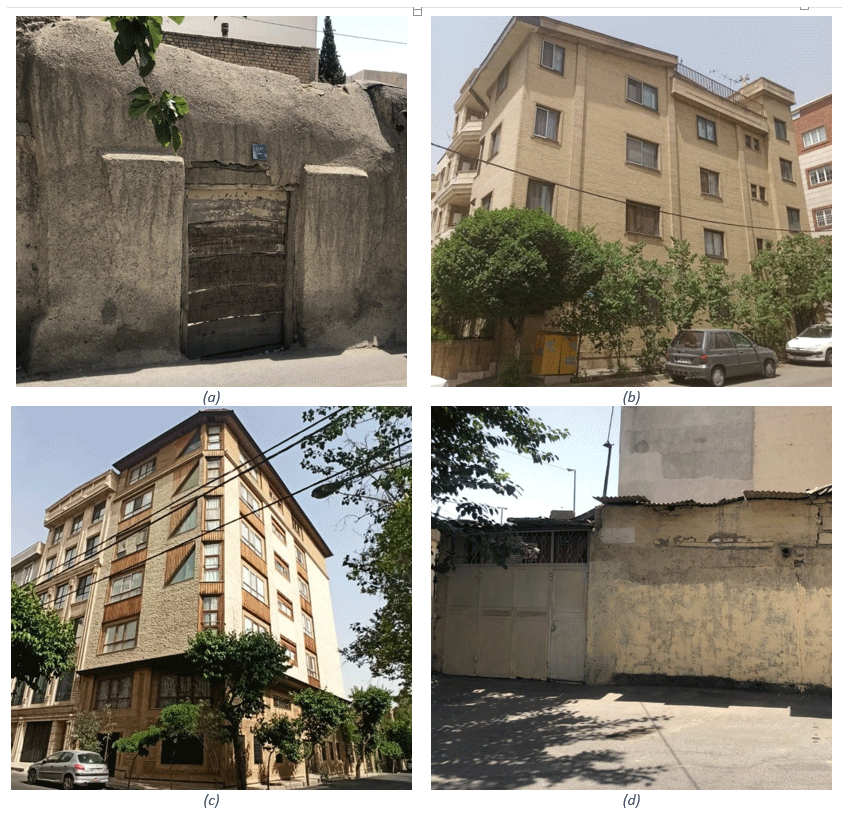
Figure 4Examples of common residential buildings in Tehran: adobe (a), steel (b), reinforced concrete (c), and masonry (d). Photos by Niloofar Kazemi Asl.
Until 2011, SCI reported four sets of building attributes, namely building material, construction date, and number and build area of dwellings split by building types and year built. We used the same vulnerability classes introduced by Mansouri and Amini-Hosseini (2013) as exhibited in Table 3 so that they are consistent with adopted vulnerability curves. Because census data from 2016 lacked the attribute building age, we used the previous census data (2011) age attribute and updated it by making the assumption that if the number of dwellings decreased between the 2011 and 2016 censuses in a given county, the reduction would be due to destruction of buildings belonging to the oldest age bin, and if the number increased, that would be because of newly built buildings affiliated with the newest age bin. This assumption is compatible with the reconstruction trend of buildings and settlement development in Iran.
No national dataset on the number of stories or height of the buildings is available in Iran. As a results, we assumed a low-rise height class for adobe and masonry buildings and mid-rise class for steel and reinforced concrete buildings in Iran based on an engineering judgment. An estimate of the construction costs of residential buildings can be obtained from builders in different provinces. The value of existing buildings can also be estimated by depreciating the value of the newly constructed buildings based on the date of construction or building age bins in the vulnerability model. Based on the research conducted, the average cost of construction per square meter in Iran in 2016 was USD 300. Using the data on build area and number of dwellings, we estimated an average building surface area of about 100 m2 for Iranian dwellings.
After creating the datasets for 10 building types at the county level, we used population data from LandScan (Bright et al., 2017) with a 30 arcsec resolution to downscale the county-level building exposure data to a finer resolution for loss calculation purposes. To accomplish this, we divide the number of dwellings of each building type by the total populations of the county to compute the number of dwellings per person, then we multiply the results by the population in each cell to come up with the number of dwellings in that cell. The process is repeated for all types of building for each county. Figure 5 presents the spatial distribution and monetary value of different residential dwelling building types in Iran at the county level. Please note that numbers are the absolute values of each building type at the county level.
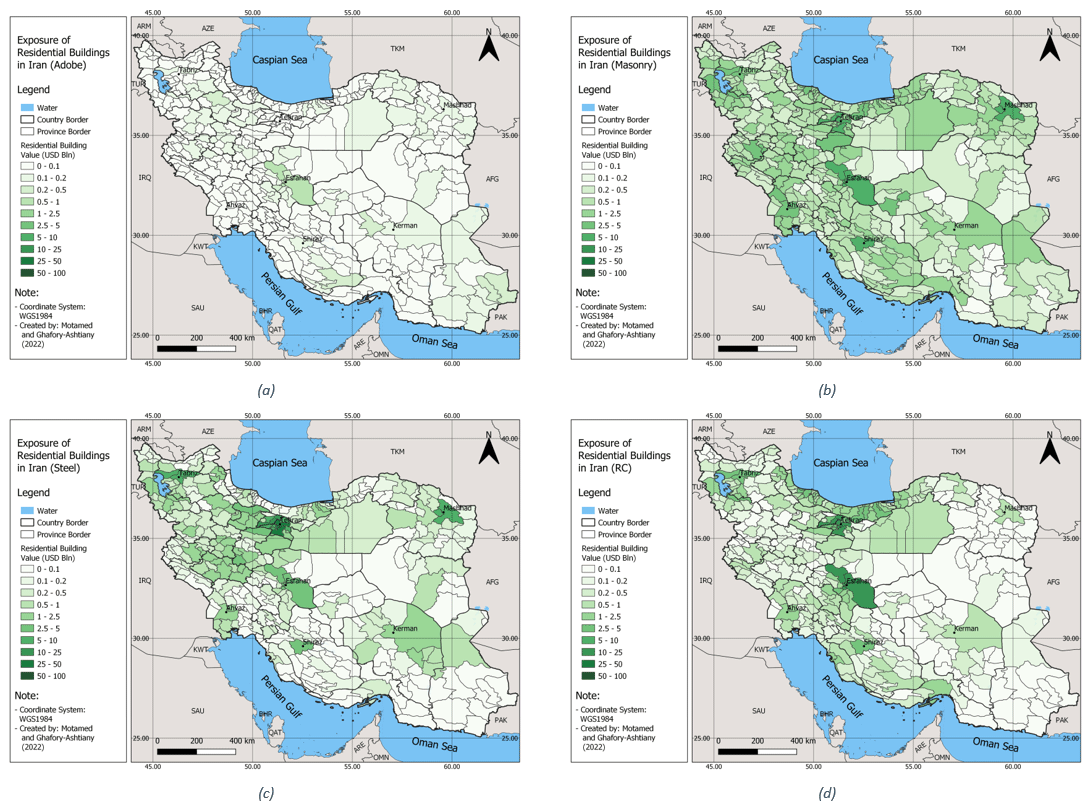
Figure 5Exposure of residential buildings in Iran: adobe (a), masonry (b), steel (c), and concrete (d).
From a holistic point of view, most residential buildings are concentrated around the highly populated capital cities of Tehran, Tabriz, Esfahan, Mashhad, and Shiraz, which is consistent with the results of the 2016 housing and population census that ranked the provinces of Tehran, Esfahan, Razavi Khorasan (including Mashhad city), Fars (including Shiraz), Markazi (containing Arak), Khuzestan (including Ahvaz), and east Azerbaijan (including Tabriz) as the largest residential built areas. As observed in Fig. 5a, the counties with the highest number of adobe buildings (the most vulnerable type) are Esfahan (center of Iran), Fars (south), Kerman (east) and Sistan and Baluchestan (southeast). Also, masonry buildings, the second-most vulnerable building type, are almost as common across the country, with a more visible presence around the capital cities of Tabriz, Tehran, and Mashhad in the north; Esfahan in the center; Shiraz in the south; and Ahvaz in southeast (see Fig. 5b). The two more-earthquake-resistant building types, namely steel and reinforced concrete, are more frequent around the capital cities of Tehran and Tabriz, followed by Esfahan, Mashhad, and Shiraz. According to statistical analyses of the exposure data, about 55 % of residential dwellings in 2016 were made of modern construction materials such as steel and reinforced concrete, while the remaining 45 % belonged to other types including masonry and adobe.
After preparing the components of the risk model, an event-based probabilistic approach was used to assess seismic risk of the Iranian residential dwellings. To achieve that, GEM's OpenQuake hazard and risk calculation engine was adopted due to its credibility within the earthquake engineering community, its transparency in terms of technical documentation, and its flexibility in using different approaches in modeling risk. Figure 6 illustrates the schema of OpenQuake's probabilistic event-based engine and its input–output structure.
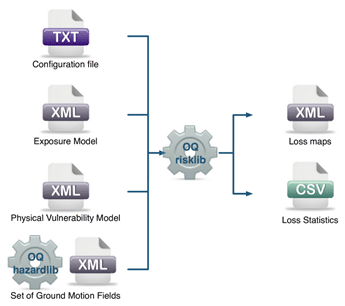
Figure 6GEM's OpenQuake schema and its input and output components (OpenQuake website, https://docs.openquake.org/oq-engine/manual/latest/risk.html, last access: 10 December 2023).
As described, the exposure, vulnerability, and hazard models need to be converted to the required format before being incorporated into the engine. In addition to that, a configuration file that introduces the input data and other analysis parameters, such as the type of analysis (here, probabilistic event-based), number of simulated years (here, 20 000 years), and types of output, is required to set up the risk analysis. The risk assessment process starts with the OpenQuake hazard engine generating sampled earthquake events using the hazard model provided. For each seismic event generated, the ground motion field (distribution of PGA on topsoil) is calculated using GMPE models and the soil shear velocity information for all the locations in the exposure model within a defined radius around the sampled epicenter (here, 150 km). Then, based on the type of buildings at each location (a cell of 30 s arc dimension), relevant vulnerability curves are used to convert PGA values to damage percentages. Further, the damage percentage is multiplied by the replacement value of that type of building to calculate loss. These OpenQuake outputs are then post-processed to calculate aggregate loss at different levels, namely at the county, province, and country level. These values should be normalized to their corresponding exposure values for each building type to compute AAL rates. The same process is done, this time using EP 99.5 % to calculate the 1-in-200-year EP loss for each building type at the aforementioned aggregate levels, which is adopted as the solvency capital required according to the Solvency II regime.
4.1 Earthquake risk assessment results
Figure 7 shows the spatial distribution of seismic AAL for all residential building types in Iran, aggregated at the county level. The studies that exist on seismic risk for Iran at a national level (e.g., Ghafory-Ashtiany and Nasserasadi, 2012; Motamed et al., 2019) were previously done by the authors of this study and are thus considered biased and unsuitable for validating the risk results. Therefore, a risk component validation method is followed to verify the accuracy of the results, in which we attempted to validate the risk distribution and intensity based on the values in the exposure, hazard, and vulnerability models used. As observed, almost all parts of the country are exposed to medium and high levels of seismic risk, except for sparsely populated areas in the central deserts and the northern coasts of the Oman Sea. There are also visible high-risk counties, especially around the major cities of Tehran and Tabriz in northern and northwestern Iran, as well as in other populated areas near Mashhad (northeastern Iran); Esfahan (central Iran); and Ahvaz, Shiraz, and Kerman in southern part of the country. This pattern seems to be in accordance with the distribution of different classes of buildings and their exposure to seismic hazard (see Figs. 2 and 5 and the comparative vulnerability of main building types in Table 4): in areas with a concentration of buildings and a very high level of earthquake hazard (such as in Tehran and Tabriz), the seismic risk is the highest. Similarly, we can witness a high potential for loss in the populated southern cities of Ahvaz, Shiraz, and Kerman that are subject to medium-to-high seismicity. The city of Esfahan, despite being located in a low-seismicity zone, also shows high seismic risk, most probably due to its very high building exposure (the second-highest exposure value after Tehran) and the prevalence of more-vulnerable building classes of masonry and adobe (Fig. 5a and b). In southeastern Iran in the province of Sistan and Baluchestan, a medium-to-rather-high level of risk can be seen, mainly because of the high level of seismicity in the southern parts of province and the existence of extremely vulnerable types of buildings (e.g., adobe).
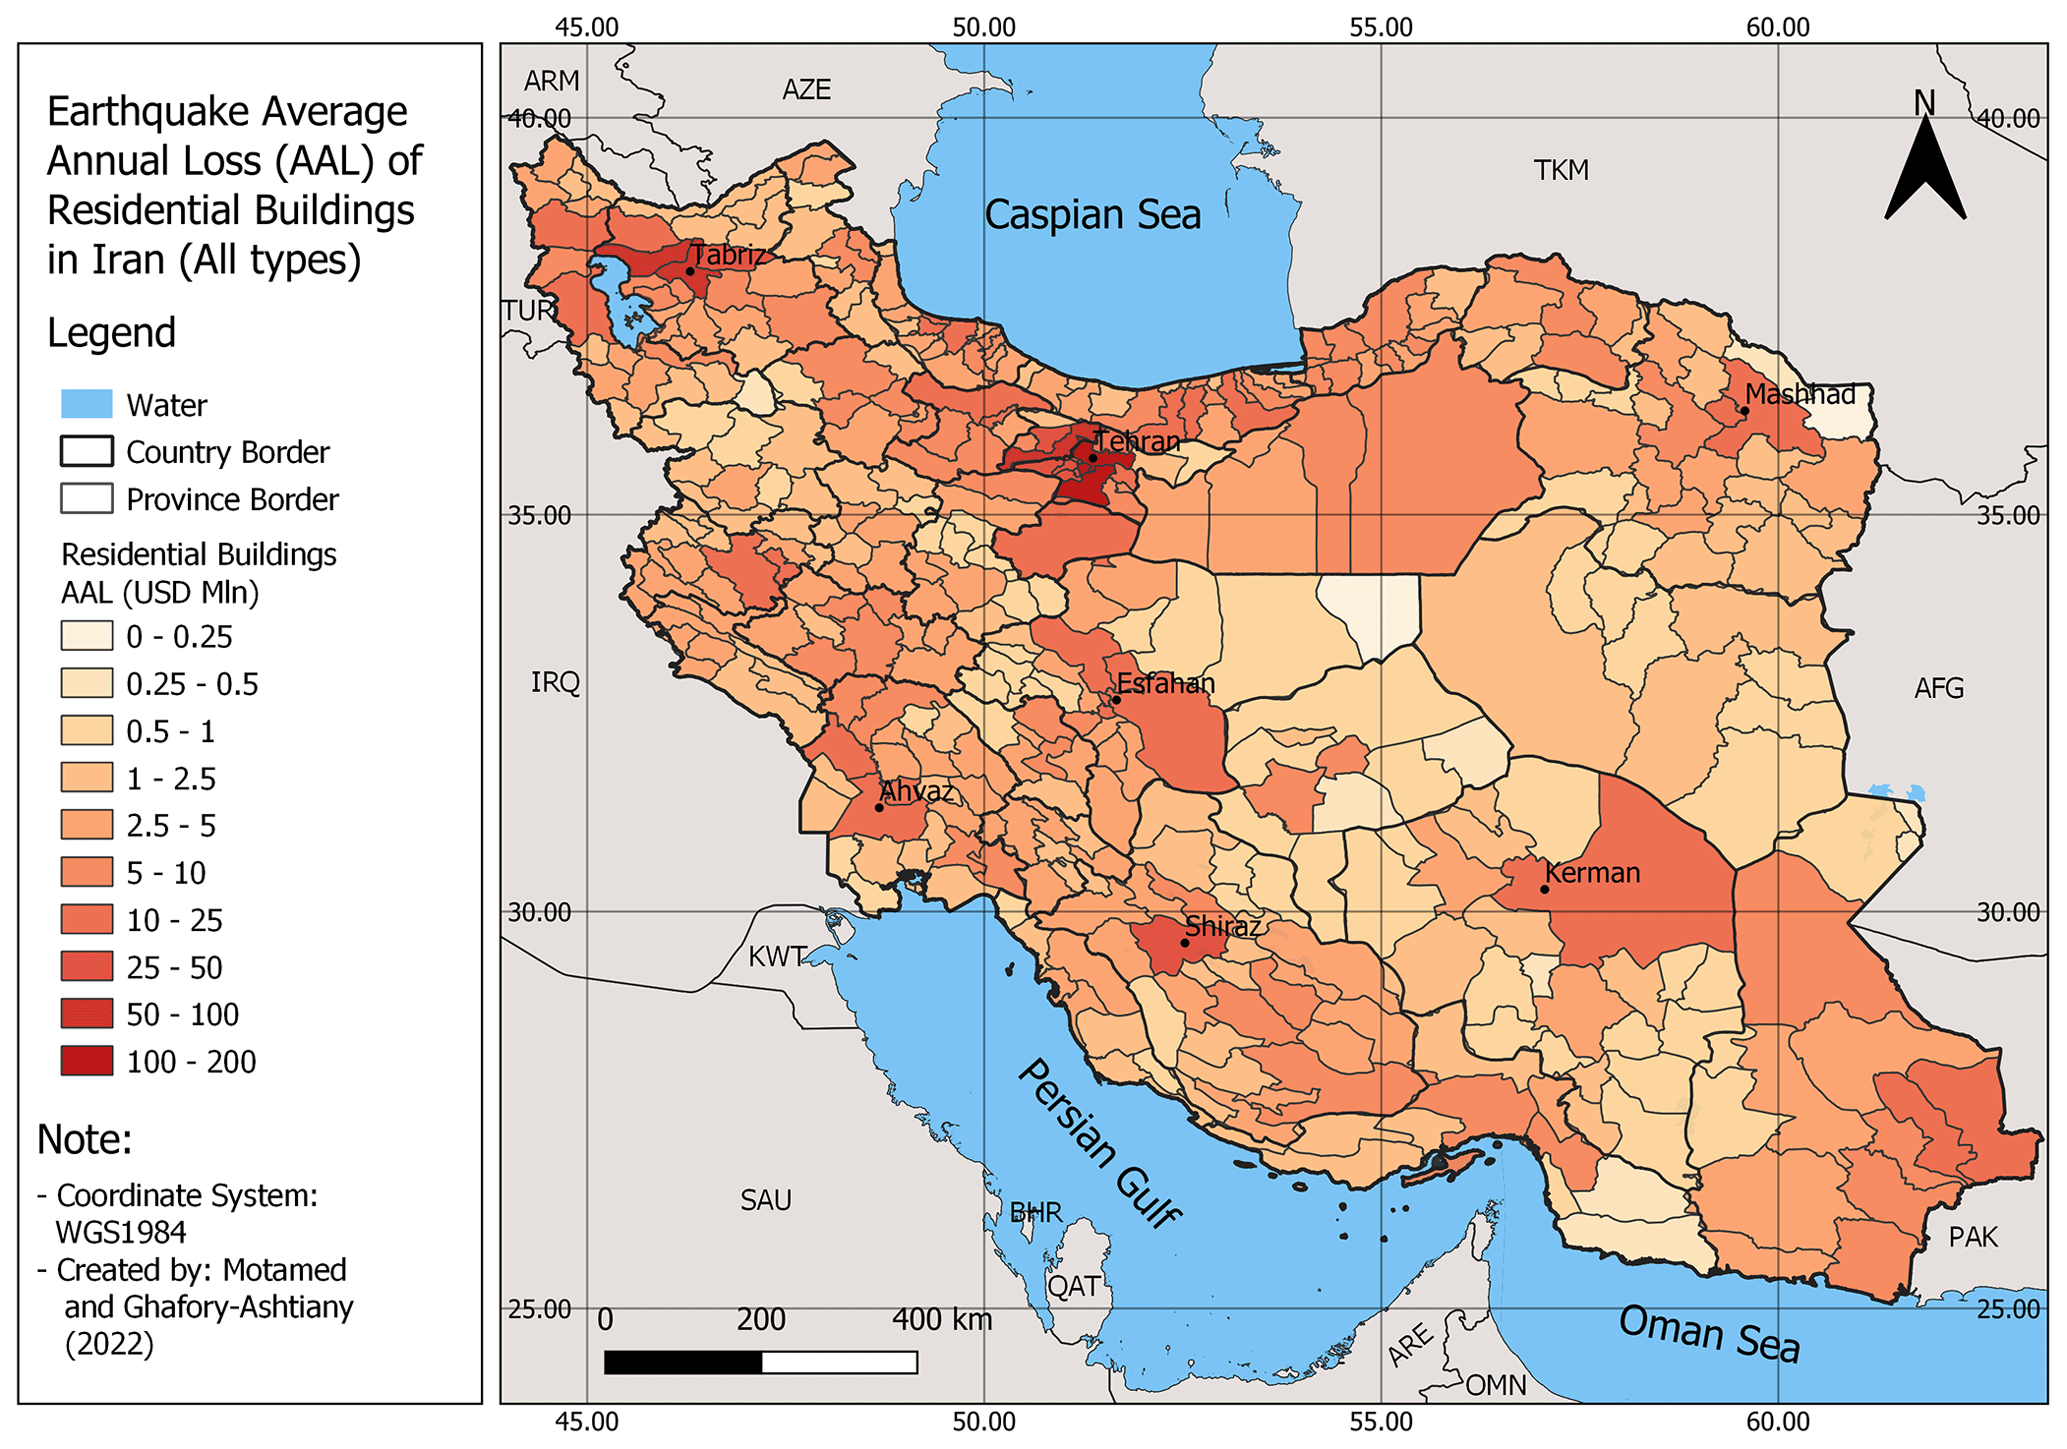
Figure 7Earthquake average annual loss (AAL) of residential buildings in Iran (in million USD).
From what Fig. 8 presented as the spatial pattern of 1-in-200-year losses from earthquakes in Iran, one can gain an idea of the level of earthquake insurance capital required by the Solvency II regime for different types of buildings at the county level in Iran. Assuming 100 % insurance coverage for residential homes in Iran, the SCR or 1-in-200-year loss for steel and reinforced concrete buildings would be the highest in Tehran, Tabriz, and to a lower extent, in Esfahan (and their surrounding counties). The situation is more homogenous for masonry structures (because of their high prevalence and rather-even distribution across the country), where significant seismic losses with 99.5 % confidence can be seen in almost all major cities in the country, namely Tehran, Tabriz, Mashhad, Esfahan, Kermanshah, and Kerman. For adobe construction, again, a medium-to-high degree of losses can be expected in many counties except for areas located in Khuzestan and Fars provinces in the southwest. The only observable anomaly for the 1-in-200-year earthquake losses in adobe buildings is found in the country's most southeastern counties in Sistan and Baluchestan province, particularly along the border with Pakistan. This pattern could first be due to the high number of extremely vulnerable buildings made of adobe in these areas compared to other parts of the country. The second reason would be the eminent seismicity of this region, which is influenced by both the shallow crustal and subduction seismic zones of Makran.
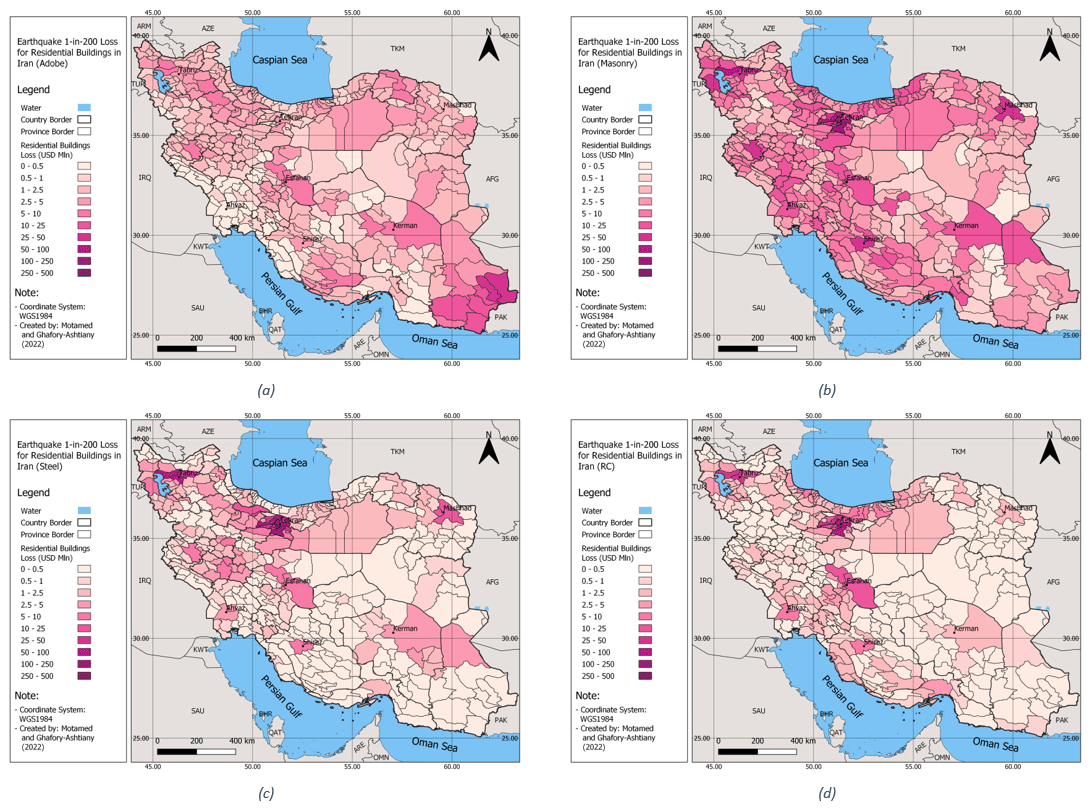
Figure 8The 1-in-200-year earthquake loss of residential buildings in Iran for adobe (a), masonry (b), steel (c), and concrete (d) building types.
Table 5 presents the pure premium rate (AAL rate) calculated for the same cities previously selected in Table 1 of Sect. 3. If we draw a comparison between these rates and those currently used in the market for pricing earthquake insurance in Iran (Table 1), we notice a vast difference, implying a sizable undervaluation of earthquake risk in the Iranian insurance industry, including by the insurers and supervisory bodies like the CII. Here, we used county-level AAL rates as a representation of the modeled seismic risk of the capital cities previously mentioned in Table 1. This is because the current market rates are only retrievable at the city level from the Iranian insurance quote aggregator websites.
Table 5Risk-based (modeled) earthquake pure premium rates (per mille) for different types of buildings in selected cities in Iran.
This difference is more pronounced for cities with a higher level of seismicity, such as Tabriz, where the modeled AAL rate (8.65) is about 8 times larger than the current market premium rate (1.1) for masonry buildings (figures are both per mille). Considering the fact that retrieved market premium rates are “technical premium”, the real discrepancy between risk-based and market rates is even higher. For seismically calmer cities like Esfahan, the discrepancy becomes smaller, reaching a ratio factor of about 2 for reinforced concrete buildings.
4.2 Calculation of solvency capital under Solvency II and Directive 69
In this section, we utilize the modeled solvency capital rates, specifically the 1-in-200-year loss rates, and the current premium rates prevailing in the market (averaged across the market) to conduct a comparative analysis of the capital requirements for earthquake risk in Iran. The assessment is based on two distinct methodologies specified by the European Solvency II regime and the Iranian Directive 69. To highlight the difference between modeled (risk-based) solvency figures and those calculated based on the earned premiums which are, per se, acquired by underwriting earthquake risks according to market premium rates, we used a hypothetical portfolio of risks in the five capital cities we previously selected in Sect. 3.1. As mentioned before, these cities have been selected because they represent different seismic zones of Iran, such as Alborz (from northwest to northeast including Tabriz and Tehran), Zagros (west, south, and southeast, including Ahvaz and Kerman), and central Iran (Esfahan). These cities also lie within regions with different seismicity levels; for example, Tehran and Tabriz are highly seismic, Ahvaz and Kerman have medium-to-high seismicity, and Esfahan is located in a seismically calm area.
To illustrate the influence of building types on solvency capital, we examined three primary construction classes: steel, reinforced concrete, and masonry. For all building classes, we assumed a replacement cost of USD 300 per square meter and an average built area of 100 m2 per housing unit, consistent with the parameters used in the exposure model. Additionally, we assumed an equal number of dwellings (100 dwellings for each construction type in each city) within the hypothetical portfolio. Using the city- and building-type-specific solvency capital rates, we calculated the solvency capital requirement (SCR) by multiplying the exposure values for each construction type by the corresponding SCR rates. Subsequently, the city-level SCRs needed to be aggregated to the portfolio level. In the Solvency II methodology, unlike Directive 69, which simply sums up city-level values to compute the portfolio-level SCR, a geography-based correlation matrix is utilized to aggregate results. Therefore, we initially developed a correlation matrix for the selected five cities.
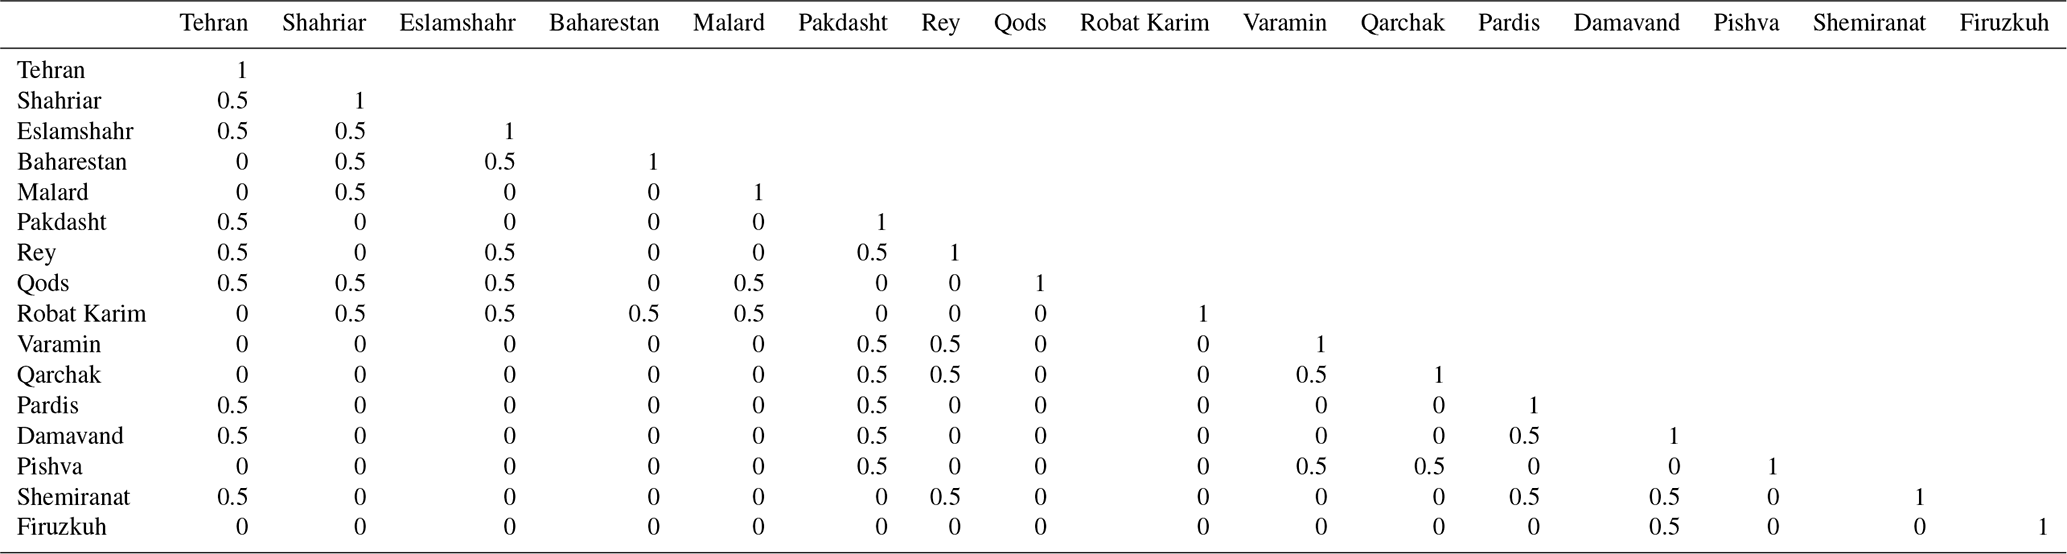
Following a methodology akin to that outlined in Annex IV of Directive 2009 and CEIOPS (2010), we established five province-level and one portfolio-level correlation matrices for the provinces hosting the pilot cities. The values within these correlation matrices were determined based on the proximity of administrative divisions, considering the relative positioning of counties within each province and the proximity of provinces. It was assumed that each county exhibits 100 % correlation with itself. Similarly, each province is considered fully correlated with itself, reflected by a correlation value of 1.0. Furthermore, a 50 % correlation was assumed between each county and its neighboring counties. For provinces, a 25 % correlation was assumed between neighboring provinces, accounting for the larger dimensions of provinces compared to counties. As an illustrative example, Fig. A1 and Table A2 depict the configuration of counties in Tehran province and its corresponding earthquake risk correlation matrix, providing a visual representation of the methodology applied.
Table 6 shows the results of solvency capital calculations based on the two solvency regimes at the county, province, and portfolio levels for the hypothetical portfolio of risks.
Table 6Earthquake risk solvency capital rates based on the methodologies suggested by the Iranian Directive 69 (D-69) and Solvency II (S-II) methodologies. M – masonry, S – steel, and RC – concrete.
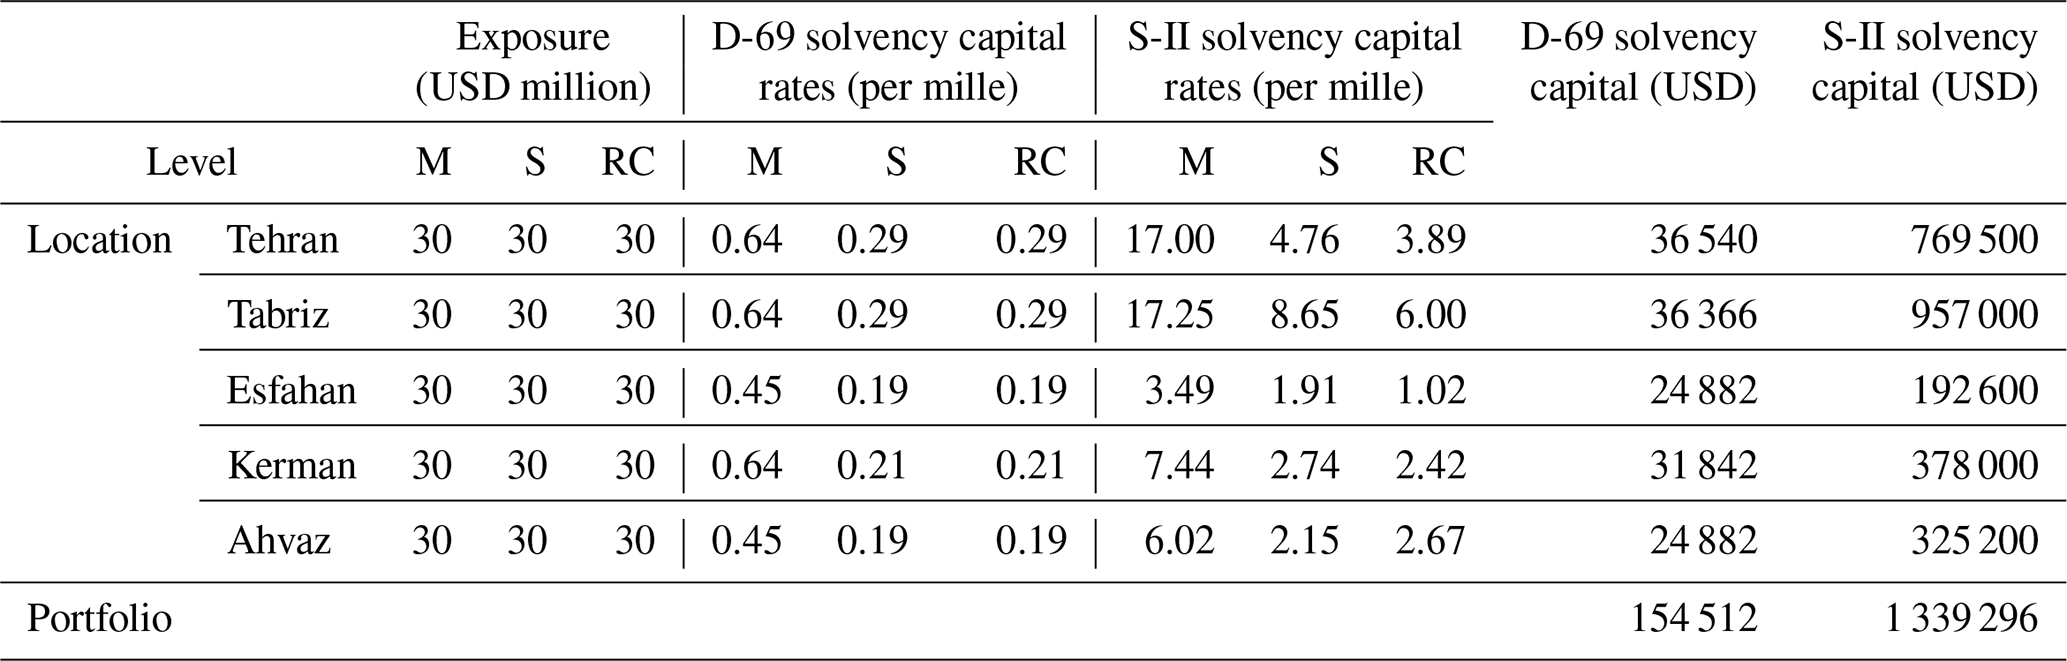
As illustrated in the table, there is an approximately 10-fold difference in the solvency capital requirement when calculated using the approach specified by Directive 69 compared to the European Solvency II regime for the same residential dwelling portfolio in the pilot cities. Two key factors contribute to this notable gap in required capital charges. Firstly, the variance in catastrophe capital rates between Directive 69 and the Solvency II system plays a significant role. The second contributing factor, albeit with a minor impact, is the dissimilarity in aggregation methods employed by each methodology. In the Iranian approach, where portfolio capital is determined by summing up county-level figures, the mitigating effect of geographical diversification is simply disregarded, leading to even higher results. According to the data presented in Table 5, the Solvency II risk-based rates are roughly 20 times greater than the Directive 69 capital rates. As mentioned, this disparity is somewhat mitigated when aggregating the solvency capital at the portfolio level. The ultimate catastrophe capital at the portfolio level for the Iranian and European systems is reported as USD 154 512 and USD 1 339 296, respectively.
The findings from the analysis indicate that the constant-factor approach utilized by the Central Insurance of Iran (CII) for calculating solvency capital related to earthquake risks significantly underestimates the risk compared to the methodology recommended by the Solvency II regime. This discrepancy raises concerns about the capacity of Iranian insurers and reinsurers to withstand catastrophic shocks stemming from medium-to-significant earthquake events in major cities across Iran. It is worth noting that, despite the low insurance penetration rate in Iran and the absence of medium-to-large events in main cities, there have been no recorded instances of catastrophe-related insolvency in the country. However, persisting with the current approach may jeopardize the stability of the insurance market in Iran, potentially giving rise to financial and social challenges in the event of future disasters.
Moreover, following the establishment of the Iran Building Catastrophe Insurance Pool (IBCIP), which provides primary insurance coverage for all residential buildings in the country, a substantial business opportunity has arisen for local insurance companies to address the gap between the partial coverage offered by IBCIP and the total insurable sum. However, if these insurance firms persist in utilizing the existing premium rates in this scenario, a significant accumulation of risk may occur over time due to the disparity between the actual risk and the written premium. This poses a considerable challenge, as the solvency capital held by these entities might be inadequate to cover losses resulting from medium-to-large seismic events in urban settlements, potentially leading to the insolvency of Iranian insurers. Additionally, given that a majority of domestic insurance firms are reinsured internally due to financial sanctions on Iran, the solvency issues of insurers could potentially have repercussions on other financial institutions. To break this cycle of catastrophe risk accumulation, it is advisable for Iranian insurance regulators to transition from current catastrophe pricing practices to a risk-based pricing system, incorporating scientifically approved catastrophe modeling techniques.
Another consideration that is relevant to the topic of insurance solvency is the public–private collaboration for adopting and implementing new measures like the risk-based catastrophe solvency requirement. As the first step, governmental bodies and insurers can initiate educational programs to raise awareness about catastrophe modeling significance in assessing natural hazard risk. Forming alliances between international institutions and local insurers is beneficial for knowledge exchange, especially amid the current financial sanctions. Moreover, the government can incentivize insurers to integrate catastrophe modeling into risk assessments before enforcing capital mandates. This involves offering tax benefits or reduced regulatory burdens, prompting insurers to embrace advanced risk evaluation tools. These proactive steps aim to fortify the Iranian insurance market, preventing undervaluation and enhancing resilience through modern practices.
It is important to note that due to the lack of frequent seismic losses, validation of an earthquake risk model is challenging because the average of past losses is not a correct representation of seismic risk in a given area. Depending on the utilized resolution, hazard model, vulnerability curves, exposure data, and loss calculation method, different risk results can be generated by various models. This is something accepted in the insurance market. When comparing the results to other studies, special attention should be given to possible differences in input data and assumptions. For example, when we compare the ratio of AAL in Kohrangi et al. (2021) with ours (their study presents the results of a seismic risk assessment for the city of Esfahan), we should notice the difference in the vulnerability curves, age of exposure data, and most importantly the resolutions of the analyses (county-level in our study versus city-level in theirs). That said, our AAL ratio of 0.55 per thousand for the county of Esfahan (which includes other cities with lower seismicity levels in addition to the city of Esfahan) is comparable to the AAL ratio of 1.9 calculated for the city of Esfahan in that study. Undoubtedly, an enhancement in the quality of input data and assumptions will enable a more precise assessment of the seismic risk associated with Iranian buildings. This, in turn, would contribute to a more accurate evaluation of the prevailing insurance underwriting and pricing practices.
A numerical analysis was carried out in this paper to compare the earthquake catastrophe capital required by the European Solvency II regime and Directive 69 of the Central Insurance of Iran. Based on the literature reviewed, in the Iranian system, a constant factor is used to compute catastrophe charges based on each policy's earned premium and incurred losses. These earned earthquake insurance premiums are the result of an underwriting practice that uses market-agreed rating schemes, which seems to be an improper representation of the existing seismic risk in the country. On the other hand, the Solvency II directive requires a risk-modeling-based capital calculation approach to compute the necessary catastrophe charges. In addition to the differences in the calculation of solvency capital rates, there is also a discrepancy between the two methodologies in risk aggregation: while the Iranian directive simply sums up the required capital charges at the city level to calculate the portfolio-level figure, the European regime considers the diversification impact by making use of correlation matrices. To be able to implement the Solvency II approach in calculating the risk-based solvency capital, a seismic risk model has been developed by adopting the Earthquake Model of the Middle East (EMME; Şeşetyan et al., 2018), creating an exposure model for Iranian residential buildings based on the newest census data and using an earthquake vulnerability model for Iranian buildings (Mansouri and Amini-Hosseini, 2013) and by utilizing GEM's OpenQuake hazard and risk assessment engine. Average annual loss (AAL) and the 1-in-200-year EP values have been calculated for four main types of Iranian buildings at a 30 s arc grid granularity.
The initial segment of the numerical findings was presented as the average annual loss (AAL) and exceedance probability (EP) figures at the county level, achieved by aggregating the OpenQuake risk output tables for four distinct construction types. A comparison between these values and the AAL rates currently employed in the Iranian insurance market reveals a noticeable undervaluation of seismic risk, ranging from to , depending on the risk location and construction type. Furthermore, to comprehend the implications of this dissonance between risk-modeling-based and market-agreed rates, we computed the earthquake capital requirement for a hypothetical portfolio of residential dwellings in five Iranian cities situated in different seismotectonic zones. This calculation was conducted using the methodologies specified by Solvency II and the instructions provided by Directive 69 of the Iranian Central Insurance. The results demonstrate a significant 20-fold underestimation of earthquake solvency capital in the Iranian Directive 69 system compared to the Solvency II directive. This undervaluation of earthquake risk poses a substantial risk for the Iranian insurance market of accumulating undue exposure. In the event of medium-to-large urban earthquakes, it could potentially lead to the insolvency of insurance undertakings due to the inadequacy of reserved catastrophe capital. We believe that this study is unique and valuable in its kind for Iran and it could engender serious discussions and challenges for the bettering of the relevant sectors. It is worthwhile to mention that earthquake solvency capital is a function of earthquake risk and risk appetite of the market. Here, we assumed similar risk appetites of the Iranian insurance market and that of the European Union. Although the average GDP per capita in the EU region is about 10 times that of Iran, we are convinced that the earthquake capital requirement should follow the risk profile of the country and the sum insured. Given the significant impact of input data and models on the results of catastrophe modeling, it is crucial to acknowledge that a different risk perception may emerge if the same process is repeated using more recent exposure data or improved seismic hazard and vulnerability models, which may become available in the future.
In the end, the authors of this paper highly advocate for ongoing research focusing on various components of risk, specifically hazard, exposure, and vulnerability. Additionally, the introduction of more state-of-the-art earthquake models is encouraged to foster a more comprehensive and accurate seismic risk assessment for the Iranian insurance market. Moreover, although the subject of the paper is not directly related to parametric insurance, the seismic risk model developed can be used to design a parametric product for earthquakes, something that could perhaps be useful for the public natural hazard insurance fund in Iran.
Table A1Riskiness of different construction types in Iran (Ghafory-Ashtiany, 1991).
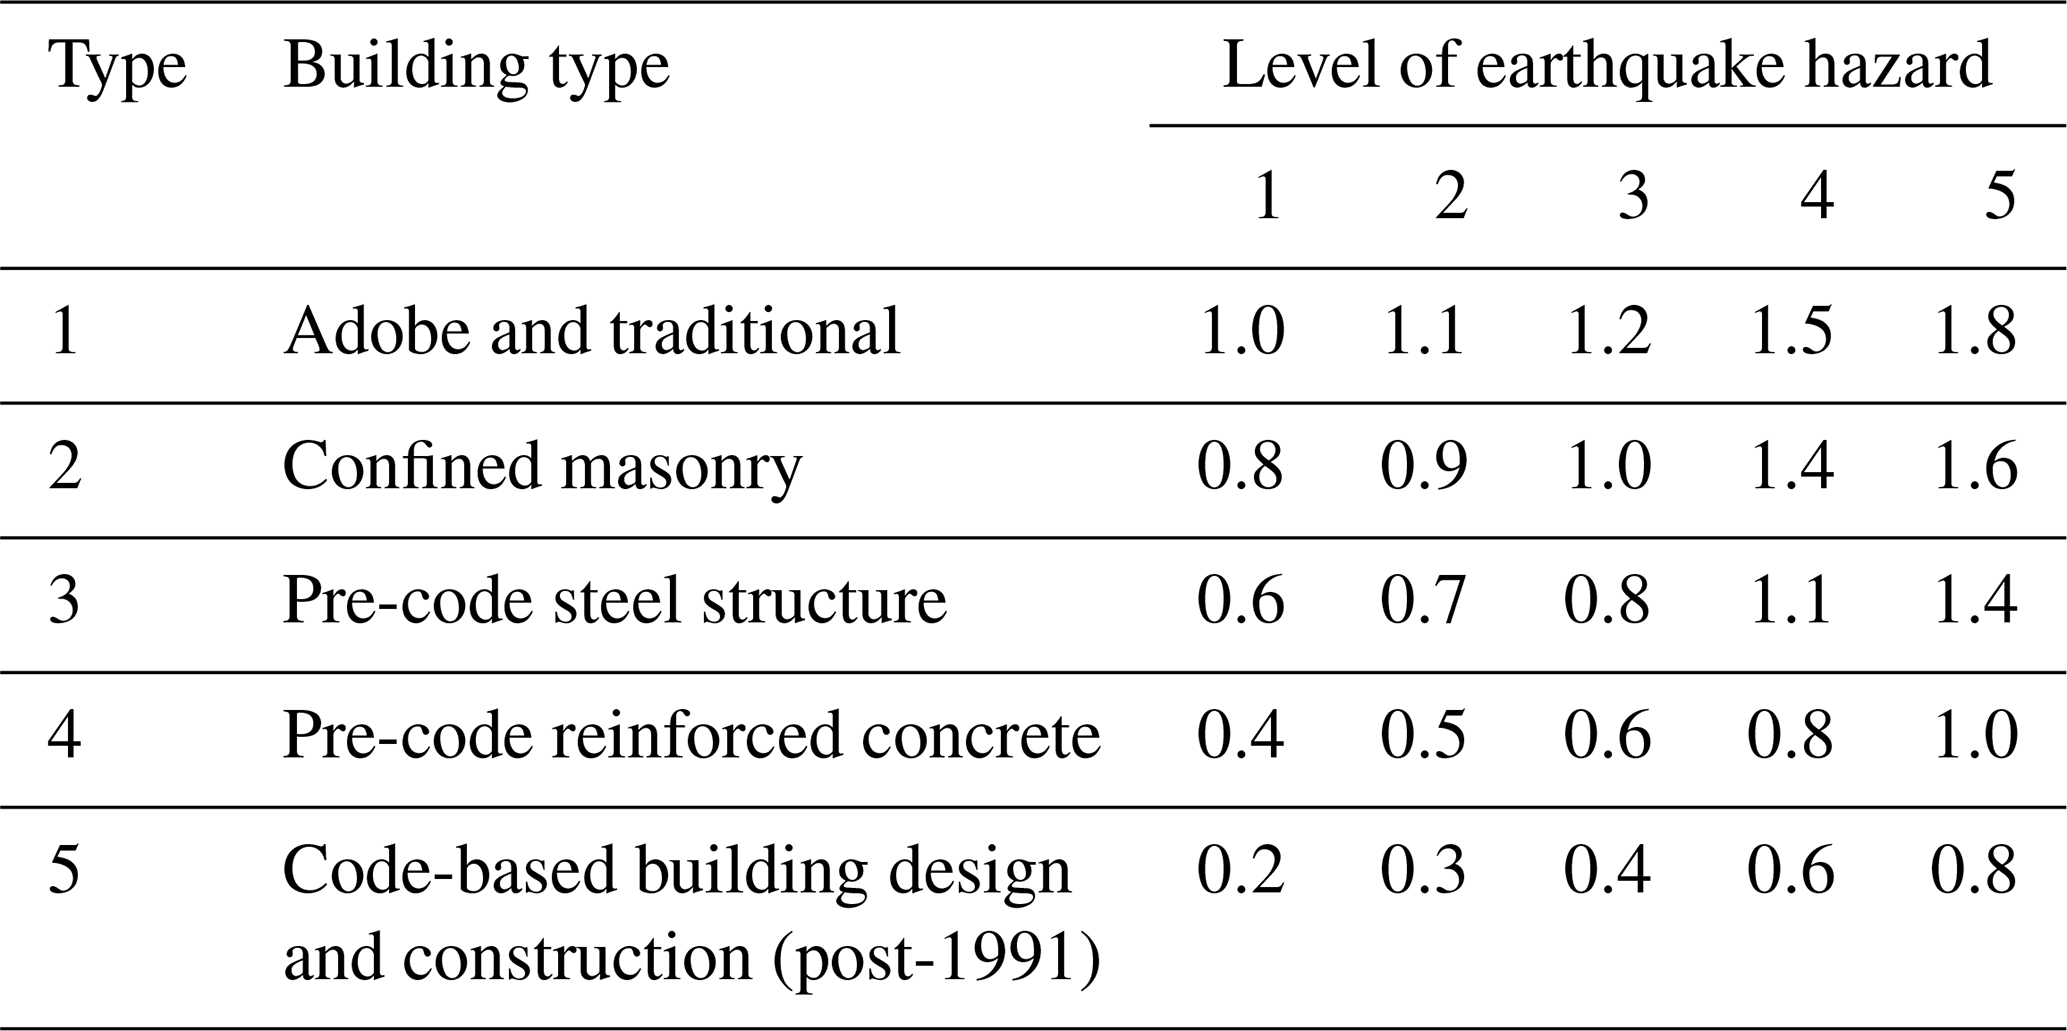
Note: hazard levels are based on zones defined in the Iranian Code of Practice for Seismic Resistant Design of Buildings – Code 2800. The levels are 1 – no, 2 – low (0.2 g), 3 – moderate (0.25 g),
4 – high (0.3 g), and 5 – very high (0.35 g).
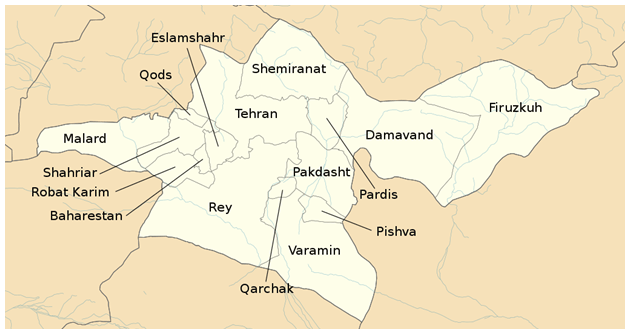
Figure A1Tehran province and its counties © Wikipedia.
Table A2Earthquake correlation matrix for Tehran province based on the methodology suggested by Solvency II.
Data used in this research are the intellectual property of the Iran National Science Foundation, which funded the study, and cannot be shared by the authors.
In the preparation of this paper, MGA planned the research project and contributed to the content of different chapters, mainly in the earthquake hazard, risk assessment, modeling and review, and validation of results sections. HM was mainly responsible for authoring the insurance regulation content and conducting the numerical analysis. Both authors edited the final paper equally.
The contact author has declared that neither of the authors has any competing interests.
Publisher’s note: Copernicus Publications remains neutral with regard to jurisdictional claims made in the text, published maps, institutional affiliations, or any other geographical representation in this paper. While Copernicus Publications makes every effort to include appropriate place names, the final responsibility lies with the authors.
The authors would like to express their gratitude to the Iran National Science Foundation for the financial support they provided for conducting this research work.
This research has been supported by the Iran National Science Foundation (grant no. 94811162).
This paper was edited by Veronica Pazzi and reviewed by Zoran Stojadinovic, Babak Mansouri, Gordon Woo, and one anonymous referee.
Akkar, S. and Cagnan, Z.: A local ground-motion predictive model for Turkey, and its comparison with other regional and global ground-motion models, B. Seismol. Soc. Am., 100, 2978–2995, 2010.
Akkar, S., Sandıkkaya, M. A., and Bommer, J. J.: Empirical ground-motion models for point-and extended-source crustal earthquake scenarios in Europe and the Middle East, B. Seismol. Soc. Am., 12, 359–387, 2014.
Allen, T. I. and Wald, D. J.: On the use of high-resolution topographic data as a proxy for seismic site conditions (VS30), B. Seismol. Soc. Am., 99, 935–943, 2009.
Anderson, T. J.: Innovative financial instruments for natural disaster risk management, Inter-American Development Bank, New York, https://doi.org/10.18235/0005685, 2002.
Atkinson, G. M. and Boore, D. M.: Empirical ground-motion relations for subduction-zone earthquakes and their application to Cascadia and other regions, B. Seismol. Soc. Am., 93, 1703–1729, 2003.
Atkinson, G. M. and Boore, D. M.: Earthquake ground-motion prediction equations for eastern North America, B. Seismol. Soc. Am., 96, 2181–2205, 2006.
Baione, F., De Angelis, P., and Granito, I.: On a capital allocation principle coherent with the Solvency II standard formula, Cornell University, New York, https://doi.org/10.48550/arXiv.1801.09004, 2018.
Basel Committee on Banking Supervision: Basel II: International Convergence of Capital Measurement and Capital Standards: A revised Framework, Bank for International Settlements (BIS), Basel, https://www.bis.org/publ/bcbs107.htm (last access: 23 September 2023), 2004.
Bastami, M., Abbasnejadfard, M., Motamed, H., Ansari, A., and Garakhaninezhad, A.: Development of hybrid earthquake vulnerability functions for typical residential buildings in Iran, Int. J. Disast. Risk Re., 77, 103087, https://doi.org/10.1016/j.ijdrr.2022.103087, 2022.
Bright, E., Rose, A., Urban, M., and McKee, J.: LandScan Global 2016, Oak Ridge National Laboratory, https://doi.org/10.48690/1524211, 2017.
Campbell, K. W.: Prediction of strong ground motion using the hybrid empirical method and its use in the development of ground-motion (attenuation) relations in eastern North America, B. Seismol. Soc. Am., 93, 1012–1033, 2003.
Chiou, B. S. and Youngs, R. R.: An NGA model for the average horizontal component of peak ground motion and response spectra, Earthq. Spectra, 1, 173–215, 2008.
Clarke, S., Mitchell, S., and Phelan, E.: Capital Management in a Solvency II World, Milliman, https://www.milliman.com/en/insight/2014/capital-management-in-a-solvency-ii-world/ (last access: 15 September 2021), 2014.
Committee of European Insurance and Occupational Pensions Supervisors (CEIOPS): Catastrophe Task Force Report on the Standardised Scenarios for the Catastrophe Risk Module in the Standard Formula, https://register.eiopa.europa.eu/CEIOPS-Archive/Documents/Reports/CEIOPS-DOC-79-10-CAT-TF-Report.pdf (last access: 15 September 2021), 2010.
Council Directive 90/619/EEC of 8 November 1990 on the coordination of laws, regulations and administrative provisions relating to direct life assurance, laying down provisions to facilitate the effective exercise of freedom to provide services and amendi, European Union Official Journal, 50–61, http://data.europa.eu/eli/dir/1990/619/oj (last access: 23 September 2021), 1990.
Council Directive 92/96/EEC on the coordination of laws, regulations and administrative provisions relating to direct life assurance and amneding Directives 79/267/EEC and 90/619/EEC, European Union Official Journal, 1–27, http://data.europa.eu/eli/dir/1992/96/oj (last access: 20 September 2021), 1992.
Danciu, L., Şeşetyan, K., Demircioglu, M., Gülen, L., Zare, M., Basili, R., Elias, A., Adamia, S., Tsereteli, N., Yalçın, H., Utkucu, M., Khan, M. A., Sayab, M., Hessami, H., Rovida, A. N., Stucchi, M., Burg, J., Karakhanian, A., Babayan, H., Avanesyan, M., Mammadli, T., Al-Qaryouti, M., Kalafat, K., Varazanashvili, O., Erdik, M., and Giardini, D.: The 2014 Earthquake Model of the Middle East: seismogenic sources, B. Earthq. Eng., 16, 3465–3496, 2018.
Deligiannakis, G., Zimbidis, A., and Papanikolaou, I.: Earthquake loss and Solvency Capital requirement calculation using a fault/specific catastrophe model, Geneva Pap. Risk Ins., 48, 821–846, https://doi.org/10.1057/s41288-021-00259-x, 2021.
Directive 92/49/EEC on the coordination of laws, regulations and administrative provisions relating to direct insurance other than life assurance and amending Directives 73/239/EEC and 88/357/EEC, European Union Official Journal, 1–23, http://data.europa.eu/eli/dir/1992/49/oj (last access: 19 September 2021), 1992.
Directive 2002/83/EC of the European Parliament and of the Council of November 2002 concerning life assurance, European Union Official Journal, L345, 1–51, http://data.europa.eu/eli/dir/2002/83/oj (last access: 20 September 2021), 2002a.
Directive 2002/13/EC of the European Parliament and the Council of 5 March 2002 amending Council Directive 73/239/EEC as regards the solvency margin requirements for non-life insurance undertakings, European Union Official Journal, 17–22, http://data.europa.eu/eli/dir/2002/13/oj (last access: 10 September 2021), 2002b.
Directive 2009/138/EC of the European Parliament and the Council of 25 November 2009 on the taking-up and pursuit of the business of insurance and reinsurance (Solvency II), European Union Official Journal, 1–155, http://data.europa.eu/eli/dir/2009/138/oj (last access: 20 September 2021), 2009.
First Council Directive 73/239/EEC on the coordination of laws, regulations and administrative provisions relating to the taking-up and pursuit of the business of direct insurance other than life assurance, European Union Official Journal, 3–19, http://data.europa.eu/eli/dir/1973/239/oj (last access: 19 September 2021), 1973.
First Council Directive 79/267/EEC of 5 March 1979 on the coordination of laws, regulations and administrative provisions relating to the taking-up and pursuit of the business of direct life assurance, European Union Official Journal, 1–18, http://data.europa.eu/eli/dir/1979/267/oj (last access: 10 September 2021), 1979.
Ghafory-Ashtiany, M.: Earthquake Insurance in Iran, International Institute of Earthquake Engineering and Seismology (IIEES), Tehran, 1991.
Ghafory-Ashtiany, M. and Nasserasadi, K.: Primary Earthquake Insurance Premium Indices for Iranian Buildings, Insurance Research Center, Tehran, http://ensani.ir/fa/article/302328/ (last access: 20 March 2021), 2012 (in Persian).
Gurenko, E. N. and Itigin, A.: Reinsurance as Capital Optimization Tool under Solvency II – Policy Research Working Paper, the World Bank, New York, https://ssrn.com/abstract=2197677 (last access: 11 April 2021), 2013.
Hashemi, S. A., Safari, A., and Kamali-Dolatabadi, M.: Assessment of Solvency Margin of Insurance Companies in Iran, Iran J. Ins. Res., 25, 79–120, 2010.
High Council of Insurance: Directive 69: Methods of calculating and monitoring the financial solvency of insurance institutions, Central Insurance of Iran, Tehran, https://ensani.ir/file/download/article/20140603142038-9487-163.pdf (last access: 10 July 2022), 2019.
Ibrion, M., Mokhtari, M., and Nadim, F.: Earthquake Disaster Risk Reduction in Iran: Lessons and “Lessons Learned” from Three Large Earthquake Disasters – Tabas 1978, Rudbar 1990, and Bam 2003, Int. J. Disast. Risk Sc., 6, 415–427, 2015.
Kohrangi, M., Bazzurro, P., and Vamvatsikos, D.: Seismic risk and loss estimation for the building stock in Isfahan: part II – hazard analysis and risk assessment, B. Earthq. Eng., 19, 1739–1763, 2021.
Kousky, C. and Cooke, R.: Explaining the failure to insure catastrophic risks, Geneva Pap. Risk Ins., 37, 206–227, 2012.
Lawson, R. C., Card, N., and Vass, G.: Insurance Industry Catastrophe Management Practices, American Academy of Acruaries, New York, https://www.actuary.org/sites/default/files/files/catmonograph_june01.4.pdf/catmonograph_june01.4.pdf (last access: 10 July 2022), 2001.
Lichtenstein, E.: Five Times Mother Nature Shocked the Insurance Industry, https://agentsync.io/blog/industry-news/five-times-mother-nature-shocked-the-insurance-industry (last access: 20 July 2023), 2022.
Lin, P. S. and Lee, C. T.: Ground-motion attenuation relationships for subduction-zone earthquakes in northeastern Taiwan, B. Seismol. Soc. Am., 98, 220–240, 2008.
Linder, U. and Ronkainen, V.: Solvency II/Towards a new insurance supervisory system in the EU, Scand. Actuar. J., 6, 462–474, 2004.
Lloyd's and CAT Risk Solutions: Seismic Shock, A new earthquake model for the Middle East, Lloyd's, London, https://assets.lloyds.com/media/99aac888-9189-44d3-9b8a-431830c3baaa/pdf-risk-reports-Seismic-shock-a-new-earthquake-model-for-the-middle-east-2017.pdf (last access: 15 May 2022), 2017.
Lotfi, A., Zafarani, H., and Khodaverdian, A.: A probabilistic deformation-based seismic hazard model for Iran, B. Earthq. Eng., 20, 7015–7046, 2022.
Maghsoudi, A. and Moshtari, M.: Challenges in disaster relief operations: evidence from the 2017 Kermanshah earthquake, J. Humanit. Logist. Sup., 11, 107–134, 2020.
Mansouri, B. and Amini-Hosseini, K.: Global Earthquake Risk Model (GEM) – Earthquake Model of the Middle East Region (EMME) – WP4: Seismic Risk Assessment, Final Report, IIEES, Tehran, 2013.
Mirzaei, N., Gao, M. T., Chen, Y. T., and Wang, J.: A uniform catalog of earthquakes for seismic hazard assessment in Iran, Acta Seismol. Sinica, 10, 713–726, 1997.
Mouroux, P. and Le Brun, B.: Risk-Ue Project: An Advanced Approach to Earthquake Risk Scenarios With Application to Different European Towns, in: Assessing and Managing Earthquake Risk. Geotechnical, Geological and Earthquake Engineering, edited by: Oliveira, C. S., Roca, A., and Goula, X., 2, Springer, Dordrecht, https://doi.org/10.1007/978-1-4020-3608-8_23, 2008.
Motamed, H., Calderon, A., Silva, V., and Costa, C.: Development of a probabilistic earthquake loss model for Iran, B. Earthq. Eng., 17, 1795–1823, 2019.
Pagani, M., Monelli, D., Weatherill, G. A., and Garcia, J.: The OpenQuake-engine Book: Hazard, Global Earthquake Model Foundation, https://cloud-storage.globalquakemodel.org/public/wix-new-website/pdf-collections-wix/publications/OQ Hazard Science 1.0.pdf (last access: 14 March 2023), 2014.
Pagani, M., Garcia-Pelaez, J., Gee, R., Johnson, K., Poggi, V., Silva, V., Simionato, M., Styron, R., Vigano, D., Danciu, L., Monelli, D., and Weatherill, G.: The 2018 version of the Global Earthquake Model: Hazard component, Earthq. Spectra, 36, 226–251, 2020.
Pakdel-Lahiji, N., Hochrainer-Stigler, S., Ghafory-Ashtiany, M., and Sadeghi, M.: Consequences of Financial Vulnerability and Insurance Loading for the Affordability of Earthquake Insurance Systems: Evidence from Iran Consequences of Financial Vulnerability and Insurance Loading for the Affordability of Earthquake Insurance Systems, Geneva Pap. Risk Ins., 40, 295–315, 2019.
Rae, R. A., Barret, A., Brooks, D., Chotai, M. A., Pelkiewicz, A. J., and Wang, C.: A review of Solvency II: Has it met its objectives?, Cambridge University Press, Cambridge, https://doi.org/10.1017/S1357321717000241, 2018.
Sandström, A.: Models, Assessment and Regulation, Chapman and Hall, London, https://doi.org/10.1080/03461230601075749, 2019.
Second Council Directive of 22 June 1988 on the coordination of laws, regulations and administrative provisions relating to direct insurance other than life assurance and laying down provisions to facilitate the effective exercise of freedom to provide services and amendi, European Union Official Journal, 1–2, http://data.europa.eu/eli/dir/1988/357/oj (last access: 23 September 2021), 1988.
Şeşetyan, K., Danciu, L., Demircioğlu, M., Giardini, D., Erdik, M., Akkar, S., Gülen, L., Zare, M., Adamia, S., Ansari, A., Arakelyan, A., Askan, A., Avanesyan, M., Babayan, H., Chelidze, T., Durgaryan, R., Elias, A., Hamzehloo, H., Hessami, K., Kalafat, D., Kale, Ö., Karakhanyan, A., Khan, M. A., Mammadli, T., and Yılmaz, M. T.: The 2014 Earthquake Model of the Middle East: overview and results, B. Earthq. Eng., 16, 3535–3566, 2018.
Shahbazi, P., Mansouri, B., Ghafory-Ashtiany, M., and Käser, M.: Introducing loss transfer functions to model seismic financial loss: A case study of Iran, Int. J. Disast. Risk Re., 51, 101883, https://doi.org/10.1016/j.ijdrr.2020.101883, 2020.
Shahriar, B., Sayyadzadeh, A., Emdadi, F., Hasanzadeh, A., Jafari, A., Safari, A., and Keshavarz Haddad, G.: Review of the Method for Calculating and Monitoring the Financial Solvency of Insurance Firms, Insurance Research Center, Research Report no. 58, Tehran, https://civilica.com/doc/1047676/ (last access: 14 August 2021), 2016.
Tavakoli, B. and Ghafory-Ashtiany, M.: Seismic hazard assessment of Iran, Ann. Geofis., 42, 1013–1021, 1999.
Thorburn, C.: On the Measurement of Solvency of Insurance Companies, World Bank Policy Research Working Paper 3199, New York, https://documents1.worldbank.org/curated/en/977941468761422861/114514322_20041117173029/additional/wps3199.pdf (last access: 23 August 2021), 2004.
Toro, G. R.: Modification of the Toro et al. (1997) attenuation equations for large magnitudes and short distances, Risk Engineering Inc., Louisville, https://www.researchgate.net/publication/237314089_Modification_of_the_Toro_et_al1997_attenuation_equations_for_large_magnitudes_and_short_distances (last access: 20 July 2021), 2002.
Yazdani, A. and Kowsari, M.: Bayesian estimation of seismic hazards in Iran, Sci. Iran., 20, 422–430, 2013.
Youngs, R., Chiou, S., Silva, W., and Humphrey, J.: Strong ground motion attenuation relationships for subduction zone earthquakes, Seismol. Res. Lett., 68, 58–73, 1997.
Zhao, J., Zhang, J., Asano, A., Ohno, Y., Oouchi, T., Takahashi, T., Ogava, H., Irikuma, K., Thio, H. K., Somerville, P. G., Fukushima, Y., and Fukushima, Y.: Attenuation Relations of Strong Ground Motion in Japan Using Site Classification Based on Predominant Period, B. Earthq. Eng., 19, 1739–1763, 2006.
Life insurance provides coverage for an individual's life and offers fixed health benefits for critical illnesses such as cancer, heart ailments, and more. On the other hand, general insurance or non-life insurance encompasses non-life assets, including houses, vehicles, health, events, travel, and other aspects.
CRESTA zones are a system used in the insurance industry to evaluate and manage catastrophe risks. CRESTA stands for Catastrophe Risk Evaluation and Standardizing Target Accumulations. These zones are geographic areas that are defined based on various factors, including seismic activity, weather patterns, and other natural perils.
total insured value (TIV) refers to the total amount of insurance coverage that an individual, organization, or entity has for its assets, properties, or liabilities.
- Abstract
- Introduction
- Natural catastrophe insurance regulations in the European Union (EU) and in Iran
- Methodology and data
- Numerical results
- Discussion
- Conclusions
- Appendix A
- Data availability
- Author contributions
- Competing interests
- Disclaimer
- Acknowledgements
- Financial support
- Review statement
- References