the Creative Commons Attribution 4.0 License.
the Creative Commons Attribution 4.0 License.
 | 02 Aug 2024
Probabilistic flood inundation mapping through copula Bayesian multi-modeling of precipitation products
Francisco Javier Gomez
Keighobad Jafarzadegan
Hamed Moftakhari
Accurate prediction and assessment of extreme flood events are crucial for effective disaster preparedness, response, and mitigation strategies. One crucial factor influencing the intensity and magnitude of extreme flood events is precipitation. Precipitation patterns, particularly during intense weather phenomena such as hurricanes, can play a significant role in triggering widespread flooding over densely populated areas. Traditional flood prediction models typically rely on single-source precipitation data, which may not adequately capture the inherent variability and uncertainty associated with extreme events due to certain limitations in the precipitation generation framework, availability, or both spatial and temporal resolutions. Moreover, in coastal regions, the complex interaction between local precipitation, river flows, and coastal processes (i.e., storm tide) can result in compound flooding and amplify the overall impact and complexity of flooding patterns. This study presents an implementation of the global copula-embedded Bayesian model averaging (BMA) (Global Cop-BMA) framework for improving the accuracy and reliability of extreme flood modeling. The proposed framework integrates a collection of precipitation products with different spatiotemporal resolutions to account for uncertainty in forcing data for hydrodynamic modeling and generating probabilistic flood inundation maps. The methodology is evaluated with respect to Hurricane Harvey, which was a catastrophic weather event characterized by intense precipitation and compound flooding processes over the city of Houston in the state of Texas in 2017. The results show a significant improvement in predictive accuracy compared to those based on a single precipitation product (e.g., the Nash–Sutcliffe efficiency (NSE) performance of a single quantitative precipitation estimation (QPE) is in the range of 0.695 to 0.846, while the Cop-BMA yields an NSE of 0.858), demonstrating the merits of the Global Cop-BMA approach. Furthermore, this research extends its impact by generating probabilistic flood extension maps that account not only for the primary influence of precipitation as a flood driver but also for the intricate nature of compound flooding processes in coastal environments.
- Article
(8299 KB) - Full-text XML
-
Supplement
(356 KB) - BibTeX
- EndNote


The inherent uncertainty associated with hydrodynamical modeling, exacerbated by complex and often non-linear relationships, presents a challenge to the accurate prediction of extreme flood events (Jafarzadegan et al., 2023). This uncertainty is frequently linked to diverse categories of errors encompassing inputs, such as the resolution and availability of topobathymetric data (Alipour et al., 2022; Liu and Merwade, 2018; Savage et al., 2016), as well as the quality and precision of boundary conditions derived from hydrological models, other types of hydraulic and/or hydrodynamic models, or hydrometric measurements at monitoring stations (Abbaszadeh et al., 2019, 2022b; Jafarzadegan et al., 2021a, b; Oruc Baci et al., 2023). Beyond these factors, additional sources of uncertainty arise from inherent errors within numerical models, including the type and dimensions of the model, governing equations, assumptions, simplifications of physical processes, and the construction of the computational domain (Bates, 2022; Liu et al., 2019; Teng et al., 2017).
Bayesian model averaging (BMA) has been used in the past 2 decades as a statistical framework for improving the reliability of hydrological or meteorological models by quantifying and reducing uncertainties arising from different models (e.g., Duan et al., 2007; Han and Coulibaly, 2017; Parrish et al., 2012; Raftery et al., 2005). BMA enables the incorporation of multiple model predictions, each possessing its own strengths and limitations, into a unified probabilistic framework. Through this process, BMA techniques provide a robust means of generating ensemble predictions that not only capture the inherent variability of the system but also account for model uncertainties, parameter uncertainties, and data uncertainties. BMA applications have expanded into other domains, such as flood inundation models, aiming to achieve more accurate estimation of flood extent and water level while accounting for different sources of uncertainty during flood events (Huang and Merwade, 2023; Liu and Merwade, 2018, 2019; Moftakhari et al., 2017). The main limitation of BMA in hydrological applications is the use of the same marginal distributions in the construction of joint probabilities and that it is generally assumed that the data and the conditional probability distribution function (PDF) of the data follow a Gaussian distribution. Copula-embedded Bayesian model averaging (Cop-BMA) represents an advancement, distinguishing itself from the traditional BMA formulation, by constructing the joint distribution independently of the marginal distributions of the individual variables of analysis (Madadgar and Moradkhani, 2014). This distinction positions Cop-BMA as a more reliable tool for considering uncertainty from the marginal distribution of the analyzed data.
With the advancements in computational modeling, novel tools have emerged to optimize and enhance outcomes while incorporating new variables into the analysis. The incorporation of precipitation data directly into hydrodynamic models via rain-on-grid (RoG) functionality stands among the innovative features that is gaining recognition by hydrodynamic modelers by allowing for the incorporation of spatiotemporally varied precipitation data into the computational domain. Among these various hydrodynamic models is the Hydrologic Engineering Center's River Analysis System (HEC-RAS) developed by the United States Army Corps of Engineers (USACE, 2022). It has the capability to simulate flooding conditions in both 1D and 2D. Although some investigations have explored the integration of RoG into the HEC-RAS 2D hydrodynamic model and assessed its performance (Costabile et al., 2020; David and Schmalz, 2021; Zeiger and Hubbart, 2021), a significant gap remains in comprehensively exploring the utility of RoG in result evaluation, comparisons with analogous computational models, and the analysis of uncertainties generated from its incorporation as a boundary condition. Currently, multiple regional and global precipitation data and products are available, exhibiting a wide range of spatial and temporal resolutions. These valuable data assets offer the opportunity to enhance the accuracy of hydrodynamic flood modeling to higher levels of detail, although incorporating this type of information introduces an additional layer of uncertainty, prompting the need to account for these variations to enhance the accuracy of estimating both the extent and the depth of flooding.
Comparisons of various precipitation products have been integral in the assessment of quantitative precipitation estimation (QPE) techniques, particularly within the context of precipitation generation and its subsequent impacts. These evaluations encompass an array of data sources, such as observations from satellites, ground-based gauges, radar measurements, reanalysis products, and combinations thereof, all contributing to the nuanced understanding of precipitation patterns (e.g., Gavahi et al., 2023; Nelson et al., 2016; Wootten and Boyles, 2014). In addition to these comparisons, studies have researched the details of QPE techniques and products during extreme hydrometeorological events. The case of Hurricane Harvey serves as a prime example (Brauer et al., 2020; Gao et al., 2021; Habibi et al., 2021; Omranian et al., 2018). This event exhibited the importance of accurate precipitation estimation, given its critical role in extreme flooding. However, the differences between observed and derived precipitation values emphasize the presence of inherent errors and biases within precipitation products. Consequently, relying solely on one dataset for QPE could potentially lead to an incomplete representation of the complex conditions encountered during such extreme events (Gavahi et al., 2023).
The impact of Hurricane Harvey was deeply felt along the Texan coastline. It brought with it an approximate accumulated precipitation of over 1500 mm in the vicinity of Beaumont, TX, and resulted in estimated losses of USD 125 billion based on the 2017 Consumer Price Index (Blake and Zelinsky, 2018). Given the significance of this hurricane and the widespread damage it caused across the state of Texas, considerable efforts have been undertaken to model and quantify the extent and depths of the flooding it generated. Various approaches, including numerical hydrodynamic models (Huang et al., 2021; Jafarzadegan et al., 2021a; Muñoz et al., 2022; Noh et al., 2019; Saksena et al., 2020; Sebastian et al., 2021; Stephens et al., 2022; Valle-Levinson et al., 2020; Wing et al., 2019), as well as combinations of different methodologies or type of models, have been employed (Chen et al., 2021, 2022; Dullo et al., 2021).
By combining hydrodynamic modeling results driven with different precipitation datasets, Bayesian multi-modeling techniques have the potential to account for uncertainties in precipitation products and enhance the flood inundation mapping skills. This article presents an approach that incorporates both deterministic and probabilistic methods in the study of the Hurricane Harvey event. On the deterministic front, the numerical results of the HEC-RAS 2D 6.3.1 hydrodynamic model, incorporating RoG, are evaluated to best describe the hydrodynamic behavior of rivers, coastal processes, and floodplain processes with a computationally affordable model. In parallel, a probabilistic approach is employed to use eight distinct precipitation products as forcing data to the hydrodynamic model to estimate an ensemble of flood extent and water depth in response to this hurricane-induced flood event. The deterministic approach provides a single representation of flood extents and depths based on predefined inputs and parameters, offering a clear understanding of the potential inundation scenario evaluated. However, it fails to adequately capture the uncertainty associated with flood modeling, potentially leading to underestimation or overestimation of flood extents in other scenarios considering highly sensitive input parameters, which can impact the accuracy of results (Di Baldassarre et al., 2010; Bates et al., 2004).
Probabilistic flood inundation mapping incorporates probabilistic techniques to assess and quantify uncertainty, providing a more comprehensive understanding of the range of potential flood outcomes and associated risks. It allows for the integration of different datasets and input values, accommodating a wider range of initial and boundary conditions and improving the robustness of flood predictions (Merwade et al., 2008; Di Baldassarre et al., 2010). Often this approach requires conducting numerous simulations to assess parameter uncertainty, leading to a substantial consumption of computational resources. Consequently, there is a preference for utilizing models that make substantial flow assumptions to conduct these simulations more efficiently and reduce computational cost.
Overall, this study aims to (1) investigate the impacts of different precipitation data in the simulation of extreme floods, such as hurricane Harvey using HEC-RAS 2D, and (2) quantify the uncertainties associated with different precipitation products by generating probabilistic flood inundation maps using the global copula Bayesian (Global Cop-BMA) multi-modeling technique.
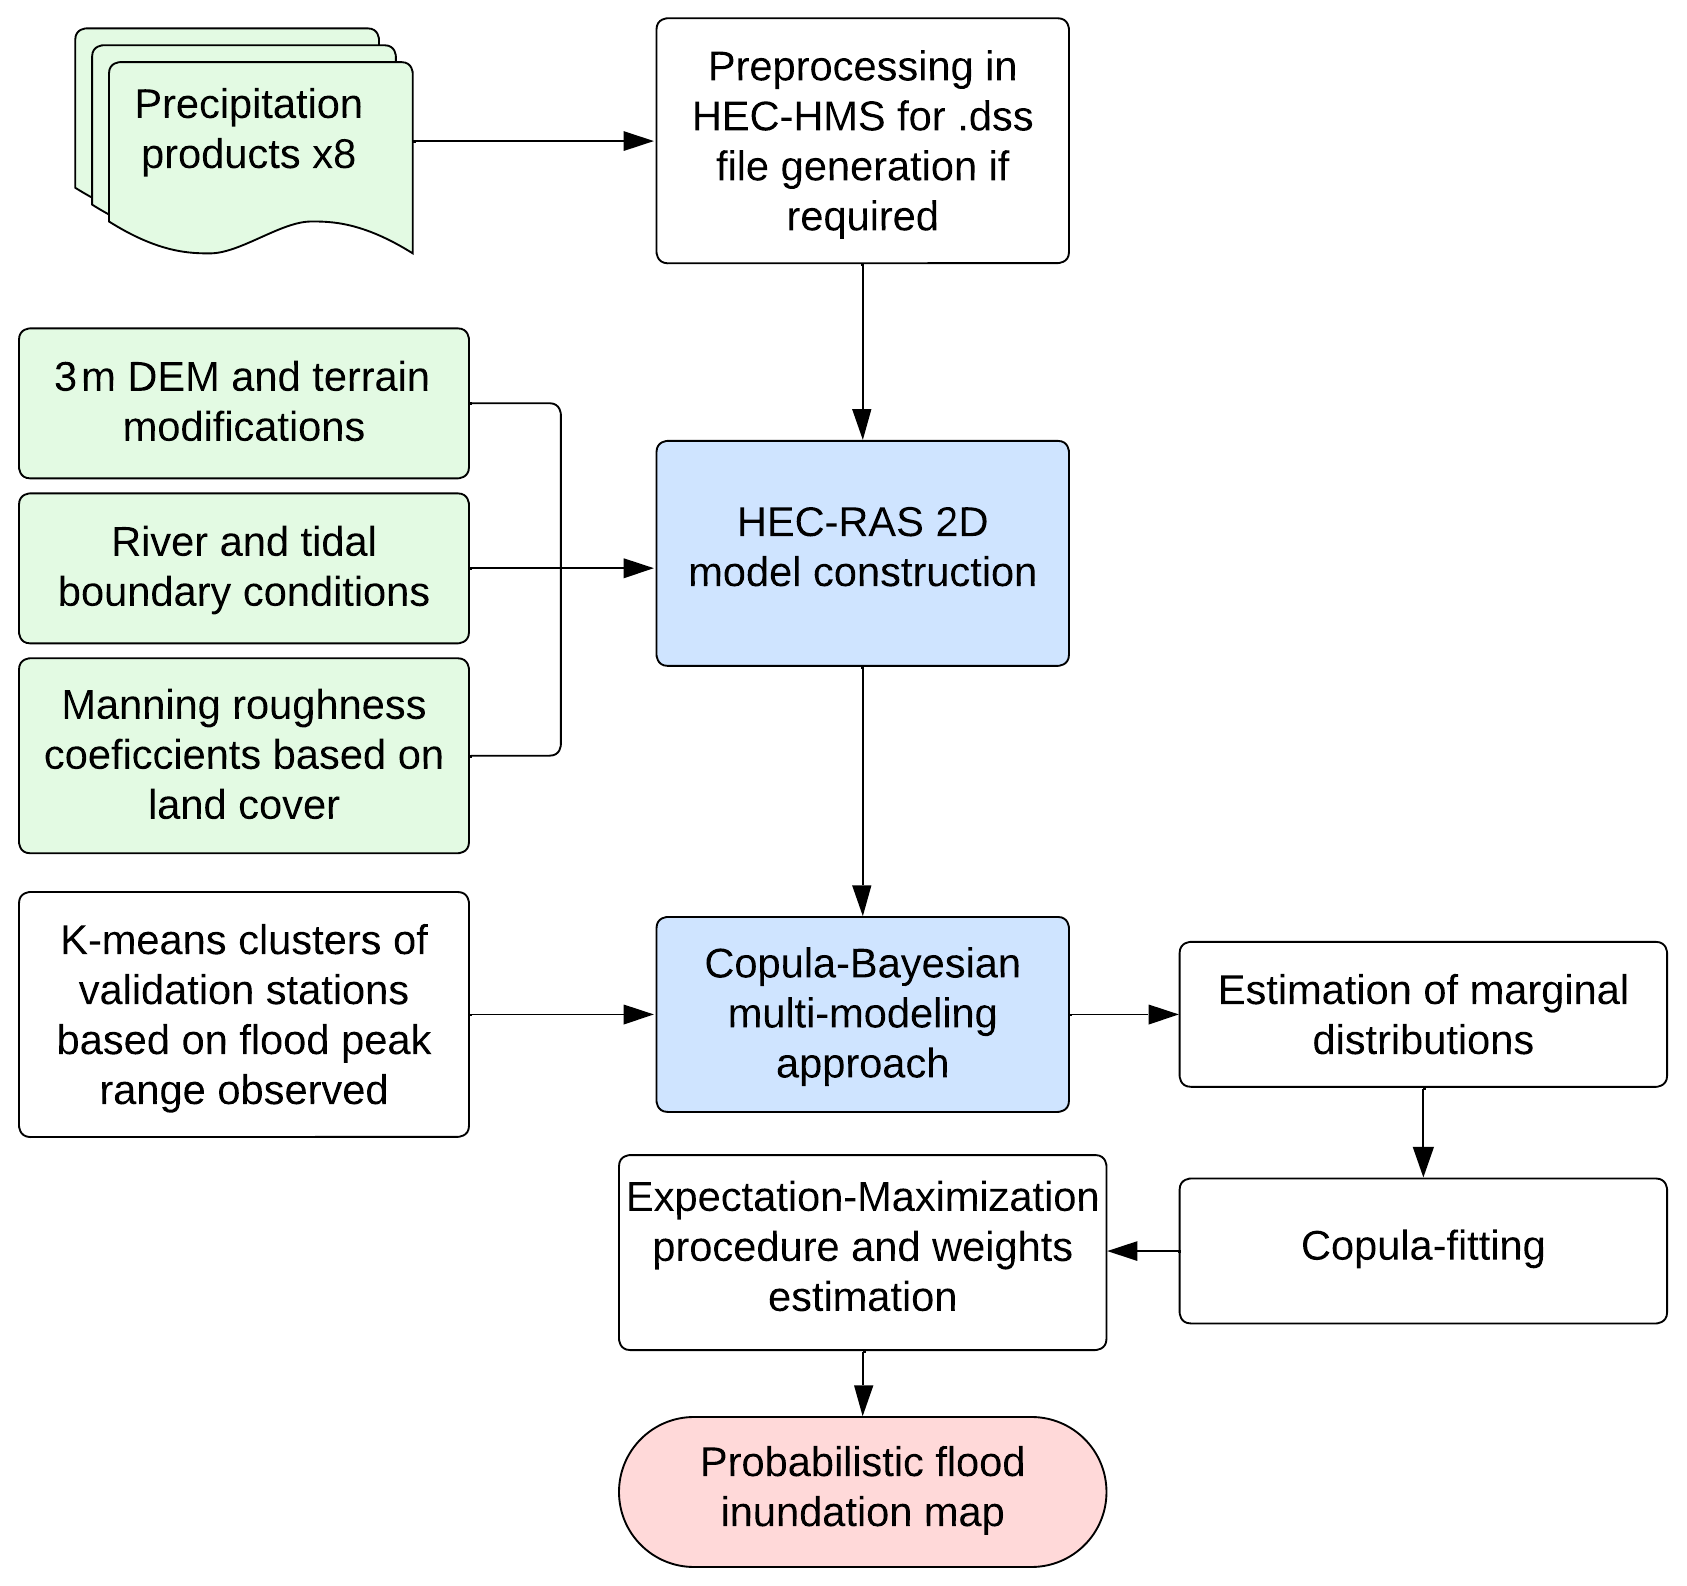
The methodology employed in this study centers on numerical hydraulic modeling and the assessment of flood extent and water elevation using the global copula Bayesian (Global Cop-BMA) multi-modeling technique. Figure 1 represents the main steps required for the implementation of the proposed methodology. First, the HEC-RAS 2D hydrodynamic model is set up, incorporating data such as roughness, boundary conditions (discharges, water levels, and precipitation), and terrain. In this step, the HEC-RAS 2D model is driven with different precipitation products to generate a collection of flood inundation maps. Second, the Cop-BMA technique is employed to combine the flood maps and produce a single probabilistic flood inundation map that accounts for the uncertainties associated with different precipitation products.
2.1 Hydrodynamic modeling
Flood extent and depth maps are typically obtained by performing 1D or 2D hydrodynamic modeling that numerically solves the Saint-Venant or shallow-water equations respectively. Each of these models possesses its own advantages and limitations in terms of computational complexity, assumptions of flow nature, practicality, accuracy, and precision (Bates, 2022; Teng et al., 2017). Among these options, 2D models offer a notable compromise, enabling flood modeling with a satisfactory level of detail while maintaining a manageable computational cost compared to their 3D counterparts. Furthermore, as compared to 1D models, they facilitate the calculation of water levels across floodplains in a more intricate and physically plausible manner over complex geometries.
While a variety of 2D models, both open source and commercially licensed, exist, the current study utilizes the HEC-RAS 2D model version 6.3.1. This choice is motivated by HR2D's open accessibility and significant improvements, such as the integration of subgrid concepts for mesh refinement and the incorporation of shallow-water equations (SWEs). These enhancements mark a distinct advancement over previous versions, making HR2D a suitable candidate for flood modeling. Notably, it surpasses its predecessors, which were employed in studies involving Hurricane Harvey's impact on the city of Houston (Garcia et al., 2020; Jiang et al., 2023; Scotti et al., 2020).
The hydrodynamic model setup is based on three primary inputs: the terrain, the roughness associated with land cover and land use types, and the boundary conditions or external forcings (typically discharge and/or water levels). Recent advancements in model capabilities have enabled the integration of additional boundary conditions within the computational domain. This integration enhances the physical representation of the system, which results in more accuracy and reduces the reliance on other types of models, such as hydrological models. In numerous flooding scenarios, precipitation plays a key role as a substantial portion of this flood driver transforms into direct runoff, leading to flood inundation. This phenomenon is typically referred to as the pluvial impact of flooding and is particularly evident in events like Hurricane Harvey (Saksena et al., 2020). Hence, the RoG functionality within HR2D emerges as a pivotal feature to be incorporated into the methodology.
2.2 Copula Bayesian multi-modeling approach
Among different multi-modeling approaches, Bayesian model averaging (BMA) has been widely used for combining multiple model predictions and producing more reliable results that account for the uncertainty in each model. BMA produces a predictive probability distribution function (PDF) of a variable, water surface elevation in this case, which is the weighted average of the PDFs associated with each model prediction. The weights reflect the prediction skill of different models. By considering the performance of all independent k model predictions , BMA eliminates the need to select a single “best” model, thereby providing a more robust prediction (Madadgar and Moradkhani, 2014). The law of total probability is used to calculate the distribution of target (predicted) variable y using both observed data and model predictions. Considering the dynamic nature of these models, the time component is integrated into the law of total probability as expressed in Eq. (1):
where is the PDF of yt given the model and training data Y, and is the likelihood of model prediction being corrected, given the observations, Y, during the analyzed period. These weights reflect the performance of models in predicting the target variable with a total sum equal to 1. In summary, the weight w reflects the degree to which a model aligns with the observed data; that is, models demonstrating high performance receive higher weights.
With BMA, the assumption that the posterior distribution follows a Gaussian distribution is commonly used as , but this may not be correct in all cases given the nature of the data used. In these cases, it is convenient to transform the data from its original space to a Gaussian space via Box–Cox transformation. Considering the target variable as water surface elevation, the Yeo–Johnson power transformation is preferred to account for negative values. This is particularly relevant in coastal environments where such values are commonly observed due to tidal conditions.
To overcome the limitations of BMA associated with the Gaussian distribution of variables and their joint distribution, a second solution involves integrating Copula multivariate functions into the BMA approach, known as Cop-BMA. Copulas are functions in the unit cube, which can link multi-dimensional distributions to their 1D marginals (Sklar, 1959), and they provide a flexible and powerful tool for modeling the dependency structure between variables, regardless of their individual marginal distributions and model dependency. This is particularly valuable in scenarios where the relationships between variables are complex and may not follow a simple linear pattern. Cop-BMA modifies the BMA predictive distribution by relaxing the assumption on the parametric posterior distribution , replacing it with a group of multivariate copula functions. Multiple copula functions have been applied to post-process hydrological forecasts (Abbaszadeh et al., 2022a; He et al., 2018; Madadgar et al., 2014; Madadgar and Moradkhani, 2014) and are used in this study for the estimation of water surface elevation posterior distribution. Equation (1) is modified to incorporate copula functions, replacing the posterior distribution following the procedure from Abbaszadeh et al. (2022a). Supported by Sklar's theorem, copulas can express the joint behavior among correlated variables through their marginal CDFs, as shown in Eq. (3):
where C is the cumulative distribution function (CDF) of the copula, and P(xi) is the marginal distribution of xi denoted as ui for the interval [0, 1]. Using the PDF of copula, the joint probability density function of the variables involved can be defined as follows:
The conditional probability distribution of x1 given x2 is defined in Eq. (5):
Considering the copula joint probability from Eq. (4), Eq. (5) can be expressed as
Since u1 and u2 are the observations (yt) and simulations respectively, the posterior distribution in Eq. (1) is replaced with the conditional probability distribution from Eq. (6) as
where represents the PDF of the copula function. To estimate weight wi, it is required to maximize the log likelihood function of the vector of parameter as
The expectation–maximization (EM) algorithm, proposed by Raftery et al. (2005), is used to maximize Eq. (8). This is achieved through iterative updates of the weights by adjusting a latent variable until a specified tolerance criterion is met.
In order to probabilistically estimate the flood extent and depth over a large domain, a comprehensive approach is necessary to spatially characterize the outcomes derived from different numerical models or, in this context, various hydrodynamic simulations with different precipitation products. This becomes especially crucial when the variables used in this study, namely the precipitation products and water level resulting from numerical simulations, exhibit significant spatial variability. Parameter regionalization plays an important role in identifying clusters or regions where assigning a single parameter for the whole domain is not reasonable (Jafarzadegan et al., 2020). To estimate weights for these clusters or regions, a global extension of the Cop-BMA has been developed, following the same procedure as the EM algorithm introduced earlier for the estimation of weights and likelihood (Yan et al., 2020). Likelihood function (Eq. 8) is adjusted to consider multiple stations over each cluster:
Here, N refers to the number of stations per cluster.
The Galveston Bay area is located in southeastern Texas on the Gulf Coastal Plain and covers parts of Brazoria, Chambers, Galveston, Harris, and Liberty counties. As the largest estuary in the state, it exhibits a notable level of urbanization in the western zone, primarily attributed to the city of Houston. The city has several bayous and creeks that flow mostly southeastward into Galveston Bay. To the north is the San Jacinto River, which flows from the discharge of Lake Houston spillway to the south.
3.1 Model setup
The HEC-RAS 2D model is built through the RAS Mapper tool version 6.3.1 with shallow-water equations and the Eulerian–Lagrangian method (SWE–ELM) formulation for governing equations. It has a total geometry extension of 5514.8 km2 with 396 063 computational cells and a spatial resolution of 200×200 m refined to 75×75 m or less in the Houston area (Garcia et al., 2020; Scotti et al., 2020). The unstructured meshing approach used in this study results in proper characterization of terrain complexities in urban areas while maintaining a reasonable computational time. For unsteady flow analysis in the HR2D setup, an hourly simulation time window is defined between 16 August 2017 and 3 September 2017. The 2D flow domain is defined considering the most significant discharge contributions to the Galveston Bay area (Fig. 2). The main highways in the Houston area, including Texas 8 Beltway and Interstate 610, serve as critical watershed boundaries for hydrodynamical modeling in the urban regions. Therefore, an additional major effort was made to incorporate break lines along these features in Houston. This allows for proper hydro-enforcement and enhances hydraulic connectivity between the computational cells.
The NCEI's Continuously Updated Digital Elevation Model (CUDEM) bathymetric and topographic DEM, with a arcsec resolution (National Centers for Environmental Information, 2014), is used as the topography data. Since a fraction of the study area is highly urbanized, there is not information on all the bridges, culverts, and the geometry of the artificial channels. Topographic adjustments are made within RAS Mapper to guarantee and preserve the hydraulic characteristics of the streams.
Manning roughness coefficients are spatially assigned using the 2019 National Land Cover Database (Dewitz and U.S. Geological Survey, 2021). To reduce the spatial complexity of various land covers in the study area, the land cover map is simplified into five groups of developed and urban areas, forests and wetlands, open water, navigational areas, and barren land (crops, pasture, agriculture). In previous research conducted by Muñoz et al. (2022), they used Latin hypercube sampling and tested various Manning roughness values for different land cover categories during the Hurricane Harvey event. We use their calibrated parameters as a reference for the HR2D model setup. These values are adjusted slightly during the calibration period, 7 d before the occurrence of Hurricane Harvey. It is worth mentioning that our simulations were performed on a desktop computer with an Intel Core i7-7700 CPU at 3.60 GHz and 32 GB RAM, averaging about 7 h per simulation for the time window.
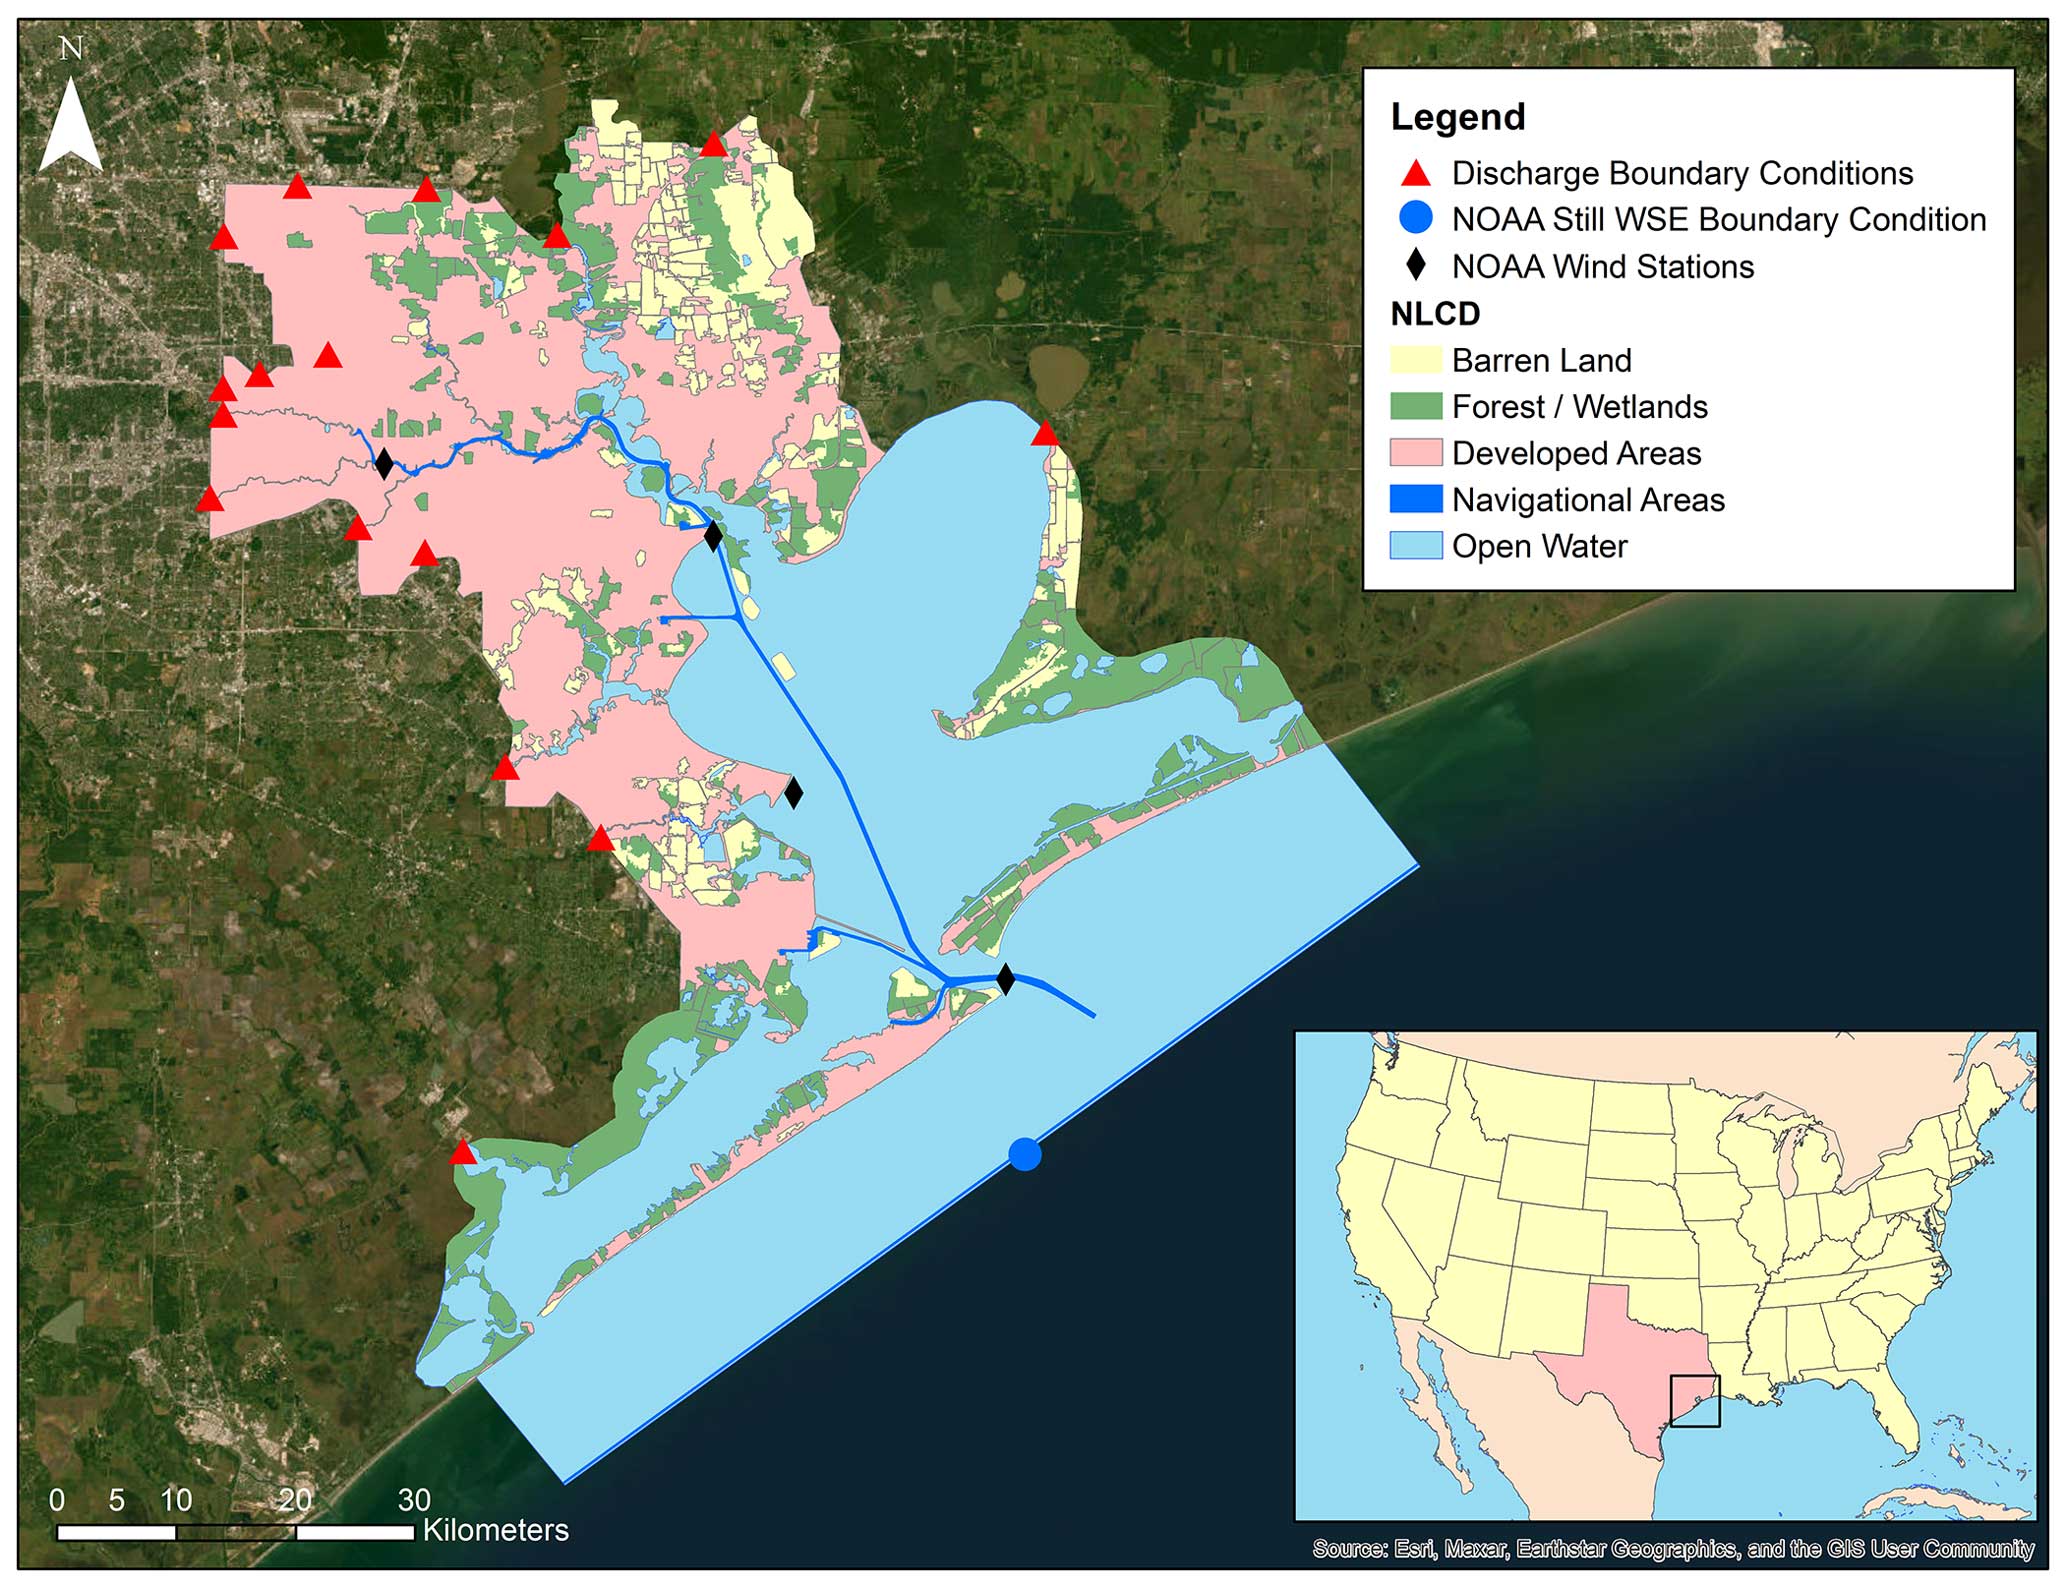
Figure 2Study area map with discharge, still-water surface elevation, and wind stations as boundary conditions. NLCD land covers are incorporated as Manning's roughness in the HEC-RAS 2D model. Basemap: ESRI World Imagery.
3.2 Discharge and tidal forcings
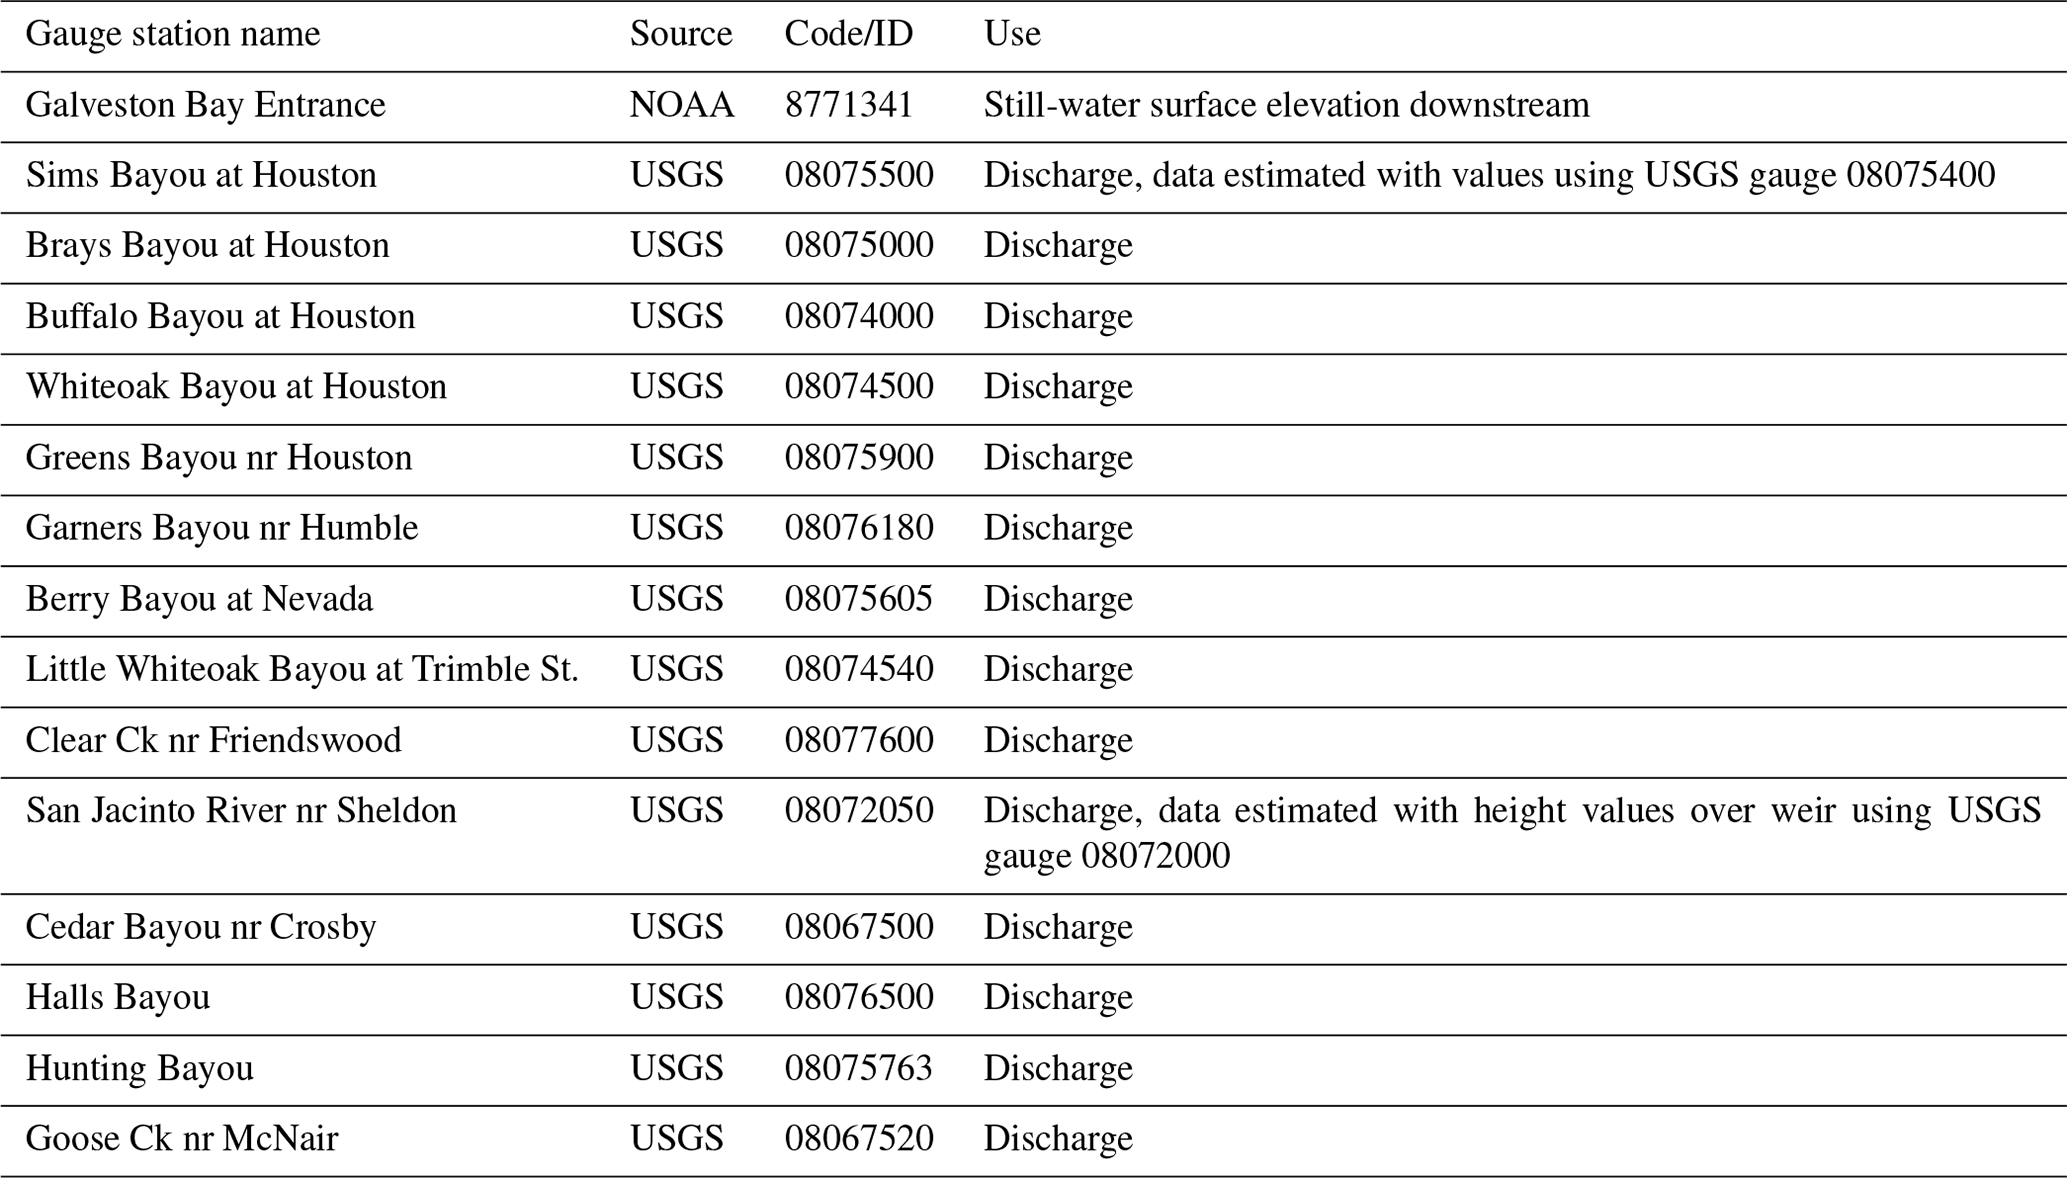
Hourly discharge data from the U.S. Geological Survey (2016) are used for most of the streams incorporated within the HR2D model. Missing data for some gauges are estimated by considering their correlation with other gauges located upstream. The U.S. Army Engineer Research and Development Center (ERDC) has provided the daily discharge time series data for Dickinson Bayou, Chocolate River, and Trinity River. San Jacinto River discharge values are estimated using gauge height time series from the USGS gauge Lk Houston nr Sheldon, TX (08072000). As the downstream boundary condition, the hourly still-water elevation data from the National Oceanic and Atmospheric Administration (NOAA) Galveston Bay Entrance station are selected. Table 1 summarizes the boundary conditions applied to the HR2D model.
Table 1Summary of discharge and still-water surface elevation boundary conditions used in the model setup.
3.3 Precipitation and wind forcings
Extensive efforts have been dedicated to the detailed comparison and evaluation of diverse precipitation datasets generated on a regional or global scale. Within this framework, researchers have rigorously examined the total precipitation outputs derived from various sources, their alignment with alternative datasets, and their consistency with gauge-based measurements.
The investigation into the spatial and temporal patterns of extreme precipitation events, particularly during Hurricane Harvey, has become essential due to the event's catastrophic impact (Fagnant et al., 2020; Wang et al., 2018). Researchers have taken a comprehensive approach, encompassing a broad spectrum of precipitation products, which include both remote-sensing- and model-based estimations. The comparison often extends to not only the total accumulated precipitation but also its spatiotemporal distribution, intensity, and duration. This multifaceted evaluation aims to discern the differences in performance, uncover potential biases, and ascertain the overall reliability of these estimates (Brauer et al., 2020; Chen et al., 2020; Gao et al., 2021; Habibi et al., 2021; Omranian et al., 2018).
In this study, an evaluation of seven distinct precipitation products is made, across the temporal and spatial resolutions that are conducive to capturing the intricacies of hydraulic routing through HR2D. The precipitation products considered for Cop-BMA assessment include the following:
-
the Climate Prediction Center MORPHing technique (CMORPH) (Xie et al., 2019)
-
Daily Surface Weather Data on a 1 km Grid (Daymet) (Thornton et al., 2022)
-
ERA5 (Muñoz Sabater, 2019)
-
Integrated Multi-satellitE Retrievals for GPM (IMERG) (Huffman et al., 2019)
-
Multi-Radar Multi-Sensor (MRMS) (Zhang et al., 2016)
-
NCEP Stage IV precipitation data (Du, 2011)
-
the North American Land Data Assimilation System version 2 (NLDAS-2) (Xia et al., 2009).
To facilitate analysis and modeling, these datasets undergo preprocessing in the Hydrologic Modeling System (HEC-HMS) software to generate .dss files, thus facilitating their integration into the HEC-RAS unsteady flow meteorological data.
It is important to emphasize that while the primary focus of this research is to assess the integration of precipitation data in compound flood events, certain limitations exist. Notably, NLDAS and Daymet products do not provide coverage for terrain areas near the coastline, particularly in the southern region of the model domain, which includes Galveston and Texas City. This geographical limitation underscores the need for careful consideration when interpreting and generalizing the findings within these specific regions.
In addition to the seven precipitation products mentioned above, rain gauge (RG) data, provided by the Harris County Flood Warning System (HCFWS) portal (https://www.harriscountyfws.org/, last access: 15 October 2023), are integrated into the study as comparison for modeling results. The Houston metropolitan region comprises a network of 188 gauge stations distributed across the county. For this study, a subset of 20 stations is selected within the study domain, ensuring the availability of continuous rainfall data specifically during the occurrence of Hurricane Harvey over the city of Houston. To facilitate the integration of these rain gauge measurements as spatially distributed data, the inverse-distance-squared weighting (IDW) interpolation method is employed (Chen and Liu, 2012). This technique allows for the estimation of precipitation values at locations that do not have direct measurements by considering the spatial proximity and inverse distances between available gauge stations.
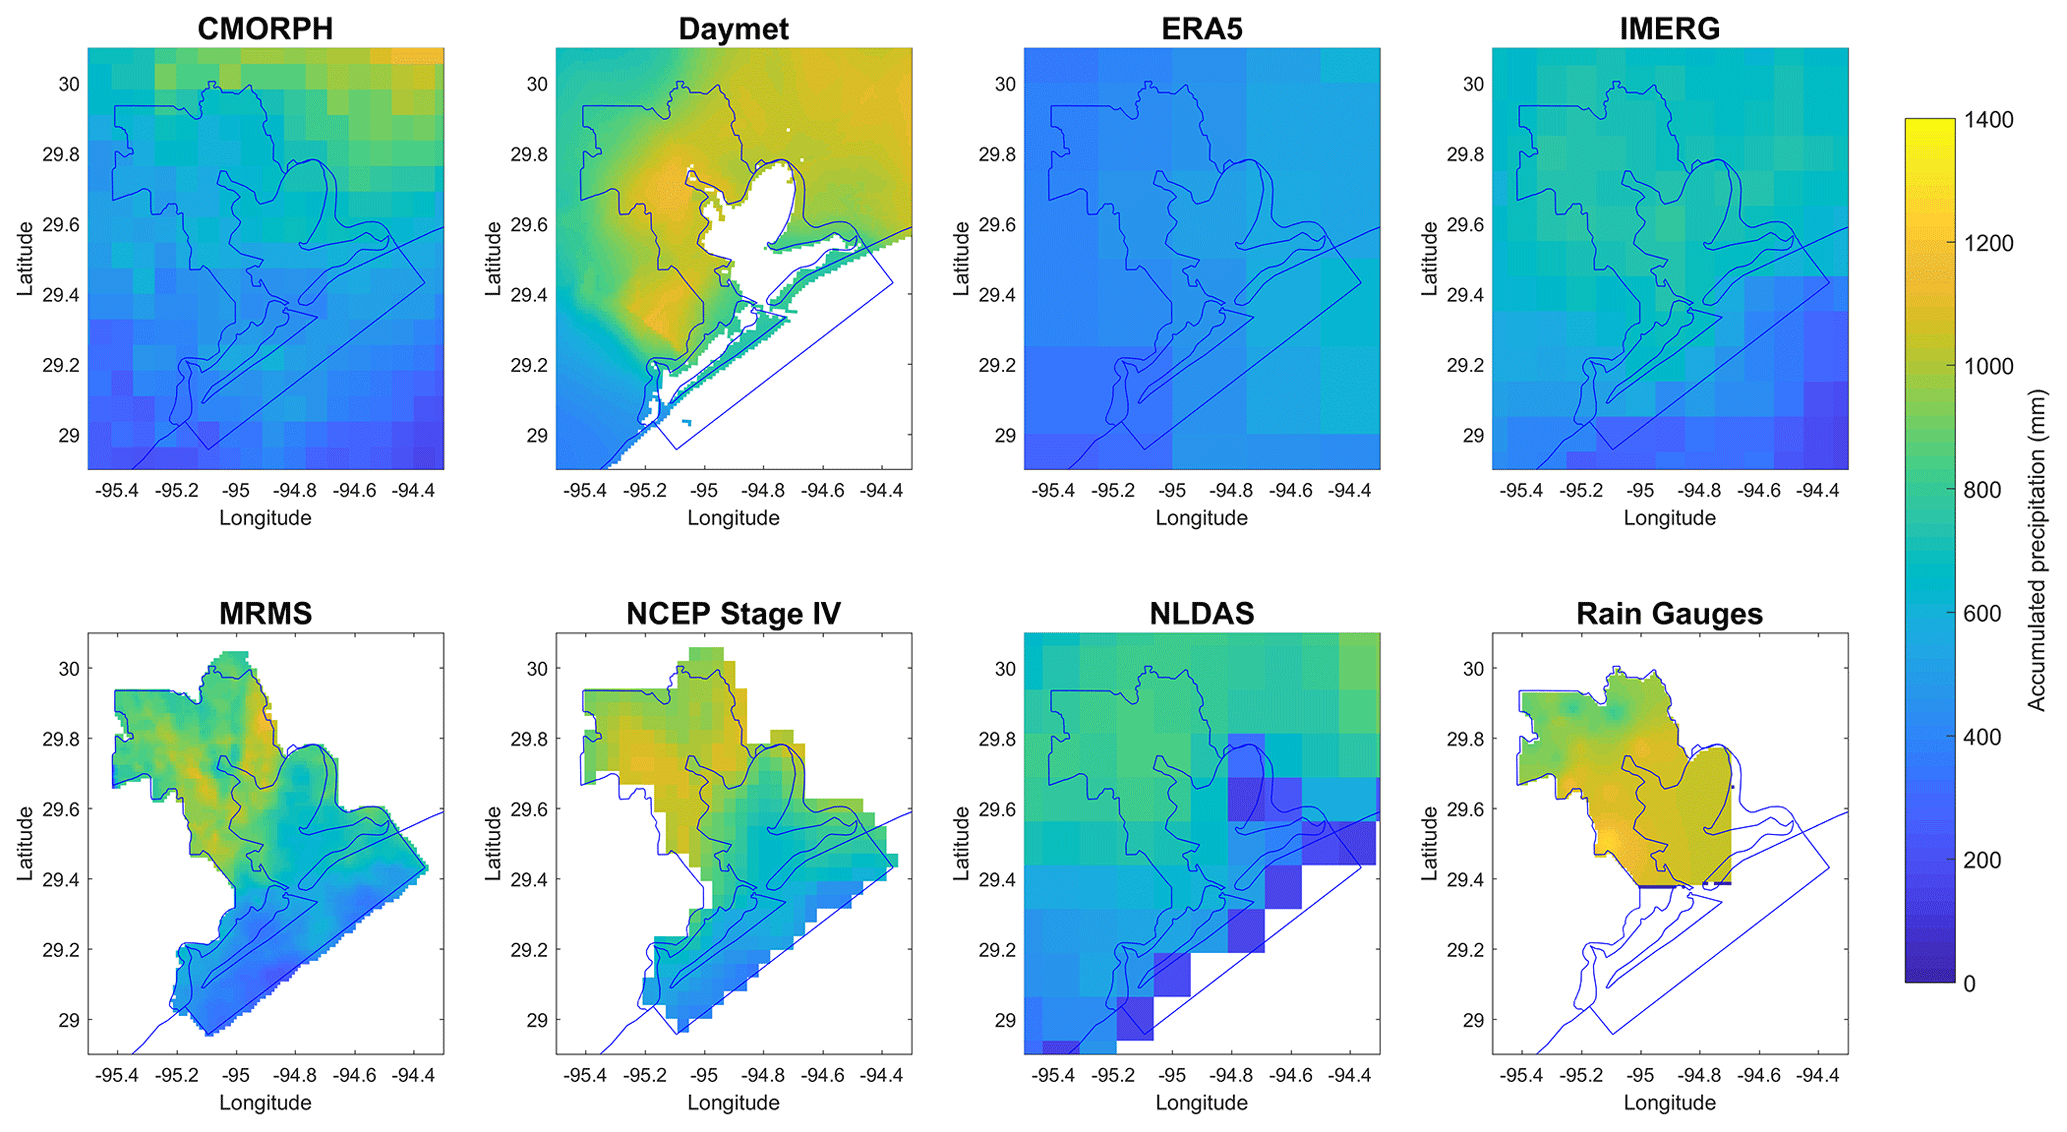
Figure 3Spatial distribution accumulated precipitation of the seven different precipitation datasets, rain gauge data, and their coverage over the study area during the Harvey event from 23 August 2017 to 3 September 2017.
Table 2Spatial and temporal details of the eight precipitation products used in this study.
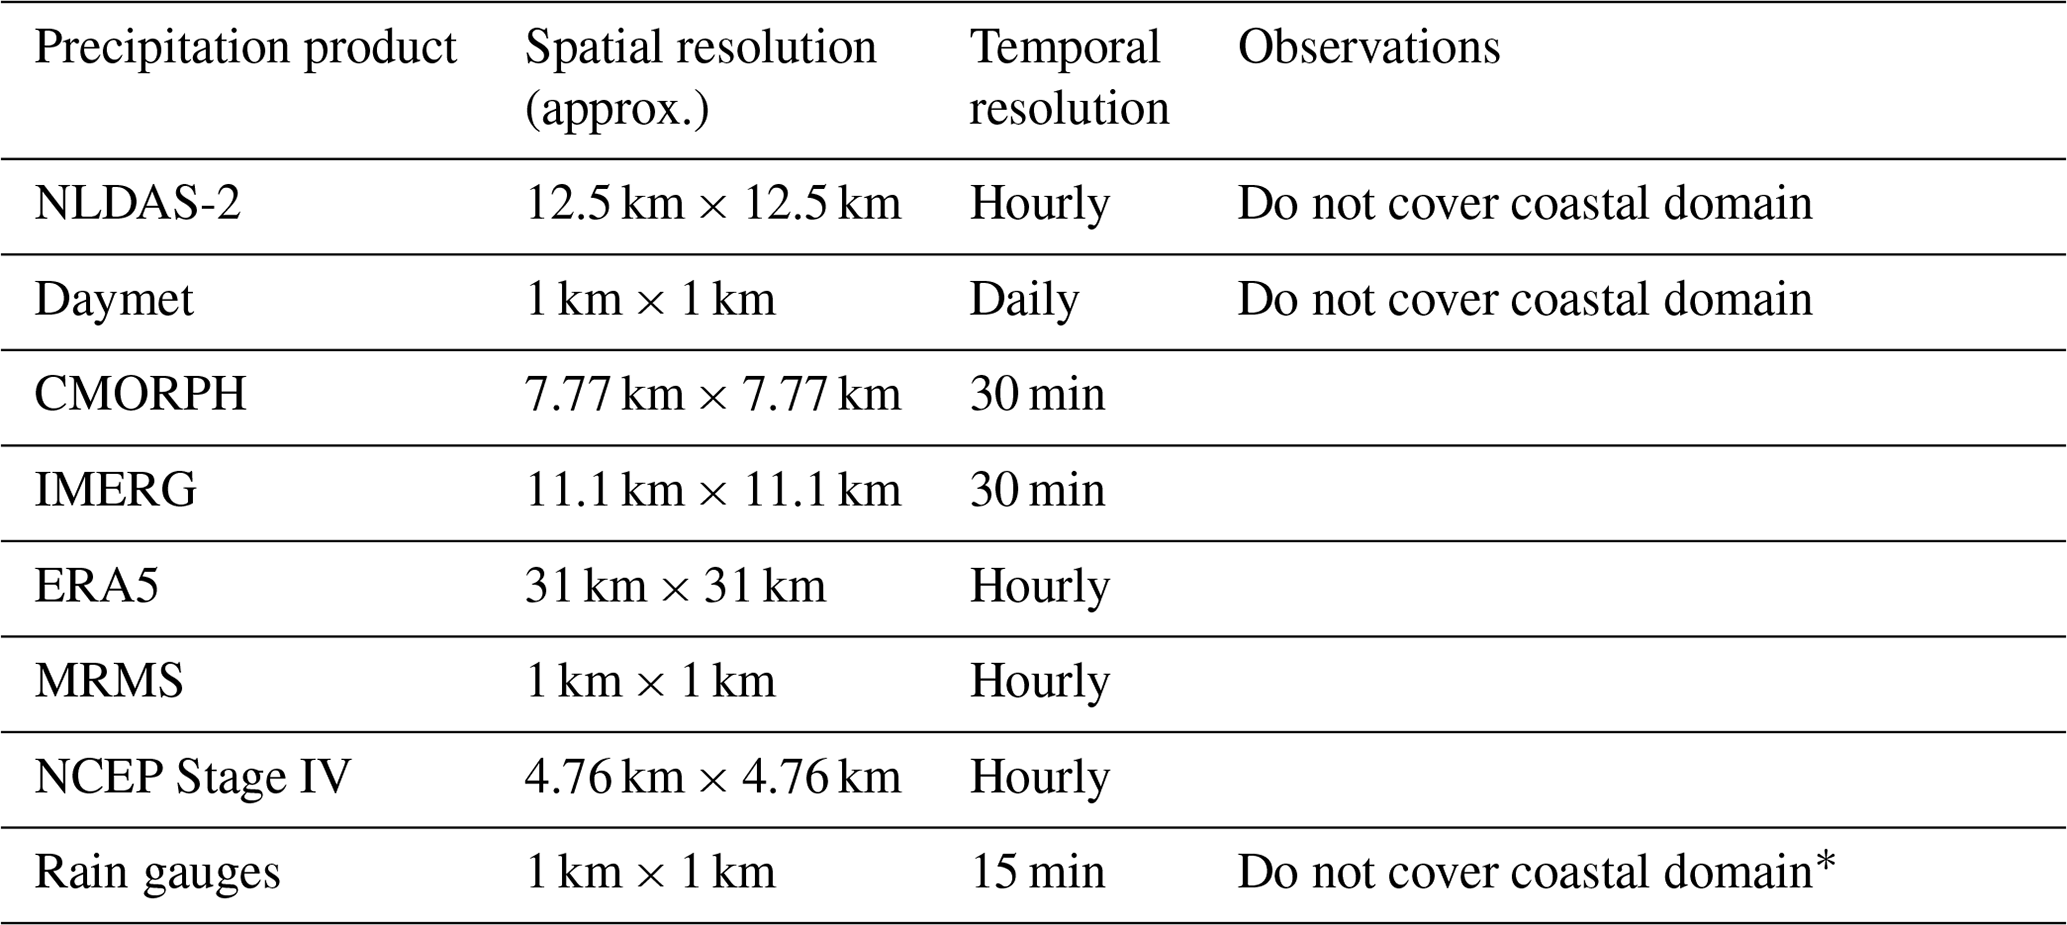
*Rain interpolated between 20 rain gauges within HEC-RAS.
Hurricane Harvey had a significant impact on the Galveston Bay region, manifesting itself as a tropical storm characterized by varying maximum wind speeds. These speeds ranged from 78.5 to 34.6 km h−1, spanning the entrance of Galveston to downtown Houston. Given the considerable length of the Galveston estuary, incorporating wind forcing into the study is essential to comprehensively account for its hydrodynamic behavior over the surface of the water. Hourly wind velocity and direction data were integrated from specific NOAA stations across the study area. These stations include Galveston Bay Entrance (8771341), Eagle Point (8771013), Morgans Point (8770613), and Manchester (8770777). These meteorological boundary conditions are introduced into the HR2D model to accurately simulate the effects of wind within the hydrodynamic system. The Lagrangian reference framework and the drag formulation of Andreas et al. (2012) are selected. Similar to precipitation data, the IDW method is also selected for wind spatial interpolation along the study area.
The simulations conducted within the HR2D model involved fixed Manning coefficients, ensuring that the water surface elevation is solely influenced by the applied precipitation forcing. A model warm-up period is set from 16–23 August 2017. The results during this interval are exclusively used to calibrate the roughness coefficients in comparison to observational data. Comprehensive assessment of the model's performance is conducted over the period from 23 August to 3 September 2017, with hourly results. This temporal scope encompasses the passage of Hurricane Harvey and the subsequent recession of the water levels.
Figure 4 presents hourly hydrographs of observed water surface elevation (WSE) data alongside simulated outputs for various validation stations (information on validation stations is in Table S1 in the Supplement). The simulation results highlight that relying on a single QPE does not lead to consistent responses across the evaluated hydrographs. It becomes apparent that some stations experience an overestimation of water levels, while in other areas within the region, the response tends towards underestimation for the same product. A notable case is observed with the Daymet product, which has a finer spatial resolution (1 km × 1 km), yet its daily precipitation values struggle to capture the hourly fluctuations evident in the observed data. Notably, the hydrograph results derived from the Daymet product exhibit a step-like behavior on a daily scale in several validation stations, particularly within the upper reaches of the modeled watersheds.
Among several validation stations, a discernible alignment between observed values and ensembles generated by different precipitation datasets can be observed. However, it is crucial to acknowledge that in certain instances, the variability among ensembles can exceed 2 m across different products, and certain ensembles fail to accurately replicate the behavior of observed values. These observations underscore the challenges involved in accurately reproducing the temporal and spatial patterns of precipitation, especially in regions characterized by complex topography and intricate watershed characteristics and influenced by structural uncertainty or parametrization within the HR2D model. Additionally, inland initial infiltration processes that might have occurred during the Hurricane Harvey event could have impacted the results of water surface elevation at gauges in modeled watersheds and were not considered in the hydrodynamic model. Furthermore, in highly urbanized systems, drainage systems play a significant role during storm events. Due to the limitations of the employed model, such hydrosystems are not included in the simulations, adding a layer of uncertainty due to the model structure and the type of physical processes involved.
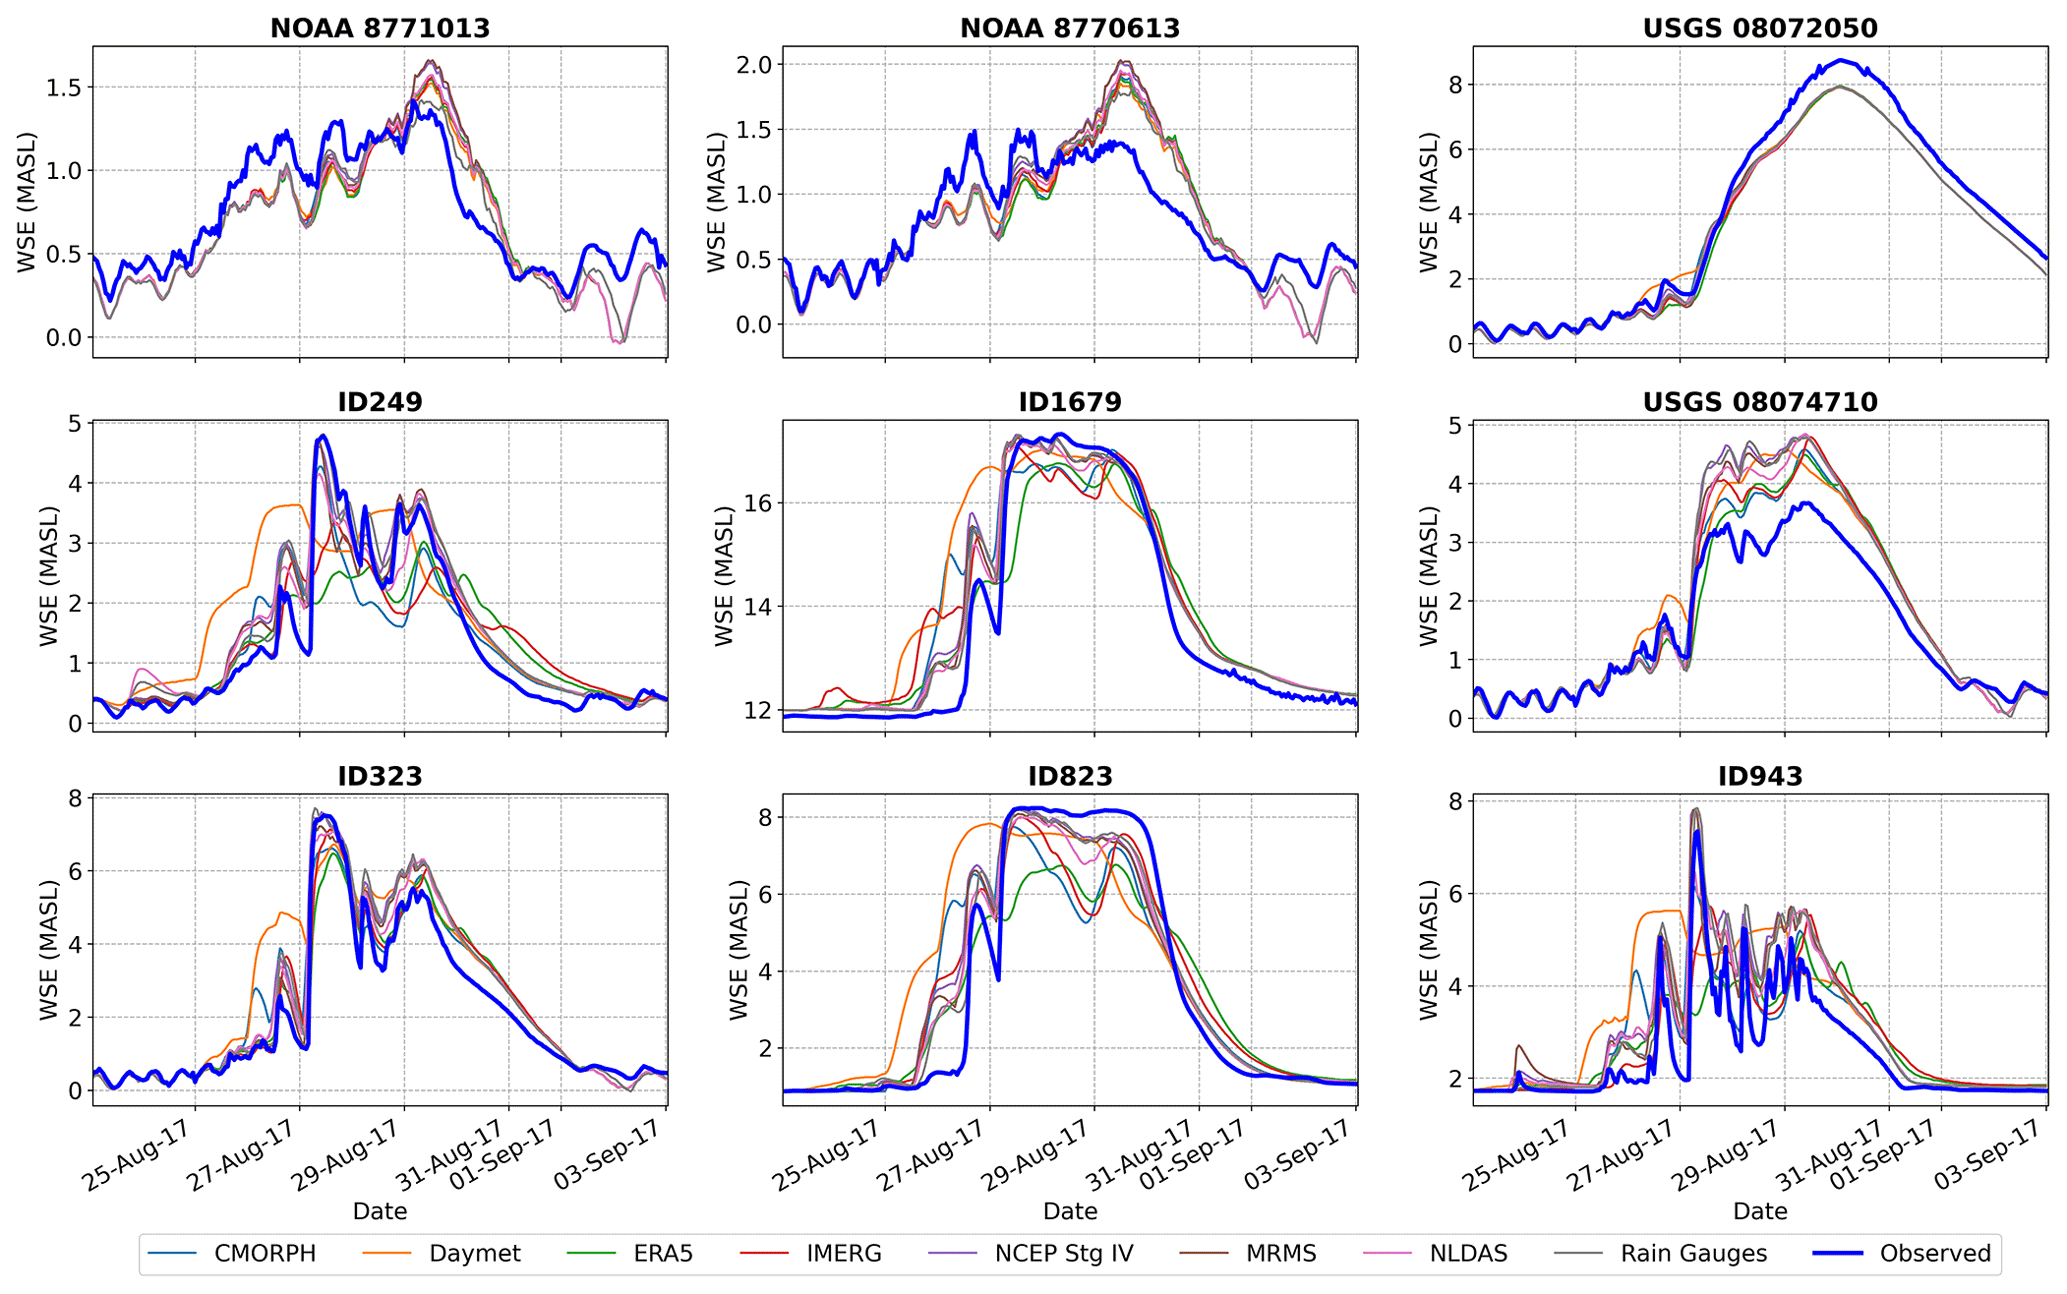
Figure 4Hydrographs of simulated water surface elevation (WSE) by the HEC-RAS 2D model using eight different precipitation datasets along with the observed WSE values observed for Hurricane Harvey. Each subplot represents the result at different validation stations where ID refers to stations in the Harris County Flood Warning System.
4.1 Global Cop-BMA flood elevation and mapping extent
With the integration of the Cop-BMA approach, it becomes feasible to enhance the accuracy of flood depth estimates at each validation station. Nonetheless, the generation of results while considering their spatial distribution along a large domain can be streamlined through clustering techniques.
For this purpose, the K-means method is used to partition the 30 validation stations along the study area from different sources (USGS, NOAA, and HCFWS) into three primary clusters, a selection determined by applying the elbow method to identify the optimal K value. Clustering is implemented by utilizing a flood range metric, defined as the difference between the peak value and the initial observed value at the beginning of the Hurricane Harvey evaluation period. In this method, each validation station is associated with an area of influence, which is delineated based on topographic attributes and often coincides with watershed concentration points. In some instances, engineering expertise is employed to supplement the delineation process. Figure 5 shows the spatial configuration of validation stations, their corresponding areas of influence, and the resultant clustering regions within the study area. This strategic clustering allows for a more focused and structured analysis, facilitating the extraction of meaningful insights from the ensemble data generated by different precipitation products.
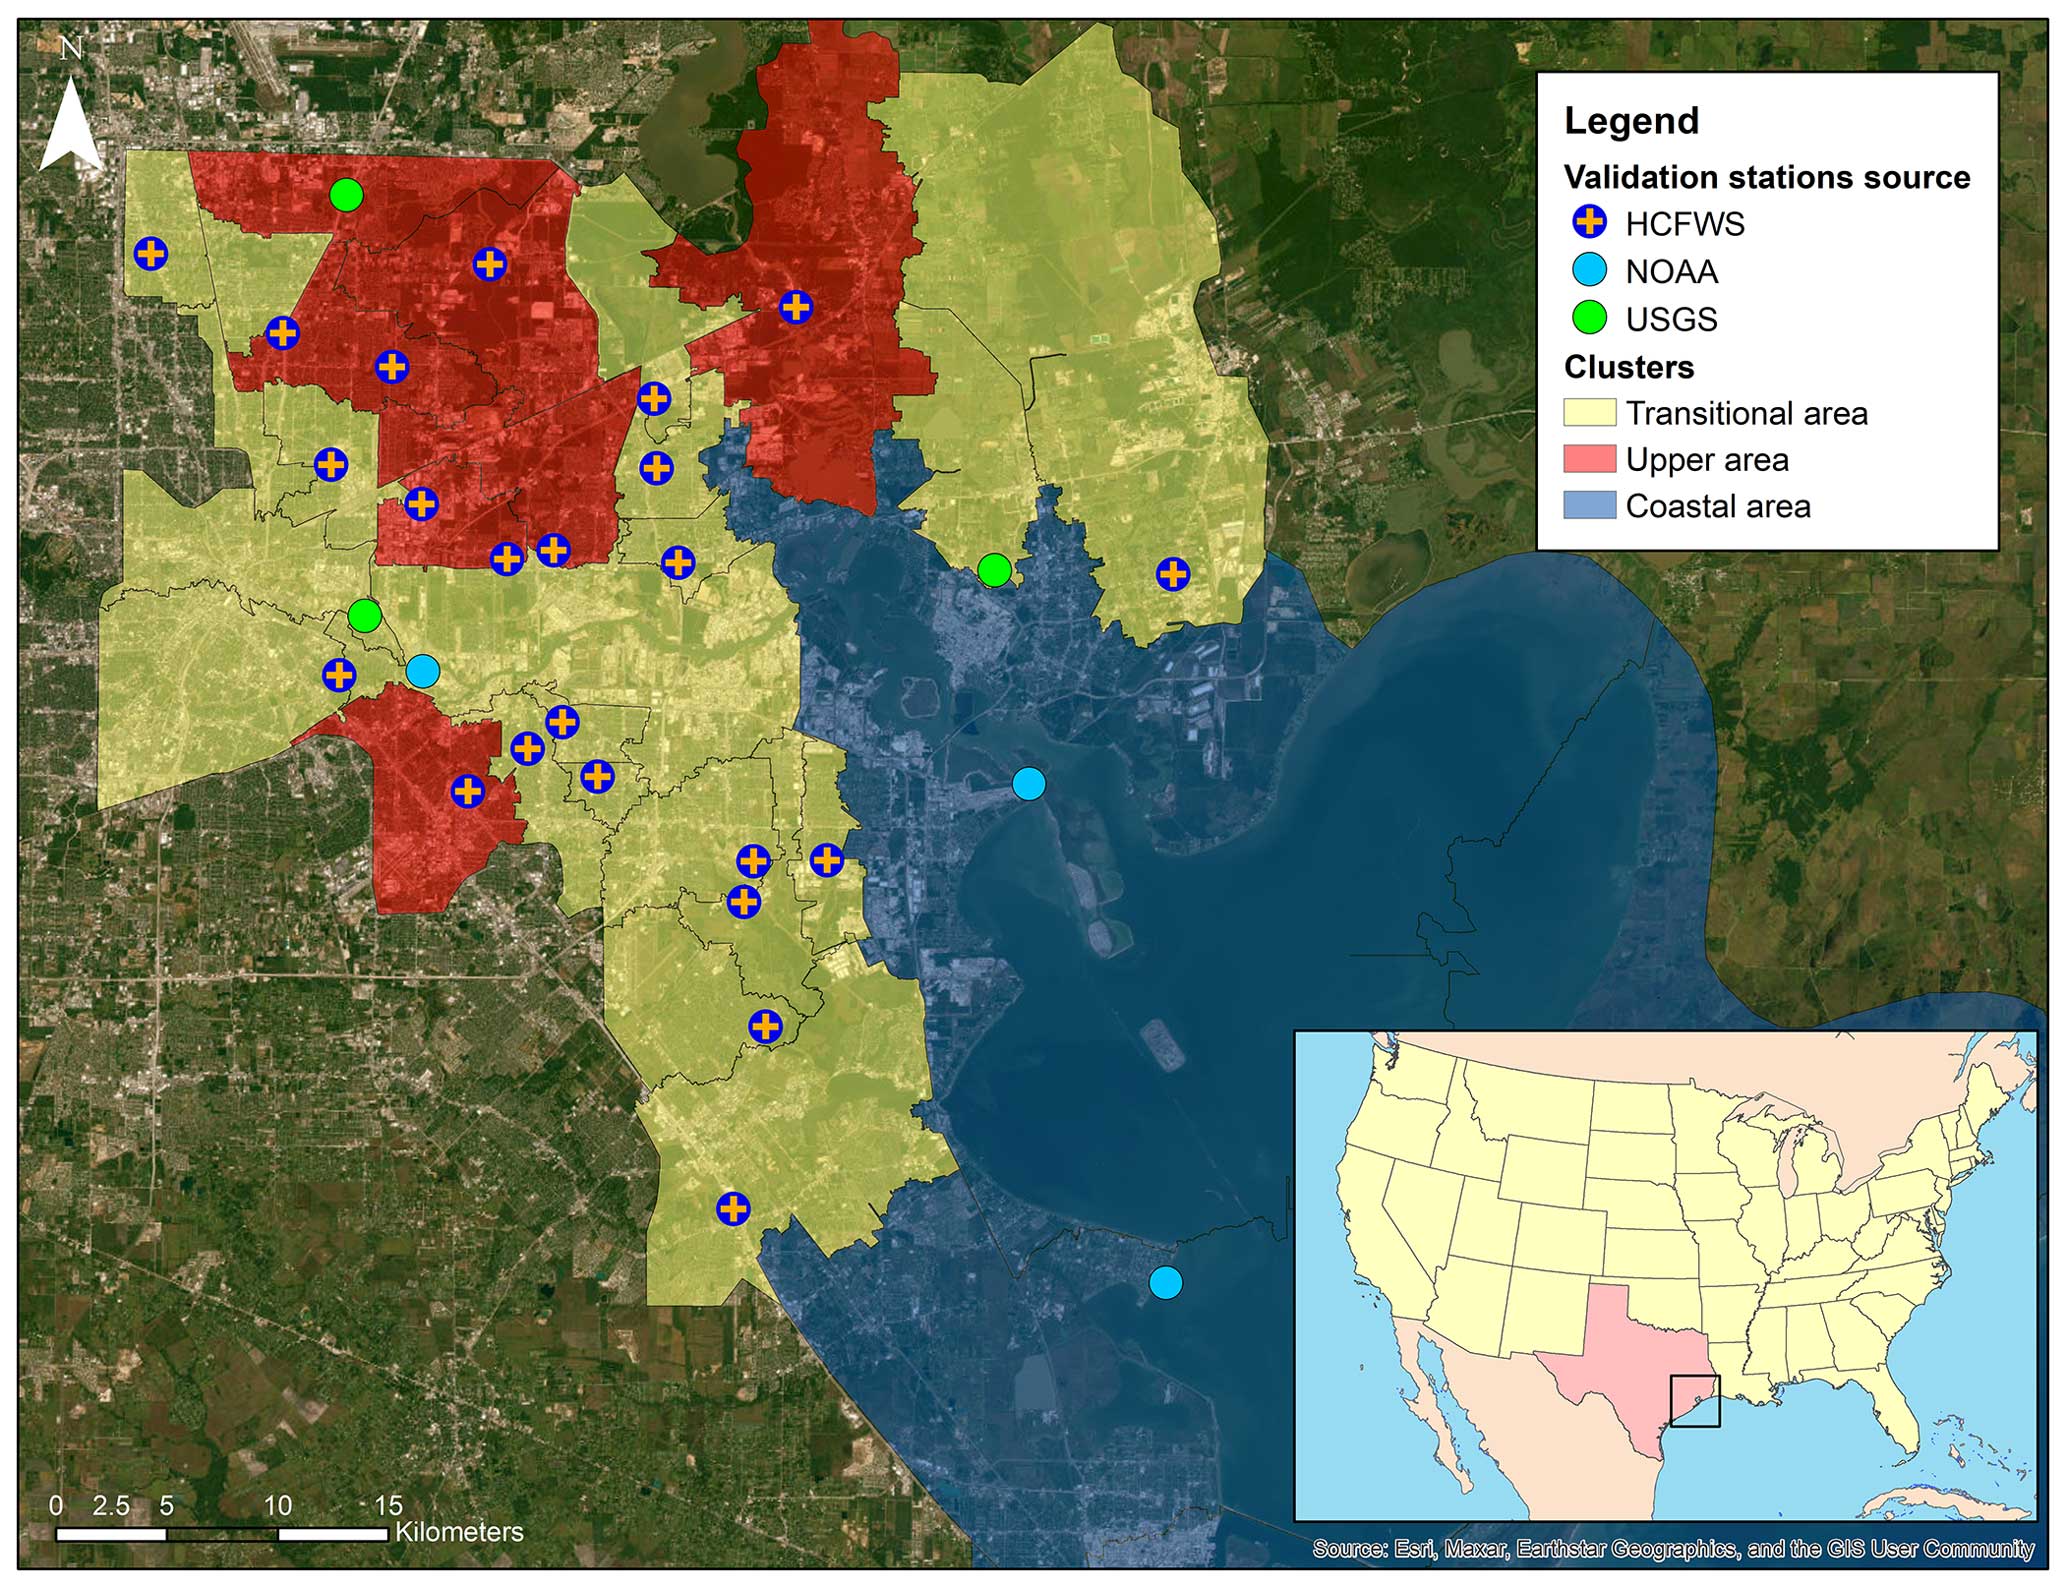
Figure 5Location of validation stations, areas of influence, and clustering regions in the study area. The entire domain is clustered into three regions of coastal, transitional, and upper areas. Basemap: ESRI World Imagery.
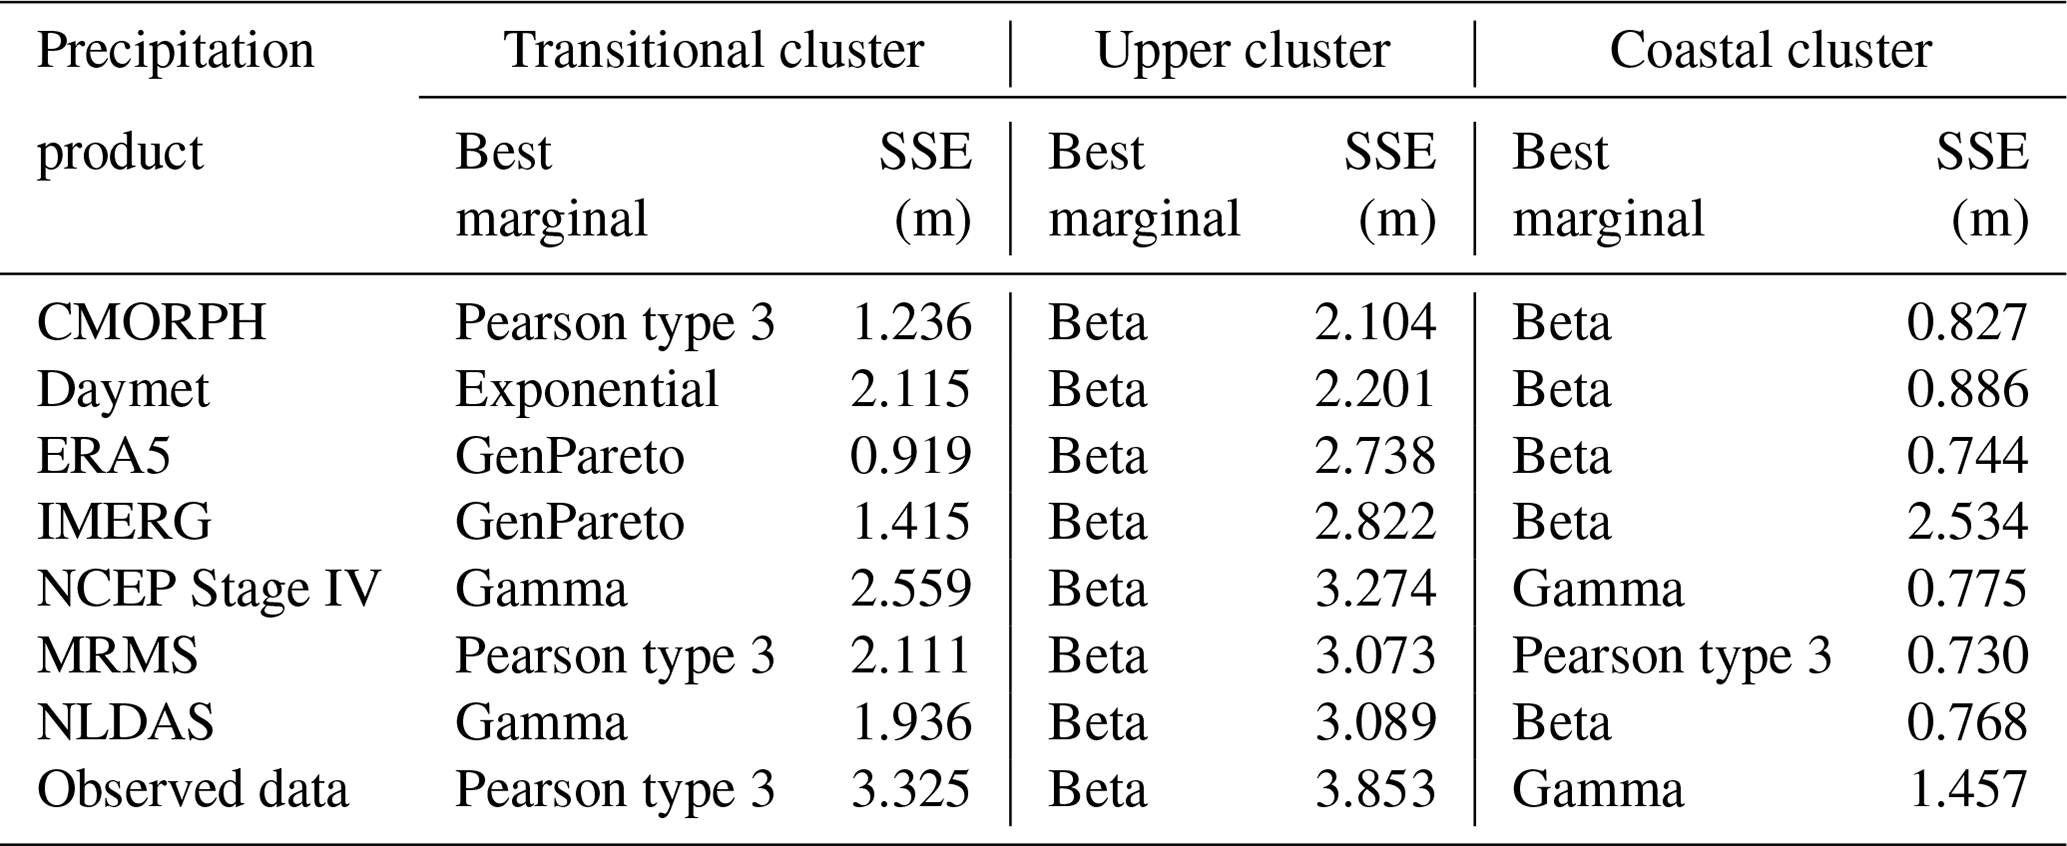
A crucial step in implementing Global Cop-BMA is to fit marginal distributions of observed and simulated data and determine the copula parameters that define the underlying correlation structure of the multivariate distribution. To fit marginal distributions, an array of probability distributions undergo testing. This comprehensive evaluation includes a variety of distributions such as Cauchy, Gumbel, alpha, beta, Gaussian, exponential, gamma, lognormal, generalized Pareto, generalized extreme, Weibull, and others. Given the intrinsic nature of the data in this study, which comprise water surface elevation data in coastal environments, it is essential to choose statistical distributions that accommodate both positive and negative values within their range of support. Parameter estimation for each distribution is performed using the maximum likelihood estimation (MLE) technique. To identify the most suitable marginal distribution, the sum of squared errors (SSEs) is employed to facilitate the selection process, choosing the distribution that provides the lower SSE value.
Table 3 provides a summary of the optimal fits of marginal distributions for various outcomes of the hydrodynamic modeling. The outcomes are categorized by each precipitation product and grouped according to their respective clusters. The table also includes the estimated value of SSE between the empirical CDF and the fitted CDF values.
Table 3Summary of marginal distribution fitting results per precipitation product and sum of squared errors for the best distribution.
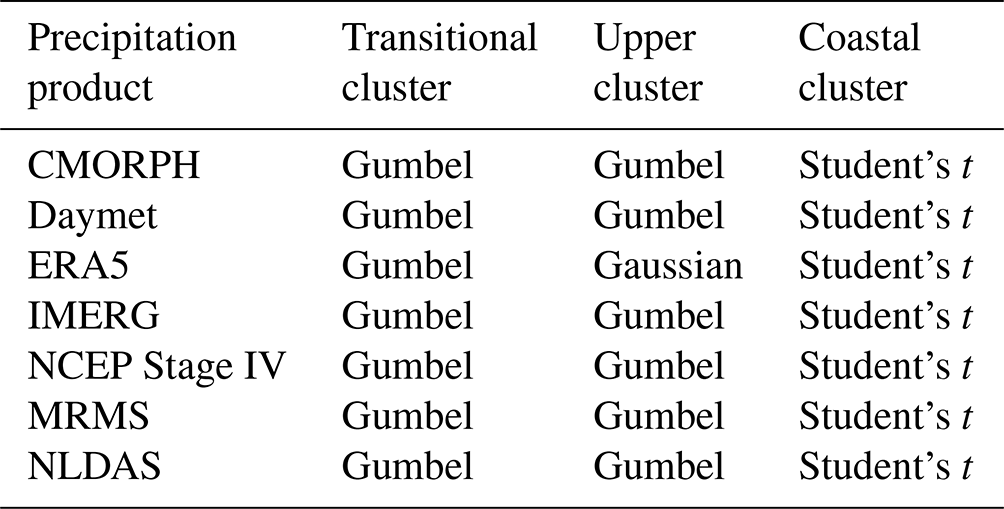
Upon identifying the optimal marginal distributions, the subsequent stage of the Global Cop-BMA framework involves the selection of a copula function. This copula function serves as a vital link, effectively connecting the CDFs of model simulations with observed data. Among various copula options, the most pertinent selection is the one that efficiently captures the inherent dependence structure between the variables being analyzed. In this study, five distinct copula functions are evaluated: Gumbel, Clayton, and Frank from the class of Archimedean copulas and Gaussian and Student's t from the elliptical group. Copulas are constructed and evaluated using the marginal distributions of the observed data and each of the precipitation product modeling results of water surface elevation per cluster as . The fitting and selection process was conducted using the Akaike information criterion (AIC) and copula cross-validation criterion (xv-CIC) (Grønneberg and Hjort, 2014) using the copula package implemented in R (Hofert et al., 2023), where the copula fit with the lowest value of AIC and higher xv-CIC was selected. Table 4 shows the selected copulas for the seven QPEs evaluated in HR2D simulations over the three clusters. Calculated values for AIC and xv-CIC are presented in Table S2 in the Supplement.
Table 4Summary of copula fitting results per cluster for each precipitation product used in the HEC-RAS 2D model simulations.
After applying the EM algorithm, it becomes feasible to compute the hydrograph generated for each station based on the estimated weights for each cluster. The averaged errors of simulations using different QPEs against observations from validation stations are shown in Fig. 6, featuring rain gauge simulation errors and estimations for the Global Cop-BMA approach per cluster. Notably, this method exhibits better results in its responses to different precipitation products and clusters, leading to an enhanced accuracy in water level estimations, particularly during peak periods, compared to the range of modeling water surface elevation outputs from the analyzed QPE such as Daymet or ERA5, which exhibit larger averaged errors. This demonstrates Cop-BMA's capability to generate results that closely correspond to the observed values at the validation stations. It is important to highlight that if all models consistently overestimate or underestimate, Global Cop-BMA may not lead to significant improvement in the result (e.g., NOAA 8770613, USGS 08074710, USGS 08072050 in Fig. 4; coastal cluster in Fig. 6). Despite its advanced weighting mechanism, Global Cop-BMA's effectiveness relies on the diversity and accuracy of the model ensemble. Therefore, while it enhances the integration of diverse model outputs, its capability to improve results may be limited when all models exhibit similar differences compared to the observations at certain sections of the hydrograph. The process of selecting validation stations within each cluster holds a significant influence over the subsequent calculation of weights using the BMA methods. The choice of metric or clustering technique can yield distinct combinations of validation stations, subsequently leading to varying weight distributions.
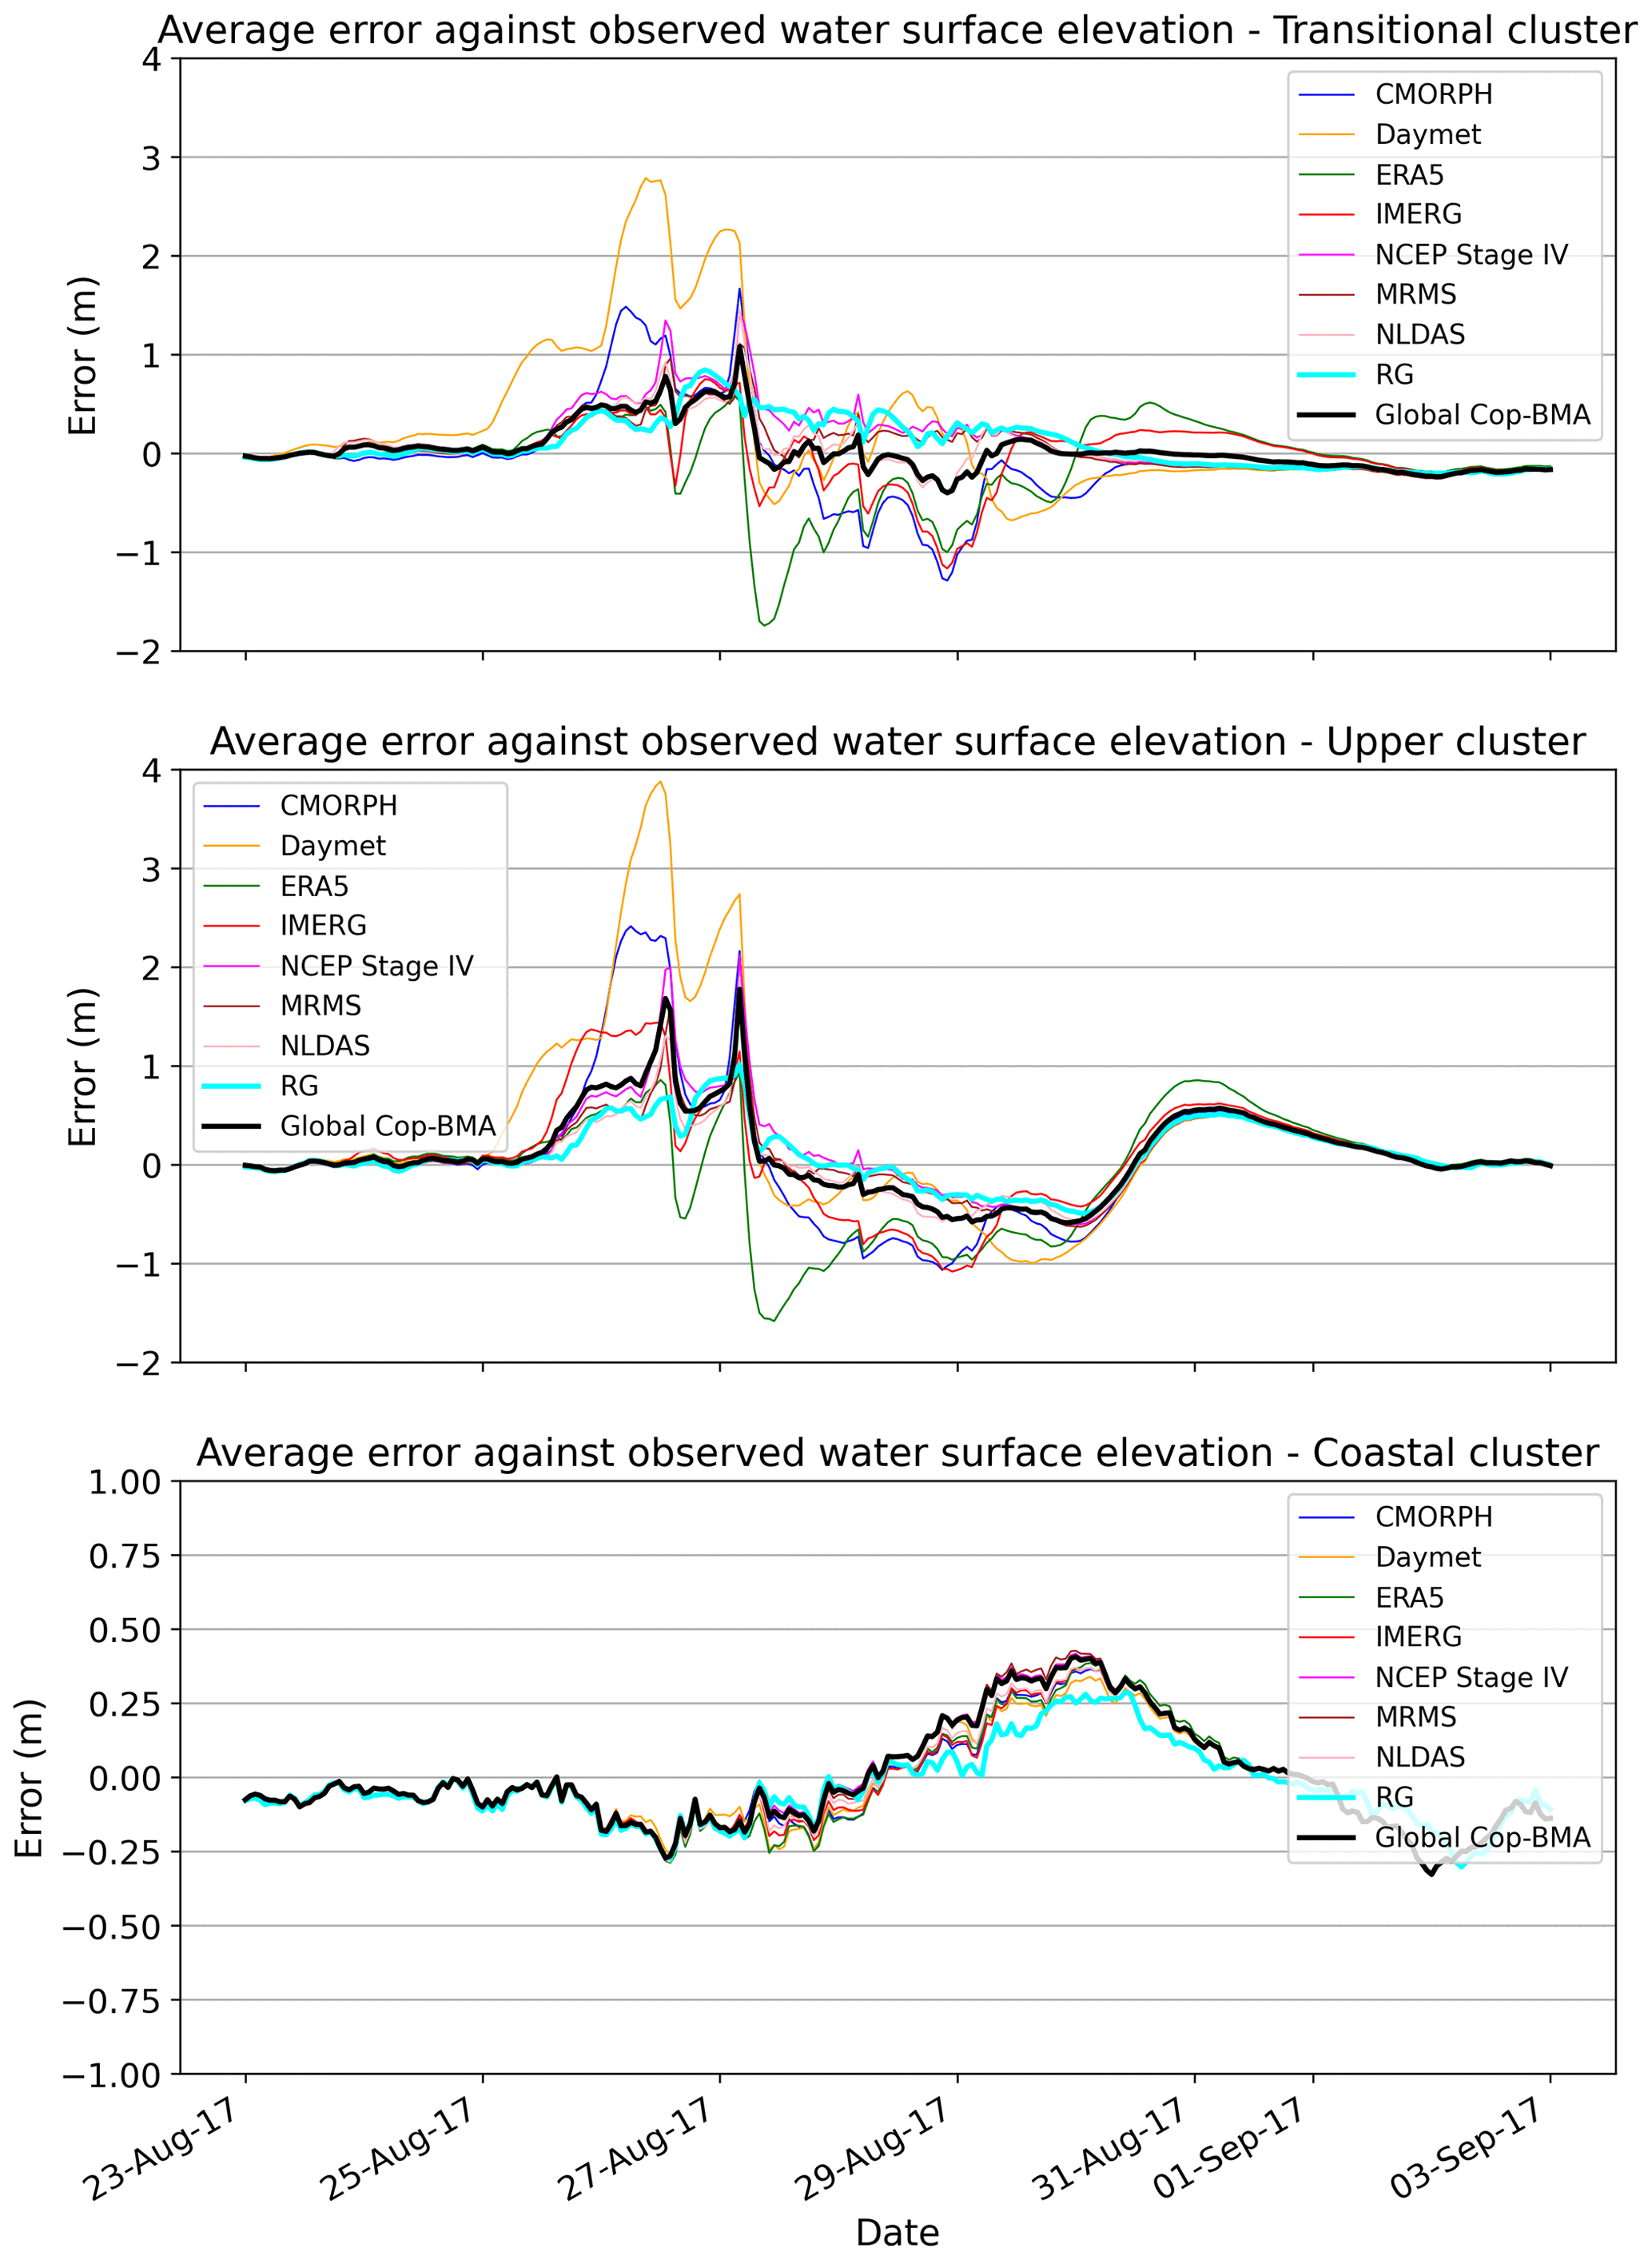
Figure 6Averaged error time series of validation stations per cluster of simulated water surface elevation (WSE) by the HEC-RAS 2D model using QPE datasets and Global Cop-BMA approach results (black) against observed WSE during Hurricane Harvey.
Figure 7 shows the calculated weights for the Global Cop-BMA method across the three analyzed clusters. The weights show the contributions of each QPE within different clusters. The distinct distribution of weights between the three clusters reflects their unique strategies in handling uncertainties and variations among different precipitation products.
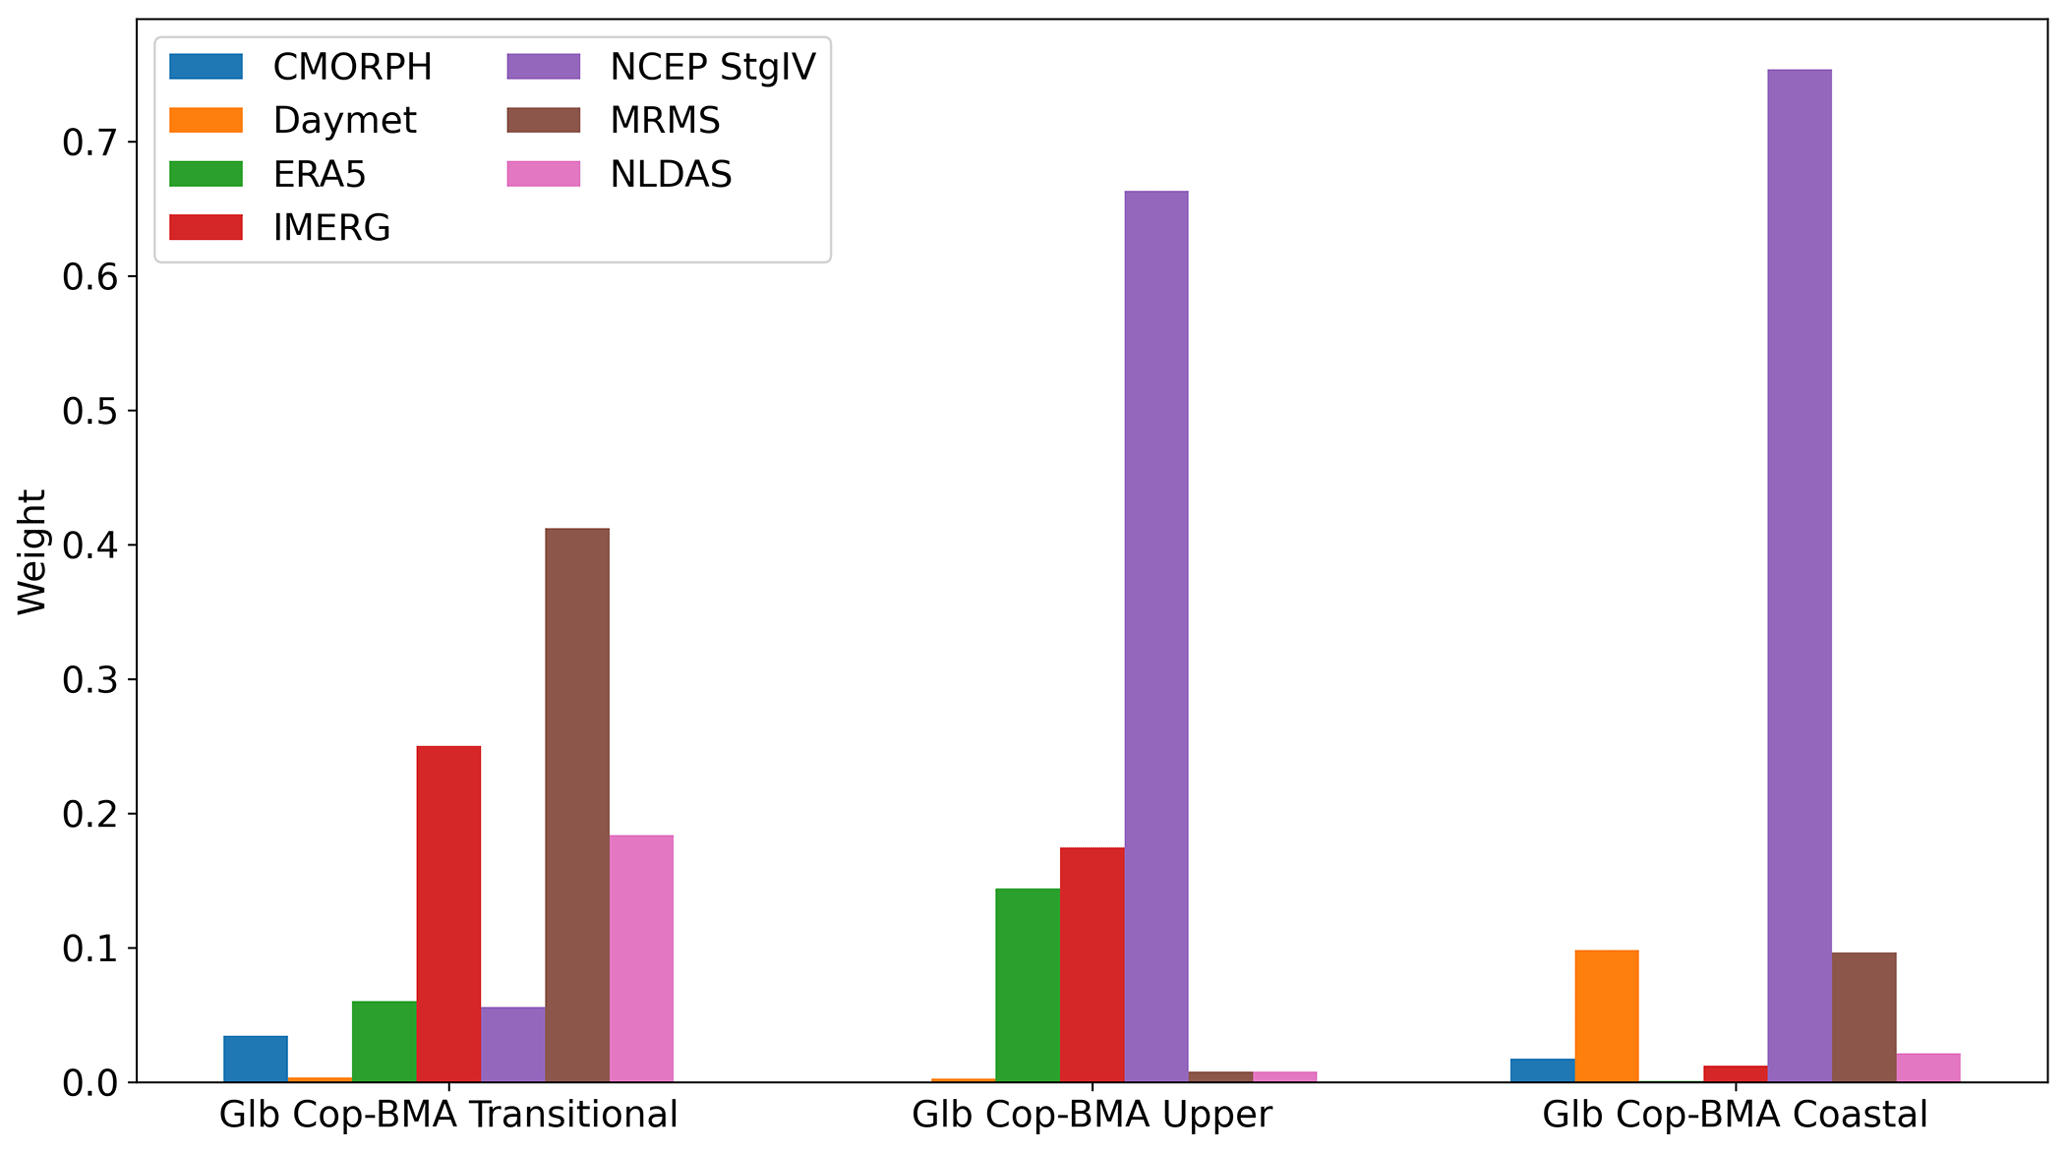
Figure 7Summary of calculated weights of the different precipitation products used within the Global Cop-BMA approach. The weight calculation task is implemented in each cluster separately.
As depicted in Fig. 7, the distribution of weights per cluster exhibits greater variability. In the transitional cluster, CMORPH, Daymet, ERA5, and NCEP Stage IV have weights below 0.1, as these four products generated underestimated responses in the hydrographs for most stations within this cluster. Weights center around the precipitation from MRMS, IMERG, and NLDAS QPEs. Within the upper cluster, a different weight distribution among the QPEs is observable, with minimal influence from CMORPH, Daymet, MRMS, and NLDAS QPEs. A higher difference is observable in the three more dominant QPEs, where NCEP Stage IV has a weight of 0.663 compared to the 0.144 of IMERG and 0.174 of ERA5 QPEs. For the coastal cluster, precipitation from the Stage IV QPE also holds the greatest weight (0.753) compared to the rest of the QPEs, which hold weight values below 0.1. Within this cluster, minimal discernible differences exist between QPE water surface elevation results for the stations, as seen in Fig. 4 (NOAA stations 8771013 and 8770613) and Fig. 6.
The evaluation of model performance in validation stations is measured through different metrics, including Nash–Sutcliffe efficiency (NSE) (Nash and Sutcliffe, 1970), Kling–Gupta efficiency (KGE) (Kling et al., 2012), root mean square error (RMSE), and mean bias error (MBE). The formulations of these metrics, which collectively provide insights into different facets of model accuracy, are summarized in Table 4. These metrics serve as quantitative measures to assess the model's capability in capturing the observed variations in water surface elevation during the Hurricane Harvey event and subsequent recession phase.
Table 5Summary of four main performance metrics used in this study for validating predicted time series of WSE compared to observed values.
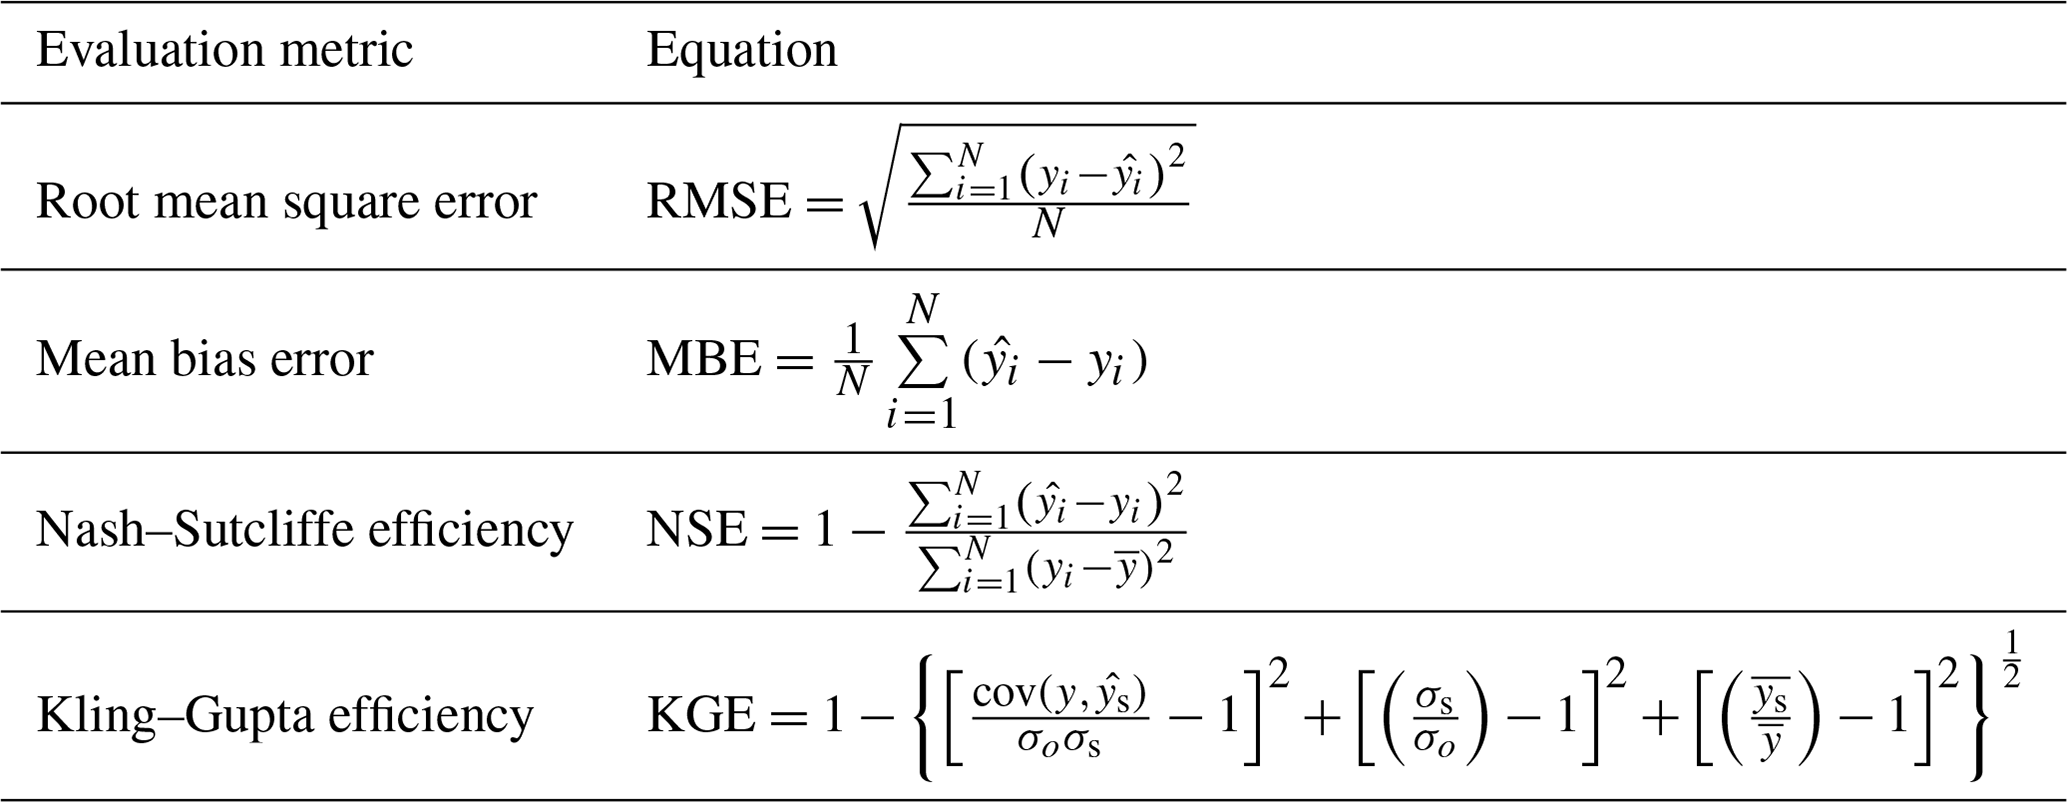
N – total time steps, i – time step, yi – observed data, – mean of observed data, – model simulation, – mean of model simulations, σ0 – standard deviation of observed data, σs – standard deviation of model simulations.
Figure 8 provides a comprehensive overview of collective performance metrics of the HR2D model across the seven QPE simulations and the rain gauge simulation and the Global Cop-BMA multi-modeling results for the seven QPEs evaluated at 30 validation stations over the 11 d simulation period. In general, the inundation modeling driven by different products consistently exhibits NSE performance with mean values ranging between 0.695 and 0.846. In terms of KGE performance, the interquartile ranges for QPEs display broader ranges, and the medians for Daymet and ERA5 products fall below 0.8, in contrast to other simulations.
Notably, the Cop-BMA approach exhibits slightly higher performance metrics compared to the QPE products, NSE has an average of 0.858, and its total variability is lower compared to single precipitation products. The KGE metric has a similar result with an average value of 0.852. The averaged RMSE for Cop-BMA is 0.561 m, which is smaller than all the single QPEs except for the rain gauge simulation, which is only 3 cm lower. The averaged MBE for single QPEs ranged between −0.018 and 0.23 m, while the Global Cop-BMA method results in an averaged value of 0.049 m. Among individual products, the rain gauge outperforms all spatially distributed precipitation datasets and comes closest to matching the performance of the Cop-BMA method. This highlights that reanalysis gridded precipitation products may have higher errors when compared to in situ rain observations and allows Global Cop-BMA to generate QPE post-processed results with observed precipitation from rain gauges that are closer to modeling results. This methodology could be replicated in areas where measured precipitation is not available and obtains better performance metrics, accounting for the uncertainties from this input. Another factor is that our study area encompasses only a few grid cells of some reanalysis products, making the advantages of using spatially distributed data less apparent. Overall, the global Cop-BMA approach offers two advantages over individual products: first, it improves and diminishes the variability of performance metrics over different locations, underscoring the robustness of the proposed approach. Second, it accounts for uncertainties associated with individual precipitation products and generates probabilistic flood inundation maps as a post-processing methodology.
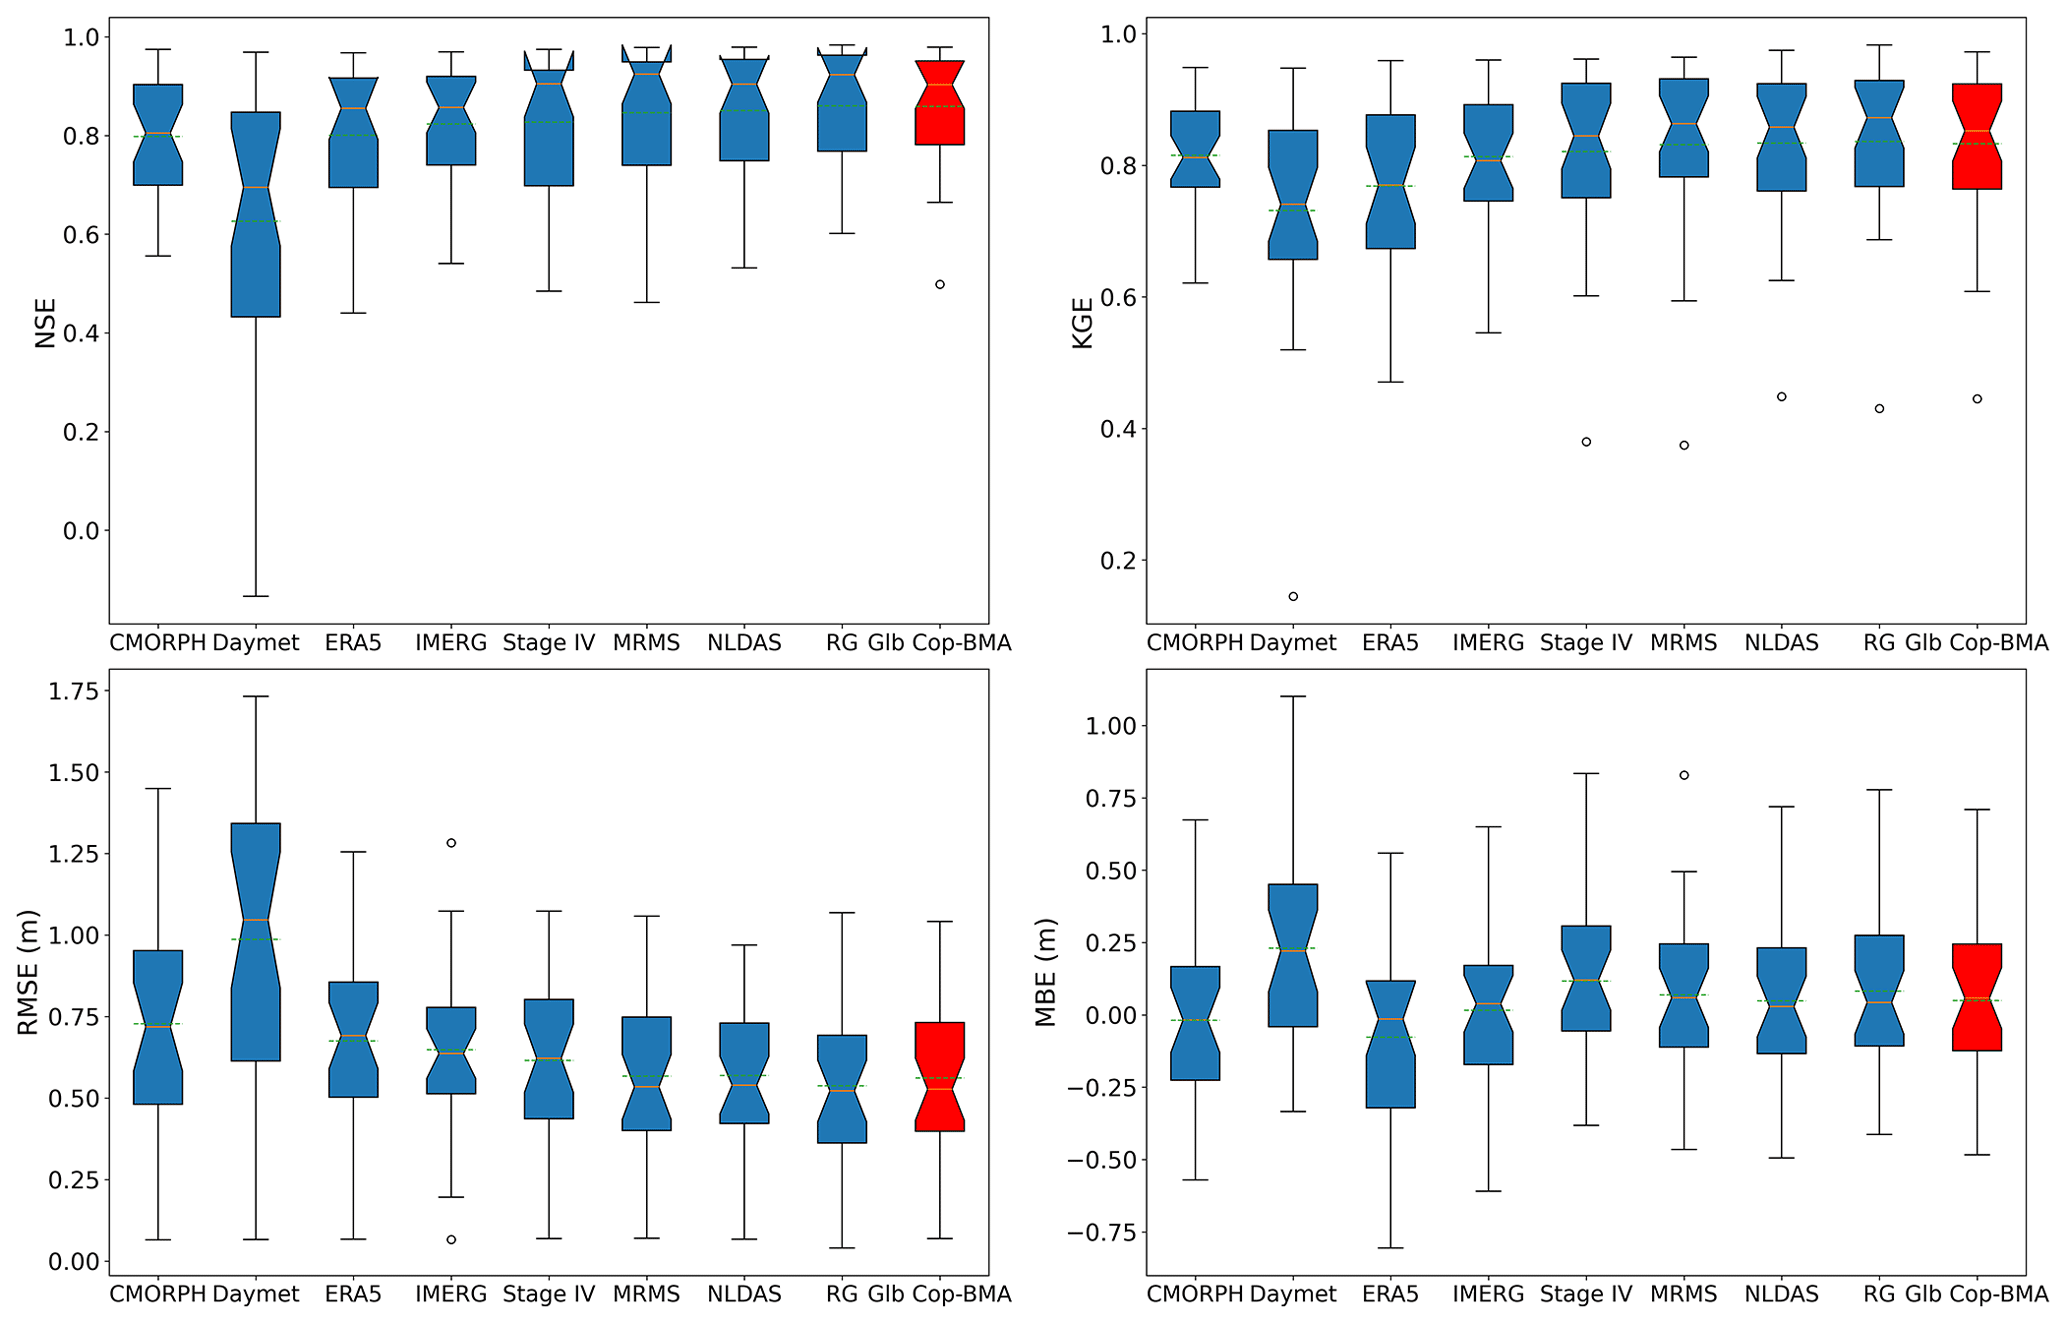
Figure 8Boxplot of four performance metrics for different precipitation products (blue) and Global Cop-BMA results (red). The boxes represent the distribution of performance metrics across the validation stations.
Utilizing the defined areas of influence and the established clusters, a crucial step for probabilistic flood inundation mapping involves the creation of a mask that applies the calculated weights of each QPE and rain gauge product. The resulting water depth simulations from the HR2D model are then exported in raster format. Employing raster calculator functions, the probability of flooding can be quantified using binary flood raster maps. In these maps, pixels hold a value of 0 to denote the absence of water and 1 if water is present. Figure 9 presents the computed flood depth and the corresponding estimated flood probability using the weights calculated with the Global Cop-BMA method for the modeled area close to downtown Houston. This approach offers a probabilistic understanding of the potential flooding scenario, providing decision-makers and stakeholders with valuable insights into the likely extent and severity of flooding.
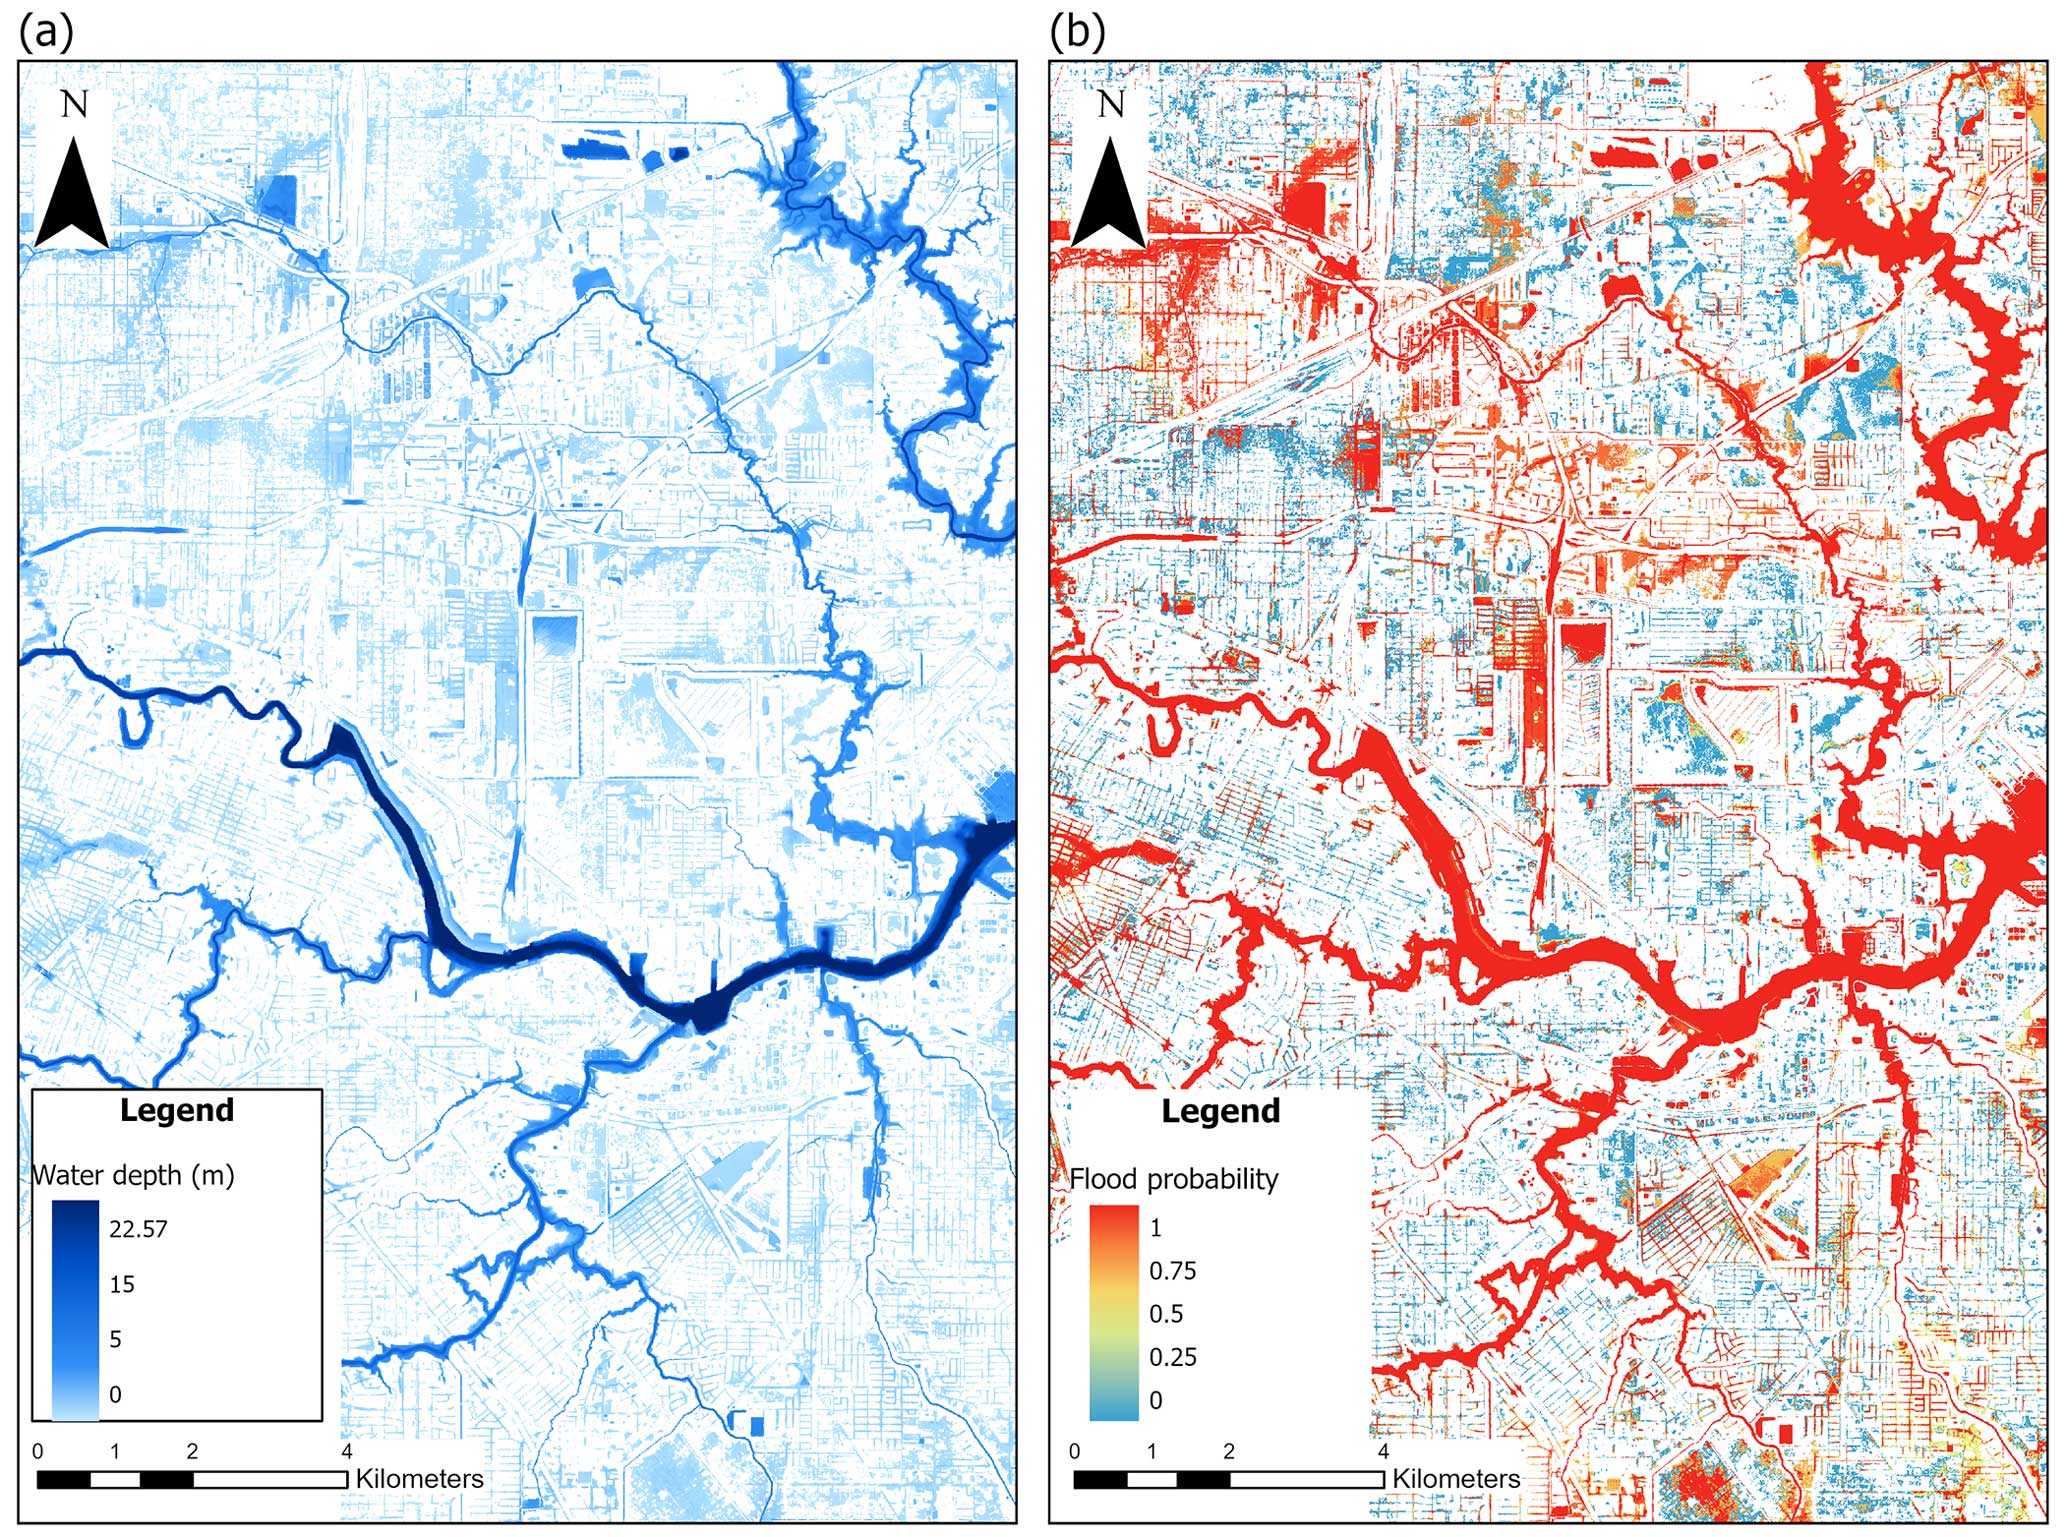
Figure 9Results of probabilistic flood inundation map using Global Cop-BMA methodology for the Hurricane Harvey event over the Houston area. (a) The average of water depth maps generated by the Global Cop-BMA approach. (b) The probabilistic flood extent map provided by Global Cop-BMA.
Given the limited availability of satellite images and validation information for the complete extent of flooding, the challenge lies in generating accurate spatial information for validation purposes over Houston (Saksena et al., 2020). While the presented approach offers a robust method for probabilistic flood inundation mapping, the verification of spatial extent remains a crucial task. The validation tasks were primarily focused on assessing the performance of model outputs at validation stations, as depicted in Fig. 5. This approach enabled us to calculate the performance metrics of WSE over a well-distributed network of stations with remarkable temporal resolution. Data collected from these validation stations sufficiently capture the hydrograph behavior within the study domain and enable us to quantify flood extents in a probabilistic manner using the HR2D model incorporated with the Cop-BMA method. It is worth noting that while a flood inundation map provided by a single QPE may potentially exhibit greater accuracy compared to one generated by Cop-BMA, the primary advantage of using Cop-BMA lies in its ability to generate probabilistic flood inundation maps while considering uncertainties associated with various QPE sources. Additionally, the QPE offering the highest accuracy is not consistently a single product; it may vary across different study cases and flood event characteristics. Therefore, employing a BMA-based approach could be a viable strategy to achieve high accuracy while accounting for uncertainties. Future research efforts may focus on improving the validation process in other study areas through the integration of additional data sources and innovative techniques with other sources to validate the entire extent of flooding more accurately compared with gauging stations and high water marks, especially in highly urban environments with rapid urbanization and constant land cover changes and also over a large and high-resolution computational domain (Juan et al., 2020; Schubert et al., 2022).
Dynamic simulation of extreme flood events demands a comprehensive approach that accounts for the inherent uncertainties and limitations present in both forcing data and numerical models. When conducting scenario analysis by inundation modeling driven by different precipitation forcings across the domain, it is crucial to acknowledge that definitively asserting the superiority of one product over another is not feasible. This is due to their inherent limitations in terms of spatial and temporal coverage, as well as the estimated precipitation values given the algorithms or methodologies used to generate the QPEs. In this study, comprehensive validation was feasible due to the access to a dense network of stations over Harris County of in situ precipitation data (rain gauges) and water surface elevation with high temporal resolution. However, such data are not widely available in many regions at a comparable density and temporal resolution. The substantial variability in the modeling results, both in terms of flood extent and water depth, is evident, leading to instances of both overestimation and underestimation throughout the response hydrograph for all assessments conducted by the different precipitation inputs as forcing to the HR2D model.
The utilization of Bayesian model averaging tools operates on the premise that there is not a single best model, specifically a precipitation product that fully captures the behavior of the flooding caused by Hurricane Harvey. Similarly, there is not a single BMA scheme that universally outperforms any other approximation (Parrish et al., 2012). It has been shown that the assumption of data and conditional PDF following a Gaussian distribution, as imposed by the BMA approach in many hydrologic applications, may lead to an oversimplification of extreme event behavior, affecting the calculated weights and subsequent flood predictions. In this regard, it has been suggested that the incorporation of copula functions (Cop-BMA) can enhance the characterization of model dependence generated by hydrodynamic water surface elevation data distributions and their relationships with observed data. Results using the Cop-BMA approach show better distribution of performance variability metrics over the validation stations and a reduced averaged error per cluster compared to single QPEs in the evaluated metrics.
Given the sensitivity of weight distributions to the selection of validation stations and clustering techniques, future studies could explore the impact of alternative clustering methods or metrics on the overall outcomes of the Global Cop-BMA approach. Such investigations could provide insights into the robustness of the method and its ability to adapt to varying configurations of validation data. Understanding how different clustering strategies influence weight distributions will contribute to a comprehensive interpretation of the uncertainty associated with flood predictions and further refine the decision-making process in flood risk management.
One advantage of our proposed framework is its flexibility, allowing for the use of alternative precipitation products to enhance model simulations. For instance, this framework can be implemented for operational forecasting purposes where the quantitative precipitation estimations (QPEs) utilized in this study can be replaced with quantitative precipitation forecasts (QPFs) from numerical weather prediction models such as High-Resolution Rapid Refresh (HRRR), the North American Mesoscale Forecast System (NAM), the Global Forecast System (GFS), and the European Centre for Medium-Range Weather Forecasts (ECMWF), among others. Additionally, the proposed framework can be further improved by accounting for uncertainties related to various factors such as boundary conditions and digital elevation models (DEMs), which have already been analyzed separately and individually. The HEC-RAS model can also incorporate the impact of infiltration during flood events. This involves testing various infiltration methods, such as deficit and constant, Soil Conservation Service (SCS) curve number, and Green–Ampt, across different storm events in rural areas with diverse land cover. By considering these additional sources of uncertainty within the modeling process, it is possible to enhance the accuracy and reliability of probabilistic flood inundation mapping, providing a more holistic perspective on extreme event simulations. This approach would yield a deeper understanding of the complex interactions and non-linearity of multiple factors contributing to flood events, thereby contributing to more robust flood risk assessments and management strategies. The challenge of scarce validation data for flood extents was addressed by generating probabilistic inundation maps. These maps assist in decision-making, especially in coastal regions where risk assessment is particularly complex. However, further research is needed to validate these spatial estimates. This is especially relevant in coastal regions where the interplay of various forcings makes it particularly complex to estimate risk scenarios for specific return periods. One limitation of the employed numerical model is its inability to directly incorporate the drainage networks present in urban areas. While the assumption was that the drainage system was operating at 100 % capacity, future research could explore the influence of these systems on accurately estimating water depth in urban areas at the city scale. Additionally, considering infiltration processes in hydrodynamic modeling when driven by different precipitation products can improve flood inundation modeling skill.
All the data used in this study, including the gauge discharge, water stage data, and the DEMs, are publicly available from the USGS, NOAA, and Harris County Flood Warning System websites respectively. The precipitation datasets used are listed in Sect. 3.3. All precipitation data used in this study are publicly available on their respective websites. The ERDC has provided discharge data in the Dickinson Bayou, Chocolate River, and Trinity River.
The supplement related to this article is available online at: https://doi.org/10.5194/nhess-24-2647-2024-supplement.
FJG, KJ, and HMi conceptualized the study. FJG implemented the methodology, conducted formal analysis, generated results, and wrote the original draft. KJ provided guidance on the methodology, formal analysis, and results and edited the original draft. HMe edited the original draft and contributed to formal analysis. HMi participated in supervision, funding acquisition, formal analysis, and editing of the original draft.
The contact author has declared that none of the authors has any competing interests.
Publisher’s note: Copernicus Publications remains neutral with regard to jurisdictional claims made in the text, published maps, institutional affiliations, or any other geographical representation in this paper. While Copernicus Publications makes every effort to include appropriate place names, the final responsibility lies with the authors.
The authors would like to thank the two reviewers for their comments and input that helped improve the quality of this work. This study was partially supported by the USACE ERDC, contract no. W912HZ202005.
This study was partially supported by the USACE ERDC, contract no. W912HZ202005.
This paper was edited by Kai Schröter and reviewed by Dino Collalti and one anonymous referee.
Abbaszadeh, P., Moradkhani, H., and Daescu, D. N.: The Quest for Model Uncertainty Quantification: A Hybrid Ensemble and Variational Data Assimilation Framework, Water Resour. Res., 55, 2407–2431, https://doi.org/10.1029/2018WR023629, 2019.
Abbaszadeh, P., Gavahi, K., Alipour, A., Deb, P., and Moradkhani, H.: Bayesian Multi-modeling of Deep Neural Nets for Probabilistic Crop Yield Prediction, Agr. Forest Meteorol., 314, 108773, https://doi.org/10.1016/j.agrformet.2021.108773, 2022a.
Abbaszadeh, P., Muñoz, D. F., Moftakhari, H., Jafarzadegan, K., and Moradkhani, H.: Perspective on uncertainty quantification and reduction in compound flood modeling and forecasting, iScience, 25, 105201, https://doi.org/10.1016/j.isci.2022.105201, 2022b.
Alipour, A., Jafarzadegan, K., and Moradkhani, H.: Global sensitivity analysis in hydrodynamic modeling and flood inundation mapping, Environ. Modell. Softw., 152, 105398, https://doi.org/10.1016/j.envsoft.2022.105398, 2022.
Andreas, E. L., Mahrt, L., and Vickers, D.: A New Drag Relation for Aerodynamically Rough Flow over the Ocean, J. Atmos. Sci., 69, 2520–2537, https://doi.org/10.1175/JAS-D-11-0312.1, 2012.
Bates, P. D.: Flood Inundation Prediction, Annu. Rev. Fluid Mech., 54, 287–315, https://doi.org/10.1146/annurev-fluid-030121-113138, 2022.
Bates, P. D., Horritt, M. S., Aronica, G., and Beven, K.: Bayesian updating of flood inundation likelihoods conditioned on flood extent data, Hydrol. Process., 18, 3347–3370, https://doi.org/10.1002/hyp.1499, 2004.
Blake, E. and Zelinsky, D.: National Hurricane Center Tropical Cyclone Report Hurricane Harvey, National Hurricane Center, https://www.nhc.noaa.gov/data/tcr/AL092017_Harvey.pdf (last access: 2 February 2024), 2018.
Brauer, N. S., Basara, J. B., Homeyer, C. R., McFarquhar, G. M., and Kirstetter, P. E.: Quantifying Precipitation Efficiency and Drivers of Excessive Precipitation in Post-Landfall Hurricane Harvey, J. Hydrometeorol., 21, 433–452, https://doi.org/10.1175/JHM-D-19-0192.1, 2020.
Chen, F.-W. and Liu, C.-W.: Estimation of the spatial rainfall distribution using inverse distance weighting (IDW) in the middle of Taiwan, Paddy Water Environ., 10, 209–222, https://doi.org/10.1007/s10333-012-0319-1, 2012.
Chen, M., Nabih, S., Brauer, N. S., Gao, S., Gourley, J. J., Hong, Z., Kolar, R. L., and Hong, Y.: Can Remote Sensing Technologies Capture the Extreme Precipitation Event and Its Cascading Hydrological Response? A Case Study of Hurricane Harvey Using EF5 Modeling Framework, Remote Sens., 12, 445, https://doi.org/10.3390/rs12030445, 2020.
Chen, M., Li, Z., Gao, S., Luo, X., Wing, O. E. J., Shen, X., Gourley, J. J., Kolar, R. L., and Hong, Y.: A comprehensive flood inundation mapping for Hurricane Harvey using an integrated hydrological and hydraulic model, J. Hydrometeorol., 22, 1713–1726, https://doi.org/10.1175/JHM-D-20-0218.1, 2021.
Chen, M., Li, Z., Gao, S., Xue, M., Gourley, J. J., Kolar, R. L., and Hong, Y.: A flood predictability study for Hurricane Harvey with the CREST-iMAP model using high-resolution quantitative precipitation forecasts and U-Net deep learning precipitation nowcasts, J. Hydrol., 612, 128168, https://doi.org/10.1016/j.jhydrol.2022.128168, 2022.
Costabile, P., Costanzo, C., Ferraro, D., Macchione, F., and Petaccia, G.: Performances of the New HEC-RAS Version 5 for 2-D Hydrodynamic-Based Rainfall-Runoff Simulations at Basin Scale: Comparison with a State-of-the Art Model, Water, 12, 2326, https://doi.org/10.3390/w12092326, 2020.
David, A. and Schmalz, B.: A Systematic Analysis of the Interaction between Rain-on-Grid-Simulations and Spatial Resolution in 2D Hydrodynamic Modeling, Water, 13, 2346, https://doi.org/10.3390/w13172346, 2021.
Dewitz, J. and U.S. Geological Survey: National Land Cover Database (NLCD) 2019 Products (ver. 2.0, June 2021), U.S. Geological Survey data release, https://doi.org/10.5066/P9KZCM54, 2021.
Di Baldassarre, G., Schumann, G., Bates, P. D., Freer, J. E., and Beven, K. J.: Flood-plain mapping: a critical discussion of deterministic and probabilistic approaches, Hydrolog. Sci. J., 55, 364–376, https://doi.org/10.1080/02626661003683389, 2010.
Du, J.: NCEP/EMC 4KM Gridded Data (GRIB) Stage IV Data. Version 1.0 (Version 1.0) Hourly precipitation amount, UCAR/NCAR – Earth Observing Laboratory, https://doi.org/10.5065/D6PG1QDD, 2011.
Duan, Q., Ajami, N. K., Gao, X., and Sorooshian, S.: Multi-model ensemble hydrologic prediction using Bayesian model averaging, Adv. Water Resour., 30, 1371–1386, https://doi.org/10.1016/j.advwatres.2006.11.014, 2007.
Dullo, T. T., Gangrade, S., Morales-Hernández, M., Sharif, M. B., Kao, S., Kalyanapu, A. J., Ghafoor, S., and Evans, K. J.: Simulation of Hurricane Harvey flood event through coupled hydrologic-hydraulic models: Challenges and next steps, J. Flood Risk Manag., 14, https://doi.org/10.1111/jfr3.12716, 2021.
Fagnant, C., Gori, A., Sebastian, A., Bedient, P. B., and Ensor, K. B.: Characterizing spatiotemporal trends in extreme precipitation in Southeast Texas, Nat. Hazards, 104, 1597–1621, https://doi.org/10.1007/s11069-020-04235-x, 2020.
Gao, S., Zhang, J., Li, D., Jiang, H., and Fang, Z. N.: Evaluation of Multiradar Multisensor and Stage IV Quantitative Precipitation Estimates during Hurricane Harvey, Nat. Hazards Rev., 22, 04020057, https://doi.org/10.1061/(ASCE)NH.1527-6996.0000435, 2021.
Garcia, M., Juan, A., and Bedient, P.: Integrating Reservoir Operations and Flood Modeling with HEC-RAS 2D, Water, 12, 2259, https://doi.org/10.3390/w12082259, 2020.
Gavahi, K., Foroumandi, E., and Moradkhani, H.: A deep learning-based framework for multi-source precipitation fusion, Remote Sens. Environ., 295, 113723, https://doi.org/10.1016/j.rse.2023.113723, 2023.
Grønneberg, S. and Hjort, N. L.: The Copula Information Criteria, Scandinavian J. Statistics, 41, 436–459, https://doi.org/10.1111/sjos.12042, 2014.
Habibi, H., Awal, R., Fares, A., and Temimi, M.: Performance of Multi-Radar Multi-Sensor (MRMS) product in monitoring precipitation under extreme events in Harris County, Texas, J. Hydrol., 598, 126385, https://doi.org/10.1016/j.jhydrol.2021.126385, 2021.
Han, S. and Coulibaly, P.: Bayesian flood forecasting methods: A review, J. Hydrol., 551, 340–351, https://doi.org/10.1016/j.jhydrol.2017.06.004, 2017.
He, S., Guo, S., Liu, Z., Yin, J., Chen, K., and Wu, X.: Uncertainty analysis of hydrological multi-model ensembles based on CBP-BMA method, Hydrol. Res., 49, 1636–1651, https://doi.org/10.2166/nh.2018.160, 2018.
Hofert, M., Kojadinovic, I., Maechler, M., and Yan, J.: copula: Multivariate Dependence with Copulas, https://doi.org/10.32614/CRAN.package.copula, 2023.
Huang, T. and Merwade, V.: Uncertainty Analysis and Quantification in Flood Insurance Rate Maps Using Bayesian Model Averaging and Hierarchical BMA, J. Hydrol. Eng., 28, 04022038, https://doi.org/10.1061/JHYEFF.HEENG-5851, 2023.
Huang, W., Ye, F., Zhang, Y. J., Park, K., Du, J., Moghimi, S., Myers, E., Pe'eri, S., Calzada, J. R., Yu, H. C., Nunez, K., and Liu, Z.: Compounding factors for extreme flooding around Galveston Bay during Hurricane Harvey, Ocean Modell., 158, 101735, https://doi.org/10.1016/j.ocemod.2020.101735, 2021.
Huffman, G. J., Stocker, E. F., Bolvin, D. T., Nelkin, E. J., and Tan, J.: GPM IMERG Final Precipitation L3 Half Hourly 0.1 degree x 0.1 degree V06, Greenbelt, MD, Goddard Earth Sciences Data and Information Services Center (GES DISC), https://doi.org/10.5067/gpm/imerg/3b-hh/07, 2019.
Jafarzadegan, K., Merwade, V., and Moradkhani, H.: Combining clustering and classification for the regionalization of environmental model parameters: Application to floodplain mapping in data-scarce regions, Environ. Modell. Softw., 125, 104613, https://doi.org/10.1016/j.envsoft.2019.104613, 2020.
Jafarzadegan, K., Abbaszadeh, P., and Moradkhani, H.: Sequential data assimilation for real-time probabilistic flood inundation mapping, Hydrol. Earth Syst. Sci., 25, 4995–5011, https://doi.org/10.5194/hess-25-4995-2021, 2021a.
Jafarzadegan, K., Alipour, A., Gavahi, K., Moftakhari, H., and Moradkhani, H.: Toward improved river boundary conditioning for simulation of extreme floods, Adv. Water Resour., 158, 104059, https://doi.org/10.1016/j.advwatres.2021.104059, 2021b.
Jafarzadegan, K., Moradkhani, H., Pappenberger, F., Moftakhari, H., Bates, P., Abbaszadeh, P., Marsooli, R., Ferreira, C., Cloke, H. L., Ogden, F., and Duan, Q.: Recent Advances and New Frontiers in Riverine and Coastal Flood Modeling, Rev. Geophys., 61, e2022RG000788, https://doi.org/10.1029/2022RG000788, 2023.
Jiang, H., Zhang, J., Liu, Y., Li, J., and Fang, Z. N.: Does flooding get worse with subsiding land? Investigating the impacts of land subsidence on flood inundation from Hurricane Harvey, Sci. Total Environ., 865, 161072, https://doi.org/10.1016/j.scitotenv.2022.161072, 2023.
Juan, A., Gori, A., and Sebastian, A.: Comparing floodplain evolution in channelized and unchannelized urban watersheds in Houston, Texas, J. Flood Risk Manage., 13, e12604, https://doi.org/10.1111/jfr3.12604, 2020.
Kling, H., Fuchs, M., and Paulin, M.: Runoff conditions in the upper Danube basin under an ensemble of climate change scenarios, J. Hydrol., 424–425, 264–277, https://doi.org/10.1016/j.jhydrol.2012.01.011, 2012.
Liu, Z. and Merwade, V.: Accounting for model structure, parameter and input forcing uncertainty in flood inundation modeling using Bayesian model averaging, J. Hydrol., 565, 138–149, https://doi.org/10.1016/j.jhydrol.2018.08.009, 2018.
Liu, Z. and Merwade, V.: Separation and prioritization of uncertainty sources in a raster based flood inundation model using hierarchical Bayesian model averaging, J. Hydrol., 578, 124100, https://doi.org/10.1016/j.jhydrol.2019.124100, 2019.
Liu, Z., Merwade, V., and Jafarzadegan, K.: Investigating the role of model structure and surface roughness in generating flood inundation extents using one- and two-dimensional hydraulic models, J. Flood Risk Manage., 12, e12347, https://doi.org/10.1111/jfr3.12347, 2019.
Madadgar, S. and Moradkhani, H.: Improved Bayesian multimodeling: Integration of copulas and Bayesian model averaging, Water Resour. Res., 50, 9586–9603, https://doi.org/10.1002/2014WR015965, 2014.
Merwade, V., Olivera, F., Arabi, M., and Edleman, S.: Uncertainty in Flood Inundation Mapping: Current Issues and Future Directions, J. Hydrol. Eng., 13, 608–620, https://doi.org/10.1061/(ASCE)1084-0699(2008)13:7(608), 2008.
Moftakhari, H., AghaKouchak, A., Sanders, B. F., Matthew, R. A., and Mazdiyasni, O.: Translating Uncertain Sea Level Projections Into Infrastructure Impacts Using a Bayesian Framework, Geophys. Res. Lett., 44, 914–921, https://doi.org/10.1002/2017GL076116, 2017.
Muñoz, D. F., Abbaszadeh, P., Moftakhari, H., and Moradkhani, H.: Accounting for uncertainties in compound flood hazard assessment: The value of data assimilation, Coast. Eng., 171, 104057, https://doi.org/10.1016/j.coastaleng.2021.104057, 2022.
Muñoz Sabater, J.: ERA5-Land hourly data from 1950 to present. Copernicus Climate Change Service (C3S) Climate Data Store (CDS), https://doi.org/10.24381/cds.e2161bac, 2019.
Nash, J. E. and Sutcliffe, J. V.: River flow forecasting through conceptual models part I – A discussion of principles, J. Hydrol., 10, 282–290, https://doi.org/10.1016/0022-1694(70)90255-6, 1970.
National Centers for Environmental Information: Cooperative Institute for Research in Environmental Sciences (CIRES) at the University of Colorado, Boulder, 2014: Continuously Updated Digital Elevation Model (CUDEM) – Arc-Second Resolution Bathymetric-Topographic Tiles, Elevation Values, https://doi.org/10.25921/ds9v-ky35, 2014.
Nelson, B. R., Prat, O. P., Seo, D.-J., and Habib, E.: Assessment and Implications of NCEP Stage IV Quantitative Precipitation Estimates for Product Intercomparisons, Weather Forecast., 31, 371–394, https://doi.org/10.1175/WAF-D-14-00112.1, 2016.
Noh, S., Lee, J.-H., Lee, S., and Seo, D.-J.: Retrospective Dynamic Inundation Mapping of Hurricane Harvey Flooding in the Houston Metropolitan Area Using High-Resolution Modeling and High-Performance Computing, Water, 11, 597, https://doi.org/10.3390/w11030597, 2019.
Omranian, E., Sharif, H., and Tavakoly, A.: How Well Can Global Precipitation Measurement (GPM) Capture Hurricanes? Case Study: Hurricane Harvey, Remote Sens., 10, 1150, https://doi.org/10.3390/rs10071150, 2018.
Oruc Baci, N., Jafarzadegan, K., and Hamid, M.: Improving flood inundation modeling skill: interconnection between model parameters and boundary conditions, Modeling Earth Systems and Environment, 10, 1–15, https://doi.org/10.1007/s40808-023-01768-5, 2023.
Parrish, M. A., Moradkhani, H., and DeChant, C. M.: Toward reduction of model uncertainty: Integration of Bayesian model averaging and data assimilation, Water Resour. Res., 48, 1–18, https://doi.org/10.1029/2011WR011116, 2012.
Raftery, A. E., Gneiting, T., Balabdaoui, F., and Polakowski, M.: Using Bayesian Model Averaging to Calibrate Forecast Ensembles, Mon. Weather Rev., 133, 1155–1174, https://doi.org/10.1175/MWR2906.1, 2005.
Saksena, S., Dey, S., Merwade, V., and Singhofen, P. J.: A Computationally Efficient and Physically Based Approach for Urban Flood Modeling Using a Flexible Spatiotemporal Structure, Water Resour. Res., 56, 1–22, https://doi.org/10.1029/2019WR025769, 2020.
Savage, J. T. S., Bates, P., Freer, J., Neal, J., and Aronica, G.: When does spatial resolution become spurious in probabilistic flood inundation predictions?: When Spatial Resolution Becomes Spurious in Probabilistic Flood Maps, Hydrol. Process., 30, 2014–2032, https://doi.org/10.1002/hyp.10749, 2016.
Schubert, J. E., Luke, A., AghaKouchak, A., and Sanders, B. F.: A Framework for Mechanistic Flood Inundation Forecasting at the Metropolitan Scale, Water Resour. Res., 58, e2021WR031279, https://doi.org/10.1029/2021WR031279, 2022.
Scotti, V., Giannini, M., and Cioffi, F.: Enhanced flood mapping using synthetic aperture radar (SAR) images, hydraulic modelling, and social media: A case study of Hurricane Harvey (Houston, TX), J. Flood Risk Manage., 13, 1–18, https://doi.org/10.1111/jfr3.12647, 2020.
Sebastian, A., Bader, D. J., Nederhoff, C. M., Leijnse, T. W. B., Bricker, J. D., and Aarninkhof, S. G. J.: Hindcast of pluvial, fluvial, and coastal flood damage in Houston, Texas during Hurricane Harvey (2017) using SFINCS, Nat. Hazards, 109, 2343–2362, https://doi.org/10.1007/s11069-021-04922-3, 2021.
Sklar, M.: Fonctions de répartition à N dimensions et leurs marges, Annales de l'ISUP, 8, 229–231, 1959.
Stephens, T. A., Savant, G., Sanborn, S. C., Wallen, C. M., and Roy, S.: Monolithic Multiphysics Simulation of Compound Flooding, J. Hydraul. Eng., 148, 05022003, https://doi.org/10.1061/(ASCE)HY.1943-7900.0002000, 2022.
Teng, J., Jakeman, A. J., Vaze, J., Croke, B. F. W., Dutta, D., and Kim, S.: Flood inundation modelling: A review of methods, recent advances and uncertainty analysis, Environ. Modell. Softw., 90, 201–216, https://doi.org/10.1016/j.envsoft.2017.01.006, 2017.
Thornton, M. M., Shrestha, R., Wei, Y., Thornton, P. E., Kao, S.-C., and Wilson, B. E.: Daymet: Daily Surface Weather Data on a 1-km Grid for North America, Version 4 R1, https://doi.org/10.3334/ORNLDAAC/2129, 2022.
U.S. Geological Survey: National Water Information System data available on the World Wide Web (USGS Water Data for the Nation), https://doi.org/10.5066/F7P55KJN, 2016.
USACE: HEC-RAS River Analysis System, Version 6.3.1, Hydrologic Engineering Center, https://www.hec.usace.army.mil/software/hec-ras/ (last access: 15 December 2022), 2022.
Valle-Levinson, A., Olabarrieta, M., and Heilman, L.: Compound flooding in Houston-Galveston Bay during Hurricane Harvey, Sci. Total Environ., 747, 141272, https://doi.org/10.1016/j.scitotenv.2020.141272, 2020.
Wang, S.-Y. S., Zhao, L., Yoon, J.-H., Klotzbach, P., and Gillies, R. R.: Quantitative attribution of climate effects on Hurricane Harvey's extreme rainfall in Texas, Environ. Res. Lett., 13, 054014, https://doi.org/10.1088/1748-9326/aabb85, 2018.
Wing, O. E. J., Sampson, C. C., Bates, P. D., Quinn, N., Smith, A. M., and Neal, J. C.: A flood inundation forecast of Hurricane Harvey using a continental-scale 2D hydrodynamic model, J. Hydrol. X, 4, 100039, https://doi.org/10.1016/j.hydroa.2019.100039, 2019.
Wootten, A. and Boyles, R. P.: Comparison of NCEP Multisensor Precipitation Estimates with Independent Gauge Data over the Eastern United States, J. Appl. Meteorol. Clim., 53, 2848–2862, https://doi.org/10.1175/JAMC-D-14-0034.1, 2014.
Xia, Y., Mitchell, K., Ek, M., Sheffield, J., Cosgrove, B., Wood, E., Luo, L., Alonge, C., Wei, H., Meng, J., Livneh, B., Lettenmaier, D., Koren, V., Duan, Q., Mo, K., Fan, Y., and Mocko, D.: NLDAS Primary Forcing Data L4 Hourly 0.125 × 0.125 degrees V002, Edited by David Mocko, NASA/GSFC/HSL, Greenbelt, Maryland, USA, Goddard Earth Sciences Data and Information Services Center (GES DISC), https://doi.org/10.5067/6J5LHHOHZHN4, 2009.
Xie, P., Joyce, R., Wu, S., Yoo, S.-H., Yarosh, Y., Sun, F., Lin, R., and NOAA CDR Program: NOAA Climate Data Record (CDR) of CPC Morphing Technique (CMORPH) High Resolution Global Precipitation Estimates, Version 1 [Precipitation], NOAA National Centers for Environmental Information, https://doi.org/10.25921/w9va-q159, 2019.
Yan, Z., Zhou, Z., Liu, J., Han, Z., Gao, G., and Jiang, X.: Ensemble Projection of Runoff in a Large-Scale Basin: Modeling With a Global BMA Approach, Water Resour. Res., 56, 1–17, https://doi.org/10.1029/2019WR026134, 2020.
Zeiger, S. J. and Hubbart, J. A.: Measuring and modeling event-based environmental flows: An assessment of HEC-RAS 2D rain-on-grid simulations, J. Environ. Manage., 285, 112125, https://doi.org/10.1016/j.jenvman.2021.112125, 2021.
Zhang, J., Howard, K., Langston, C., Kaney, B., Qi, Y., Tang, L., Grams, H., Wang, Y., Cocks, S., Martinaitis, S., Arthur, A., Cooper, K., Brogden, J., and Kitzmiller, D.: Multi-Radar Multi-Sensor (MRMS) Quantitative Precipitation Estimation: Initial Operating Capabilities, B. Am. Meteorol. Soc., 97, 621–638, https://doi.org/10.1175/BAMS-D-14-00174.1, 2016.