the Creative Commons Attribution 4.0 License.
the Creative Commons Attribution 4.0 License.
 | 22 Jul 2024
The role of citizen science in assessing the spatiotemporal pattern of rainfall events in urban areas: a case study in the city of Genoa, Italy
Nicola Loglisci
Giorgio Boni
Arianna Cauteruccio
Massimo Milelli
Guido Paliaga
Antonio Parodi
Climate change in the Mediterranean region is manifesting itself as an increase in average air temperature and a change in the rainfall regime: the value of cumulative annual rainfall generally appears to be constant, but the intensity of annual rainfall maxima, between 1 and 24 h, is increasing, especially in the period between late summer and early autumn. The associated ground effects in urban areas consist of flash floods and pluvial floods, often in very small areas, depending on the physical-geographical layout of the region. In the context of global warming, it is therefore important to have an adequate monitoring network for rain events that are highly concentrated in space and time. This research analyses the meteo-hydrological features of the 27 and 28 August 2023 event that occurred in the city of Genoa, Italy, just 4 d after the record maximum air temperature was recorded: between 19:00 and 02:00 UTC almost 400 mm of rainfall was recorded in the eastern sector of the historic centre of Genoa, with significant ground effects such as flooding episodes and the overflowing of pressurised culverts. Rainfall observations and estimates were made using both official or “authoritative” networks (rain gauges and meteorological radar) and rain gauge networks inspired by citizen science principles. The combined analysis of observations from authoritative and citizen science networks reveals, for the event analysed, a spatial variability of the precipitation field at an hourly and a sub-hourly timescale that cannot be captured by the current spatial density of the authoritative measurement stations (which have one of the highest densities in Italy). Monthly total rainfall and short-duration annual maximum time series recorded by the authoritative rain gauge network of the Genoa area are then analysed. The results show significant variation even at distances of less than 2 km in the average rainfall depth accumulated over sub-hourly duration. Extreme weather monitoring activity is confirmed as one of the most important aspects in terms of flood prevention and protection in urban areas. The integration between authoritative and citizen science networks can prove to be a valid contribution to the monitoring of extreme events.
- Article
(10365 KB) - Full-text XML
- BibTeX
- EndNote


The study of the impact of climate change on heavy-precipitation phenomena at the global scale is an important field of research aiming at assessing possible changes in frequency, intensity, and related spatiotemporal scales (Huang et al., 2022; Sauter et al., 2023). Based on observational data, Seneviratne et al. (2012) and Raymond et al. (2020) concluded that it is likely that the number of heavy-precipitation events over land had increased in more regions than it had decreased, though there are wide regional and seasonal variations, and indeed trends in many locations are not statistically significant.
Du et al. (2019) and Dunn et al. (2020) showed that the annual maximum 1 d precipitation from daily in situ observations (Rx1day) has significantly increased since the mid-20th century over land. Furthermore, the globally averaged annual fraction of precipitation from days in the top 5 % (R95pTOT) has also increased significantly (Dunn et al., 2020). Sun et al. (2021), using high-quality station data up to 2018, studied changes in annual maxima of 1 d (Rx1day) and 5 d (Rx5day) precipitation accumulation at different spatial scales, and they found that the addition of a decade (2009–2018) of observational data shows a more robust increase in Rx1day over the global land region.
When considering the sub-daily rainfall, it is well known that the available data records are certainly shorter than what is requested for a robust quantification of past changes (Li et al., 2019). Still, there are studies in regions of almost all continents that generally indicate intensification of sub-daily extreme precipitation, such as in South Africa (Roy and Rouault, 2013), Australia (Guerreiro et al., 2018), India (Ali and Mishra, 2018), and eastern China (Xiao et al., 2016). Furthermore, Arnone et al. (2013) and Libertino et al. (2019) also identified similar trends in some regions of Italy.
This body of work suggests the importance of an adequate monitoring capability to capture localised extreme rainfall events in a warming climate. Besides already-consolidated remote-sensing-based rainfall estimates, taking advantage of the combination of authoritative in situ weather stations with opportunistic networks inspired by citizen science principles (Bedrina et al., 2013; Starkey et al., 2017; Tipaldo and Allamano, 2017) is becoming more and more important.
There is evidence that climate change can also cause an intensification of short-lived and highly intense events in Italy and the Mediterranean area (Arnone et al., 2013; Libertino et al., 2019). Due to the limited extension of the urban catchment areas, with a high density of buildings and largely impervious surfaces, rapidly evolving pluvial flooding is typically experienced in cities, resulting from the inefficiency of urban drainage systems in terms of the hydraulic failure of storm water pipes and/or the insufficient capacity of storm drain inlets. In the Mediterranean region, this is accompanied by a rainfall regime characterised by short-duration and high-intensity events, which typically show a quite limited spatial extension and very rapid evolution and are therefore difficult to capture by traditional monitoring networks. Urban areas are also affected by riverine floods, from the overtopping of small streams (often covered and/or with narrowing sections) in orographically complex and steep areas. Since storm water drainage in the urban texture is structured in a great number of small-size catchments, usually smaller than the typical spacing of rain gauge stations, urban catchments are often ungauged.
Depth–duration–frequency (DDF) relationships derived from a rain gauge positioned in a contiguous urban catchment could estimate a return period associated with a specific rainfall depth that would affect the design of the pipe size or of potential structural adjustments of the drainage network. The temporal resolution of rainfall measurements also plays a key role in the study of flood events: the faster the hydrological response of the basin, the finer the required resolution of the supporting data. The World Meteorological Organization (WMO) developed the Observing Systems Capability Analysis and Review (OSCAR) tool (https://space.oscar.wmo.int/, last access: 12 July 2024) that contains quantitative user-defined requirements for observation of physical variables related to weather, water, climate, and other application areas. Regarding the variable precipitation intensity and the nowcasting/very-short-range forecasting application area, which can be considered relevant for small catchments, OSCAR reports that the highest performance level (indicated with the term “goal”) can be reached using measurements at a spatial resolution of up to 1 km and a temporal resolution of 5 min.
Along these lines the characteristic spatial scales of the events that produce intense rainfall in the Ligurian area, compared with the observational capacities of the authoritative networks, are analysed in this work. Four rainfall time series were compared in terms of monthly precipitation and annual maxima of rainfall depth for sub-hourly duration. An example of an extreme rainfall event that occurred on 27 and 28 August 2023, causing flooding in the Genoa city centre, is presented along with a description of the synoptic-scale and mesoscale analysis. Both authoritative and citizen science rain gauge stations were involved in the study to show the impact of a finer monitoring network on deriving merged rain gauge and radar rainfall maps.
Genoa is an ancient pre-Roman city that saw concentrated urban development in the 20th century (Faccini et al., 2015, 2016). Genoa is the capital of the Italian region of Liguria and the sixth-largest city in Italy. In 2015, about 600 000 people lived within the city's administrative limits. As of the 2011 Italian census, the province of Genoa, which became the Genoa metropolitan area (GMA) in 2015, had about 850 000 residents.
The GMA has historically been affected by meteorological conditions such as flash floods and severe sea storms due to the Genoa low (also known as Ligurian Gulf depression) and the city's geographical layout, which is characterised by a narrow coast bounded by steep mountains. The Genoa low is a cyclone that forms or intensifies from a pre-existing cyclone to the south of the Alps with an orographic effect (Jansa et al., 2014) over the Gulf of Genoa in the Ligurian Sea. This depression is linked to the arrival of the Atlantic perturbations behind the Alps and is formed on the gulf primarily in the autumn–winter and spring periods. This circulation is responsible for the large amounts of rainfall distributed over the overall region surrounding the Ligurian Sea (Sacchini et al., 2012).
The area of Genoa is characterised by a complex morphology due to the Alps–Apennines system, which hosts relief, including peaks between 1000 and 2000 m above mean sea level, and rapidly descends towards the Ligurian Sea. The resulting hydrographic network is composed of numerous steep and short watercourses that can attain a concentration time from 3–4 h down to less than 1 h. Therefore, the morphology of the Ligurian Gulf and the orographic barrier contribute to rainfall events that may be very intense, especially at the end of summer or autumn, when Atlantic perturbations may be blocked by the European continental anticyclone. The convergence between the air mass stationed over the warm Mediterranean Basin and the colder air masses moving from the north triggers the development of very intense and localised convective systems, known as back-building mesoscale convective systems (Fiori et al., 2014; Rebora et al., 2013). These localised convective systems have historically affected different locations over the Ligurian Gulf (Portofino in 1915, Cinqueterre in 2011, Genoa in 2011 and 2014), causing flash floods arising from rainfall intensities of about 500 mm (6 h)−1 or 180 mm (1 h)−1 (Fiori et al., 2014; Parodi et al., 2017; Faccini et al., 2021).
In recent years, the metropolitan city of Genoa has experienced an increase in flooding episodes concentrated mainly in the autumn period and often characterised by exceptional rainfall values, with records even at the international level: 181 mm (1 h)−1 was recorded in November 2011, while in October 2021, 378 mm (3 h)−1, 496 mm (6 h)−1, 741 mm (12 h)−1, and 884 mm (24 h)−1 were measured (not far from the historical Italian record of 948 mm registered in October 1970 in Genoa again) (Ferrari et al., 2023).
While the city of Genoa is internationally known for its recurrent floods, mainly related to the Bisagno River, high levels of river-related risk are also present in the historic city centre. The watercourses of the historical city have been subject to relevant anthropic modifications since the Middle Ages; today the hydrographical network appears to be almost entirely artificial, flowing under the streets and buildings of the historic centre. The morphological amphitheatre, where the historical city of Genoa has developed over the centuries, represents as a whole a composite catchment area that includes seven small and steep catchments that today are barely identifiable due to the dense urban texture. In historic centres like Genoa, the channelised drainage networks often have under-dimensioned hydraulic sections as they have been designed with antiquated methodologies and a lack of observational data. Furthermore, they have been built in times when the urban context was different, with impervious surface areas largely expanding over time.
The construction of culverts over time and the modifications they have undergone over the centuries up to very recent times due to progressive urbanisation (currently 75 %) have led to a reduction in the riverbed cross-section, which can lead to possible overflows of water under pressure and consequent floods. In the historical city, floods have been particularly frequent in the past 30 years and are mainly associated with pluvial flooding because of the inefficiency of the urban drainage system.
In this paper, six authoritative (AR) and six citizen science (CS) rain gauge stations are used to demonstrate the high spatial variability of the rainfall phenomenon in the city of Genoa and to show the relevance of using both networks when merging rain gauges and radar maps for the reconstruction of the rainfall field (Bruno et al., 2021). The meteorological radar (a GPM250C C-band Doppler and polarimetric radar) is located on Mount Settepani (see geographical coordinates and altitude in Table 1) and is managed by the Regional Agency for Environmental Protection of the Liguria Region (ARPAL). The temporal resolution is 5 min, while the pixel size is 1 km. Meteosat Second Generation (MSG) infrared satellite images (10.8 MHz), available at http://www.mydewetra.org (last access: 13 July 2024), are used to describe the synoptic-scale and mesoscale evolution of the observed extreme rainfall event, supported by reanalysis maps and radio soundings from the nearest available sites.
Table 1Geographical coordinates (WGS84) and altitude above mean sea level of the radar and the rain gauge stations.
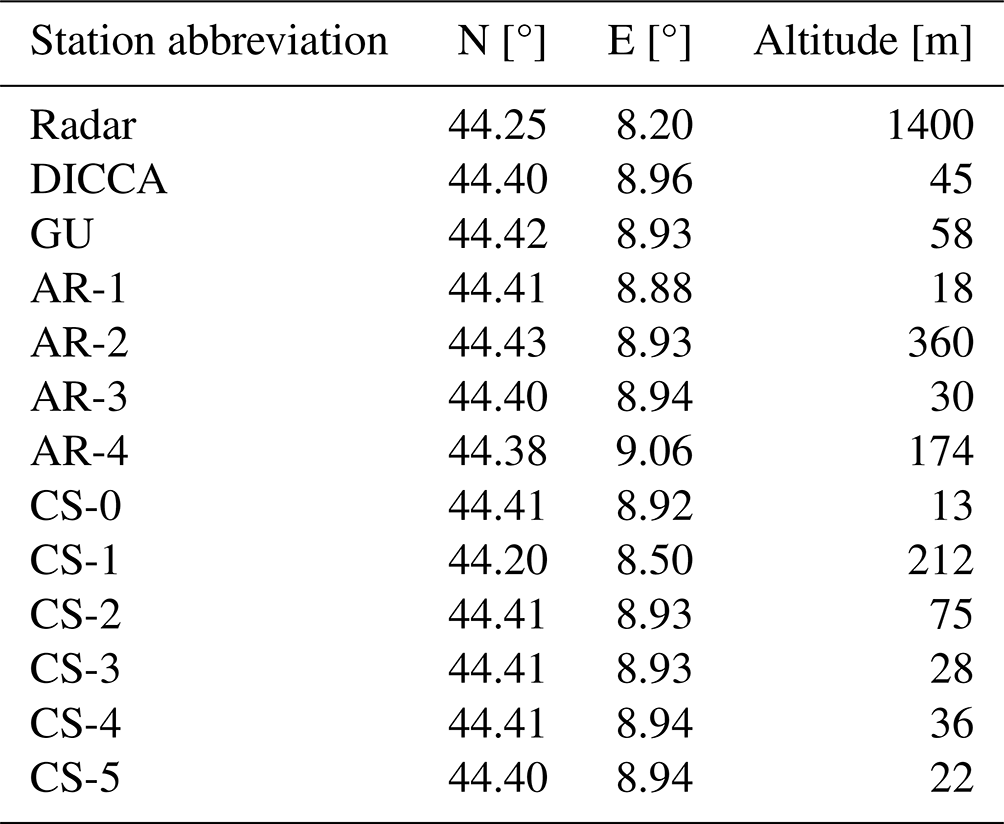
Among the AR stations, four are managed by ARPAL and are equipped with the FAK010AA rain gauge manufactured by Mtx s.r.l, which provides measurements of the rainfall intensity (RI) with a temporal resolution of 5 min. They are called Fiumara (hereafter AR-1), Castellaccio (AR-2), Centro Funzionale (AR-3), and Sant'Ilario (AR-4). Two other rain gauge stations, owned by the University of Genoa and assumed to be authoritative stations for the present study, are indicated in the following with the abbreviations GU and DICCA. The first (now equipped with a SIAP UM7525 rain gauge) is the source of a quasi-bicentennial rainfall time series and has been providing RI measurements with an hourly resolution since 2002 (Cauteruccio and Lanza, 2023). The DICCA station (manufactured by CAE S.p.A) is managed by the Department of Civil, Chemical and Environmental Engineering (DICCA) and has been providing RI measurements with a resolution of 1 min since 1988.
The CS stations, numbered from CS-0 to CS-5, are part of the Acronet (Fedi et al., 2013), MeteoNetwork (Giazzi et al., 2022), and Weather Underground (Gharesifard et al., 2017) networks and have been chosen to achieve a high-density coverage of the historic city centre. The Acronet network is made up of weather stations inspired by the Acronet paradigm, a model of design, realisation, dissemination, and installation in the field of environmental monitoring and control systems released according to an open hardware mode. A series of sensors or third-party devices can be connected to the board at the same time (with different technologies); each individual combination is a different configuration. The Acronet station considered in this work and located in the Porto Antico area (CS-0) involves a Lambrecht 15189 precipitation sensor (5 min temporal resolution). The CS-1, CS-2, CS-3, CS-4, and CS-5 stations, included in the MeteoNetwork and Weather Underground networks, are equipped with a DAVIS wireless Vantage Pro2 model precipitation sensor and provide RI measurements with a temporal resolution of 5 min.
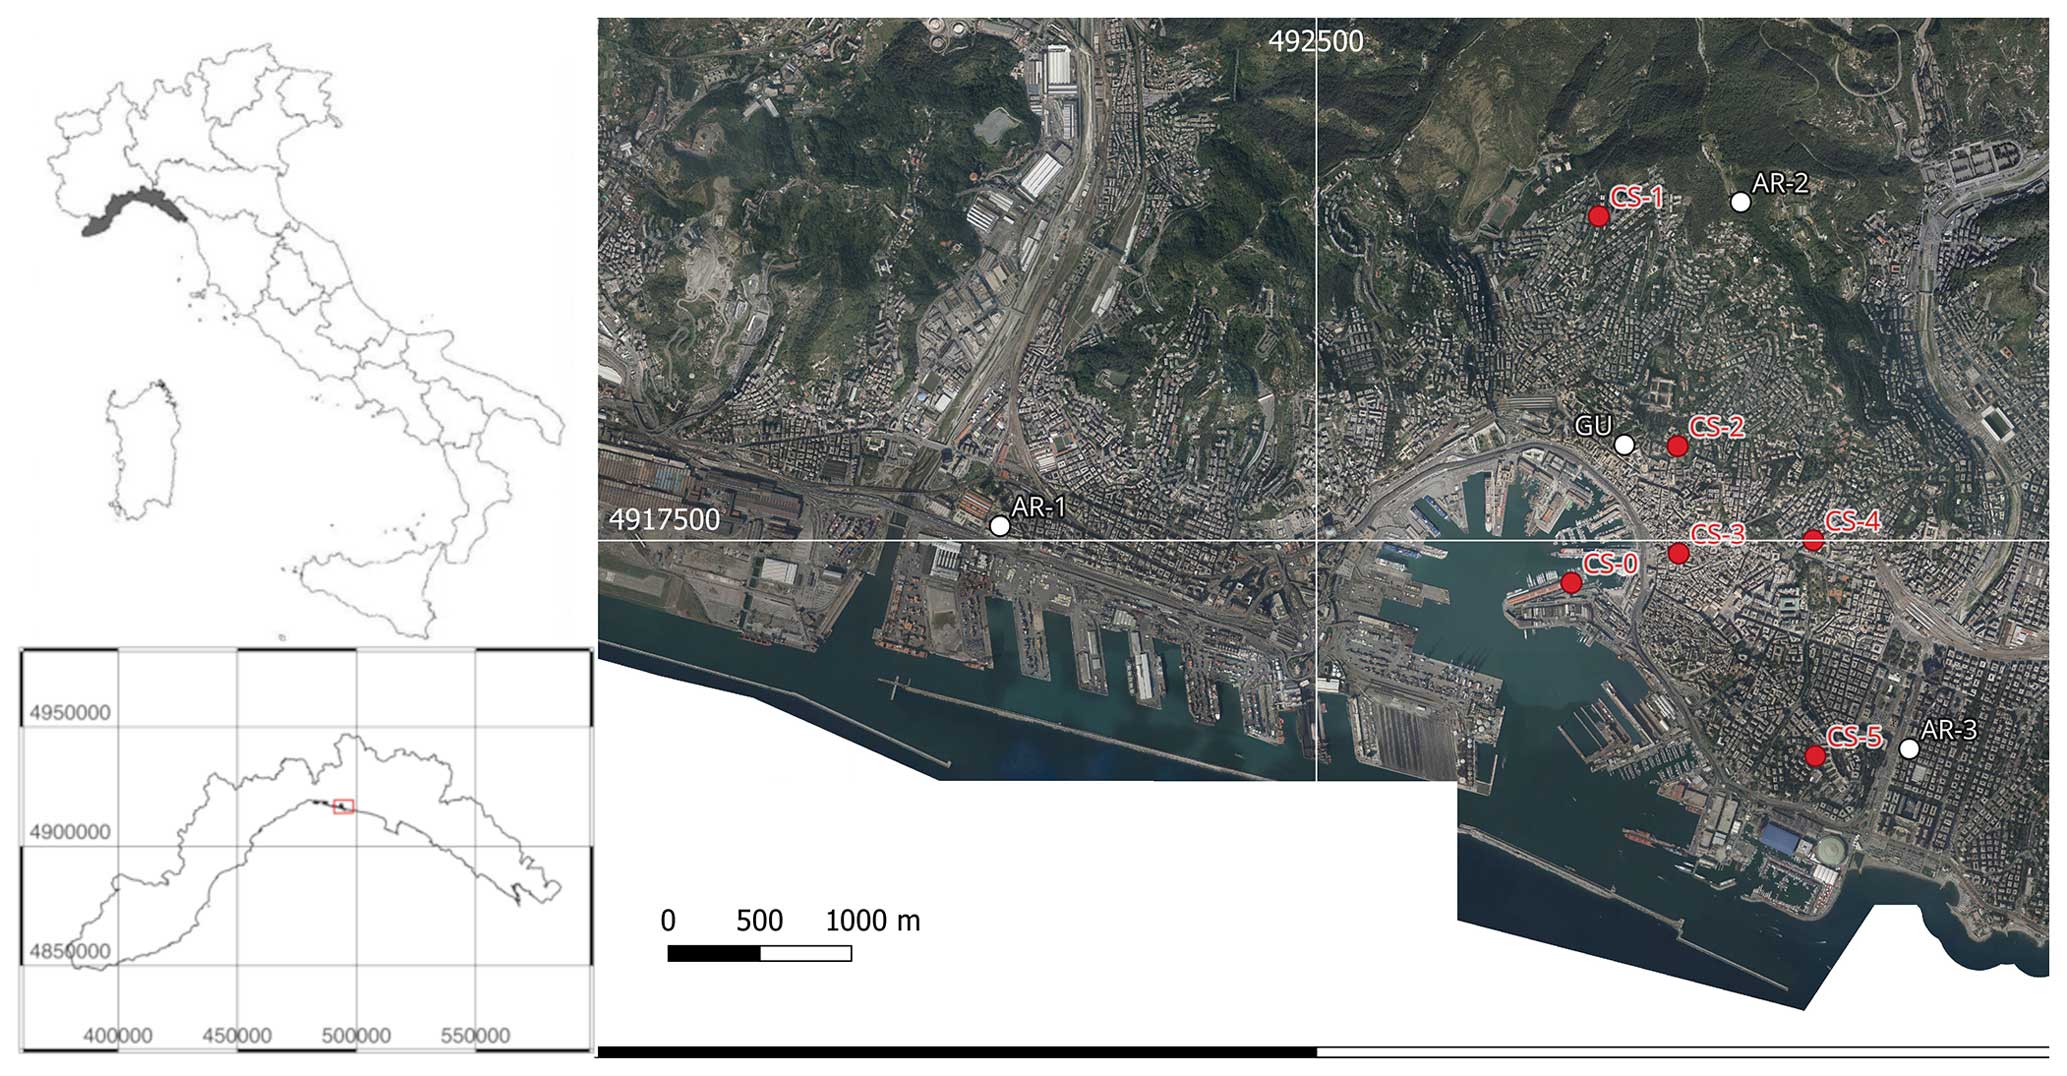
Figure 1Locations of the authoritative (AR and GU) and citizen science (CS) rain gauge stations in the Genoa study area. Aerial images are made available by the cartographic repository of the municipality of Genoa. Coordinates are in the RDN2008–UTM32N coordinate system.
The location of the AR, GU, and CS stations used in this work, overlaid on an aerial photograph of the city of Genoa, is shown in Fig. 1 (except for AR-4 and DICCA positioned about 11 and 3.5 km east of the historic centre, respectively), while the geographical coordinates and altitude are given in Table 1.
The spatial variability of intense rainfall events is significant even over a limited part of the territory of the historic centre of the city of Genoa. To corroborate this statement, this paper analyses and compares five rainfall time series of at least 12 years of high-resolution records, from rain gauges located in the city of Genoa.
Accurate RI measurements (Lanza and Cauteruccio, 2022) and their spatial and temporal resolution play a key role in the modelling of flood events in urban areas (Lin et al., 2022; Bruni et al., 2015). The large spatial variation in rainfall intensity, especially for short-duration events, is shown below to arise from the analysis of rainfall statistics obtained from rainfall records of contiguous rain gauge stations in the city of Genoa. A reference station was selected because of the high accuracy and fine resolution of the available data. Four other rain gauge stations were selected within a radius of 1.4 to 7.9 km from the reference station. Monthly rainfall totals and extreme value statistics of short-duration/high-intensity events were compared to show that, even within such a short distance, the variation in the expected maximum rainfall is significant, as shown in the following paragraphs.
As a reference data set, about 30 years of rainfall intensity measurements (from 1 January 1988 to 31 December 2021) at 1 min resolution are available from the DICCA tipping-bucket rain gauge (TBRG). These are available as raw and corrected data, after application of appropriate calibration curves, as derived at the laboratory of the World Meteorological Organization (WMO) Measurement Lead Centre on Precipitation Intensity. The calibration and adjustments applied are in accordance with the European standard EN 17277/2019 (CEN, 2019). The typical instrumental bias of the TBRGs (see e.g. Cauteruccio et al., 2021) affects the high-rainfall-intensity measurements (RI > 150 mm h−1) with an underestimation greater than 5 %, while after appropriate adjustment the measurement bias is contained between ± 3 % over the whole measurement range.
The other three rainfall time series analysed in this paper were obtained from stations AR-2, AR-3, and AR-4 for 12 years of high-resolution data (2011 to 2022). Finally, hourly rainfall data for the same period were also obtained from the GU station.
DDF curves were derived using the 30-year time series of corrected 1 min RI measurements from the DICCA reference rain gauge. A typical power law expression was used for the DDF curves, where the rainfall depth for a given duration and return period, T, is expressed as a scale coefficient, a(T), multiplied by the rainfall duration to the power of the shape coefficient, b.
Due to the relatively short duration of the time series available from the nearby stations, only the DDF curves associated with return periods T = 1.5, 2.32, and 5 years were used in the analysis. These are also typical values of the return periods assumed in the design of urban drainage networks, beyond which the failure of the drainage system is accepted. Note that a return period of 2.32 years was chosen because it is associated with the mean value of the sample of annual maxima calculated for each event duration under the hypothesis of an underlying Gumbel distribution of rainfall extremes (Gumbel, 1941). For sub-hourly rainfall, the coefficient b is equal to 0.57, while a(T) is equal to 46.67, 62.53, and 84.59 mm h−b for the three return periods used.
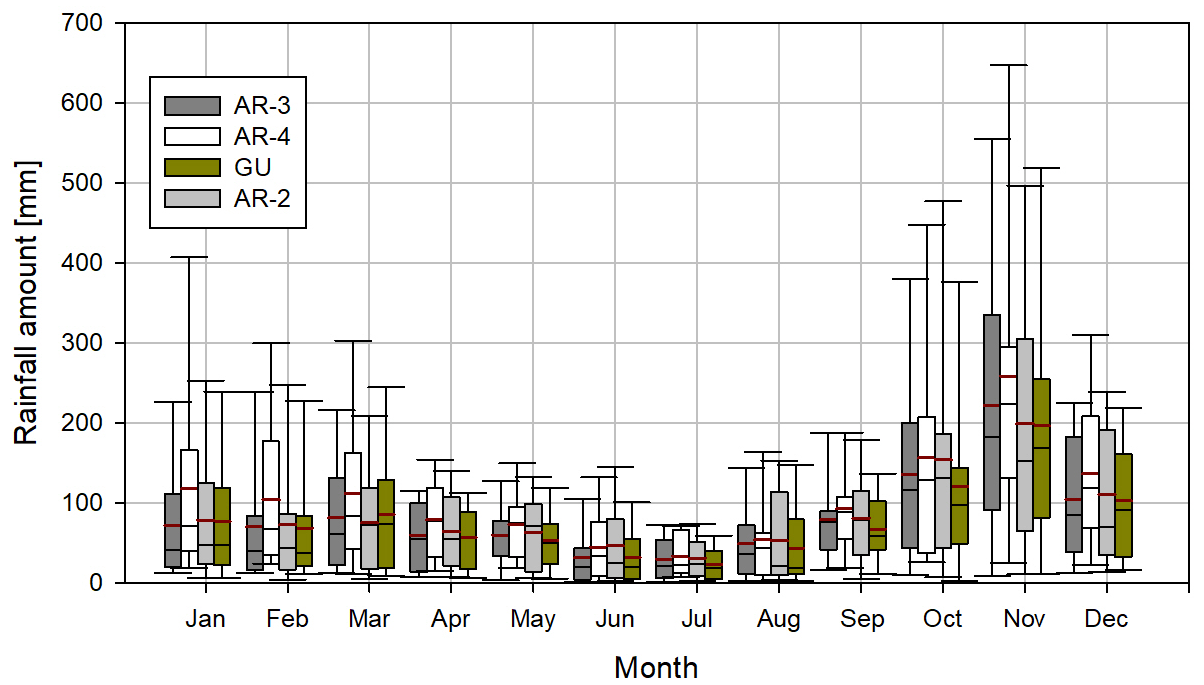
Figure 2Year-to-year variability of monthly precipitation at the four rain gauge stations studied. Boxes and whiskers cover the central 50 % and 80 % of the data set, respectively. The mean and median values are indicated in each box by the horizontal red and black lines, respectively.
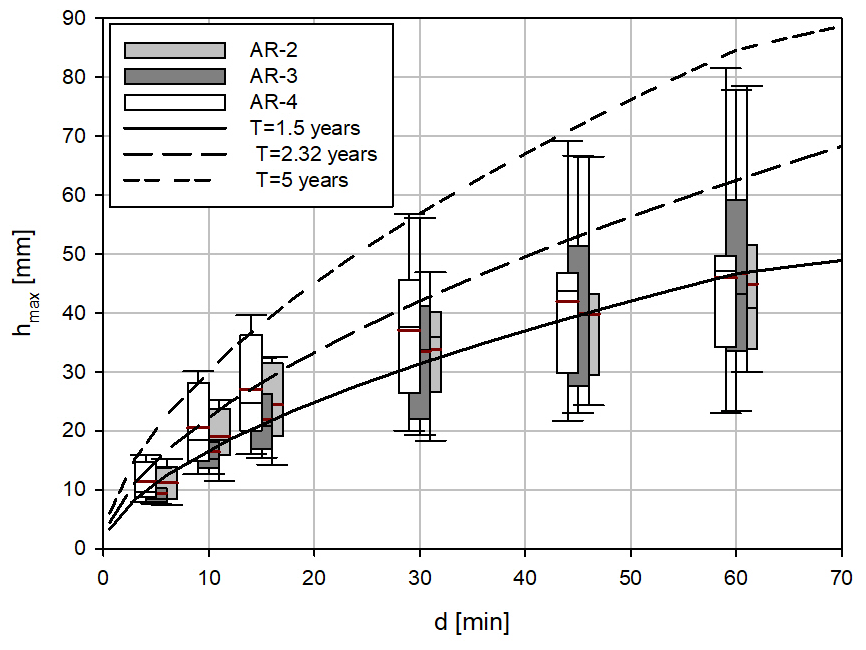
Figure 3Annual maximum rainfall depth for each duration at the three ARPAL rain gauge stations studied (boxplot), overlaid with the DDF curves derived at the DICCA reference station. Boxes and whiskers cover the central 50 % and 80 % of the data set, respectively. The mean and median values are indicated in each box by the horizontal red and black lines, respectively.
The year-to-year variability of monthly precipitation for 12 years of records at the four rain gauge stations studied is shown in Fig. 2. The boxes and whiskers cover the central 50 % and 80 % of the data set, respectively. The mean and median values are indicated in each box by the horizontal red and black lines, respectively. The mean values, the extremes, and the annual variability observed at AR-4 are systematically higher than at the other stations. In the dry summer months, the relative difference between the mean precipitation at two neighbouring stations is limited, but in the wet months (autumn and spring), when intense precipitation is usually expected, this difference is greater, despite the short distance between them. Especially in autumn, the mean and the annual variability of precipitation are systematically lower at GU than at the other stations. Differences in the precipitation regime at the stations considered are also evident for short-duration high-intensity events, as shown in Fig. 3 based on the DDF curves calculated at the nearby reference station (DICCA). Short-duration events of 5, 10, 15, 30, 45, and 60 min were considered in the analysis, thus excluding the GU station due to the coarse time resolution (1 h) of the available data set.
Table 2Percentage relative difference between the rainfall depth at each of the investigated stations and at the reference station (DICCA), for a 2.32-year return period (mean annual maxima).
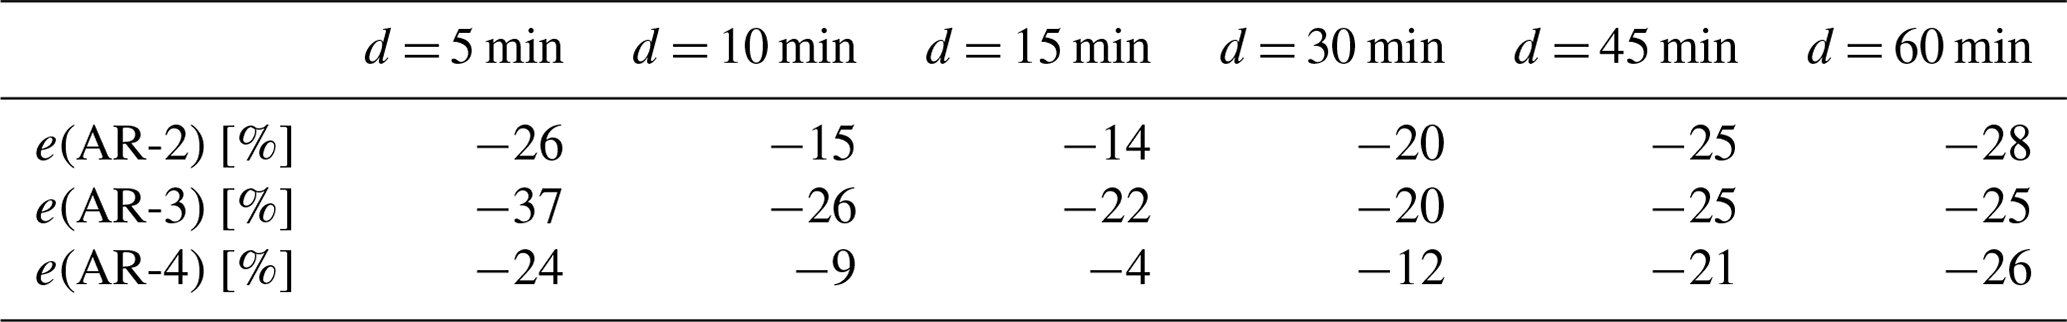
The mean value of the annual maxima at each station and for each duration can be compared with the reference DDF curve at T = 2.32 years. The percentage relative difference e (%) between such mean values at each of the investigated stations and at the reference station was therefore calculated (see Table 2). The comparison shows that short-duration high-intensity events at the AR-3 station are up to 37 % lower than the typical events at the reference station for any duration. Meanwhile, the statistics at the AR-4 station are close to the reference station for short-duration events (between 10 and 30 min), while longer-duration events are less intense, at least over the period studied. The AR-2 station shows an intermediate behaviour.
The results show that, for each duration, the mean values of the annual maxima at the AR-3 station are characterised by the same return period T = 1.5 years, while the AR-4 station exhibits the largest annual maxima for short-duration events (up to 15 min) with T = 2.32 years, then the return period decreases with increasing event duration, reaching 1.5 years at a duration of 60 min. For the AR-2 station, the mean annual maxima range from above to slightly below T = 1.5 years with increasing event duration. Note that for events shorter than 15 min, the AR-4 station is the closest to the reference station in terms of the return period of its annual maxima, although geographically it is the most distant. However, the dispersion of the annual maxima around the mean value for this station reaches the longest return period studied (T = 5 years), with the limits of the interval covering 80 % of the sample, which is not the case for any other station in the range of short-duration events.
Therefore, a large variability is observed between the investigated stations, especially for short-duration events, which are typically associated with critical conditions in urban drainage systems. The variability of extreme value statistics between the investigated rain gauge stations over the period considered reflects the spatial variability of short-duration high-intensity events, even at the limited spatial scale of urban catchments.
In light of this analysis and considering the high spatiotemporal variability of severe events in the urban area of Genoa, a specific case study is discussed below, which recently occurred on 27–28 August 2023, when the historic centre and the San Fruttuoso district of the city of Genoa suffered from intense pluvial flooding events that were not observed in nearby districts of the city.
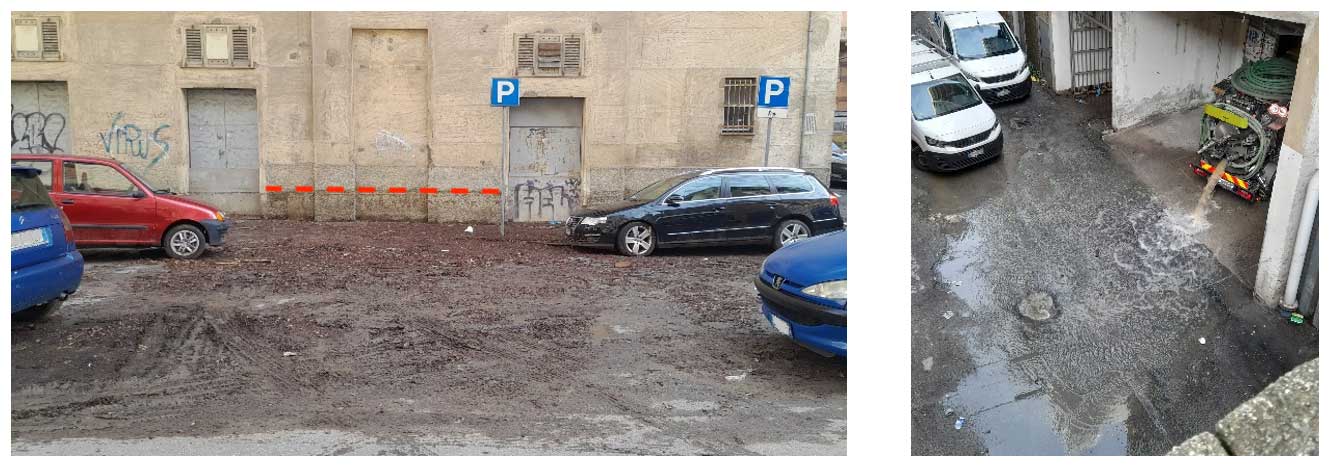
Figure 4Pictures showing post-event traces of the ground effects of the event analysed. The dashed red line shows traces of the water level reached during the event.
5.1 Ground effects
Local newspapers and the event report of ARPAL (ARPAL, 2023) described the impact of the investigated event on the involved catchments. The event produced severe hydrological impacts in the centre of Genoa, including the flooding of the Genova Piazza Principe railway station around 23:00 UTC, even if the railway traffic was not interrupted. The Genoa subway services and the Sant'Anna and Zecca–Righi funicular services were stopped for a few hours during the night. Dozens of interventions by firefighters due to flooding of cellars and garages were reported in the districts of Oregina and Castelletto but also in the Foce district and in the historic centre. There were also many calls to rescue people stuck in the water near underpasses. Several cars were flooded. There were also many interventions due to the collapse of retaining walls and trees that fell due to strong winds. Some small watercourses (among them the Lagaccio stream) reached the overflow warning level. In Fig. 4 some pictures that capture the post-event evidence are reported.
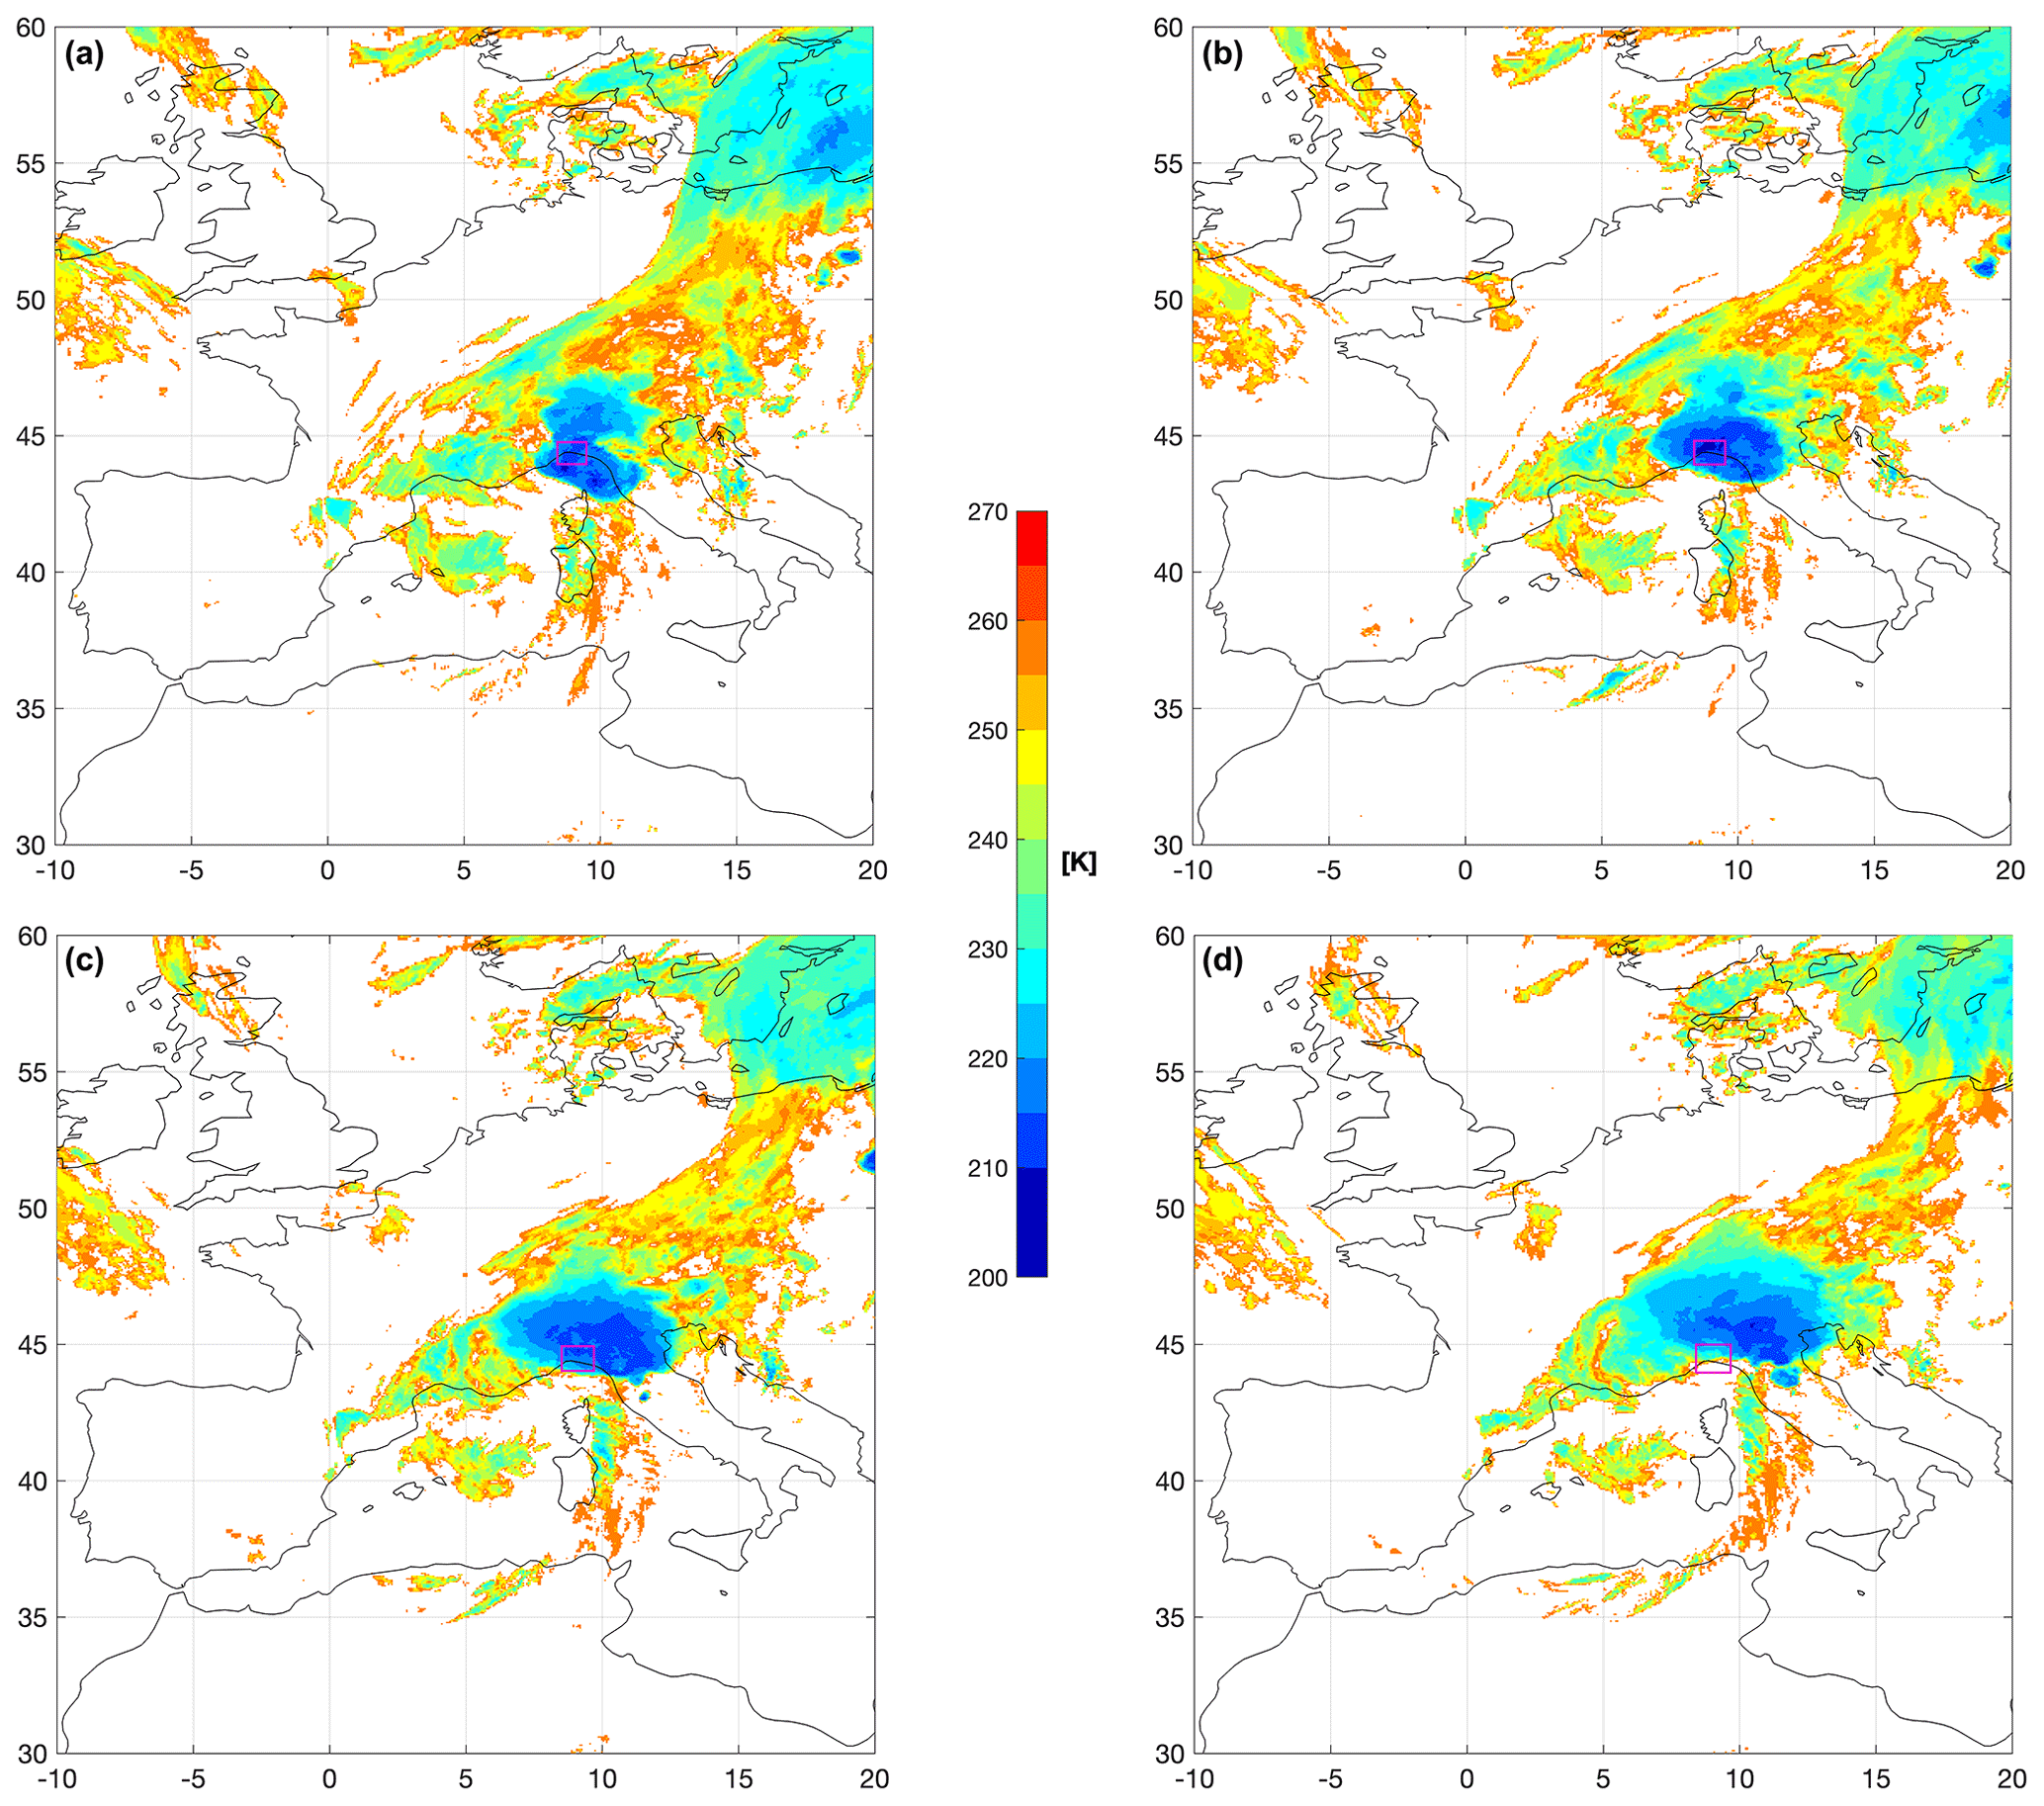
Figure 5Meteosat Second Generation (MSG) infrared images (10.8 MHz) at 22:00 UTC (a) and 23:00 UTC (b) on 27 August 2023 and at 00:00 UTC (c) and 01:00 UTC (d) on 28 August 2023. The area of interest is highlighted with the purple rectangle.
5.2 Synoptic-scale and mesoscale analysis
On 25 August, a North Atlantic disturbance began to descend towards the northwestern Alpine arc, weakening the northernmost part of the high-pressure promontory of North African origin present in the central Mediterranean. This synoptic scenario caused a rotation of the currents from the southern quadrants. This rotation favoured the entry of a warm conveyor belt characterised by moist air moving northward from the Ligurian Gulf. The warm and humid air continued to flow over the region in the days that followed and caused high instability further north in the Alpine foothill areas and the Po Valley (Fig. 5).
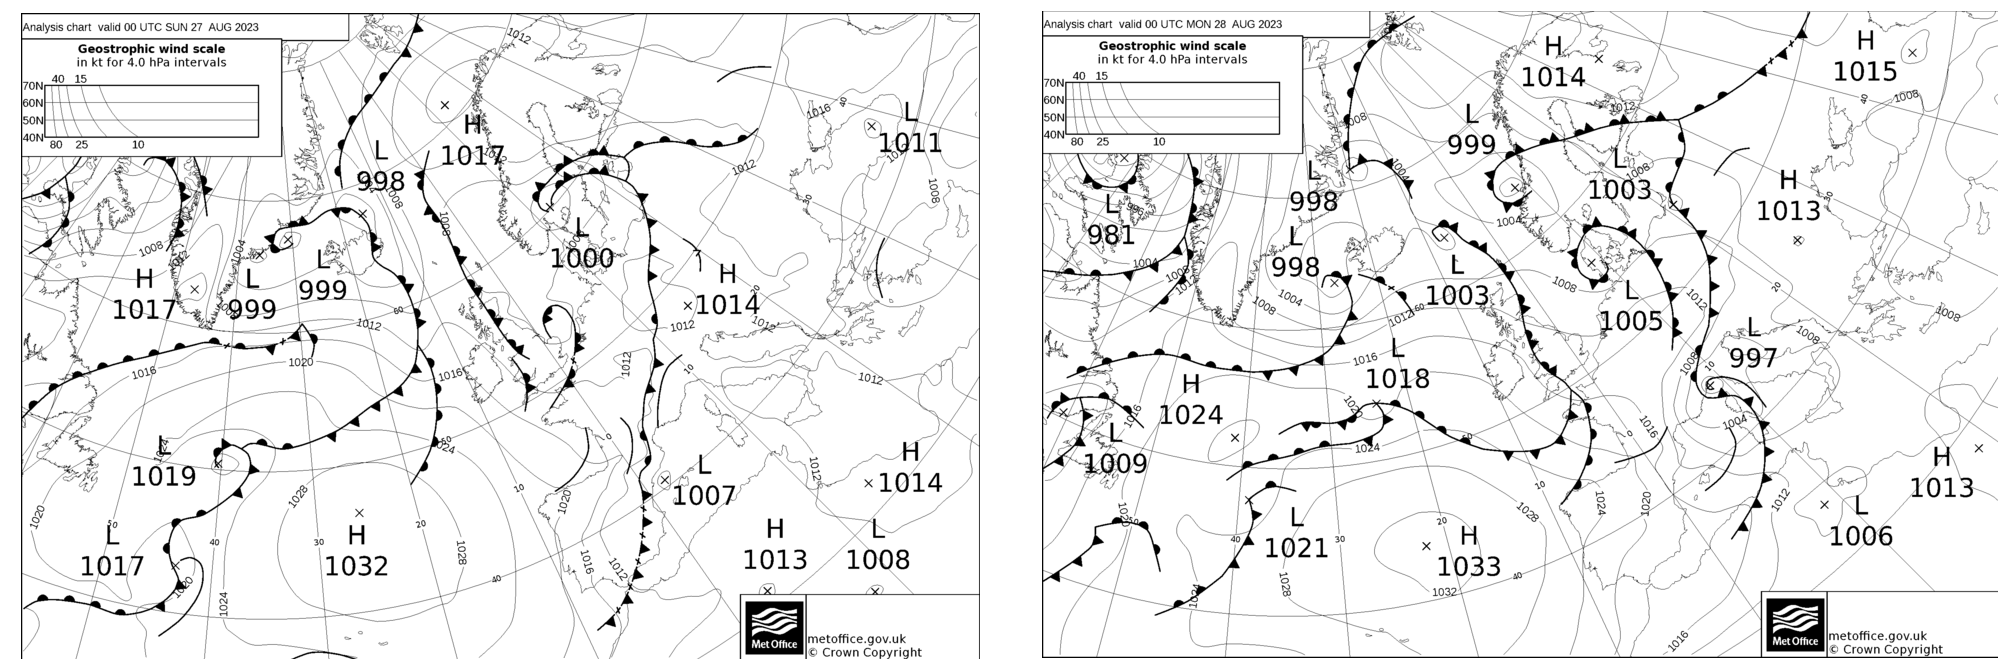
Figure 6Analysis chart for 00:00 UTC on 27 August 2023 (left) and 28 August 2023 (right).
From the evening of 26 August, the Atlantic trough extended further south, reaching the latitudes of the Iberian Peninsula, and, the following day, a low structured at all altitudes isolated itself from the trough, moving progressively from Spain towards the Ligurian Gulf, where it arrived the night between 27 and 28 August (Fig. 6). The influx of humid air from the east became even more pronounced over the Po Valley, and a pressure gradient favouring northern winds in the western part of the Genoa area and eastern winds in the eastern part of the Ligurian territory developed on the mountains. The subsequent convergence over the sea caused by this situation, together with the influx of humid air from the sea, exacerbated the atmospheric instability over the sea during the nighttime hours, resulting in the formation of cumulus clouds, which caused thunderstorms moving from the Ligurian Sea towards the coast, with showers developing over the historic centre of Genoa.
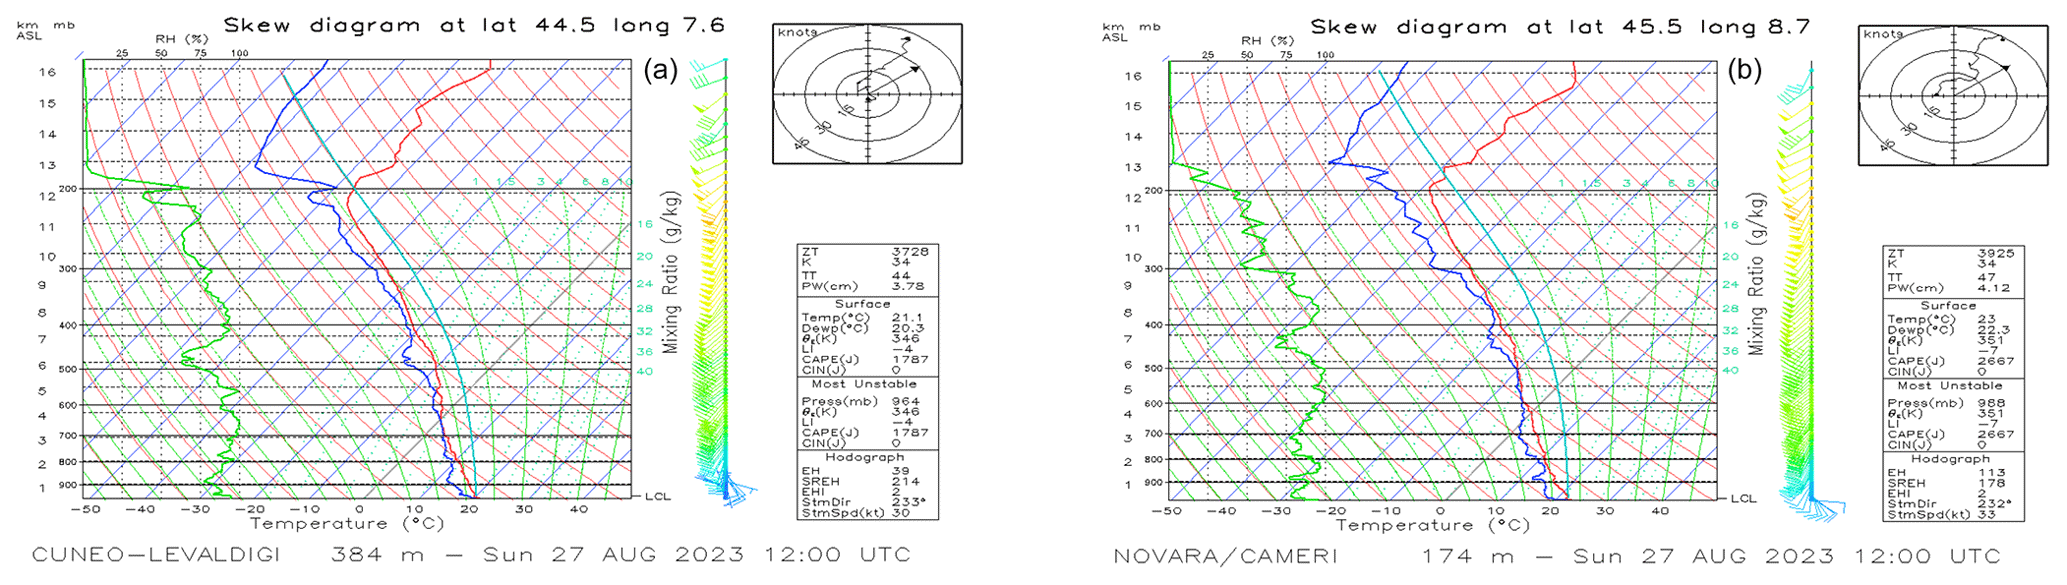
Figure 7Skew-T diagram in Cuneo Levaldigi (a) and Novara–Cameri (b) on 27 August 2023, 12:00 UTC.
From the analysis of the possible air column starting from the surroundings of Novara–Cameri and Cuneo Levaldigi (Fig. 7), it appears that in the afternoon of 27 August there was high energy available for convection on the northwest of the peninsula (convective available potential energy (CAPE) of 1800 J in Cuneo and 2700 J in Novara), with notable instability indices (lifted index of −4 in Cuneo and −7 in Novara, wind shear above 20 m s−1), while in the southern part of the Ligurian Gulf the instability indices did not highlight a particular situation (Payerne, not shown). These values of the instability indices suggest the possible formation of organised thunderstorms with a high risk of very intense rain.
The following day, on 28 August, the minimum pressure moved eastwards, giving way to drier northerly currents, which resulted in a dry Tramontana northern wind with consequent improvement in the weather. After a pre-frontal phase of a thunderstorm nature between the night of Saturday, 26 August, and the early hours of Sunday, 27 August, the most intense precipitation effects were observed on Sunday night, between 27 and 28 August, especially in the Genoa area.
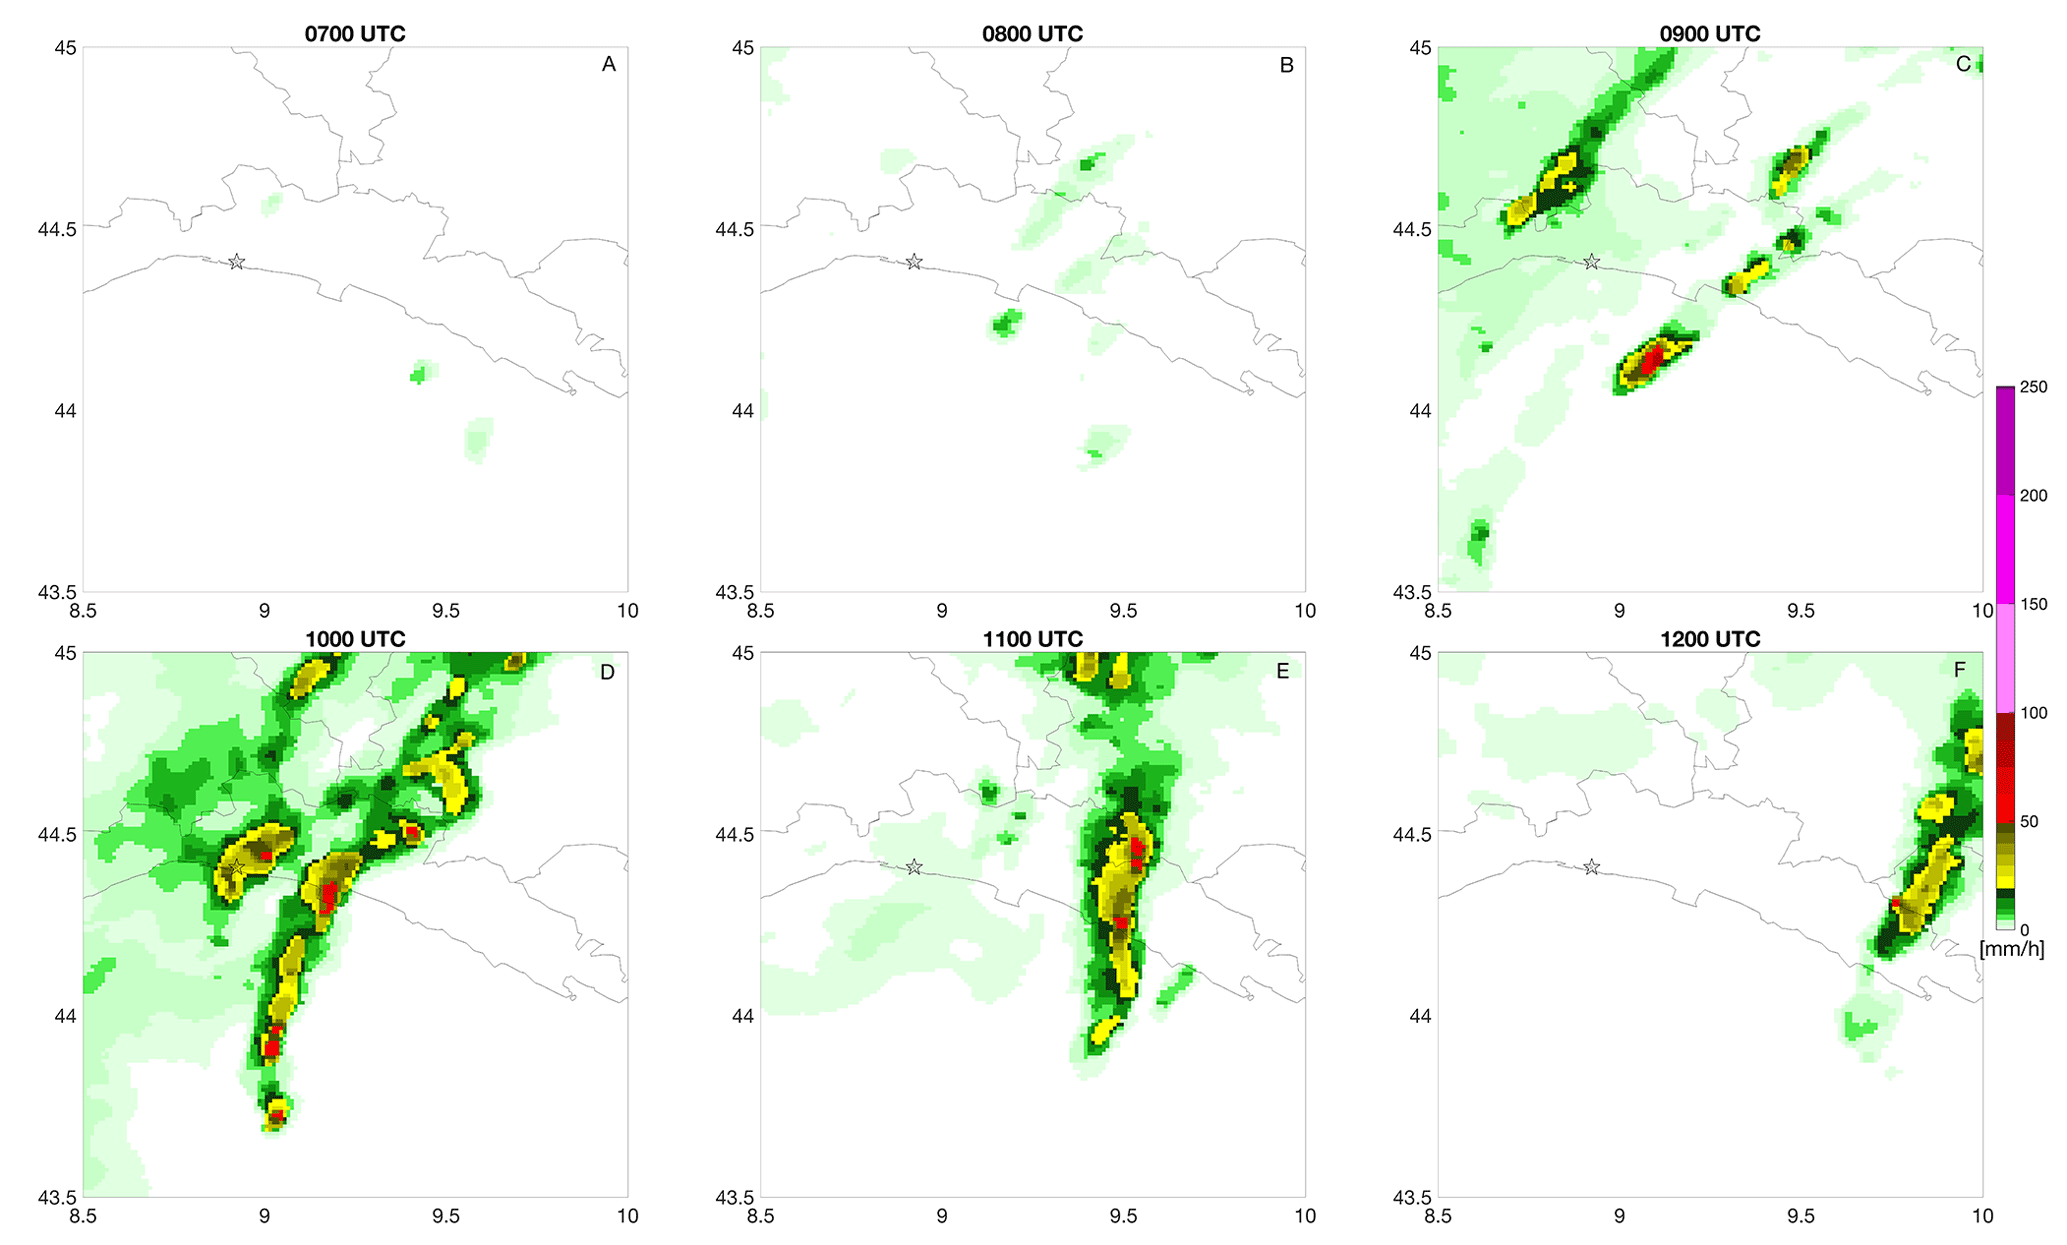
Figure 8Radar-derived rainfall intensity maps (07:00–12:00 UTC, from top left, a, to bottom right, f) on 27 August 2023. The star marker shows the position of the historic centre of Genoa.
Around 09:00 UTC, eastern Liguria began experiencing thunderstorm activity, with the main convective cell located in front of the Portofino area and associated rainfall intensity of approximately 30–40 mm h−1 (Fig. 8). Then, 1 h later, at 10:00 UTC, the convective cells (while persisting in the Portofino area) began affecting the Genoa area as well, with rainfall intensities peaking approximately up to 30–40 mm h−1. The convective line originally present in the Portofino area gradually moved eastward, affecting the areas of Chiavari, Lavagna, and Sestri Levante (11:00 UTC), and finally leaving eastern Liguria (12:00 UTC).
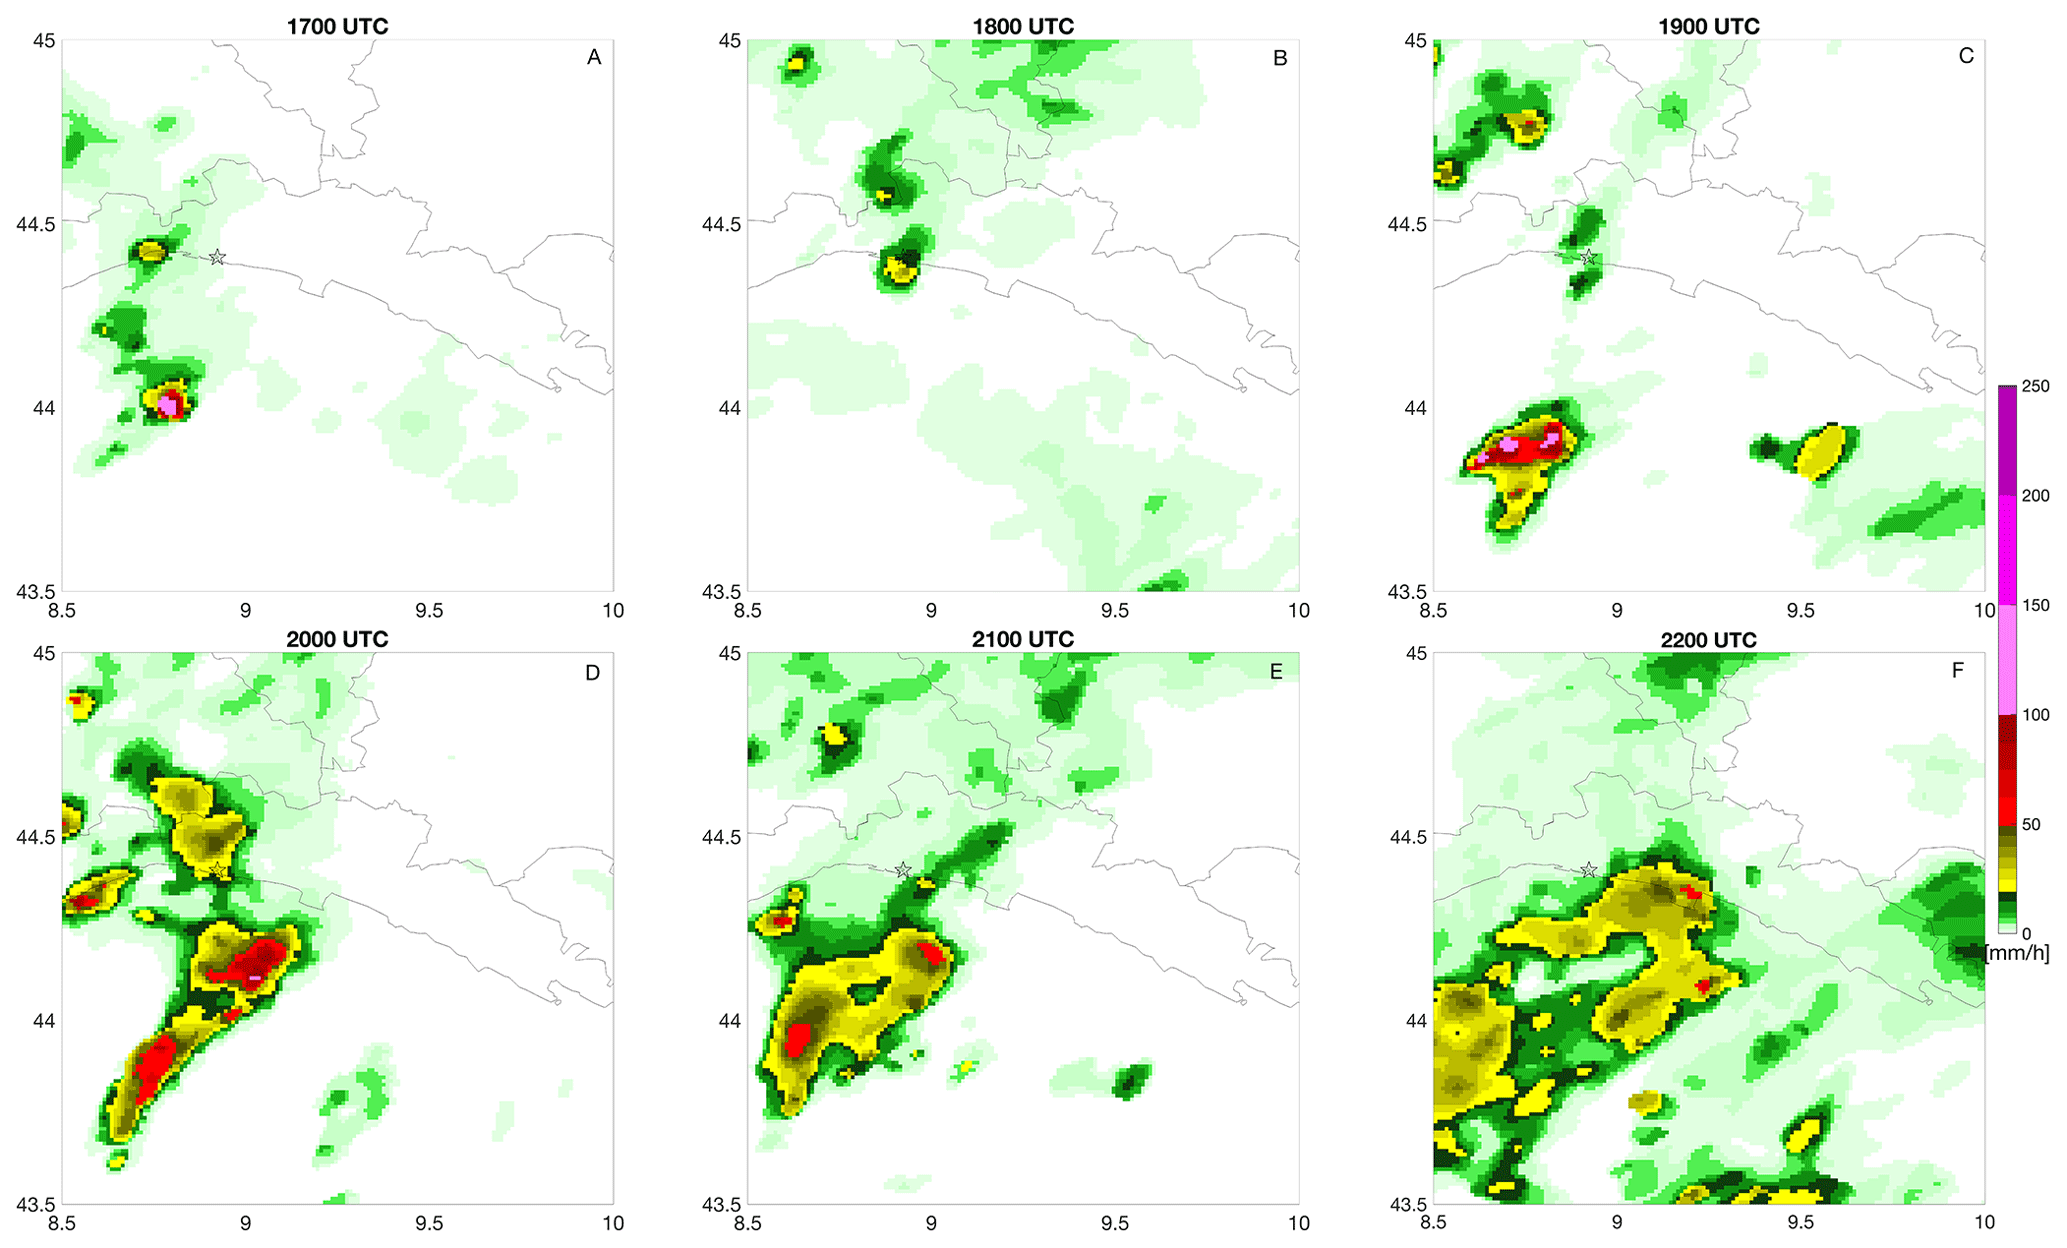
Figure 9Radar-derived rainfall intensity maps (17:00–22:00 UTC, from top left, a, to bottom right, f) on 27 August 2023. The star marker shows the position of the historic centre of Genoa.
Convective phenomena over the Gulf of Genoa area dissipated during the afternoon until 17:00 UTC when a new convective system, moving from France and associated with intense lightning activity, intensified over the Ligurian Sea about 100 km away from the Genoa area with rainfall intensity above 100 mm h−1 (Fig. 9). Newly developed severe convection activity started to affect the Genoa area around 17:00 UTC, and it persisted, in this phase, until the early hours of 28 August.
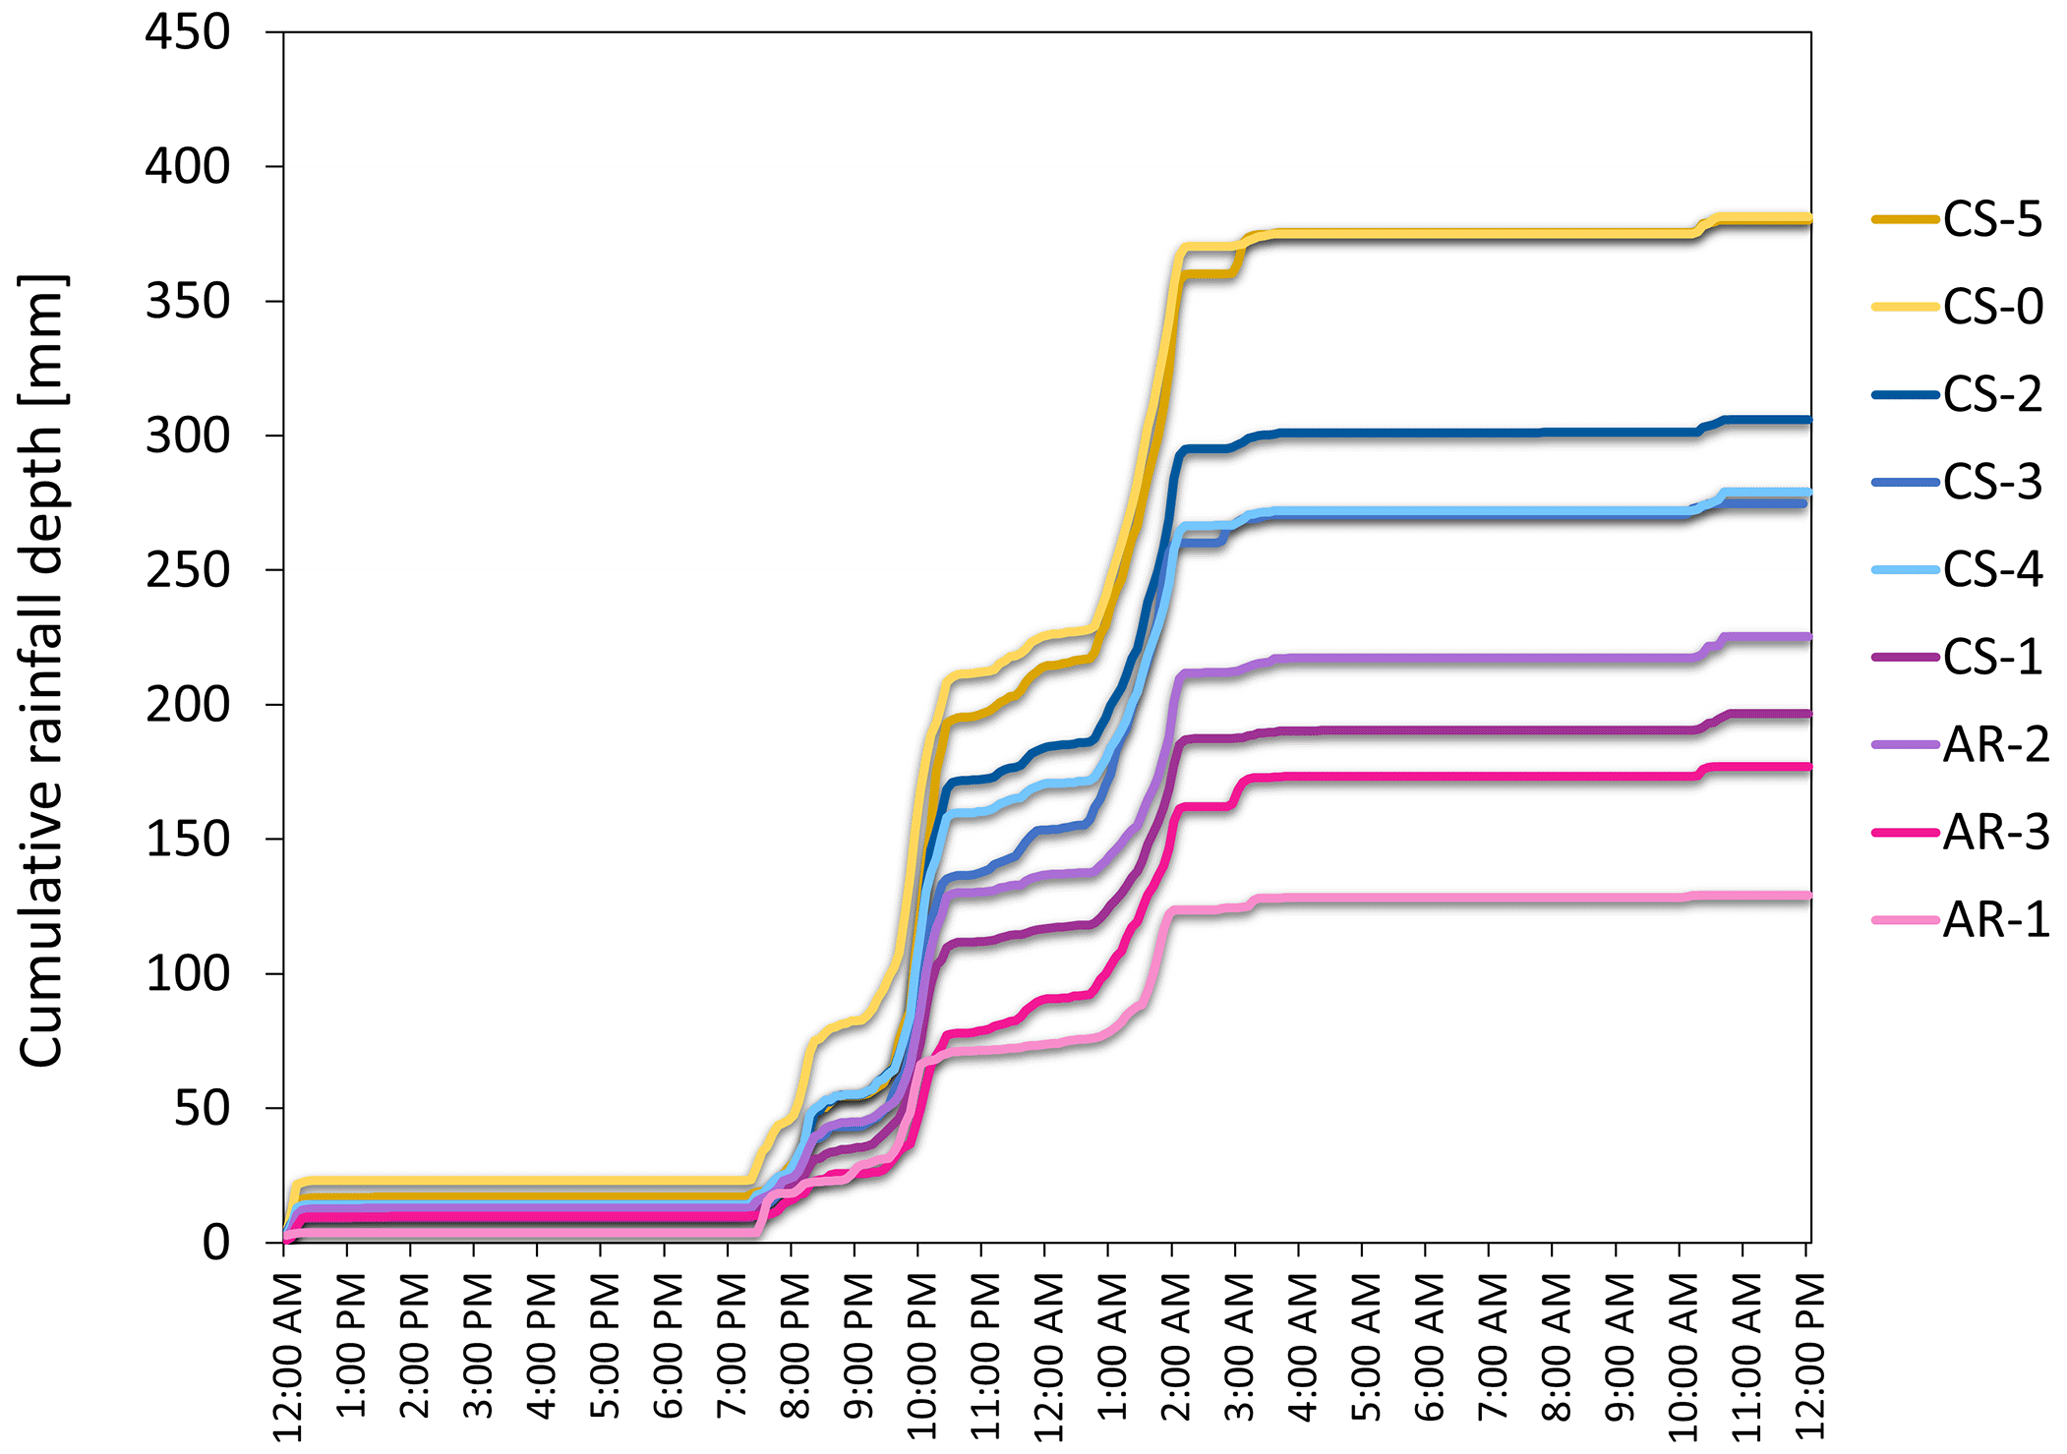
Figure 10Cumulative rainfall depth recorded from authoritative and citizen science networks in the Genoa study area.
5.3 Rain field reconstruction
As shown in Fig. 10, the authoritative weather station AR-2 managed by ARPAL, located in Castellaccio, recorded a cumulative rainfall depth of about 120 mm between 17:00 and 21:00 UTC. Later, convection phenomena reinforced between 23:00 UTC on 27 August and 00:00 UTC on 28 August, leading to a total rainfall depth of about 200 mm in 6–7 h. Two other ARPAL stations (AR-1 and AR-3) recorded about 130 and 170 mm, respectively, over the same time window.
In addition, the two stations CS-0 and CS-5, located about 600 m from each other within the harbour area, recorded a cumulative precipitation of 381.3 and 380 mm, respectively, almost double that of the AR-2 station positioned about 2 km away. The CS-5 station recorded precipitation values that are more similar to the CS-1 station, located at a distance of about 700 m from AR-2.
The cumulative precipitation patterns recorded at all stations can be grouped into three main sets, each one representative of the main showers associated with the event. The first set is located within a radius of less than 800 m from the centre of the main shower (CS-0 and CS-5, in the ancient harbour), coloured with different shades of yellow; the second set is located eastward of the centre of the main shower within a radius of less than 2 km and coloured with different shades of blue (CS-2, CS-3, and CS-4); and the last set is located further away within a radius beyond 2 km, west and east of the area, as highlighted with different shades of pink (AR-1 and AR-3).
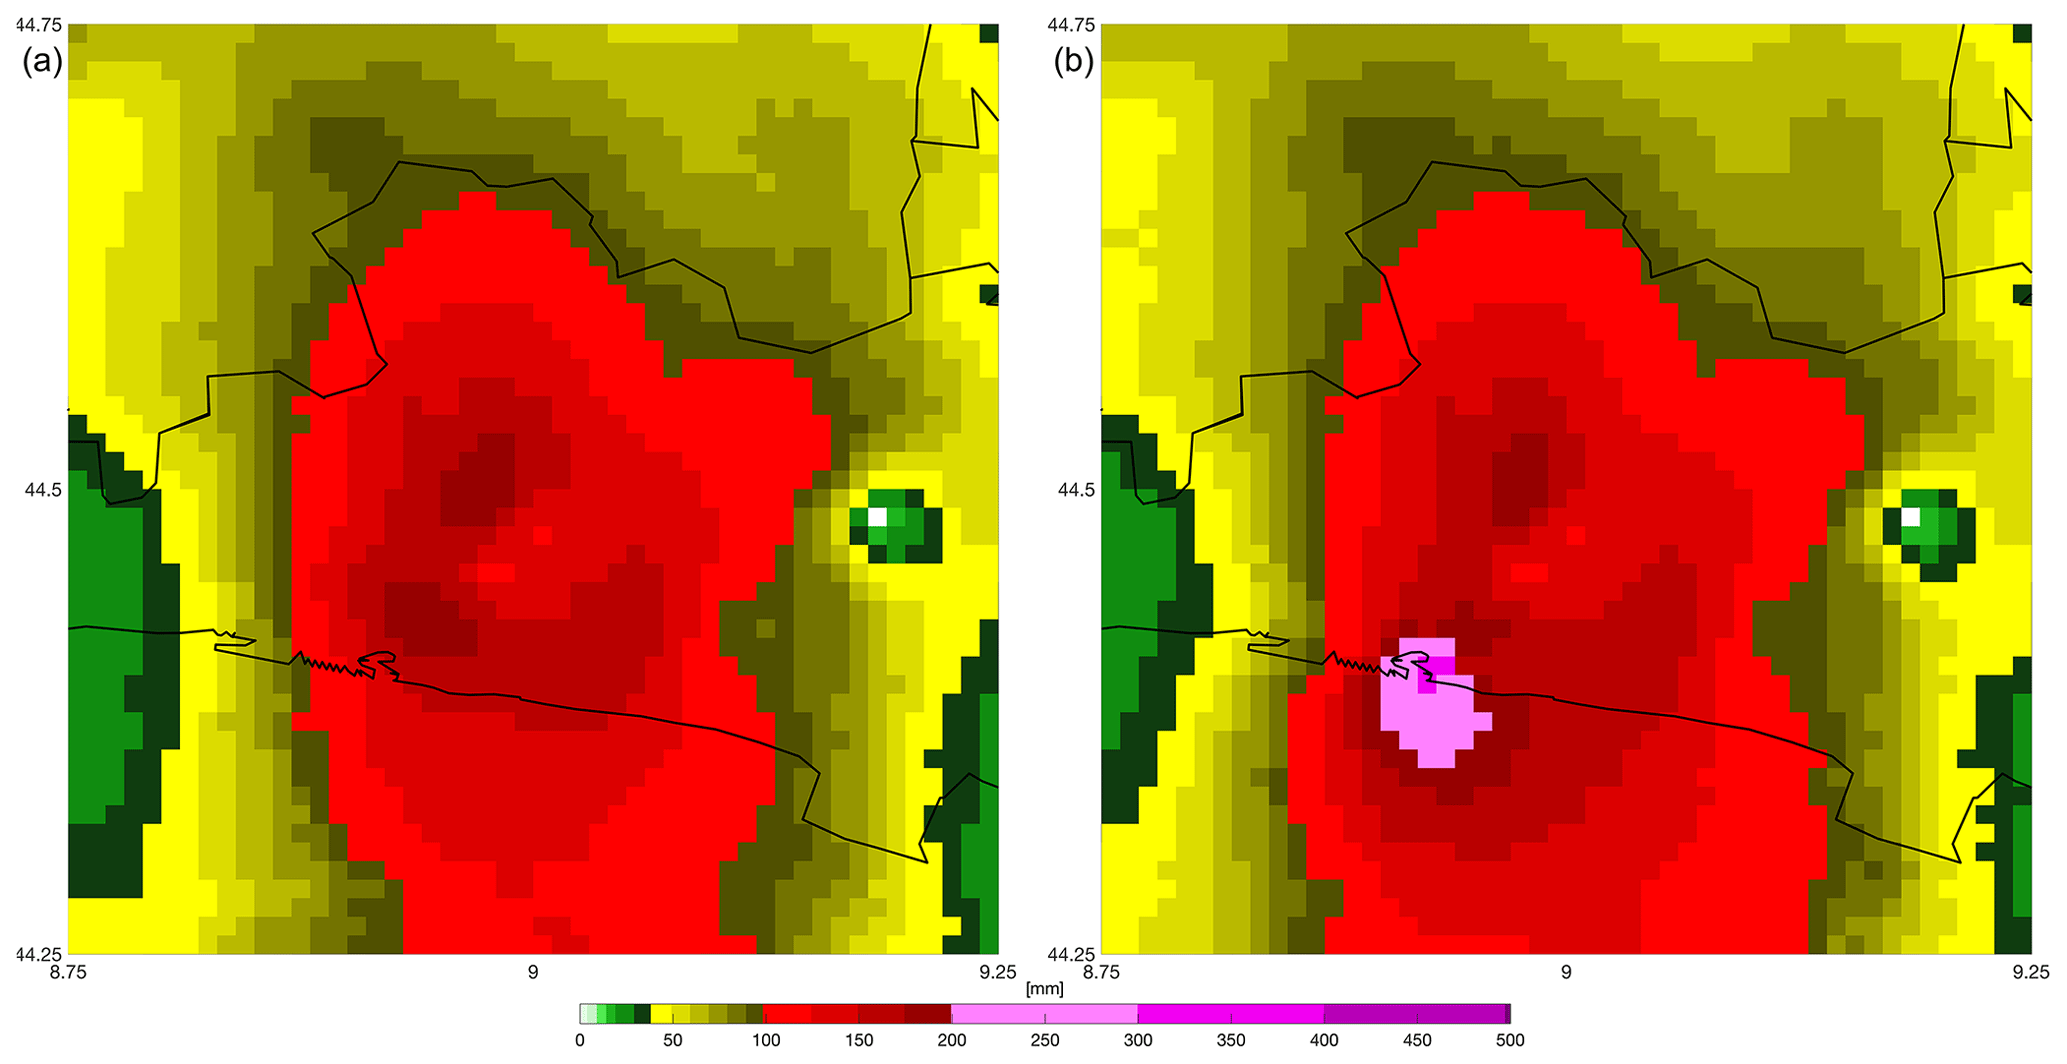
Figure 11The 12 h cumulative precipitation maps from 18:00 UTC on 27 August to 06:00 UTC on 28 August 2023, based on the merging of radar estimates with authoritative rain gauges alone (a) and also adding citizen science rain gauges (b).
A question arises from this analysis and the statistical analysis performed in the previous section. What would happen if data from citizen science stations were included in the process of acquisition and production of the radar-derived rainfall maps? To answer this question, we produced 12 h cumulative precipitation maps from 18:00 UTC on 27 August to 06:00 UTC on 28 August 2023 in two different configurations (Fig. 11):
-
merging only radar data and the official AR weather stations (Bruno et al., 2021)
-
also adding citizen science (CS) stations.
The fusion method used in this study is modified conditional merging (MCM). After the spatiotemporal domain of interest is defined, radar quantitative precipitation estimations (QPEs) and rain gauges are downloaded from the reference database. Then, the correlation is evaluated for each rain gauge, and the GRISO (random generator of spatial interpolation from uncertain observations) interpolation (Petracca et al., 2018; Pignone et al., 2010) is performed on both rain gauge data and radar data. With reference to the interpolation of radar data, the data are sampled on rain gauge locations, and the same GRISO parameters as for the interpolation of rain gauge data are adopted. Then, the difference between the original radar map and the GRISO interpolation on radar data is evaluated. Finally, the sum of the difference map and the rain gauge interpolation provides the MCM map.
It is evident from the data set analysed in this work that a higher density of rain gauge stations is required to capture the spatiotemporal dynamics of intense rainfall events that are prone to produce flooding in cities and critical conditions in storm water drainage systems. Authoritative monitoring networks are often too coarse to provide sufficient coverage.
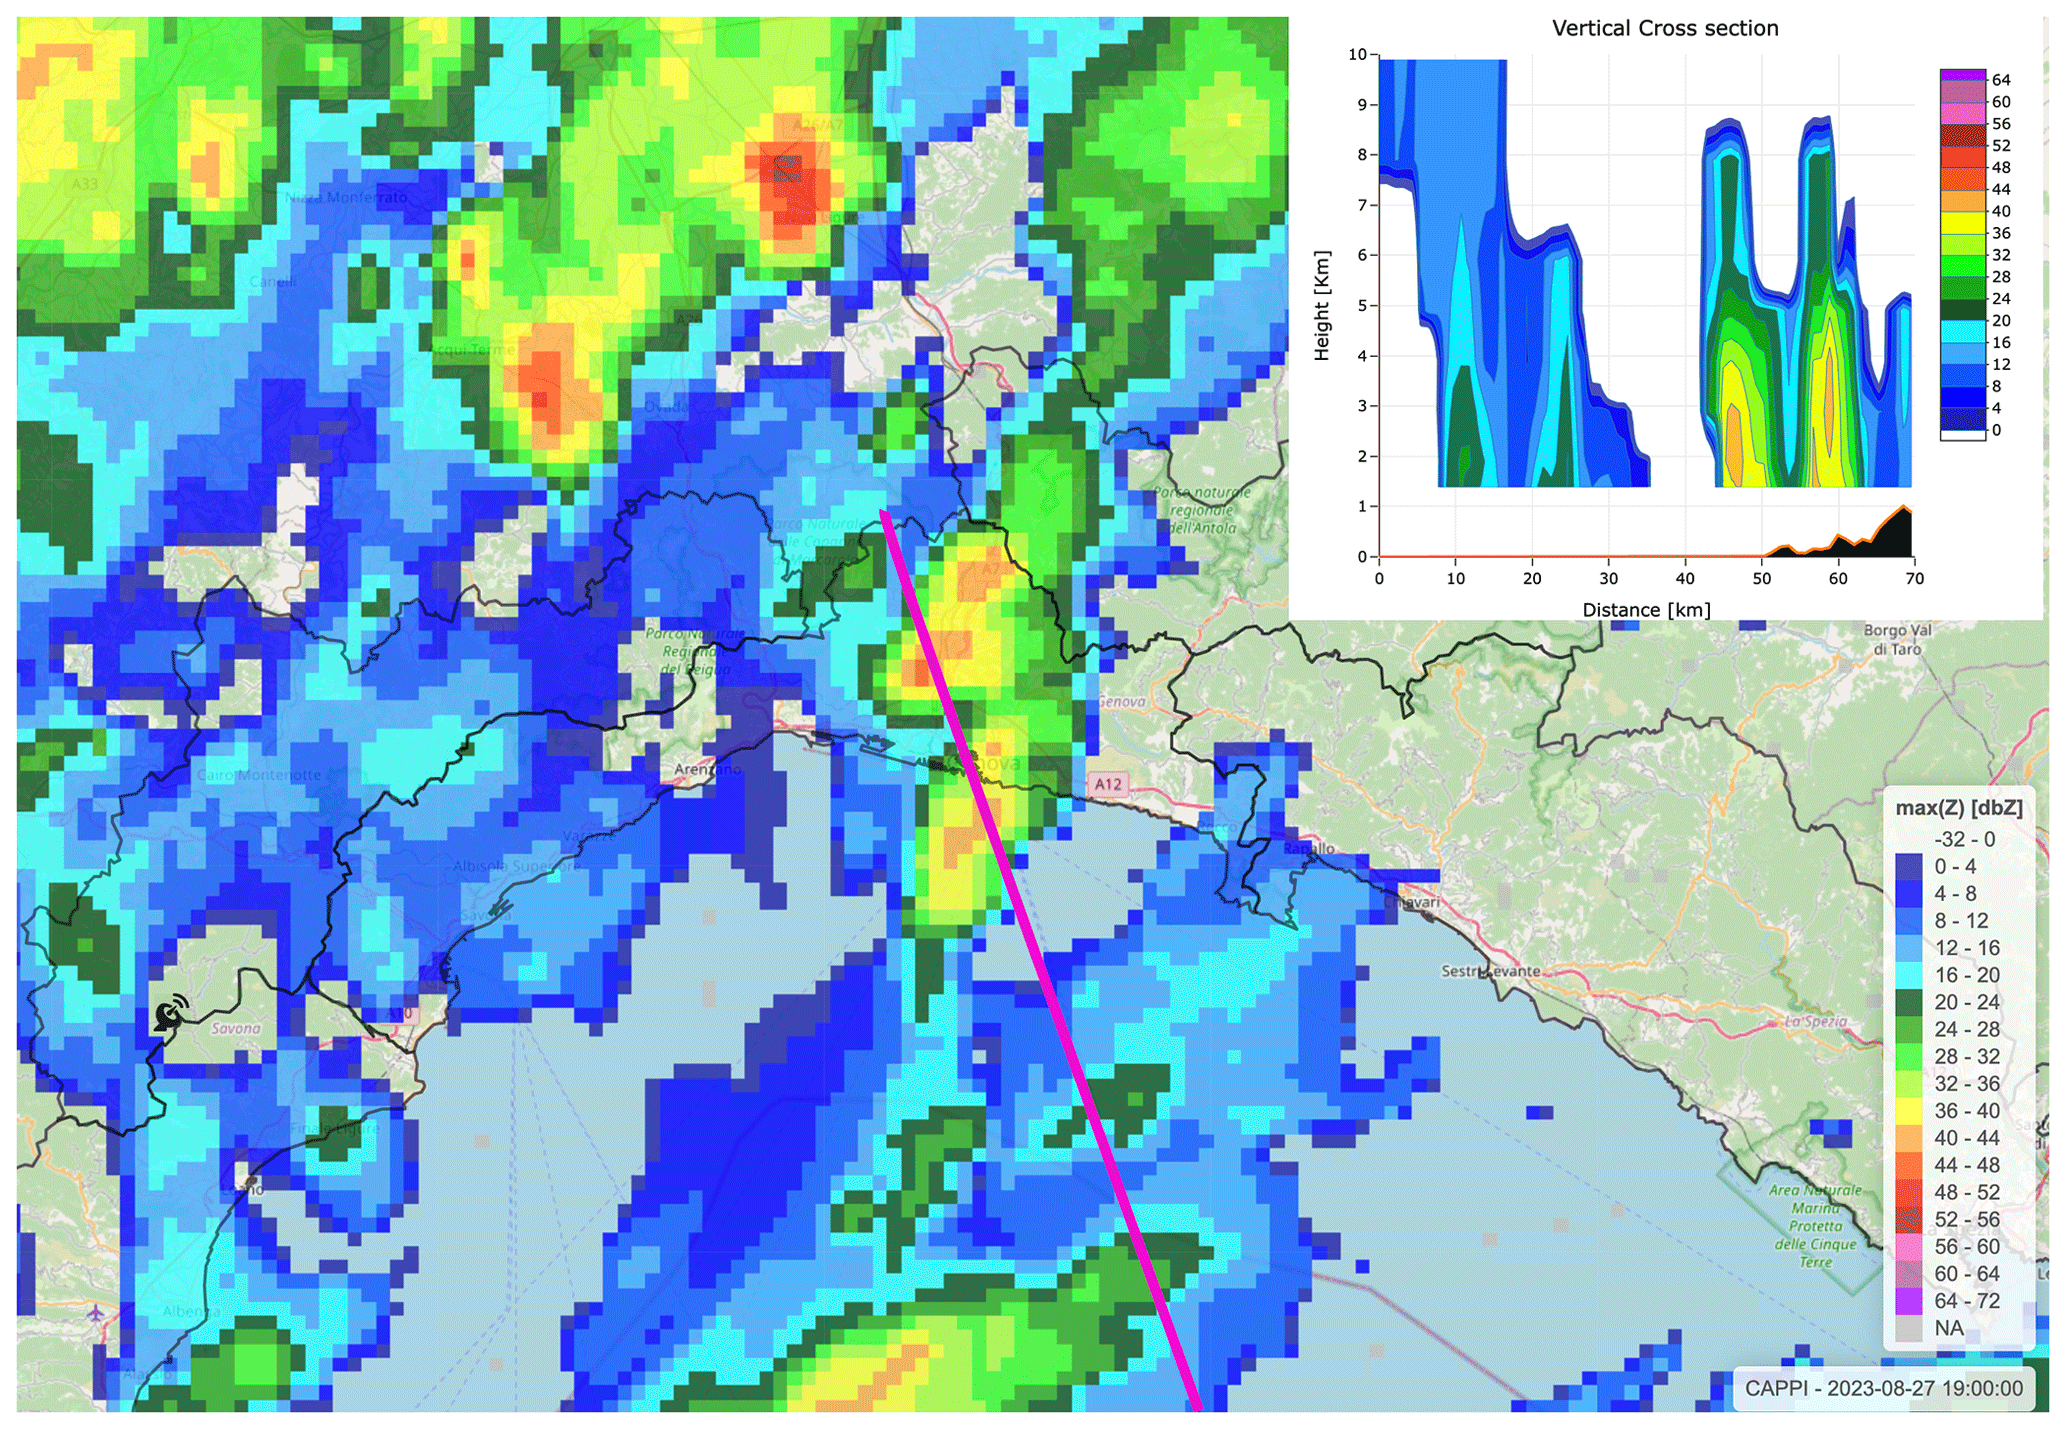
Figure 12Radar reflectivity map (19:00 UTC) on 27 August 2023 and sample cross-section (track is indicated by the purple line).
Looking at the radar images in more detail, it is possible to gain a deeper understanding of the convective phenomenon affecting the historic centre of Genoa starting from the evening (19:00 UTC) of 27 August. In fact, when a cross-section is made of the radar echoes over the area of the ancient port of Genoa, one notices how the column of air above is affected by extremely localised thunderstorms with a thickness of up to 8000 m (19:00 UTC, Fig. 12).
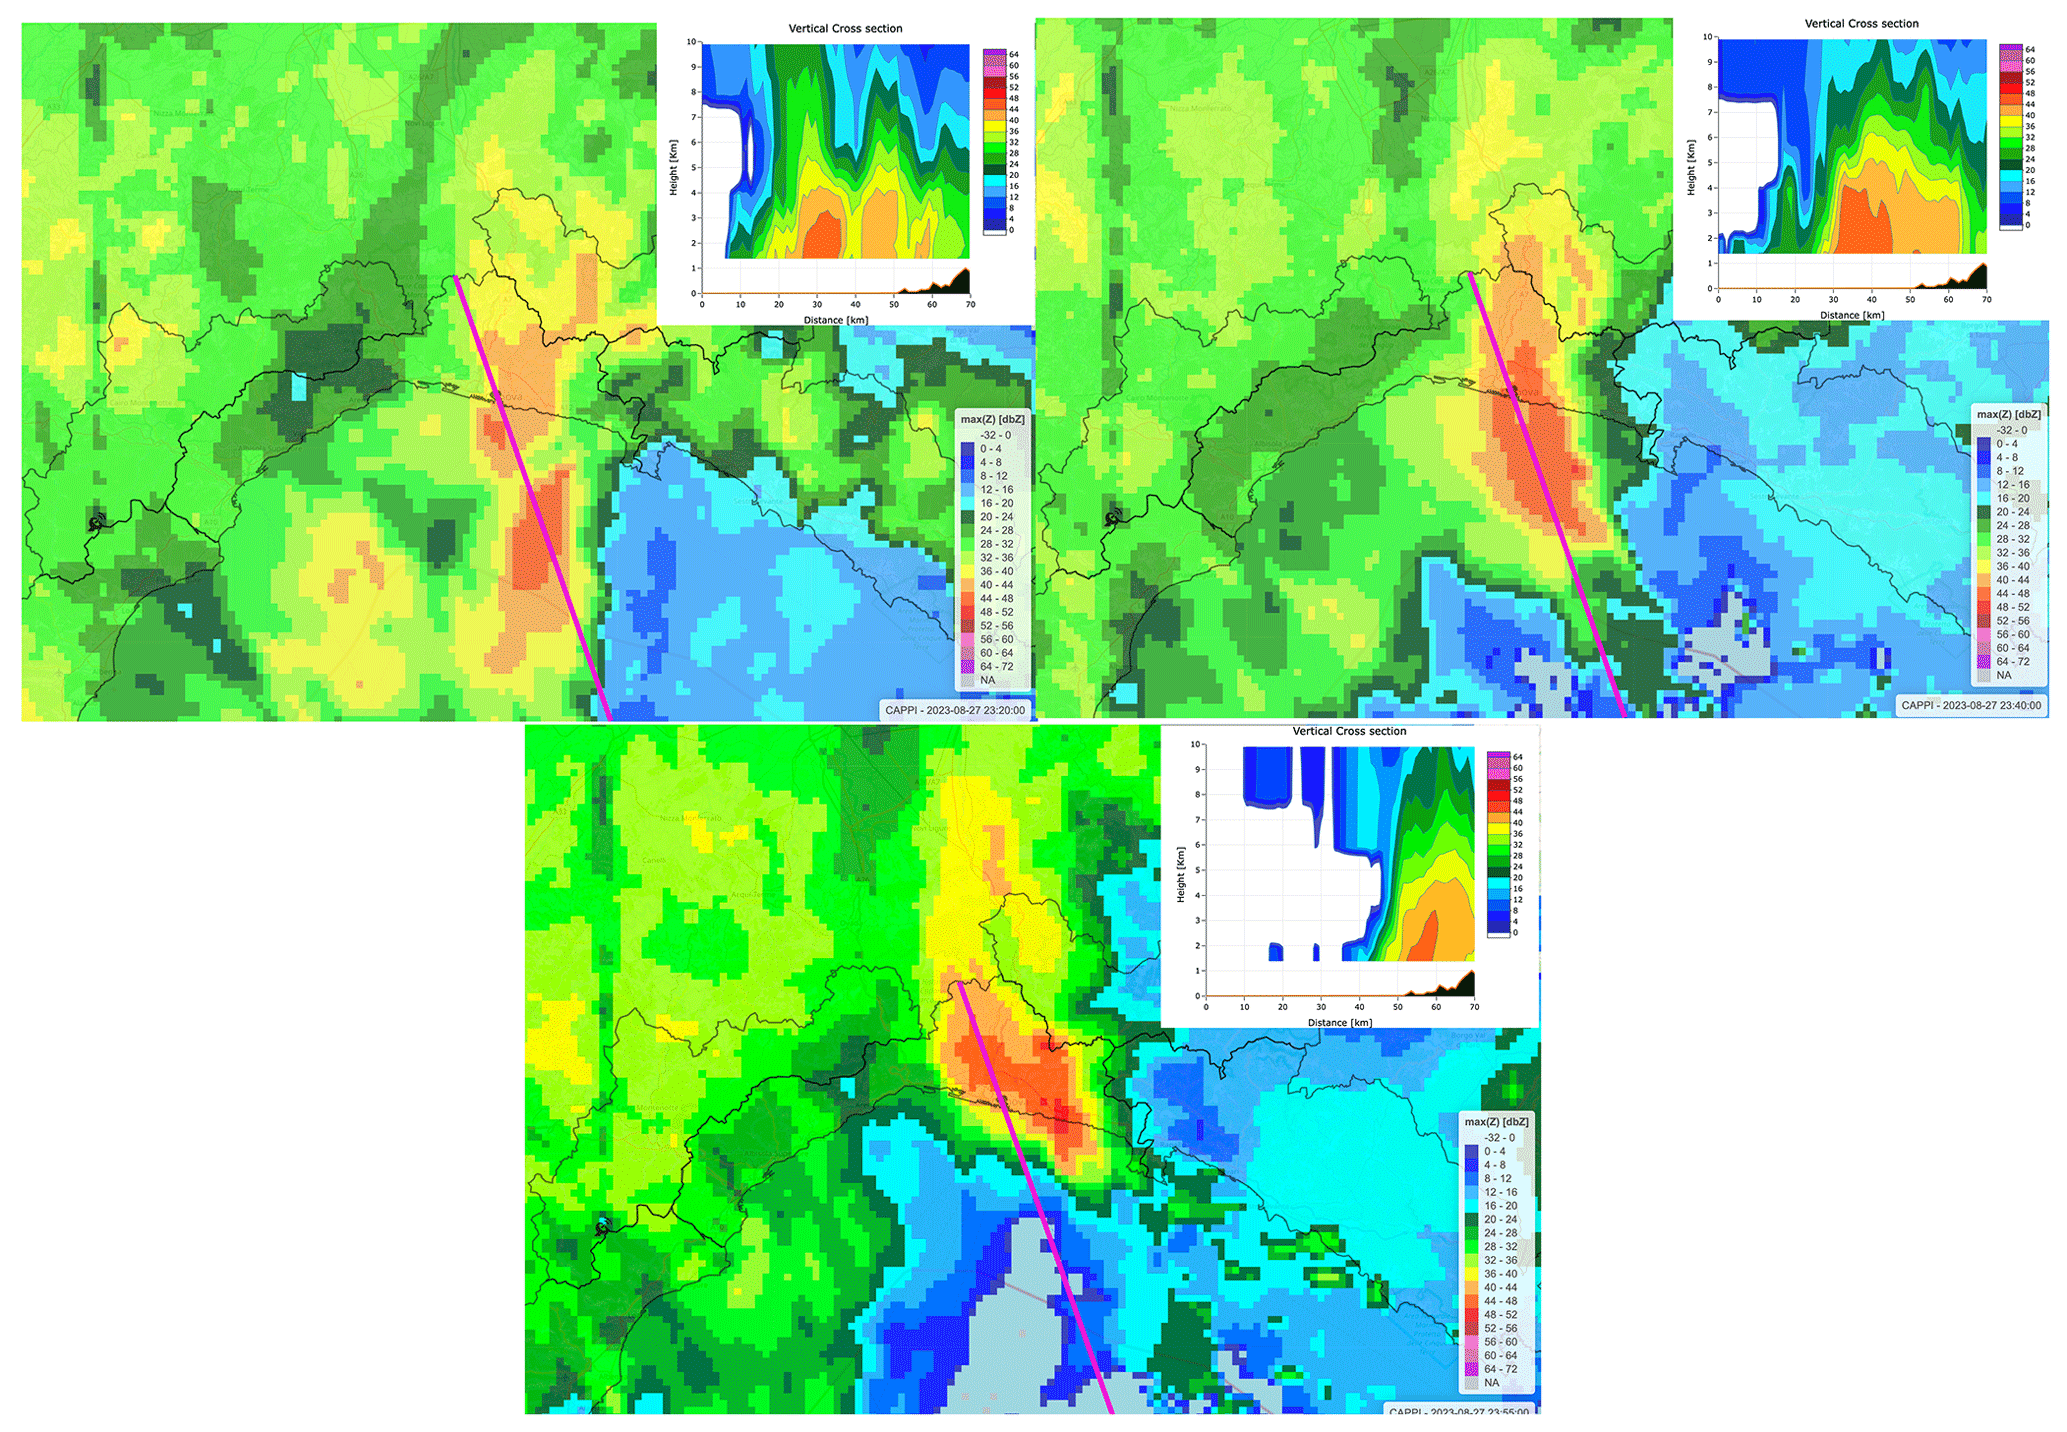
Figure 13Radar reflectivity maps (23:20, 23:40, and 23:55 UTC) on 27 August 2023 and sample cross-sections (tracks are indicated by the purple lines).
Taking into consideration the same cross-section in the period between 23:00 and 00:00 UTC, we note that the convective structure is becoming more organised, with a movement towards the east affecting a vertical portion up to above 10 000 m. From the vertical section at 23:55 UTC one can also appreciate the hook shape of the top of the convective cloud, typical of meteorological structures with moist deep convection, causing high vertical movement of the air up to the boundary layer (Fig. 13).
The comparison between the cumulative rain recorded by the different networks shows how the convective nature of the phenomenon reflects extremely diverse effects on the territory and an extremely local evolution of the most intense showers. The very local features of this event show the importance of merging different monitoring networks, when available, to capture the small-scale characteristics of convective events.
This study analysed the role of citizen scientist weather stations in observing and analysing the spatiotemporal evolution of intense and short-lived precipitation events, which are potentially dangerous for urban areas, especially in regions with complex orography.
The case of the historic centre of Genoa (Italy) was used as an example. A recent event that occurred between 27 and 28 August 2023 was analysed from a meteorological point of view using radar, satellite, and in situ observations.
The observations from the closest radio soundings clearly show a high probability of the formation of intense convective structures, which subsequently formed over the Ligurian Gulf. The spatiotemporal structure and the maximum intensity of the forecasts generated over the Genoa area are only partially captured by the observations of the authoritative network and the estimates from meteorological radar, mainly due to the coarse spatial resolution of the AR weather stations and the limited reliability of the radar estimates in the case of convective rainfall.
The inclusion of observations from citizen science weather stations shows the high spatial variability of the rainfall field for the case study investigated, with values of cumulative precipitation being extremely variable within a range of only 1–2 km.
It is therefore evident that both meteorological radar, which usually has a spatial resolution of the order of 1 km, and the authoritative ground measurement networks, which in a best-case scenario in Italy have a density of around 0.03 stations per square kilometre (Pelosi et al., 2020), are not suitable for adequately describing the precipitation field.
This further corroborates similar results obtained at much larger spatiotemporal scales. For example, Shen and Xiong (2016) used rain gauge information, although not fused with radar maps, to show that increasing the number of stations used for rain field reconstruction in China can include more details of rainfall patterns. However, they used a much coarser spatial resolution compared to the present study.
Further evidence of this inadequacy, extrapolated from the case of a single event, is obtained from the statistical analysis of the annual rainfall maxima for a sub-hourly duration carried out on historical time series recorded by the authoritative stations in the Genoa area. Differences in the mean depth of the sub-hourly maximum annual precipitation are generally estimated to be greater than 20 % even over distances of 2–4 km.
Inadequate observation of short-duration intense rainfall has a twofold impact: firstly, the design hyetographs used for urban infrastructures or flood mitigation solutions are underestimated in areas where the historical urban stratification does not allow for interventions to modify drainage networks. Secondly, it can limit the effectiveness of efforts to improve the reliability of high-resolution modelling of convective systems, as there is no reliable ground truth against which to validate model performance.
In situations such as the historic centre of Genoa, with such a high anthropogenic impact on the natural morphogenetic system, it is difficult to design risk reduction measures: it is not possible to operate with structural interventions aimed at increasing the hydraulic cross-section due to urbanisation, nor it is possible to significantly reduce the impervious surface. Possible solutions include the so-called “green infrastructures” (e.g. porous materials for paving, green roofs) or old cisterns connected to buildings as temporary floodwater storage basins to attenuate the peak discharges (Coniglio et al., 2002), which are usually very rapid due to the physical-geographical layout of urban areas such as the historic centre of Genoa.
In the presented case study, the introduction of citizen science observations allowed for a better understanding of the spatiotemporal structure of the phenomena causing urban flooding in the study area. In the future, a more structured use of this information, together with observation-based validation procedures, can make a fundamental contribution to risk prediction and management in densely urbanised areas, such as the historic centres of many Mediterranean coastal cities.
The analysis carried out in the previous section shows how, in a highly urbanised area and with a drainage structure that has now been completely transformed into an artificial network (a feature common to many historic cities in the Mediterranean region), events of this type have characteristic spatial scales that cannot be fully captured by standard authoritative measurement networks alone. A better knowledge of the spatial scale and probability of occurrence of short-duration heavy-rainfall events is fundamental for the correct design of risk management measures in urban areas, and the role of observations provided by networks managed by citizen scientists can prove to be fundamental.
Data from the GU station are available upon request from DISTAV, University of Genoa. For more information, see https://www.distav.unige.it/meteo (last access: 13 July 2024). Data from the DICCA station are available upon request from DICCA, University of Genoa. Data from AR stations are available upon request from the ARPAL. For more information, see https://omirl.regione.liguria.it/#/map (last access: 13 July 2023). Data from CS stations are available upon request from the CIMA Research Foundation (https://www.acronetwork.org/, last access: 14 July 2024), MeteoNetwork (https://www.meteonetwork.it/rete/livemap/, last access: 14 July 2024), and Weather Underground (https://www.wunderground.com/ last access: 14 July 2024).
AP, NL, and MM co-conceived the research, drafted the paper, contributed to the meteorological analysis, and revised the paper. AC conceived and performed the analysis of the study area rainfall regime, drafted the related section, and revised the paper. GB, FF, and GP contributed to the description of the study region and revised the paper. All authors have read and agreed to the published version of the paper.
The contact author has declared that none of the authors has any competing interests.
Publisher's note: Copernicus Publications remains neutral with regard to jurisdictional claims made in the text, published maps, institutional affiliations, or any other geographical representation in this paper. While Copernicus Publications makes every effort to include appropriate place names, the final responsibility lies with the authors.
We extend our sincere appreciation to ARPA Piemonte for their essential support in providing atmospheric soundings, which greatly enriched the scope of our research. Additionally, we would like to acknowledge ARPA Liguria for their valuable contribution in supplying radar cross-sections. The collaboration with both ARPA Piemonte and ARPA Liguria has been instrumental in advancing our understanding of the atmospheric conditions crucial to this study.
This research has been supported by the Horizon H2020 project I-CHANGE (Individual Change of HAbits Needed for Green European transition) (grant no. 101037193) and by the “RETURN” Extended Partnership, which received funding from the European Union's NextGenerationEU (National Recovery and Resilience Plan – NRRP, Mission 4, Component 2, Investment 1.3 – D.D. 1243 2/8/2022, PE0000005).
This paper was edited by Dan Li and reviewed by Aaron Alexander and Mingze Ding.
Ali, H. and Mishra, V.: Contributions of dynamic and thermodynamic scaling in subdaily precipitation extremes in India, Geophys. Res. Lett., 45, 2352–2361, https://doi.org/10.1002/2018GL077065, 2018. a
Arnone, E., Pumo, D., Viola, F., Noto, L. V., and La Loggia, G.: Rainfall statistics changes in Sicily, Hydrol. Earth Syst. Sci., 17, 2449–2458, https://doi.org/10.5194/hess-17-2449-2013, 2013. a, b
ARPAL: Meteo-hydrologic Event of 27–28/08/2023, Regional Agency for Environmental Protection of the Liguria Region, http://www.arpal.liguria.it/contenuti_statici/pubblicazioni/rapporti_eventi/2023/REM_20230827-28-arancione_temporali_vers20231028.pdf (last access: 13 July 2024), 2023 (in Italian). a
Bedrina, T., Parodi, A., Quarati, A., and Clematis, A.: ICT approaches to integrating institutional and non-institutional data services for better understanding of hydro-meteorological phenomena, Nat. Hazards Earth Syst. Sci., 12, 1961–1968, https://doi.org/10.5194/nhess-12-1961-2012, 2012. a
Bruni, G., Reinoso, R., van de Giesen, N. C., Clemens, F. H. L. R., and ten Veldhuis, J. A. E.: On the sensitivity of urban hydrodynamic modelling to rainfall spatial and temporal resolution, Hydrol. Earth Syst. Sci., 19, 691–709, https://doi.org/10.5194/hess-19-691-2015, 2015. a
Bruno, G., Pignone, F., Silvestro, F., Gabellani, S., Schiavi, F., Rebora, N., and Falzacappa, M.: Performing hydrological monitoring at a national scale by exploiting rain-gauge and radar networks: the Italian case, Atmosphere, 12, 771, https://doi.org/10.3390/atmos12060771, 2021. a, b
Cauteruccio, A. and Lanza, L. G.: The Long-Term Performance of a Rainwater Harvesting System Based on a Quasi-Bicentennial Rainfall Time Series, Sustainability, 15, 15619, https://doi.org/10.3390/su152115619, 2023. a
Cauteruccio, A., Colli, M., Stagnaro, M., Lanza, L. G., and Vuerich, E.: In-situ precipitation measurements, in: Springer Handbook of Atmospheric Measurements, edited by: Foken, T., Springer, Cham, Switzerland, 359–400, https://doi.org/10.1007/978-3-030-52171-4_12, 2021. a
CEN: Hydrometry: measurement requirements and classification of rainfall intensity measuring instruments, European Committee for Standardization, Brussels, Belgium, EN 17277:2019, 22 pp., 2019. a
Coniglio, D., Molini, A., La Barbera, P., and Lanza, L. G.: Non invasive defense structures in the urban environment: a case study, in: Proceedings of the second international symposium on flood defence, Science Press New York Ltd, New York, US, Vol. 2, 1347–1356, ISBN 1-880132-54-0, 2002. a
Du, H., Alexander, L. V., Donat, M. G., Lippmann, T., Srivastava, A., Salinger, J., Kruger, A., Choi, G., He, H. S., Fujibe, F., Rusticucci, M., Nandintsetseg, B., Manzanas, R., Rehman, S., Abbas, F., Zhai, P., Yabi, I., Stambaugh, M. C., Wang, S., Batbold, A., de Oliveira, P. T., Adrees, M., Hou, W., Zong, S., Santos e Silva, C. M., Lucio, P. S., and Wu, Z.: Precipitation from persistent extremes is increasing in most regions and globally, Geophys. Res. Lett., 46, 6041–6049, https://doi.org/10.1029/2019GL081898, 2019. a
Dunn, R. J., Alexander, L. V., Donat, M. G., Zhang, X., Bador, M., Herold, N., Lippmann, T., Allan, R., Aguilar, E., Barry, A. A., Brunet, M., Caesar, J., Chagnaud, G., Cheng, V., Cinco, T., Durre, I., de Guzman, R., Htay, T. M., Ibadullah, W. M. W., Ibrahim, M. K. I. B., Khoshkam, M., Kruger, A., Kubota, H., Leng, T. W., Lim, G., Li-Sha, L., Marengo, J., Mbatha, S., McGree, S., Menne, M., de los Milagros Skansi, M., Ngwenya, S., Nkrumah, F., Oonariya, C., Pabon-Caicedo, J. D., Panthou, G., Pham, C., Rahimzadeh, F., Ramos, A., Salgado, E., Salinger, J., Sané, Y., Sopaheluwakan, A., Srivastava, A., Sun, Y., Timbal, B., Trachow, N., Trewin, B., van der Schrier, G., Vazquez-Aguirre, J., Vasquez, R., Villarroel, C., Vincent, L., Vischel, T., Vose, R., and Yussof, M. N. B. H.: Development of an updated global land in situ-based data set of temperature and precipitation extremes: HadEX3, J. Geophys. Res.-Atmos., 125, e2019JD032263, https://doi.org/10.1029/2019JD032263, 2020. a, b
Faccini, F., Luino, F., Sacchini, A., and Turconi, L.: Flash flood events and urban development in Genoa (Italy): lost in translation, in: Engineering Geology for Society and Territory, edited by: Lollino, G., Manconi, A., Guzzetti, F., Culshaw, M., Bobrowsky, P., and Luino, F., Springer, Cham, Switzerland, https://doi.org/10.1007/978-3-319-09048-1_155, 2015. a
Faccini, F., Paliaga, G., Piana, P., Sacchini, A., and Watkins, C.: The Bisagno stream catchment (Genoa, Italy) and its major floods (1822, 1970 and 2014): geomorphic and land use variations in the last three centuries, Geomorphology, 273, 14–27, https://doi.org/10.1016/j.geomorph.2016.07.037, 2016. a
Faccini, F., Luino, F., Paliaga, G., Roccati, A., and Turconi, L.: Flash flood events along the west Mediterranean coasts: inundations of urbanized areas conditioned by anthropic impacts, Land, 10, 620, https://doi.org/10.3390/land10060620, 2021. a
Fedi, A., Ferrari, D., Lima, M., Pintus, F., Versace, C., and Boni, G.: The “ACRONET paradigm”, an “pen hardware” project, Open Water Journal, 2, 7, https://scholarsarchive.byu.edu/openwater/vol2/iss1/7, 2013. a
Ferrari, F., Maggioni, E., Perotto, A., Salerno, R., and Giudici, M.: Cascade sensitivity tests to model deep convective systems in complex orography with WRF, Atmos. Res., 295, 106964, https://doi.org/10.1016/j.atmosres.2023.106964, 2023. a
Fiori, E., Comellas, A., Molini, L., Rebora, N., Siccardi, F., Gochis, D. J., Tanelli, S., and Parodi, A.: Analysis and hindcast simulations of an extreme rainfall event in the Mediterranean area: The Genoa 2011 case, Atmos. Res., 138, 13–29, https://doi.org/10.1016/j.atmosres.2013.10.007, 2014. a, b
Gharesifard, M., Wehn, U., van der Zaag, P.: Towards benchmarking citizen observatories: Features and functioning of online amateur weather networks, J. Environ. Manage., 193, 381–393, https://doi.org/10.1016/j.jenvman.2017.02.003, 2017. a
Giazzi, M., Peressutti, G., Cerri, L., Fumi, M., Riva, I. F., Chini, A., Ferrari, G., Cioni, G., Franch, G., Tartari, G., Galbiati, F., Condemi, V., and Ceppi, A.: Meteonetwork: an open crowdsourced weather data system, Atmosphere, 13, 928, https://doi.org/10.3390/atmos13060928, 2022. a
Guerreiro, S. B., Fowler, H. J., Barbero, R., Westra, S., Lenderink, G., Blenkinsop, S., Lewis, E., and Li, X.: Detection of continental-scale intensification of hourly rainfall extremes, Nat. Clim. Change, 8, 803–807, https://doi.org/10.1038/s41558-018-0245-3, 2018. a
Gumbel, E. J.: The Return Period of Flood Flows, Ann. Math. Stat., 12, 163–190, 1941. a
Huang, J., Fatichi, S., Mascaro, G., Manoli, G., and Peleg, N.: Intensification of sub-daily rainfall extremes in a low-rise urban area, Urban Clim., 42, 101124, https://doi.org/10.1016/j.uclim.2022.101124, 2022. a
Jansa, A., Alpert, P., Arbogast, P., Buzzi, A., Ivancan-Picek, B., Kotroni, V., Llasat, M. C., Ramis, C., Richard, E., Romero, R., and Speranza, A.: MEDEX: a general overview, Nat. Hazards Earth Syst. Sci., 14, 1965–1984, https://doi.org/10.5194/nhess-14-1965-2014, 2014. a
Lanza, L. G. and Cauteruccio, A.: Accuracy assessment and intercomparison of precipitation measurement instruments, in: Precipitation Science – Measurement, Remote Sensing, Microphysics and Modeling, edited by: Michaelides, S., Elsevier, Amsterdam, the Netherlands, 3–35, https://doi.org/10.1016/B978-0-12-822973-6.00007-X, 2022. a
Li, D., Lettenmaier, D. P., Margulis, S. A., and Andreadis, K.: The role of rain-on-snow in flooding over the conterminous United States, Water Resour. Res., 55, 8492–8513, https://doi.org/10.1029/2019WR024950, 2019. a
Libertino, A., Ganora, D., Claps, P.: Evidence for increasing rainfall extremes remains elusive at large spatial scales: The case of Italy, Geophys. Res. Lett., 46, 7437–7446, https://doi.org/10.1029/2019GL083371, 2019. a, b
Lin, R., Zheng, F., Ma, Y., Duan, H., Chu, S., and Deng, Z.: Impact of spatial variation and uncertainty of rainfall intensity on urban flooding assessment, Water Resour. Manag., 36, 5655–5673, https://doi.org/10.1007/s11269-022-03325-8, 2022. a
Pagliara, P., Corina, A., Burastero, A., Campanella, P., Ferraris, L., Morando, M., Rebora, N., and Versace, C.: Dewetra, coping with emergencies, in: Proceedings of the 8th International ISCRAM Conference, Lisbon, Portugal, May 2011, 5 pp., https://www.idl.iscram.org/files/pagliara/2011/827_Pagliara_etal2011.pdf (last access: 17 July 2024), 2011.
Paliaga, G. and Parodi, A.: Geo-Hydrological Events and Temporal Trends in CAPE and TCWV over the Main Cities Facing the Mediterranean Sea in the Period 1979-2018, Atmosphere, 13, 89, https://doi.org/10.3390/atmos13010089, 2022.
Parodi, A., Ferraris, L., Gallus, W., Maugeri, M., Molini, L., Siccardi, F., and Boni, G.: Ensemble cloud-resolving modelling of a historic back-building mesoscale convective system over Liguria: the San Fruttuoso case of 1915, Clim. Past, 13, 455–472, https://doi.org/10.5194/cp-13-455-2017, 2017. a
Pelosi, A., Furcolo, P., Rossi, F., and Villani, P.: The characterization of extraordinary extreme events (EEEs) for the assessment of design rainfall depths with high return periods, Hydrol. Process., 34, 2543–2559, https://doi.org/10.1002/hyp.13747, 2020. a
Petracca, M., D'Adderio, L. P., Porcù, F., Vulpiani, G., Sebastianelli, S., Puca, S.: Validation of GPM dual-frequency precipitation radar (DPR) rainfall products over Italy, J. Hydrometeorol., 19, 907–925, https://doi.org/10.1175/JHM-D-17-0144.1, 2018. a
Pignone, F., Rebora, N., Silvestro, F., Castelli, F.: GRISO-rain, in: year-1 activity report, edited by: CIMA research foundation, Savona, Italy, 272, 353, 2010. a
Raymond, C., Horton, R. M., Zscheischler, J., Martius, O., AghaKouchak, A., Balch, J., Bowen, G. S., Camargo, S. J., Hess, J., Kornhuber, K., Oppenheimer, M., Ruane, A. C., Wahl, T., and Whiteet, K.: Understanding and managing connected extreme events, Nat. Clim. Change, 10, 611–621, https://doi.org/10.1038/s41558-020-0790-4, 2020. a
Rebora, N., Molini, L., Casella, E., Comellas, A., Fiori, E., Pignone, F., Siccardi, F., Silvestro, F., Tanelli, S., and Parodi, A.: Extreme rainfall in the Mediterranean: What can we learn from observations?, J. Hydrometeorol., 14, 906–922, https://doi.org/10.1175/JHM-D-12-083.1, 2013. a
Roy, S. S. and Rouault, M.: Spatial patterns of seasonal scale trends in extreme hourly precipitation in South Africa, Appl. Geogr., 39, 151–157, https://doi.org/10.1016/j.apgeog.2012.11.022, 2013. a
Sacchini, A., Ferraris, F., Faccini, F., and Firpo, M.: Environmental climatic maps of Liguria (Italy), J. Maps, 8, 199–207, https://doi.org/10.1080/17445647.2012.703901, 2012. a
Sauter, C., Fowler, H. J., Westra, S., Ali, H., Peleg, N., and White, C. J.: Compound extreme hourly rainfall preconditioned by heatwaves most likely in the mid-latitudes, Weather Clim. Extrem., 40, 100563, https://doi.org/10.1016/j.wace.2023.100563, 2023. a
Seneviratne, S. I., Nicholls, N., Easterling, D., Goodess, C., Kanae, S., Kossin, J., Luo, Y., Marengo, J., McInnes, K., Rahimi, M., Reichstein, M., Sorteberg, A., Vera, C., Zhang, X., Alexander, L. V., Allen, S., Benito, G., Cavazos, T., Clague, J., Conway, D., Della-Marta, P. M., Gerber, M., Gong, S., Goswami, B. N., Hemer, M., Huggel, C., van den Hurk, B., Kharin, V. V., Kitoh, A., Klein T., Albert, M. G., Li, G., Mason, S. J., McGuire, W., van Oldenborgh, G. J., Orlowsky, B., Smith, S., Thiaw, W., Velegrakis, A., Yiou, P., Zhang, T., Zhou, T., Zwiers, and Francis, W.: Changes in Climate Extremes and their Impacts on the Natural Physical Environment, in: Managing the Risks of Extreme Events and Disasters to Advance Climate Change Adaptation: Special Report of the Intergovernmental Panel on Climate Change, edited by: Field, C. B., Barros, V., Stocker, T. F., Dahe, Q., Cambridge University Press, 109–230, https://doi.org/10.7916/d8-6nbt-s431, 2012. a
Shen, Y. and Xiong, A.: Validation and comparison of a new gauge-based precipitation analysis over mainland China, Int. J. Climatol., 36, 252–265, https://doi.org/10.1002/joc.4341, 2016. a
Starkey, E., Parkin, G., Birkinshaw, S., Large, A., Quinn, P., and Gibson, C.: Demonstrating the value of community-based ('citizen science') observations for catchment modelling and characterisation, J. Hydrol., 548, 801–817, https://doi.org/10.1016/j.jhydrol.2017.03.019, 2017. a
Sun, Q., Zhang, X., Zwiers, F., Westra, S., and Alexander, L. V.: A Global, Continental, and Regional Analysis of Changes in Extreme Precipitation, J. Climate, 34, 243–258, https://doi.org/10.1175/JCLI-D-19-0892.1, 2021. a
Tipaldo, G. and Allamano, P.: Citizen science and community-based rain monitoring initiatives: an interdisciplinary approach across sociology and water science, WIREs Water, 4, e1200, https://doi.org/10.1002/wat2.1200, 2017. a
Vulpiani, G., Pagliara, P., Negri, M., Rossi, L., Gioia, A., Giordano, P., Alberoni, P., Cremonini, R., Ferraris, L., and Marzano, F. S.: The Italian radar network within the national early-warning system for multi-risks management, in: Proceedings of the 5th European Conference on Radar in Meteorology and Hydrology, ERAD, Vol. 184, 5 pp., 30 June–4 July 2008, Helsinki, Finland, 2008.
Xiao, C., Wu, P., Zhang, L., and Song, L.: Robust increase in extreme summer rainfall intensity during the past four decades observed in China, Sci. Rep.-UK, 6, 38506, https://doi.org/10.1038/srep38506, 2016. a