the Creative Commons Attribution 4.0 License.
the Creative Commons Attribution 4.0 License.
 | 30 May 2024
Multisectoral analysis of drought impacts and management responses to the 2008–2015 record drought in the Colorado Basin, Texas
Stephen B. Ferencz
Ning Sun
Sean W. D. Turner
Brian A. Smith
Jennie S. Rice
Drought has long posed an existential threat to society. Engineering and technological advancements have enabled the development of complex, interconnected water supply systems that buffer societies from the impacts of drought, enabling growth and prosperity. However, increasing water demand from population growth and economic development, combined with more extreme and prolonged droughts due to climate change, poses significant challenges for governments in the 21st century. Improved understanding of the cascading multisectoral impacts and adaptive responses resulting from extreme drought can aid in adaptive planning and highlight key processes in modeling drought impacts. The record drought spanning 2008 to 2015 in the Colorado Basin in the state of Texas, United States, serves as an outstanding illustration to assess multisectoral impacts and responses to severe, multi-year drought. The basin faces similar water security challenges to those across the western US, such as groundwater depletion and sustainability, resource competition between agriculture and growing urban populations, limited options for additional reservoir expansion, and the heightened risk of more severe and frequent droughts due to climate change. By analyzing rich, high-quality data sourced from nine different local, state, and federal sources, we demonstrate that characterizing regional multisector dynamics is crucial to predicting and understanding future vulnerability and possible approaches to reduce impacts to human and natural systems in the face of extreme drought conditions. This review reveals that, despite the severe hydrometeorological conditions of the drought, the region's advanced economy and existing water infrastructure effectively mitigated economic and societal impacts.
- Article
(5778 KB) - Full-text XML
-
Supplement
(978 KB) - BibTeX
- EndNote


Droughts threaten modern civilizations in a variety of ways (van Dijk et al., 2013; Wilhite et al., 2007). Prolonged dry spells cause depletion of terrestrial water resources, leading to water use restrictions and shortage (Lund et al., 2018), reduced crop yields and loss of pasture (Gupta et al., 2020; Kuwayama et al., 2019), impaired electricity generation from hydroelectric and thermoelectric facilities (van Vliet et al., 2016; Voisin et al., 2020), degradation of water quality (Ahmadi and Moradkhani, 2019), forest loss through tree mortality (Brodribb et al., 2020) and forest fire (Littell et al., 2016), and reduced primary productivity of vegetation (Stocker et al., 2019; Xu et al., 2019). These impacts spawn a myriad of second-order effects. For instance, loss of water-dependent electricity generation can reduce the reliability of the power grid (Turner et al., 2021) or shift generation onto resources that cost more to run or emit more carbon (O'Connell et al., 2019). In some cases, the impacts of a local drought can carry national or global implications, such as by increasing crop prices and altering global food trade networks (Lal et al., 2012; Marston and Konar, 2017).
The need to understand possible impacts from drought is underscored by anticipated intensification of drought in some world regions in the 21st century due to climate change (Cayan et al., 2010; Cook et al., 2018; Trenberth et al., 2014), manifesting large reductions in surface water availability over large portions of the globe (Schewe et al., 2014). In some regions, climate change has already increased the joint probability of hot and dry conditions that produce more severe drought impacts (Sarhadi et al., 2018).
There is no single quantitative definition of drought (Kuwayama et al., 2019). Drought can be defined by many metrics of water deficit, such as reduced precipitation (meteorological drought) often combined with increased potential evapotranspiration and soil moisture deficit affecting vegetation (soil moisture drought or agricultural drought) and reduced surface water flows, lake levels, and groundwater levels (hydrological drought) leading to streamflow drought and reduced reservoir storage (i.e., reservoir drought) (Van Loon, 2015). Reservoir drought has not been widely studied in the literature (Shah et al., 2024). Shah et al. (2024) define reservoir-based hydrological drought (i.e., reservoir drought) as a period when reservoir storage has persistent negative anomalies due to diminished inflow (streamflow drought), increased net evaporation (meteorological drought), and/or water resource management decisions (i.e., storage releases). Because of the importance of reservoirs to water supply resilience (Kuria and Vogel, 2014), irrigation for food production (Biemans et al., 2011), hydropower, and streamflow (Wanders et al., 2015), reservoir droughts can have significant socioeconomic, energy, and environmental implications. The intensity and duration of meteorological drought influences the severity of other types of droughts; for example, a short, intense meteorological drought can result in a severe agricultural drought but not a severe hydrological drought. The impacts of meteorological drought can also be exacerbated by human actions (Van Loon et al., 2016), such as increased diversions from streams resulting in more severe hydrological drought (reduced streamflow) or withdrawals from reservoirs initiating or exacerbating reservoir drought.
Because extreme drought is rare (by definition), there are a limited number of 21st century case studies available to document and synthesize its impacts. Examining each case is essential to better understand the complex dynamics of drought propagation, the resulting multisector impacts and responses to drought in modern society, and critical lessons learned to better prepare for future droughts. The aim of this paper is to provide such a case study through a detailed examination of the 2008–2015 drought in the Colorado Basin, Texas. This region (Fig. 1a) faces significant municipal–agricultural–energy–water nexus challenges and offers a compelling case study for multisectoral drought impact analysis. The paper is organized into the following sections: background on the drought of record, e.g., the basin's hydroclimate, water supply, and sectoral water use (Sect. 1.1 and 1.2); data and methods (Sect. 2); analysis of multisectoral impacts and adaptive management responses from the drought of record (Sect. 3.1–3.3); a discussion of insights into multisector impacts and dynamics, water planning strategies that improve the resiliency and sustainability of regional supply, limitations, and future work (Sect. 4); and concluding remarks (Sect. 5).
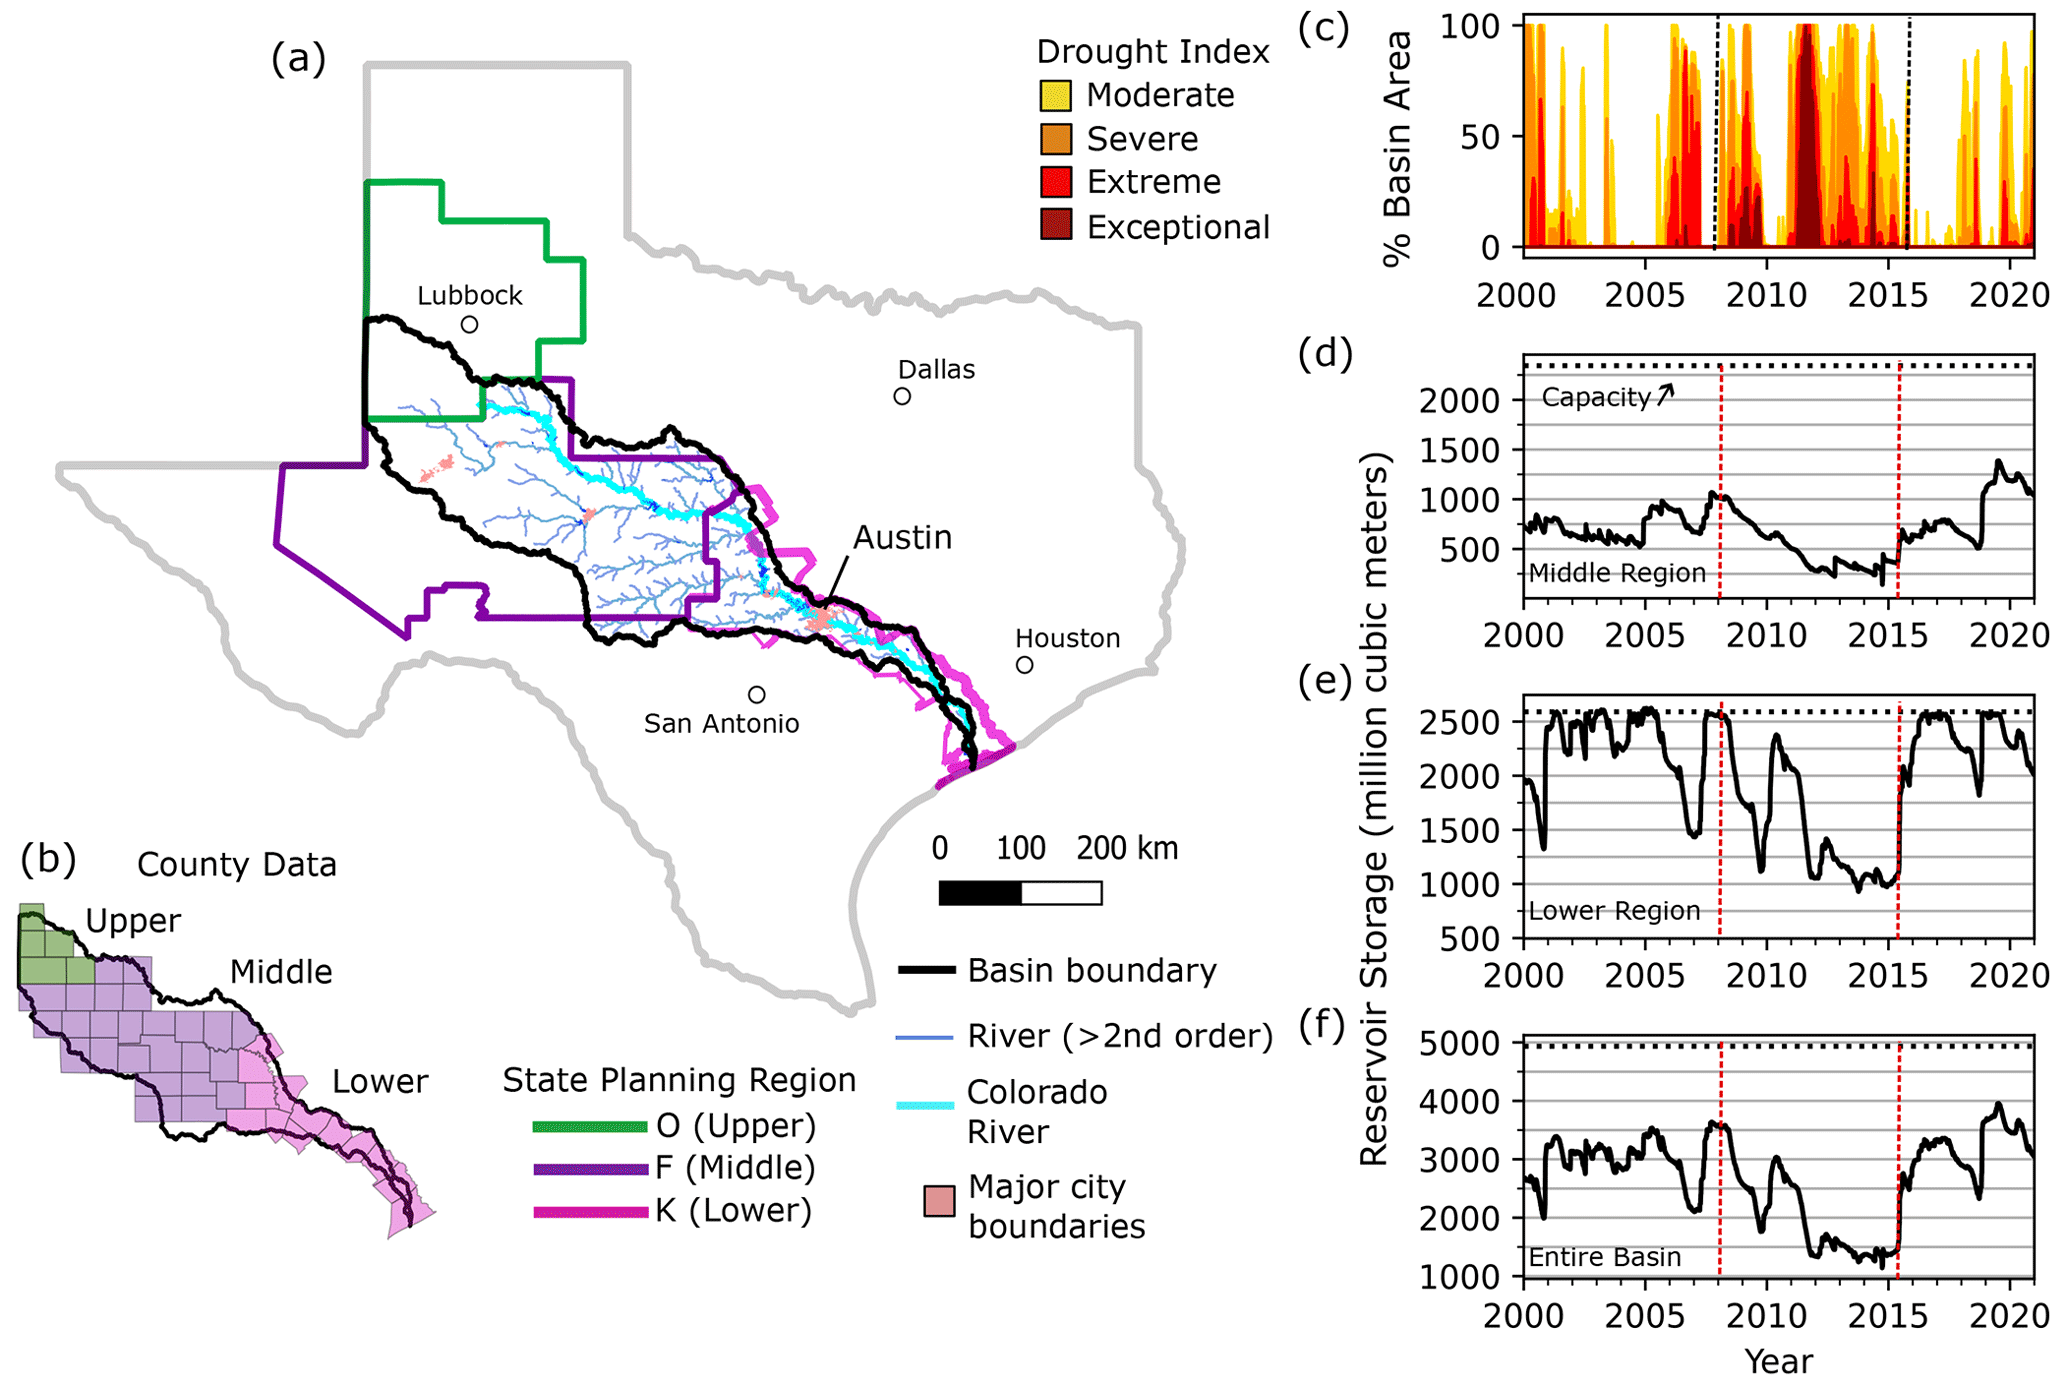
Figure 1The Colorado Basin (a). The basin spans three state water planning regions: Region O (upper), Region F (middle), and Region K (lower). All regional data presented are based on data from counties within the basin footprint (b). U.S. Drought Monitor drought index showing the area of the basin under drought from 2000 to 2020 (c). Reservoir storage for the middle region (d), lower region (e), and total basin (f) in 106 m3.
1.1 Basin geography and sectoral water use
The Colorado Basin spans 800 km across the central part of Texas and has a drainage area of 102 000 km2 (Fig. 1a). Its headwaters are in the arid northwestern part of the state, and surface water flows southeast towards the Gulf of Mexico. The basin is divided into three water management regions (Fig. 1a), marked by diverse hydroclimates and distinct differences in water use, reliance on surface water versus groundwater, and sectoral water demand (Table 1). Here, water use refers to total withdrawals, not consumptive use.
Table 1Summary of regional average annual water use, population, and reservoir storage from 2000–2007. Volumes are in 106 m3. For each region, the percentage of the basin total water use is shown in parentheses – for example, the middle region uses 16.7 % of the groundwater (GW) and upper-region agricultural use is 54 % of the basin total. The percentages of each column sum to 100. Total volumetric water use for the basin is summed in the last row. SW signifies surface water, and n/a signifies not applicable.
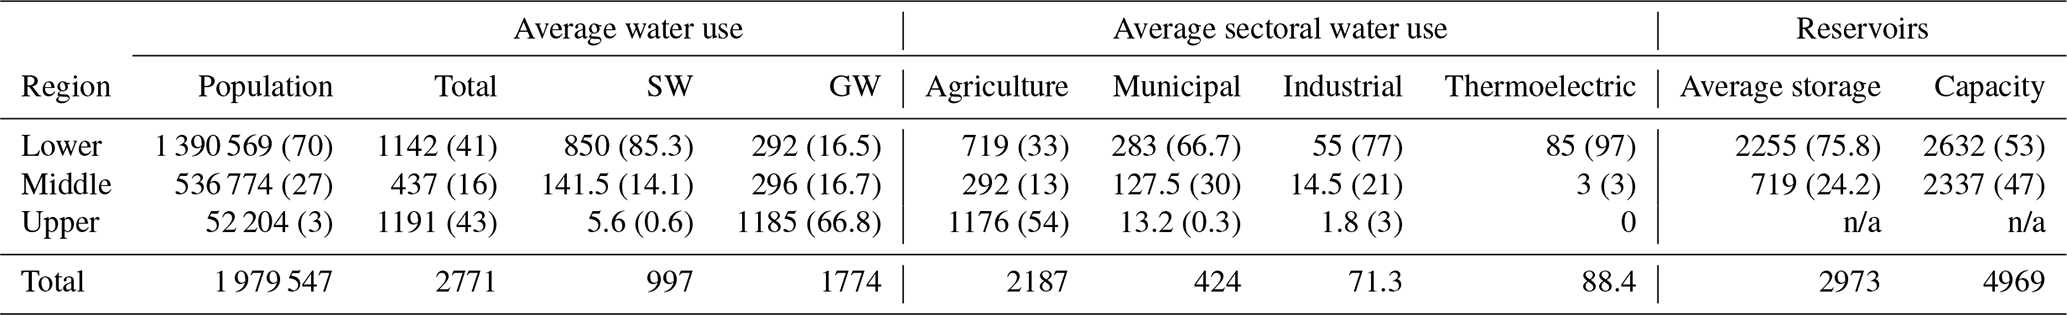
The basin's hydrology is characterized by highly variable seasonal streamflow prone to multi-year drought periods (Wurbs, 2021). There is a markedly increasing precipitation gradient from the western upper region (38–45 cm yr−1) to the eastern lower region (68–112 cm yr−1) (TWDB, 2023a), which greatly influences surface water availability and the ratio of surface water to groundwater use across the basin (Table 1). The sparsely populated, arid upper region has few reliable sources of surface water, has no major reservoirs, and is almost entirely dependent on groundwater sourced from the Southern High Plains Aquifer to supply its large agricultural sector (Table 1). In contrast, the highly populated lower region receives more than two-thirds of its annual supply from surface water. Lower-region reservoirs are the critical supply for the city of Austin's municipal demands and for providing reliable water supply for thermoelectric power and lower-region agriculture. The middle region is heavily reliant on groundwater for agriculture but uses surface water to meet 60 %–70 % of its municipal demand. Overall, the middle region uses less than 20 % of the surface water of the lower region.
Water use and population are also highly unequally distributed amongst the three management regions (Table 1). The sparsely populated, heavily agricultural upper region and densely populated lower region both use more than twice the water of the middle region. Before the drought (2000–2007), the agriculture sector was the largest water user in all three regions, accounting for 99 % of all water use in the upper region and between 50 % and 70 % in the middle and lower regions. Municipal use was the second largest sector, representing 25 %–30 % of annual water use in both the lower and middle regions. Industrial and thermoelectric use was less significant in all three regions, accounting for 3 %–7 % of annual use.
1.2 The 2008–2015 drought of record
The 2008–2015 drought is recognized as the drought of record for the middle and lower planning regions in the basin (TWDB, 2022a). Texas uses the “drought of record” framework for water planning where future water supply is determined based on shortages that would occur under a repeat of the drought of record event. The 2008–2015 drought period is characterized by a combination of reservoir and meteorological drought, spanning the time between lower-basin reservoir storage resetting (Fig. 1e) and the end of widespread drought conditions (Fig. 1c). The drought consisted of two dry periods (2008–2009 and late 2010–2015) separated by a relatively wet year in 2010 (Fig. 1c). The drought severity shown in Fig. 1c is the US Drought Monitor drought classification index, which is a composite index that incorporates meteorological drought, soil moisture conditions, and surface water impacts (US Drought Monitor, 2023). Before 2008–2015, the region's most severe drought on record took place in the 1950s (TWDB, 2022a). The greater severity and distinctive impacts of the 2008–2015 drought can be attributed to five key factors, including a combination of climate (natural) and human system factors.
-
Rapid onset of extreme drought. A statewide record low Palmer drought severity index (PDSI) (Palmer, 1965) of −8.06 occurred just 14 months into the 2011–2015 period, whereas the drought of the 1950s took 72 months to reach a PDSI of −7.77 (TWDB, 2017). The PDSI accounts for precipitation, evapotranspiration, and soil moisture conditions and is standardized to enable comparison between regions (Alley, 1984).
-
Meteorological conditions. The 2008–2015 drought featured record meteorological drought combined with prolonged heat waves in 2009 and 2011. Notably, in 2011, the mean temperature during the summer months of June, July, and August reached a record high, about 1.4 °C higher than the previous hottest summer on record (Nielsen-Gammon, 2012).
-
Persistent reservoir drought. Record low reservoir storage persisted in the basin from 2012–2015.
-
Population growth. The basin's population is 3 times larger, with 80 % of the population increase occurring in the heavily surface-water-reliant lower region, leading to increased population exposure to drought and sectoral competition for surface water.
-
Economic transformation. In the 1950s, the basin was a largely agrarian economy, in contrast with the predominantly urban, industrialized economy in the 21st century (TWDB, 2022b). While population growth has increased the population exposed to drought conditions, the diversification of the regional economy has reduced the basin's economic vulnerability to drought because many of the sectors are not highly water-dependent – representing a shift from a climate sensitive to climate insensitive economy (Tubi, 2020). This is discussed further in Sect. 3.
The extensive review and analysis of grey literature related to drought impacts and management responses are novel aspects of this study. We obtained data from a diverse array of publicly available sources to understand and characterize the breadth of multisectoral impacts and management responses in the basin (Table 2). Table 2 provides a description of each data type, citing the temporal and spatial resolutions and the period of record, and links to all dataset sources are in the references.
Table 2Data sources for multisector impacts and water management response characterization. * Regional water plans include 2010, 2015, and 2020 regional plans for each of the planning regions (Region K, 2010, 2015, 2020; Region F, 2010, 2015, 2020; Region O, 2010, 2015, 2020).
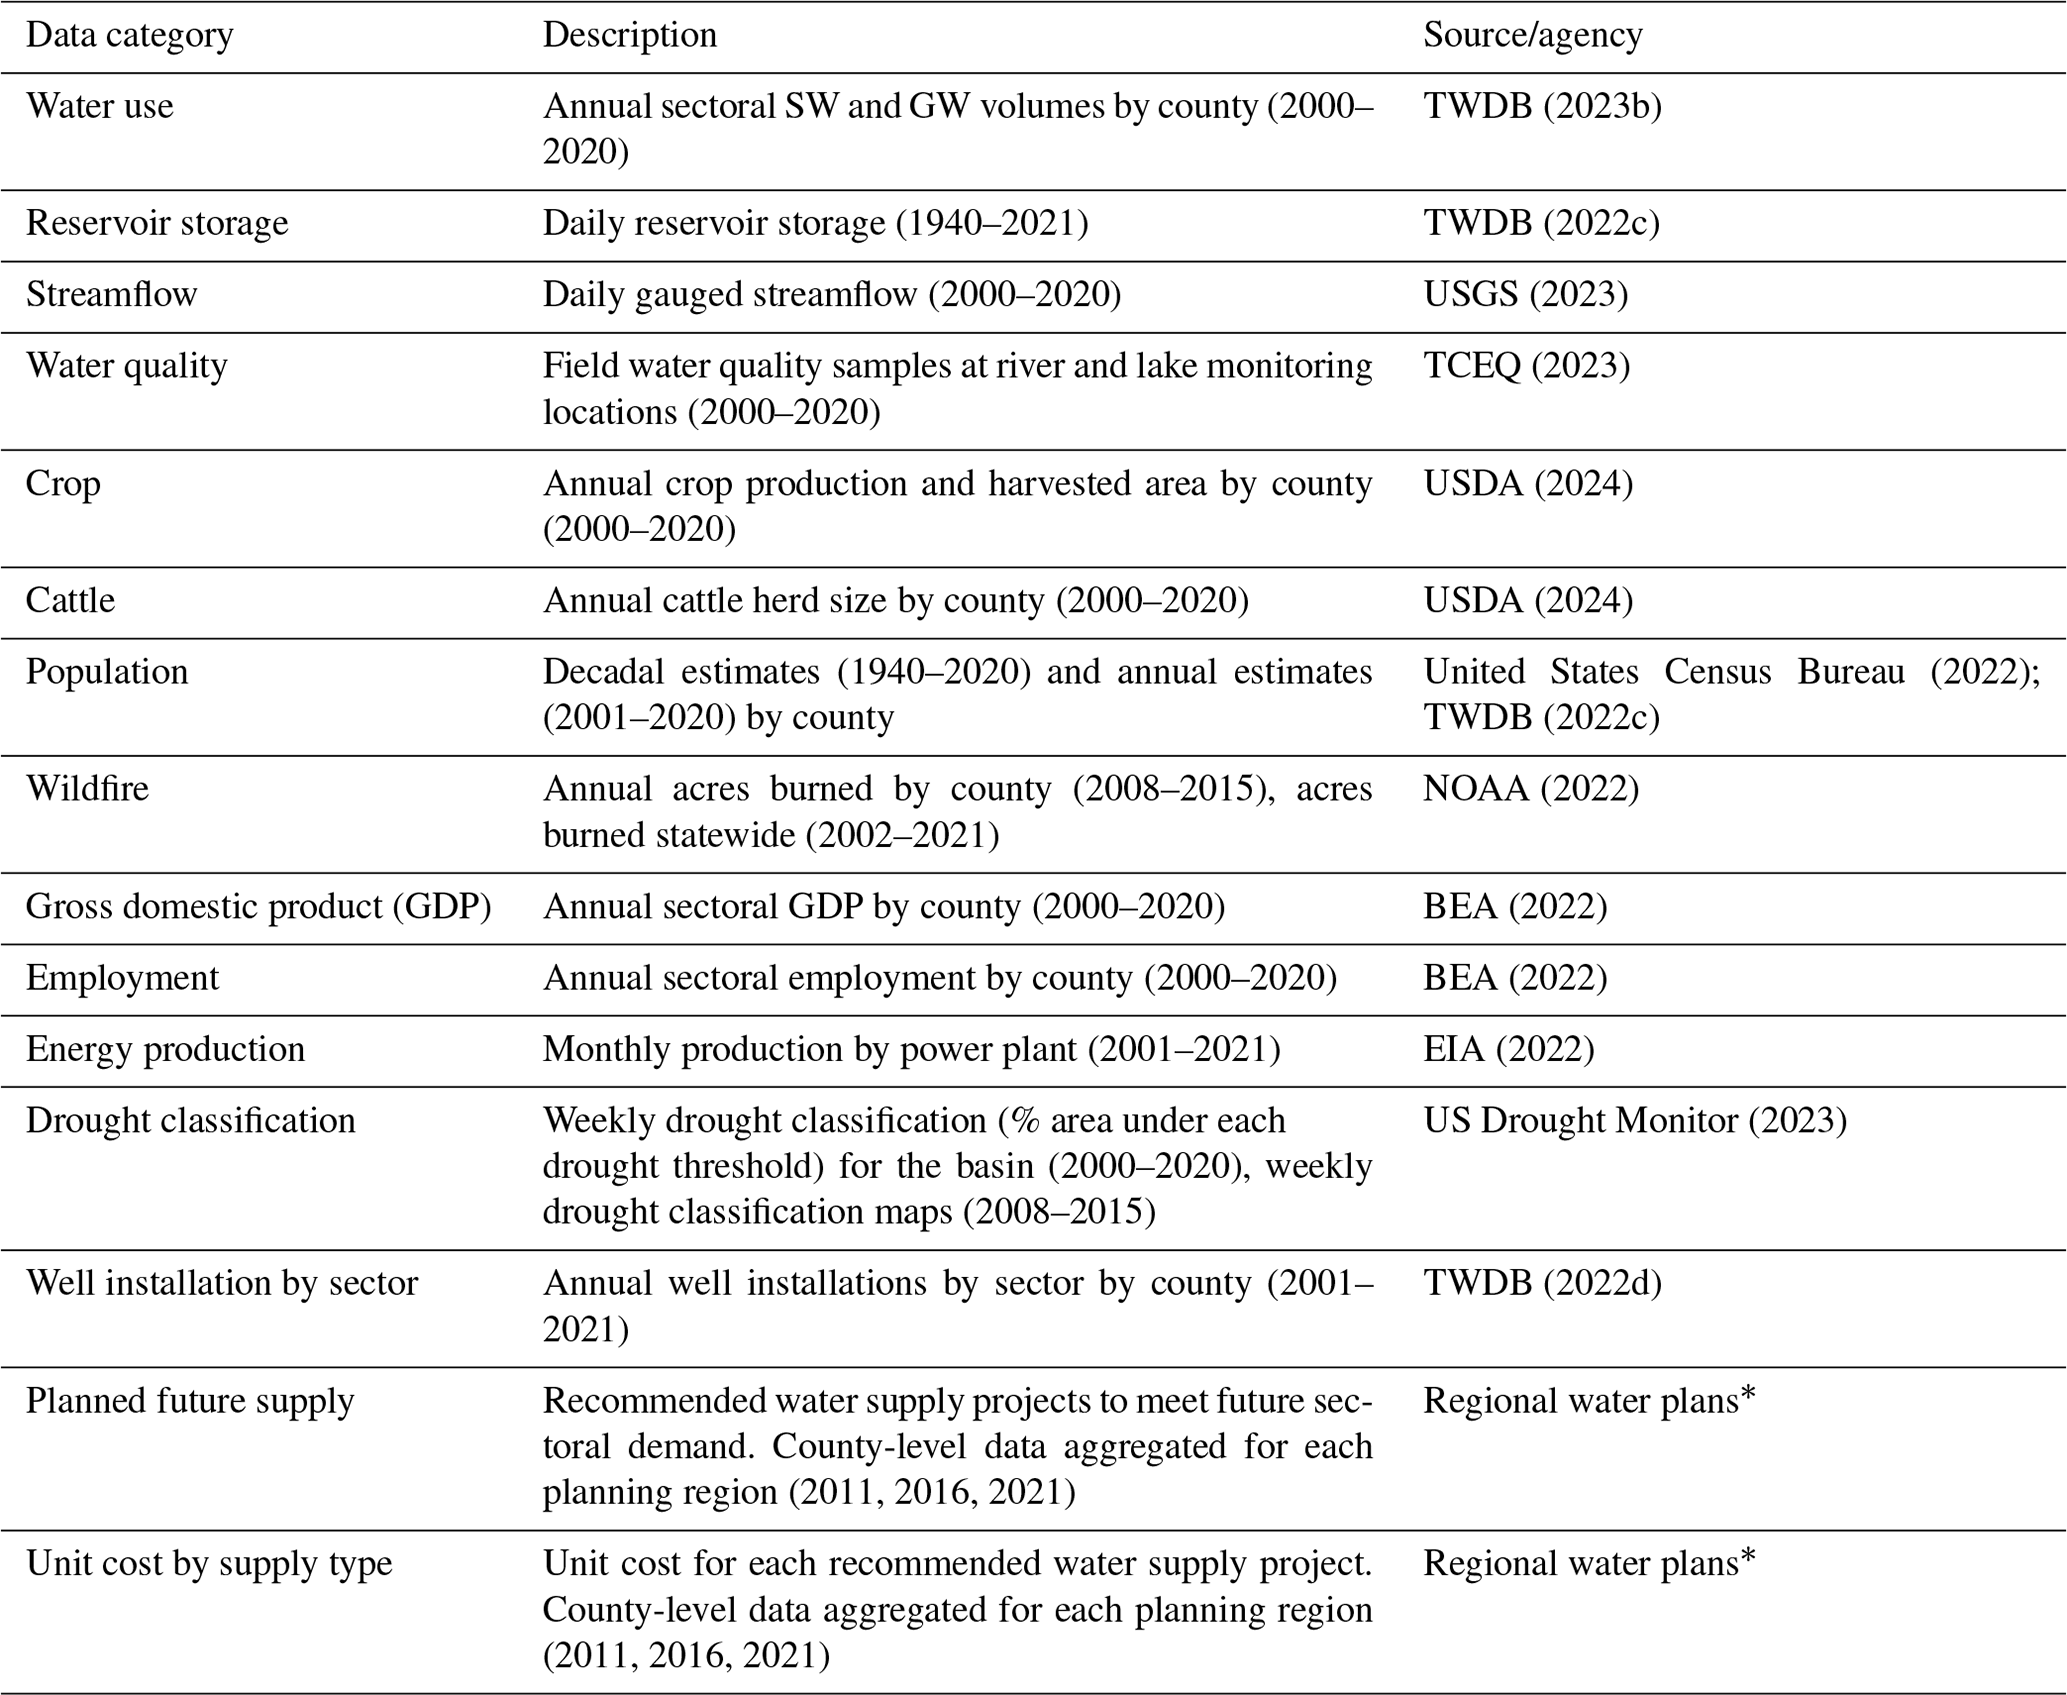
Much of the data were available at annual temporal resolution at the county spatial scale. For these cases, we primarily aggregated the county-level data to determine annual statistics related to drought impact for each of the three regions in the basin. The only exceptions are streamflow and reservoir storage, which are continuous daily data, and water quality, which is only available during reported sampling times. In some cases, the data categories contained an overabundance of records. For example, there were hundreds or thousands of locations with hydrological time series data (streamflow, water quality) and numerous metrics associated with annual, county-level gross domestic product (GDP), employment, and crop data. For these cases, the literature and planning documents helped guide the selection of metrics and locations for analysis. We used the data sources in Table 2 to assess impacts on sectoral water use, reservoir storage, agriculture production, land cover and the environment, the economy, and energy production. The topical focus areas for drought impacts were informed by peer-reviewed literature and regional water planning documents. Costs for sectoral and regional GDP were converted to 2022 dollars using consumer price index data.
To understand the substantive ways that the drought shaped water planning in the basin, we conducted a comprehensive review and analysis of data in regional water management plans from 2011, 2016, and 2021 for each of the three regions in the basin. Regional water plans in Texas are issued on a 5-year planning cycle and have been mandated by state law since 1997 in response to severe drought conditions in 1995 and 1996 (Wurbs, 2015). An advantage of the relatively short 5-year planning cycle is the ability to respond to recent changes in water availability and sectoral demand. Future shortages are calculated based on the difference between projected future demands (based on estimated sectoral growth) and available supply under drought of record conditions. The 2011 plans were developed before the most severe and prolonged impacts, the 2016 plans were influenced by the record drought in 2011 and persistent drought conditions, and the 2021 plans were created with the full understanding of the drought of record. Our analysis of planning and management responses was additionally supported by publicly available reports from utilities and municipalities in the basin and was also informed by interviews with subject matter experts who have experience in city-, regional-, state-, and utility-scale water planning and management. We quantify water management and planning responses by aggregating county-level data from the regional plants on planned water supply projects. The planned supply data included information about the supply type (e.g., new groundwater wells, reuse, desalination), the unit cost of each supply project for which there were over 1186 individual projects (USD per m3), supply volume, and sector supplied by each proposed project. Water supply costs were converted to 2022 values using the annual consumer price index.
The last section of results (Sect. 3.3) presents a synthesis of our analysis of the multisector impacts during the 2008–2015 drought of record in the form of a directed acyclic graph (DAG). A DAG, also known as an influence diagram, is a compact way to present complex causal relationships pictorially; it can also be implemented mathematically to model causal inferences (not performed for this study) (Howard and Matheson, 2005; Shachter, 1986). The influence diagram in Sect. 3.3 is a novel product of this study and is based on the review of thousands of pages of regional water planning documents, over a hundred academic papers and reports, and the analysis of 15 datasets (Table 1). As a preview to the detailed influence diagram in Sect. 3.3, Fig. 2 presents a high-level DAG showing the relationship between drought dynamics, impacts, and planning and management responses. In an influence diagram, each oval represents a state variable, each rectangle represents a decision, and each arrow shows the direction of influence. Figure 2 shows the following relationships. Meteorological drought can lead to soil moisture drought (not shown here but also influenced by evapotranspiration). Together, these two types of droughts lead to streamflow drought (less surface runoff due to decreased precipitation and decreased soil moisture) that in turn can lead to reservoir drought. Reservoir drought can also be exacerbated by soil moisture drought if increased irrigation demand (municipal or agricultural) is accommodated by reservoir storage. Thus, reservoir drought can be produced by both decreased surface water inflows and increased water demand during drought conditions. The combined effects of soil moisture, streamflow, and reservoir droughts cause a wide variety of human and natural system impacts (Sect. 3.1) and planning and management responses (Sect. 3.2).
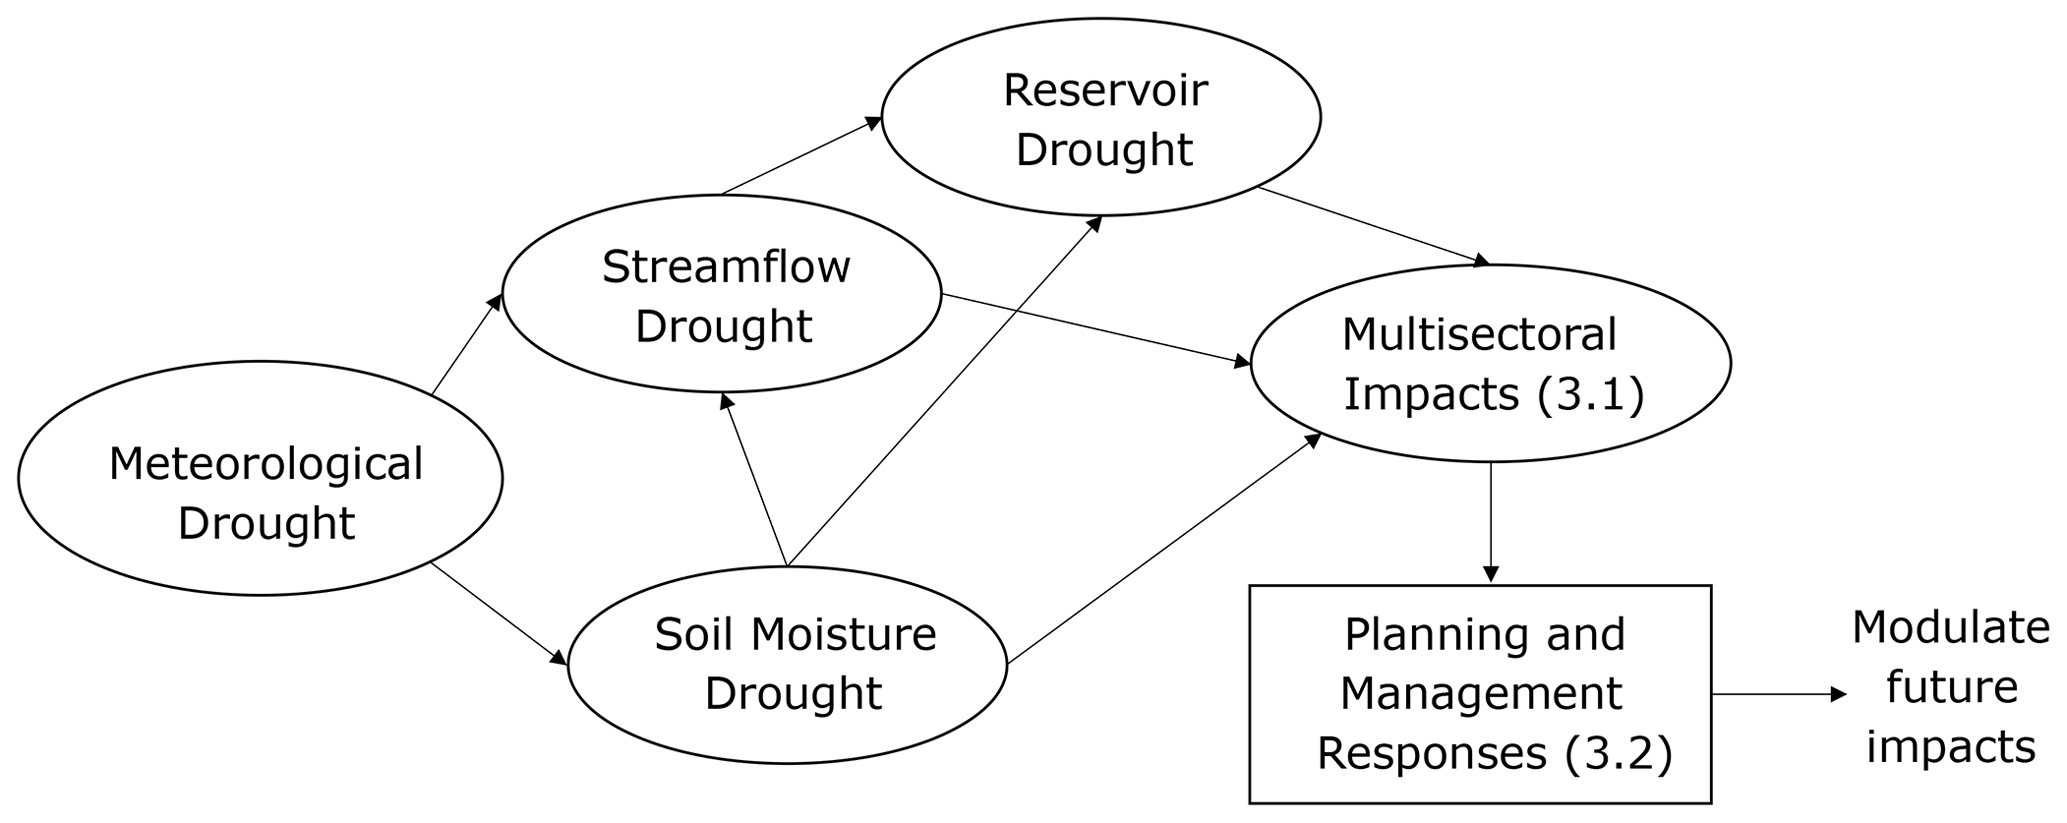
Figure 2High-level influence diagram showing the relationships between types of droughts, multisectoral impacts, and adaptation responses.
We first present analysis of multisectoral impacts during the 2008–2015 drought of record (Sect. 3.1), followed by changes to water planning, policy, and management during and following the drought of record (Sect. 3.2), and conclude with an influence diagram summarizing multisectoral impacts and interactions based on our analysis (Sect. 3.3).
3.1 Multisectoral impacts
This section covers multisectoral impacts during the 2008–2015 drought. Available data are presented before and after the drought to provide context on how sectoral impacts compared to the pre-drought and post-drought period. The following subsections are covered: multisectoral water use of surface water and groundwater (Sect. 3.1.1), reservoir drought in the middle and lower regions (Sect. 3.1.2), impacts to agricultural production (Sect. 3.1.3), environmental impacts (Sect. 3.1.4) (wildfire, drought-driven tree mortality, streamflow, surface water quality, and environmental flows), economic impacts (Sect. 3.1.5), and impacts to energy production (Sect. 3.1.6).
3.1.1 Multisectoral water use
The onset of the drought in 2008 marked the highest amount of water use in the middle and upper regions (from increased groundwater use), while 2011 was the largest annual water use in the lower region (from both increased surface water and groundwater use) (Fig. 3). Notable regional differences in year-to-year variability in water use during the drought were driven primarily by agriculture (Fig. 3), while municipal use (second largest sector) showed comparatively little absolute (volumetric) fluctuation when compared to total water use within each region (Fig. 3). Surface water use declined in the middle and lower regions as the drought progressed, reflecting reservoir conservation measures and temporary drought management measures enacted by municipal water providers (Fig. S1). During the last 3 years of the drought (2013–2015), surface water use in the lower region was 40 % less than that from 2008–2010, while surface water use decreased by 19 % in the middle region. In contrast, average groundwater use in the middle and lower regions showed less change during the drought. The declining trend in groundwater use in the upper region that started during the drought does not have an obvious explanation because it does not reflect a comparatively large reduction in irrigated acres for major crops. One plausible explanation would be adoption of more efficient irrigation technology, but we do not have data to support that hypothesis.
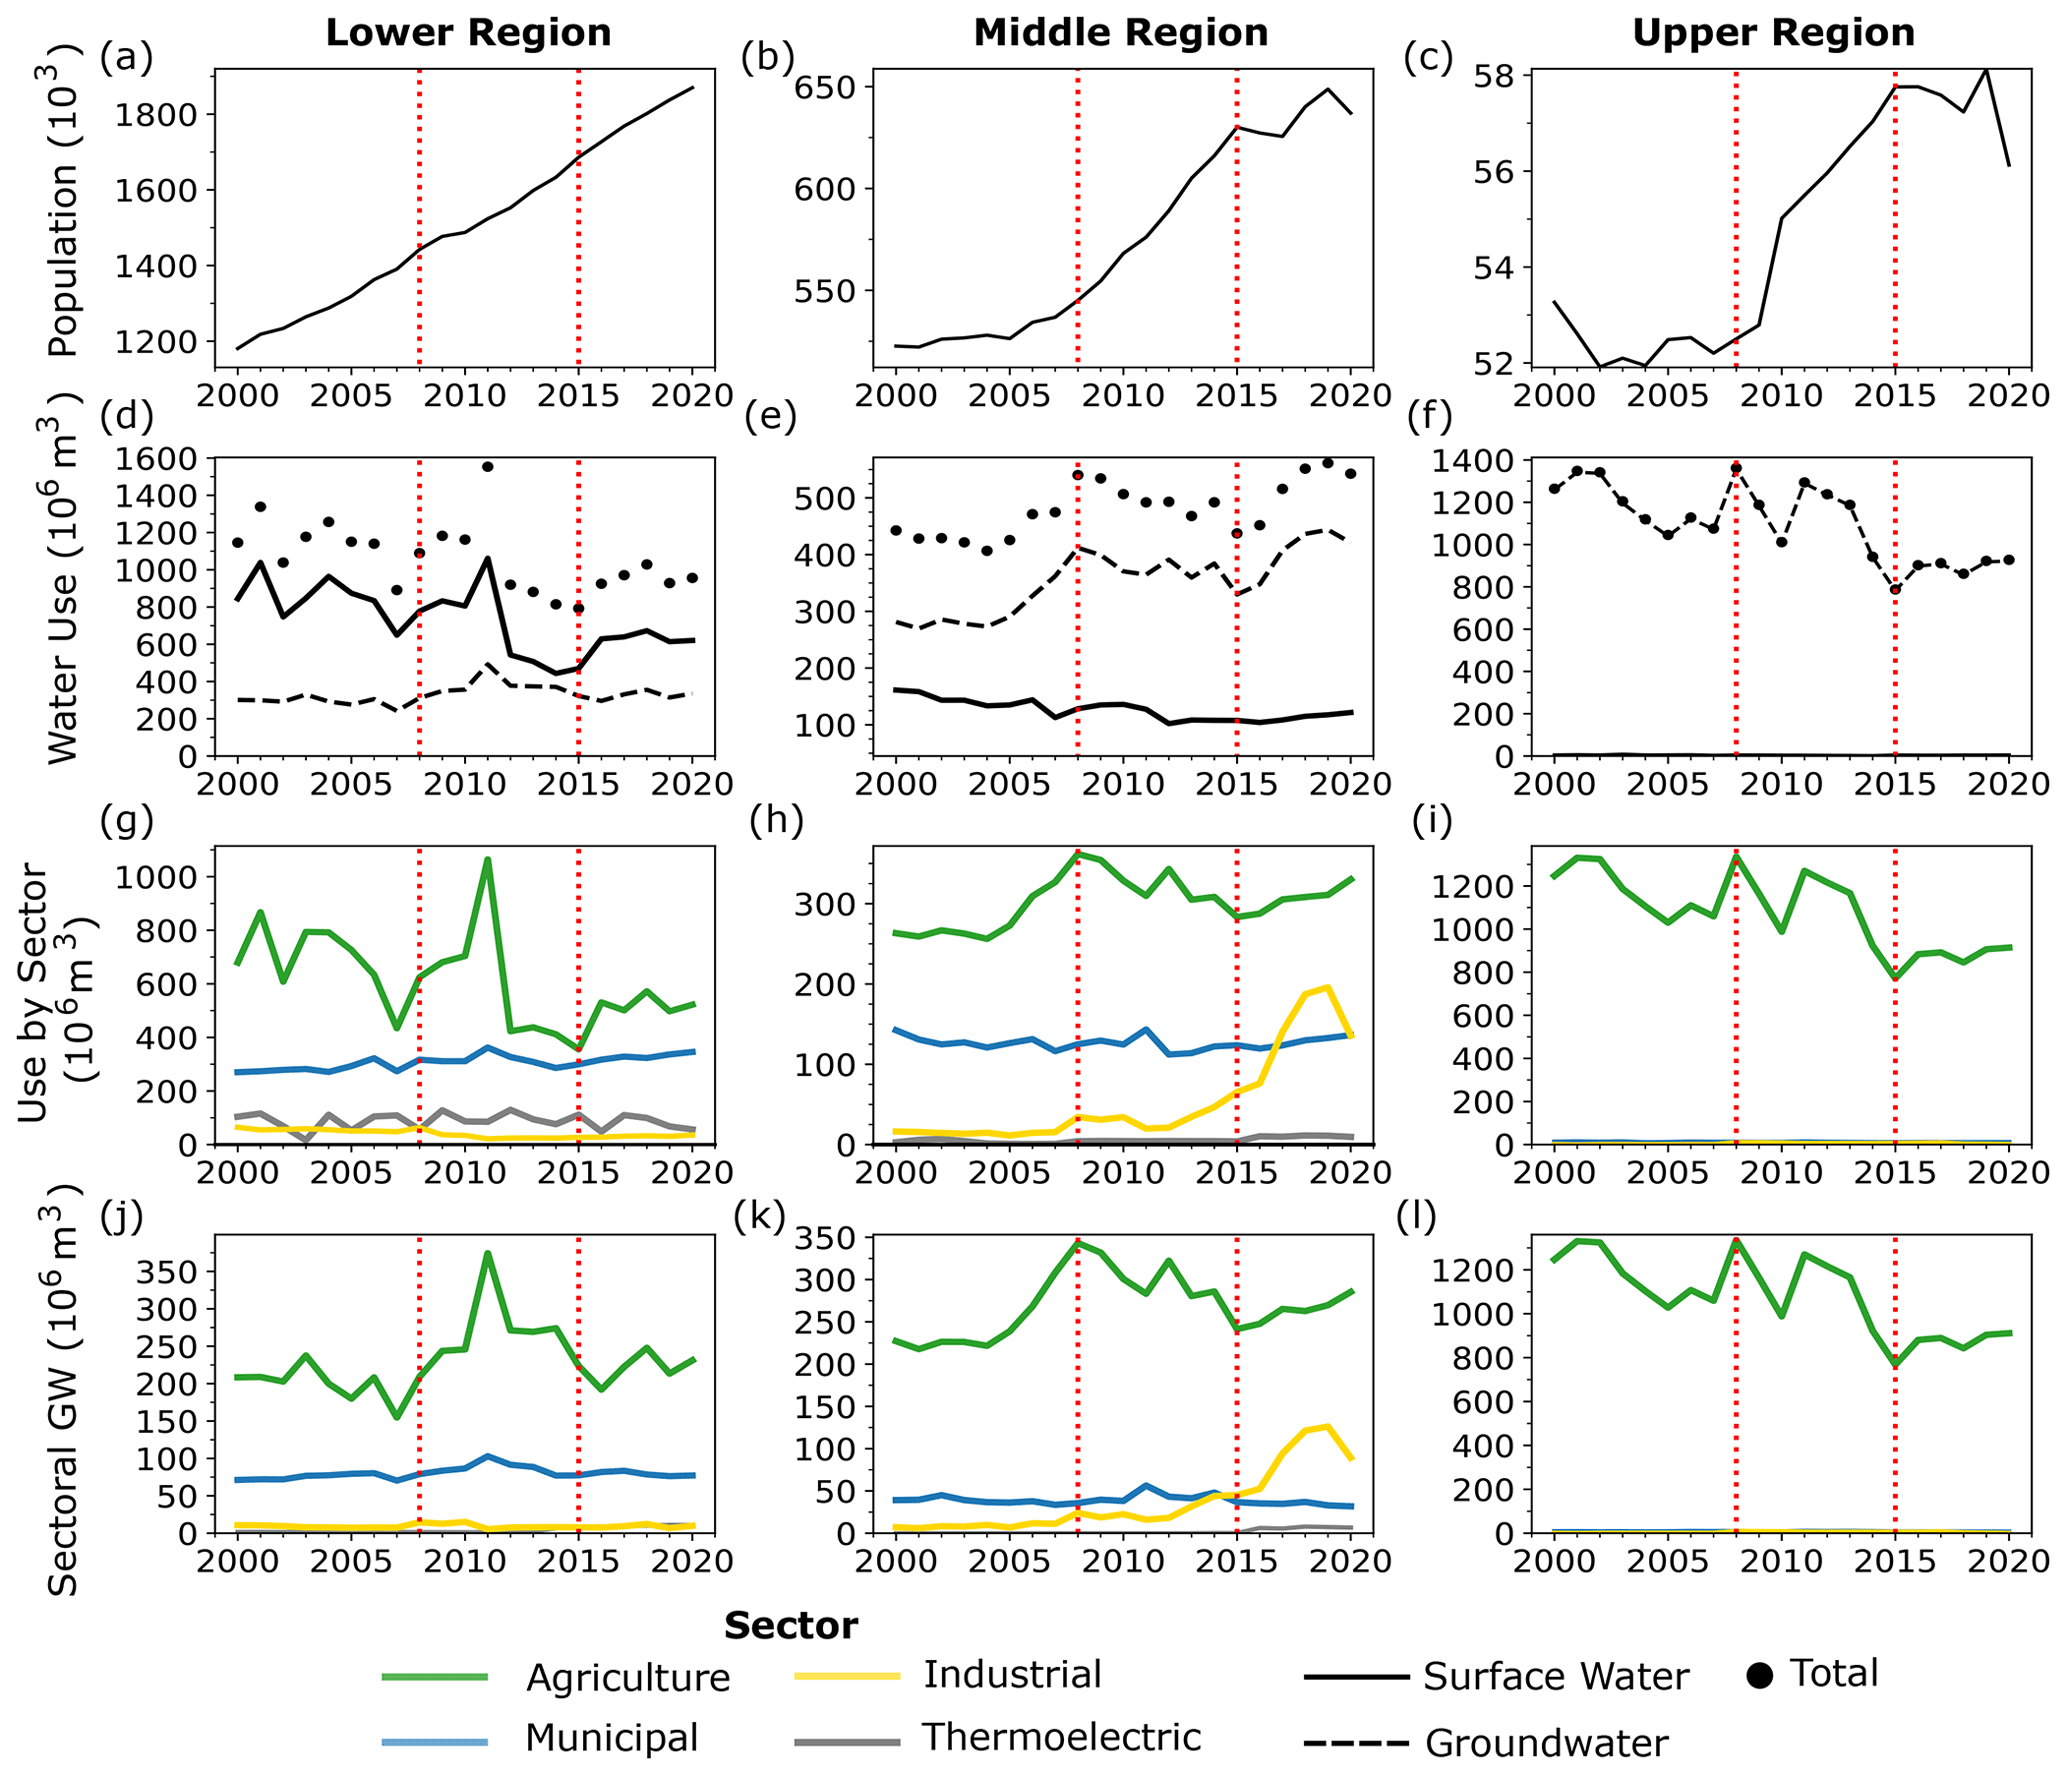
Figure 3Population growth (a–c), annual surface water (SW) and groundwater (GW) use (d–f), total sectoral use (SW + GW) (g–i), and sectoral GW use (j–l) from 2000–2020 in the three planning regions. These data only include counties shown in Fig. 1b.
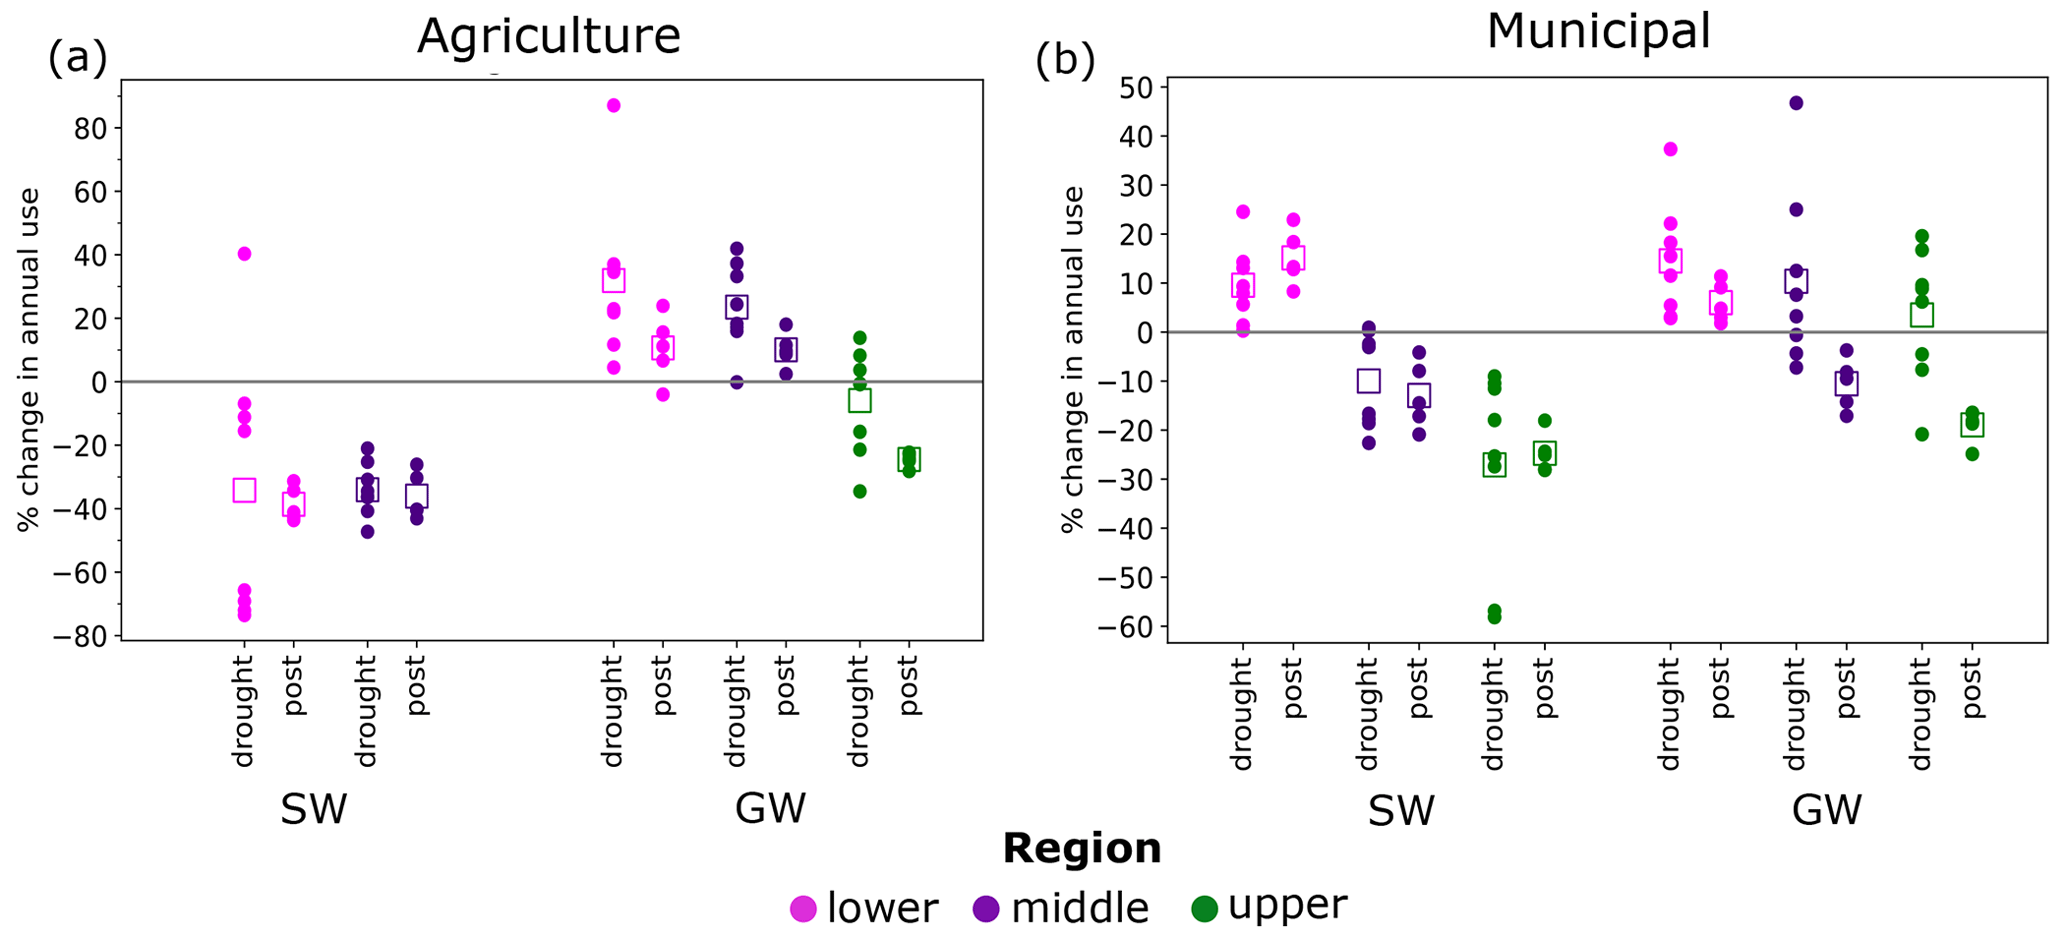
Figure 4Change in agricultural (a) and municipal (b) surface water (SW) and groundwater (GW) use during the drought (2008–2015) and post-drought (2016–2020) periods compared to the pre-drought 2000–2007 period. Annual values are circles, and period means are open squares. No SW is reported for agriculture in the upper region, and it is therefore omitted from (a).
Comparing annual agricultural water use during and following the drought revealed significant shifts in surface water and groundwater use for the two largest sectors in the basin (Fig. 4). Compared to the pre-drought period (2000–2007), agricultural surface water use during the drought declined by an average of 36 % in the lower region and 38 % in the middle region, and these reductions persisted over the 2016–2020 post-drought period (Fig. 4a). Following reservoir conservation measures in 2012, lower-basin agricultural surface water use was 65 %–77 % less than during the pre-drought period. A consequence of reduced agricultural surface water availability in the lower region was an increase in groundwater use (Fig. 4a) and well installations (Fig. S2) during the drought and post-drought periods. Average agricultural groundwater use in the lower region was 33 % higher compared to the pre-drought period, with a peak increase of 84 % in 2011, while in the middle region average use was 21 % higher during the drought and 42 % higher in 2008. Only upper-region groundwater use declined in the post-drought period compared to the pre-drought period. In all three regions, post-drought agricultural groundwater use declined compared to the drought period (Fig. 4a). The post-drought decline in agricultural groundwater use across the basin could be due to a combination of reduced irrigation demand due to the cessation of meteorological drought and more efficient irrigation technology and/or practices, and in the middle and lower regions it could also be influenced by a preference for lower-cost surface water when available.
Increased municipal surface water use in the lower region during and following the drought (Fig. 4b) is reflective of the large population growth in the region, which grew by over 450 000 residents between 2008 and 2020 (Fig. 3a). In contrast, municipal surface water use in the middle region was on average 11 % lower during the drought and 15 % lower following the drought (Fig. 4b). Municipal surface water use in the upper region, while small in magnitude (Fig. 3g), showed even larger declines than the middle region (Fig. 4b). A consistent pattern in municipal groundwater use shared by all three regions was increased use during the drought followed by reduced use after the drought. This suggests a temporary shift towards groundwater to compensate for reduced surface water supply during the drought. The reduction in groundwater use following the drought may reflect the successful long-term demand management efforts implemented in response to the drought (Sect. 3.2) and also a preference to use lower-cost surface water when available. Only in the lower-region did municipal groundwater use in the post-drought period remain higher than during the pre-drought period, likely related in some degree to accommodating the large population increase from 2008–2020.
Thermoelectric water use in the basin increased by an average of 12.4 % during the drought compared to the pre-drought period, and two of the highest-use years occurred during the drought (2009 and 2012). Although not visually apparent in Fig. 3j due to its relatively small magnitude compared to other sectoral water uses, there was a 540 % increase in groundwater use for thermoelectric water supply in the lower region following the drought (1.58×10⁶ m3 yr−1 from 2008–2013 growing to 10.17×10⁶ m3 yr−1 from 2015–2020). This suggests a transition towards a more drought-resilient supply as groundwater is less sensitive to reduced surface flows. A notable multisectoral use trend unique to the middle region was a remarkable 150 % increase in industrial water use from 2008 to 2020 (Fig. 3h). This growth was almost entirely associated with unconventional (fracking) oil and gas development (Region F, 2020), which often uses non-potable sources and was not influenced by drought – it is thus not considered a drought impact.
3.1.2 Reservoir drought
In 2008, at the onset of the meteorological drought, middle-region reservoirs were less than 50 % full and were already in the midst of a long-term reservoir drought (Fig. 1d). In contrast, lower-region reservoirs were completely filled at the onset of the drought (Fig. 1e). However, because of much lower agricultural surface water use (less than 1/10 of the lower region), the middle region is not susceptible to large interannual declines in storage from supplying large quantities to irrigators (Fig. 1d). Additionally, surface water use from other sectors in the middle region was much smaller than the lower region (Fig. 3e, h, k). In fact, the total surface water use in the middle region during 2000–2007 was 47 % less than municipal use alone in the lower region. In contrast to the gradual storage declines in the middle region during the drought (Fig. 1d), in both 2008–2009 and 2011, there were sharp declines in lower-region reservoir storage with over 40 % drops in total storage during each 1- or 2-year period (Fig. 1e). Reservoir releases for surface water irrigation were the largest driver of large annual storage declines in the lower region, but significant municipal demand also contributed to storage declines during the most severe meteorological drought years.
Middle- and lower-region reservoirs experienced sustained record low storage during the second half of the drought (2012–2015). During this period, storage levels in the lower region fluctuated between 40 %–50 % capacity and in the middle region between 10 %–20 %. A specific feature of the 2011 to 2015 period that caused severe reservoir drought to persist in the lower region was the absence of any large storm events to replenish storage. In 2011, inflows to lower-region reservoirs were the lowest on record and only 10.6 % of average annual inflows from 1942 to 2017 (Austin Water, 2018). To contextualize how unprecedented 2011 inflows were, the lowest inflows during the 1950s' drought (619×106 m3) were approximately 4 times greater than in 2011 (157×106 m3) (Austin Water, 2018). Inflows to the lower-region reservoirs continued at record low levels from 2012 to 2014, all lower than the worst year of the 1950s' drought. Evaporative losses further exacerbated low surface inflow and contributed to reservoir drought. In 2011, lower-region evaporative losses exceeded reservoir inflows, with an estimated 239×106 m3 lost to evaporation – equivalent to ∼10 % of lower-region storage capacity and approximately the total annual municipal demand of the highly populated lower region (LCRA, 2022). A series of large precipitation events in 2015 ended the drought and replenished lower-region reservoirs, which by 2016 were completely full, while the middle basin storage only recovered to 25 % capacity (Fig. 1d).
3.1.3 Agricultural production
Reduced agricultural production was one of the most notable impacts of the drought. The simultaneous stressors of increased plant water demand and physiological stress from high temperatures were the main drivers leading to diminished yields and high abandonment rates during the hot, dry drought conditions in 2008–2009 and 2011 (Fig. 5) (Anderson et al., 2012; TWDB, 2022b; Nielsen-Gammon, 2012). For all three major crops (corn, cotton, winter wheat) but rice, these years were generally associated with the lowest harvested acreage, production, and yield (Fig. 5b–m) (Anderson et al., 2012; TWDB, 2022b).
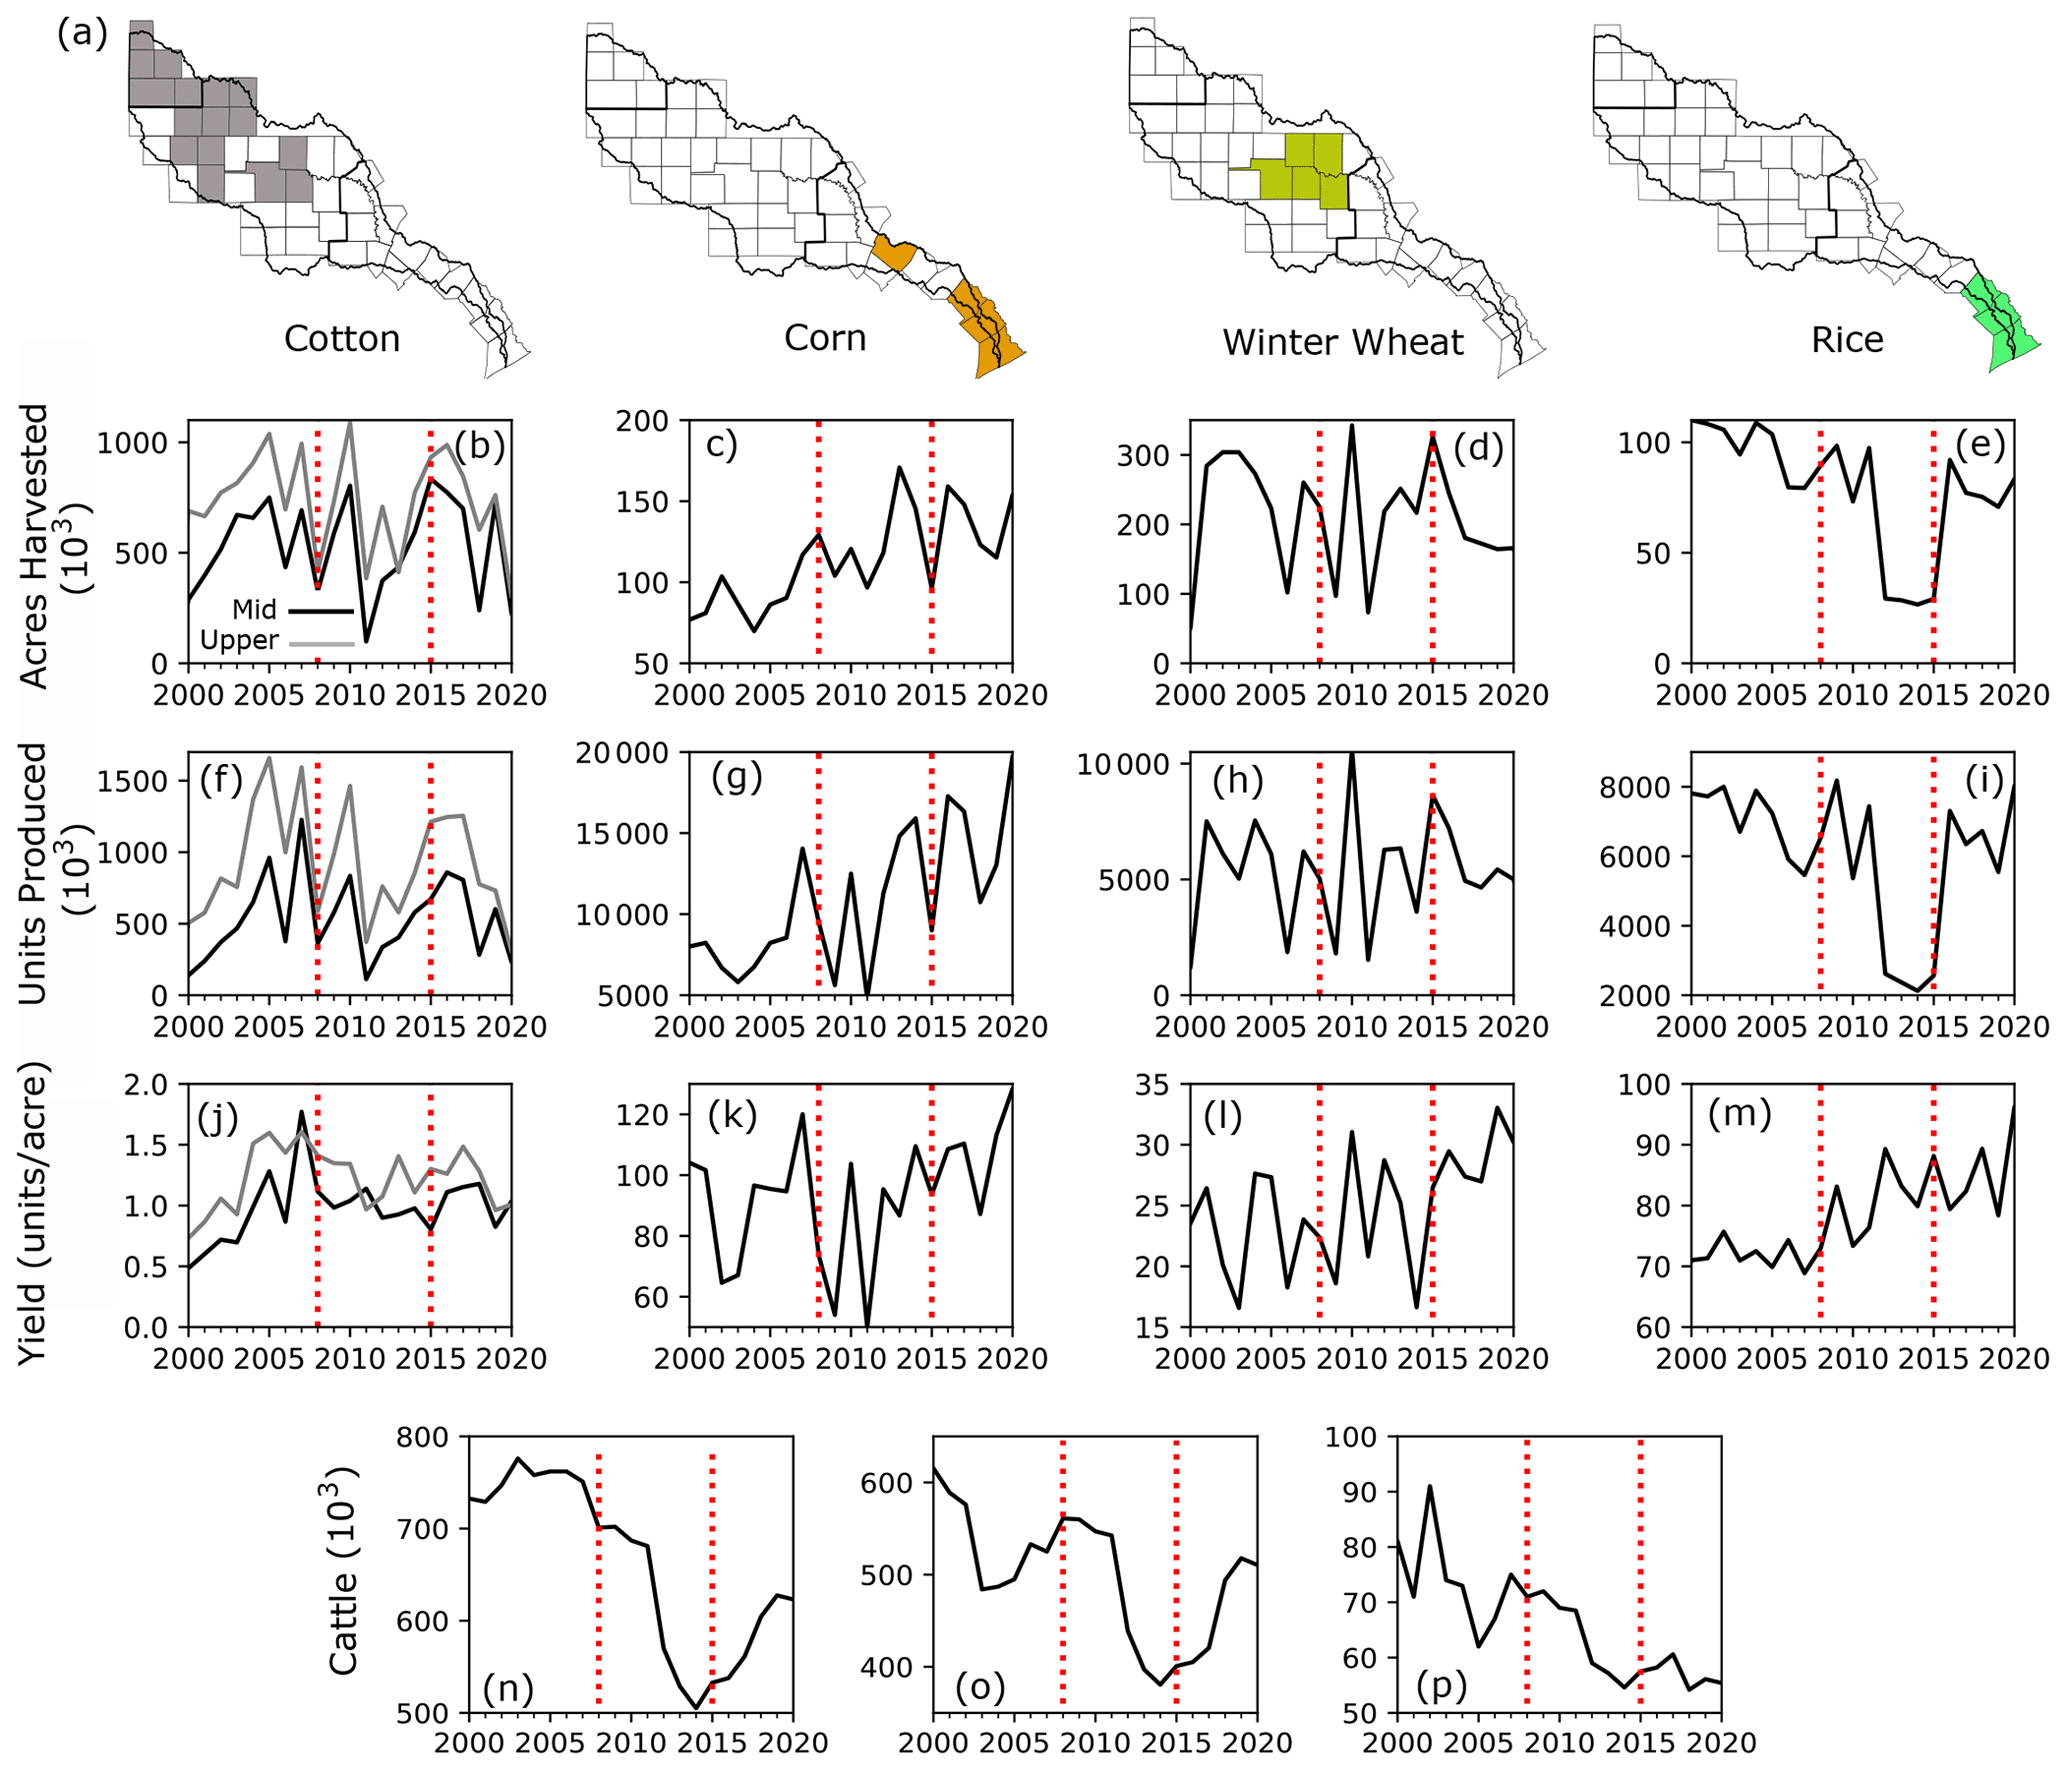
Figure 5Locations of major crop production (a). Harvested acres (b–e), units produced (f–i), and yield (j–m) for the four crops. Crop-specific units of production: 480 lb (1 lb = 0.453 kg) bales for cotton, bushels for corn and wheat, and 100 lb units for rice. Cattle herd data for each region (n–p). These data include all counties shown in Fig. 1b.
The severity of impacts varied by region due to the spatial heterogeneity of drought (Fig. S3) and differences in the proportion of irrigated versus dryland crops. Because dryland farming relies on precipitation to meet plant water needs, it is more vulnerable to meteorological drought than irrigated farmland that can supplement precipitation deficits. The middle basin, with 29 % of cotton production irrigated, had generally lower cotton yields than the upper region with 55 % of production irrigated (Fig. 5j). A higher proportion of dryland farming was also related to larger reductions in total production and harvested acres during the most severe drought years (Fig. 4b, f). Compared to 2010, in 2011 cotton acreage in the upper region declined by 64 %, while acreage in the middle region decreased by 87.5 %. Texas is one of the major global producers of cotton and comprises a large enough fraction of supply that the severely reduced production in 2011 contributed to the unprecedented price spike in cotton, which increased 153 % between March 2010 and March 2011 (U.S. Bureau of Labor Statistics, 2011). Cotton acreage and production gradually recovered to pre-drought levels over 2012–2015. Winter wheat is another example of severe yield, acreage, and production declines for dryland crops (Fig. 5d, h, l). Before the drought, less than 10 % of annual production was for irrigated wheat – even during the drought only 16 % of production was irrigated. In 2009 and 2011, wheat production declined by 64 % and 86 %, respectively, compared to the preceding year. Corn is also primarily dryland and had reduced production and yield in 2009 and 2011 but by 2013 production recovered to levels greater than before the drought (Fig. 5g, k). Corn continued to increase following the drought with post-drought area and production almost doubling relative to pre-drought levels (Fig. 5c, g). Rice differs from the three other crops because it is primarily irrigated by surface water flood irrigation. The abrupt decrease in rice production from 2012–2015 was a result of the curtailment of lower-region reservoir releases. The year 2012 was the first time in the basin's history that agricultural water deliveries in the lower basin were curtailed, and curtailments continued until 2015. Most surface water deliveries for rice are classified as interruptible, which can be reduced or entirely cut off if reservoir storage falls below defined drought trigger levels.
An adaptive response during drought is to temporarily switch to lower-water-demand, more drought-tolerant crops (Fisher et al., 2015; Glotter and Elliott, 2016). Temporary increase in sorghum production in the upper region is a potential example of crop switching (Fig. S4). Increased sorghum, combined with decreased wheat and cotton, also occurred during the 1950s' Texas drought (TWDB, 2022b). Sorghum has lower water requirements and is more drought-tolerant than cotton or wheat (TWDB, 2022b). The largest single-year increase in sorghum production occurred in the upper region in 2008 with a 350 % rise, while cotton production dropped by 55 % compared to 2007. Sorghum production in the lower and middle regions did not show evidence of crop switching, and both regions displayed a long-term decline in sorghum production from 2000 to 2020 (Fig. S4).
The drought also caused large reductions in cattle in the middle and lower regions, with a 17 % (224 000) decrease from 2011 to 2012. Exceptionally low spring precipitation in 2011 prevented development of dryland crops for cattle feed and adequate forage growth for pasture (Nielsen-Gammon, 2012), which reduced available feed and increased feed prices (Countryman et al., 2016). Cattle numbers did not increase until 2015, and through 2020 herd sizes had not yet recovered to pre-drought numbers (Fig. 5).
3.1.4 Environmental impacts
Wildfire and land cover
The dry and abnormally hot conditions in 2008 and 2011 (Nielsen-Gammon and McRoberts, 2009; Nielsen-Gammon, 2012) produced the two most severe wildfire years in the state (Fig. S5), and the record dry and hot conditions in 2011 led to the worst wildfire year in the state's history (Texas A&M Forest Service, 2011). The year 2011 accounted for 52 % of the total area burned in the Colorado Basin over the drought period. However, the fraction of burned area in 2011 varied widely over the different regions, with over 88 % in the upper, 50 % in the middle, and 40 % in the lower regions (Fig. S5). The upper and middle regions are mostly arid grassland and shrubland, which were more affected by hot and dry drought-driven wildfires (Nielsen-Gammon, 2012) compared to the forest-dominated lower region. Firefighting costs for Texas were estimated at USD 48 million (Nielsen-Gammon, 2012). Of the estimated USD 500 million in fire-related losses in 2011, USD 325 million (65 %) was associated with the Bastrop Complex fire located in the lower-region city of Bastrop that remains the costliest fire in state history (Texas Standard, 2021).
In addition to vegetation loss from fires, the extreme dry and hot conditions during 2011 caused widespread tree mortality in the middle and lower regions due to depleted deep soil moisture that typically buffers trees from short-term drought (Nielsen-Gammon, 2012). Estimates indicate that there was an 8 %–10 % canopy loss in the middle and lower regions (Schwantes et al., 2017). A statewide study by Moore et al. (2016) found single-year mortality percentages of 6–6.6 % in the middle region and 7.4 %–9.7 % in the lower region, similar to the estimates from Schwantes et al. (2017). Crouchet et al. (2019) studied tree mortality in the middle region and found a 9 times increase in mortality compared to a typical year. The upper region was not affected by tree mortality because it is scrubland largely devoid of tree cover. Tree mortality also affected cities, with mortality rates in parts of Austin reaching 20 % in 2011 (NASA, 2019). While the record hot, dry conditions in 2011 have been the focus of most studies, Klockow et al. (2018) found pest-driven mortality increased during 2012–2015 in eastern Texas and hypothesized that this was related to physiological stress induced by 2011 combined with the continuation of drought conditions.
Streamflow, surface water quality, and environmental flows
To contextualize the severity of the hydrological drought, streamflow at six locations in the basin are summarized using flow-duration plots (Fig. 6a–f). Locations a–c are located along the main stem of the Colorado River, while locations d–f are tributaries (Fig. 6j). Figure 6a–c additionally show the flow duration curves for the 2000–2007, 2008–2015, and 2016–2020 periods. The curves for the pre-drought (2000–2007) and drought (2008–2015) periods were used to calculate percent reduction in flow over the entire range of exceedance probabilities (Fig. 6a–f). Median to low flows are critical for stream habitat and water quality (Caldwell et al., 2018; Konrad et al., 2008; Wineland et al., 2022), while high flows are important for replenishing reservoir storage.
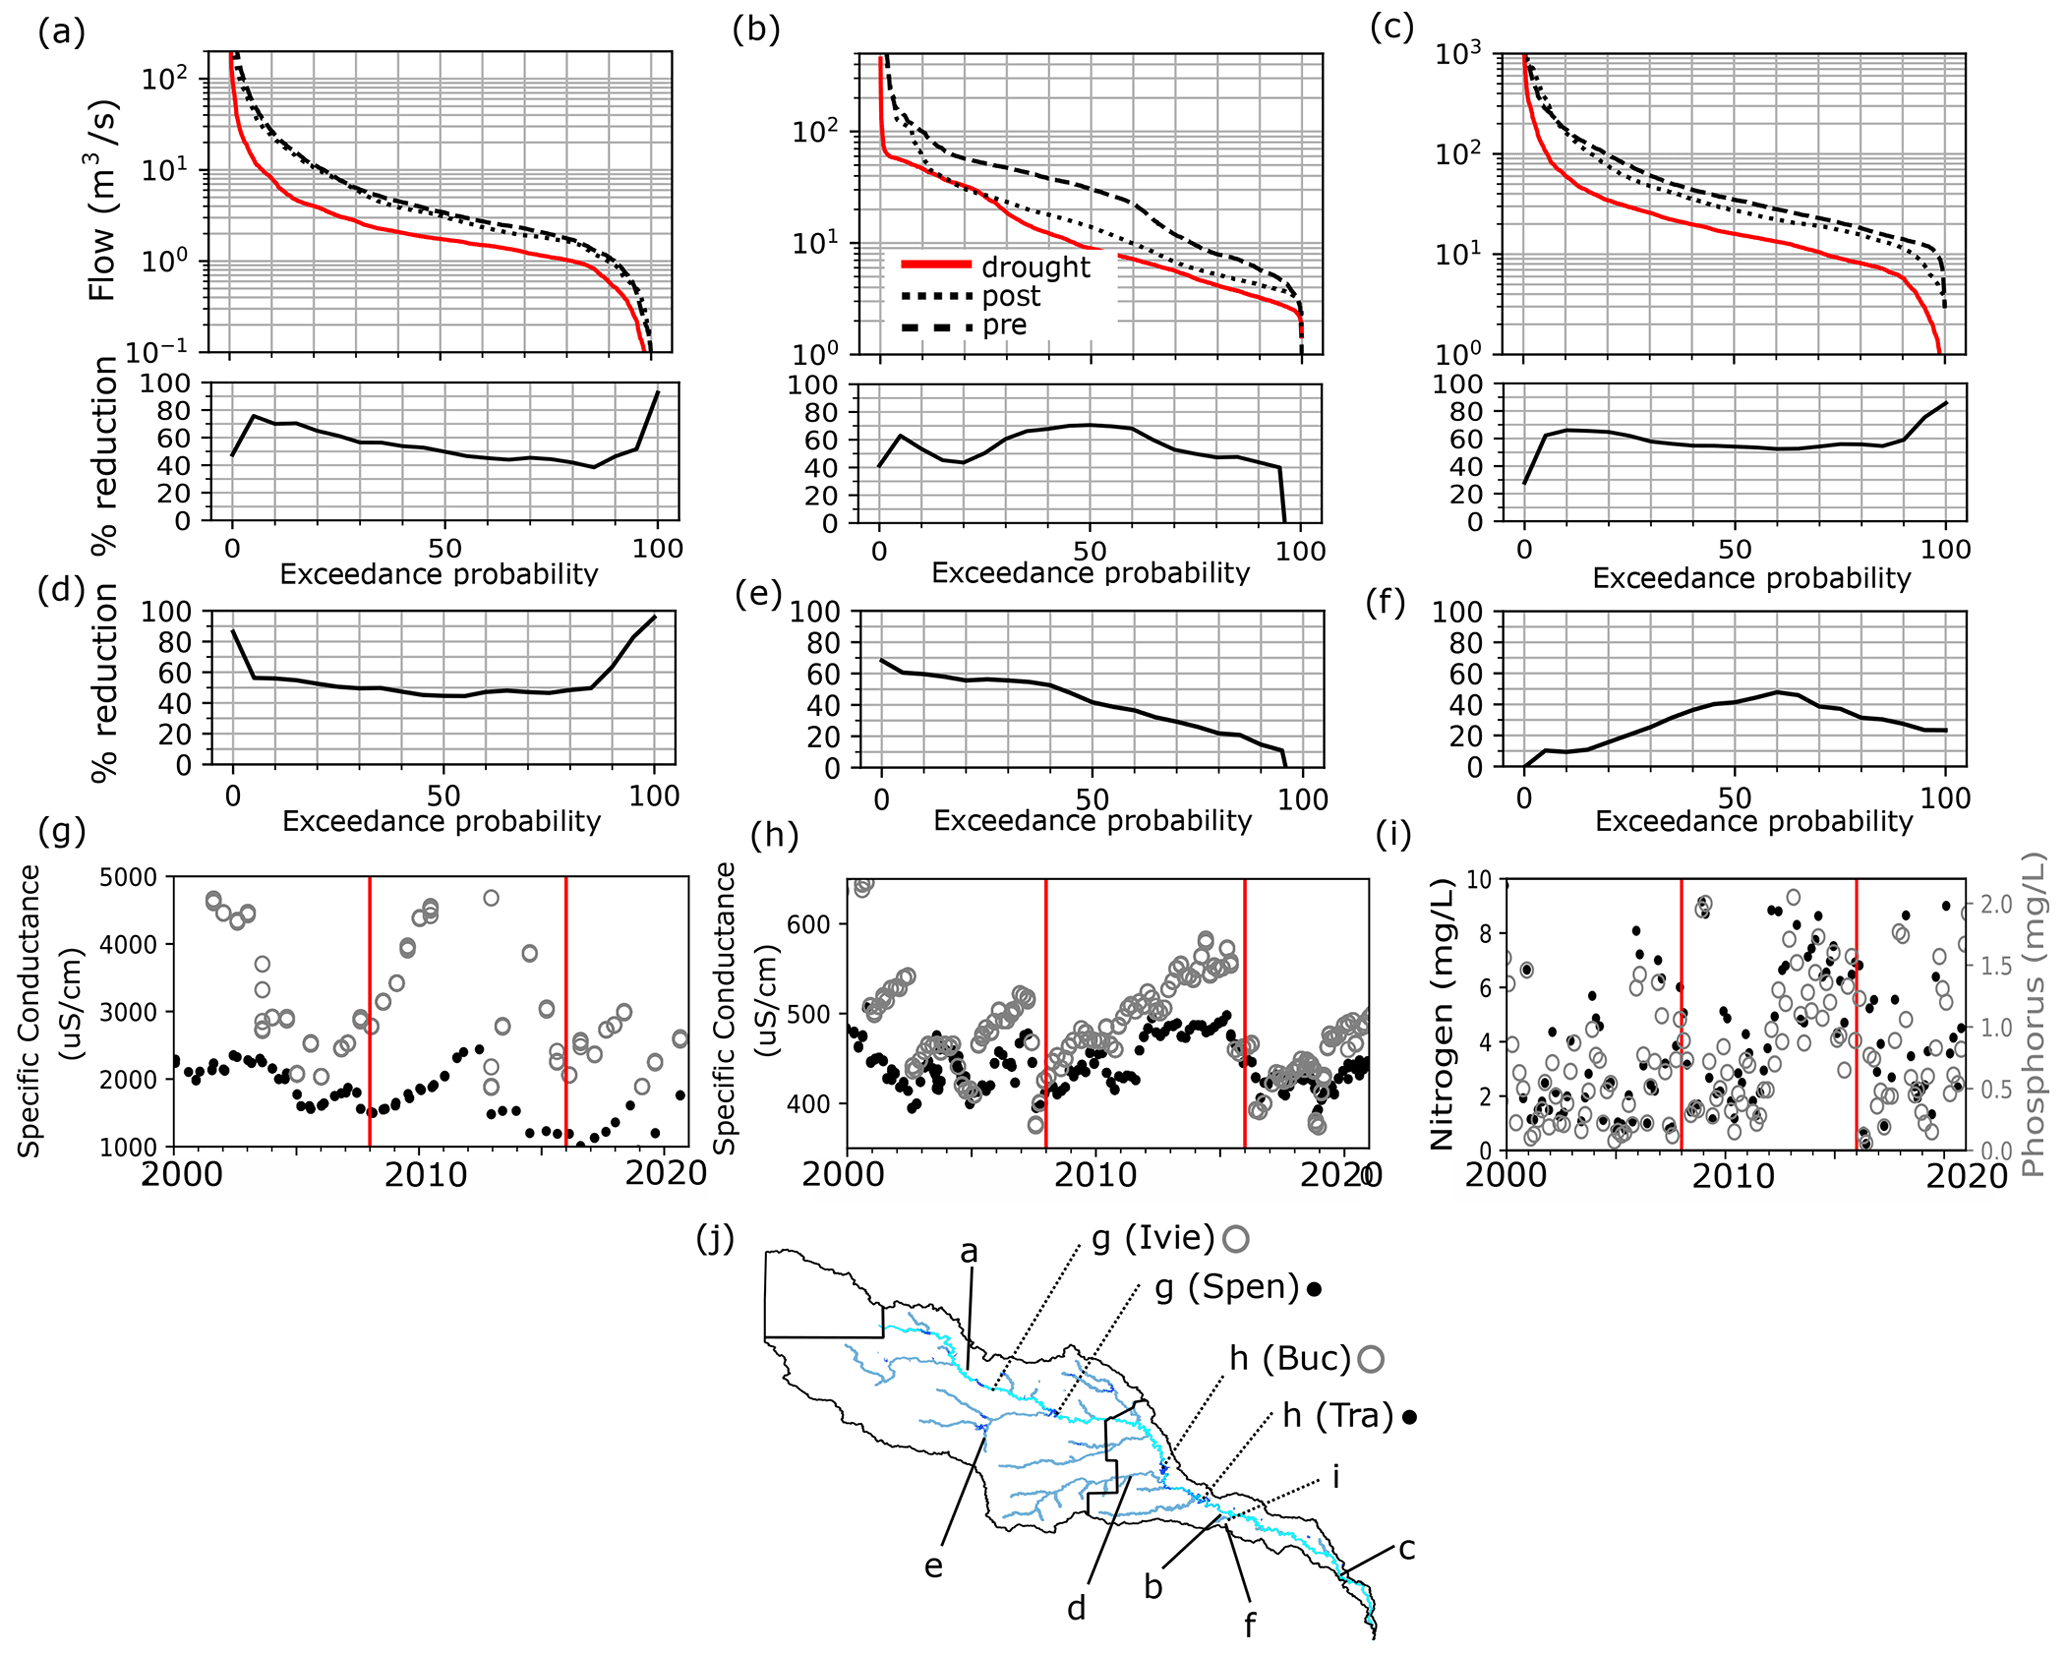
Figure 6Flow duration curves for the pre-drought (2000–2007), drought (2008–2015), and post-drought (2016–2020) periods for three locations along the Colorado River, Texas (a–c). Percent reduction in exceedance probability flow for the drought period compared to the pre-drought period (a–f) for six locations (three for the Colorado River and three for tributaries). Specific conductance data at two middle-region reservoirs, O.H. Ivie (Ivie) and Spence (Spen) (g), and two lower-region reservoirs, Buchanan (Buc) and Travis (Tra) (h). Nitrate and phosphorus data for the Colorado River downstream of Austin (i). Locations of discharge and water quality data (j) and denoted symbols for panels (g) and (h) that each show data for two reservoirs.
During the drought, flows along the main stem were generally 40 %–60 % lower across the spectrum of flow percentiles (i.e., the high, median, and low flows were all heavily reduced), while the tributary locations had more heterogeneity in their flow reductions. The San Saba location (Fig. 6d) showed a greater than 45 % reduction across all flow percentiles, while the spring-fed South Concho (Fig. 6e) and Barton (Fig. 6f) locations had less severely affected low flows (often considered to be defined by the 90th or 95th flow exceedance percentiles). Prolonged hydrological drought can affect groundwater levels, which can in turn affect streamflow by reducing groundwater baseflow and spring discharge (Smith, 2013; Smith et al., 2015), demonstrated by reduced flows at spring-fed locations e and f (Fig. 6j). Due to the reservoirs being at critical levels between 2012 and 2015, environmental flow releases were reduced by about 86 %, decreasing from 38 to 40.7×10⁶ m3 in 2011–2013 to only 5.7×10⁶ m3 in 2014, and there were no releases in 2015 (LCRA, 2022), affecting low flows downstream of major reservoirs.
Water quality impacts included increased salinity, algae, metals, and nutrients (nitrogen and phosphorus), which are surface water quality impacts commonly associated with drought (Mosley, 2015). Reduced surface flows affect water quality by increasing the concentration of pollutants in surface water from both point source pollution (e.g., treated wastewater outflows) and non-point source pollution (e.g., runoff from agricultural or urban land) (Mosley, 2015). The example we provide is for a segment of the Colorado River downstream of one of Austin's two water treatment plants (Fig. 6i), which shows consistently elevated nitrogen and phosphorous concentrations during 2012–2015. Low streamflow also affected water quality in the Matagorda Bay estuary where the Colorado River discharges into the Gulf of Mexico. Discharge from the lower Colorado River to Matagorda Bay in 2011 was 274×106 m3, representing a decrease of over 78 % compared to the average annual discharge of over 1.2×10⁹ m3 between 1980 and 2010, marking the lowest on record since 1977 (TWDB, 2015). This historically low freshwater input resulted in increased salinity levels in the estuary that reduced habitat suitability for oyster, crab, shrimp, and fish, affecting commercial fishing operations and estuary health (TWDB, 2015).
In the lower region, the drought led to elevated nitrogen levels in reservoirs that caused increases in the microalgae population and a shift towards more harmful algae strains (Gamez et al., 2019), specifically cyanobacteria, which can produce harmful algal blooms (Beversdorf et al., 2013). Water quality in middle-region streams and reservoirs was affected by naturally high levels of chlorides, sulfates, trace contaminants (e.g., arsenic), and total dissolved solutes from groundwater baseflows (Region F, 2015). During hydrological drought, groundwater baseflow comprises a larger fraction of streamflow (Jones and van Vliet, 2018), which resulted in degraded surface water quality in the middle region. Reservoir water quality was further degraded by evaporation that concentrated solutes. Specific conductance data (proxy for solute concentration) for two key middle-region supply reservoirs (O.H. Ivie and Spence) show solute concentrations steadily increasing from 2008 to 2013 (Fig. 6g). Fresh inflows in 2013 substantially reduced solute concentrations in these reservoirs, though total storage in the middle basin changed little (Fig. 1b). The two main lower-region reservoirs (Buchanan and Travis) also showed increasing solute concentrations during the drought (Fig. 6h), but their magnitude was much smaller and was not a concern for potable water quality.
3.1.5 Economic impacts
It is difficult to precisely quantify and directly attribute economic impacts to drought (Naumann et al., 2021; Stahl et al., 2016). However, sectoral data on employment, GDP, and population growth at regional and basin scales enable a first-order assessment of whether any explainable changes coincide with the drought period.
Population growth in the basin, including the rapidly growing Austin metro area, remained constant throughout the 2008–2015 period and did not show a reduced growth rate at any point during the drought (Fig. 3a–c), even during 2011–2015 when strict water conservation measures were in place. Additionally, key economic metrics of total GDP (Fig. 7) and employment (Fig. S6) both showed steady and sizable growth throughout the drought. As shown in Fig. 7, GDP decline in the middle and upper regions can be attributed to the oil and gas sector, which is unrelated to the drought. Compared to average agricultural GDP during 2000–2007, average GDP in the basin over 2008–2015 was USD 574 million lower (35 %) and in 2011 USD 913 million lower (56 %) (inflation adjusted to 2022). The upper region was more severely affected and disproportionally due to its large agricultural sector. During 2008–2015 upper-region agricultural GDP was reduced by 51 %, while the middle and lower regions were only reduced by 26 % and 24 %. While the drought had significant negative impacts on the agricultural sector GDP, agriculture represents a small fraction of total GDP and regional employment. Even in the upper region, where 99 % of water use is for irrigation, agriculture accounts for less than 15 % of GDP, whereas it is less than 0.5 % in the other two regions. However, agricultural impacts would have been more severe if losses were not partially offset by federal assistance and crop insurance (TWDB, 2022b). For example, at the state level there were USD 2.6 billion in insurance payments (Collins and Bulut, 2012), while state-level losses were estimated at USD 13 billion (Anderson et al., 2012). However, the losses reported by Anderson et al. (2012) are gross revenue, so the USD 2.6 billion likely made up for a large fraction of lost profit.
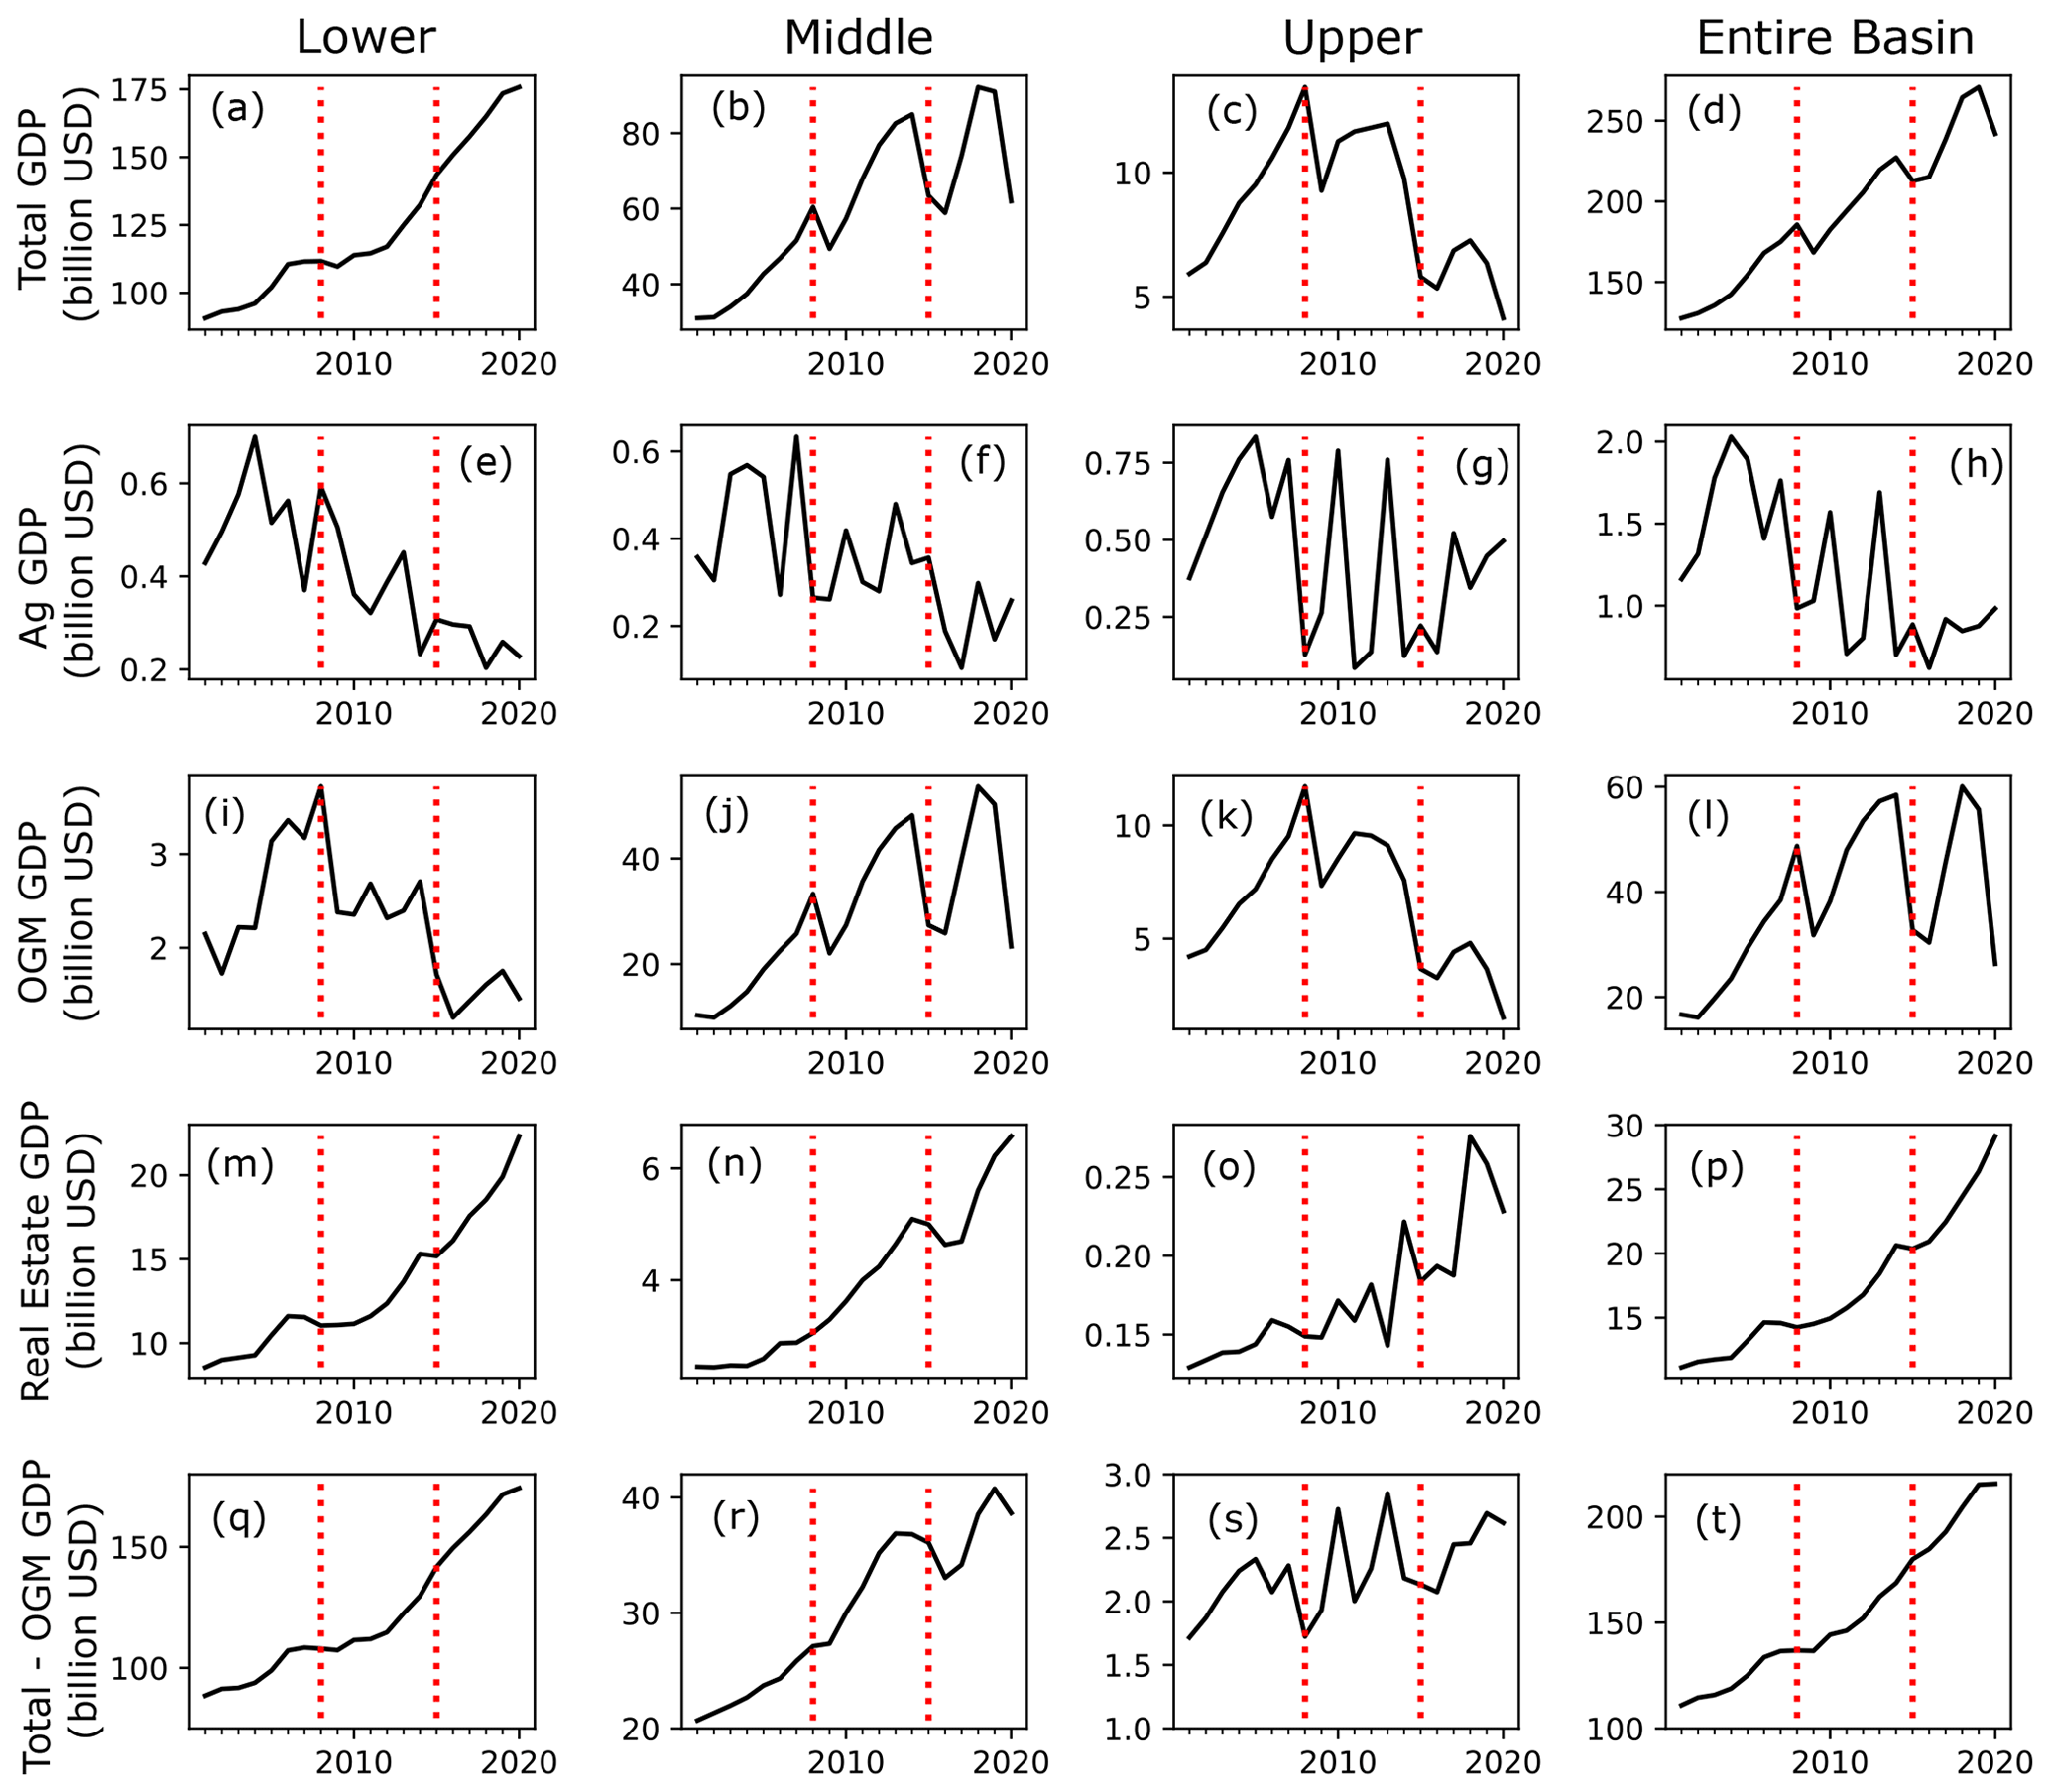
Figure 7Regional annual GDP for all sectors (a–c); agriculture (e–g); oil, gas, and mining (OGM) (h–j); real estate (k–m); and all sectors minus OGM (n–p).
Aside from agriculture, a specific sector harmed by the drought was the real estate market for lakeside homes, whose values are strongly tied to the recreational and aesthetic value of lakes. An analysis by Morris (2019) of home values around the lower-region reservoir Lake Travis showed that the drought had large adverse effects on property values. Accounting for both loss of value and lost appreciation, lakeside homes incurred over USD 2 billion in estimated losses between 2011 and 2015 (Morris, 2019), whereas the real estate market in Austin and the lower region exhibited strong growth throughout the drought (Morris, 2019) (Fig. 7).
Our finding that the drought had little apparent overall effect on the basin-wide economy is in line with assessments of the 2001–2009 Millennium Drought in Australia (van Dijk et al., 2013) and the 2012–2016 drought in California, United States (Lund et al., 2018). Highly connected domestic and global trade networks in the 21st century have greatly reduced the economic and societal impacts of drought (Lund, 2016; Lund et al., 2018). Water supply infrastructure also buffers social impacts and economic disruption (Lund, 2016). The combined factors of highly engineered regional water supply and domestic-global trade networks help explain why the drought did not hinder population and economic growth.
3.1.6 Energy production
The power sector notably did not suffer any major adverse impacts during the drought (TWDB, 2022b), and there were no reports of significant outages even during record drought conditions in 2011 (Scanlon et al., 2013a). The absence of substantial reliance on hydropower in the basin (on average less than 3 % of annual production) resulted in no significant impact to power generation from curtailed reservoir releases due to reservoir drought. Additionally, many thermoelectric plants in the basin had already transitioned to low-water-demand cooling technologies before the drought and thus were “pre-adapted” for severe and prolonged drought conditions (Scanlon et al., 2013a). Natural gas facilities with high-water-efficiency technologies such as combustion turbine and combined cycle (with cooling tower) are prevalent in the middle and upper regions (Scanlon et al., 2013b). There is only one high-water-demand coal plant in the lower basin, which is supported by a guaranteed firm water contract from lower-basin reservoirs (LCRA, 2022). Many of the thermoelectric plants also have their own reservoirs, including the South Texas Nuclear Plant in the lower region, that provide more reliable supply than solely relying on run-of-river diversions. These factors highlight the significance of institutional arrangements and engineered water infrastructure for reducing power sector vulnerability to drought.
During the drought wind power production in the basin almost doubled (98 % increase), mostly in the water-scarce middle and upper regions. By 2015 annual wind production was similar in magnitude to coal power production in the basin ( megawatt hours (MWh); Fig. S7). Solar power did not experience large growth until after 2015, but between 2015 and 2020 annual production increased from 44 000 to 4.1×10⁶ MWh. By 2020 the combined annual wind and solar production (2.5×10⁷ MWh) was more than double coal power and on par with gas power production in the basin (Fig. S7). An advantage of wind and solar power in a water-stressed region is electricity generation with zero water requirements.
3.2 Impacts on water planning and management
The drought resulted in large increases in proposed investments to meet long-term water needs, with the largest increase in planned projects in the lower region (a USD 3.63 billion increase from 2011 to 2016 and an additional USD 623 million from 2016 to 2021) and moderate increases in the middle region (USD 281 million from 2011 to 2016 and an additional USD 410 million from 2016 to 2021). Notably, the drought did not cause any major changes in the upper-region planning due to its low sectoral demand outside of agriculture and no economically viable alternative irrigation source other than continued use of groundwater. The following sections describe changes in planned sectoral water supply (Sect. 3.2.1); the type, volume, and unit costs of proposed water supply sources (Sect. 3.2.2); and specific planning and management innovations (Sect. 3.2.3).
3.2.1 Impact of drought of record on future sectoral water supply planning
The first part of our assessment tabulated recommended additional water supply for sectors in each region along with the estimated sectoral shortage in a repeated drought of record (Fig. 8). We found that most of the anticipated future supply needs and recommended additional supplies were associated with the municipal and agricultural sectors (Fig. 8), the two largest sectors in the basin. The most prominent planning response was a nearly 300 % increase in planned municipal supply for the lower region between 2011 and 2016 (Fig. 8b). A consistent pattern across all regions was that recommended new municipal supply far exceeded projected future needs, which suggests a sizable buffer or “safety factor” should a future drought be more severe than the historical reference used by the drought of record methodology. In contrast, recommended agricultural supplies typically do not exceed projected needs and are indicative of a lower priority towards preventing agricultural water shortages in the event of drought. This gap is most notable in the upper region where planned supplies for agriculture were less than 20 % of anticipated need, reflecting the anticipated reduction in long-term supply due to groundwater depletion with no feasible alternative supply (Region O, 2020). Proposed additional supply for thermoelectric power met anticipated needs in the lower region but not the middle and upper regions. However, the middle basin plans note that some middle-region power plants included in the regional water plans are being phased out in the near future and that the projected 30-year demands are not accurate; the upper-region need in 2016 appears anomalous.
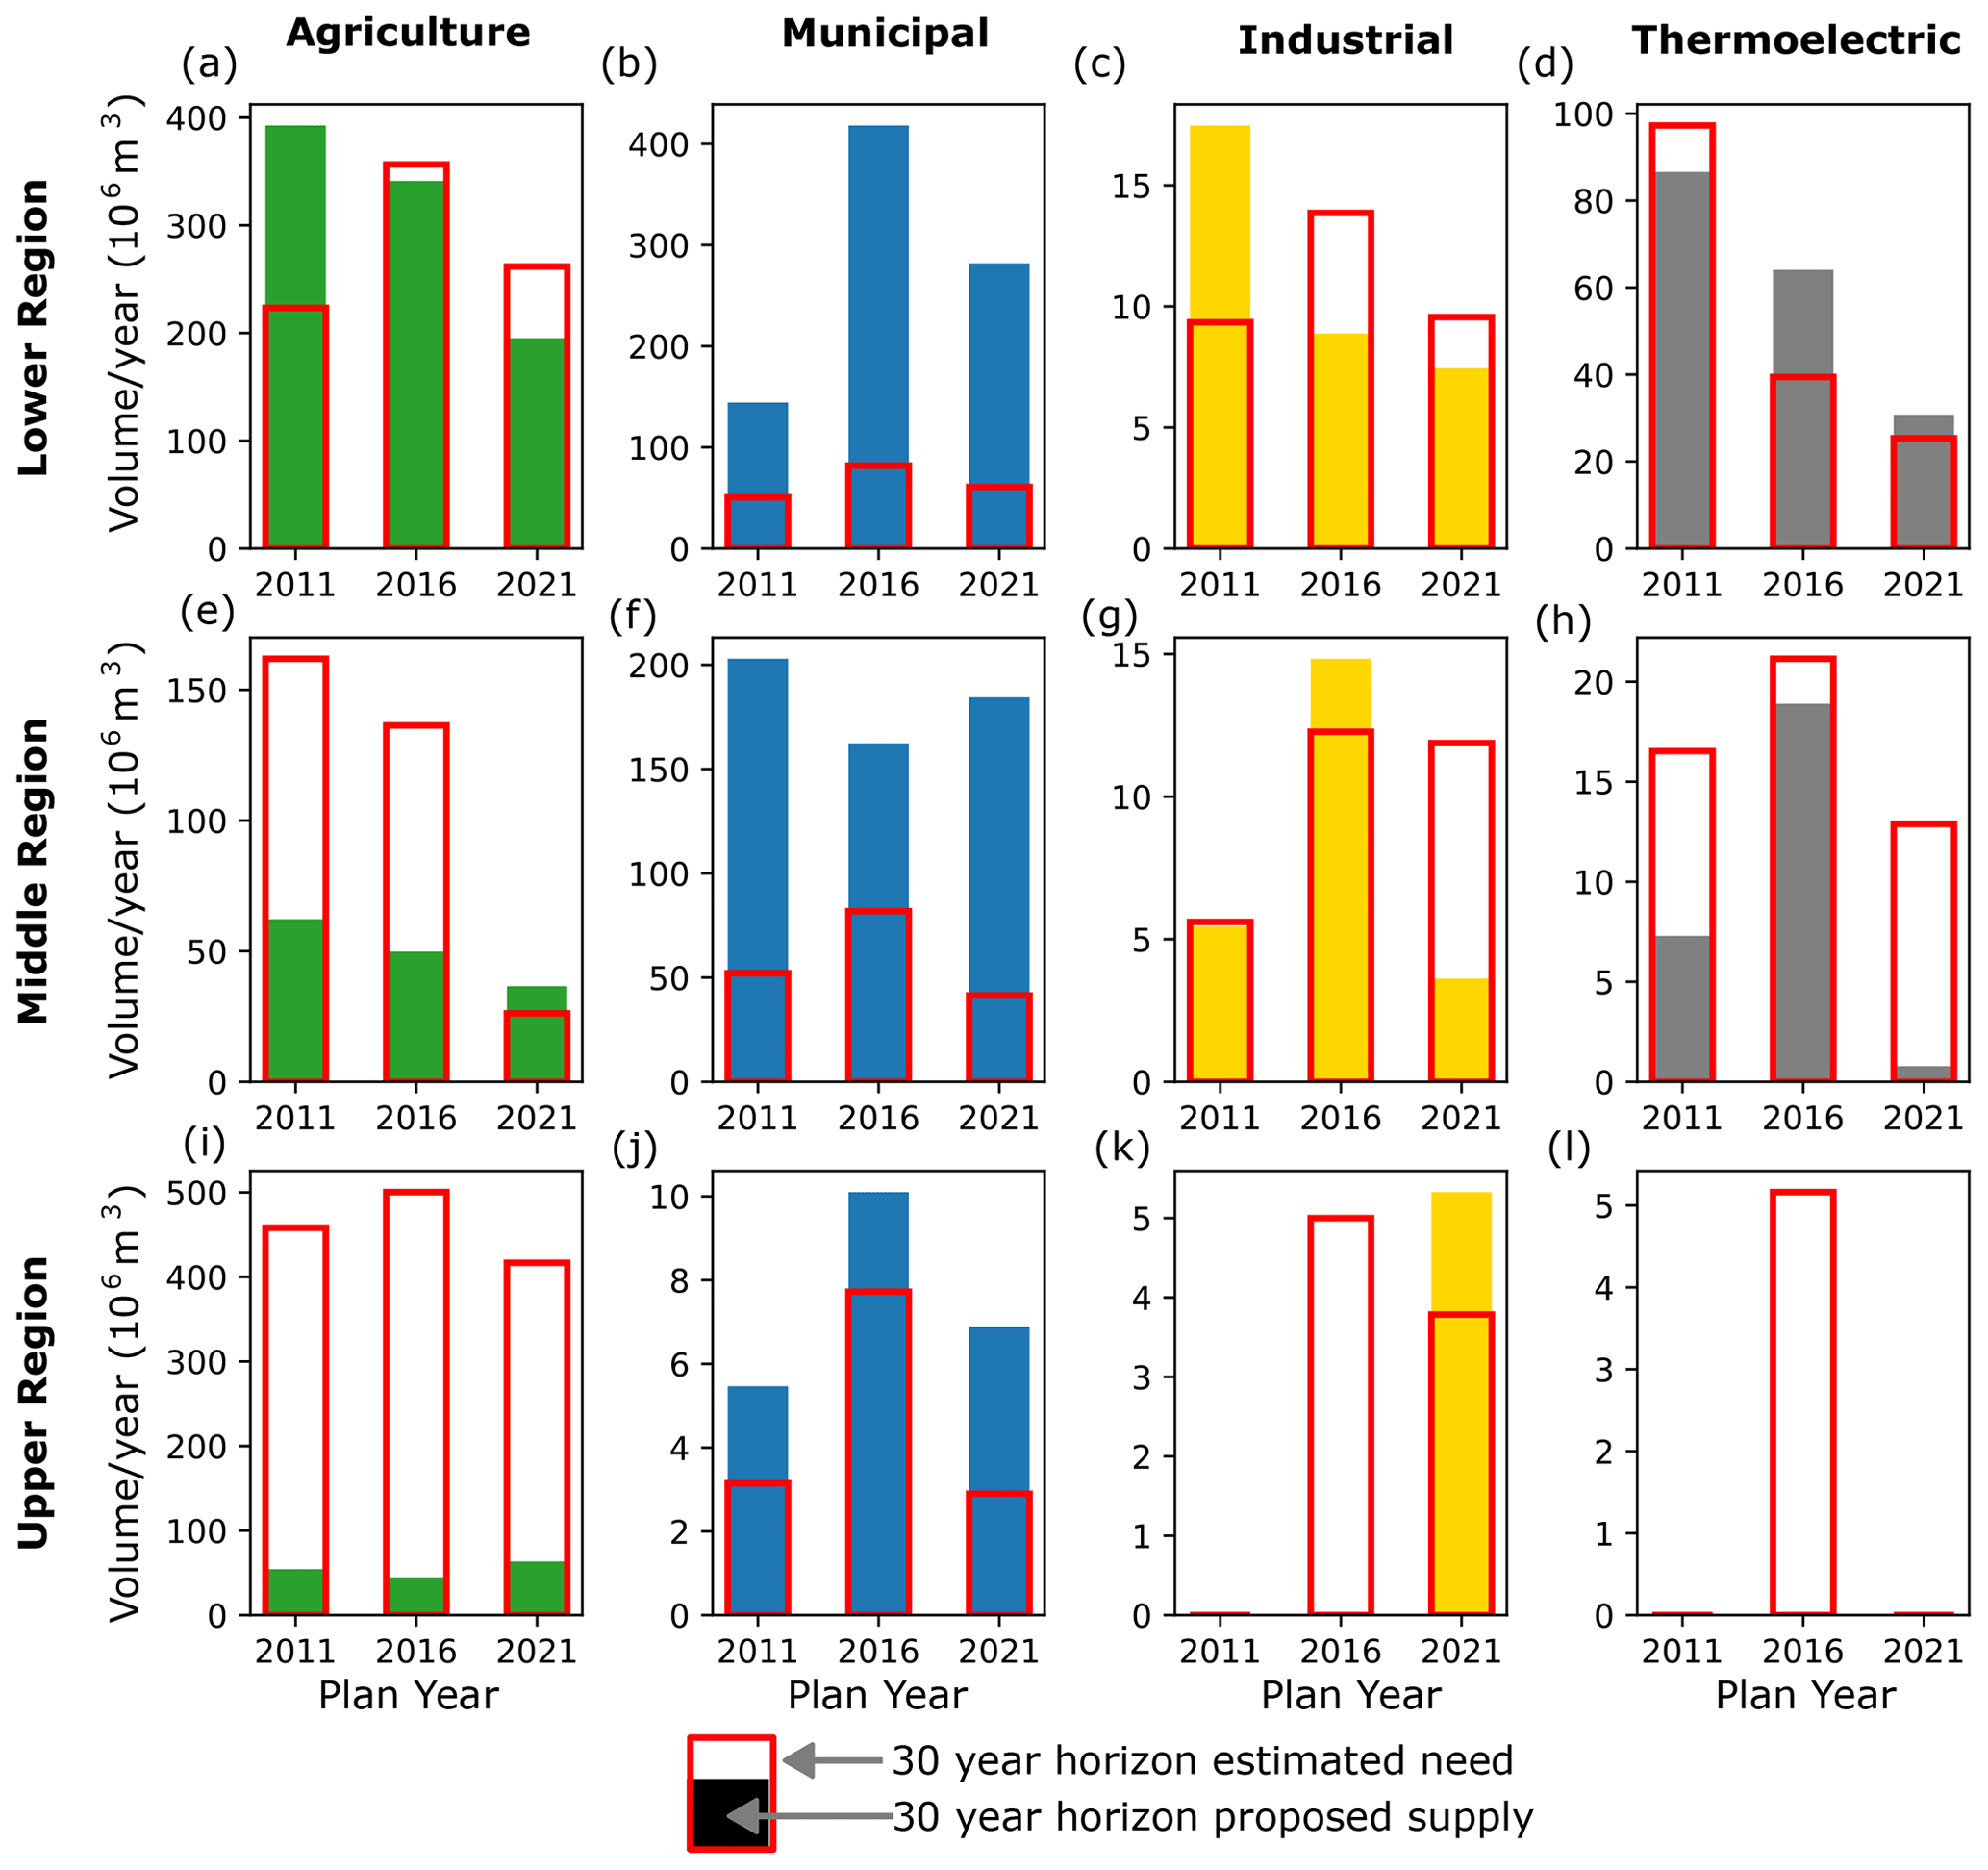
Figure 8Filled bars show 30-year additional recommended supply (106 m3 yr−1) for each sector within each region, while unfilled red bars are estimated annual sectoral needs under a repeat of the drought of record in the same 30-year horizon.
3.2.2 Water supply and management strategies to meet future supply needs
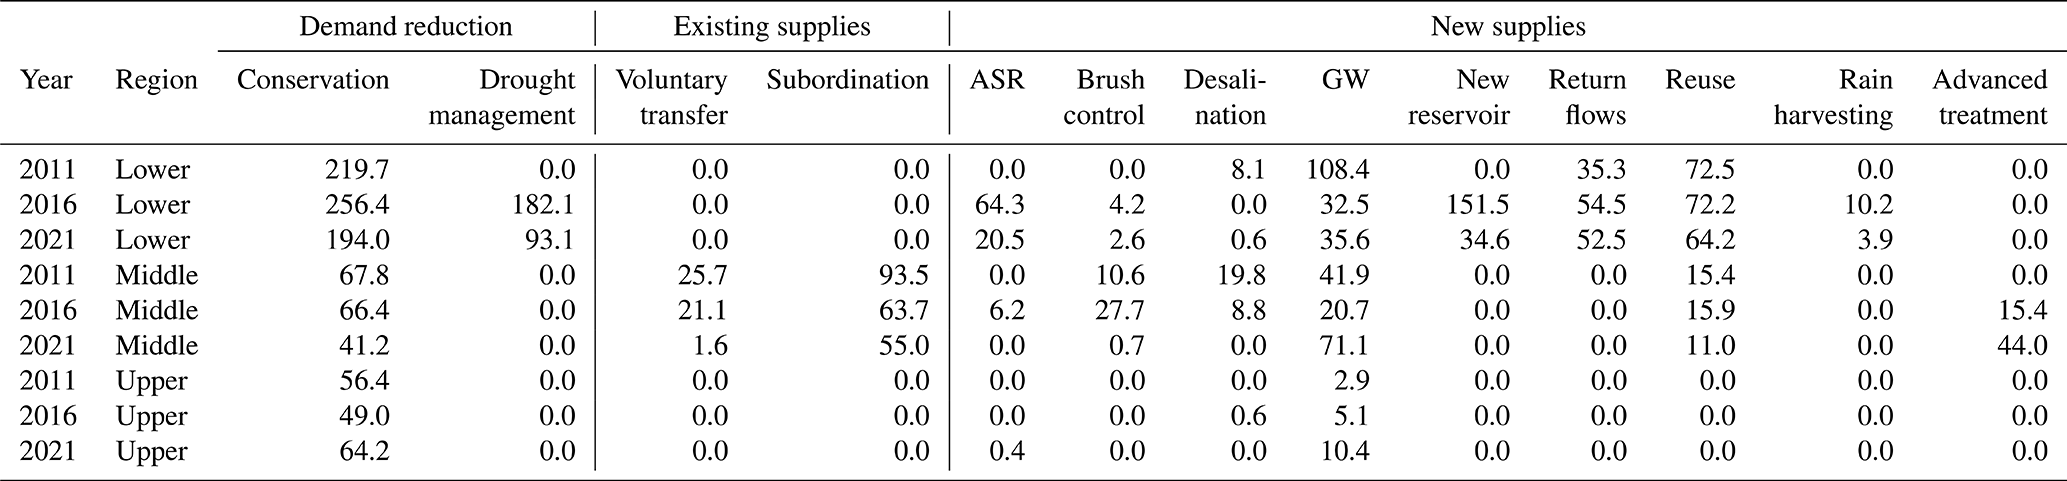
The next part of our analysis compiled a database of the specific sources of additional supply proposed to meet the recommended supply targets for each planning region in each of the 5-year regional water plans from 2011 to 2021 (Table 3). We identified 13 water supply strategies proposed to meet future water needs in the basin (Table 3). The strategies can be classified into one of the following three groups: (1) demand reduction, (2) creation of new supplies, and (3) alternative use of existing supplies. The three regions have notable differences in what combination of the 13 strategies is used to meet projected needs under a repeated drought of record.
Table 3Planned sources of additional supply (106 m3 yr−1) for planning regions in the Colorado Basin. ASR – aquifer storage and recovery; GW – groundwater.
Planned new water supply sources following the drought of record
The 2016 regional water plans had six supply strategies that were not present in 2011 plans: aquifer storage and recovery (ASR), rain harvesting, advanced water treatment, construction of new reservoirs, and brush control. Another notable change compared to 2011 was a large increase in the use of municipal return flows. While this strategy was not entirely new in the 2016 plans, the over 50 % increase in return flow volumes was notable, so this strategy is included in this section.
The new strategies had a wide range of unit cost, with return flows being the least expensive, while advanced treatment, rain harvesting, and ASR generally were the most expensive (Fig. 9). ASR is primarily a strategy in the lower region and likely due to its high estimated unit cost was scaled back in the subsequent 2021 plan (Table 3). Advanced treatment is unique to the middle region and refers to upgrading existing water treatment facilities and building new facilities that can treat surface and groundwater to meet drinking water standards. Expanded advanced treatment would enable the middle region to use groundwater sources that currently exceed standards and treat reservoir water that can exceed standards during periods of drought (Region F, 2015). The use of return flows in the lower region is primarily for Colorado River diversions downstream of Austin, but one project proposes to import municipal return flows from outside of the basin.
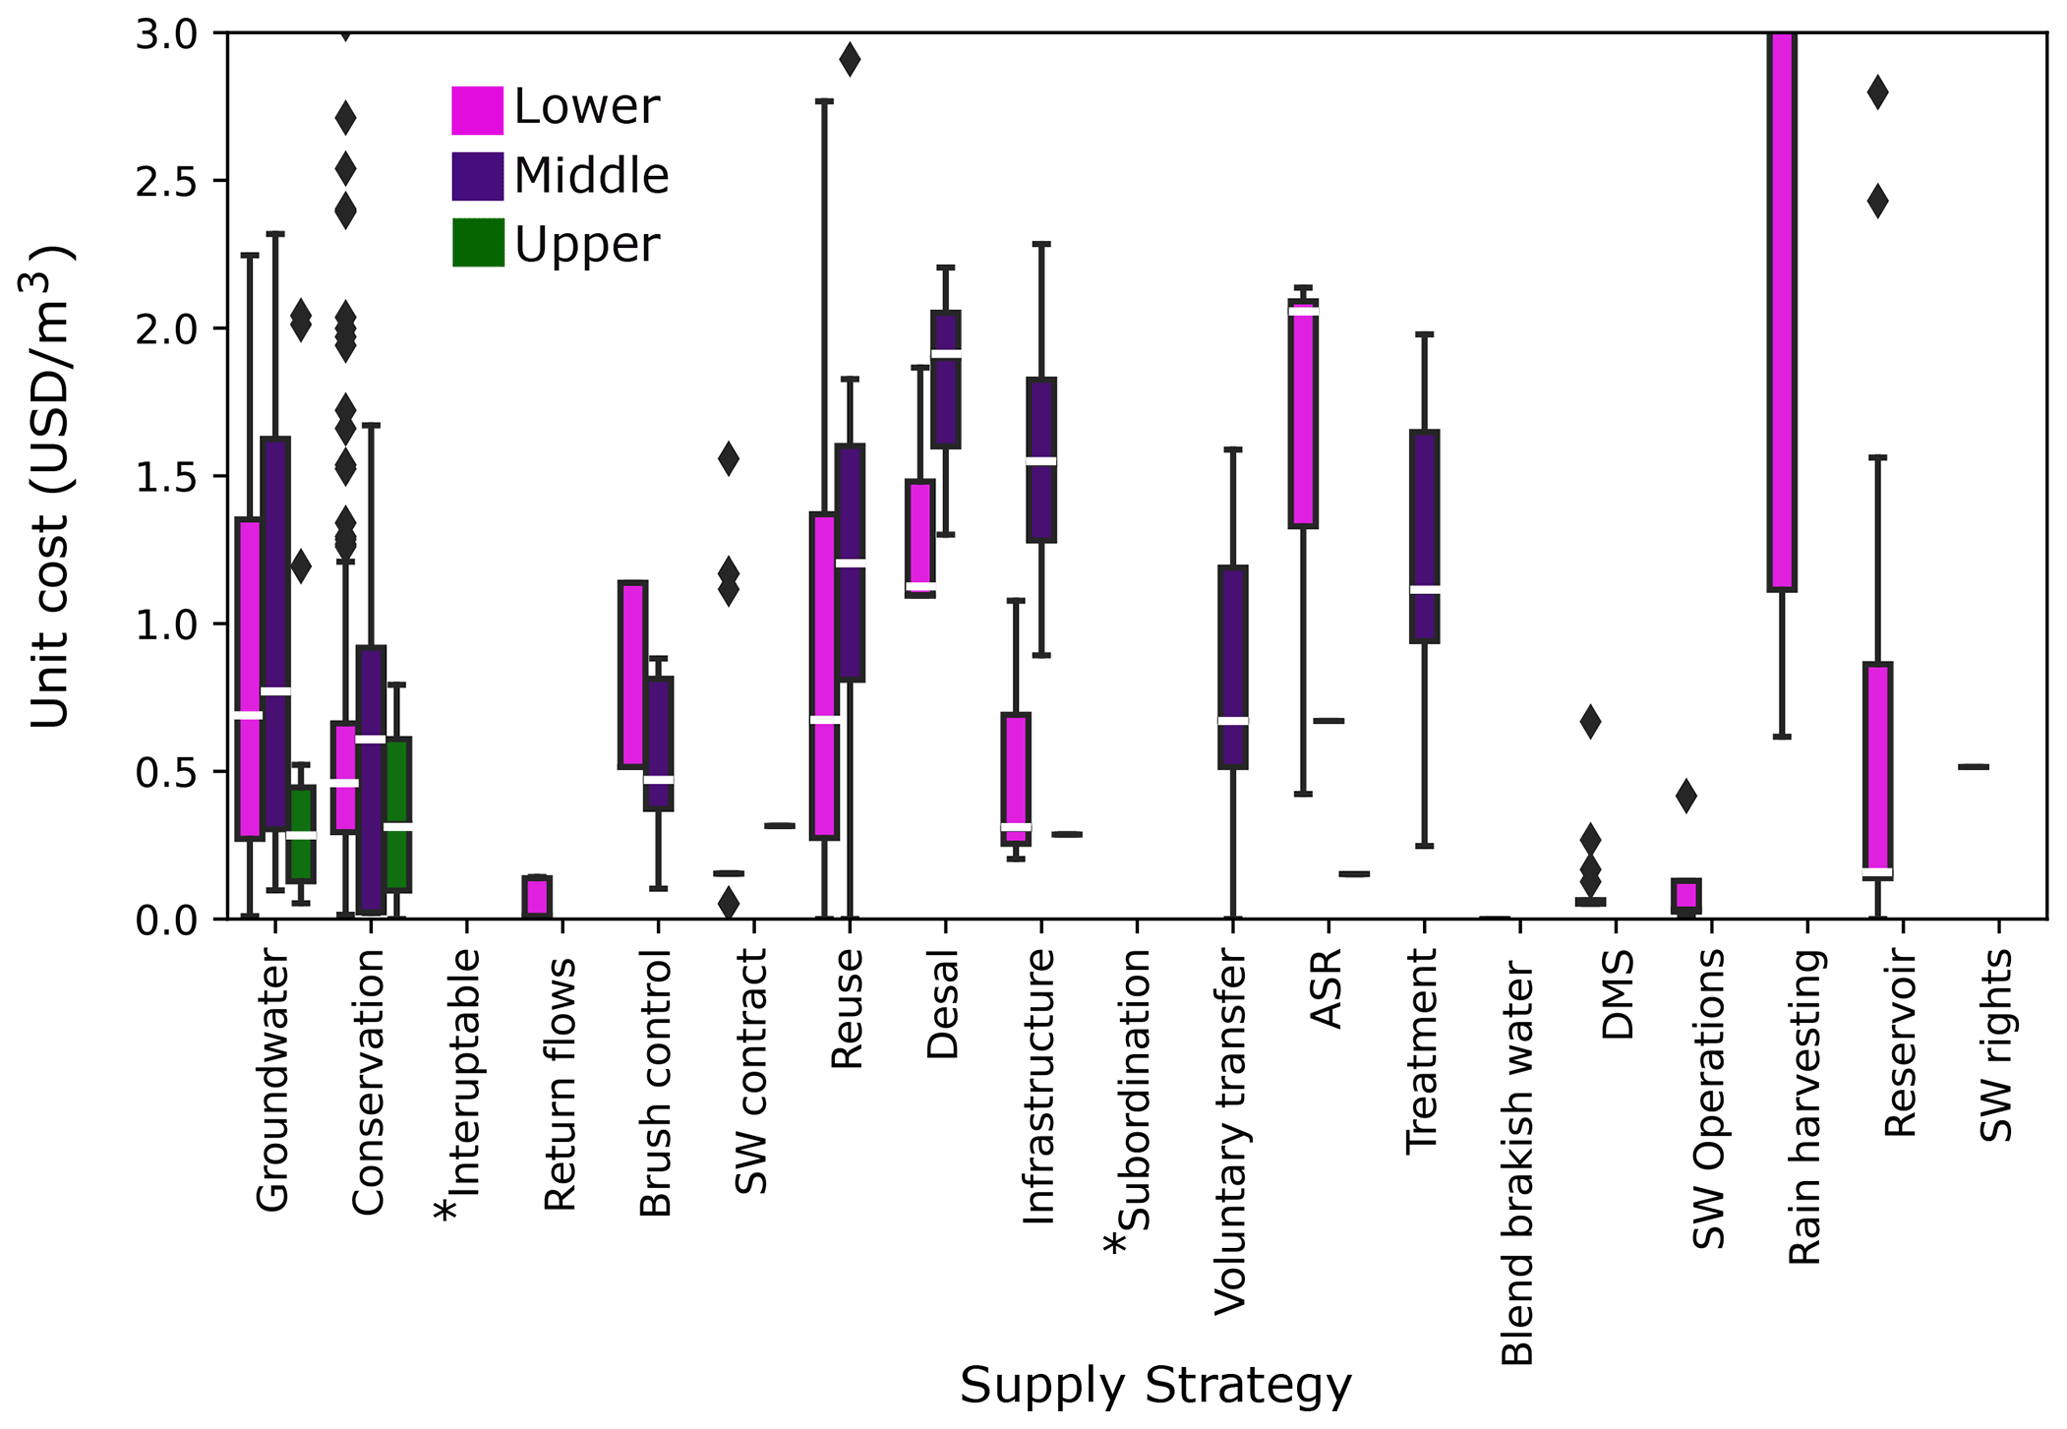
Figure 9Unit cost per cubic meter for water supply strategies compiled from the 2011, 2016, and 2021 regional water plans. Costs converted to 2022 dollars. ASR signifies aquifer storage and recovery, and DMS signifies temporary drought management strategies. No unit cost reported for interruptible supply or subordination. Boxes show the interquartile range, and the median is shown by white lines.
The drought accelerated the construction of an off-channel reservoir that was proposed for 2030 in the 2011 plan. The 49.3×10⁶ m3 reservoir is designed to be filled using diversions from the Colorado River during high-flow events to capture water that would otherwise flow to the Gulf of Mexico. Brush control refers to the selective removal of high-water-demand plants (juniper, salt cedar, and mesquite) to increase groundwater recharge and reduce riparian and shallow groundwater evapotranspiration (ET). Brush control was scaled back as a strategy in the 2021 plans and is not currently proposed as a major source of supply.
Supply strategies that remained the same or decreased following the drought of record
Planned supply from groundwater pumping and reuse remained the same or decreased after the drought. New groundwater supply was increased in the middle and upper regions following the drought, but there was a large decrease for the lower region, which was offset by a commensurate increase in groundwater supply from ASR, suggesting an effort towards more sustainable groundwater use (Table 3).
We found that reuse and groundwater have a wide range of estimated costs (Fig. 9). Reuse costs vary depending on whether the reuse is indirect or direct and the intended end use, with potable reuse being more costly than non-potable reuse, in agreement with Cooley et al. (2019). Non-potable reuse currently supplies municipal irrigation (parks, golf courses), oil and gas operations in the middle basin, and water for thermoelectric plants (middle and lower regions). The first direct reuse facility in Texas became operational in the middle-region city of Big Spring in 2013. The Big Spring direct reuse facility blends reclaimed water with raw reservoir water that is then treated in water treatment plants, providing 2.32×10⁶ m3 yr−1 of supply (Region F, 2015).
Estimates of new groundwater supply costs vary from USD 0.3 to USD 0.7 per m3 for the lower quartile to over USD 1 per m3 for the upper quartile (Fig. 9). Major cost factors are proximity to the groundwater source and end use. The top quartile costs are associated with municipal supply projects developed far from the groundwater source that require extensive conveyance infrastructure, whereas the lower costs are associated with local supplies associated with existing well fields or non-municipal use. An example of a high-cost, municipal supply groundwater project is the T-Bar Well Field Project for the city of Midland (middle region) that became operational during the drought. The project added 13.8×10⁶ m3 yr−1 of supply at a cost of USD 209 million (Region F, 2015). The project required the installation of 43 wells and a 95 km, 1.2 m diameter pipeline to convey groundwater from the T-Bar Ranch, located outside the basin, to the city of Midland. Estimated unit costs for the project were USD 1.15 per m3 (2008 dollars) per acre-foot during amortization (first 20 years) and USD 0.28 per m3 after (2008 dollars) (Region F, 2010).
The use of existing supplies through voluntary transfers and subordination are unique to the middle region. Voluntary transfers are the temporary sale of surface or groundwater supply between users within the middle region. Following the drought, available supply from voluntary transfers was reduced by over 90 %. Subordination refers to junior water right holders in the middle region purchasing water from more senior downstream rights in the lower region. Under a strict priority system, junior middle-basin water rights would not be allowed to make diversions during a drought of record due to legal priority of senior downstream users. However, the middle and lower regions have historically cooperated to ensure adequate essential supply for junior (low-priority) middle-basin users in critical sectors (e.g., municipal and power) and anticipate continuing to do so in the future (Region F, 2020). However, estimated supply provided by subordination was reduced by 40 % following the drought due to reduced estimates of the firm (reliable) supply for the lower region.
Conservation strategies
Conservation is a key strategy in all the regional plans and was already a major strategy before the drought (Table 3). Conservation was proposed across all sectors, with the largest amounts for municipal and agricultural sectors. Our cost analysis found that conservation is often more costly than many existing supplies but is typically less expensive than developing new resources (Fig. 9).
Municipal conservation approaches include replacing water fixture efficiency, incentivizing low-water landscaping, implementing permanent watering schedules, improved metering, pipeline leak detection and repair, public outreach and education, customer engagement software (custom water use reports and water saving suggestions), and landscape standards for new development (Austin Water, 2018; Region K, 2020). The city of Austin has already implemented aggressive conservation measures, which have produced large, sustained reductions in per capita use (Fig. 10). In 2010, Austin's water utility published a plan to reduce per capita use to 529 L d−1 by 2020 (Austin Water, 2010). The drought served as an accelerator of this objective (Fig. 10). Per capita use fell to below 529 L d−1 in 2013, 7 years ahead of schedule, and the 76–113 L d−1 per capita reduction achieved during the drought has been sustained in the 5 years following the drought (2016–2020). Steep and lasting reductions in per capita use were achieved through an array of measures such as education, rebates for installation of drought-tolerant landscapes, new ordinances for irrigation systems in new developments, rate increases, and rebates for water-efficient fixtures (Austin Water, 2018).
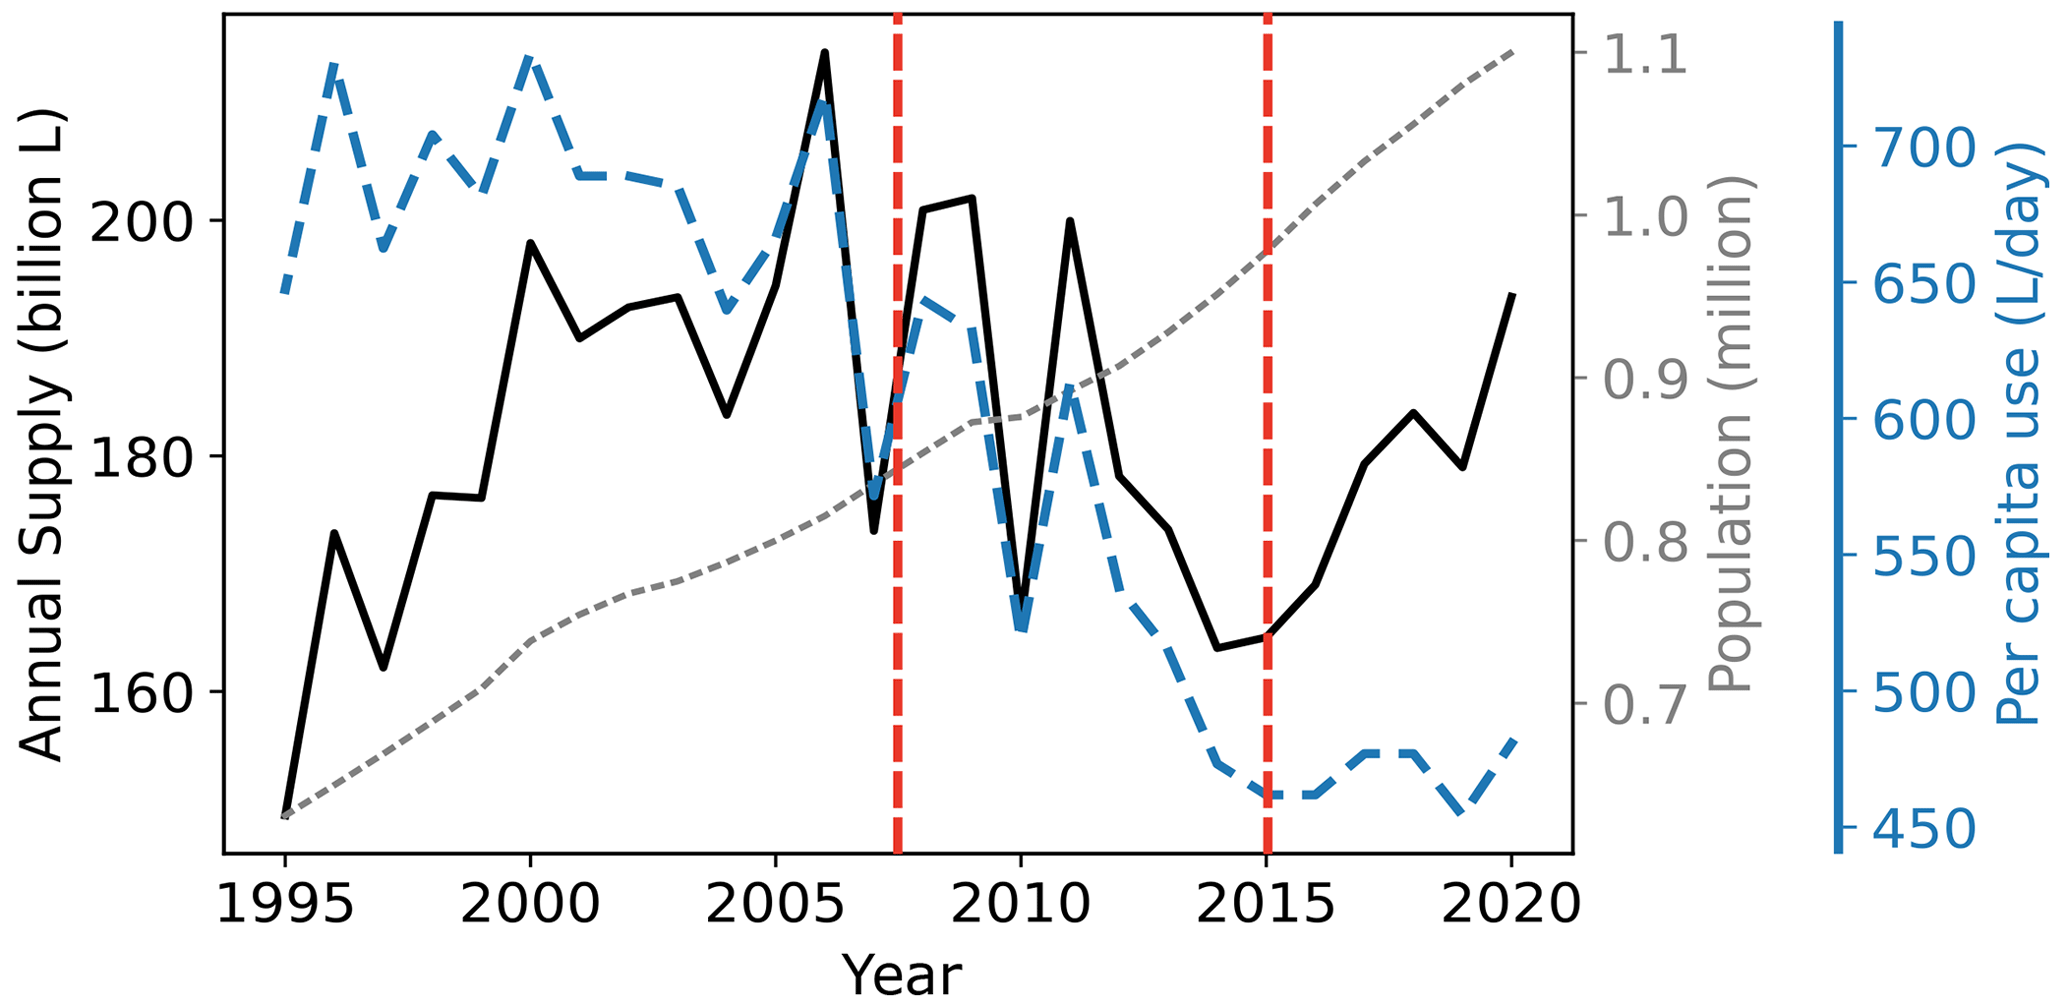
Figure 10Austin Water annual water use (black, solid), population (grey, dotted), and per capita water use (blue, dashed) from 1995 to 2020. Drought period shown by dashed red lines. Data: Austin Water (2022).
Agricultural irrigation conservation measures include lining canals, converting canals to pipelines, laser-leveling flood irrigation fields (primarily rice in the lower region), increased efficiency (conversion of flood to sprinkler and sprinkler to drip), and real-time metering and monitoring (supports more accurate billing and data to support conservation improvements) (Region F, 2020; Region K, 2020; Region O, 2020).
Temporary demand management measures were not unique to the lower region, but it is the only region where temporary demand management is treated as a source of supply to offset shortage during a repeated drought of record. Most temporary demand management efforts are aimed at reducing municipal outdoor use, which can be highly responsive to temporary reduction measures (Hogue and Pincetl, 2015). For example, outdoor water restrictions in the United States during drought have been shown to reduce residential water demand by ∼20 %–50 % (Gober and Quay, 2015; Mayer et al., 2015). Temporary demand management measures in the basin (limitations on frequency, timing, and method of outdoor water use) are implemented under pre-defined drought trigger thresholds such as reservoir storage thresholds (e.g., lower-region storage below 60 %) and peak daily municipal demand thresholds (e.g., 120 % of average daily demand) (Austin Water, 2016).
3.2.3 Other water management responses and planning innovations
Following the drought, the lower region, which is highly reliant on reservoir storage, implemented more stringent supply reduction triggers to conserve storage more aggressively during drought. Before the drought, available interruptible (non-guaranteed) supply was gradually reduced between reservoir storage thresholds of 70 % to 15 % capacity, and there were no restrictions to firm customers (Region K, 2010). Following the drought, operating rules were revised so that interruptible supplies can now be fully curtailed below 45 % capacity (Region K, 2020). Another major change is that lower-region municipal firm customers now have drought trigger thresholds at 70 % and 45 % storage capacity that require corresponding use reductions of 5 % and 10 %–20 % (Region K, 2020). Under a scenario worse than the drought of record, firm customers will be subject to a minimum 20 % reduction and are encouraged to use alternate supplies (e.g., groundwater) (Region K, 2020).
There were notable modeling capability improvements during and following the drought. The Lower Colorado River Authority (LCRA) who manages lower-region surface water supplies added new capabilities of their medium-range forecast model used to inform reservoir operations. New features include revised reservoir operating rules, modification of environmental flow requirements, and incorporation of El Niño–Southern Oscillation forecasts (Anderson and Walker, 2017). A model using the Distributed Hydrology Soil Vegetation Model (DHSVM; Wigmosta et al., 1994) is under development for the basin that can produce high-resolution naturalized flow inputs to either the official state Water Rights Analysis Package model (Wurbs, 2020) or the LCRA RiverWare (Zagona et al., 2001) operational model for water management modeling studies. The DHSVM will enable historically based drought of record analysis and future climate scenarios driven by downscaled global climate model inputs.
The record drought also prompted Austin to more rigorously evaluate the long-term security of its water supply. In 2014, the Austin Water Resource Planning Task Force recommended that the city perform its own independent assessment of water supply for the next 100 years (Austin Water, 2018). The task force recommended assessments occur on 5-year planning cycles, similar to the regional and state water planning cycles. The first long-term study for Austin was published in 2018 (Austin Water, 2018). A notable feature of the study is the incorporation of future climate uncertainty into the assessment of Austin's long-term water supply instead of the drought of record approach used in the state regional water planning.
Several state laws were passed, both during and following the drought, to improve water planning and drought response. In response to numerous threats to municipal supplies during 2011, the 2012 state legislature passed TAC 357.42(d) requiring each regional planning group to collect information on existing emergency water connections. The law mandates each region to create and maintain a database of emergency supply connections and the available supply volume of each connection. Before 2016, recommended water management strategies from previous regional plans were not tracked to determine their implementation status. Since 2016, the Texas Water Development Board (TWDB) has required each region to conduct a region-wide survey to track the implementation status of all water management strategies recommended in the previous plan. More recently, HB 807 (passed in 2019) is designed to increase regional cooperation in water planning and promote ASR by requiring all regional water plans to assess ASR as a strategy (Kramer et al., 2019). While there are currently only six active ASR sites in the state, two are in the lower region of the Colorado Basin and multiple new ASR projects were proposed in the 2016 and 2021 plans for the lower and middle regions (Table 3). HB 807 also requires the TWDB to create an Interregional Planning Council to improve coordination and share best practices between planning regions (Kramer et al., 2019).
3.3 Influence diagram of multisector dynamics during the drought of record
We developed an influence diagram to summarize the insights from our analysis presented in Sect. 3.1 and 3.2 (Fig. 11). The diagram shows the causal nature of cascading impacts that stem from the initial trigger of severe meteorological drought and highlights the highly multisectoral, interconnected nature of the drought impacts. The diagram is not intended to be exhaustive of all potential causal drought impacts and instead aims to capture the notable, basin-specific impacts and responses covered in this study. As a static illustration, the influence diagram does not provide information on the temporal nature (timing, frequency, duration) or severity of impacts. For example, some impacts occurred months into the drought (agriculture in early 2008), while others took years to develop (estuary impacts did not occur until 2011). Some were brief but intense (wildfire), and others were prolonged (reservoir drought from 2011 to 2015). The temporal dynamics and impact severity are described in the preceding Sect. 3.1 and 3.2.
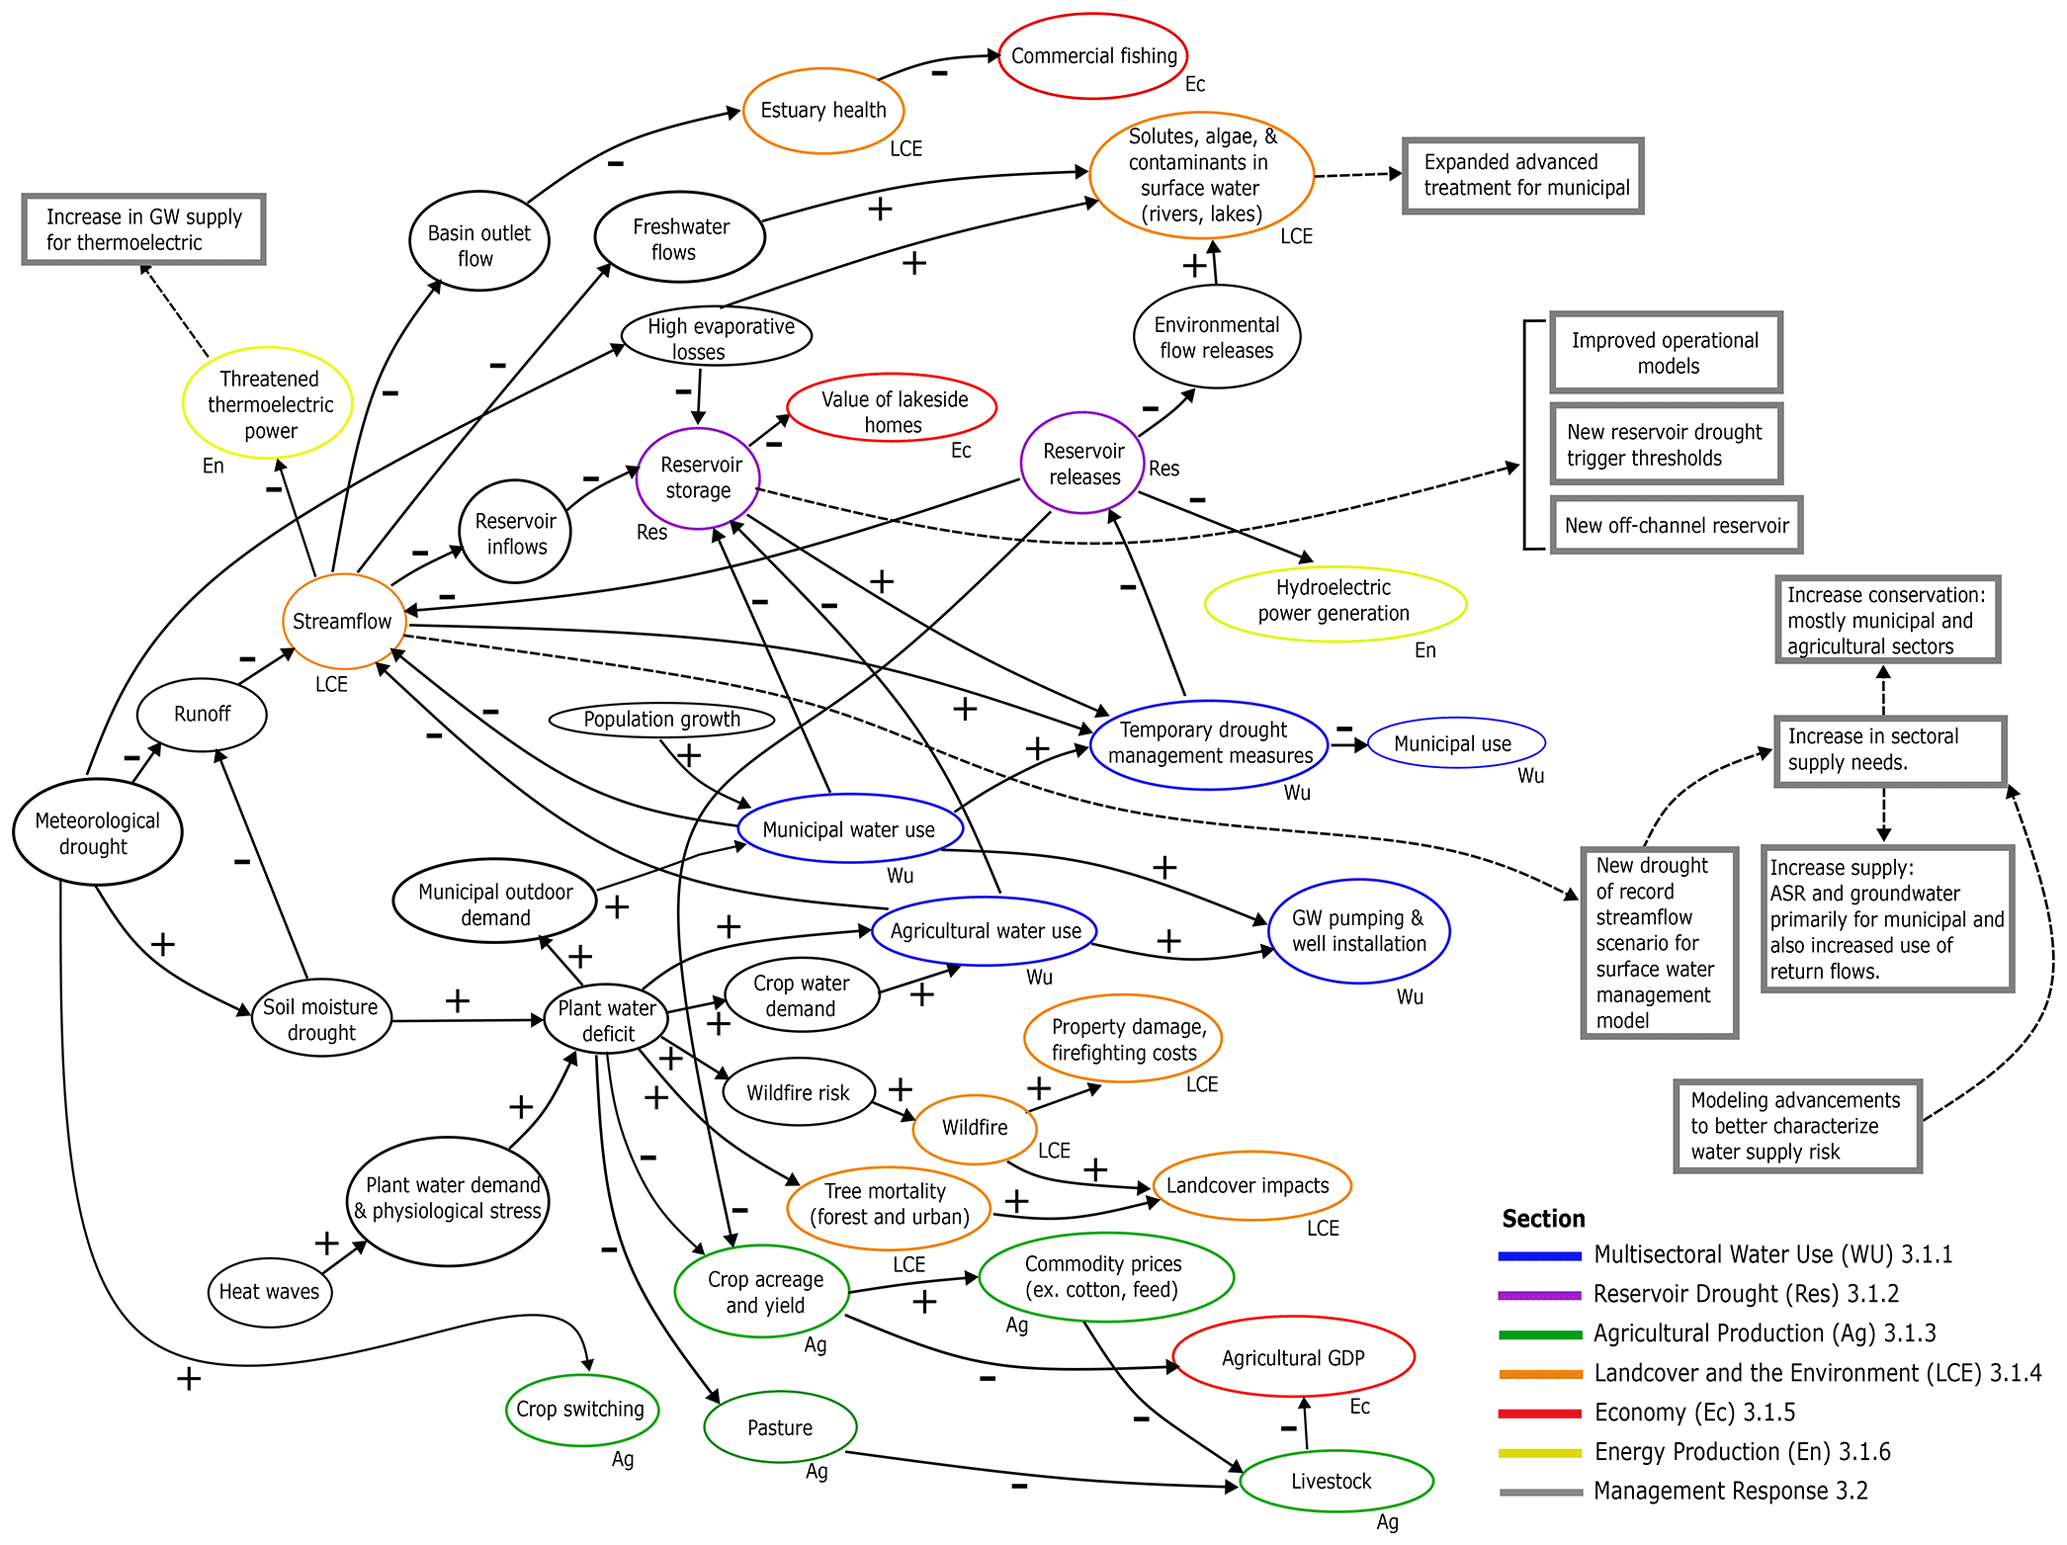
Figure 11Influence diagram describing multisector impacts and interactions during the drought. Arrows depict influence of upstream state variables on a downstream state variable and can be interpreted as connecting causes and effects. Plus (+) and minus (−) symbols denote the effect on the downstream state variable. Colors indicate multisector impacts identified in each of the corresponding sections. Squares represent management responses following the drought. Abbreviations for sections provided (e.g., Ec signifies economy) next to corresponding states. Drivers are not colored or labeled with an abbreviation, but impacts are.
The utility of the influence diagram is that it explicitly captures the interactions and multisectoral connections that may not be easily inferred from the text. For example, from the text alone it may not be apparent that reservoir drought was a nexus of sectoral interactions and what the specific upstream causes and downstream impacts were. The nodes are colored based on the sector that was affected – sectors can be the part of the human system or the natural environment. Not all nodes represent sectoral impacts and therefore are not colored. For example, wildfire impacts to land cover and the environment were the result of propagating (1) meteorological drought to (2) a soil moisture deficit that (3) produced a plant water deficit that (4) led to increased wildfire risk. The upstream nodes are important to the causal outcome of wildfire impacts but are not themselves sectoral impacts. Also summarized are the notable management responses that resulted from the drought. Some of the major drought impacts that motivated management changes were the severe reservoir drought and the impacts to streamflow, and these responses have clear downstream adaptive responses. An important response without a clear upstream driver was modeling advancements that helped better characterize future drought impacts; these were motivated by the collective and widespread impacts to water availability for human and environmental needs.
4.1 Insight into multisector dynamics during the severe drought
Drought impacts in coupled human–natural systems are often the result of cascading natural and human factors (Aghakouchak et al., 2021; Fig. 11). Some dynamics during severe drought can be expected to occur in any region, such as impacts to land cover due to the propagation of meteorological drought to soil moisture drought, reductions in groundwater recharge, or reductions in streamflow. However, as revealed in this study, the specific multisectoral impacts that result from drought are shaped by region-specific attributes of the human and natural system. Examples of impacts specific to the study basin are the water quality issues in the middle region resulting from groundwater solutes, curtailments of surface water irrigation supply in the lower region, or impacts to estuary health at the basin outlet. Whether drought hazards create significant harm to the human system depends on sectoral exposure and the available mechanisms (engineered or institutional) to mitigate the exposure to the given drought hazard. For example, in a region with agriculture, soil moisture drought has the potential to affect agricultural production, but access to surface water or groundwater can partially or entirely offset impacts. Our analysis showed that extensive irrigation helped partially offset the agricultural impacts in the Colorado Basin, Texas. However, as shown in Fig. 11, management decisions for one sector can reduce or increase impacts to other sectors or even the same sector in another location. An example of cross-sector impacts in the Colorado Basin is agricultural demand in the lower region hastening reservoir drought, which produced cascading impacts to municipal supply availability (triggering conservation measures) and reduced water availability for environmental flows.
A characteristic of drought impact propagation not captured in the influence diagram (Fig. 11), but highly relevant to the manifestation of sectoral impacts, is that some impacts do not occur until certain state thresholds are crossed. This means that there can be nonlinear or stepwise responses to upstream states. Examples of this are that reservoir release curtailments did not occur until specific trigger thresholds were crossed and adverse impacts to specific stream segments or the estuary did not occur until some minimum flow condition was crossed. Other impacts occur across a gradient of upstream state conditions, such as increasing severe and prolonged meteorological drought resulting in progressively more severe soil moisture deficits or progressively more irrigation required to meet plant water demand for agriculture or municipal irrigation.
Examples of commonly studied sectoral interactions during drought are energy–health, water–energy, energy–water, and water–food (Blauhut, 2020; de Brito, 2021; Hagenlocher et al., 2023; Yates et al., 2024). Our analysis revealed significant water–food impacts because of the harm to agricultural production (Figs. 5 and 11). Due to the direct dependence of vegetation health on soil moisture, agriculture is typically one of the earliest and most affected sectors with respect to meteorological drought (Van Loon, 2015). While water–food interactions affected agricultural production, domestic and global trade mitigated food–health impacts within the basin. Sectoral exposure and adaptive measures limited the impact of water–energy, energy–water, and energy–health impacts. For example, the pre-adaptation of thermoelectric power plants to lower-water-requirement technology reduced energy–water impacts as the power sector had a low water footprint (Fig. 3). The absence of significant negative water–energy interactions can be explained by the already mentioned low-water-use technology for thermoelectric power combined with hydropower being a minor source of energy in the basin. The rapid growth of renewable wind and solar energy during the drought also reduced negative water–energy and energy–water interactions. This is an example of how decarbonization and energy transitions can reduce water reliance and water supply vulnerability of the power sector (Byers et al., 2014; Zohrabian and Sanders, 2018). However, increased reliance on renewables can produce new vulnerabilities, such as periods of reduced wind speeds if a large fraction of regional supply is sourced from wind power (Wessel et al., 2022). Also of note, there were no major human health impacts reported during drought and heat waves – undoubtedly, a contributing factor was the absence of any significant water–energy impacts, which enabled the use of air conditioning during dangerous heat conditions. Finally, our analysis did not identify a widespread economic impact from the drought. Recent examples from California (Lund et al., 2018) and Australia (van Dijk et al., 2013), along with this study, demonstrate how modern economies are largely decoupled from the agricultural sector. Tubi (2020) terms this a shift from “climate sensitive” to “climate insensitive” economies.
4.2 Building a more resilient and sustainable water supply
Recent studies have examined the “reservoir effect” where regions with access to large reservoir storage can be prone to increased vulnerability to severe drought due to lack of supply diversification and lower incentivization for adaptive measures (Di Baldassarre et al., 2018; Garcia et al., 2019). The recent drought highlighted the vulnerability of the lower region due to its heavy reliance on surface water and reservoirs. The planned diversification of water supply sources following the drought shown by our analysis (Table 3) indicates efforts to reduce reliance on reservoirs. The middle region, because of its chronically depleted reservoirs, had already expanded its use of groundwater, including out-of-basin groundwater imports, and unconventional supplies (direct and indirect reuse) before the drought.
To mitigate the reliance on reservoir storage, and more generally surface water, strategies include increasing groundwater capacity and developing non-conventional water supply sources such as wastewater reuse, desalination, and ASR. Expanding groundwater capacity can offer a reliable supply for users confronted with more unpredictable surface water resources (Taylor et al., 2013). However, the location, scale, and frequency of groundwater use should be evaluated to ensure that it is sustainable and does not adversely impact surface water baseflows (de Graaf et al., 2019). Reuse has the benefit of creating additional supply close to the source of demand, low transmission costs, and low environmental impacts (Grant et al., 2012). Potable reuse may have less environmental impacts and is often cheaper in the unit cost compared to desalination (Hadjikakou et al., 2019). ASR enables storage of surface water during periods of plentiful supply for later use and has the added benefit that stored water is not lost to evaporation. However, ASR is still a developing technology and can have high abandonment rates due to a variety of issues such as well clogging, water quality, and insufficient recovery (Bloetscher et al., 2014). Managed aquifer recharge (MAR), which has been employed since the 1960s and has had significant growth over the last 30 years (Dillon et al., 2019), is a lower-risk alternative to ASR to improve groundwater sustainability.
Equally important to expanding supply is reducing demand. Demand management encompasses a wide range of actions intended to reduce water use, such as increasing efficiency, adopting or changing laws governing water use, and pricing strategies (rate-based), and is considered an essential component of water security (Cosgrove and Loucks, 2015). Conservation is often much cheaper than development of new alternative supplies (Cooley et al., 2019) and was found to be a major component of agricultural and municipal supplies in the basin (Table 3).
Finally, our water supply cost analysis (Fig. 9) showed that additional new supplies tend to be more costly than existing conventional sources, particularly low-cost surface water. The increased cost of new supplies can be accommodated and justified for municipal and industrial uses, but costs of unconventional sources may be prohibitive for agricultural use, where profit margins are slim (Hoppe, 2014). A common adaptive response to potential shortages in high-value sectors (municipal, industrial, energy) is to obtain supply from low-value uses, typically from agriculture (Flörke et al., 2018). This practice raises questions about its impacts on food security and regional agricultural production (Brown et al., 2019). Improved management and conservation efforts in the upper region will only slow the timeline to depletion (Scanlon et al., 2012), and large declines in irrigated acreage are anticipated by 2100 (Deines et al., 2020).
4.3 Limitations and future work
Limitations for our study are related to historical data availability and the depth of analysis of each sectoral impact. Much of the historical data were not available before the year 2000, preventing comparisons to impacts during previous droughts and the 1950s' drought of record. Diminishing quality and availability of historical data are likely an issue in many regions, which limits the number of severe drought events that can be evaluated as multisectoral case studies. Another data limitation is the temporal and spatial resolution of publicly available data. Most of the data were only available at annual temporal and county-level spatial resolution (Table 2). This prevented analysis of sub-annual drought impact dynamics, and the coarse spatial resolution prevented understanding the spatial heterogeneity of impacts, for example at the community or user level. Such limitations are discussed by Savelli et al. (2022), who point out that many impact indicators represent average values and thus limit the understanding of impact heterogeneity.
A challenge for this type of broad analysis that spans both impacts and management responses is distilling the most salient findings into an article-length text. This necessitated a high-level presentation of impacts and responses. Indeed, many of the individual sectors or impacts are often the subject of their own in-depth studies. The utility of this type of analysis is capturing the key multisector dynamics and their interactions within the study region, which can motivate focused follow-on studies looking more closely at specific sectoral interactions. Future work can involve applying a similar approach for other drought events in other regions. Building out a corpus of multisectoral drought impact analyses would improve understanding of how regional characteristics (sectors, hydrology, management, infrastructure) produce certain drought impact typologies and sectoral interactions, which would aid the development of proactive adaptation measures targeted at reducing drought vulnerability across all sectors.
We found that the drought produced a wide array of environmental impacts, significantly harmed agriculture, threatened water supplies and triggered drought conservation measures, and had lasting effects on water planning and management. Water supply infrastructure (reservoirs, pipelines, canals, and wells) and temporary demand management responses were key for averting severe shortages to non-agricultural sectors. We demonstrate the use of an influence diagram as an effective tool for summarizing cascading regional multisectoral impacts and interactions. Insight into the connectivity between impacts can support adaptative planning and help reduce the vulnerability of negative cascades in other regions (Lawrence et al., 2020). Our evaluation of regional water management plans revealed that the drought substantively affected water management planning with large increases in the variety of water supply strategies (supply diversification) and planned municipal supply volume. There is no “silver bullet” water management solution for the basin like building a large new reservoir. Instead, a mosaic of supply and demand management strategies are needed to achieve long-term water security. Evidence of proactive changes to water management and planning following the drought of record includes the development of more sophisticated water supply planning models, the enactment of more conservative drought management policies, and the passing of several new laws that regulate water planning. However, the difficult task of implementing the expensive water supply projects (over USD 6 billion in 2022 dollars) is largely yet to be accomplished.
Water planning faces deep uncertainty about future demand (sectors, location, quantity) and availability of supply, and it is therefore imperative that both technical and institutional management approaches evolve as better data and modeling techniques become available. We feel this study offers a “blueprint” that can be followed by future regional drought analyses. Our hope is that this work will inspire other comprehensive, multisectoral drought impact studies that improve understanding of how regional nuances in climate, hydrology, ecosystems, institutional management, water supply infrastructure, and sectoral demand lead to specific drought impacts and how these factors influence adaptive planning.
The Python scripts for processing and plotting the data presented in the figures are available at https://doi.org/10.5281/zenodo.11224908 (Ferencz, 2024).
All data presented were obtained from publicly available sources. All data presented in the text and Supplement figures are available at https://doi.org/10.5281/zenodo.11224908 (Ferencz, 2024).
The supplement related to this article is available online at: https://doi.org/10.5194/nhess-24-1871-2024-supplement.
SBF, SWDT, NS, and JSR conceived the idea for the study. SBF performed the data curation and formal analysis. SBF wrote the manuscript draft. SBF, NS, SWDT, BAS, and JSR reviewed and edited the manuscript.
The contact author has declared that none of the authors has any competing interests.
Publisher’s note: Copernicus Publications remains neutral with regard to jurisdictional claims made in the text, published maps, institutional affiliations, or any other geographical representation in this paper. While Copernicus Publications makes every effort to include appropriate place names, the final responsibility lies with the authors.
This article is part of the special issue “Drought, society, and ecosystems (NHESS/BG/GC/HESS inter-journal SI)”. It is not associated with a conference.
This research was supported by the U.S. Department of Energy, Office of Science, as part of the research in the MultiSector Dynamics, Earth and Environmental System Modeling program. Pacific Northwest National Laboratory is a multi-program national laboratory operated by Battelle for the U.S. Department of Energy under contract DE-AC05-76RL01830.
This research has been supported by the U.S. Department of Energy (MultiSector Dynamics, Earth and Environmental System Modeling program – grant no. 59534).
This paper was edited by Gemma Coxon and reviewed by Rishma Chengot and one anonymous referee.
AghaKouchak, A., Mirchi, A., Madani, K., Di Baldassarre, G., Nazemi, A., Alborzi, A., Anjileli, H., Azarderakhsh, M., Chiang, F., Hassanzadeh, E., Huning, L. S., Mallakpour, I., Martinez, A., Mazdiyasni, O., Moftakhari, H., Norouzi, H., Sadegh, M., Sadeqi, D., Van Loon, A. F., and Wanders, N.: Anthropogenic Drought: Definition, Challenges, and Opportunities, Rev. Geophys., 59, e2019RG000683, https://doi.org/10.1029/2019RG000683, 2021.
Ahmadi, B. and Moradkhani, H.: Revisiting hydrological drought propagation and recovery considering water quantity and quality, Hydrol. Process., 33, 1492–1505, https://doi.org/10.1002/hyp.13417, 2019.
Alley, W. M.: The Palmer Drought Severity Index – Limitations and Assumptions, J. Clim. Appl. Meteorol., 23, 1100–1109, 1984.
Anderson, R. and Walker, D.: Ten years of stochastic water supply modeling by Lower Colorado River Authority of Texas, J. Water Manage. Model., 26, C432, https://doi.org/10.14796/JWMM.C432, 2017.
Anderson, D. P., Welch, J. M., and Robinson, J.: Agricultural Impacts of Texas's Driest Year on Record, Choices AAEA, 27, 1–4, 2012.
Austin Water: 140 GPCD Conservation Plan, 68 pp., https://www.austintexas.gov/edims/document.cfm?id=148212 (last access: 14 August 2023), 2010.
Austin Water: City of Austin Drought Contingency Plan, https://www.austintexas.gov/sites/default/files/files/Water/Conservation/Planning_and_Policy/2016DroughtContingencyPlan.pdf (last access: 14 August 2023), 2016.
Austin Water: Water Forward Integrated Water Resource Plan, 494 pp., https://www.austintexas.gov/department/water-forward (last access: 14 August 2022), 2018.
Austin Water: Total Gallons of Water Pumped per Capita per Day, https://data.austintexas.gov/Utilities-and-City-Services/Total-Gallons-of-Water-Pumped-per-Capita-per-Day-G/cr3t-b72z (last access: 8 April 2022), 2022.
Beversdorf, L. J., Miller, T. R., and McMahon, K. D.: The Role of Nitrogen Fixation in Cyanobacterial Bloom Toxicity in a Temperate, Eutrophic Lake, Plos One, 8, e5610, https://doi.org/10.1371/journal.pone.0056103, 2013.
Biemans, H., Haddeland, I., Kabat, P., Ludwig, F., Hutjes, R. W. A., Heinke, J., von Bloh, W., and Gerten, D.: Impact of reservoirs on river discharge and irrigation water supply during the 20th century, Water Resour. Res., 47, W03509, https://doi.org/10.1029/2009WR008929, 2011.
Blauhut, V.: The triple complexity of drought risk analysis and its visualisation via mapping: a review across scales and sectors, Earth-Sci. Rev., 210, 103345, https://doi.org/10.1016/j.earscirev.2020.103345, 2020.
Bloetscher, F., Sham, C. H., Danko III, J. J., and Ratick, S.: Lessons Learned from Aquifer Storage and Recovery (ASR) Systems in the United States, J. Water Resour. Prot., 6, 1603–1629, https://doi.org/10.4236/jwarp.2014.617146, 2014.
Brodribb, T. J., Powers, J., Cochard, H., and Choat, B.: Hanging by a thread? Forests and drought, Science, 368, 261–266, https://doi.org/10.1126/science.aat7631, 2020.
Brown, T. C., Mahat, V., and Ramirez, J. A.: Adaptation to Future Water Shortages in the United States Caused by Population Growth and Climate Change, Earths Future, 7, 219–234, https://doi.org/10.1029/2018ef001091, 2019.
Bureau of Economic Analysis (BEA): Regional Data GDP and Personal Income, https://apps.bea.gov/itable/?ReqID=70&step=1&acrdn=5 (last access: 25 August 2022), 2022.
Byers, E. A., Hall, J. W., and Amezaga, J. M.: Electricity generation and cooling water use: UK pathways to 2050, Global Environ. Chang., 25, 16–30, https://doi.org/10.1016/j.gloenvcha.2014.01.005, 2014.
Caldwell, T. J., Rossi, G. J., Henery, R. E., and Chandra, S.: Decreased streamflow impacts fish movement and energetics through reductions to invertebrate drift body size and abundance, River Res. Appl., 34, 965–976, https://doi.org/10.1002/rra.3340, 2018.
Cayan, D. R., Das, T., Pierce, D. W., Barnett, T. P., Tyree, M., and Gershunov, A.: Future dryness in the southwest US and the hydrology of the early 21st century drought, P. Natl. Acad. Sci. USA, 107, 21271–21276, https://doi.org/10.1073/pnas.0912391107, 2010.
Cook, B. I., Mankin, J. S., and Anchukaitis, K. J.: Climate Change and Drought: From Past to Future, Curr. Clim. Change Rep., 4, 164–179, https://doi.org/10.1007/s40641-018-0093-2, 2018.
Cooley, H., Phurisamban, R., and Gleick, P.: The cost of alternative urban water supply and efficiency options in California, Environ. Res. Commun., 1, 042001, https://doi.org/10.1088/2515-7620/ab22ca, 2019.
Collins K. and Bulut H.: 2011 Year in Review, Crop Insurance America, https://ageconsearch.umn.edu/record/160510/files/2011 Year in Review FINAL.pdf (last access: 20 May 2024), 2012.
Cosgrove, W. J. and Loucks, D. P.: Water management: Current and future challenges and research directions, Water Resour. Res., 51, 4823–4839, https://doi.org/10.1002/2014wr016869, 2015.
Countryman, A. M., Paarlberg, P. L., and Lee, J. G.: Dynamic Effects of Drought on the U.S. Beef Supply Chain, Agricultural and Resource Economics Review, 45, 459–484, https://doi.org/10.1017/age.2016.4, 2016.
Crouchet, S. E., Jensen, J., Schwartz, B. F., and Schwinning, S.: Tree Mortality After a Hot Drought: Distinguishing Density-Dependent and – Independent Drivers and Why It Matters, Front For. Glob. Chang., 2, https://doi.org/10.3389/ffgc.2019.00021, 2019.
de Brito, M. M.: Compound and cascading drought impacts do not happen by chance: A proposal to quantify their relationships, Sci. Total Environ., 778, 146236, https://doi.org/10.1016/j.scitotenv.2021.146236, 2021.
de Graaf, I. E. M., Gleeson, T., van Beek, L. P. H., Sutanudjaja, E. H., and Bierkens, M. F. P.: Environmental flow limits to global groundwater pumping, Nature, 574, 90–94, https://doi.org/10.1038/s41586-019-1594-4, 2019.
Deines, J. M., Schipanski, M. E., Golden, B., Zipper, S. C., Nozari, S., Rottler, C., Guerrero, B., and Sharda, V.: Transitions from irrigated to dryland agriculture in the Ogallala Aquifer: Land use suitability and regional economic impacts, Agr. Water Manage., 233, 106061, https://doi.org/10.1016/j.agwat.2020.106061, 2020.
Di Baldassarre, G., Wanders, N., AghaKouchak, A., Kuil, L., Rangecroft, S., Veldkamp, T. I. E., Garcia, M., van Oel, P. R., Breinl, K., and Van Loon, A. F.: Water shortages worsened by reservoir effects, Nat. Sustain., 1, 617–622, https://doi.org/10.1038/s41893-018-0159-0, 2018.
Dillon, P., Stuyfzand, P., Grischek, T., Lluria, M., Pyne, R. D. G., Jain, R. C., Bear, J., Schwarz, J., Wang, W., Fernandez, E., Stefan, C., Pettenati, M., van der Gun, J., Sprenger, C., Massmann, G., Scanlon, B. R., Xanke, J., Jokela, P., Zheng, Y., Rossetto, R., Shamrukh, M., Pavelic, P., Murray, E., Ross, A., Valverde, J. P. B., Nava, A. P., Ansems, N., Posavec, K., Ha, K., Martin, R., and Sapiano, M.: Sixty years of global progress in managed aquifer recharge, Hydrogeol. J., 27, 1–30, https://doi.org/10.1007/s10040-018-1841-z, 2019.
Energy Information Administration (EIA): Electricity Data Browser, https://www.eia.gov/electricity/data/browser/ (last access: 22 November 2022), 2022.
Ferencz, S.: IMMM-SFA/ferencz_et_al_2024_NHESS: Ferencz_et_al_2024_NHESS_plotting_and_analysis_FINAL (Version V2), Zenodo [code and data set], https://doi.org/10.5281/zenodo.11224908, 2024.
Fisher, M., Abate, T., Lunduka, R. W., Asnake, W., Alemayehu, Y., and Madulu, R. B.: Drought tolerant maize for farmer adaptation to drought in sub-Saharan Africa: Determinants of adoption in eastern and southern Africa, Climatic Change, 133, 283–299, https://doi.org/10.1007/s10584-015-1459-2, 2015.
Flörke, M., Schneider, C., and McDonald, R. I.: Water competition between cities and agriculture driven by climate change and urban growth, Nat. Sustain., 1, 51–58, https://doi.org/10.1038/s41893-017-0006-8, 2018.
Gamez, T. E., Benton, L., and Manning, S. R.: Observations of two reservoirs during a drought in central Texas, USA: Strategies for detecting harmful algal blooms, Ecol. Indic., 104, 588–593, https://doi.org/10.1016/j.ecolind.2019.05.022, 2019.
Garcia, M., Koebele, E., Deslatte, A., Ernst, K., Manago, K. F., and Treuer, G.: Towards urban water sustainability: Analyzing management transitions in Miami, Las Vegas, and Los Angeles, Global Environ. Chang., 58, 101967, https://doi.org/10.1016/j.gloenvcha.2019.101967, 2019.
Gober, P. and Quay, R.: Harnessing urban water demand: Lessons from North America, in: The Routledge handbook of urbanization and global environmental change, edited by: Seto, K. C., Solecki, W. D., and Griffith, C. A., 93–105, Routledge, Abingdon, UK, https://doi.org/10.4324/9781315849256, 2015.
Glotter, M. and Elliott, J.: Simulating US agriculture in a modern Dust Bowl drought, Nat. Plants, 3, 16193, https://doi.org/10.1038/nplants.2016.193, 2016.
Grant, S. B., Saphores, J.-D., Feldman, D. L., Hamilton, A. J., Fletcher, T. D., Cook, P. L., Stewardson, M., Sanders, B. F., Levin, L. A., and Ambrose, R. F.: Taking the “waste” out of “wastewater” for human water security and ecosystem sustainability, Science, 337, 681–686, https://doi.org/10.1126/science.1216852, 2012.
Gupta, A., Rico-Medina, A., and Cano-Delgado, A. I.: The physiology of plant responses to drought, Science, 368, 266–269, https://doi.org/10.1126/science.aaz7614, 2020.
Hadjikakou, M., Stanford, B. D., Wiedmann, T., Rowley, H. V., Kobayashi, Y., Ishii, S., Gaitan, J. P. A, Johns, G., Lundie, S., and Khan, S. J.: A flexible framework for assessing the sustainability of alternative water supply options, Sci. Total Environ., 671, 1257–1268, https://doi.org/10.1016/j.scitotenv.2019.03.288, 2019.
Hagenlocher, M., Naumann, G., Meza, I., Blauhut, V., Cotti, D., Döll, P., Ehlert, K., Gaupp, F., Van Loon, A. F., Marengo, J. A., Rossi, L., Siemons, A. S. S., Siebert, S., Tsehayu, A. T., Toreti, A., Tsegai, D., Vera, C., Vogt, J., and Wens, M.: Tackling Growing Drought Risks-The Need for a Systemic Perspective, Earths Future, 11, e2023EF003857, https://doi.org/10.1029/2023EF003857, 2023.
Hoppe, R. A.: Structure and finances of U.S. farms: Family farm report, 2014 edition, Econ. Inform. Bull. (no. 132), Economic Research Service, U.S. Department of Agriculture, https://www.ers.usda.gov/publications/pub-details/?pubid=43916 (last access: 20 May 2024), 2014.
Hogue, T. S. and Pincetl, S.: Are you watering your lawn?, Science, 348, 1319–1320, https://doi.org/10.1126/science.aaa6909, 2015.
Howard, R. A. and Matheson, J. E.: Influence diagrams, Decis. Anal., 2, 127–143, 2005.
Jones, E. and van Vliet, M. T. H.: Drought impacts on river salinity in the southern US: Implications for water scarcity, Sci. Total Environ., 644, 844–853, https://doi.org/10.1016/j.scitotenv.2018.06.373, 2018.
Klockow, P. A., Vogel, J. G., Edgar, C. B., and Moore, G. W.: Lagged mortality among tree species four years after an exceptional drought in east Texas, Ecosphere, 9, e02455, https://doi.org/10.1002/ecs2.2455, 2018.
Konrad, C. P., Brasher, A. M. D., and May, J. T.: Assessing streamflow characteristics as limiting factors on benthic invertebrate assemblages in streams across the western United States, Freshwater Biol., 53, 1983–1998, https://doi.org/10.1111/j.1365-2427.2008.02024.x, 2008.
Kramer, K., Mullins, C., Robbins, D., Steinbach, S. A., Martinsson, L., Hightower, T., and Fowler, P. L.: Commentary: 86th Texas State Legislature: Summaries of Water-related Legislative Action, Texas Water J., 10, 75–100, https://doi.org/10.21423/twj.v10i1.7100, 2019.
Kuria, F. W. and Vogel, R. M.: A global water supply reservoir yield model with uncertainty analysis, Environ. Res. Lett., 9, 095006, https://doi.org/10.1088/1748-9326/9/9/095006, 2014.
Kuwayama, Y., Thompson, A., Bernknopf, R., Zaitchik, B., and Vail, P.: Estimating the Impact of Drought on Agriculture Using the Us Drought Monitor, Am. J. Agr. Econ., 101, 193–210, https://doi.org/10.1093/ajae/aay037, 2019.
Lal, R., Delgado, J. A., Gulliford, J., Nielsen, D., Rice, C. W., and Van Pelt, R. S.: Adapting agriculture to drought and extreme events, J. Soil Water Conserv., 67, 162a–166a, https://doi.org/10.2489/jswc.67.6.162A, 2012.
Lawrence, J., Blackett, P., and Cradock-Henry, N. A.: Cascading climate change impacts and implications, Climate Risk Management, 29, 100234, https://doi.org/10.1016/j.crm.2020.100234, 2020.
Littell, J. S., Peterson, D. L., Riley, K. L., Liu, Y. Q., and Luce, C. H.: A review of the relationships between drought and forest fire in the United States, Glob. Change Biol., 22, 2353–2369, https://doi.org/10.1111/gcb.13275, 2016.
LCRA: Historical Water Use Summary, https://www.lcra.org/water/water-supply-planning/water-use-summary/, last access: 20 December 2022.
Lund, J., Medellin-Azuara, J., Durand, J., and Stone, K.: Lessons from California's 2012–2016 Drought, J. Water Res. Plan. Man., 144, 04018067, https://doi.org/10.1061/(Asce)Wr.1943-5452.0000984, 2018.
Lund, J. R.: Droughts and the global economy: Lessons from California: Harvard College Review of Environment and Society: Running dry, weathering the great California drought, https://issuu.com/harvarduniversityreviewofenvironmen/docs/hcres_2016 (last access: 20 May 2024), 2016.
Marston, L. and Konar, M.: Drought impacts to water footprints and virtual water transfers of the Central Valley of California, Water Resour. Res., 53, 5756–5773, https://doi.org/10.1002/2016wr020251, 2017.
Mayer, P., Lander, P., and Glenn, D. T.: Outdoor water efficiency offers large potential savings, but research on effectiveness remains scarce, J. Am. Water Works Ass., 107, 61–66, 2015.
Moore, G. W., Edgar, C. B., Vogel, J. G., Washington-Allen, R. A., March, O. G., and Zehnder, R.: Tree mortality from an exceptional drought spanning mesic to semiarid ecoregions, Ecol. Appl., 26, 602–611, https://doi.org/10.1890/15-0330, 2016.
Morris, B.: Lake-area homes and lake water levels, https://billmorrisrealtor.blog/2019/07/02/lake-area-homes-and-lake-water-levels/ (last access: 8 August 2023), 2019.
Mosley, L. M.: Drought impacts on the water quality of freshwater systems; review and integration, Earth-Sci. Rev., 140, 203–214, https://doi.org/10.1016/j.earscirev.2014.11.010, 2015.
National Oceanic and Atmospheric Administration (NOAA): Storm Events Database, https://www.ncdc.noaa.gov/stormevents (last access: 15 May 2022), 2022.
NASA: NASA DEVELOP Analyzes Drought Impacts on Urban Tree Recovery in Texas, https://www.drought.gov/news/nasa-develop-analyzes-drought-impacts-urban-tree-recovery-texas (last access: 14 August 2023), 2019.
Naumann, G., Cammalleri, C., Mentaschi, L., and Feyen, L.: Increased economic drought impacts in Europe with anthropogenic warming, Nat. Clim. Change, 11, 485–491, https://doi.org/10.1038/s41558-021-01044-3, 2021.
Nielsen-Gammon, J. W.: The 2011 Texas Drought, The Texas Water Journal, 3, 59–95, https://doi.org/10.21423/twj.v3i1.6463, 2012.
Nielsen-Gammon, J. W. and McRoberts, B.: An assessment of the meteorological severity of the 2008–09 Texas drought through July 2009, Office of the State Climatologist, Texas, Publication OSC-0901, 24 pp., https://hdl.handle.net/1969.1/158247 (last access: 20 May 2024), 2009.
O'Connell, Voisin, N., Macknick, and Fu: Sensitivity of Western US power system dynamics to droughts compounded with fuel price variability, Appl. Energ., 247, 745–754, https://doi.org/10.1016/j.apenergy.2019.01.156, 2019.
Palmer, W.: Meteorological Drought, Technical Report, Weather Bureau Research Paper 45, US Department of Commerce, https://www.droughtmanagement.info/literature/USWB_Meteorological_Drought_1965.pdf (last access: 20 May 2024), 1965.
Region F.: 2010. 2011 Region F Water Plan, 501 pp., https://www.twdb.texas.gov/waterplanning/rwp/regions/f/index.asp (last access: 20 May 2024), 2010.
Region F: 2015. 2016 Region F Water Plan, 607 pp., https://www.twdb.texas.gov/waterplanning/rwp/regions/f/index.asp (last access: 21 May 2024), 2015.
Region F: 2020. 2021 Region F Water Plan, 450 pp., https://www.twdb.texas.gov/waterplanning/rwp/regions/f/index.asp (last access: 21 May 2024), 2020.
Region K: 2010. 2011 Region K Water Plan, 1341 pp., https://www.twdb.texas.gov/waterplanning/rwp/regions/k/index.asp (last access: 21 May 2024), 2010.
Region K: 2015. 2016 Region K Water Plan, 2018 pp., https://www.twdb.texas.gov/waterplanning/rwp/regions/k/index.asp (last access: 21 May 2024), 2015.
Region K: 2021 Region K Water Plan, 1425 pp., https://www.twdb.texas.gov/waterplanning/rwp/regions/k/index.asp (last access: 21 May 2024), 2020.
Region O: 2010. Llano Estacado Regional Water Planning Area Regional Water Plan, 916 pp., https://www.twdb.texas.gov/waterplanning/rwp/regions/o/index.asp (last access: 21 May 2024), 2010.
Region O: 2015. Llano Estacado (Region O) 2016 Regional Water Water Plan, 10535 pp., https://www.twdb.texas.gov/waterplanning/rwp/regions/o/index.asp (last access: 21 May 2024), 2015.
Region O: 2020. 2021 Llano Estacado Regional Water Plan, 1051 pp., https://www.twdb.texas.gov/waterplanning/rwp/regions/o/index.asp (last access: 21 May 2024), 2020.
Sarhadi, A., Ausin, M. C., Wiper, M. P., Touma, D., and Diffenbaugh, N. S.: Multidimensional risk in a nonstationary climate: Joint probability of increasingly severe warm and dry conditions, Sci. Adv., 4, eaau3487, https://doi.org/10.1126/sciadv.aau3487, 2018.
Savelli, E., Rusca, M., Cloke, H., and Di Baldassarre, G.: Drought and society: Scientific progress, blind spots, and future prospects, Wires Clim. Change, 13, e761, https://doi.org/10.1002/wcc.761, 2022.
Scanlon, B. R., Faunt, C. C., Longuevergne, L., Reedy, R. C., Alley, W. M., McGuire, V. L., and McMahon, P. B.: Groundwater depletion and sustainability of irrigation in the US High Plains and Central Valley, P. Natl. Acad. Sci. USA, 109, 9320-9325, https://doi.org/10.1073/pnas.1200311109, 2012.
Scanlon, B. R., Duncan, I., and Reedy, R. C.: Drought and the water-energy nexus in Texas, Environ. Res. Lett., 8, 045033, https://doi.org/10.1088/1748-9326/8/4/045033, 2013a.
Scanlon, B. R., Reedy, R. C., Duncan, I., Mullican, W. F., and Young, M.: Controls on Water Use for Thermoelectric Generation: Case Study Texas, US, Environ. Sci. Technol., 47, 11326–11334, https://doi.org/10.1021/es4029183, 2013b.
Schewe, J., Heinke, J., Gerten, D., Haddeland, I., Arnell, N. W., Clark, D. B., Dankers, R., Eisner, S., Fekete, B. M., Colon-Gonzalez, F. J., Gosling, S. N., Kim, H., Liu, X. C., Masaki, Y., Portmann, F. T., Satoh, Y., Stacke, T., Tang, Q. H., Wada, Y., Wisser, D., Albrecht, T., Frieler, K., Piontek, F., Warszawski, L., and Kabat, P.: Multimodel assessment of water scarcity under climate change, P. Natl. Acad. Sci. USA, 111, 3245–3250, https://doi.org/10.1073/pnas.1222460110, 2014.
Schwantes, A. M., Swenson, J. J., Gonzalez-Roglich, M., Johnson, D. M., Domec, J. C., and Jackson, R. B.: Measuring canopy loss and climatic thresholds from an extreme drought along a fivefold precipitation gradient across Texas, Glob. Change Biol., 23, 5120–5135, https://doi.org/10.1111/gcb.13775, 2017.
Shachter, R. D.: Evaluating Influence Diagrams, Oper. Res., 34, 871–882, https://doi.org/10.1287/opre.34.6.871, 1986.
Shah, D., Zhao, G., Li, Y., Singh, V. P., and Gao, H.: Assessing global reservoir-based hydrological droughts by fusing storage and evaporation, Geophys. Res. Lett., 51, e2023GL106159, https://doi.org/10.1029/2023GL106159, 2024.
Smith, B. A.: Drought Trigger Methodology for the Barton Springs Aquifer, Travis and Hays Counties, Texas, Barton Springs/Edwards Aquifer Conservation District, https://bseacd.org/2014/07/drought-trigger-methodology-for-the-barton-springs-aquifer-travis-and-hays/ (last access: 21 May 2024), 2013.
Smith, B. A., Hunt, B. B., Andrews, A. G., Watson, J. A., Gary, M. O., Wierman, D. A., and Broun, A. S.: Surface water-groundwater interactions along the Blanco River of central Texas, USA, Environ. Earth Sci., 74, 7633–7642, https://doi.org/10.1007/s12665-015-4630-1, 2015.
Stahl, K., Kohn, I., Blauhut, V., Urquijo, J., De Stefano, L., Acácio, V., Dias, S., Stagge, J. H., Tallaksen, L. M., Kampragou, E., Van Loon, A. F., Barker, L. J., Melsen, L. A., Bifulco, C., Musolino, D., de Carli, A., Massarutto, A., Assimacopoulos, D., and Van Lanen, H. A. J.: Impacts of European drought events: insights from an international database of text-based reports, Nat. Hazards Earth Syst. Sci., 16, 801–819, https://doi.org/10.5194/nhess-16-801-2016, 2016.
Stocker, B. D., Zscheischler, J., Keenan, T. F., Prentice, I. C., Seneviratne, S. I., and Penuelas, J.: Drought impacts on terrestrial primary production underestimated by satellite monitoring, Nat. Geosci., 12, 264–270, https://doi.org/10.1038/s41561-019-0318-6, 2019.
Taylor, R. G., Scanlon, B., Doll, P., Rodell, M., van Beek, R., Wada, Y., Longuevergne, L., Leblanc, M., Famiglietti, J. S., Edmunds, M., Konikow, L., Green, T. R., Chen, J. Y., Taniguchi, M., Bierkens, M. F. P., MacDonald, A., Fan, Y., Maxwell, R. M., Yechieli, Y., Gurdak, J. J., Allen, D. M., Shamsudduha, M., Hiscock, K., Yeh, P. J. F., Holman, I., and Treidel, H.: Ground water and climate change, Nat. Clim. Change, 3, 322–329, https://doi.org/10.1038/Nclimate1744, 2013.
Texas A&M Forest Service: 2011 Texas Wildfires Common Denominators of Home Destruction, 52 pp., https://wildfiretoday.com/documents/Texas Wildfires report 2011.pdf (last access: 21 May 2024), 2011.
Texas Commission on Environmental Quality (TCEQ): Surface Water Quality Web Reporting Tool, https://www80.tceq.texas.gov/SwqmisPublic/index.htm (last access: 31 May 2023), 2023.
Texas Standard: Looking Back On 10 Years Since Bastrop Fire, And What Central Texas Is Doing to Mitigate Future Disasters, https://www.texasstandard.org/stories/ (last access: 14 August 2023), 2021.
Texas Water Development Board (TWDB): Studies to Evaluate Achievement of Freshwater Inflow Standards and Ecological Response Final Report, https://www.twdb.texas.gov/publications/reports/contracted_reports/doc/1400011715_Matagorda&Lavaca.pdf (last access: 21 May 2024), 2015.
Texas Water Development Board (TWDB): 2017 State Water Plan, 150 pp., https://www.twdb.texas.gov/waterplanning/swp/2017/index.asp (last access: 21 May 2024), 2017.
Texas Water Development Board (TWDB): 2022 State Water Plan, 202 pp., https://www.twdb.texas.gov/waterplanning/swp/2022/index.asp (last access: 21 May 2024), 2022a.
Texas Water Development Board (TWDB): Drought in Texas: A Comparison of the 1950–1957 and 2010–2015 Droughts, 101 pp., https://www.twdb.texas.gov/publications/reports/other_reports/ (last access: 21 May 2024), 2022b.
Texas Water Development Board (TWDB): Texas Reservoirs: Monitored Water Supply Reservoirs, https://waterdatafortexas.org/reservoirs/statewide (last access: 21 November 2023), 2022c.
Texas Water Development Board (TWDB): County Well Reports, https://www3.twdb.texas.gov/apps/reports/SDR/WellRpts_County_Use (last access: 2 August 2022), 2022d.
Texas Water Development Board (TWDB): GIS Data, https://www.twdb.texas.gov/mapping/gisdata.asp (last access: 27 April 2023), 2023a.
Texas Water Development Board (TWDB): Historical Water Use Estimates, https://www.twdb.texas.gov/waterplanning/waterusesurvey/estimates/index.asp (last access: 27 April 2023), 2023b.
Trenberth, K. E., Dai, A. G., van der Schrier, G., Jones, P. D., Barichivich, J., Briffa, K. R., and Sheffield, J.: Global warming and changes in drought, Nat. Clim. Change, 4, 17–22, https://doi.org/10.1038/Nclimate2067, 2014.
Tubi, A.: Recurring droughts or social shifts? Exploring drivers of large-scale transformations in a transformed country, Global Environ. Chang., 65, 102157, https://doi.org/10.1016/j.gloenvcha.2020.102157, 2020.
Turner, S. W. D., Nelson, K., Voisin, N., Tidwell, V., Miara, A., Dyreson, A., Cohen, S., Mantena, D., Jin, J. L., Warnken, P., and Kao, S. C.: A multi-reservoir model for projecting drought impacts on thermoelectric disruption risk across the Texas power grid, Energy, 231, 120892, https://doi.org/10.1016/j.energy.2021.120892, 2021.
United States Census Bureau: Explore Census Data, https://www.census.gov/data.html (last access: 27 October 2022), 2022.
United States Department of Agriculture (USDA): National Agricultural Statistics Service Quick Stats, https://quickstats.nass.usda.gov/, last access: 21 May 2024.
United States (US) Drought Monitor: Drought Severity and Coverage Index, https://droughtmonitor.unl.edu/DmData/DataDownload/DSCI.aspx (last access: 25 May 2023), 2023.
United States Geological Survey (USGS): USGS Current Water Data for the Nation, https://waterdata.usgs.gov/nwis/rt (last access: 1 February 2023), 2023.
U.S. Bureau of Labor Statistics: The Impact of Soaring Cotton Prices on Consumer Apparel Prices, vol. 2, 1–8, https://www.bls.gov/opub/btn/archive/the-impact-of-soaring-cotton-prices-on-consumer-apparel-prices.pdf (last access: 21 May 2024), 2011.
van Dijk, A. I. J. M., Beck, H. E., Crosbie, R. S., de Jeu, R. A. M., Liu, Y. Y., Podger, G. M., Timbal, B., and Viney, N. R.: The Millennium Drought in southeast Australia (2001–2009): Natural and human causes and implications for water resources, ecosystems, economy, and society, Water Resour. Res., 49, 1040–1057, https://doi.org/10.1002/wrcr.20123, 2013.
Van Loon, A. F.: Hydrological drought explained, Wires Water, 2, 359–392, https://doi.org/10.1002/wat2.1085, 2015.
Van Loon, A. F., Gleeson, T., Clark, J., Van Dijk, A. I. J. M., Stahl, K., Hannaford, J., Di Baldassarre, G., Teuling, A. J., Tallaksen, L. M., Uijlenhoet, R., Hannah, D. M., Sheffield, J., Svoboda, M., Verbeiren, B., Wagener, T., Rangecroft, S., Wanders, N., and Van Lanen, H. A. J.: Drought in the Anthropocene, Nat. Geosci., 9, 89–91, https://doi.org/10.1038/ngeo2646, 2016.
van Vliet, M. T. H., Sheffield, J., Wiberg, D., and Wood, E. F.: Impacts of recent drought and warm years on water resources and electricity supply worldwide, Environ. Res. Lett., 11, 124021, https://doi.org/10.1088/1748-9326/11/12/124021, 2016.
Voisin, N., Dyreson, A., Fu, T., O'Connell, M., Turner, S. W. D., Zhou, T., and Macknick, J.: Impact of climate change on water availability and its propagation through the Western US power grid, Appl. Energ., 276, 115467, https://doi.org/10.1016/j.apenergy.2020.115467, 2020.
Wanders, N., Wada, Y., and Van Lanen, H. A. J.: Global hydrological droughts in the 21st century under a changing hydrological regime, Earth Syst. Dynam., 6, 1–15, https://doi.org/10.5194/esd-6-1-2015, 2015.
Wessel, J., Kern, J. D., Voisin, N., Oikonomou, K., and Haas, J.: Technology Pathways Could Help Drive the US West Coast Grid's Exposure to Hydrometeorological Uncertainty, Earths Future, 10, e2021EF002187, https://doi.org/10.1029/2021EF002187, 2022.
Wigmosta, M. S., Vail, L. W., and Lettenmaier, D. P.: A distributed hydrology-vegetation model for complex terrain, Water Resour. Res., 30, 1665–1697, https://doi.org/10.1029/94WR00436, 1994.
Wilhite, D. A., Svoboda, M. D., and Hayes, M. J.: Understanding the complex impacts of drought: A key to enhancing drought mitigation and preparedness, Water Resour. Manag., 21, 763–774, https://doi.org/10.1007/s11269-006-9076-5, 2007.
Wineland, S. M., Basagaoglu, H., Fleming, J., Friedman, J., Garza-Diaz, L., Kellogg, W., Koch, J., Lane, B. A., Mirchi, A., Nava, L. F., Neeson, T. M., Ortiz-Partida, J. P., Paladino, S., Plassin, S., Gomez-Quiroga, G., Saiz-Rodriguez, R., Sandoval-Solis, S., Wagner, K., Weber, N., Winterle, J., and Wootten, A. M.: The environmental flows implementation challenge: Insights and recommendations across water-limited systems, Wires Water, 9, e1565, https://doi.org/10.1002/wat2.1565, 2022.
Wurbs, R. A.: Sustainable Statewide Water Resources Management in Texas, J. Water Res. Plan. Man., 141, A4014002, https://doi.org/10.1061/(ASCE)WR.1943-5452.0000499, 2015.
Wurbs, R. A.: Institutional Framework for Modeling Water Availability and Allocation, Water-Sui., 12, 2767, https://doi.org/10.3390/w12102767, 2020.
Wurbs, R. A.: Storage and Regulation of River Flows by Dams and Reservoirs, The Texas Water Journal, 12, 10–39, https://doi.org/10.21423/twj.v12i1.7106, 2021.
Xu, C. G., McDowell, N. G., Fisher, R. A., Wei, L., Sevanto, S., Christoffersen, B. O., Weng, E. S., and Middleton, R. S.: Increasing impacts of extreme droughts on vegetation productivity under climate change, Nat. Clim. Change, 9, 948–953, https://doi.org/10.1038/s41558-019-0630-6, 2019.
Yates, D., Szinai, J. K., and Jones, A. D.: Modeling the Water Systems of the Western US to Support Climate-Resilient Electricity System Planning, Earths Future, 12, e2022EF003220, https://doi.org/10.1029/2022EF003220, 2024.
Zagona, E. A., Fulp, T. J., Shane, R., Magee, T., and Goranflo, H. M.: Riverware: a generalized tool for complex reservoir system modelling, J. Am. Water Resour. Assoc., 37, 913–929, 2001.
Zohrabian, A. and Sanders, K. T.: Assessing the impact of drought on the emissions- and water-intensity of California's transitioning power sector, Energ. Policy, 123, 461–470, https://doi.org/10.1016/j.enpol.2018.09.014, 2018.