the Creative Commons Attribution 4.0 License.
the Creative Commons Attribution 4.0 License.
 | 14 May 2024
The value of multi-source data for improved flood damage modelling with explicit input data uncertainty treatment: INSYDE 2.0
Mario Di Bacco
Daniela Molinari
Anna Rita Scorzini
Accurate flood damage modelling is essential to estimate the potential impact of floods and to develop effective mitigation strategies. However, flood damage models rely on diverse sources of hazard, exposure and vulnerability data, which are often incomplete, inconsistent or totally missing. These issues with data quality or availability introduce uncertainties into the modelling process and affect the final risk estimations. In this study, we present INSYDE 2.0, a flood damage modelling tool that integrates detailed survey and desk-based data for enhanced reliability and informativeness of flood damage predictions, including an explicit representation of the effect of uncertainties arising from incomplete knowledge of the variables characterising the system under investigation.
- Article
(3764 KB) - Full-text XML
-
Supplement
(2091 KB) - BibTeX
- EndNote


In recent years, a policy shift from mere hazard control to more holistic flood risk management has steadily increased the demand for reliable quantitative flood risk assessment methodologies (Sayers et al., 2002; Merz et al., 2010). However, despite the significant advancements achieved in flood damage modelling over the past decade, the application of developed tools in practical decision-making for flood risk management has been limited, mainly because of concerns about modelling uncertainties affecting the results of loss estimations (Morgan et al., 1990; Apel et al., 2008; Wagenaar et al., 2016; Winter et al., 2018; Marvi, 2020).
Uncertainty, arising from incomplete knowledge of the system under investigation in terms of input data and/or model assumptions, could be reduced by enhancing model complexity (i.e. better representation of modelled mechanisms) and/or using high-quality input data (Wagenaar et al., 2016). In this regard, the recent literature has demonstrated that multi-variable flood damage models not only outperform simpler (stage–damage) functions (Schröter et al., 2014; Wagenaar et al., 2017; Amadio et al., 2019), but also provide ancillary advantages. These cover the ability to identify key variables influencing damage (useful, for instance, in guiding interventions for improving building resilience) and, for probabilistic models, the possibility of including the explicit treatment of uncertainty in the modelling framework, thus supporting comprehensive and informative damage assessments (Morgan et al., 1990; Rözer et al., 2019; Zarekarizi et al., 2020). Nevertheless, practical constraints, such as budget, operational timelines and computational efforts, as well as issues regarding data quality and availability, often hinder the actual implementation of such models at a large (e.g. river basin) scale, with the consequent risk of providing decision-makers with a limited perspective on potential damage scenarios (Pappenberger and Beven, 2006; Merz et al., 2008; Wagenaar et al., 2016; Albano et al., 2018; Zarekarizi et al., 2020; Razavi et al., 2021).
With specific reference to data, for the case of residential buildings, the literature has pointed out that several features characterising both the event (e.g. water depth, flow velocity, inundation duration, debris and contamination load) and the exposed object (e.g. material and construction type, age and finishing quality of the building, in addition to its geometrical parameters and more micro-scale characteristics) affect the resulting flood losses (Penning-Rowsell et al., 2005; Dottori et al., 2016; Wagenaar et al., 2016; Mohor et al., 2020; Nofal et al., 2020; Malgwi et al., 2021; Paulik et al., 2022). Hence, to ensure accurate flood damage assessments, based on a thorough characterisation of the building stock, it is crucial to count on comprehensive vulnerability and exposure data, including relevant ancillary information. Unfortunately, the availability and reliability of such data are often limited, especially for large-scale applications (Papathoma-Köhle et al., 2007; Schröter et al., 2018; Bhuyan et al., 2023; Velez et al., 2022).
To tackle this issue, a few existing tools have been designed to adapt to actual available knowledge of hazard and building features: an example is represented by INSYDE (Dottori et al., 2016), which is a synthetic (i.e. based on “what-if” analysis), multi-variable flood damage model for residential buildings, capable of handling missing input data by assigning them specific default values typical of the country/region of implementation (Dottori et al., 2016; Molinari and Scorzini, 2017; Scorzini et al., 2022). However, relying on this approach could lead to biased results, since missing and known inputs are treated as equivalent when the former are set to their corresponding built-in defaults. This challenge could be mitigated by considering probabilistic distributions of unknown input data within a Monte Carlo approach, which still necessitates representative empirical distributions for the relevant input variables in order to account for the local nature of flood damage mechanisms and to ensure meaningful and reliable uncertainty bounds (Cammerer et al., 2013; Wagenaar et al., 2018; Sairam et al., 2019; Scorzini et al., 2021, 2022). However, the commonly poor availability of specific databases (particularly concerning very detailed building attributes, such as the elevation of the first floor from ground level or the perimeter of internal walls), coupled with the time-consuming operation of conducting surveys, currently constitutes the main obstacle to thorough analyses of models' sensitivities to uncertainties stemming from input data.
The divergent needs of balancing modelling costs and informative results (Di Bacco et al., 2023; Sieg et al., 2023) then pose two questions concerning the applicability of sophisticated and data-intensive models in flood damage assessments: (i) how can multi-source data be used to provide an added value to advanced damage modelling tools in terms of output quality and usefulness? (ii) What are the essential variables that play a key role in constraining the uncertainty bounds, making them worthy of investment in data collection?
The present paper aims at answering these questions by leveraging the updating of the INSYDE model towards a use with a full treatment of input data uncertainty, involving the exploitation of detailed flood hazard and building inventories, here specifically developed for and/or consulted with reference to the Po River District (northern Italy, Fig. S1 in the Supplement) but with the potential for replication in any other contexts.
2.1 From INSYDE to INSYDE 2.0
INSYDE is a synthetic, micro-scale, multi-variable flood damage model for the residential sector, released as an open-source R script, originally developed and validated for Italy but also extended to Belgium (Dottori et al., 2016; Molinari and Scorzini, 2017; Scorzini et al., 2022). In INSYDE, the calculation of direct economic damage at the building scale relies on explicit, physically based mathematical equations describing flood damage mechanisms for each building component (and sub-components), as a function of more than 20 variables, including flood event (i.e. water depth, flow velocity, inundation duration, sediment and pollution load) and building characteristics (i.e. geometric and qualitative features – footprint area; internal and external perimeter; building material, type and quality; etc.), as well as prices for the reparation or replacement of damaged items. For some building components, the damage mechanisms affected by greater uncertainties are modelled probabilistically by accounting for the probability of damage occurrence as a function of certain hazard intensity measures.
As stated in the Introduction, in the case of missing information, the original model proposed deterministic default values for each input variable, calibrated based on expert judgement and/or based on the analysis of large-scale local databases (Dottori et al., 2016). Some of them, such as extensive variables (e.g. internal area, external and internal perimeter of the building), were defined by default functional relationships calibrated on a typical configuration of a 100 m2 Italian house. According to the authors' experience, the implementation of INSYDE can lead to biased results (due to the pairwise consideration of known and unknown input data) or inaccurate estimations, especially when applied to large buildings, like apartment blocks, implying a scalability issue (Galliani et al., 2020). For this reason, in INSYDE 2.0, following the strategy proposed for the Belgian version of the model (Scorzini et al., 2022), the housing unit (HU) has been chosen as the minimum calculation item for multifamily buildings (i.e. apartment buildings). In addition, to enhance and ease the model's usability and to mitigate the impact of input data quality issues on the accuracy of damage assessment, an algorithm has been implemented to automatically split a building's footprint area into a suitable number of HUs if the value introduced by the user significantly exceeds a representative building size.
Considering the sensitivity of damage estimates to individual input variables (albeit in varying degrees, not known a priori), it is crucial to conduct a comprehensive analysis of the effects of missing information on model outcomes, by also accounting for both mutual and non-linear relationships among the variables. Such an approach can provide practical insights for finding an efficient trade-off between model accuracy and efforts for input data retrieval (Di Bacco et al., 2023); at the same time, a shift from the use of fixed deterministic values to suitable distributions of input variables could enhance users' awareness of damage estimation uncertainty.
By employing a stepwise procedure, the present study then aims to address the aforementioned issues by proposing an updated version of INSYDE that will also enable the exploration of the two research questions outlined in the Introduction. In detail, the methodological approach consists of the main following phases (Fig. 1):
-
data collection (Sect. 2.2) to acquire relevant information on hazard and building features required by INSYDE;
-
development of INSYDE 2.0, incorporating a module for handling missing inputs in a probabilistic framework and involving the generation of synthetic datasets based on collected empirical data combined with expert-based knowledge concerning relationships between hazard variables (Sect. 2.3);
-
assessment of the model's sensitivities to missing input data, including analysis of feature importance using the developed synthetic datasets, as well as the evaluation of the impact of individual or combined missing inputs on uncertainty in damage estimation (conducted on synthetic building portfolios and on observed datasets for two recent flood events in Italy (Sect. 2.4)).
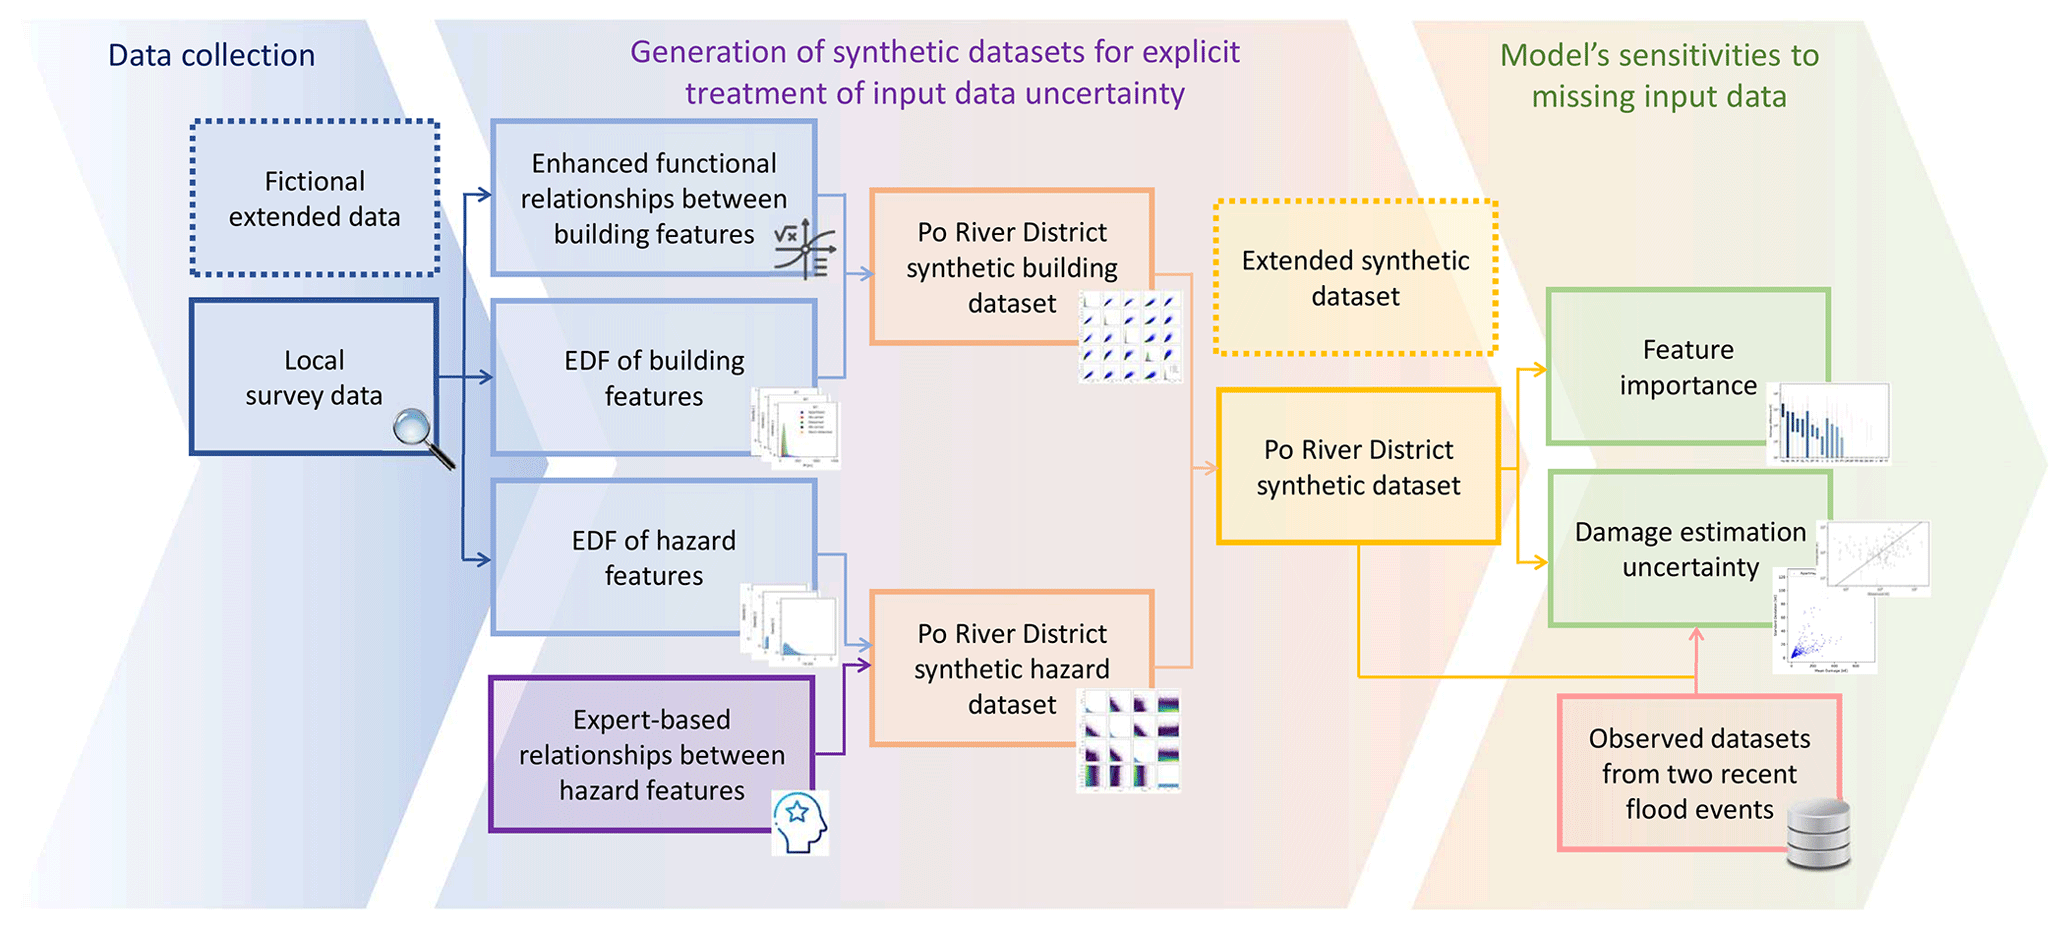
Figure 1Overview of the methodological approach. Dotted-line boxes represent an alternative dataset for the analysis while maintaining the same methodological flow as depicted in the solid-line boxes.
2.2 Data collection
Due to the local nature of damage models, the initial phase focuses on establishing the foundation for a model capable of accurately capturing the hazard and building-specific details of the region of implementation, here represented by the Po River District as an exemplificatory case. To achieve this, a “survey dataset” has been developed as a basis for the generation of empirical distribution functions (EDFs) for the variables at stake, which serve for sampling representative features of the populations of interest in case of unknown inputs encountered in the application of INSYDE. Virtual surveys (Scorzini et al., 2022), offering in-depth insights into building vulnerability and supporting the establishment of functional relationships for different building features (e.g. internal and external perimeter as a function of footprint area), can be employed as an additional means to conventional approaches based on statistical data and building inventories. In the specific case of the Po River, while traditional datasets (derived from the Italian National Institute of Statistics (ISTAT) and OpenStreetMap (OSM)) provide extensive coverage of the whole district for the entire building stock, virtual surveys focus on a smaller sample due to limited real-estate listings with complete information and the time-demanding micro-scale analysis of building details, photographs and floor layouts. With this virtual approach, 119 buildings were assessed, compiling comprehensive information on building material, systems and quality, as well as the position and dimensions of building components, among other relevant details (Huayra Mena, 2022). The EDFs describing typical inundation phenomena in terms of water depth and flow velocity can instead be derived from the analysis of the hazard maps included, for instance, in flood risk management plans or other detailed hydraulic studies that exist for the investigated region. In the analysed case study, we leveraged the information contained in the 2021 update of the Flood Risk Management Plan of the Po River District Basin Authority (Autorità di Bacino del Fiume Po, 2022), which consisted of raster files obtained from 2D hydrodynamic modelling of flood scenarios across various return periods (ranging from 20 to 500 years) in specific catchments of the district. These catchments represent distinctive inundation types in both rural and urban areas, as well as in flat or steeper regions of the district, where inundation phenomena typically result from riverine and artificial channel floods in the central plain area and flash floods in the mountainous regions located in the northern and southern parts of the basin (Fig. S1). The medium-frequency scenario has been selected as the representative case for deriving the EDFs for water depth and flow velocity, based on its designation as the typical reference scenario for implementing mitigation measures in the Po catchment. The inclusion of different inundation types in the hazard dataset was driven by the goal of establishing a comprehensive model applicable to the entire district, aligning with exposure and vulnerability features which are representative of the whole region. Expert knowledge was utilised to determine suitable distributions for other hazard variables (as described in Sect. 2.3), like inundation duration and sediment load, with limited or null availability of detailed information. For instance, due to the inherent random nature of water pollution in flood events, a conservative assumption was made for the variable accounting for this process, by assigning a 50 % probability of having contaminated floodwater. Details on data statistics derived from the analysis of ISTAT data, the OSM building inventory, virtual surveys and flood-related data are available in the work by Huayra Mena (2022).
2.3 Generation of synthetic datasets for explicit treatment of input data uncertainty
The probability distributions of the different input features representative of the Po River District for INSYDE 2.0 were generated, based on the collected hazard and building data described while also accounting for the intrinsic interdependence among the variables (Tables 1 and 2). Specifically, the assumptions regarding the relationships between the building features relied upon the survey dataset and findings reported in Huayra Mena (2022), while a physically informed approach was adopted in the case of the hazard variables, depending on the features characterising both riverine (i.e. long duration, low flow velocity) and flash (i.e. rapid onset, greater flow velocities and shallower water depth compared to the other type) inundation phenomena.
In more detail, probability distributions were first retrieved independently for the hazard variables based on detailed data, when available (he, v), or on expert-based assumptions derived from aggregated or approximated data (d, s, q). Then, considering a set of 250 000 elements, the following functional dependencies were assumed to describe the correlation among the features, based on the values sampled for he, d and v:
with N being a random number from a normal distribution with mean μ and standard deviation σ and the coefficients ci being constant values introduced in the expert-based approach to obtain the desired functional relationships among the variables. In contrast, q was assumed to be independent of the other hazard features.
Although the resulting d*, v* and s* account for the correlation among the hazard variables, they do not follow the probability distributions retrieved independently for the variables d, v and s; on the contrary, the latter were sampled independently of the correct distributions, but they do not provide information on the rank correlation among the variables. To obtain a dataset with both the mentioned properties, the values of d*, v* and s* were then ranked and replaced with the corresponding percentiles derived from the ordered versions of d, v and s.
Furthermore, additional synthetic distributions (referred to as the “extended synthetic dataset” hereinafter), while preserving the nature of the identified functional relationships among the variables but spanning wider ranges of them (as reported in the Supplement), were also generated to support a more comprehensive analysis of INSYDE 2.0, regardless of the specific characteristics of the Po River District.
This dual analysis is rooted, on the one hand, in the need for context-specific insights into flood damage assessment in order to support efficient data retrieval efforts, allowing for prioritisation of data collection for variables that really play a key role in the considered context. On the other hand, a non-region-specific scenario, encompassing a broader range of values for the input variables, is instead aimed at providing more general findings on the influence of the different variables on the damage estimation process.
Table 1Hazard features considered in INSYDE 2.0 and assumed probability distributions for the case of the Po River District.
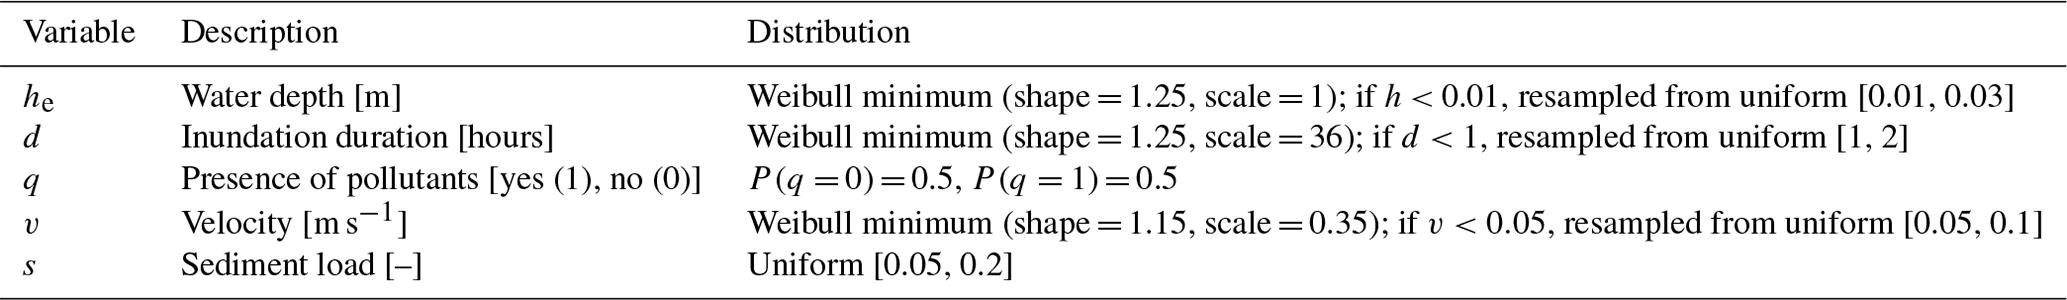
Table 2Building features considered in INSYDE 2.0 and assumed probability distributions for the case of the Po River District.
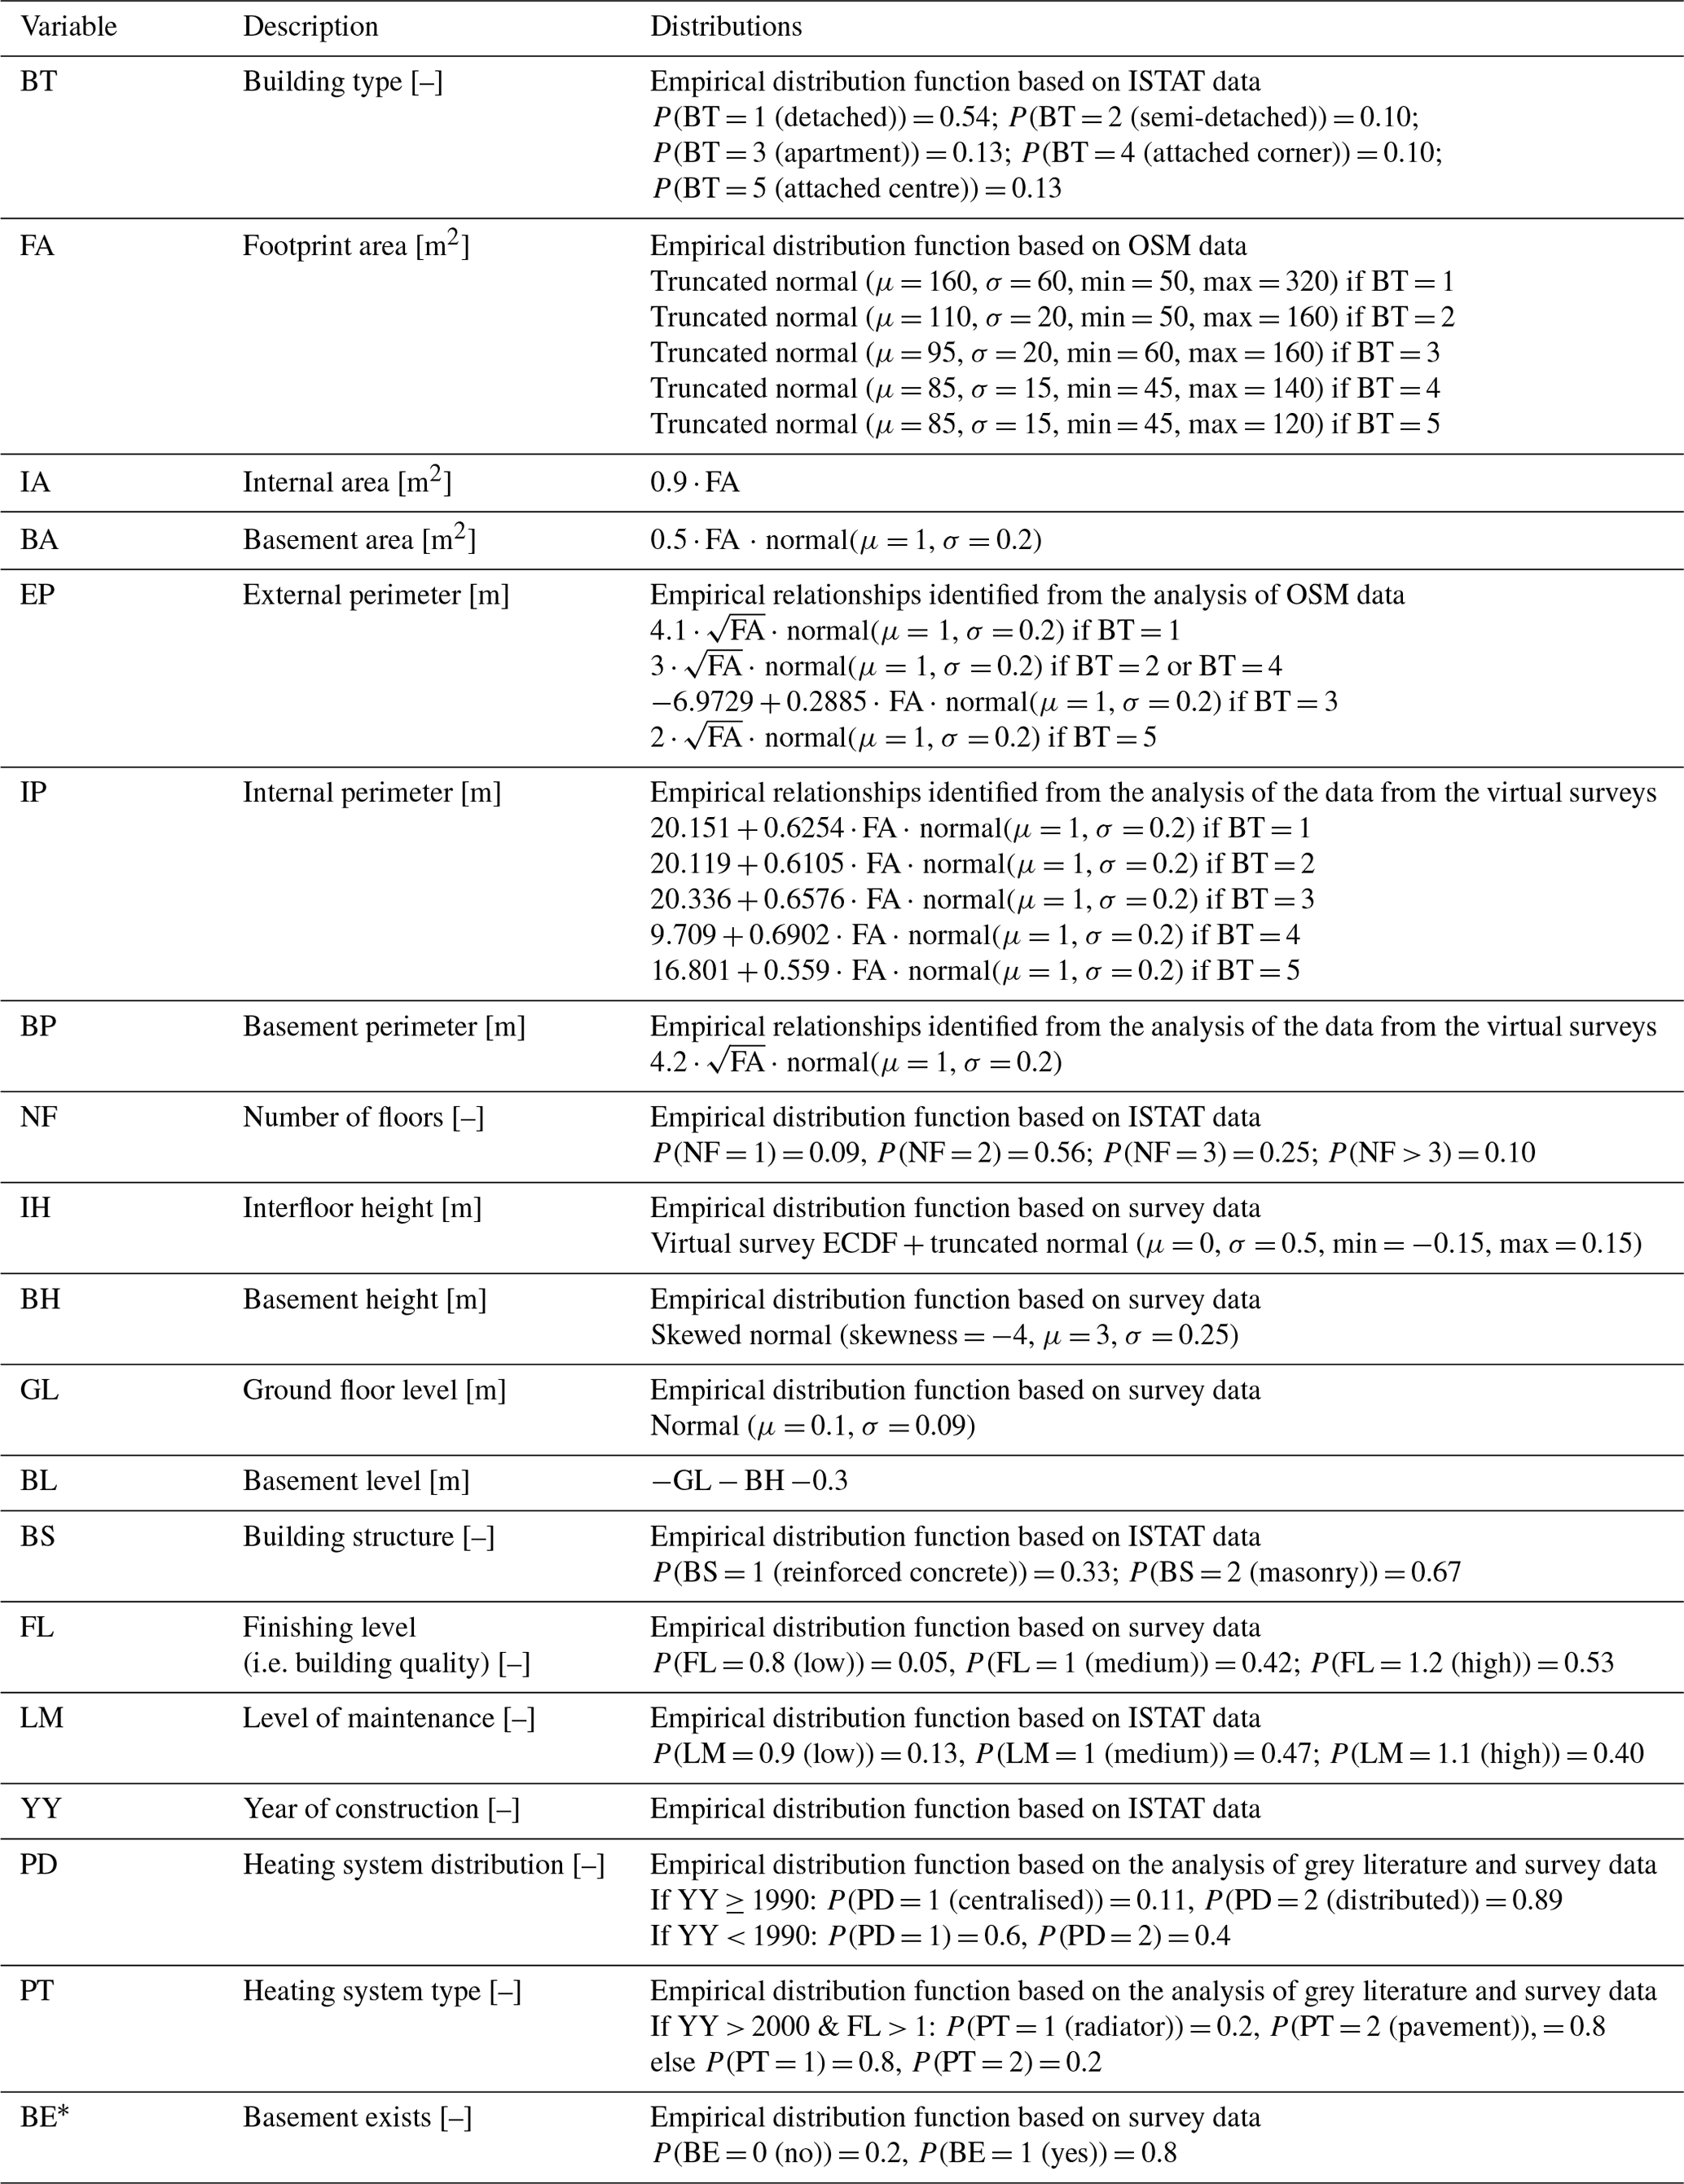
* New variable introduced in INSYDE 2.0.
2.4 Model's sensitivities to missing input data
2.4.1 Analysis of the feature importance
In the new framework for missing data handling, the generated synthetic distributions can be exploited in a feature importance exercise aimed at a quantitative assessment of the sensitivity of damage calculations to the absence of information on certain input variables in order to identify key features deserving attention in data collection. This analysis, based here on a probabilistic test performed on a complete portfolio of 250 000 hypothetically flooded buildings (generated from the identified distributions for the Po District as well as for the “extended case”), involved the following steps: first, INSYDE 2.0 is used to calculate damage using the complete dataset, where all input values are assumed to be available, and the resulting estimate is taken as a reference point. Next, the values of one input variable are removed at a time from the dataset, and the corresponding missing values are sampled from the generated synthetic dataset. This process is repeated for each variable, and, each time, damage is recalculated; the difference in damage with respect to the reference value is finally recorded, and then the variance induced by each feature on model outcomes can be determined.
2.4.2 Analysis of damage estimation uncertainty
In addition to assessing the possible contribution of unknown single-input features to damage estimation uncertainty, a further analysis can be carried out to evaluate the impact of the combined absence of multiple input variables on the variability in damage estimations.
Analysis on the synthetic dataset
A first test has been conducted, for computational reasons, on a subsample of 5000 buildings extracted from the complete building portfolio of the Po River District, this time altered to account for the presence of multiple unknown input data within the sample. The reduction in the dataset's level of completeness was achieved by assuming different percentages of missing data for each feature, which were assigned based on their typical availability or ease of retrieval, as experienced by the authors in the Italian context. Except for he and FA (see Table 1 for definitions of hazard feature variables and Table 2 for definitions of building feature variables), which were considered the minimum known variables for a damage assessment, the missing values were placed randomly, as follows: 10 % for variables of easy retrieval, due either to their availability at the meso-scale (e.g. census block scale) or to their low variability (BT, IH, NF, BS, LM, FL, YY), and 20 % for other building features that require specific surveys for correct characterisation (EP, BE and related variables, BH, BA, BP); for GL, which is generally not available in databases but potentially appraisable through (virtual) surveys, this percentage was increased to 50 %, while 95 % was assumed for the building features that are hardly ever known (or only after internal surveys), such as IP and PD. For the hazard variables, the percentages were assumed to be 10 %, 20 %, 50 % and 80 % for v, d, s and q, respectively, taking into account the increasing modelling costs when going from a simple 2D steady hydrodynamic simulation to a more complex unsteady run with the inclusion of sediment transport modelling; the very specific and detailed data requirements regarding the presence and propagation of pollutants instead explain the higher value assumed for q. For each tested object, 1000 complete replicates were generated by filling missing input data with values sampled from the developed synthetic distributions, and the corresponding average damage and standard deviation were calculated.
Analysis on field data from recent flood events
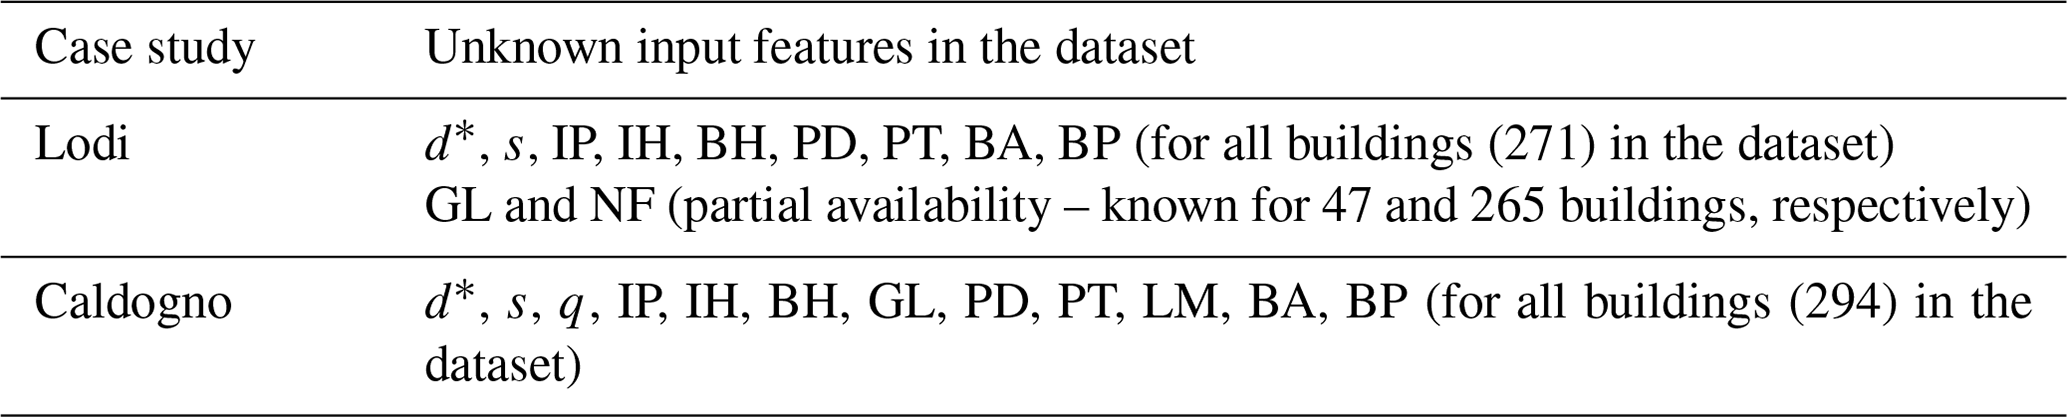
A similar analysis has also been carried out considering real-world field databases compiled for two flood events that occurred in the Po River valley: the 2002 Adda flood in Lodi and the 2010 Bacchiglione flood in Caldogno, both of which have been described in previous applications of INSYDE (Dottori et al., 2016; Amadio et al., 2019; Molinari et al., 2020). Table 3 provides a concise overview of the available datasets by specifically highlighting the unknown variables for INSYDE 2.0 in the two case studies. As is typical in large-scale flood damage assessments, the missing data mainly concerned the ultra-detailed characteristics of the dwellings, while only approximate information on inundation duration was available from the reports of the events, which provided a rough indication of 24 h on average for both cases. To ensure a reasonable level of uncertainty, while considering the available information on inundation duration, the empirical distribution for this variable was modified with respect to the one in Table 1, by sampling d values from an assigned truncated normal distribution centred at 24 h and spanning 16 to 48 h. As in the previous case, the approach entailed calculating damage over 1000 complete replicates for each affected building and registering the corresponding damage statistics.
Table 3Unknown input features for INSYDE in the considered case studies of the Lodi and Caldogno floods.
Furthermore, considering the availability of observed losses for the two case studies, we also investigated the impact of missing inputs on the results of classical validation exercises, prompting a broader discussion on the general interpretation of their results when performed for simple (e.g. univariable) or complex models without proper treatment of uncertainties (Molinari et al., 2019, 2020). In this context, since its formulation, INSYDE has undergone continuous updates and validation, with reported superior performance when compared to other tested damage models (Dottori et al., 2016; Amadio et al., 2019; Molinari et al., 2020). Although these previous studies consistently demonstrated INSYDE's capacity to provide accurate damage estimations, the reliance on fixed default values for missing input data limited the quantitative assessment of the uncertainty associated with validation outcomes.
3.1 Generation of the synthetic datasets
The pair plot in Fig. 2 displays the pairwise relationships among the flood hazard variables, water depth (he), flow velocity (v), inundation duration (d) and sediment load (s), characterising the developed synthetic dataset for the Po River District. This graphical tool employs a scatterplot to illustrate the relationship between each pair of variables in the dataset, while the diagonal axis displays kernel density plots for each variable.
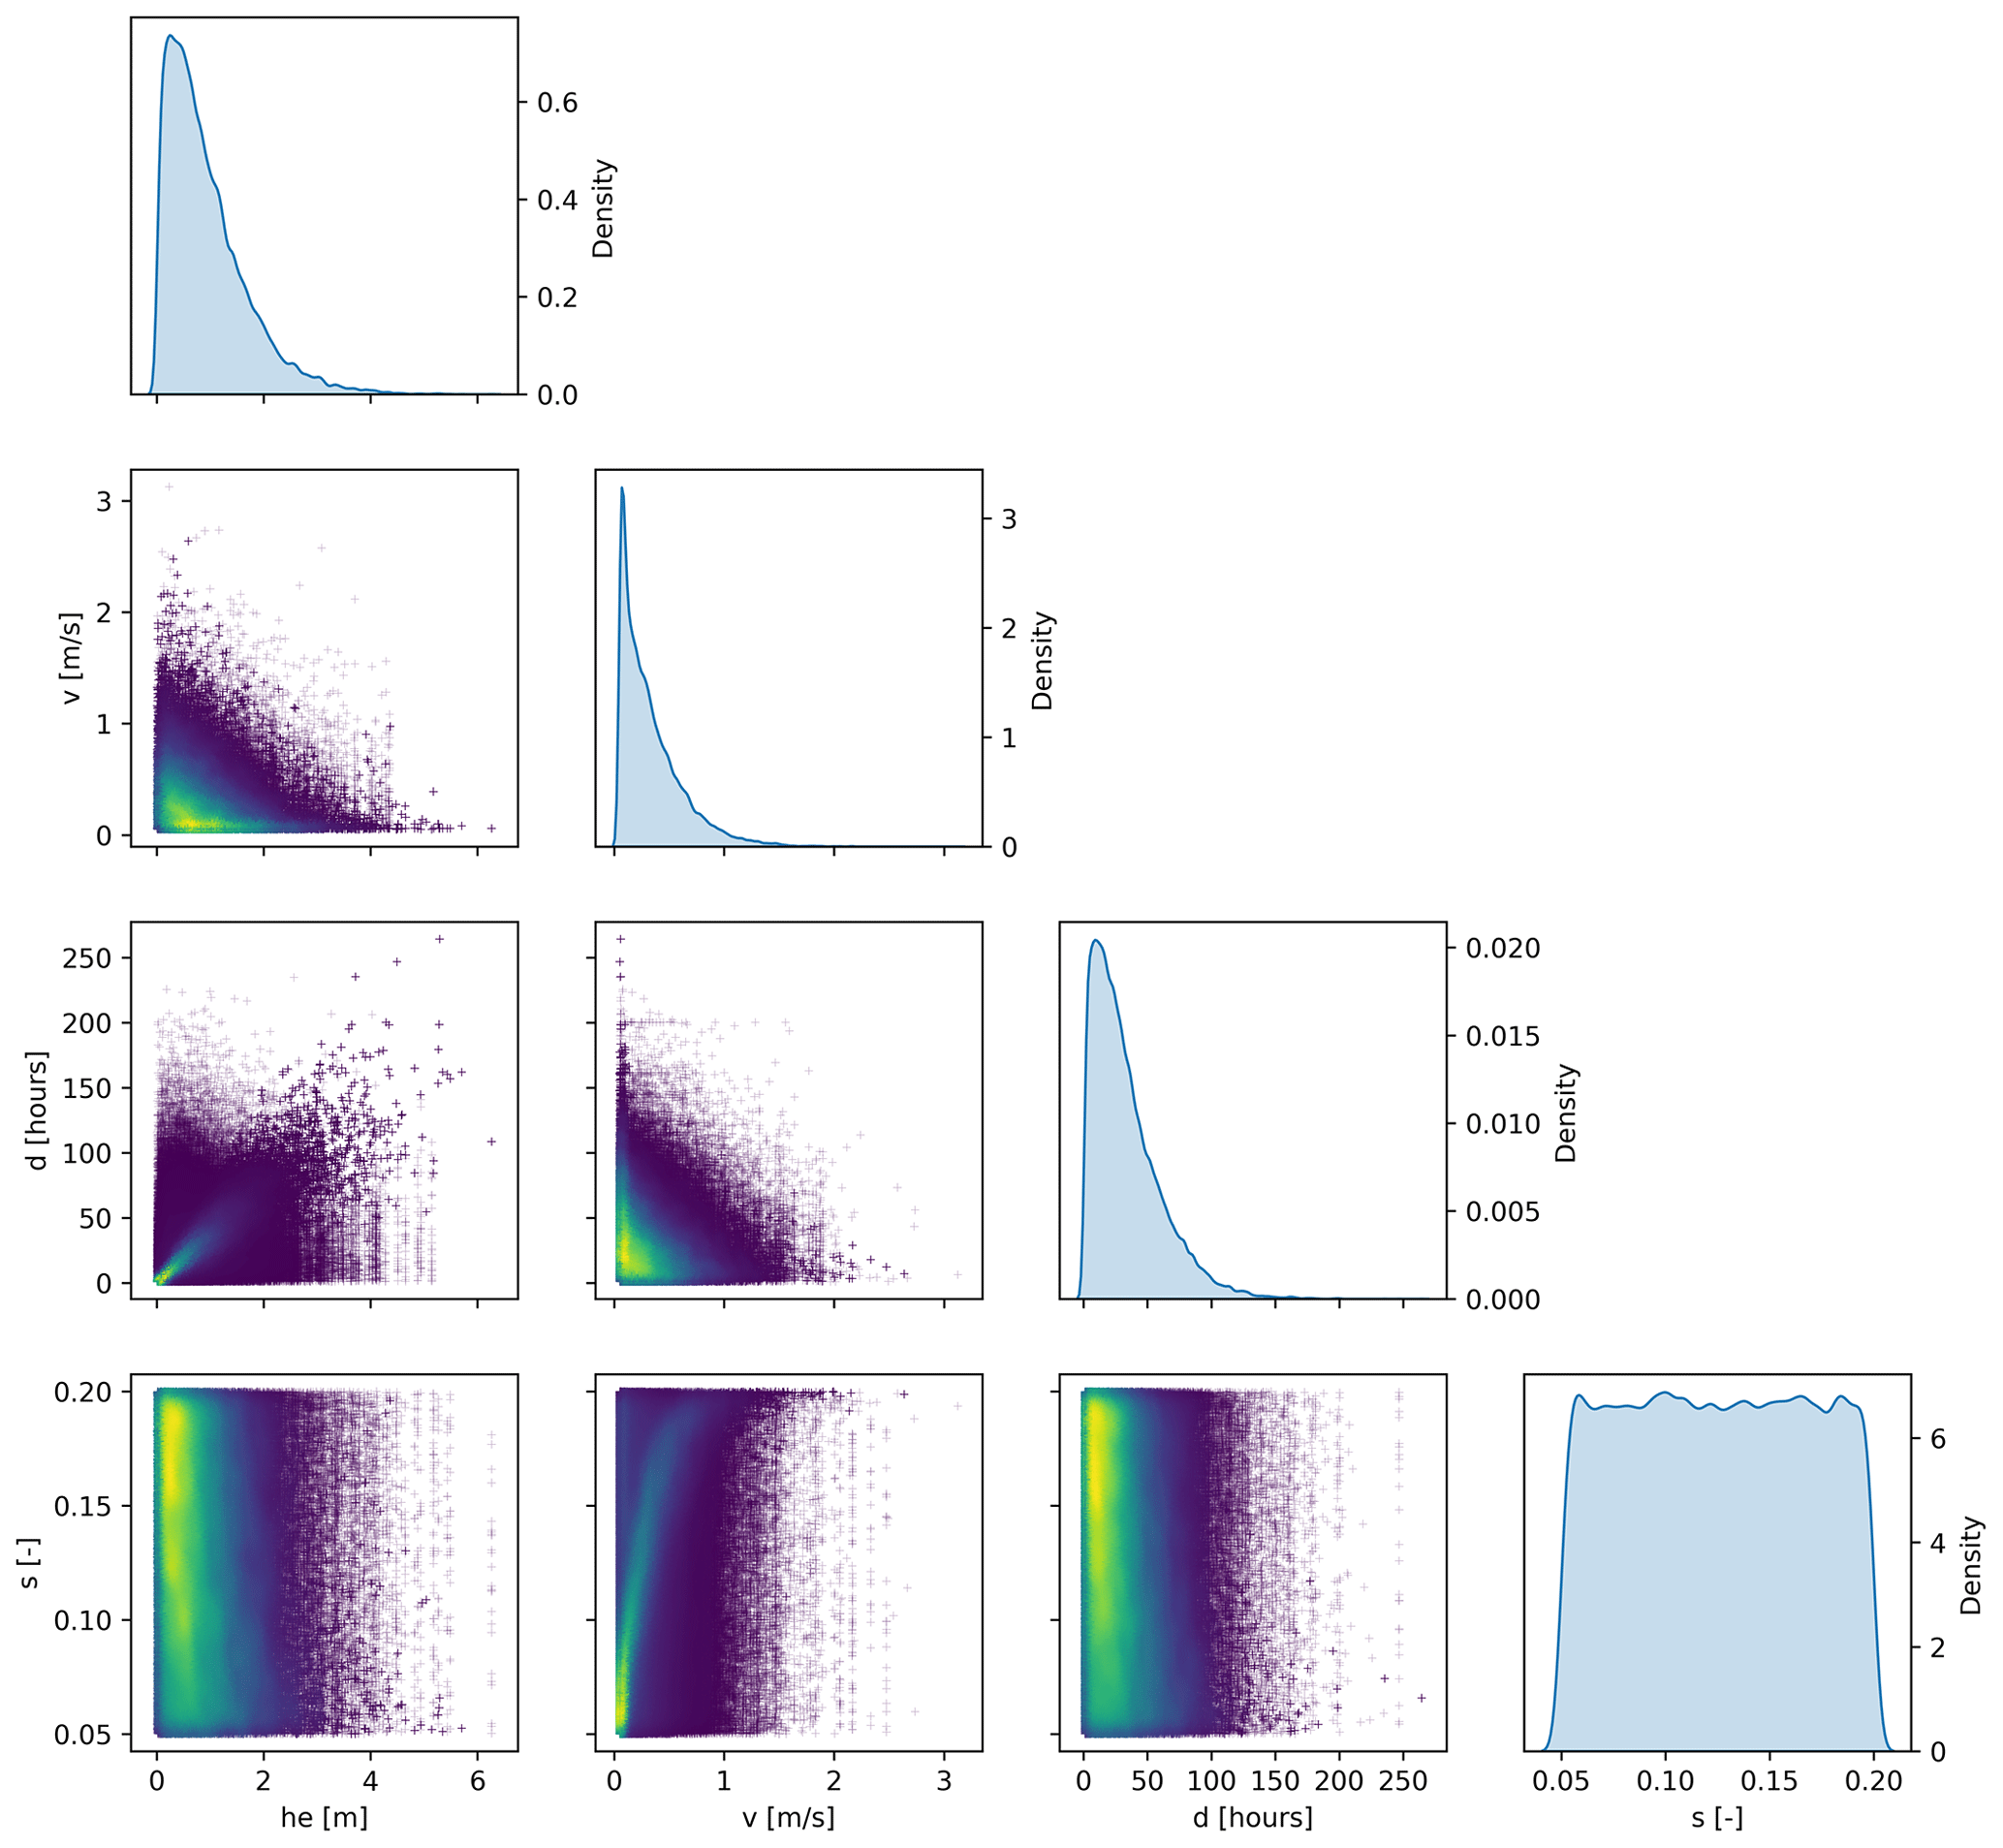
Figure 2Pairwise relationships assumed for the generation of the Po River District synthetic dataset: hazard variables (water depth (he), flow velocity (v), inundation duration (d) and sediment load (s)).
Figure 2 clearly illustrates the physically informed approach behind the generation of the synthetic dataset: for instance, a positive relationship between he and d, as well as between v and s, with the latter explained by the tendency of flash floods to carry greater amounts of debris; similarly, d and v were considered to be negatively correlated, in consideration of the short duration typically associated with flash floods.
An analogous pair plot for the extensive building variables is presented in Fig. 3, which illustrates the functional relationships (Table 2) identified from the analysis of the building survey dataset for the region (Huayra Mena, 2022).
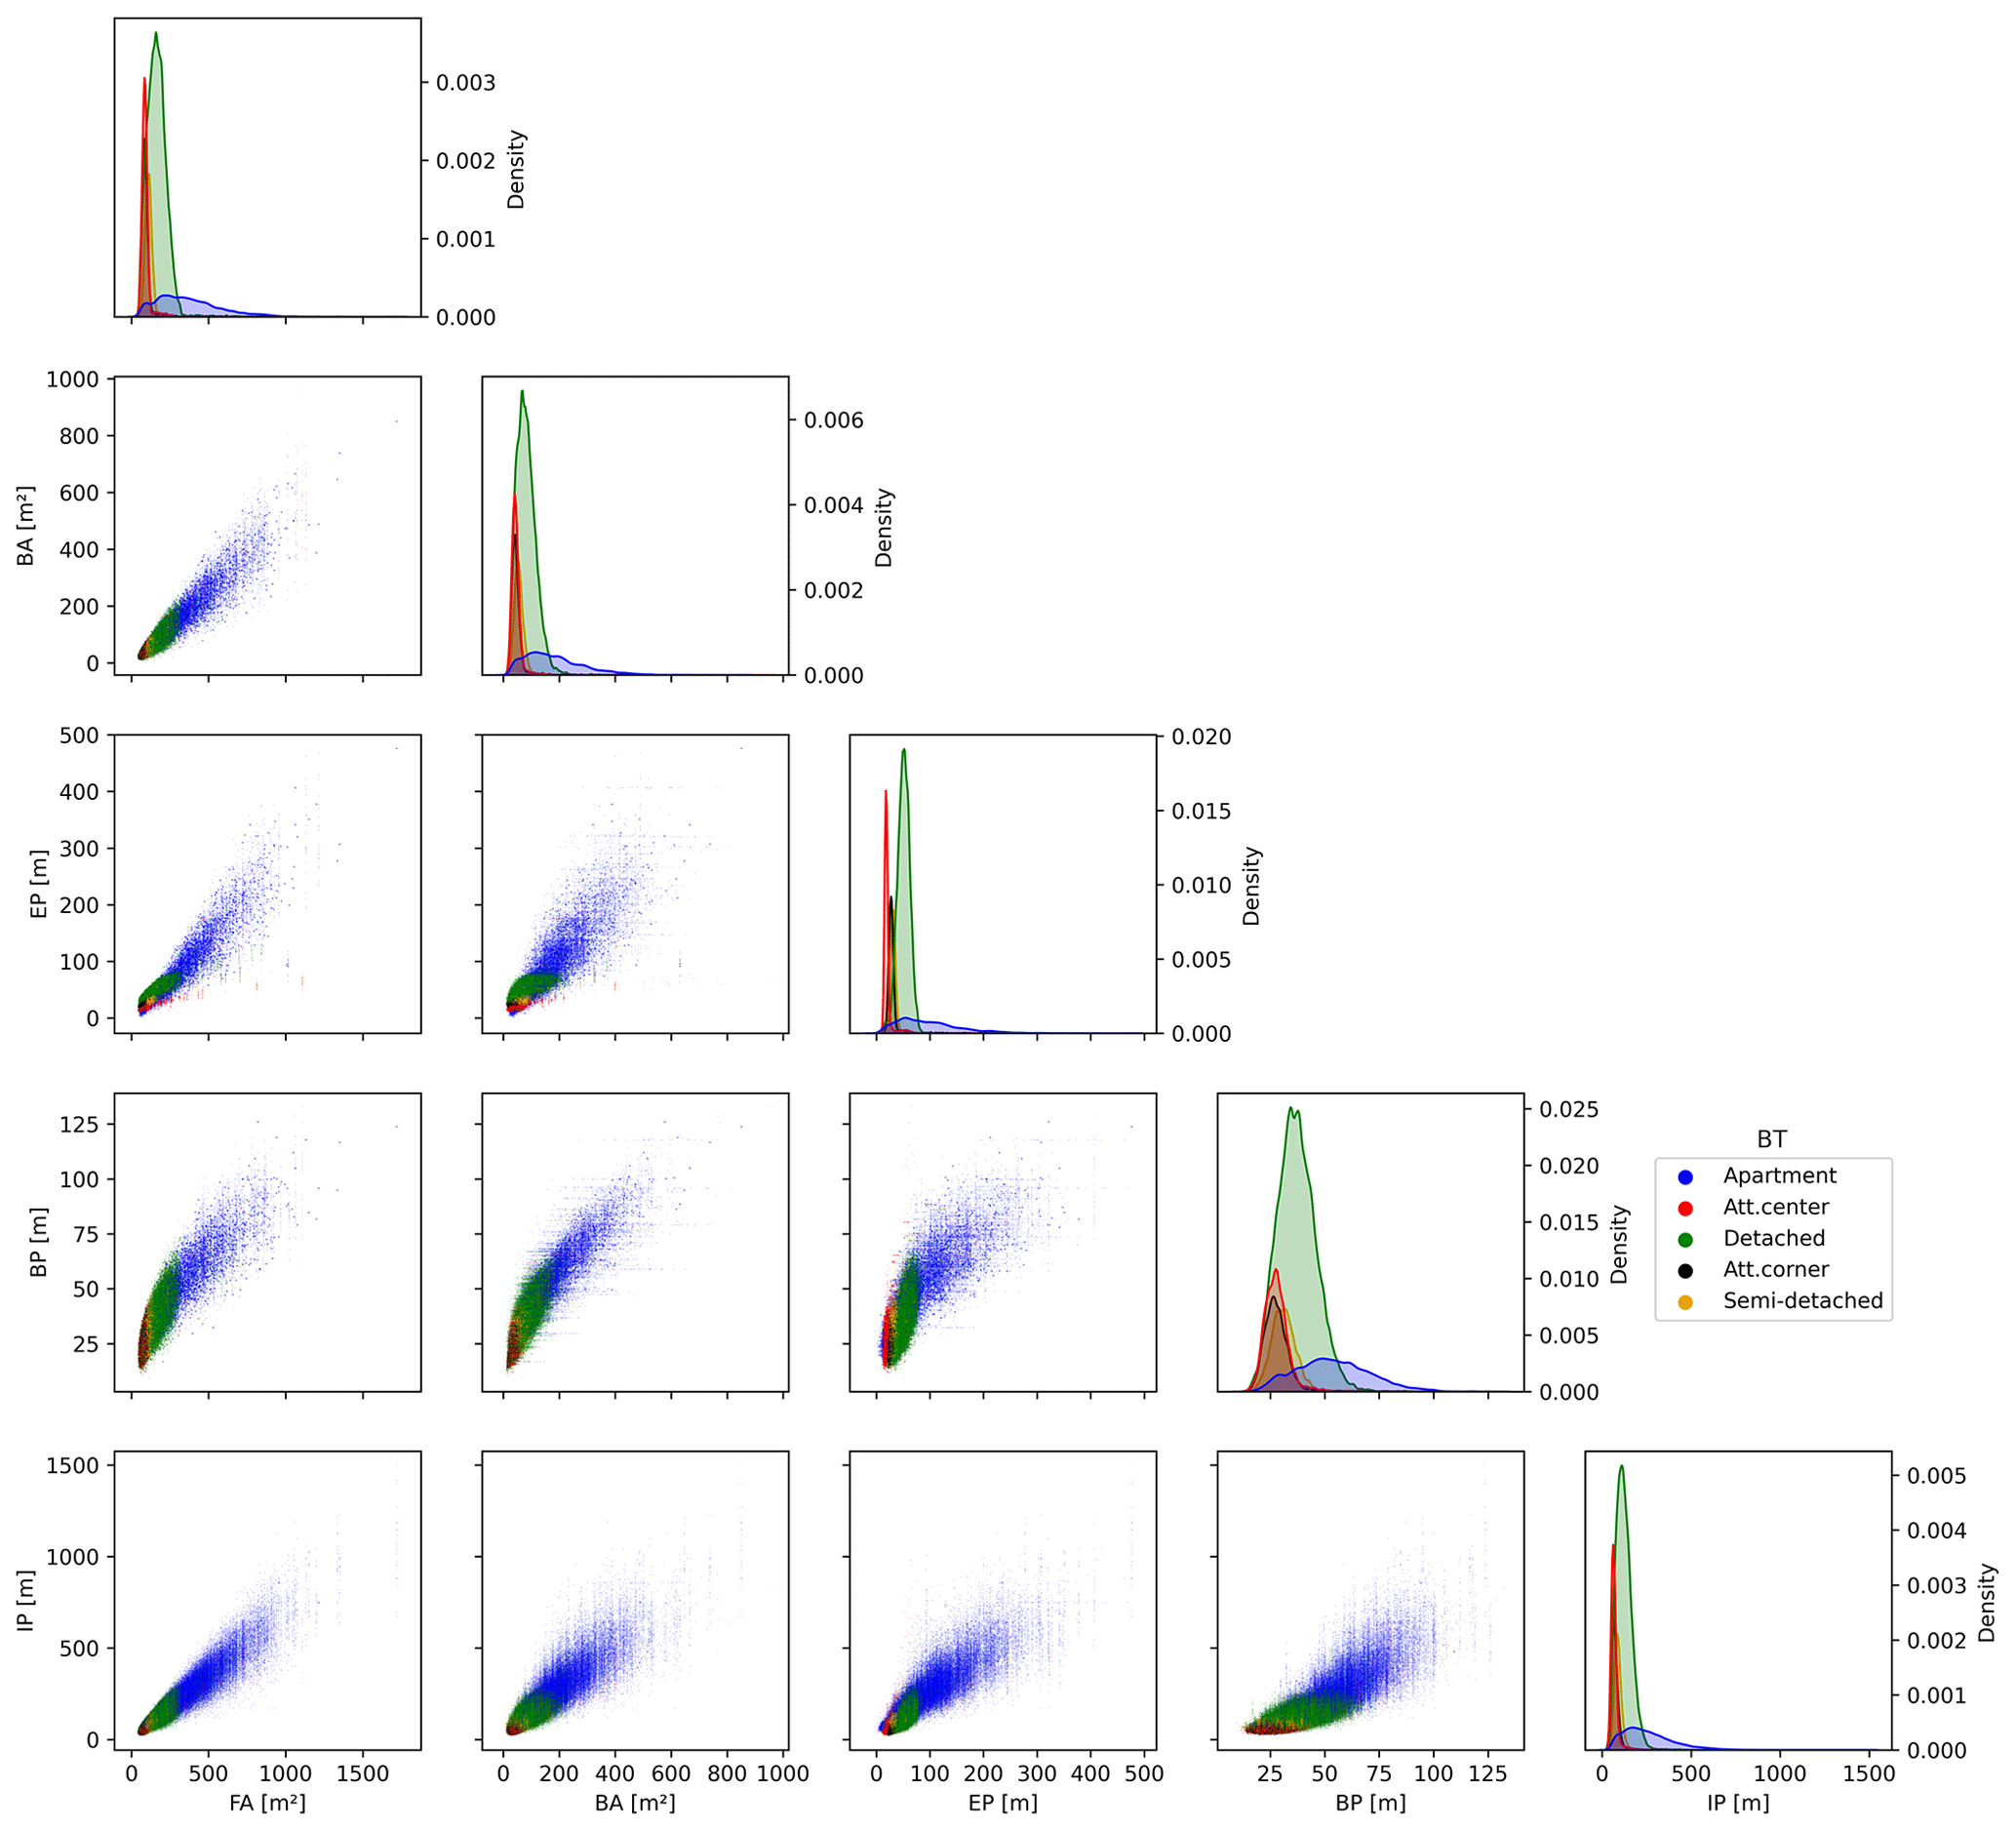
Figure 3Pairwise relationships assumed for the generation of the Po River District synthetic dataset: extensive building variables (footprint (FA) and basement (BA) area; external (EP), internal (IP) and basement perimeter (BP)).
For clarity, it should be noted that the distributions for the “apartment” category are represented in Fig. 3 at the building block scale, having assumed a number of housing units (nHU ≥ 1) generated from a Weibull distribution with shape and scale parameters equal to 2 and 4, respectively.
The pair plots illustrating the extended synthetic dataset (generated for obtaining more general findings on the influence of input features on damage estimation beyond the specificities of the region under investigation) are provided in the Supplement (Figs. S2 and S3) for comprehensive reference.
3.2 Model's sensitivities to missing input data
3.2.1 Analysis of the feature importance
This section reports on uncertainty in damage calculations resulting from the potential lack of knowledge of certain input data in INSYDE 2.0. In detail, Fig. 4 summarises the results of the feature importance analysis by showing the difference in computed damage when applying the model to a reference complete synthetic set of 250 000 buildings and to their replicas obtained by replacing the values of one input variable at a time with a sampling from the Po River District case (Fig. 4a) or from the extended synthetic dataset reported in the Supplement (Fig. 4b).
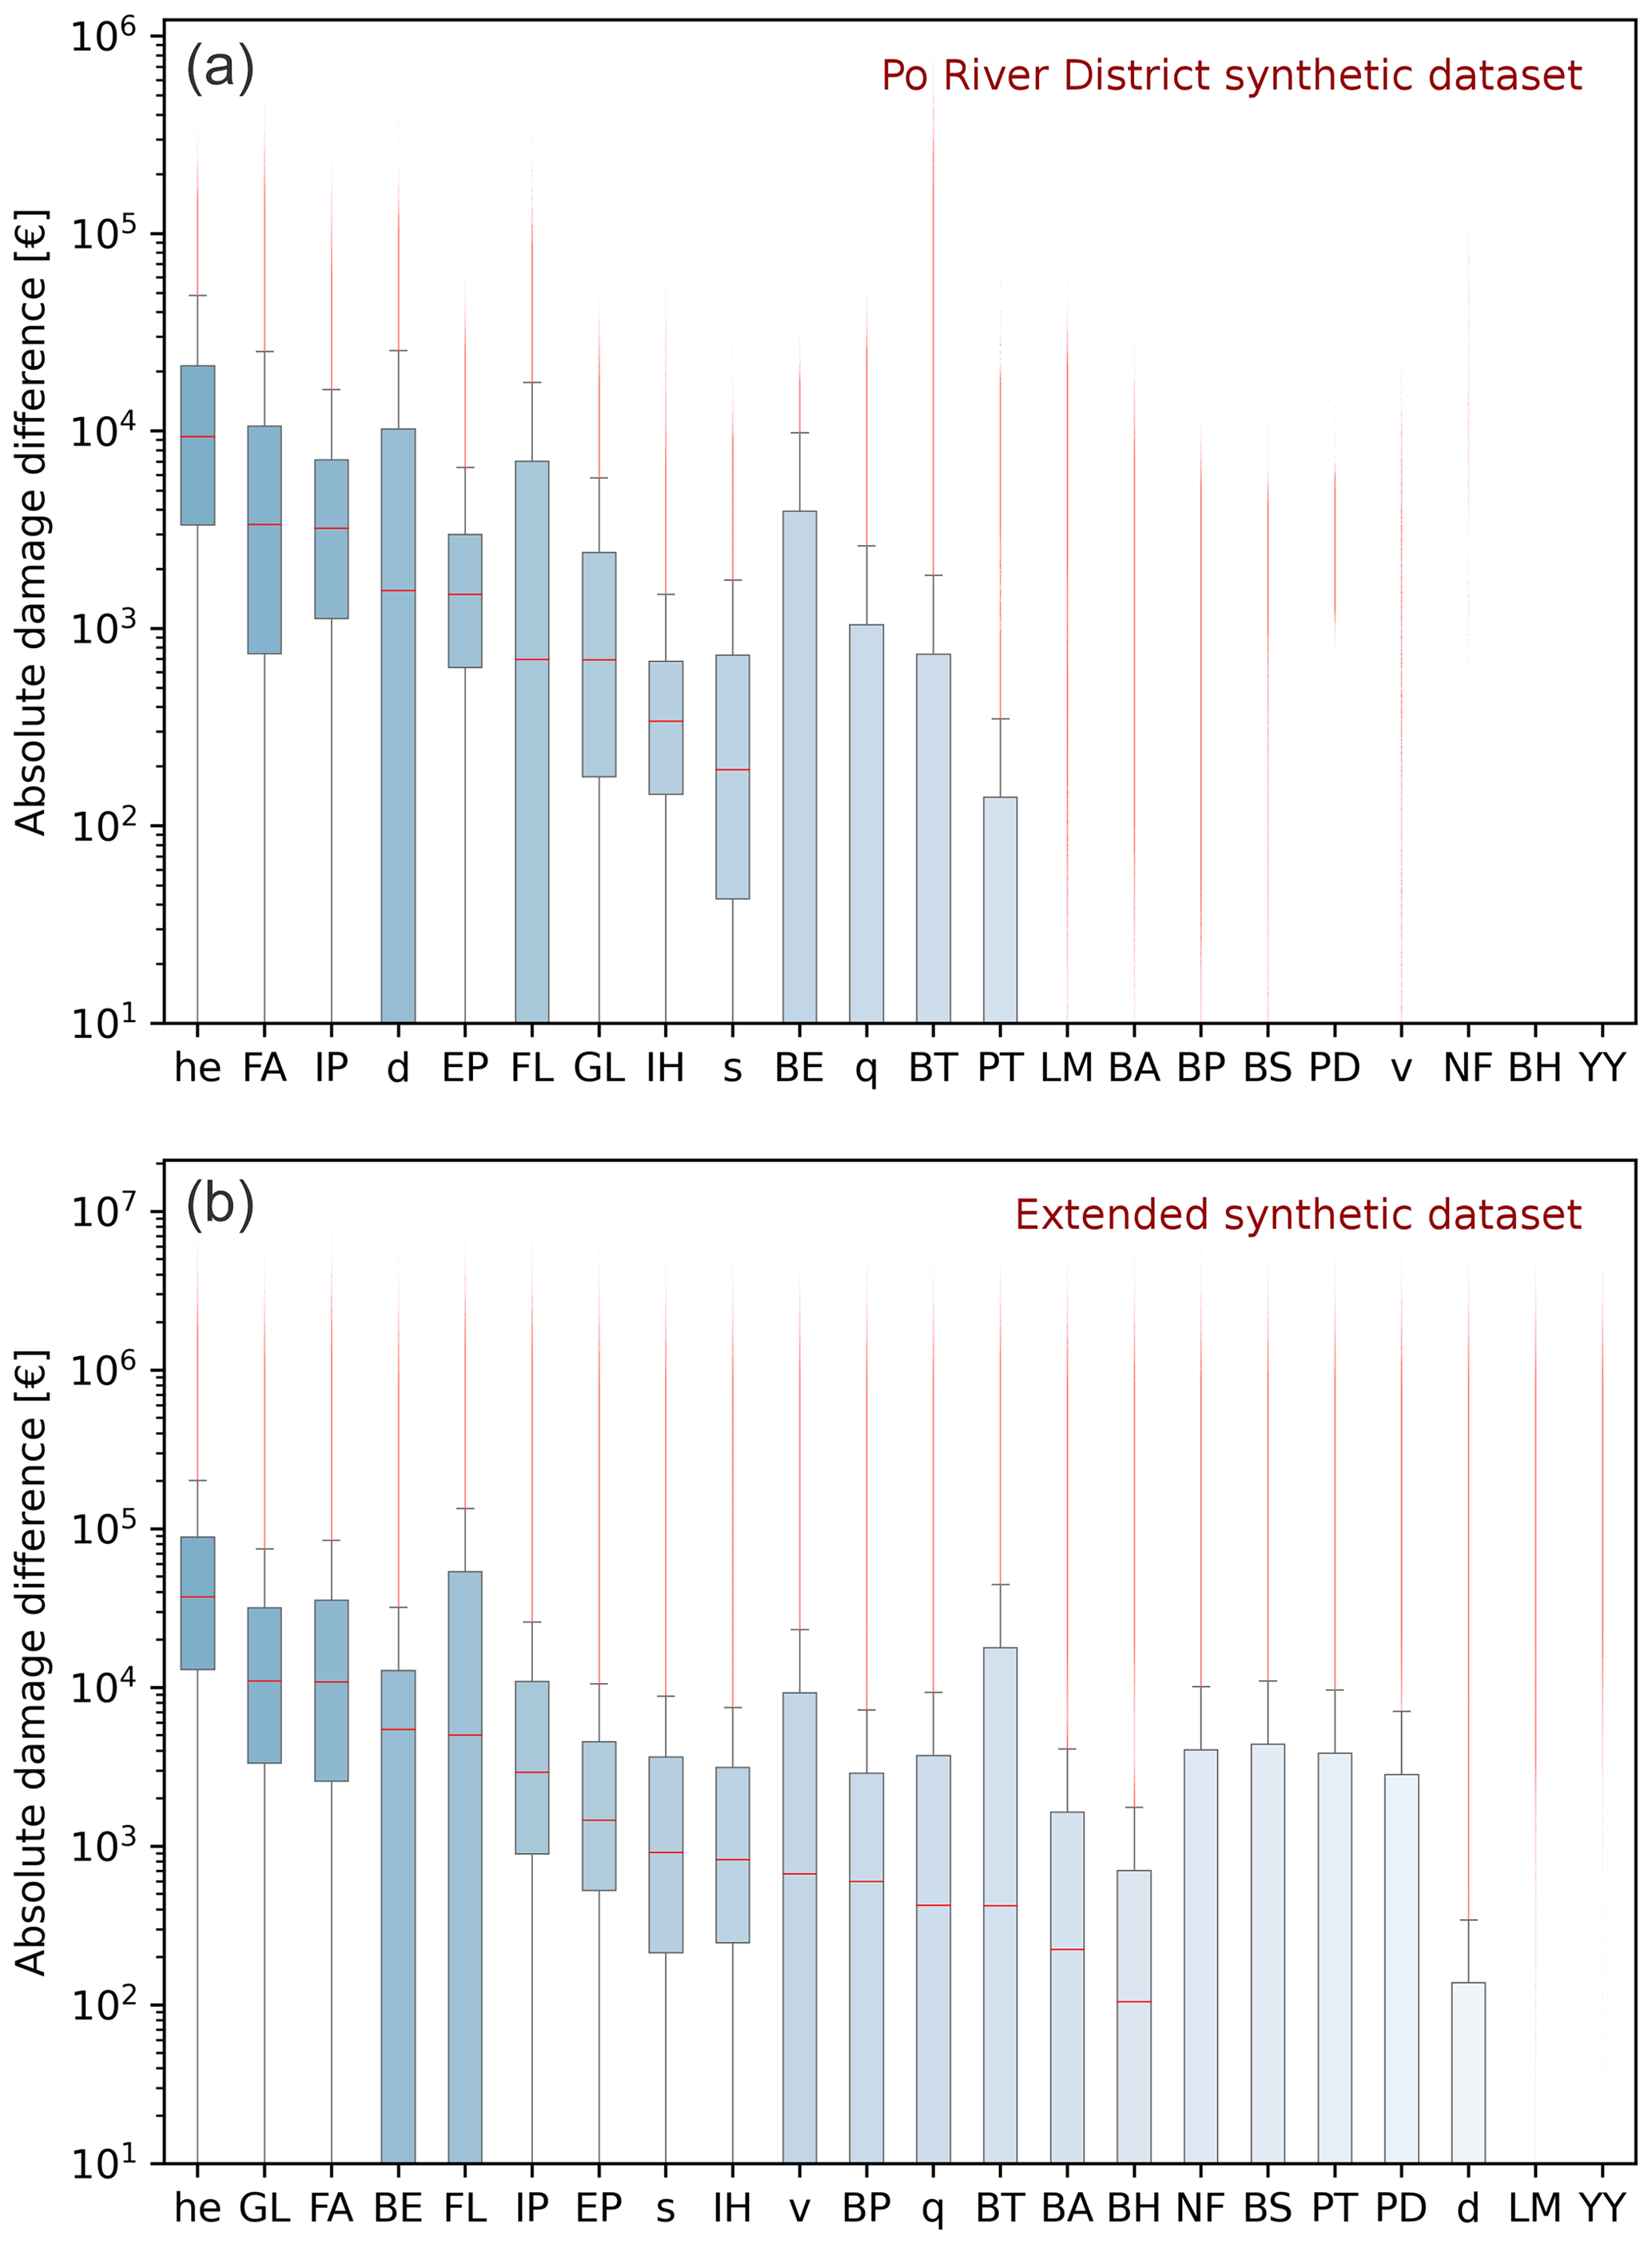
Figure 4Feature importance in INSYDE 2.0: test with sampling from the Po River District synthetic dataset (a); test with sampling from the extended synthetic dataset – refer to Figs. S2–S3 (b). Variables are ranked based on the median value of the estimated absolute damage difference compared to the reference damage calculated on a complete dataset. Outliers are visualised as red points in the plots.
Consistently with the literature (Kelman and Spence, 2004; Schröter et al., 2014; Dottori et al., 2016; Amadio et al., 2019; Scorzini et al., 2022), Fig. 4 confirms the importance for flood damage modelling of relying on accurate input data for water depth, even though damage differences associated with it are limited, on average, around EUR 10 000 (Fig. 4a), due to the intrinsic small variability assumed for this variable in the generation of representative distributions for the context of northern Italy (Fig. 2). Albeit with a lower influence, sediment load, inundation duration and the indicator for the presence of pollutants can be ranked as other important hazard input features, with the latter two inducing more variability in the results, as a consequence of some damage mechanisms activated in INSYDE on the basis of thresholds for d or q (Dottori et al., 2016; for clarity, an example of such a damage mechanism is reported in the Supplement). The riverine inundation characteristics, typical of the examined context (Fig. 2) and insufficient to cause structural damage (Clausen and Clark, 1990), also explain why a lack of input data on flow velocity does not induce any tangible effect on damage estimation. A different pattern is instead visible in the lower panel of Fig. 4, obtained from a sampling based on the extended synthetic dataset (Figs. S2 and S3), featuring larger ranges of values for the tested input variables and thus providing more general insights into model sensitivity to input data availability (regardless of the specific local characteristics for the context of model customisation). In this case, apart from the greater differences observed in absolute terms, Fig. 4 indicates that velocity has a far more relevant impact than inundation duration on damage estimation uncertainty when dealing with long-lasting flood events (as represented in the extended synthetic dataset, Fig. S2), exceeding the duration threshold assumed for certain damage mechanisms (Dottori et al., 2016; please refer to the code of INSYDE 2.0 for details).
Regarding building characteristics, the upper panel of Fig. 4 reveals the significant and obvious influence of the extensive features (FA, IP, EP), of the binary variable BE for the presence of the basement (which masks the importance of the basement-related variables, BA, BP and BH) and of the building's elevation with respect to the ground level (GL). The finishing level (FL) causes relevant variability in model outcomes, with an observed median damage difference of about EUR 670 for the Po River data, while detailed knowledge of variables such as the level of maintenance (LM), building structure (BS) and heating distribution (PD) type – and even more the number of floors (NF) and the year of construction (YY) – appears to provide an overall negligible impact on damage estimation uncertainty. Again, such results are dependent on the specific datasets used for sampling missing values, and, therefore, for a more general overview of the ranking of the feature importance in INSYDE 2.0, it is possible to refer to the lower panel of Fig. 4, which illustrates how some variables (such as NF, BS, PD and PT) gain increasing importance when hazard parameters are set to (larger) values capable of activating damage mechanisms for more building components. These findings demonstrate how the importance of specific input parameters can vary depending on the characteristics of the study region, thus highlighting the cruciality of relying on regionally representative hazard and building datasets for enhanced and efficient flood damage modelling.
3.2.2 Analysis of damage estimation uncertainty
Analysis on the Po River District synthetic dataset
Figure 5 reports the results of the analysis aimed at evaluating the performance of INSYDE 2.0 when the absence of multiple inputs is considered. In detail, the figure shows the mean damage and standard deviation calculated for each of the 5000 modified (i.e. with multiple missing inputs) items over their 1000 complete replicates generated by populating the missing information with values sampled from the Po River District synthetic dataset. Interestingly, the figure shows that, for all building typologies, the results tend to lie on two different trend lines corresponding to higher or lower damage variability. A closer inspection of the results revealed that these distinct patterns are not necessarily related to the quantity of missing variables but rather to their role in the damage mechanisms implemented in INSYDE. Indeed, in certain instances, the estimated damage for certain building components depends on the occurrence of specific conditions across multiple variables. In such cases, when more than one of these conditions are met, the maximum resulting damage is assumed to hold, as the most unfavourable state is thought to dominate the damage mechanism regardless of other conditions (Dottori et al., 2016). This situation is exemplified by components related to interior or exterior plaster (details in the Supplement and in the code). Here, damage occurrence is supposed to depend on inundation duration and flow velocity, as expressed by the corresponding fragility functions, as well as on water quality (q) and the level of maintenance (LM) of the building; specifically, a 100 % probability of damage occurrence is assigned in the case of contaminated water (q= 1) or an average/poor level of maintenance (LM ≤ 1). These conditions applied to the latter two variables are the ones that eliminate any potential estimation uncertainties arising from missing data on other parameters involved in the damage mechanism. A similar uncertainty-limiting behaviour is also distinctive of damage to pavement components, which theoretically depend on different input features but only when the finishing level (FL) is set to certain values (FL > 1).
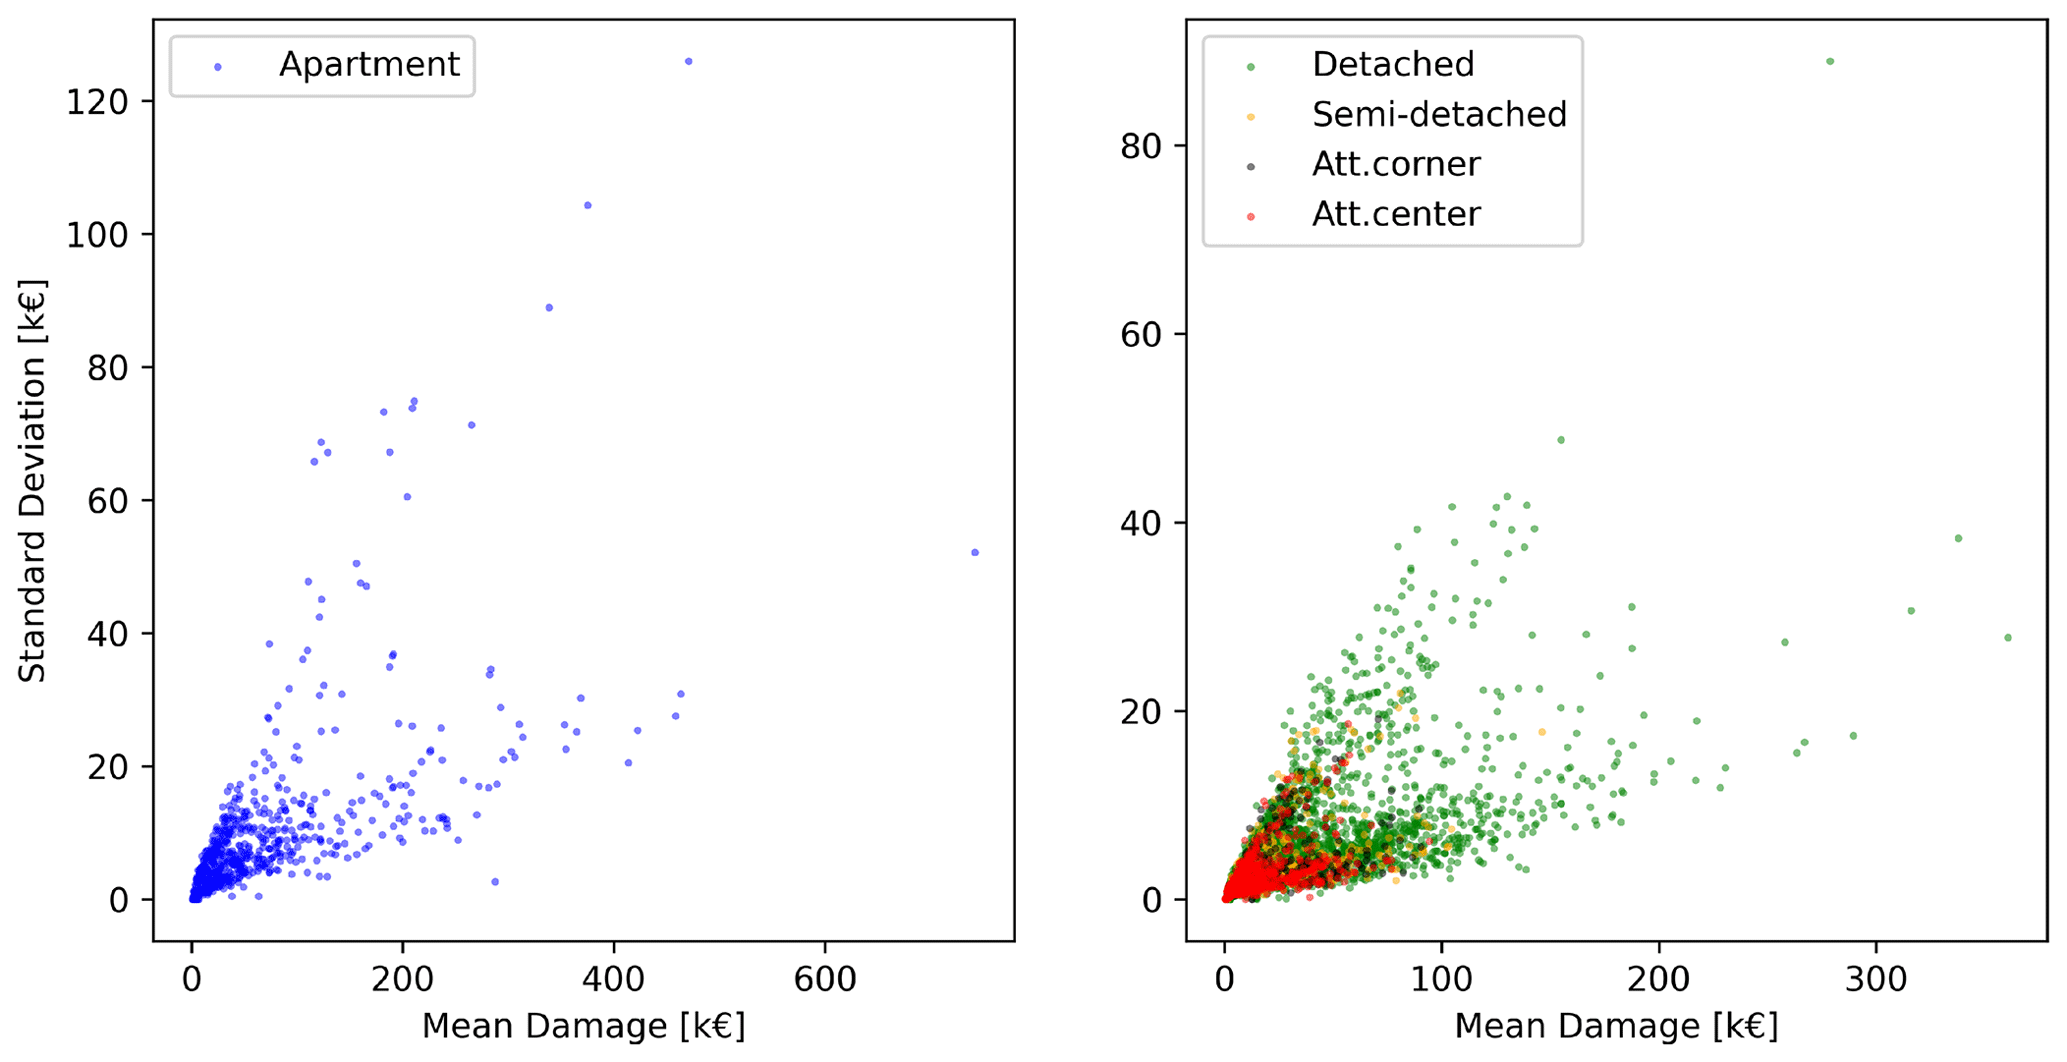
Figure 5Damage estimation variability observed using the altered (i.e. with randomly generated multiple missing inputs) Po River District synthetic dataset.
Analysis on observed data from recent flood events
Similar trend patterns to those presented in Fig. 5 are also evident in Fig. 6, which displays the results obtained by replicating the data-filling procedure applied to the datasets for the flood events in Lodi and Caldogno, both of which were originally characterised by the presence of some unknown input features (Table 3). The minor differences visible between the two case studies (Fig. 6) are again a consequence of the types of missing variables within each dataset.
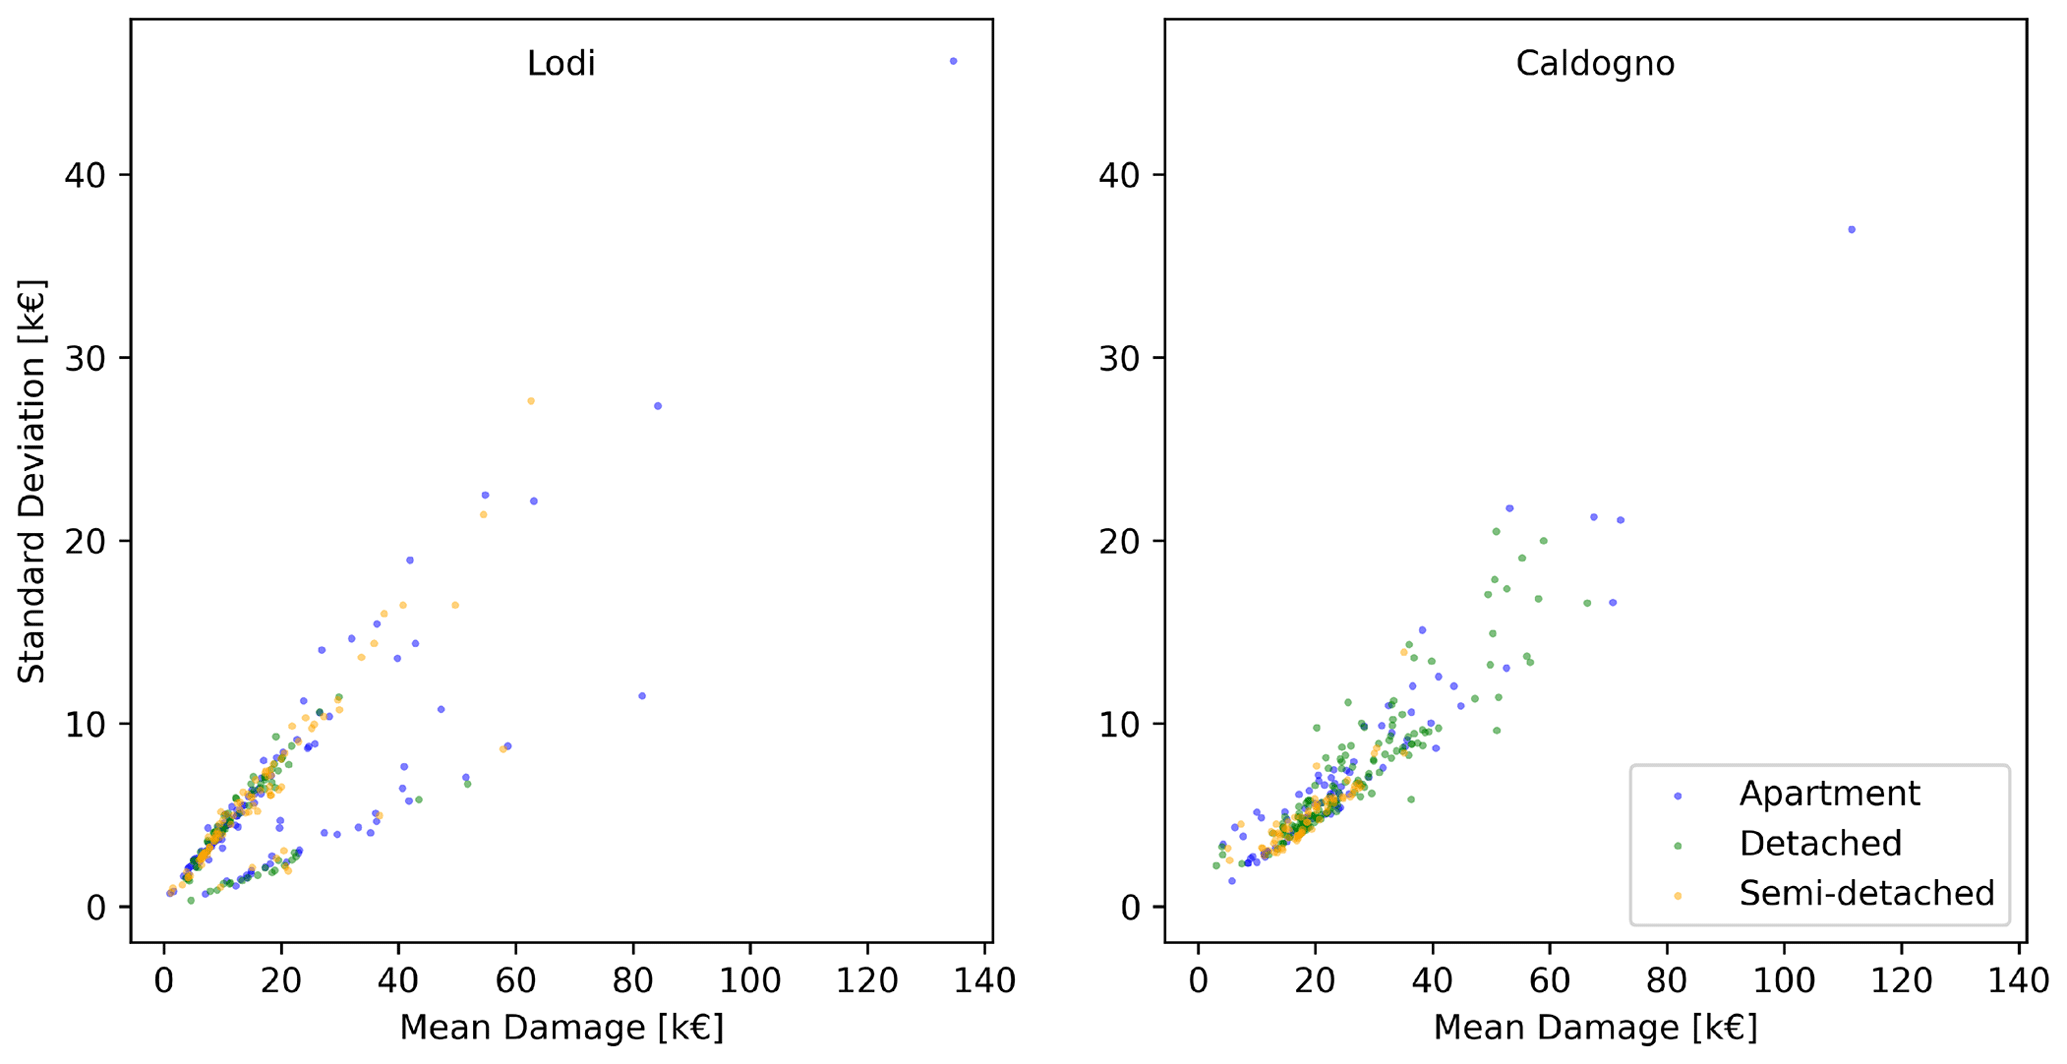
Figure 6Damage estimation variability observed using the datasets for the case studies of Lodi and Caldogno.
Specifically, the points lying on the lower-variability trend line for the Lodi case are representative of those buildings with available information on GL, which significantly reduces damage estimation uncertainty. If excluding these data, Lodi generally exhibits slightly larger standard deviations for the same calculated mean damage in Caldogno. Such a difference can be explained by considering the input data availability in the two cases for certain key variables (q and LM) which can act as limiting or amplifying factors of damage estimation variability. In detail, complete information on these key variables is only available for the Lodi dataset, with just a restricted number of buildings exhibiting the mentioned “uncertainty-limiting values” q= 1 and LM ≤ 1 (in ∼ 6 % and ∼ 15 %, respectively, of the elements in the dataset).
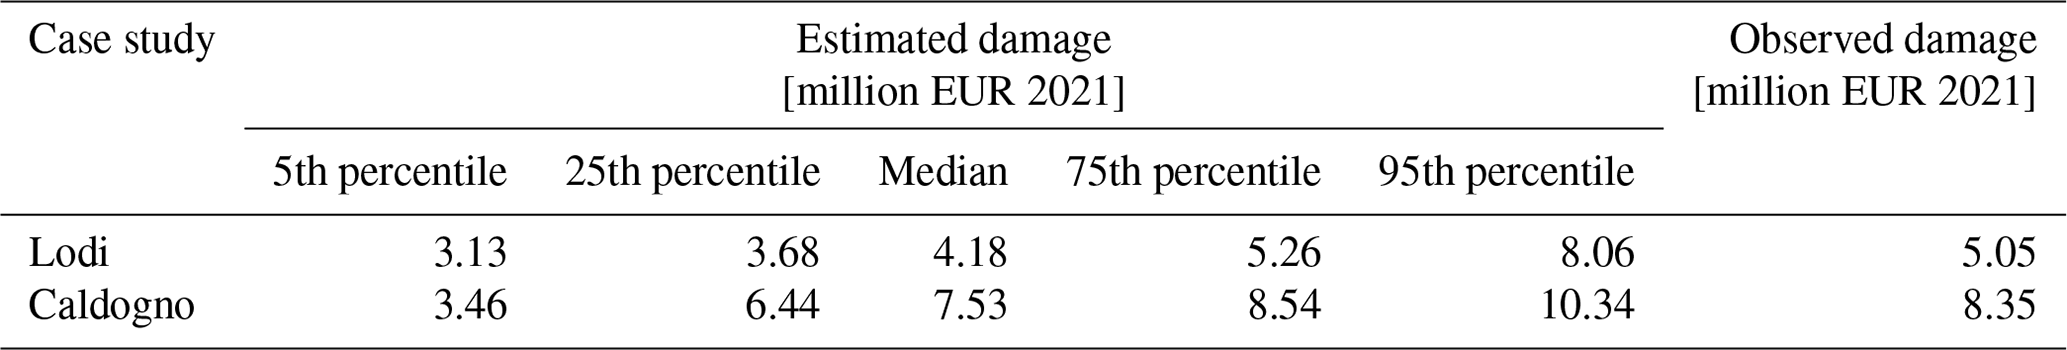
The two case studies were also considered to highlight the value of the proposed approach in interpreting the results of model validation, which is particularly important for a complex multi-variable damage model like INSYDE. The outcomes of the test are summarised in Table 4, which compares total observed losses to damage statistics obtained by applying INSYDE 2.0 to 1000 replicates for each affected item in the two building portfolios containing missing input features. These findings are complemented by Fig. 7, which offers a visual representation of the detected differences between estimations and observations at the individual building scale.
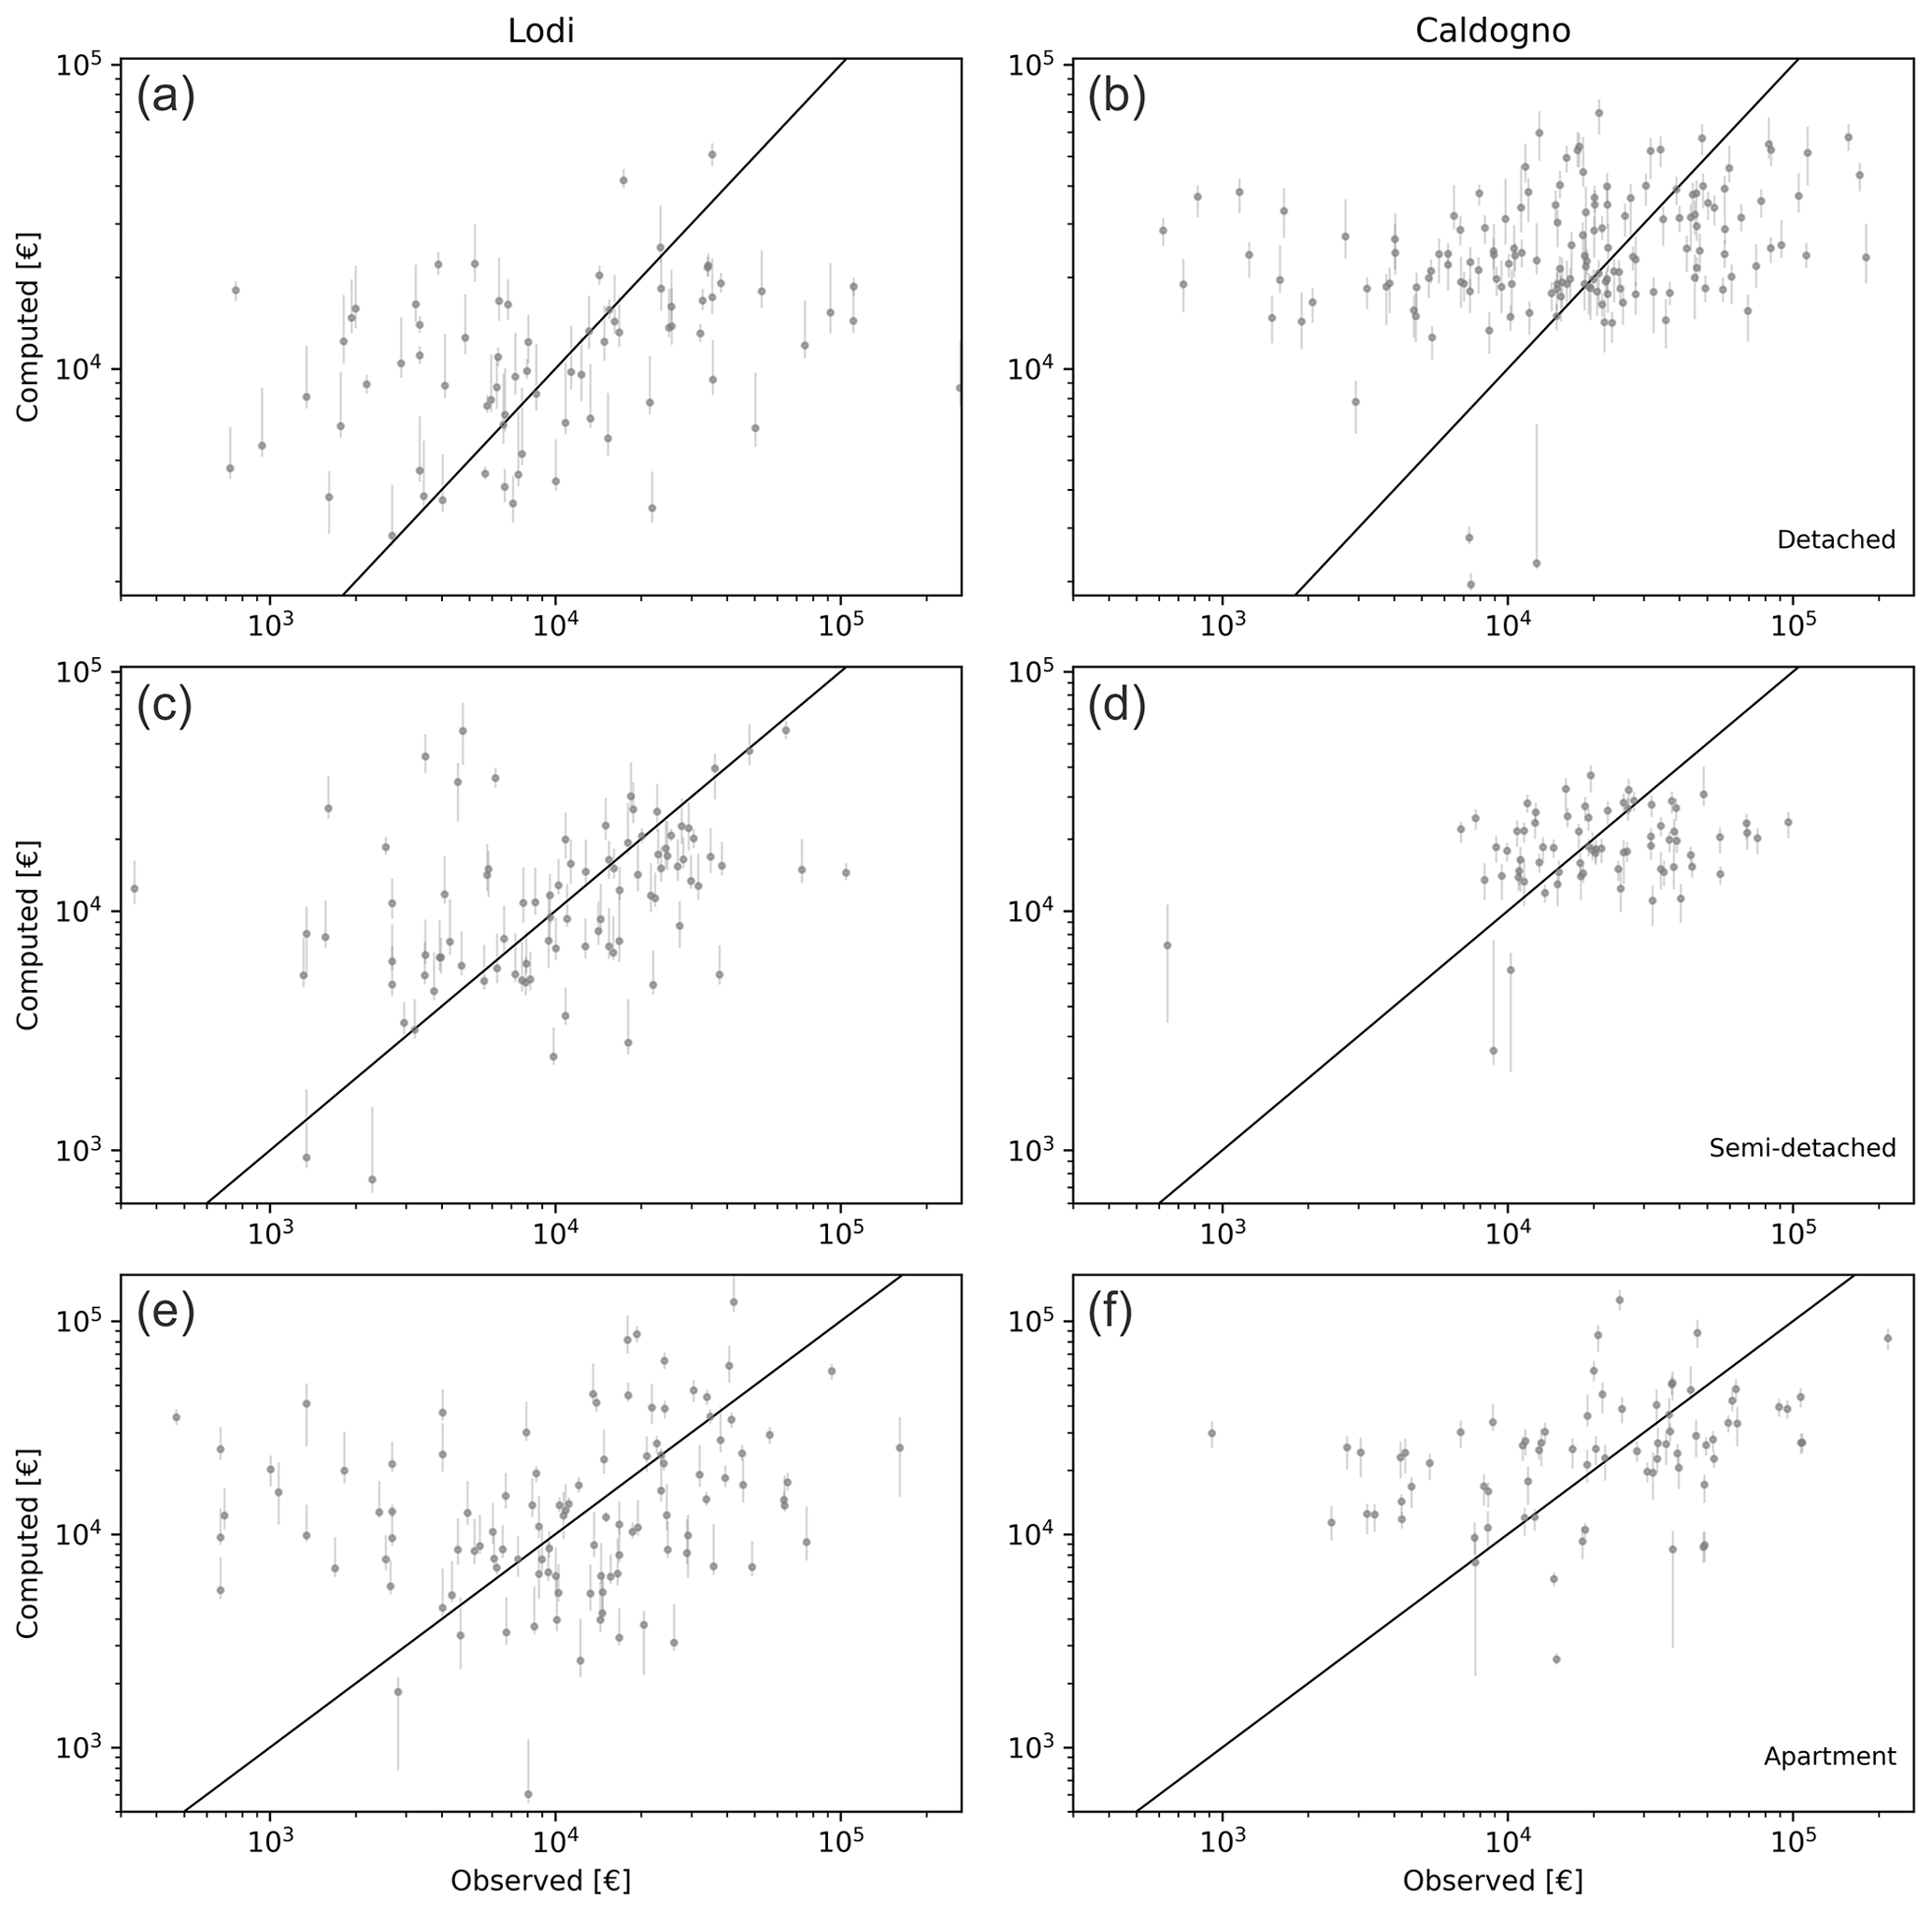
Figure 7Results of the probabilistic validation of INSYDE 2.0 for the case study of Lodi (a, c, e) and Caldogno (b, d, f). The median computed damage (dots) and corresponding interquartile range (vertical lines) are plotted for each building against observed damage (expressed in 2021 EUR).
Table 4 illustrates a general convergence between observed and estimated damage, particularly around the 75th percentile, where the calculated losses align with the reported values. The median estimates exhibit a satisfactory level of agreement with the observed losses, which is consistent with typical outcomes observed in validation exercises for models demonstrating overall good performances (e.g. Amadio et al., 2019; Molinari et al., 2020). It should be noted that the model tends to overestimate lower entity damage across all building types (Fig. 7), but this discrepancy, rather than being a consequence of any model-related issue, can be primarily attributed to the limitations in the representativeness of claims data, particularly for minor losses, as documented in the literature (Merz et al., 2008; Molinari et al., 2020; Pinelli et al., 2020).
Table 4Results of the probabilistic validation of INSYDE 2.0 for the case studies of Lodi and Caldogno: statistics of total estimated damage versus reported damage.
While confirming the performance of INSYDE 2.0 in accurately depicting the overall damage figures for the two events, the results of this analysis emphasise the benefits of incorporating the treatment of input data uncertainty when presenting model validation outcomes, also in consideration of the well-known biases and limitations of damage observations in fully capturing reality (Molinari et al., 2020). Indeed, previous validation exercises applied to earlier model versions, relying on a deterministic approach for handling unknown input features, while reporting limited errors ranging from −1.7 % to +5.1 % for Caldogno and up to +19.1 % for Lodi (Dottori et al., 2016; Amadio et al., 2019), lacked insights into the uncertainty introduced by the selection of fixed default values for handling missing variables in the tested cases. Here, by providing a clear indication of the uncertainty bounds of the estimations, the new approach enhances the model's robustness, transparency and reliability, thus effectively mitigating the risk of conveying a false perception of certainty, which may be instead encountered with simpler deterministic approaches or even with more sophisticated models when used in combination with oversimplified assumptions (Merz et al., 2008; Pappenberger and Beven, 2006).
Accurately assessing flood risk is crucial for mitigating the potentially devastating effects of flooding. However, the complexity of the systems involved and the significant number of data required make flood damage estimation a challenging task, susceptible to uncertainties from input data, model structure and assumptions. Achieving a trade-off between outcome reliability (with a quantitative characterisation of uncertainty) and estimation efforts (in terms of time and financial resources for both data retrieval and modelling) is essential for efficient and comprehensive risk assessments, enabling optimal decision-making (Apel et al., 2008; Merz et al., 2015; Sieg et al., 2023). To strike this balance, it is important to examine the possible added value of utilising detailed data and advanced methodologies, as well as of identifying critical variables that reduce damage estimation uncertainty, justifying investment in data collection.
In this context, the present study aimed at addressing these issues through the development of an updated version of a multi-variable flood damage model, INSYDE, which estimates direct economic damage at the building scale as a function of several flood event and building features. Given the number and detail of required input variables, retrieving and preparing data for a multi-variable model, like INSYDE, can be resource-intensive; on the other hand, incomplete inputs may exert a significant impact on the variability of calculated damage. The proposed updated version of INSYDE thus incorporates a probabilistic module for filling missing input data, offering transparent information on uncertainties arising from limited knowledge of damage explicative variables. This approach, tailored to the Po River District as an exemplificatory case, ensures more reliable and robust assessments, reducing the risk of conveying a false perception of certainty that can occur when using univariable, simple deterministic approaches or even when interpreting the results of model validation exercises (Merz et al., 2005; Pappenberger and Beven, 2006; Amadio et al., 2019; Molinari et al., 2019, 2020). Therefore, the primary lesson learned from INSYDE 2.0 lies in transcending the confines of deterministic damage models. By challenging the conventional notion of certainty in damage assessments, our approach emphasised the importance of acknowledging uncertainty arising from “known unknowns”. From a decision-maker perspective, a thorough understanding of modelling assumptions and awareness of the broad variability in model outcomes stemming from limited knowledge of certain inputs can indeed be crucial for making well-informed decisions. As a second aspect, acknowledging the complex interplay of assumptions in model input and output as well as possible biases in observed damage, we also question the use of the term “validation” in damage modelling, as this may imply a level of certainty that is inherently elusive. Our idea, instead, shifts from just seeking convergence between estimations and observations to embracing a comprehensive understanding of the uncertainties that characterise flood damage estimations.
In this context, the present study (even under necessary assumptions about certain variables due to the lack of pertinent information) demonstrates the value of generating comprehensive local synthetic datasets of flood hazard and building features that can be leveraged to identify key variables worthy of specific investment in data retrieval. Additionally, the development and use of synthetic datasets, combined with uncertainty analysis on model outcomes, can help in bridging the data gaps and addressing the challenges associated with the availability and completeness of input variables.
Results obtained also indicated that, besides standard hazard variables, an accurate description of building features is essential to derive reliable estimations of flood damage (Schröter et al., 2018; Molinari et al., 2020; Taramelli et al., 2022). While data retrieval on a large scale for some of the vulnerability variables can be costly (Ruggieri et al., 2021), the use of the proposed probabilistic missing data-filling procedure, based on representative datasets of the local building stock, can be employed as an option. This can help not only to solve the problem of insufficient knowledge about certain input features (Pinelli et al., 2020; Gómez Zapata et al., 2022), but also to provide decision-makers with a better understanding of the uncertainty associated with the estimations (Razavi et al., 2021). Moreover, the lessons derived from the feature importance analysis conducted in this study highlight the significance of relying on representative datasets that capture the characteristics of the investigated area for proper identification of the key variables to be considered when modelling flood damage.
The process for developing these specific datasets, here exemplified for northern Italy but theoretically replicable, with adaptation, in any other region/country, mainly involves a combination of traditional methods for data collection, such as desk-based analysis of statistical data sources as well as virtual surveys; even though such tasks can be time-consuming, especially in consideration of the possible significant regional spatial variability in the building stock, it is worth noting that emerging technologies, such as remote sensing and automatic image reconnaissance (Velez et al., 2022), can potentially enhance the process in the future, enabling more efficient and accurate exposure and vulnerability modelling.
In conclusion, this study demonstrates the significant added value of adopting a probabilistic approach with the explicit treatment of input data uncertainties, thus providing insights for more informed risk assessments while ensuring efficient data collection procedures. Overall, it also emphasises the enduring importance of continuously refining data collection and modelling approaches, given that a comprehensive and reliable characterisation of inundation phenomena and impacted assets remains crucial for enhancing confidence in the outcomes of damage assessment processes.
The code of INSYDE 2.0 is available from Mendeley Data, https://doi.org/10.17632/jpdb89gxn5.1 (Di Bacco et al., 2024).
Original data from ISTAT (Italian National Institute of Statistics) and OSM (OpenStreetMap) are publicly accessible through their respective databases at https://esploradati.censimentopopolazione.istat.it/databrowser/ (last access: 6 May 2024) and https://www.openstreetmap.org/ (last access: 6 May 2024). Processed and virtual survey data for the Po River District can be found in the work of Huarya Mena (2022, https://www.politesi.polimi.it/handle/10589/187358, last access: 6 May 2024). The datasets for Lodi and Caldogno are confidential and are available from the corresponding author upon reasonable request.
The supplement related to this article is available online at: https://doi.org/10.5194/nhess-24-1681-2024-supplement.
Conceptualisation: MDB, DM and ARS; data curation: MDB and ARS; formal analysis: MDB and ARS; investigation of results: MDB, DM and ARS; software: MDB; visualisation: MDB and ARS; writing – original draft: ARS; writing – final draft: MDB, DM and ARS.
The contact author has declared that none of the authors has any competing interests.
Publisher’s note: Copernicus Publications remains neutral with regard to jurisdictional claims made in the text, published maps, institutional affiliations, or any other geographical representation in this paper. While Copernicus Publications makes every effort to include appropriate place names, the final responsibility lies with the authors.
The authors gratefully acknowledged Grecia Geraldine Huayra Mena for contributing to the first phase of the present study during her MSc and the Po River District Basin Authority for supplying the data required for the investigation of hazard features in northern Italy.
This study was carried out within the RETURN Extended Partnership and received funding from the European Union NextGenerationEU (National Recovery and Resilience Plan – NRRP, Mission 4, Component 2, Investment 1.3 – D.D. 1243 2/8/2022, PE0000005).
This paper was edited by Brunella Bonaccorso and reviewed by Julius Schlumberger and one anonymous referee.
Albano, R., Sole, A., Adamowski, J., Perrone, A., and Inam, A.: Using FloodRisk GIS freeware for uncertainty analysis of direct economic flood damages in Italy, Int. J. Appl. Earth. Obs., 73, 220–229, https://doi.org/10.1016/j.jag.2018.06.019, 2018.
Amadio, M., Scorzini, A. R., Carisi, F., Essenfelder, A. H., Domeneghetti, A., Mysiak, J., and Castellarin, A.: Testing empirical and synthetic flood damage models: the case of Italy, Nat. Hazards Earth Syst. Sci., 19, 661–678, https://doi.org/10.5194/nhess-19-661-2019, 2019.
Apel, H., Merz, B., and Thieken, A. H.: Quantification of uncertainties in flood risk assessments, Int. J. River Basin Manag., 6, 149–162, https://doi.org/10.1080/15715124.2008.9635344, 2008.
Autorità di Bacino del Fiume Po: Aggiornamento e revisione del Piano di Gestione del Rischio di Alluvione – II ciclo (2021–2027), Final report, https://pianoalluvioni.adbpo.it/piano-gestione-rischio-alluvioni-2021/ (last access: 9 October 2023), 2022.
Bhuyan, K., Van Westen, C., Wang, J., and Meena, S. R.: Mapping and characterising buildings for flood exposure analysis using open-source data and artificial intelligence, Nat. Hazards, 119, 805–835, https://doi.org/10.1007/s11069-022-05612-4, 2023.
Cammerer, H., Thieken, A. H., and Lammel, J.: Adaptability and transferability of flood loss functions in residential areas, Nat. Hazards Earth Syst. Sci., 13, 3063–3081, https://doi.org/10.5194/nhess-13-3063-2013, 2013.
Clausen, L. and Clark, P. B.: The development of criteria for predicting dam break flood damages using modelling of historical dam failures, in: International Conference on River Flood Hydraulics, edited by: White, W. R., Hydraulics Research Limited, John Wiley & Sons Ltd., Wallingford, UK, 369–380, ISBN 0471927139, 1990.
Di Bacco, M., Rotello, P., Suppasri, A., and Scorzini, A. R.: Leveraging data driven approaches for enhanced tsunami damage modelling: Insights from the 2011 Great East Japan event, Environ. Modell. Softw., 160, 105604, https://doi.org/10.1016/j.envsoft.2022.105604, 2023.
Di Bacco, M., Molinari, D., and Scorzini, A. R.: INSYDE 2.0, Mendeley Data [code], https://doi.org/10.17632/jpdb89gxn5.1, 2024.
Dottori, F., Figueiredo, R., Martina, M. L. V., Molinari, D., and Scorzini, A. R.: INSYDE: a synthetic, probabilistic flood damage model based on explicit cost analysis, Nat. Hazards Earth Syst. Sci., 16, 2577–2591, https://doi.org/10.5194/nhess-16-2577-2016, 2016.
Galliani, M., Molinari, D., and Ballio, F.: Brief Communication: Simple-INSYDE, development of a new tool for flood damage evaluation from an existing synthetic model, Nat. Hazards Earth Syst. Sci., 20, 2937–2941, https://doi.org/10.5194/nhess-20-2937-2020, 2020.
Gómez Zapata, J. C., Pittore, M., Cotton, F., Lilienkamp, H., Shinde, S., Aguirre, P., and Santa María, H.: Epistemic uncertainty of probabilistic building exposure compositions in scenario-based earthquake loss models, B. Earthq. Eng., 20, 2401–2438, https://doi.org/10.1007/s10518-021-01312-9, 2022.
Huayra Mena, G. C.: Flood damage model: development of INSYDE in the Po River basin, Master thesis, Politecnico di Milano, Milano, 137 pp., https://www.politesi.polimi.it/handle/10589/187358 (last access: 6 May 2024), 2022.
Kelman, I. and Spence, R.: An overview of flood actions on buildings, Eng. Geol., 73, 297–309, https://doi.org/10.1016/j.enggeo.2004.01.010, 2004.
Malgwi, M. B., Schlögl, M., and Keiler, M.: Expert-based versus data-driven flood damage models: A comparative evaluation for data-scarce regions, Int. J. Disast. Risk Re., 57, 102148, https://doi.org/10.1016/j.ijdrr.2021.102148, 2021.
Marvi, M. T.: A review of flood damage analysis for a building structure and contents, Nat. Hazards, 102, 967–995, https://doi.org/10.1007/s11069-020-03941-w, 2020.
Merz, B., Kreibich, H., and Apel, H.: Flood risk analysis: uncertainties and validation, Österreichische Wasser- und Abfallwirtschaft, 60, 89–94, https://doi.org/10.1007/s00506-008-0001-4, 2008.
Merz, B., Kreibich, H., Schwarze, R., and Thieken, A.: Review article “Assessment of economic flood damage”, Nat. Hazards Earth Syst. Sci., 10, 1697–1724, https://doi.org/10.5194/nhess-10-1697-2010, 2010.
Merz, B., Vorogushyn, S., Lall, U., Viglione, A., and Blöschl, G.: Charting unknown waters – On the role of surprise in flood risk assessment and management, Water Resour. Res., 51, 6399–6416, https://doi.org/10.1002/2015WR017464, 2015.
Mohor, G. S., Hudson, P., and Thieken, A. H.: A Comparison of Factors Driving Flood Losses in Households Affected by Different Flood Types, Water Resour. Res., 56, e2019WR025943, https://doi.org/10.1029/2019WR025943, 2020
Molinari, D. and Scorzini, A. R.: On the influence of input data quality to flood damage estimation: The performance of the INSYDE model, Water, 9, 688, https://doi.org/10.3390/w9090688, 2017.
Molinari, D., De Bruijn, K. M., Castillo-Rodríguez, J. T., Aronica, G. T., and Bouwer, L. M.: Validation of flood risk models: Current practice and possible improvements, Int. J. Disast. Risk Re., 33, 441–448 https://doi.org/10.1016/j.ijdrr.2018.10.022, 2019.
Molinari, D., Scorzini, A. R., Arrighi, C., Carisi, F., Castelli, F., Domeneghetti, A., Gallazzi, A., Galliani, M., Grelot, F., Kellermann, P., Kreibich, H., Mohor, G. S., Mosimann, M., Natho, S., Richert, C., Schroeter, K., Thieken, A. H., Zischg, A. P., and Ballio, F.: Are flood damage models converging to “reality”? Lessons learnt from a blind test, Nat. Hazards Earth Syst. Sci., 20, 2997–3017, https://doi.org/10.5194/nhess-20-2997-2020, 2020.
Morgan, M. G., Henrion, M., and Small, M.: Uncertainty: a guide to dealing with uncertainty in quantitative risk and policy analysis, Cambridge University Press, Cambridge, UK, ISBN 0521365422, 1990.
Nofal, O. M., van de Lindt, J. W., and Do, T. Q.: Multi-variate and single-variable flood fragility and loss approaches for buildings, Reliab. Eng. Syst. Safe, 202, 106971, https://doi.org/10.1016/j.ress.2020.106971, 2020.
Papathoma-Köhle, M., Neuhäuser, B., Ratzinger, K., Wenzel, H., and Dominey-Howes, D.: Elements at risk as a framework for assessing the vulnerability of communities to landslides, Nat. Hazards Earth Syst. Sci., 7, 765–779, https://doi.org/10.5194/nhess-7-765-2007, 2007.
Pappenberger, F. and Beven, K. J.: Ignorance is bliss: Or seven reasons not to use uncertainty analysis, Water Resour. Res., 42, W05302, https://doi.org/10.1029/2005WR004820, 2006.
Paulik, R., Wild, A., Zorn, C., and Wotherspoon, L.: Residential building flood damage: Insights on processes and implications for risk assessments, J. Flood Risk Manag., 15, e12832, https://doi.org/10.1111/jfr3.12832, 2022.
Penning-Rowsell, E., Johnson, C., Tunstall, S., Morris, J., Chatterton, J., Green, C., Koussela, K., and Fernandez-Bilbao, A.: The Benefits of Flood and Coastal Risk Management: a Handbook of Assessment Techniques, Middlesex Univ. Press, Middlesex, Hydraulic Engineering Reports, ISBN 1904750516, 2005.
Pinelli, J. P., Da Cruz, J., Gurley, K., Paleo-Torres, A. S., Baradaranshoraka, M., Cocke, S., and Shin, D.: Uncertainty reduction through data management in the development, validation, calibration, and operation of a hurricane vulnerability model, Int. J. Disast. Risk Sc., 11, 790–806, https://doi.org/10.1007/s13753-020-00316-4, 2020.
Razavi, S., Jakeman, A., Saltelli, A., Prieur, C., Iooss, B., Borgonovo, E., Plischke, E., Lo Piano, S., Iwanaga, T., Becker, W., Tarantola, S., Guillaume, J.H.A., Jakeman, J., Gupta, H., Melillo, N., Rabitti, G., Chabridon, V., Duan, Q., Sun, X., Smith, S., Sheikholeslami, R., Hosseini, N., Asadzadeh, M., Puy, A., Kucherenko, S., and Maier, H. R.: The future of sensitivity analysis: An essential discipline for systems modeling and policy support, Environ. Modell. Softw., 137, 104954, https://doi.org/10.1016/j.envsoft.2020.104954, 2021.
Rözer, V., Kreibich, H., Schröter, K., Müller, M., Sairam, N., Doss-Gollin, J., Lall, U., and Merz, B.: Probabilistic models significantly reduce uncertainty in Hurricane Harvey pluvial flood loss estimates, Earths Future, 7, 384–394, https://doi.org/10.1029/2018EF001074, 2019.
Ruggieri, S., Cardellicchio, A., Leggieri, V., and Uva, G.: Machine-learning based vulnerability analysis of existing buildings, Autom. Constr., 132, 103936, https://doi.org/10.1016/j.autcon.2021.103936, 2021.
Sairam, N., Schröter, K., Rözer, V., Merz, B., and Kreibich, H.: Hierarchical Bayesian approach for modeling spatiotemporal variability in flood damage processes, Water Resour. Res., 55, 8223–8237, https://doi.org/10.1029/2019WR025068, 2019.
Sayers, P. B., Hall, J. W., and Meadowcroft, I. C.: Towards risk-based flood hazard management in the UK, in: Proceedings of the Institution of Civil Engineers-Civil Engineering, Thomas Telford Ltd., Vol. 150, 36–42, https://doi.org/10.1680/cien.2002.150.5.36, 2002.
Schröter, K., Kreibich, H., Vogel, K., Riggelsen, C., Scherbaum, F., and Merz, B.: How useful are complex flood damage models?, Water Resour. Res., 50, 3378–3395, https://doi.org/10.1002/2013WR014396, 2014.
Schröter, K., Lüdtke, S., Redweik, R., Meier, J., Bochow, M., Ross, L., Nagel, C., and Kreibich, H.: Flood loss estimation using 3D city models and remote sensing data, Environ. Modell. Softw., 105, 118–131, https://doi.org/10.1016/j.envsoft.2018.03.032, 2018.
Scorzini, A. R., Di Bacco, M., and Manella, G.: Regional flood risk analysis for agricultural crops: Insights from the implementation of AGRIDE-c in central Italy, Int. J. Disast. Risk Re., 53, 101999, https://doi.org/10.1016/j.ijdrr.2020.101999, 2021.
Scorzini, A. R., Dewals, B., Rodriguez Castro, D., Archambeau, P., and Molinari, D.: INSYDE-BE: adaptation of the INSYDE model to the Walloon region (Belgium), Nat. Hazards Earth Syst. Sci., 22, 1743–1761, https://doi.org/10.5194/nhess-22-1743-2022, 2022.
Sieg, T., Kienzler, S., Rözer, V., Vogel, K., Rust, H., Bronstert, A., Kreibich, H., Merz, B., and Thieken, A. H.: Toward an adequate level of detail in flood risk assessments, J. Flood Risk Manag., 16, e12889, https://doi.org/10.1111/jfr3.12889, 2023.
Taramelli, A., Righini, M., Valentini, E., Alfieri, L., Gatti, I., and Gabellani, S.: Building-scale flood loss estimation through vulnerability pattern characterization: application to an urban flood in Milan, Italy, Nat. Hazards Earth Syst. Sci., 22, 3543–3569, https://doi.org/10.5194/nhess-22-3543-2022, 2022.
Velez, R., Calderon, D., Carey, L., Aime, C., Hultquist, C., Yetman, G., Kruczkiewicz, A., Gorokhovich, Y. and Chen, R. S.: Advancing Data for Street-Level Flood Vulnerability: Evaluation of Variables Extracted from Google Street View in Quito, Ecuador, IEEE Open Journal of the Computer Society, 3, 51–61, https://doi.org/10.1109/OJCS.2022.3166887, 2022.
Wagenaar, D. J., de Bruijn, K. M., Bouwer, L. M., and de Moel, H.: Uncertainty in flood damage estimates and its potential effect on investment decisions, Nat. Hazards Earth Syst. Sci., 16, 1–14, https://doi.org/10.5194/nhess-16-1-2016, 2016.
Wagenaar, D., de Jong, J., and Bouwer, L. M.: Multi-variable flood damage modelling with limited data using supervised learning approaches, Nat. Hazards Earth Syst. Sci., 17, 1683–1696, https://doi.org/10.5194/nhess-17-1683-2017, 2017.
Wagenaar, D., Lüdtke, S., Schröter, K., Bouwer, L. M., and Kreibich, H.: Regional and temporal transferability of multivariable flood damage models, Water Resour. Res., 54, 3688–3703, https://doi.org/10.1029/2017WR022233, 2018.
Winter, B., Schneeberger, K., Huttenlau, M., and Stötter, J.: Sources of uncertainty in a probabilistic flood risk model, Nat. Hazards, 91, 431–446, https://doi.org/10.1007/s11069-017-3135-5, 2018.
Zarekarizi, M., Srikrishnan, V., and Keller, K.: Neglecting uncertainties biases house-elevation decisions to manage riverine flood risks, Nat. Commun., 11, 1–11, https://doi.org/10.1038/s41467-020-19188-9, 2020.