the Creative Commons Attribution 4.0 License.
the Creative Commons Attribution 4.0 License.
 | 08 May 2024
Limited effect of the confluence angle and tributary gradient on Alpine confluence morphodynamics under intense sediment loads
Théo St. Pierre Ostrander
Thomé Kraus
Bruno Mazzorana
Johannes Holzner
Andrea Andreoli
Francesco Comiti
Bernhard Gems
Confluences are dynamic morphological nodes that are found in all river networks. In mountain regions, they are influenced by hydraulic and sedimentary processes that occur in steep channels during extreme events in small watersheds. Sediment transport in the tributary channel and aggradation in the confluence can be massive, potentially causing overbank flooding and sedimentation into adjacent settlement areas. Previous works dealing with confluences have mainly focused on lowland regions, and those that have focused on mountain areas have used sediment concentrations and channel gradients that are largely under-representative of mountain river conditions. The presented work contributes to filling this research gap with 45 experiments that use a large-scale physical model. Geometric model parameters, the applied grain size distribution, and the considered discharges represent the conditions at 135 confluences in South Tyrol (Italy) and Tyrol (Austria).
The experimental program allowed for a comprehensive analysis of the effects of (i) the confluence angle, (ii) the tributary gradient, (iii) the channel discharges, and (iv) the tributary sediment concentration. In contrast to most research dealing with confluences, results indicate that, in the presence of an intense tributary sediment supply and a small tributary-to-main-channel discharge ratio (0.1), the confluence angle does not have a decisive effect on confluence morphology. Adjustments to the tributary channel gradient yielded the same results. A reoccurring range of depositional geomorphic units was observed in which a deposition cone transitioned to a bank-attached bar. The confluence morphology and tributary channel gradient rapidly adjusted, tending towards an equilibrium state to accommodate both water discharges and the sediment load from the tributary. Statistical analyses demonstrated that the confluence morphology was controlled by the combined channel discharge and the depositional or erosional extent was controlled by the sediment concentration. Applying conclusions drawn from lowland confluence dynamics could misrepresent depositional and erosional patterns and the related flood hazard at mountain river confluences.
- Article
(19191 KB) - Full-text XML
- BibTeX
- EndNote


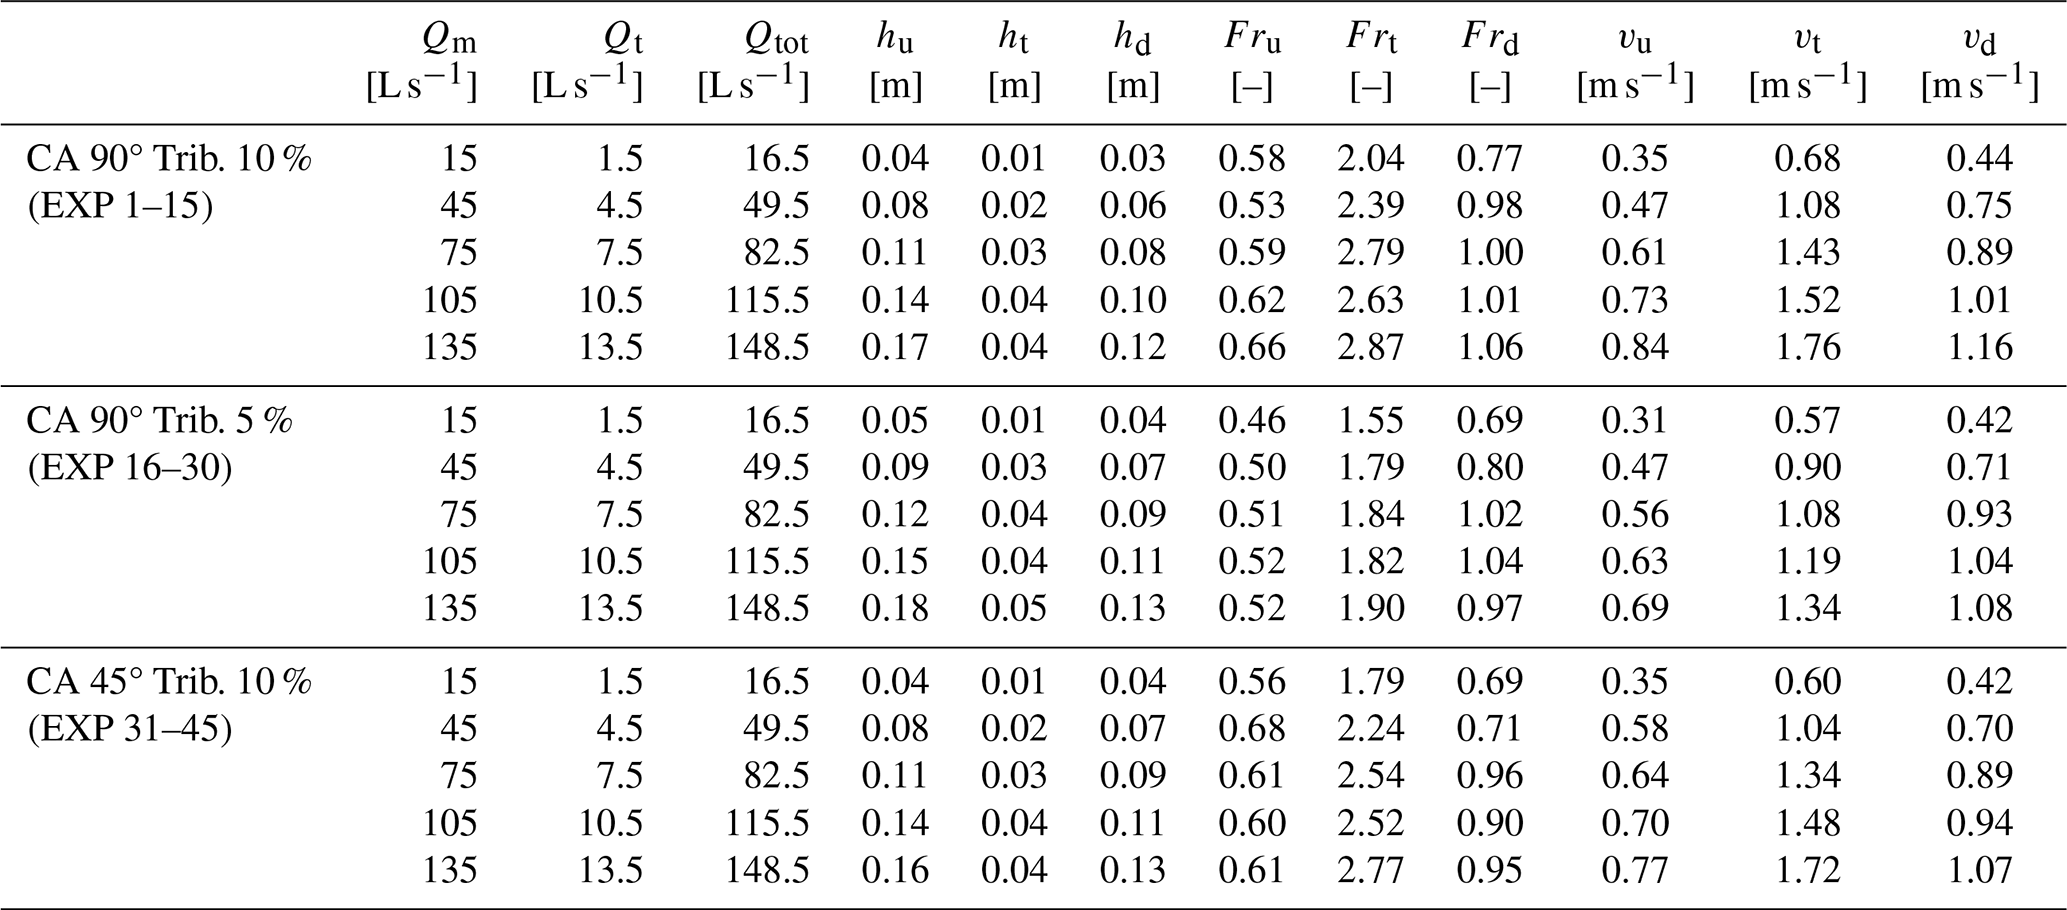
River confluences are important features of all river systems and are sites of significant hydraulic and morphological change (Benda et al., 2004). They are characterized by converging flow paths that produce complex three-dimensional hydraulics that influence the local morphology and fluvial dynamics (Best, 1987, 1988; Rhoads and Kenworthy, 1995; Benda et al., 2004; Boyer et al., 2006; Ferguson and Hoey, 2008; Guillén-Ludeña et al., 2015, 2017). In developed areas, confluences form critical junctions, as the hydraulic geometries and sediment loads from each channel must be accommodated to avoid overbank flooding and sedimentation (Gems et al., 2014; Liu et al., 2015; Kammerlander et al., 2016; Sturm et al., 2018). The importance of these junctions has garnered much research interest, which has illuminated many characteristics of the hydro-morphodynamic interactions and the major controls on the flow structure that occur at lowland river confluences (Mosley, 1976; Best, 1987, 1988; Biron et al., 1993; Rhoads and Kenworthy, 1995; Bradbrook et al., 1998; De Serres et al., 1999; Benda et al., 2004; Boyer et al., 2006; Wang et al., 2007; Liu et al., 2015). Best (1987, 1988) built upon the seminal work of Mosley (1976) in his identification of hydraulic and morphologic zones that occur at confluences. The typically occurring hydraulic zones are flow separation, flow stagnation, flow deflection, maximum velocity, shear layers, and the recovery zone. These zones influence sediment transport pathways through the confluence and the resulting morphological elements of confluences: avalanche faces at the mouth of each confluent channel, a deep central scour hole, and a bar in the separation zone. Best (1988) concluded that the variables controlling the locations, orientations, and sizes of these morphologic zones are the confluence angle and the discharge ratio , which is the ratio of the tributary (Qt) and the main channel (Qm) discharges. For lowland confluences, increasing the discharge ratio or the confluence angle leads to greater mutual deflection of flows and a bigger separation zone, which is the largest sink for tributary-transported sediment (Best, 1987, 1988). Flow deflection influences the shear layers generated between the two convergent flows, along which powerful vortices which are responsible for increased bed shear stresses in the junction are generated (Mosley, 1976; Best, 1987; Penna et al., 2018; De Serres et al., 1999). Contrarily, decreasing the confluence angle results in greater mixing of flows, a smaller separation zone, and decreased levels of turbulence in the confluence (Best, 1988; Penna et al., 2018). However, mountain channels are steeper than lowland channels and so have higher velocities and supercritical flows that amplify event intensity (Rudolf-Miklau and Suda, 2013) and can result in rapid channel adjustments (Wohl, 2010). This is apparent when comparing, for example, the Froude numbers from Best (1988) (0.1–1) and Biron et al. (1996) (0.1–0.24) and the tributary velocities (0.45–0.57 m s−1) from Roy and Bergeron (1990) with the Froude numbers and velocities from the presented work (Table 1) and steep channels in the study region (e.g., Hübl et al., 2005).
Table 1Experimental discharges for the main (Qm) and tributary (Qt) channels along with corresponding hydraulic attributes showing the flow depth (h), Froude number (Fr), and velocity (v) upstream (u) and downstream (d) of the confluence and in the tributary channel (t) for all confluence angles (CA) and tributary gradients (Trib.). Values are based on undisturbed initial conditions in the channel. The values used in particular experiments (EXP) are indicated.
Confluences in mountain regions have not received the same attention as those in lowland areas, which is surprising given the hazard potential associated with large volumes of coarse sediment entering these critical junctions (Aulitzky, 1989). Mountain and lowland confluences can be differentiated by (i) supercritical or transitioning flow conditions in the tributary channel, (ii) bed surface armoring due to the size heterogeneity of the tributary sediment load or non-erodible conditions in the tributary channel as a result of hazard protection measures, (iii) high sediment concentrations during flooding events, and (iv) highly variable discharges and sediment transport rates (Aulitzky, 1980, 1989; Meunier, 1991; Roca et al., 2009; Guillén-Ludeña et al., 2017). Topographic confinement can amplify confluence effects, whereas in lowland regions with wide valley floors and broad terraces, deposition cones or fans can be isolated from the main channel (Benda et al., 2004). A sudden introduction of sediment from steep tributaries can trigger numerous types of morphological changes (Benda et al., 2004), as tributaries of confined channel confluences can be particularly impactful (Rice, 1998).
Detailed records of flash flooding associated with intense sediment transport in Tyrol (Austria) show that these events are a persistent hazard (Embleton-Hamann, 1997; Rom et al., 2023). In the Alps, hazardous events can impact high-population-density valleys. Increased or shifting flooding patterns (Blöschl et al., 2017, 2020; Löschner et al., 2017; Hanus et al., 2021) and enhanced sediment availability (Knight and Harrison, 2009; Stoffel and Huggel, 2012; Gems et al., 2020) as a consequence of climate change (Keiler et al., 2010) not only threaten new infrastructure but also challenge previously installed mitigation measures. Ancey (2020a) discusses the complications and assumptions associated with the multitude of approaches used to predict bedload transport and the resulting bedforms and how rivers are systems punctuated by intense moments of bedload transport that result in rapid changes in bed morphology over short time intervals (Ancey, 2020b). Relevant hazard events are typically triggered by localized short-duration and high-intensity convective storms in small watersheds, which do not significantly affect main channel discharge and bedload transport (Gems et al., 2014; Hübl and Moser, 2006; Prenner et al., 2018; Stoffel, 2010). The narrow, steep tributary provides the sediment load to the main channel, which supplies the dominant flow discharge (Miller, 1958; Guillén-Ludeña et al., 2017).
Most of the work that has been done on mountain river confluences has focused on conditions that do not typically generate hazardous events and has generally under-represented gradients and sediment concentrations (Roca et al., 2009; Leite Ribeiro et al., 2012a, b; Guillén-Ludeña et al., 2015, 2017). Complicating the conclusions drawn regarding confluence morphodynamics, St. Pierre Ostrander et al. (2023) established, from a set of 15 experiments, that confluences of mountain rivers are influenced by factors other than the confluence angle and the discharge ratio. They held the confluence angle and discharge ratio constant, only adjusting discharges and the tributary sediment concentration. They observed a range of morphologies with specific geomorphic units: a deposition cone, a transitional morphology, a bank-attached bar, and a scour hole. They used the unit stream power to predict and associate the confluence zone morphology with the hydraulic conditions. However, they were limited in their conclusions and recommended further experiments considering additional geometries, as their experimental program was not sufficiently comprehensive, restricting the reach of their findings. The channel geometry was unchanged throughout the experimental program and the morphological assessment lacked a statistical evaluation and grain size analysis. This paper builds upon those experimental results with an additional 30 experiments considering geometric modifications. In addition to investigating the effects of the channel discharge and sediment concentration, adjustments to the confluence angle and the tributary gradient provide a more comprehensive data analysis of fluvial hazard processes and the resulting morphologies of mountain river confluences. Evaluation of morphological patterns and extents was done qualitatively with digital elevation models (DEMs) of difference (DoDs) created from laser scans; quantitatively from the extents of geomorphic units, depositional and erosional values, and volumetric grain samples; and statistically. Statistical analyses determined which of the introduced controlling factors significantly impacted the response variables that define the morphodynamic development of mountain river confluences. Results from the 45 experiments tested the following hypotheses:
-
Adjustments to the confluence angle and the tributary gradient do not significantly impact the confluence morphology and the development of specific geomorphic units (hypothesis 1).
-
Of the introduced controlling factors, the sediment concentration and channel discharge exert the most control over depositional and erosional patterns (hypothesis 2).
The formulation of the two hypotheses was based on the results in St. Pierre Ostrander et al. (2023), where it was established that there were other factors in addition to the confluence angle and discharge ratio influencing the morphological development of the confluence, and from a review of literature dealing with rivers in response to intense hydrological events. Specifically, a channel will adjust its geometric characteristics and gradient in a way that maximizes sediment transport capacity (Lane, 1955; White et al., 1982).
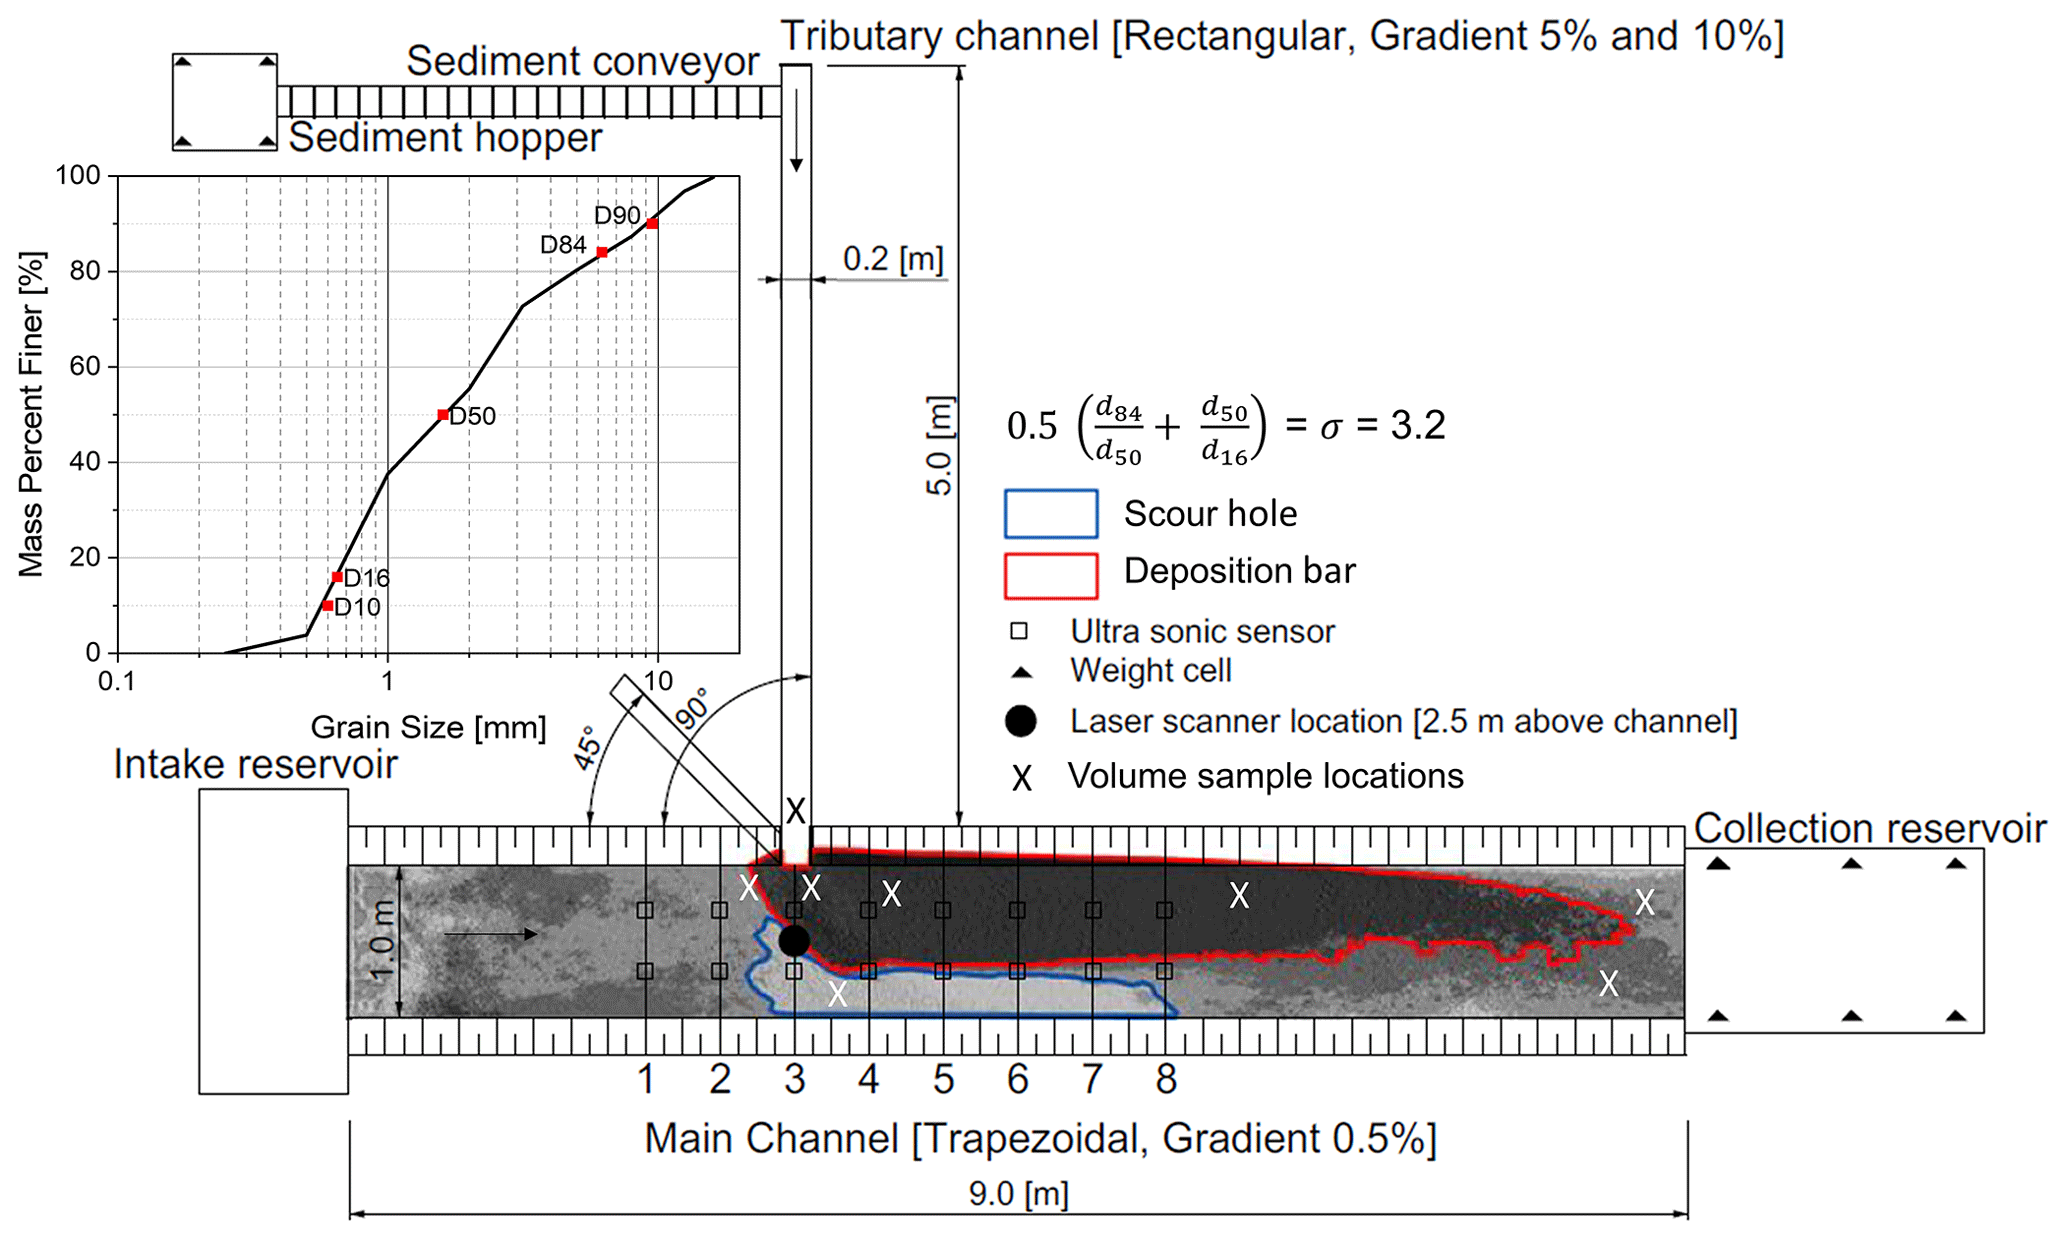
Figure 1Overview of the physical model, showing the locations of measurement devices, the volume sample locations, the gradation coefficient (σ), the grain size distribution of the sediment supplied to the tributary channel and the mobile bed in the main channel, and examples of the scour hole and the deposition bar.
2.1 Experimental program
The physical scale model (Fig. 1) was constructed to represent a typical confluence in the regions of South Tyrol (Italy) and Tyrol (Austria). The experimental setup served as a generic configuration to reproduce the main hydrodynamic and sedimentary processes occurring at mountain river confluences while gaining insights into the dominant control variables. The experimental modeling used and built upon the configuration, calibration, and experiments (1–15) carried out by St. Pierre Ostrander et al. (2023), but it considered an additional case for the tributary gradient as well as for the confluence angle. The model dimensions, discharges, and the grain size distribution of the quartz sand input material and the main channel bed were based on an analysis of 135 confluences and 65 volume (subsurface) and line (surface) sediment samples in the study region (St. Pierre Ostrander et al., 2023). The sediment mix was scaled by a factor of 30 to transfer the natural grain size dimensions to the model conditions. The main channel had a mobile bed allowing for 0.2 m of erosion, while the tributary channel had a fixed bed. Tributary bed roughness was created by using an adhesive to apply a layer of quartz sand to the bed. The channel roughness was established from hydraulic manuals (Chow, 1959) and previous calibration work (St. Pierre Ostrander et al., 2023). Quartz sand is widely used in flume experiments dealing with gravel-bed rivers (e.g., Williams, 1970; Gems et al., 2014), as the grain density (ρs=2650 kg m−3) supports Froude model similitude (Young and Warburton, 1996). A grain size distribution curve and the gradation coefficient (σ) of both the mobile bed and the input material are included in Fig. 1. The physical model was adjustable, except for the width of the tributary (0.2 m) and the lengths of the channels (5.0 and 9.0 m for the tributary and main channel, respectively). The discharge to each channel was supplied by separate pumps controlled by electronic flow measurement devices. The discharge ratio was fixed at 0.1 for all experiments. The tributary sediment discharge was always proportional to the clear water discharge; an increase in tributary discharge meant an increase in both clear water and sediment discharges. The main channel flow was exclusively clear water and had fully rough turbulent flow to replicate typical events that produce massive aggradation at mountain river confluences (Hübl and Moser, 2006; Stoffel, 2010; Gems et al., 2014; Prenner et al., 2018). Scaling was done according to Froude similarity; transferring the model dimensions to nature involves a scale factor range of 20–40. The scale is determined by the width of the tributary at the confluence relative to the width of the tributary in the physical model and is referred to as the specific scale (St. Pierre Ostrander et al., 2023).
The experiments (Table 2) allowed the same five steady-state discharge combinations to be tested with different tributary gradients, confluence angles, and sediment concentrations, which were based on the bulk density of the input material. The five discharges correspond to flooding conditions in the study region, including an extreme event. Steady-state discharges were used so that a specific discharge could be linked with a geomorphic unit to limit the uncertainty in associating morphologies with the introduced controlling factors, which is consistent with the approaches used by other researchers dealing with steep channel confluences (Roca et al., 2009; Leite Ribeiro et al., 2012), and to make the morphological development comparable to research dealing with lowland confluences, which largely assume steady-state conditions (e.g., Mosley, 1976; Best, 1988). The morphological development of the confluence zone for each geometric setup was evaluated by creating DEMs of difference (DoDs) (ESRI ArcGIS Desktop, release 10.8.2) from laser scans (Faro Focus 3D, Trimble X7) taken before and after an experiment. Each laser scan contained 125 million points with a point density of 0.004 m at a distance of 10 m. The average error between the position of the scanner and the targets used for referencing the scans was less than 0.004 m. The initial bathymetry was the reference, which was established by running a low discharge of 15 L s−1 in the main channel for 5 h to create a more natural riverbed, while the post-run bathymetry was the comparison (St. Pierre Ostrander et al., 2023). Morphological evaluation was done by assessing specific zones and overall changes that occurred in the channel. The deposition bar and scour hole were delineated by deposition or erosion above or below 0.01 m (Fig. 1). Main channel deposition and erosion areas and volumes reflect the morphological change that occurs throughout the entire channel above or below the initial bathymetry.
Table 2Experimental target and actual discharges and sediment concentrations as well as tributary sediment supply rates. Q denotes discharge, while the subscripts “m” and “t” refer to the main channel and the tributary channel, respectively. The main channel gradient was 0.5 % for all experiments (EXP). Experiment 30 could not be completed, as the deposition in the tributary caused overtopping of the channel.
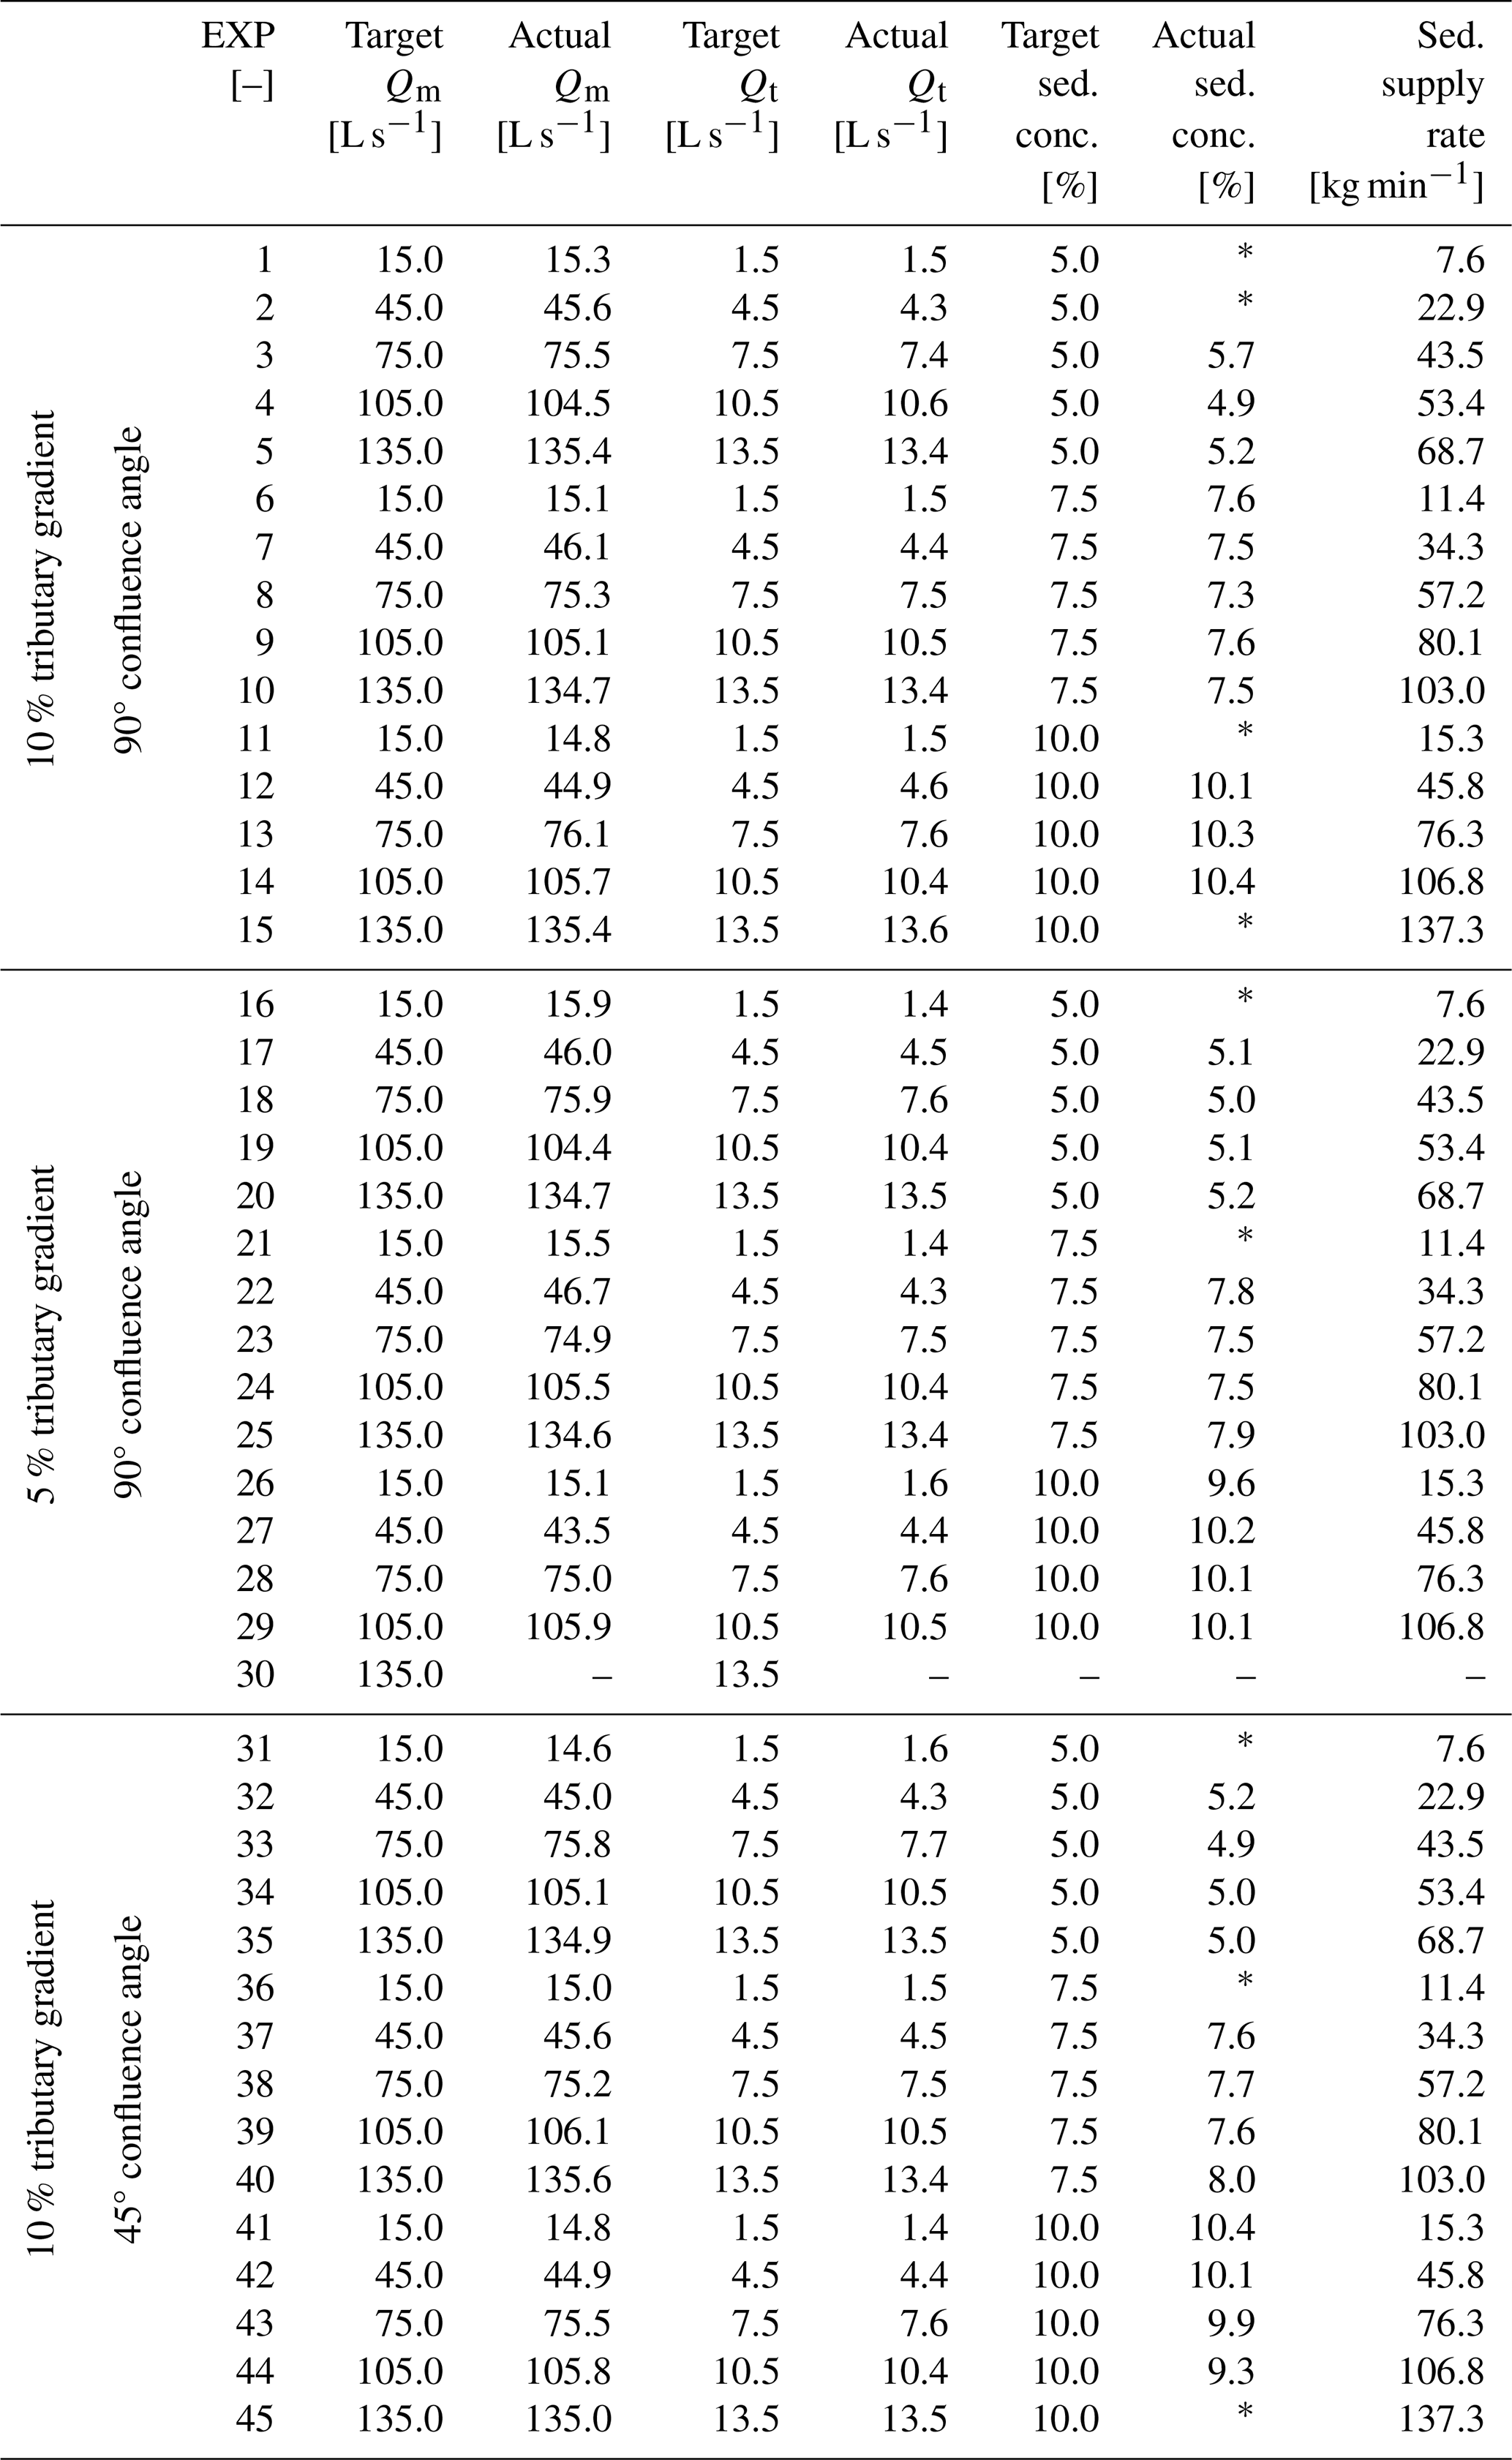
* The sediment was delivered manually or with manual assistance, as the dosing machine could not dose very low or high rates of sediment into the tributary channel.
Based on incident reports supplied by the Austrian Service for Torrent and Avalanche Control and event documentation (e.g., Hübl et al., 2012), the experiment duration scaled (30) according to Froude similarity was 20 min and started when sediment entered the tributary channel. The only differences between the experimental groups were in the tributary gradient and the confluence angle. Experiments 1–15 had a 10 % tributary gradient, a 90° confluence angle, and a main channel gradient of 0.5 %. Experiments 16–30 had the same geometric configuration, except with a 5 % tributary gradient. Experiments 31–45 had a 10 % tributary gradient and a 45° confluence angle; the main channel gradient remained unchanged. The respective dimensions were chosen as they are the most representative of the study region (St. Pierre Ostrander et al., 2023). DoDs were created from the DoDs of experiments with identical input conditions, i.e., discharge and sediment supply rate, allowing for a visual assessment of morphological differences based on geometric changes alone. For example, experiments 1 and 16 had equal discharges and sediment concentrations; the only change was the tributary gradient. Experiments 1 and 31 had the same discharges, sediment concentrations, and gradients, but the confluence angle was changed. The 10 % gradient tributary with a 90° confluence angle was used as the reference, as both geometric configurations are comparable and changes to the gradient and confluence angle could be accurately assessed.
2.2 Statistical analysis
A statistical analysis of the various controlling factors introduced and their effects on the response variables (Table 3) was done using the software package OriginPro (v.2023, OriginLab Corp.) (Stevenson, 2011; Baranovskiy, 2019). The chosen response variables (Table 3) captured either depositional or erosional features and allowed for a nuanced investigation into the subtle morphological variations that were not able to be qualitatively assessed. The combined discharge was used as a factor, since the morphological development of the confluence occurred downstream of the tributary. The confidence interval for all tests was 95 %. A significant result occurred when the p value calculated from the test statistic of the applied test was less than 0.05. A p value of less than 0.05 allowed the rejection of the null hypothesis (i.e., that it was a factor that did not significantly impact the response variable). If the null hypothesis was rejected, further pairwise post hoc tests were conducted to determine the decisive factors influencing the confluence morphology.
Table 3Controlling factors and response variables that control and define the confluence morphology.

The sequence of operations in Fig. 2 shows the chosen tests which allowed for planned comparisons (Ruxton and Beauchamp, 2008). The relevant data sets were examined to ensure that the correct statistical and pairwise post hoc tests were applied (Welch, 1947; Massey, 1951; Dunn, 1964; Maxwell and Delaney, 2004; Steinskog et al., 2007; Sawyer, 2009; McKnight and Najab, 2010; Moder, 2010; Witte and Witte, 2017; Delacre et al., 2019). The tests that were applied for a specific factor were determined based on whether the sample came from a population with a specific distribution and by verifying heterogeneity or homogeneity of variances. This established the subsequent hypothesis and post hoc tests, if applicable. Not all the tests were used, but they were established in the case of varying distributions and homogeneity or heterogeneity of variances. Data were grouped by aggregating individual observations for a specific controlling factor. For example, the deposition bar area in response to sediment concentration had three groups – a mean area for each of the three tested sediment concentrations. For the confluence angle, the bar area can only have two mean values, one from each angle, so there are only two groups.
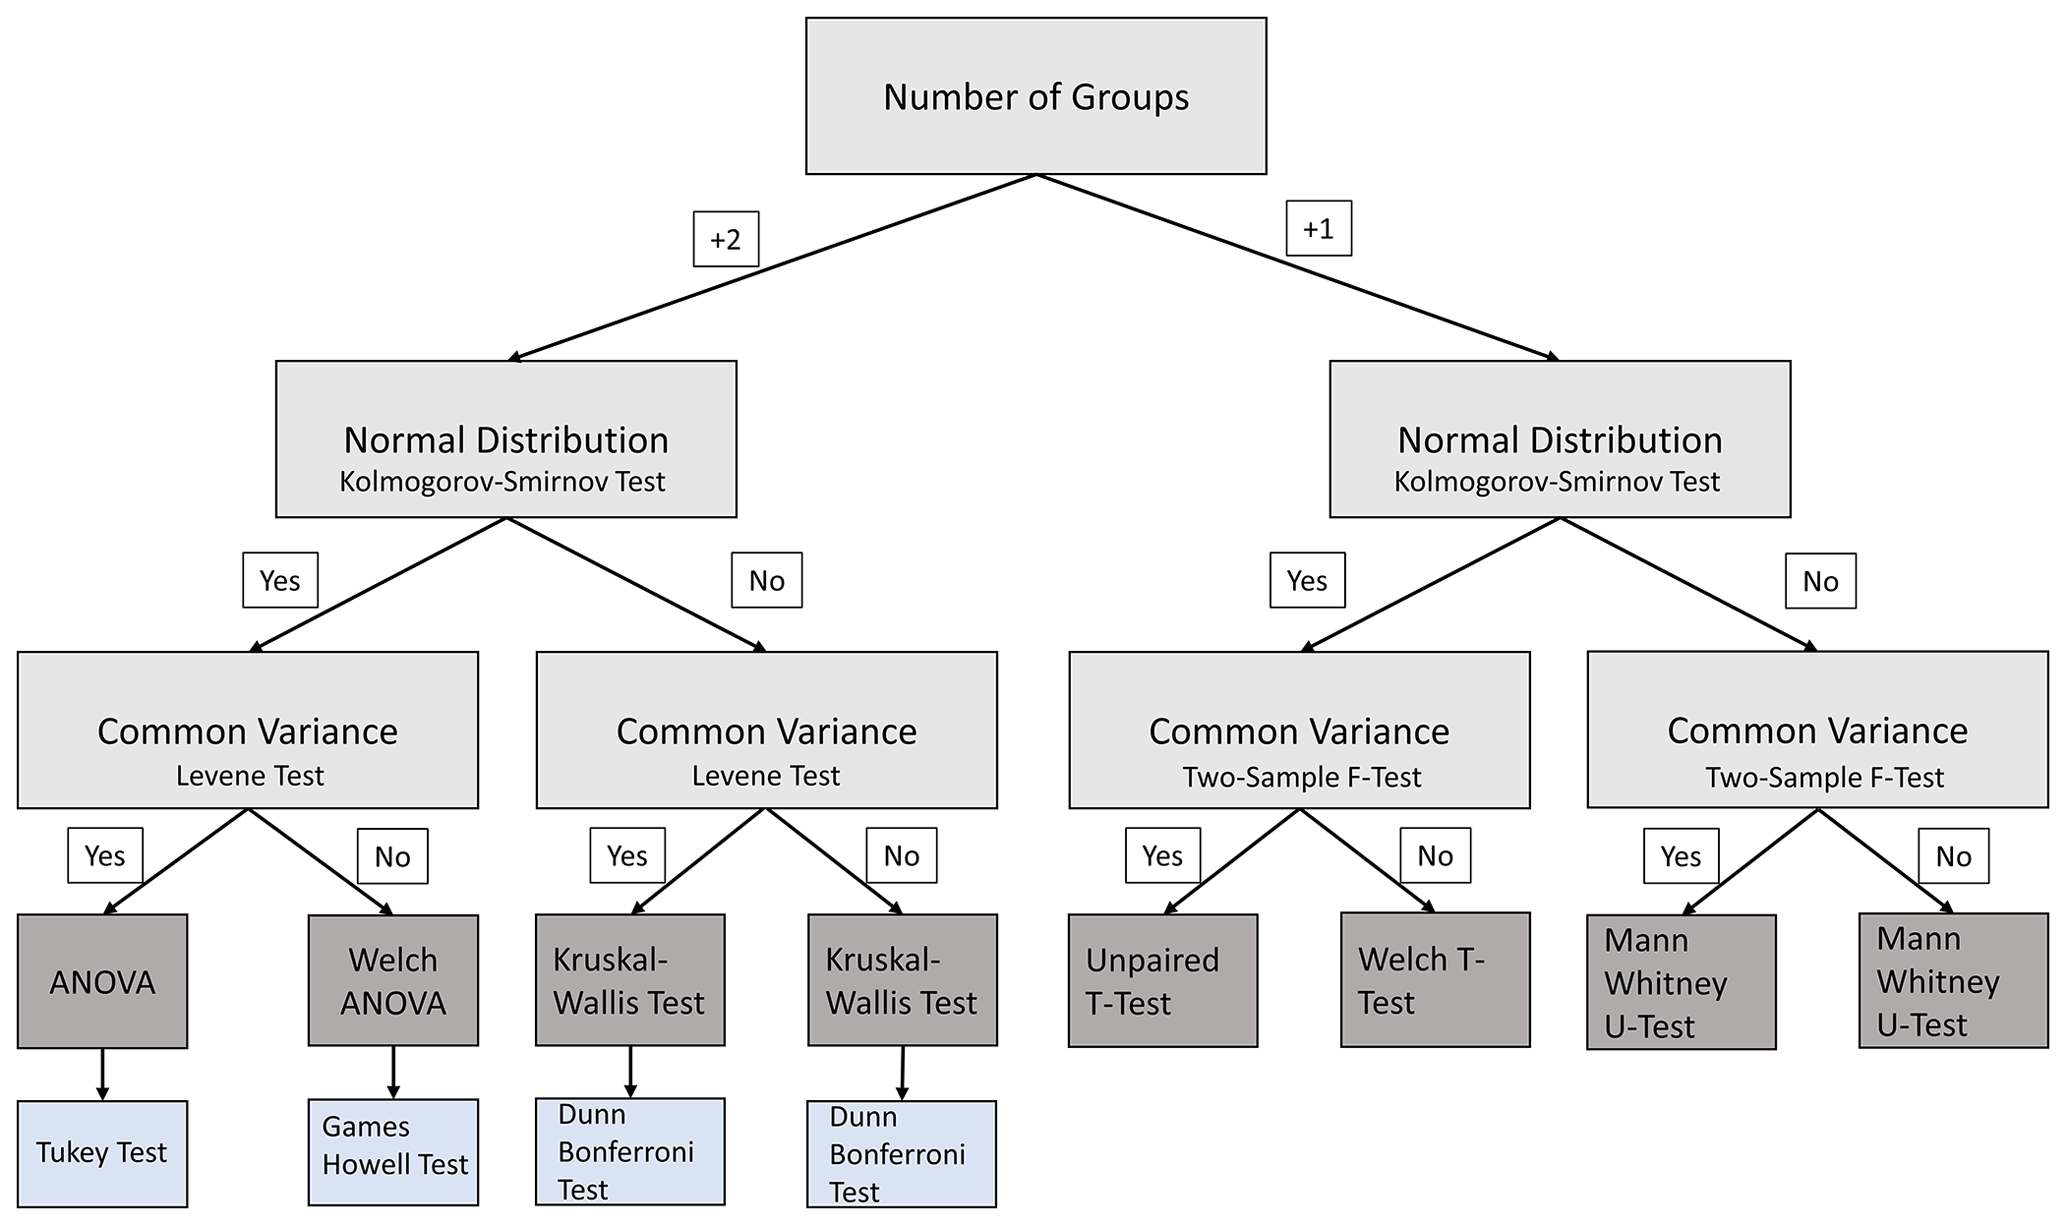
Figure 2Workflow for assessing the impacts of controlling factors with associated tests based on the number of groups and the distributions and variances of the examined data sets.
2.3 Volumetric grain sampling
Volume samples were taken after each experiment, with the sample locations corresponding to confluence morphologic (Best, 1988) and hydraulic zones (Best, 1987) in the channel. In total, eight samples were taken for each experiment. The sampled volume was 0.002 m3, with an average sample mass of 3.3 kg, which was taken by inserting a cylinder (0.16 m diameter and 0.1 m height) into the channel bed or depositional form. The sampled mass was within the guideline of Bunte and Abt (2001) (Eq. 2):
where Dmax is the maximum grain size (16 mm), ρs is the grain density (2650 kg m−3), and b is the accuracy level: high (b=5), medium (b=4), or low (b=3). A larger volume would not be suitable to accurately represent small areas of deposition or erosion, as material outside of the area of interest would also be captured. The samples were dried after collection and before the sieving analysis. During sieving, the material was separated into 10 fractions based on the mesh size of each sieve. The masses of the fractions were determined and plotted as grain size distribution curves. This grain size analysis provided insights into the hydraulic influence on the various zones.
3.1 Development and evolution of the confluence morphology
Table 4 associates the three depositional geomorphic units consistently observed for all channel configurations and sediment concentrations with the unit stream power. Unit stream power calculations are based on the initial conditions at cross-sections in the main and tributary channels. The geomorphic units were (i) the deposition cone (Figs. 3a and A1–A9), (ii) the transitional morphology (Figs. 3b and A1b–A9b), and (iii) the bar attached to the left channel wall in the separation zone (Figs. 3c and A1c–e to A9c–e). The scour hole, an erosional geomorphic unit (Fig. 3), was apparent in all experiments (Figs. A1–A9) on the right bank opposite the tributary. The deposition cone was characterized by deposition upstream of the confluence in the main channel, a compact longitudinal extent, and steep gradients in the upstream and downstream directions (Fig. 3d). Cone formation resulted from insufficient transport capacity of the main channel flow and a sustained and abundant sediment supply from the tributary channel. Deposition cones formed for all configurations and sediment concentrations when the discharge was 15 and 1.5 L s−1 in the main and tributary channels, respectively. The transitional morphology is derived from the increased discharge and subsequent unit stream power when experimental discharges of 45 L s−1 in the main channel and 4.5 L s−1 in the tributary nearly forced the bar over to the left bank but morphological aspects of the deposition cone remained. The transitional morphology partially occupies the separation zone, which is shown in Fig. 3e, where the longitudinal profile is a hybrid between the cone and bar. Discharges and the related unit stream power values above 45 L s−1 in the main channel and 4.5 L s−1 in the tributary allowed for the development of a bar attached to the left channel wall in the separation zone. This bar had the greatest longitudinal extent (Fig. 3f) and the largest storage capacity for tributary-transported sediment. Once the separation zone bar was fully developed, the hydraulic separation zone was filled with deposited sediment and flanked by the maximum-velocity zone on the right, which has been observed at lowland confluences with subcritical flows and large discharge ratios (Best, 1988; Biron et al., 1993; De Serres et al., 1999).

Figure 3Observed geomorphic units: the deposition cone (a) – also shown with longitudinal (d) and transversal (g) plots, the transitional morphology (b) – also shown with longitudinal (e) and transversal (h) plots, and the bar attached to the channel wall in the separation zone (c) – also shown with longitudinal (f) and transversal (i) plots, with the scour hole on the right, opposite the tributary. Longitudinal profiles were spaced every 0.1 m starting 1 m upstream of the confluence, and they spanned 7 m; transversal profiles were spaced every 0.1 m starting 1 m upstream of the confluence, and they spanned 2 m, focusing on the confluence zone.
Table 4Geomorphic units and unit stream power (ω) values. Unit stream power was calculated for the main channel discharge, the tributary discharge, and the combined channel discharge. The subscripts “m” and “t” denote the main and tributary channel conditions, respectively, while “tot” represents the unit stream power from the combined channel discharge.


Figure 4DoDs showing the morphological differences between the minimum (a, d, g), median (b, e, h), and maximum (c, f) experimental discharges. These were created by subtracting the DoDs of experiments with a 5 % tributary gradient (EXP 16–30) from the DoDs of experiments with a 10 % tributary gradient (EXP 1–15).
The scour hole was created hydraulically, as the extent of the separation zone forced the confluent streams into a smaller area, but also physically, as depositional patterns reduced the area in which the confluent flows may travel, leading to channel constriction (Guillén-Ludeña et al., 2015; St. Pierre Ostrander et al., 2023), thereby increasing flow velocities (Rhoads and Kenworthy, 1995) and transport capacities. Additionally, the absence of avalanche faces inhibits the development of lee-side flow separation cells (Roy and Bergeron, 1990), which segregates sediment around the confluence instead of through it. Field observation of a gravel-bed confluence showed that tracked particles from both channels converged towards the scour hole, with no noticeable segregation (Roy and Bergeron, 1990). As the hydraulic separation zone filled with sediment, the spatial extent of the scour hole increased. The system tended towards an equilibrium state where sediment was transported through the scour hole, as this was the only available pathway through the confluence. The size and depth of the scour hole were greatest at lower sediment concentrations, given the same discharge. There was less sediment to be transported and potentially deposited in the scour hole, and the transport capacity of the main channel flow was not yet exhausted.
3.2 Effects of the tributary gradient
Figure 4 shows the DoDs from the minimum (Fig. 4a, d, and g), median (Fig. 4b, e, and h), and maximum (Fig. 4c and f) experimental discharge combinations, which were produced by subtracting the DoDs for experiments 16–30 with a 5 % tributary gradient from the DoDs for experiments 1–15 with a 10 % tributary gradient. The same general morphological patterns consistently occurred regardless of the imposed geometric change. Intense bedload transport in the tributary provided an abundance of sediment to the confluence. A smaller tributary gradient of 5 % (EXP 16–30) led to a reduced velocity and subsequent transport capacity, which did not greatly impact the morphological development of the confluence relative to the depositional forms observed when the gradient was 10 % (EXP 1–15). This trend could be associated with the unit stream power of the main channel, since the same patterns were observed for all sediment concentrations. As described by Guillén-Ludeña et al. (2017), the main channel supplies the dominant flow at mountain river confluences; if the flow is unchanged, similar development occurs. Main channel unit stream power was consistent for all comparable experiments. The tributary unit stream power was approximately halved when the channel gradient was reduced to 5 % (EXP 16–30) (Table 4).

Figure 5A comparison of morphological attributes between experiments with a 5 % tributary gradient (EXP 16–30) and those with a 10 % tributary gradient (EXP 1–15). Deposition bar area (a) and scour area (b) are delineated by deposition or erosion above or below 0.01 m, respectively. The width and length values in panels (c) and (d) represent the maximum measured width and length values, respectively, while the main channel deposition (e) and erosion (f) areas represent all deposition and erosion, respectively, in the main channel. Sediment concentration groups are shown in panel (f).
Figure 5 shows the depositional and erosional characteristics of experiments 1–15 (10 % tributary gradient, 90° confluence angle) and 16–30 (5 % tributary, 90° confluence angle), excluding the tributary channel. A visual inspection of Fig. 5 does not show a clear trend in differences in depositional or erosional characteristics between gradients. If there is a trend, it is most apparent when comparing the first five experiments of each geometry group (EXP 1–5 and EXP 16–20). Depositional patterns (Fig. 5a, c, and e) were greater for experiments 16–20 than for experiments 1–5, while erosional patterns were greater for experiments 1–5 than for 16–20 (Fig. 5b, d, and f). Reducing the tributary channel gradient reduced the velocity of the tributary flow (Table 1), limiting its contribution to main channel erosion. When the tributary gradient was 10 % (EXP 1–15), there was greater penetration of the tributary flow into the main channel and a local increase in transport capacity, creating a larger and deeper scour hole and enhanced conveyance of sediment through the confluence.
Figure 6 shows the gradients and volumes of the deposited sediment in the tributary channel at the end of experiments 1–30. The depositional gradient was determined through a linear regression of the DoD surface profile of the tributary channel. Adjustments to the tributary gradient changed the depositional mechanisms in the tributary channel; this was characterized by either an increase or decrease in the gradient of the deposited material in the tributary channel relative to the initial gradient. When the initial gradient was 10 % (EXP 1–15), the transport capacity of the main channel was the limiting factor for sediment moving through the confluence. This led to regressive sediment aggradation starting at the junction, which decreased the gradient of the tributary channel. Conversely, when the initial tributary channel gradient was 5 % (EXP 16–30), the resulting decrease in velocity saturated the transport capacity of the tributary channel. Consequently, the depositional patterns switched, and intense progressive deposition occurred starting at the upstream boundary of the tributary channel, which increased the gradient of the channel.
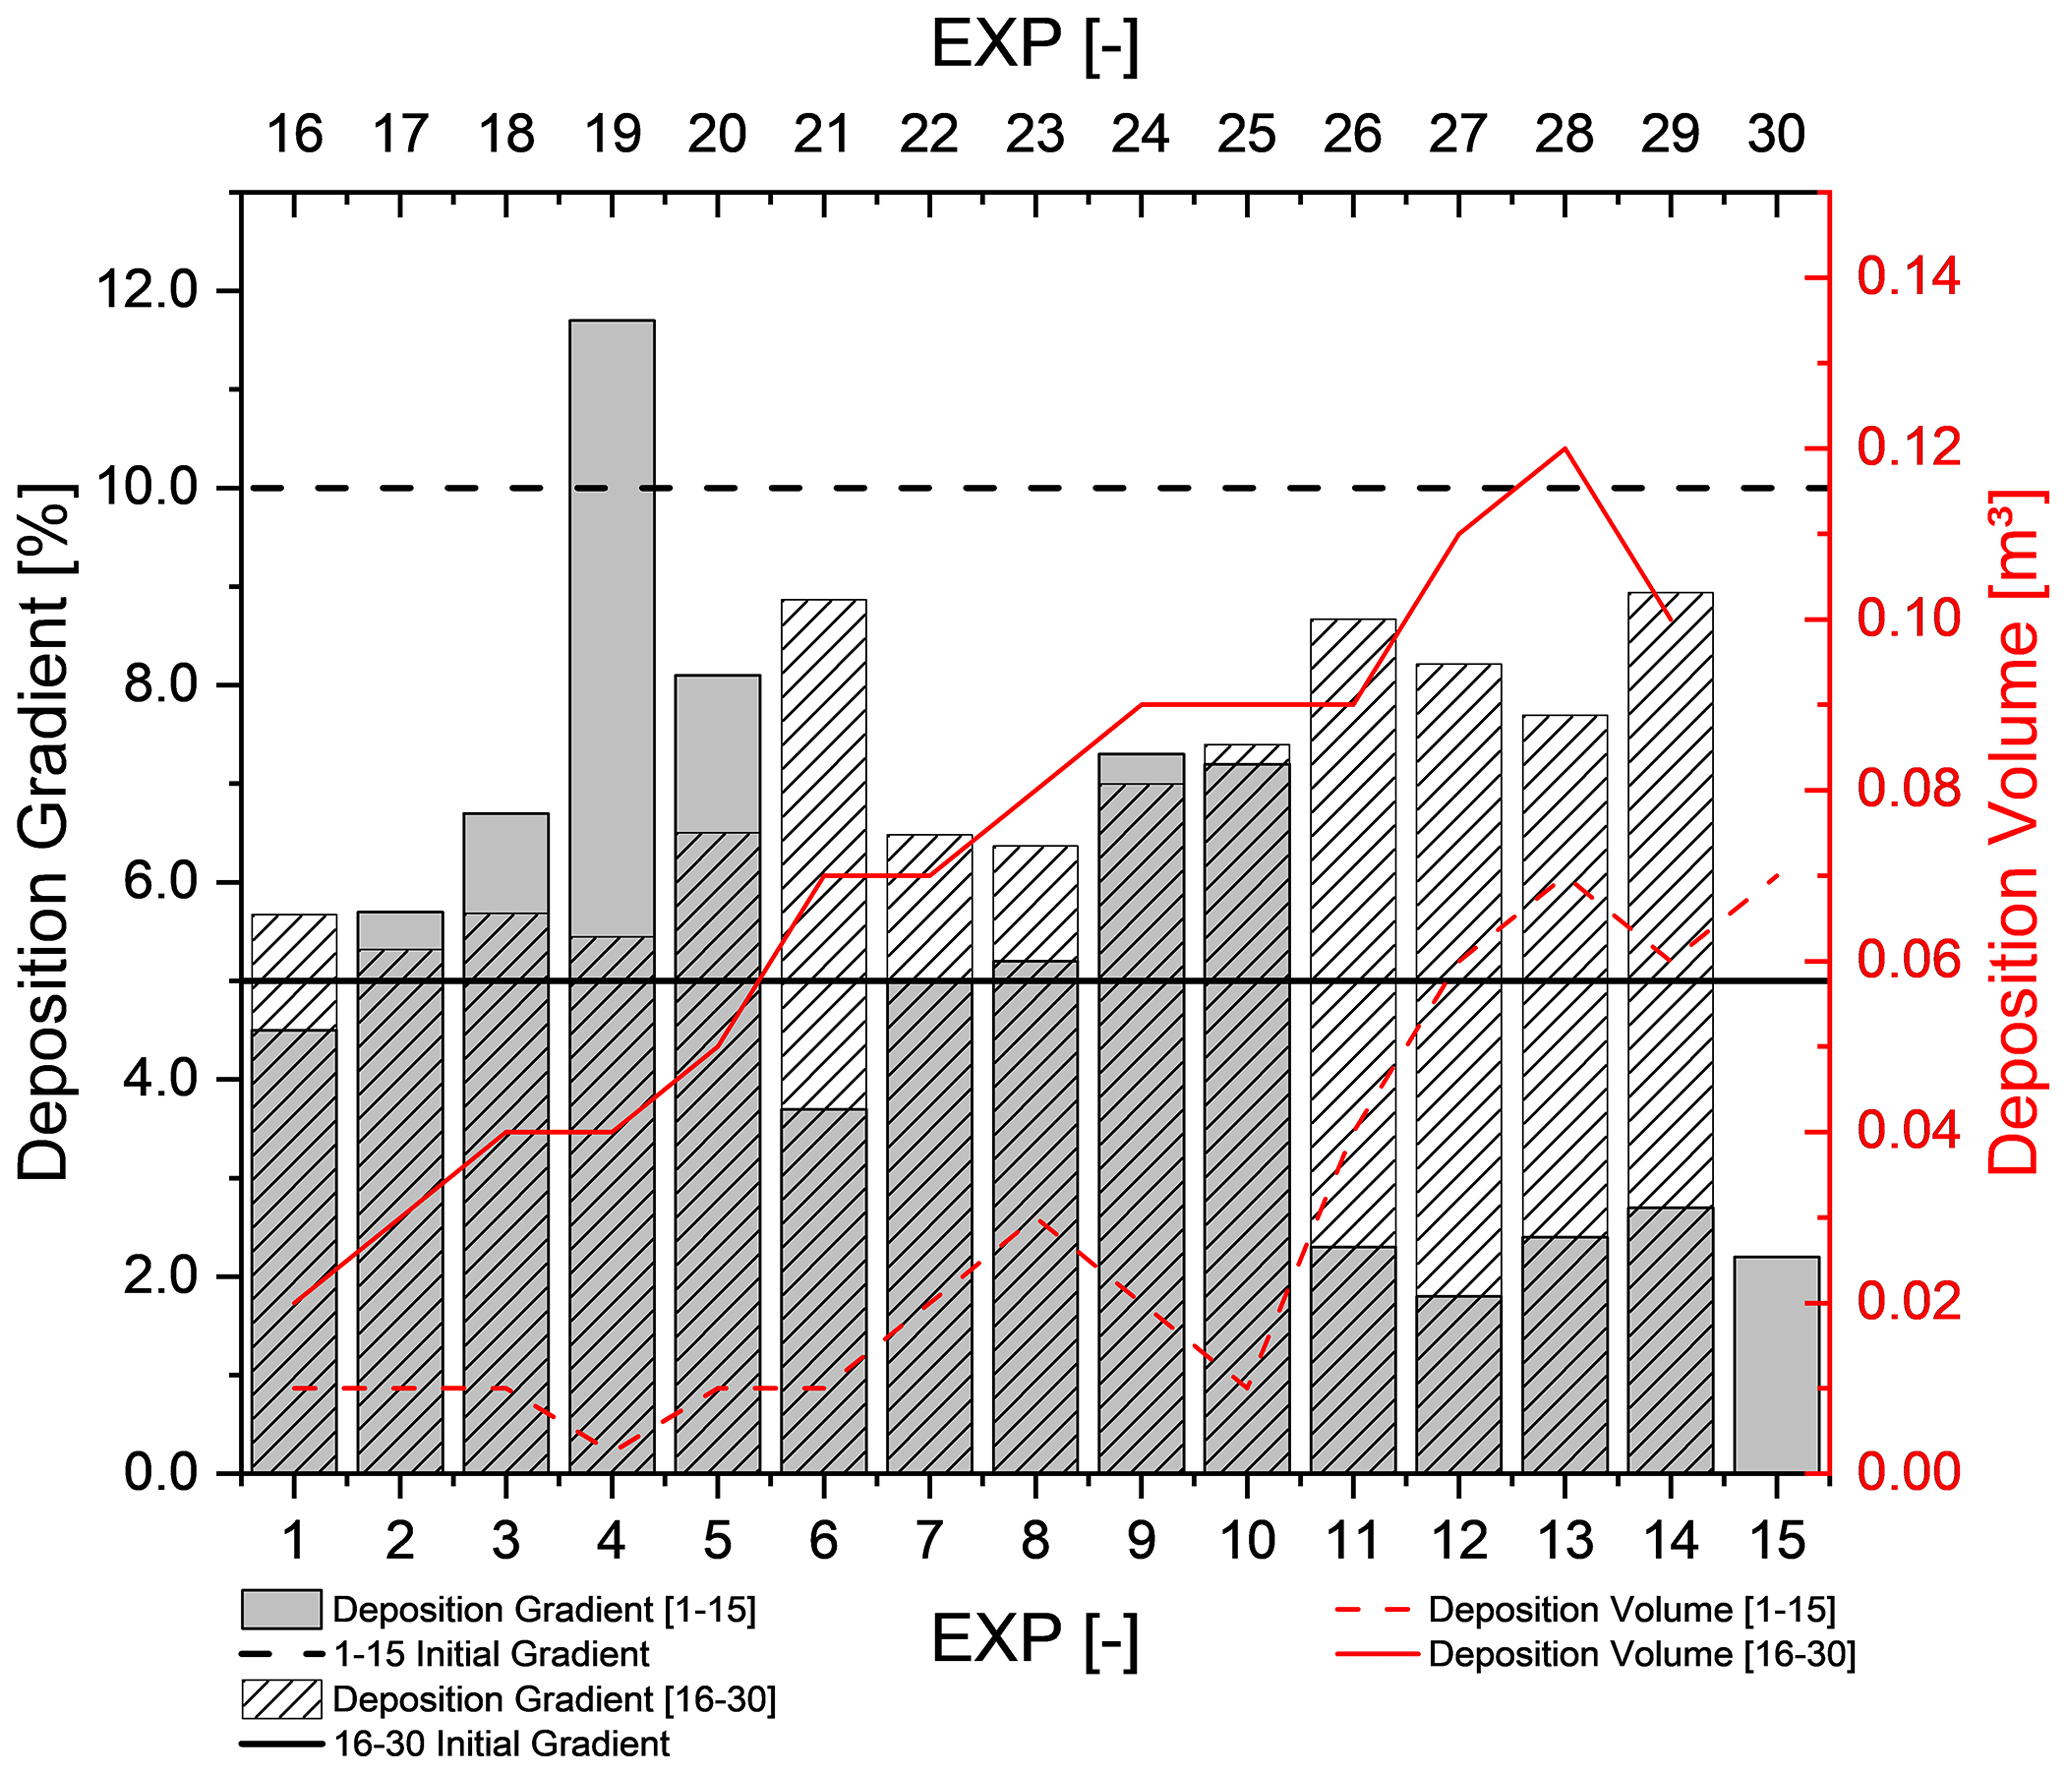
Figure 6Gradients and volumes of sediment deposited in the tributary channel for experiments 1–15 with an initial 10 % tributary gradient and experiments 16–30 with an initial 5 % tributary gradient.
3.3 Effects of the confluence angle
Figure 7 shows the DoDs from the minimum (Fig. 7a, d, and g), median (Fig. 7b, e, and h), and maximum (Fig. 7c, f, and i) experimental discharge combinations, which were created by subtracting the DoDs produced in experiments with a 45° confluence angle (EXP 31–45) from the DoDs produced in experiments with a 90° confluence angle (EXP 1–15). The tributary channels with a 45° confluence angle were extracted and referenced to the 90° tributary channels, allowing for DoD comparisons. A visual inspection of confluence zone morphologies does not reveal drastic changes between confluence angle experiments. Small regions of morphological change are apparent, mainly increased deposition downstream of the junction corner and a generally shallower scour hole when the confluence angle was 45°.

Figure 7DoDs showing the morphological differences between the minimum (a, d, g), median (b, e, h), and maximum (c, f, i) experimental discharges, which were created by subtracting the DoDs in experiments with a 45° confluence angle (EXP 31–45) from the DoDs in experiments with a 90° confluence angle (EXP 1–15).
Figure 8 shows subtle morphological differences with noticeable trends in scour characteristics, while depositional characteristics do not exhibit standout trends upon visual assessment. Both the area and length of the scour hole tended to be greater for experiments 31–45 with a 45° confluence angle (Fig. 8b and d). However, the depth and width of the scour were generally greater for experiments 1–15 with a 90° confluence angle. For both confluence angle experiment groups, clear increasing trends in scour area, length of scour, and erosion area occurred within each sediment concentration group in response to discharge. Assessing the impact of confluence angle adjustments on depositional attributes required a statistical approach to reveal any nuanced relationships occurring within the channel.

Figure 8Comparison of morphological attributes between experiments with a 45° confluence angle (EXP 31–45) and experiments with a 90° confluence angle (EXP 1–15). Deposition bar area (a) and scour area (a) are delineated by deposition or erosion above or below 0.01 m, respectively. The width and length values in panels (c) and (d) represent the maximum measured width and length, respectively, while the main channel deposition (e) and erosion (f) areas represent all deposition and erosion, respectively, in the main channel.
Figure 9 illustrates that variations in tributary depositional properties occurred even though a consistent tributary gradient was maintained across the experimental groups. When the confluence angle was 45° (EXP 31–45), a general increase in the depositional volume and a general decrease in the depositional gradient were observed (Fig. 9) relative to the experiments with a 90° confluence angle (EXP 1–15). A reduction in the confluence angle limits tributary channel flow penetration into the main channel (Best, 1988), reducing the exposure of the tributary sediment to main channel entraining forces. In experiments 1–15 with a greater confluence angle (90°), the tributary channel exhibited greater penetration. Increasing the confluence angle caused a greater mutual deflection of flows, further segregating the tributary and main channel flows (Best, 1987). This factor, coupled with the increased velocity, allowed the tributary sediment load to rapidly pass through the confluence zone when the confluence angle was 90° rather than be deposited in the tributary channel.

Figure 9Gradients and volumes of deposited sediment in the tributary channel for experiments 1–15 (10 % tributary gradient, 90° confluence angle) and 31–45 (10 % tributary gradient, 45° confluence angle).
3.4 Statistical analysis of the controlling factors impacting the confluence morphology
3.4.1 Overview
Only the controlling factors that had a significant effect (Table 5) on the response variables of the main channel are discussed here. The focus of the statistical analysis was to determine the dominant controls over the confluence morphology. For this reason, tributary channel depositional behavior was not included as a response variable.
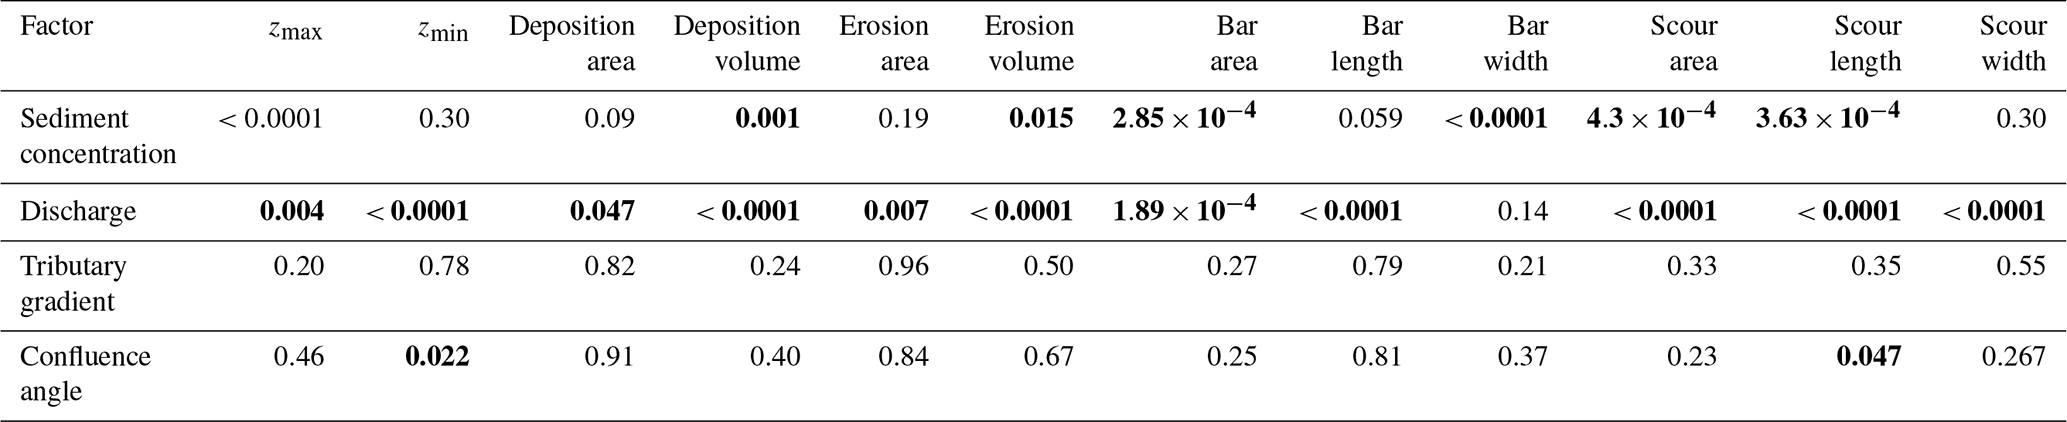
Table 5Introduced controlling factors and their impact on the confluence morphology. Bold text indicates that the factor had a significant impact on one or more groups of the response variable. P values from overall mean comparison tests are included.
3.4.2 Sediment concentration
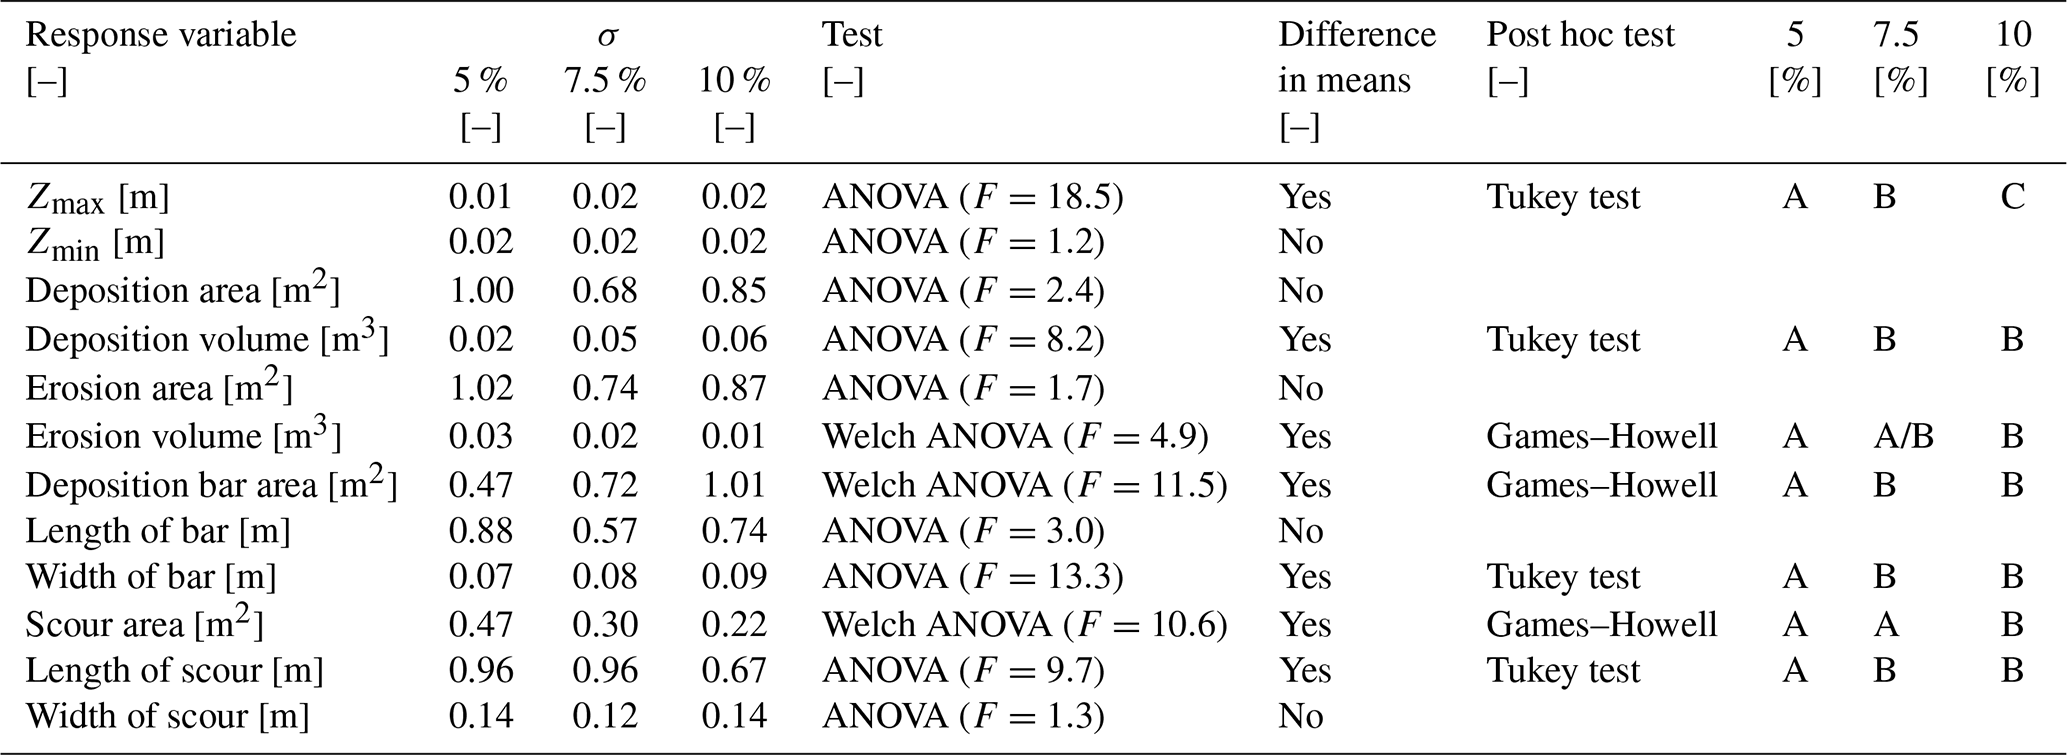
Table 6 and Fig. 10 show that sediment concentration had a significant impact on 7 out of 12 response variables. Increasing or decreasing the sediment concentration enhanced depositional or erosional patterns, respectively. Post hoc testing further revealed patterns caused by the sediment concentration (Table 6). Unsurprisingly, the majority of the significant differences in mean response values occurred between the 5 % and 10 % sediment concentration groups. The maximum deposition depth was significantly reactive to all sediment concentrations. With increasing sediment concentration, the deposition depth increased but reached a maximum, as the aggradation cannot exceed the local flow depth. When the sediment concentration was 7.5 %, the response variables did not significantly differ from those of the 5 % and 10 % groups.
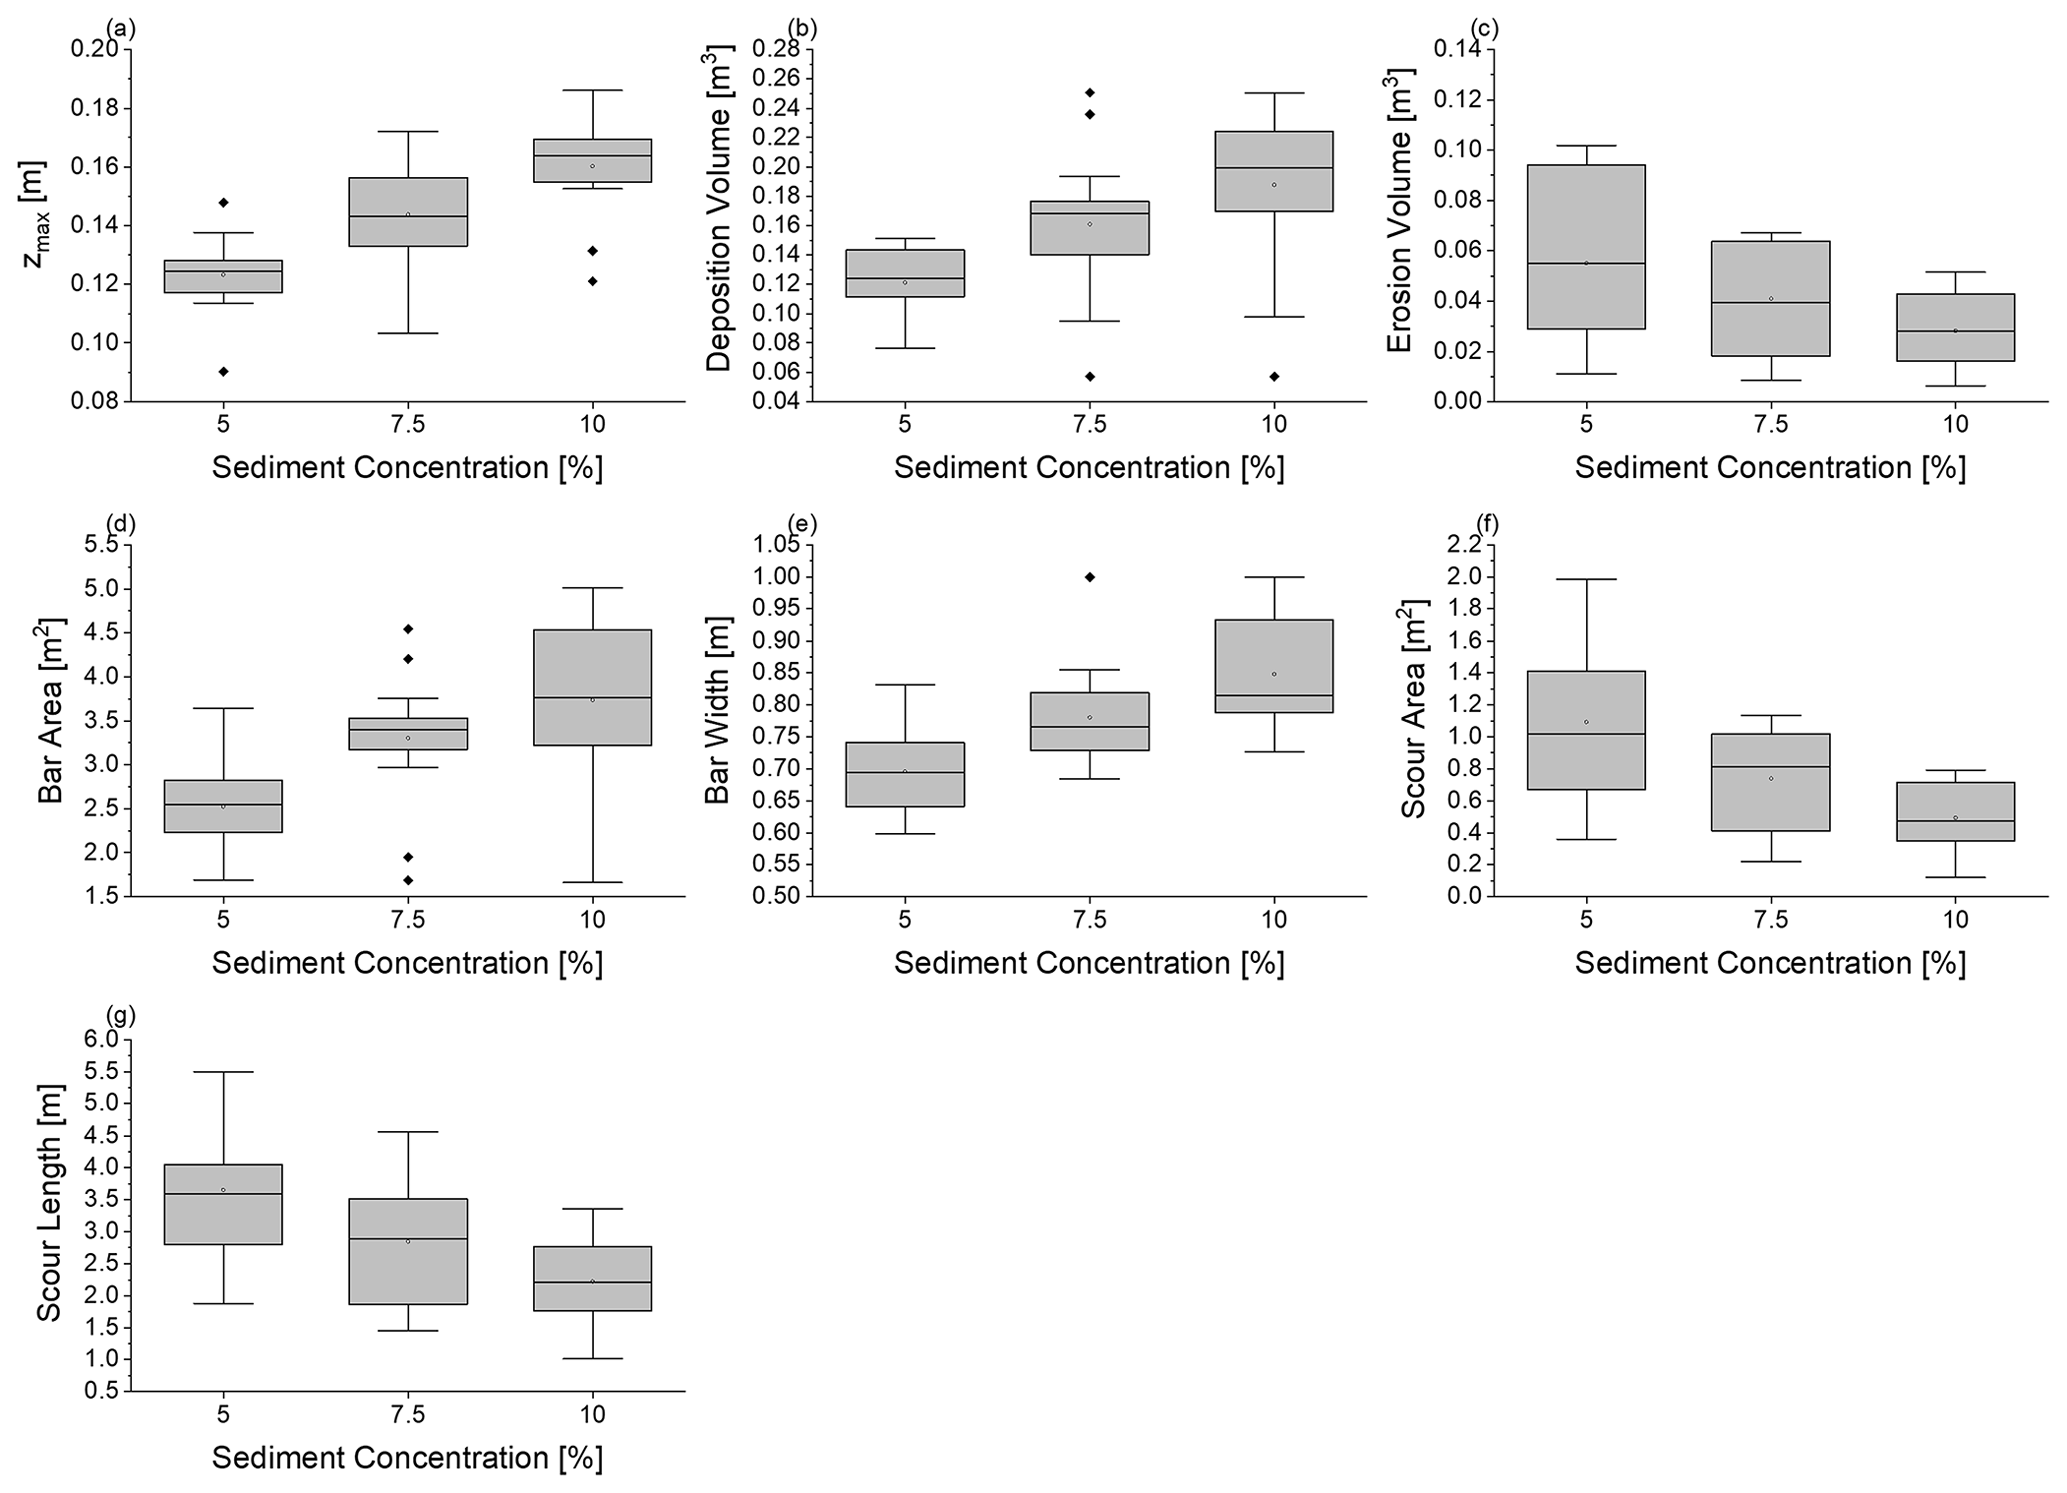
Figure 10Box plots from ANOVA and Welch ANOVA results for all response variables that showed a significant difference in mean values (Table 5) with sediment concentration as the controlling factor.
Table 6Sediment concentration and its impact on the response variables; σ is the standard deviation. The results of pairwise post hoc mean comparison testing are summarized by the letters A, B, and C: means that do not share a letter are significantly different. For example, the mean Zmax values for the sediment concentration groups were significantly different (A, B, C), and the mean deposition volumes for the 7.5 % and 10 % sediment concentration groups did not significantly differ from each other (B, B) but did significantly differ from the mean deposition volume when the sediment concentration was 5 % (A).
Adjustments in the deposition and erosion areas allowed the majority of the incoming sediment load to pass through the confluence. However, given the differences in sediment loads, rapid mutual adjustments were morphologically represented by the same general patterns but with less erosion and more aggradation as the sediment concentration increased. The differences in mean response values between the experiments with 5 % and 10 % tributary sediment concentrations and the similarities to the mean response values when the sediment concentration was 7.5 % can be attributed to this process.
3.4.3 Combined discharge
Table 7 and Fig. 11 show that the discharge significantly affected 11 out of the 12 response variables. Generally, erosional processes increased with increasing discharge as the transport capacity of the main channel flow increased. At lower discharges with limited transport capacities, erosional processes were comparatively reduced. However, certain instances revealed increased depositional properties with increasing discharge (Fig. 11a and d). This most apparently occurred between the 16.5 and 49.5 L s−1 combined discharge experiments. A deposition cone formed with all sediment concentrations when the combined discharge was 16.5 L s−1. Unlike the bar or transitional morphology, the deposition cone does not occupy the separation zone and is characterized by a short longitudinal extent and the furthest protrusion into the main channel from the tributary channel. At discharges of 49.5 L s−1 or above, the depositional patterns shifted, and sediment was entrained and deposited in the separation zone. The separation zone is the largest sink for tributary-transported sediment; the occupying bar can only be as big as the hydraulic zone, which is the same size for a given discharge ratio (Best, 1987, 1988). This explains the subtle differences in depositional properties once the combined discharge exceeded 49.5 L s−1.

Figure 11Box plots of ANOVA and Welch ANOVA results for all response variables that showed a significant difference in mean values (Table 5) with combined discharge as the controlling factor.
Table 7Discharge and its impact on the response variables; σ is the standard deviation. The results of pairwise post hoc mean comparison testing are summarized by the letters A, B, C, and D; means that do not share a letter are significantly different.

Pairwise post hoc comparisons of maximum deposition depth indicated a significant difference in mean values between the lowest and highest combined discharge experiments while revealing similarities among intermediate-discharge scenarios. These similarities could be attributed to the combined flows regulating the depositional depth, which does not exceed the flow depth. The observed differences can be attributed to the increased sediment load and associated morphological changes with increasing discharge.
3.4.4 Confluence angle
Surprisingly, the confluence angle only had a significant influence on 2 out of the 12 response variables (Table 8). The confluence angle did have a decisive impact on scour depth (Fig. 12a). This could be attributed to the increase in the degree of turbulence with increasing confluence angle (Mosley, 1976). The elevated turbulence arises from the increased mutual flow deflection, which influences the shear layers generated between the two converging flows. Along these shear layers, powerful vortices are created, which enhance the bed shear stress within the junction, resulting in significant bed scour (Best, 1987). Reducing the confluence angle allowed for improved mixing of the tributary and main channel flows, which in turn decreased the turbulence in the confluence, producing a shallower scour.
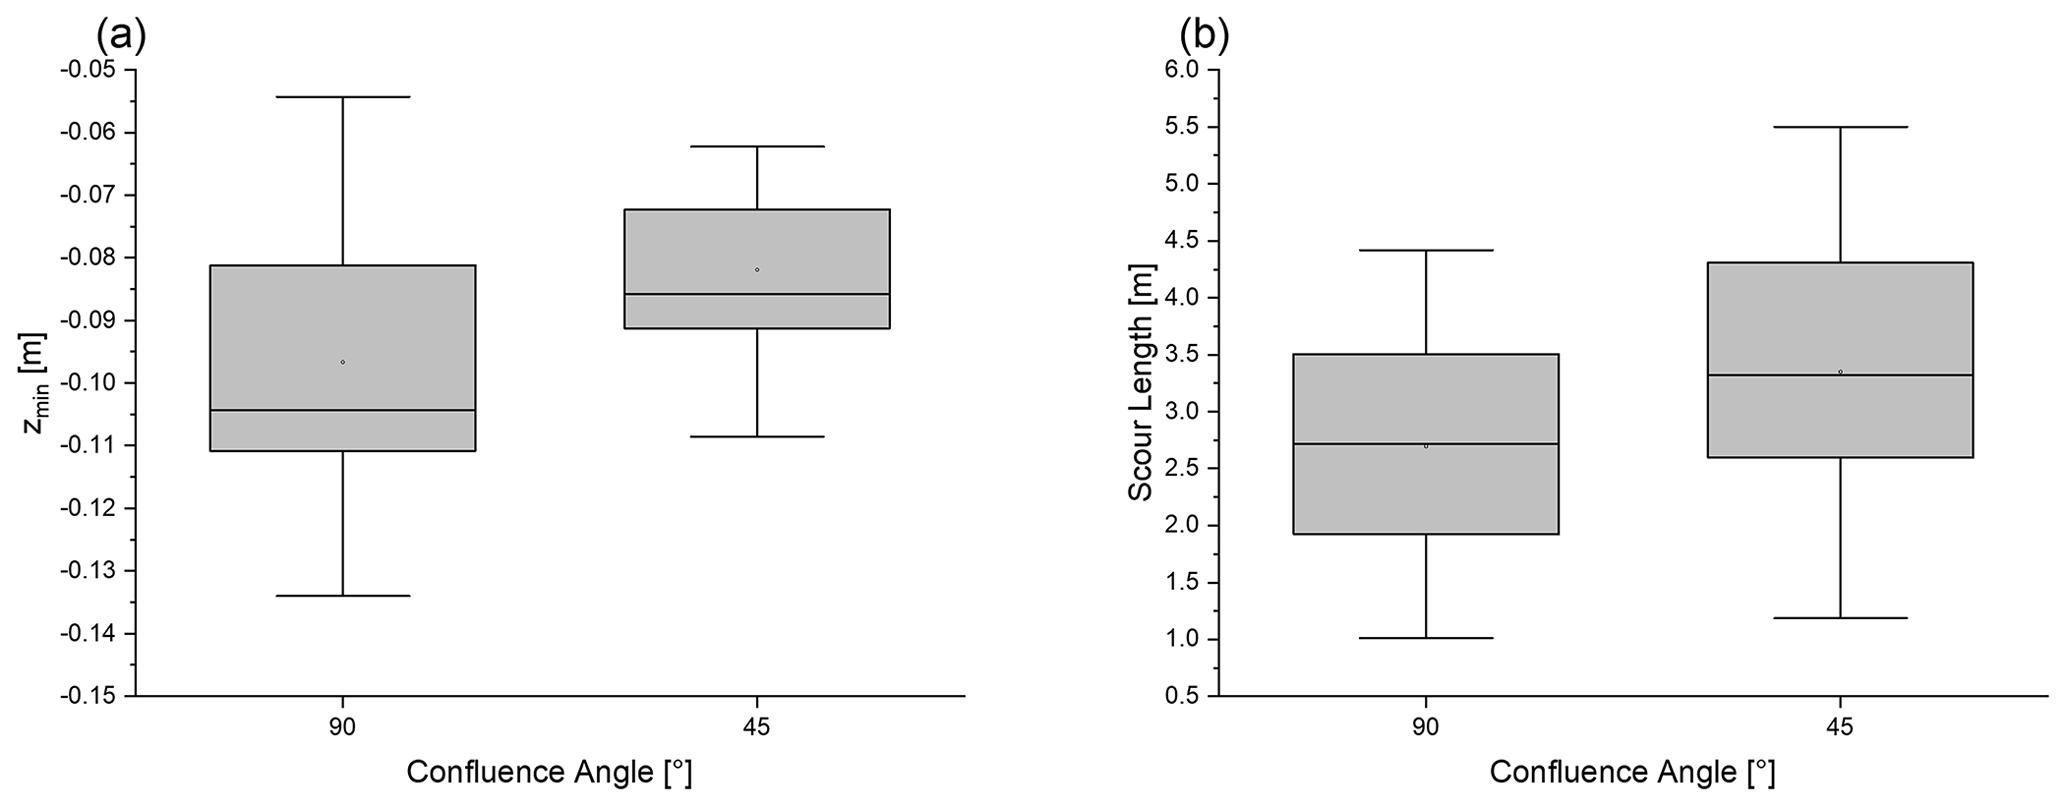
Figure 12Box plots of t-test results for all response variables that showed a significant difference in mean values (Table 5) with the confluence angle as the controlling factor.
Table 8Confluence angle and its impact on the response variables. Post hoc testing was not required since there were only two groups to compare; σ is the standard deviation.
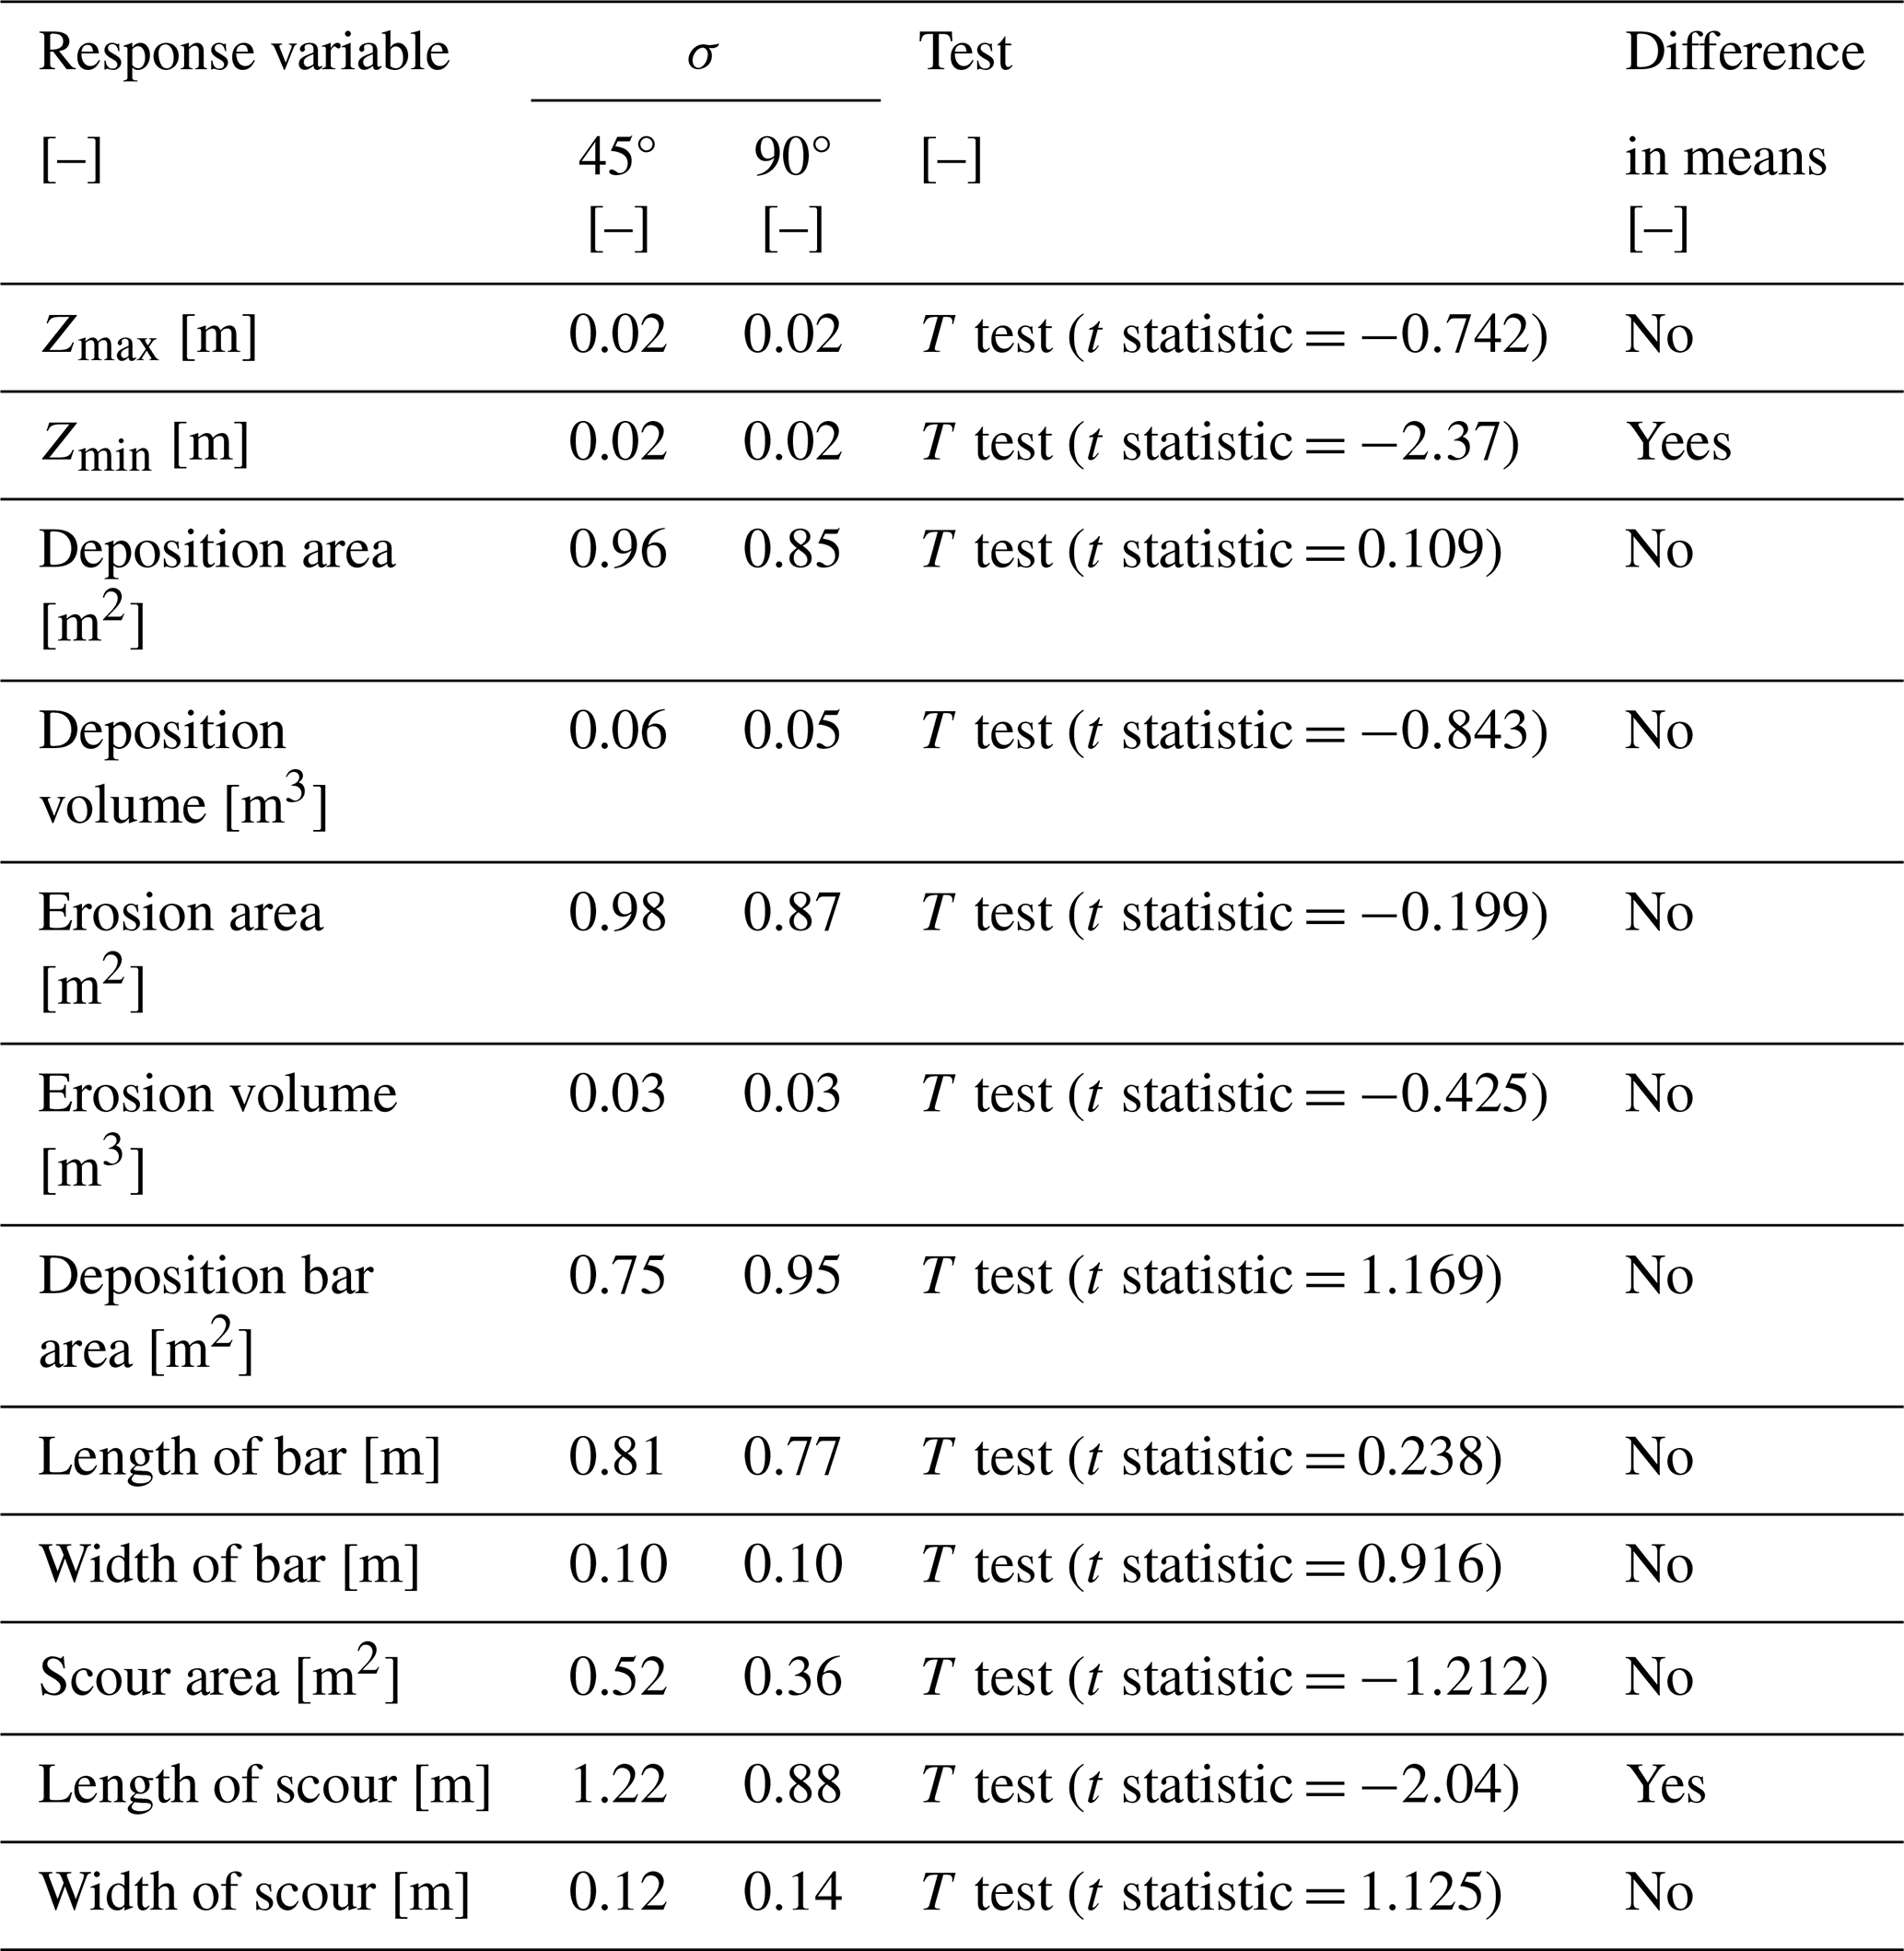
Additionally, the confluence angle had an impact on the length of the scour (Fig. 12b). Enhanced mixing of confluent flows and a reduced hydraulic separation zone created conditions where the scour generally occupied a greater area but produced a shallower scour depth. However, the width of the bar was relatively unchanged (Fig. 8c) in response to the confluence angle; the increased scour area was due to an increase in scour length. While the penetration of the tributary channel was reduced, the transport capacity of the main channel was still sufficient to mobilize a similar volume of sediment (Fig. 8f).
4.1 Special dynamics of mountain river confluences
The confluence angle has been established as being one of the main drivers of the confluence morphology and thus affects the spatial distribution of the hydraulic zones for lowland confluences. However, for mountain river confluences during events with intense bedload transport, it had a minimal effect, corroborating hypothesis 1, i.e., that adjustments to the confluence angle (Fig. 8, Table 8) and the tributary gradient (Fig. 5, Table 5) do not significantly impact the confluence morphology and the development of specific geomorphic units. Wohl (2010) discusses the extremal hypotheses (Davies and Sutherland, 1983), which are based on the underlying assumption that the equilibrium channel morphology corresponds to the morphology that maximizes or minimizes the value of a specific parameter (Darby and Van De Wiel, 2003). Examples of this are reductions in the unit stream power (Yang and Song, 1979) and energy dissipation rate (Yang, 1976) and maximizations of the friction factor (Davies and Sutherland, 1983) and sediment transport rate (White et al., 1982). The confluence morphologically reacted to steep channel flooding and bedload conditions, characterized by higher velocities, sediment concentrations, and Froude numbers than what would be expected at a lowland confluence, and it adjusted to maximize sediment transport through the confluence. Since all channel geometry experiments were exposed to the same discharges and sediment supply rates, a similar development occurred. Relative to mountain river confluences during flooding events, lowland regions are typically less intense and morphologically more responsive to variations in the size and orientation of the hydraulic zones as they respond to channel adjustments (Mosley, 1976; Best, 1987, 1988; Liu et al., 2015). Scour area and depth were the only response variables sensitive to the confluence angle. Decreasing the confluence angle limited the extent of the flow separation zone (Mosley, 1976; Best, 1987). The zone of maximum velocity responded to the size of the flow separation zone (Best, 1987). When more channel was available for the zone of maximum velocity due to a decreased size of the separation zone, the velocity decreased, causing a shallower scour, which is consistent with the findings of Mosley (1976) and Best (1988). In contrast, increasing the confluence angle increased the local velocity and transport capacity and caused greater penetration of the tributary flow. Combined, these aspects provide evidence that the transport capacity of the main channel is enhanced at higher confluence angles, which was reflected in the tributary depositional volumes and gradients. It was previously observed in mountain rivers (Mueller and Pitlick, 2005; Trevisani et al., 2010) that the tributary channel gradient responds to the transport capacity of the flow. Mueller and Pitlick (2005) suggest that forced changes in gradient are offset by adjustments to width, depth, and bed surface texture to maintain a balance between the intensity and frequency of bedload transport. In confined channels, width adjustments are not possible, resulting in extensive deposition in the channel. The main differences in sediment depositional patterns and mechanisms caused by adjusting the tributary channel gradient were observed in the tributary channel, while the main channel was largely unchanged. This indicates that, with a sustained and abundant sediment supply and relatively uniform main channel hydraulic conditions, the morphologic development of the confluence is not significantly impacted by changes in the tributary channel gradient.
Referring to hypothesis 2 (that sediment concentration and channel discharge exert the most control over depositional and erosional patterns), the same geomorphic units and morphological patterns occurred for all experimental groups and channel configurations, which establishes the dominance of the combined channel discharge over the confluence. This can be explained by Guillén-Ludeña et al. (2017), where the main channel supplies the dominant flow discharge. The unit stream power in the main channel (Table 4) was sufficient to force the development of the same geomorphic units for a specific discharge, regardless of changes to the sediment concentration and channel geometry. Adjustments to the sediment concentration were reflected in varying ranges of deposition and erosion depths and volumes as well as varying extents of these geomorphic units. The interaction between discharge and sediment shows clear coarsening or fining trends at specific sites (Fig. 13 and Table A1) for all the introduced controlling factors. However, trends relating the sediment concentration or channel geometry to coarsening or fining are not apparent, since the same general morphological patterns consistently occurred, which in turn caused similar hydraulic conditions to develop. Grain size distribution curves from the tributary channel near the confluence, the deposition cone or bar, and the recovery zone further illustrate the selective bedload transport that occurs in the confluence zone. Consistently across all the experiments, the deposited material in the tributary was finer than the input mix (Fig. 13a–c and Table A1). For experiments with the 10 % tributary gradient, this can be explained by the regressive aggradation that occurred in the tributary channel, which reduced the gradient of the tributary and, thus, its transport capacity. For experiments with a 5 % tributary gradient, the transport capacity of the tributary was saturated, which caused intense progressive deposition of all grain sizes in the channel, despite the increased depositional gradient. Samples taken from the scour hole (Fig. 13d–f and Table A1) showed an overall coarsening, illustrating the enhanced transport capacity through this zone. The separation zone bar was formed in a region of low flow velocity relative to the main channel, which is reflected in the associated grain size distributions (Fig. 13h and i and Table A1). The samples taken from the lowest-discharge experiments were from the deposition cone; the cone did not occupy the hydraulic separation zone and was exposed to the main channel flow. Accordingly, the samples showed a general coarsening pattern of the finer grain fractions and a fining of the larger grain size fractions (Fig. 13g and Table A1). The zone of flow recovery is characterized by decreased turbulence and more uniform flow patterns and bed morphology (Best, 1987, 1988). As a result, no hydraulic or morphologic structures existed that influenced the velocity distribution throughout this portion of the channel. This is apparent in Fig. 13j–l, where the samples taken across all experiments showed the least deviation from the plotted line of the input material. A slight but overall coarsening is apparent, caused by the increased velocity from the combined channel flow and the resulting selective bedload transport.

Figure 13Grain size distribution curves from samples taken from the tributary channel (a–c), the scour hole (d–f), the deposition cone or bar (g–i), and the recovery zone (j–l) for the lowest, middle, and highest experimental discharges. Qm and Qt denote the main and tributary channel discharges, respectively.
4.2 Modeling limitations
Modeling limitations relate mainly to scale effects and the duration required to set up and run an experiment, which limit the scope of the study but create a well-founded base to build from. Preparing and running an experiment took multiple days; the project duration did not allow investigations into the effects of the discharge ratio. An ideal experimental program would have included the same 45 experiments but with a different discharge ratio. Accordingly, we strongly encourage additional investigations into this component, as it influences mountain river confluences. All physical models are subject to some degree of scale effects, as it is impossible to correctly model all force ratios (Chanson, 2004; Heller, 2011). This arises from having to choose the most relevant force ratio, which, for open-channel hydraulics, is Froude similarity (Heller, 2011). Under Froude similarity, the remaining force ratios cannot be identical for the model and the prototype, which can result in non-negligible scale effects (Heller, 2011). Scale effects generally increase with increasing prototype-to-model scale factor (Heller, 2011). Scale limitations on grain size diameter are discussed in Zarn (1992), where it is shown that grain sizes smaller than 0.22 mm can change the flow–grain interaction due to cohesion effects. In this regard, Oliveto and Hager (2005) discuss limiting D50 to 0.80 mm. The model grain size distribution has a minimum grain size of 0.5 mm and a D50 of 1.4 mm. The Shields (θ) number and the grain Reynolds (Re*) number in the main channel were calculated for all discharges and geometric configurations. In the lowest-discharge experiments, θ and Re* range from 0.08–0.10 and 60–67, respectively, at the model scale. At the prototype scale, Re* ranges from 9849–10 927. For the next discharge combination, θ and Re* range from 0.15–0.17 and from 82–87, respectively, at the model scale. At the prototype scale, Re* ranges from 13 523–14 247. While there is certainly a significant shift in Re* between the lab and prototype scales, Aufleger (2006) states that, assuming Froude similarity, Re* numbers of above 80 at the model scale are recommended to minimize scale effects for pre-Alpine gravel-bed rivers. In this regard, for the lowest-discharge experiments, the smaller grain fractions were subject to some degree of scale effects.
The channel discharges and then the tributary sediment concentration are the most impactful factors influencing the mountain river confluence morphology during events with intense bedload transport. This conclusion contrasts with the findings of the literature dealing with the controls on river confluences. Mountain river confluences are influenced by characteristics unique to mountain regions, including the availability of massive amounts of sediment and frequent and intense localized flooding. The rate of sediment entering the confluence saturated the transport capacity of the main channel. The resulting morphologies represented a system tending towards an equilibrium state that was optimized to maximize sediment transport through the confluence through local increases in sediment transport rate. Every geometric group of experiments had the same discharges and sediment supply rates; the resulting morphologies were similar because the channel was responding to similar intense hydraulic and sediment supply conditions. This limited the effect the channel adjustments had on the hydraulic zones influencing the confluence morphology. However, adjustments did cause an apparent response to the depositional mechanisms in the tributary channel. A progressive or regressive aggradation of tributary sediment occurred, which enhanced or reduced the tributary channel transport capacity. Rapid mutual adjustments occurred as the system tended towards an equilibrium state. The evolution towards an equilibrium morphology was characterized by the geomorphic units, which reflected the flood magnitude. With increasing discharge, the geomorphic units transitioned from a cone to a bank-attached bar as the depositional patterns were forced further downstream and into the separation zone, with the bank-attached bar occupying the full extent of the separation zone. When the sediment concentration was fixed and the discharge was adjusted, the morphology responded to the combined channel flows downstream of the confluence. However, the morphological patterns were mainly unaffected when the discharge was fixed and the sediment concentration was adjusted. Therefore, the combined discharge determined the overall morphology and the development of specific geomorphic units, and the sediment concentration controlled the morphological extent of the units. These aspects illustrate that the morphological spatial patterns at mountain river confluences are unique and require special attention for flood risk management.
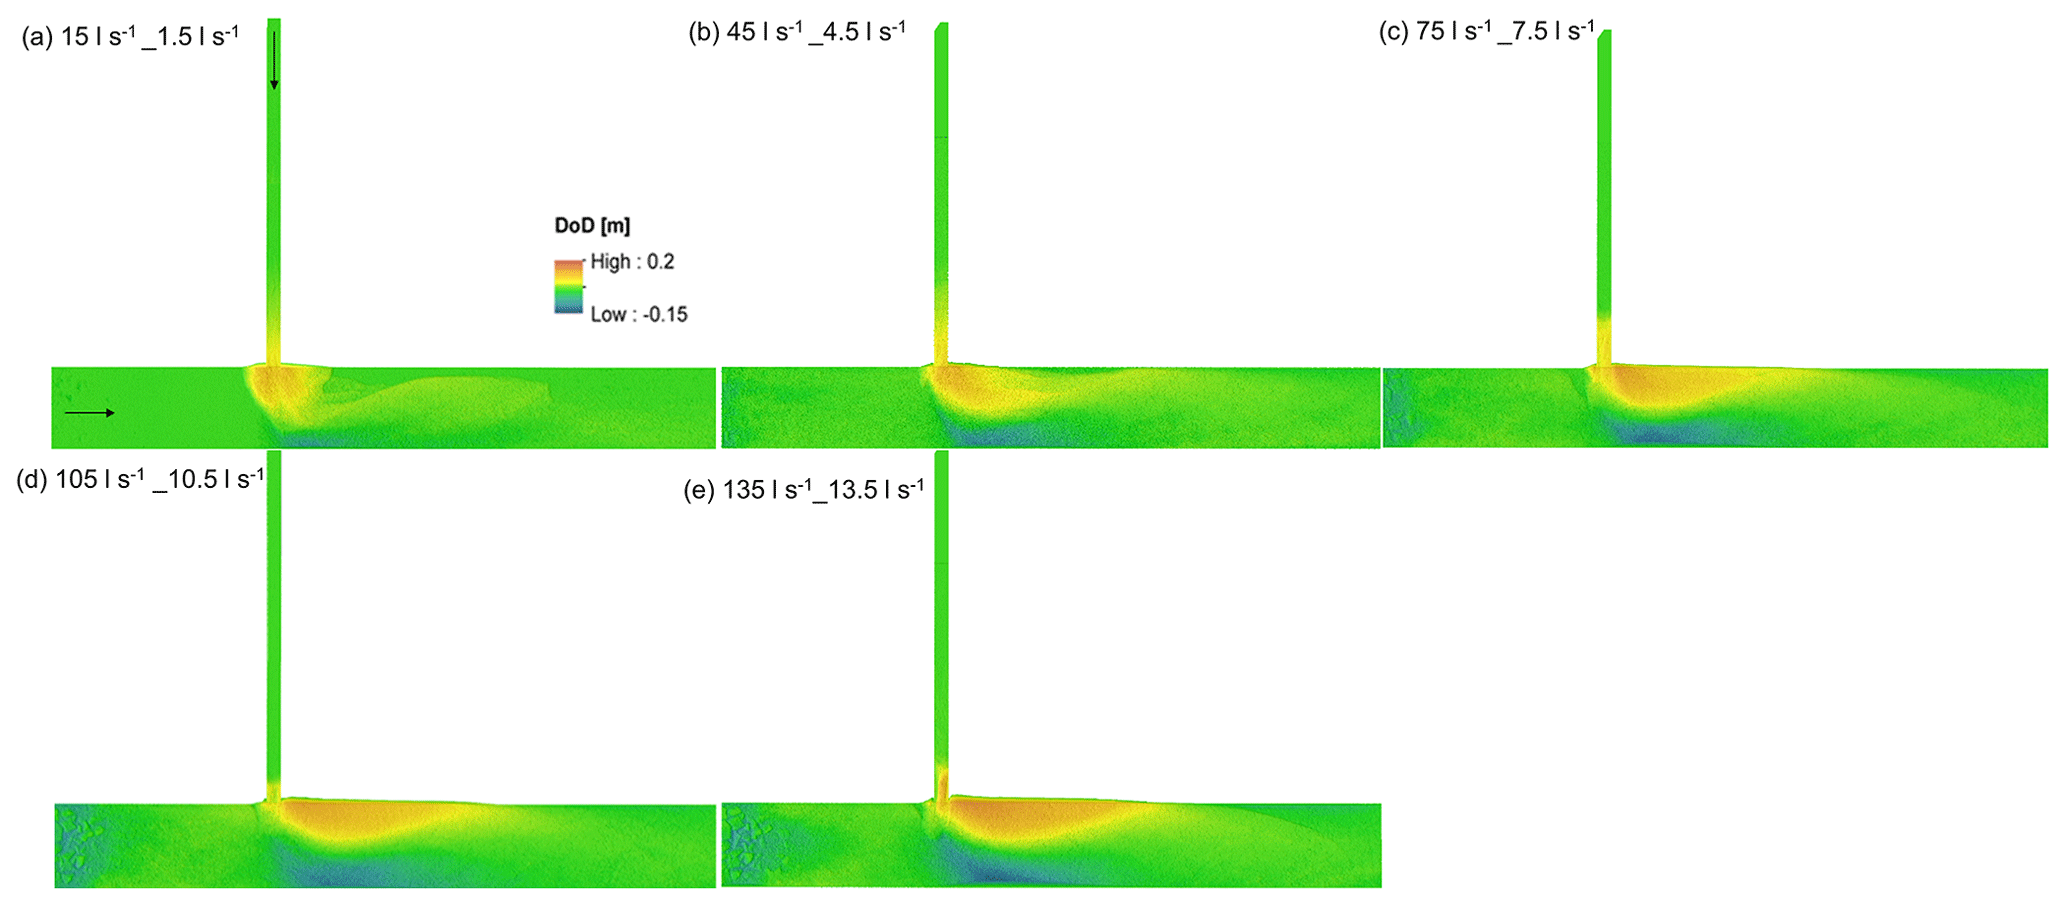
Figure A1Confluence morphologies for experiments 1–5 with a 5 % sediment concentration, a 90° confluence angle, and a 10 % tributary gradient.

Figure A2Confluence morphologies for experiments 6–10 with a 7.5 % sediment concentration, a 90° confluence angle, and a 10 % tributary gradient.
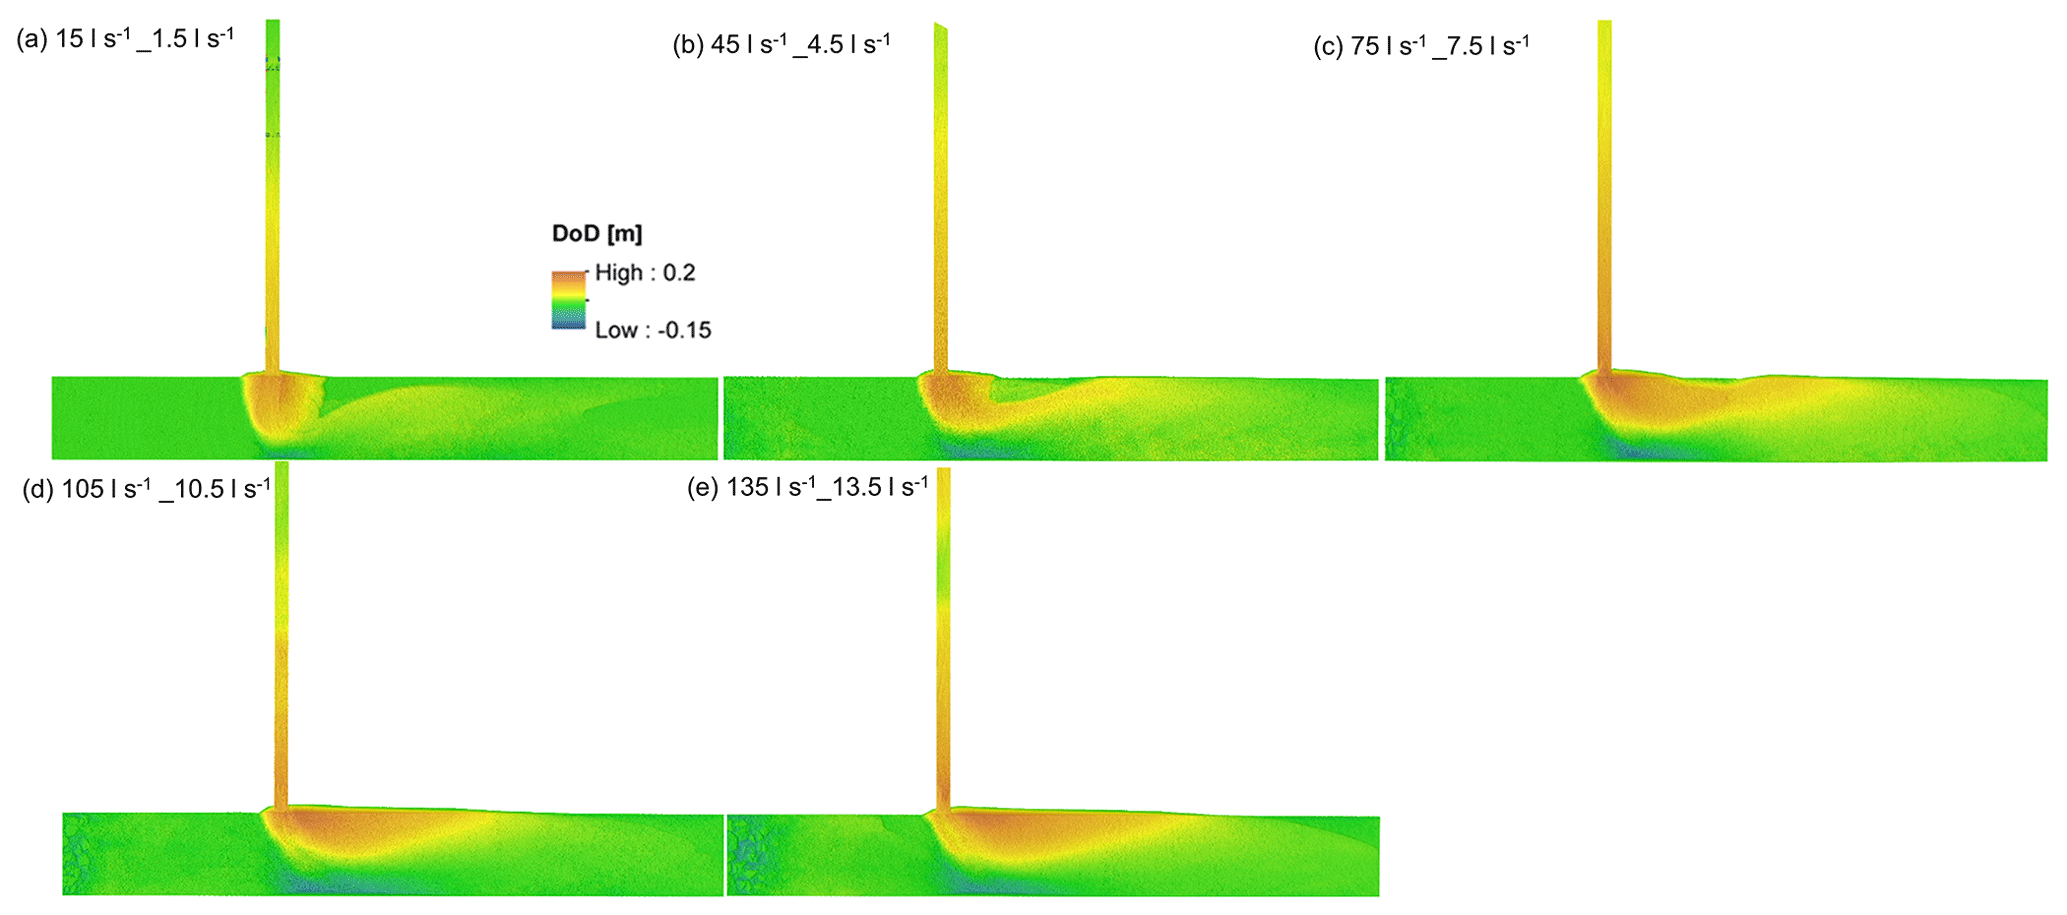
Figure A3Confluence morphologies for experiments 11–15 with a 10 % sediment concentration, a 90° confluence angle, and a 10 % tributary gradient.
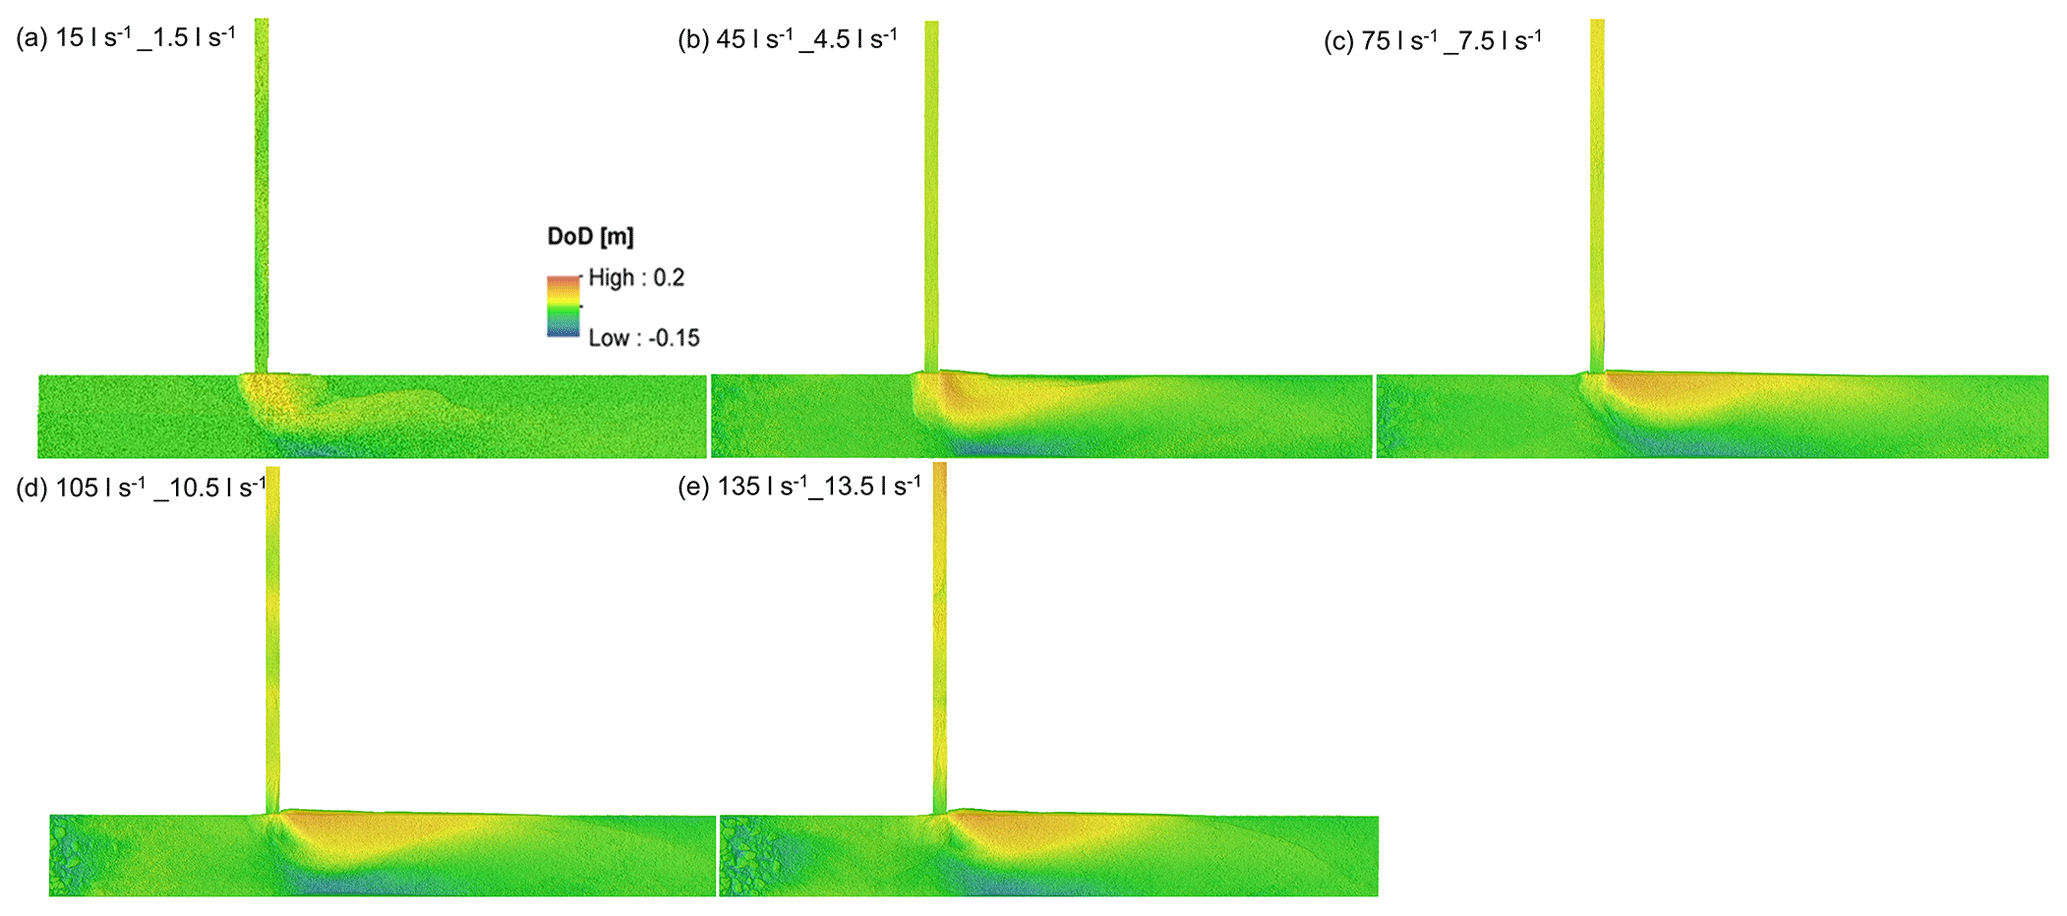
Figure A4Confluence morphologies for experiments 16–20 with a 5 % sediment concentration, a 90° confluence angle, and a 5 % tributary gradient.
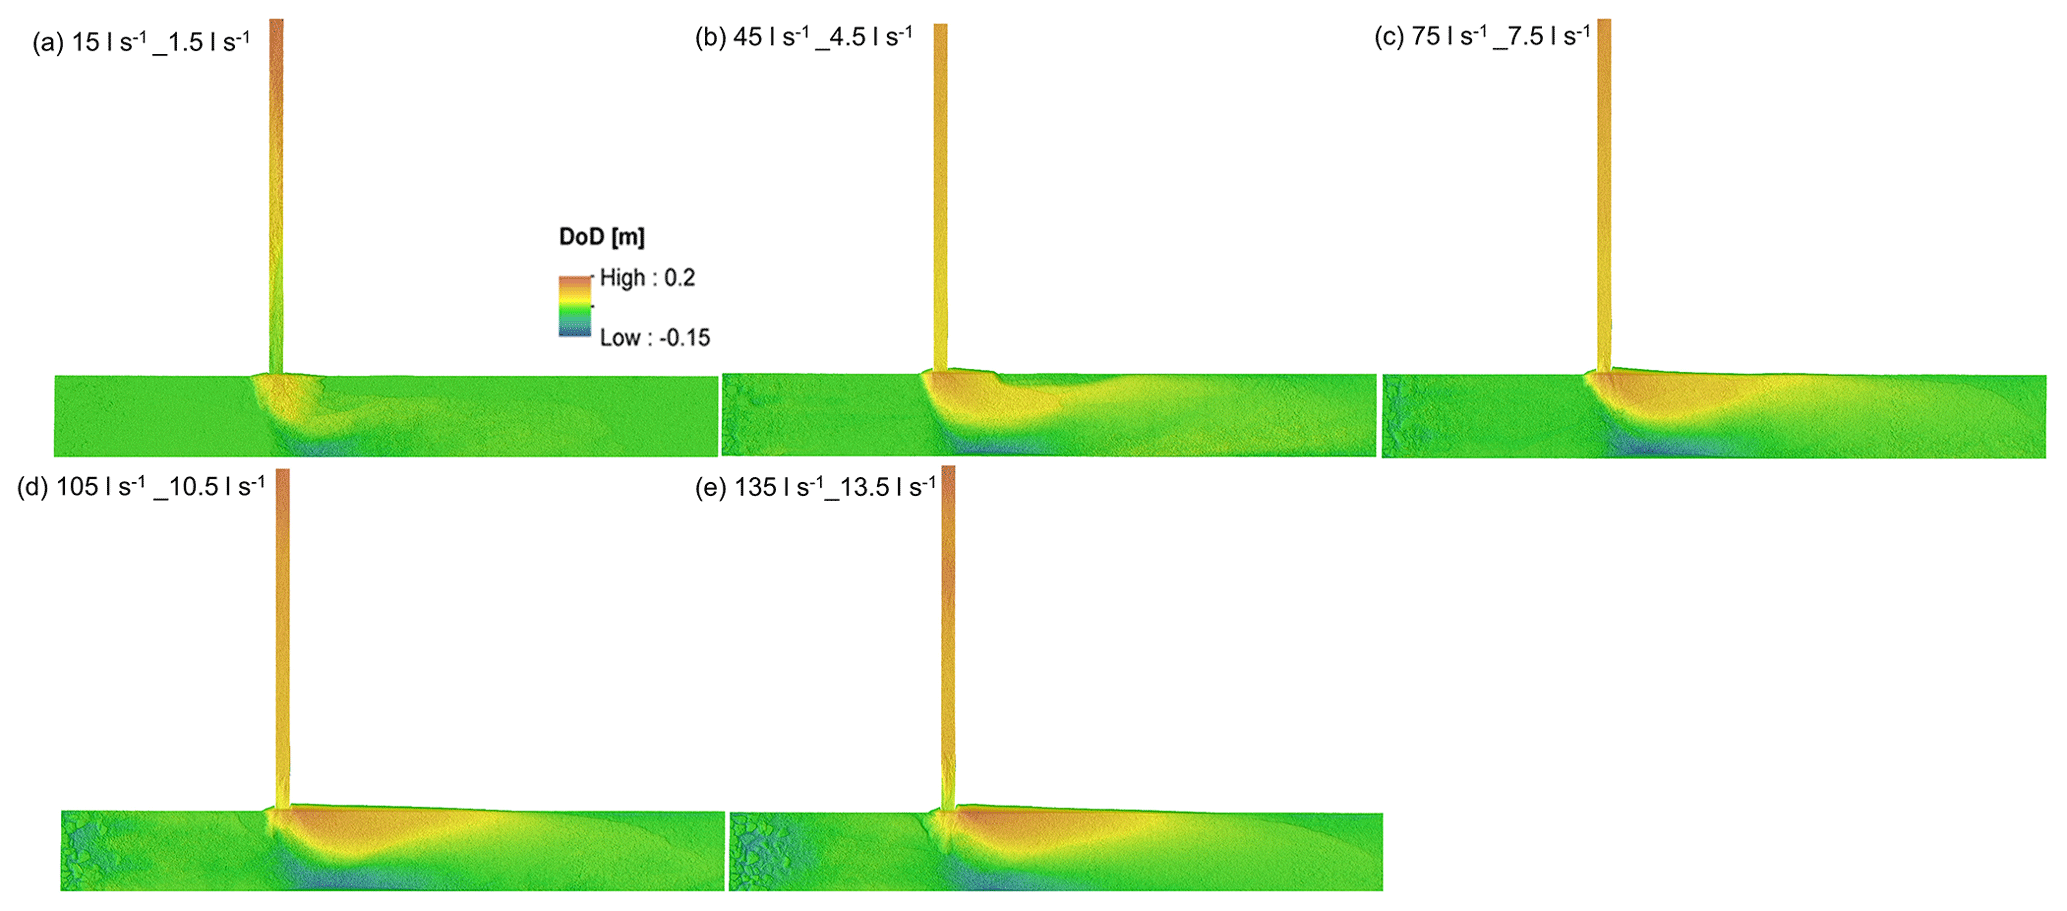
Figure A5Confluence morphologies for experiments 21–25 with a 7.5 % sediment concentration, a 90° confluence angle, and a 5 % tributary gradient.

Figure A6Confluence morphologies for experiments 26–29 with a 10 % sediment concentration, a 90° confluence angle, and a 5 % tributary gradient.
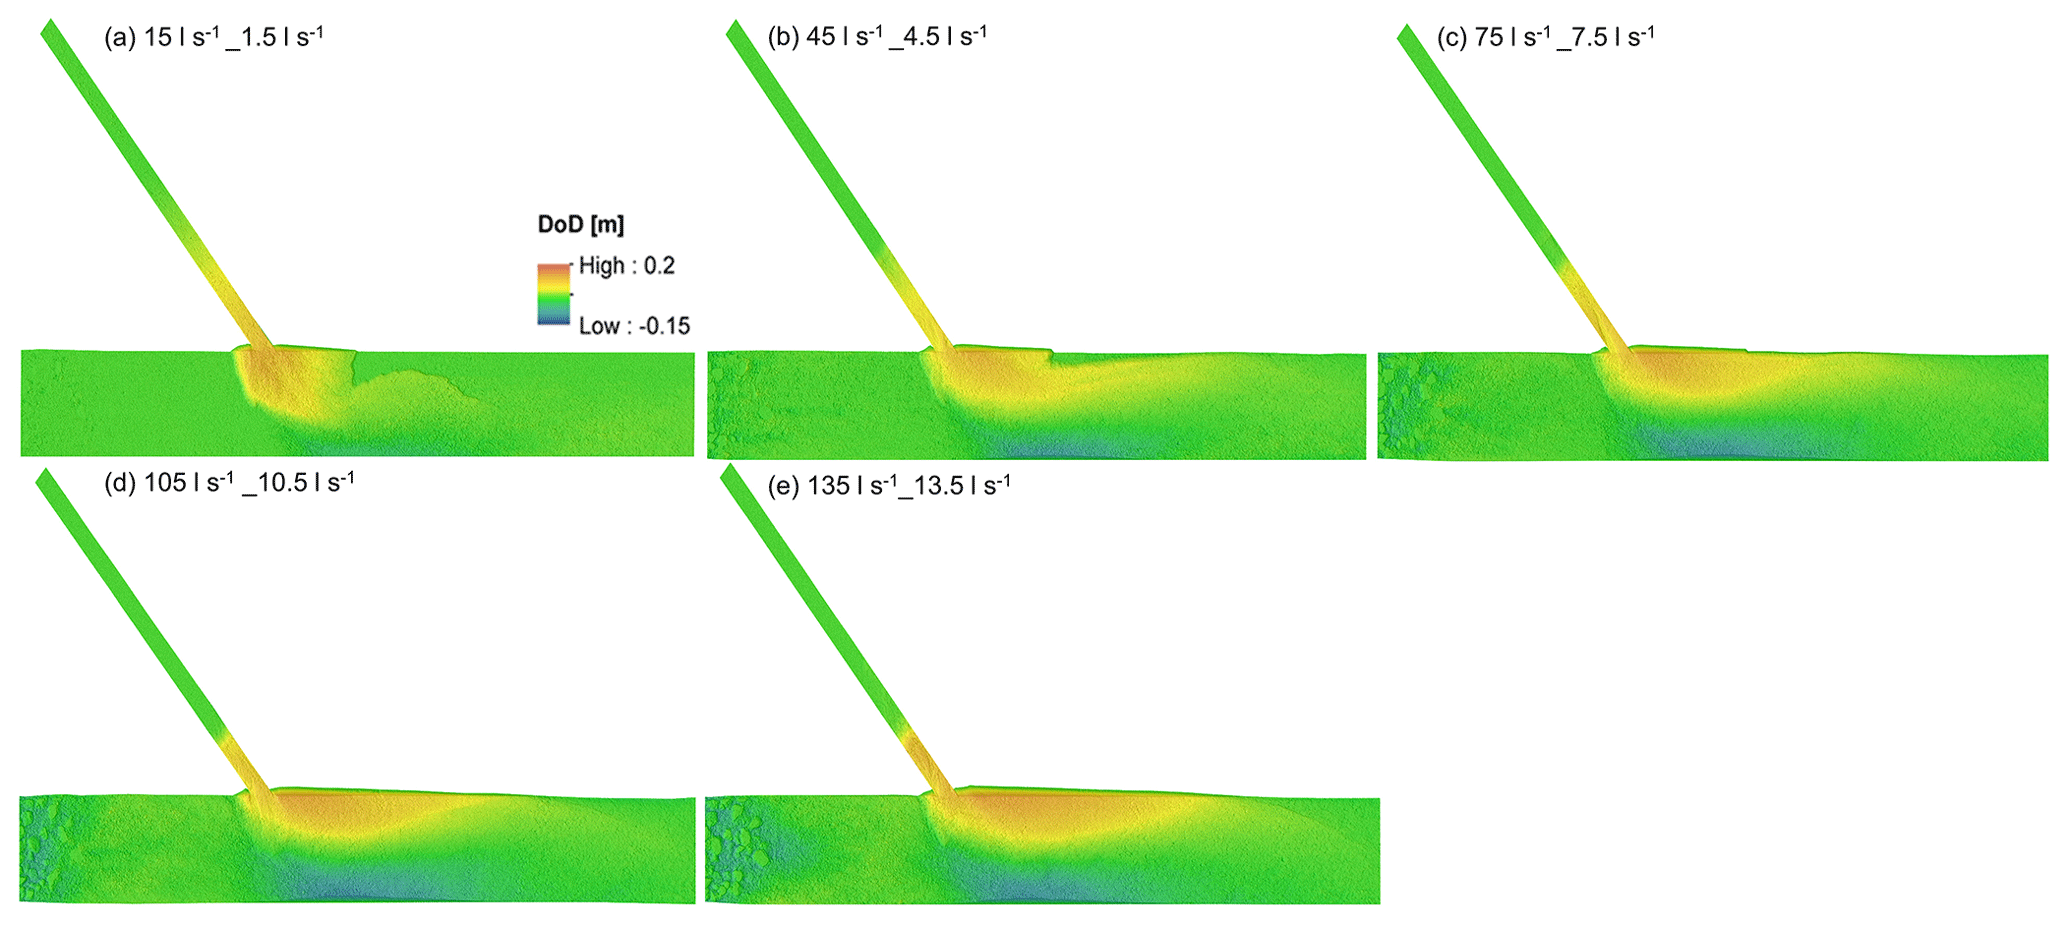
Figure A7Confluence morphologies for experiments 31–35 with a 5 % sediment concentration, a 45° confluence angle, and a 10 % tributary gradient.
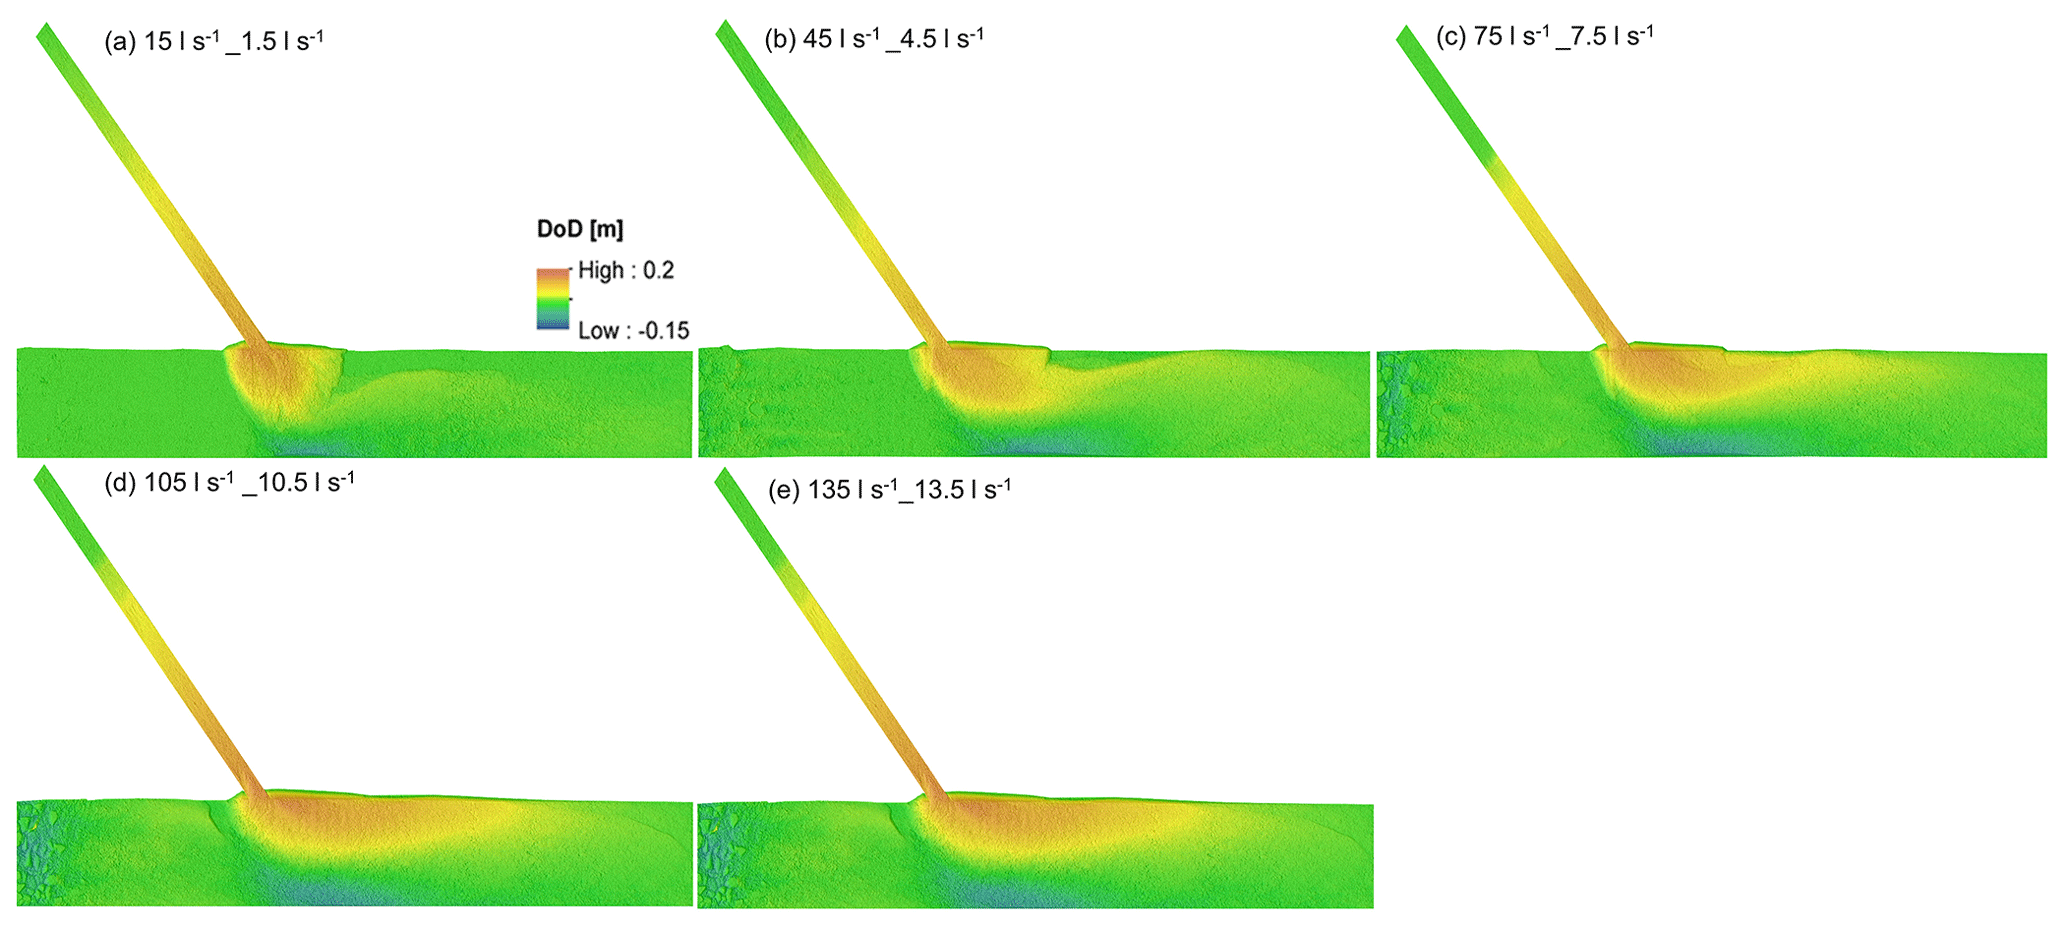
Figure A8Confluence morphologies for experiments 36–40 with a 7.5 % sediment concentration, a 45° confluence angle, and a 10 % tributary gradient.
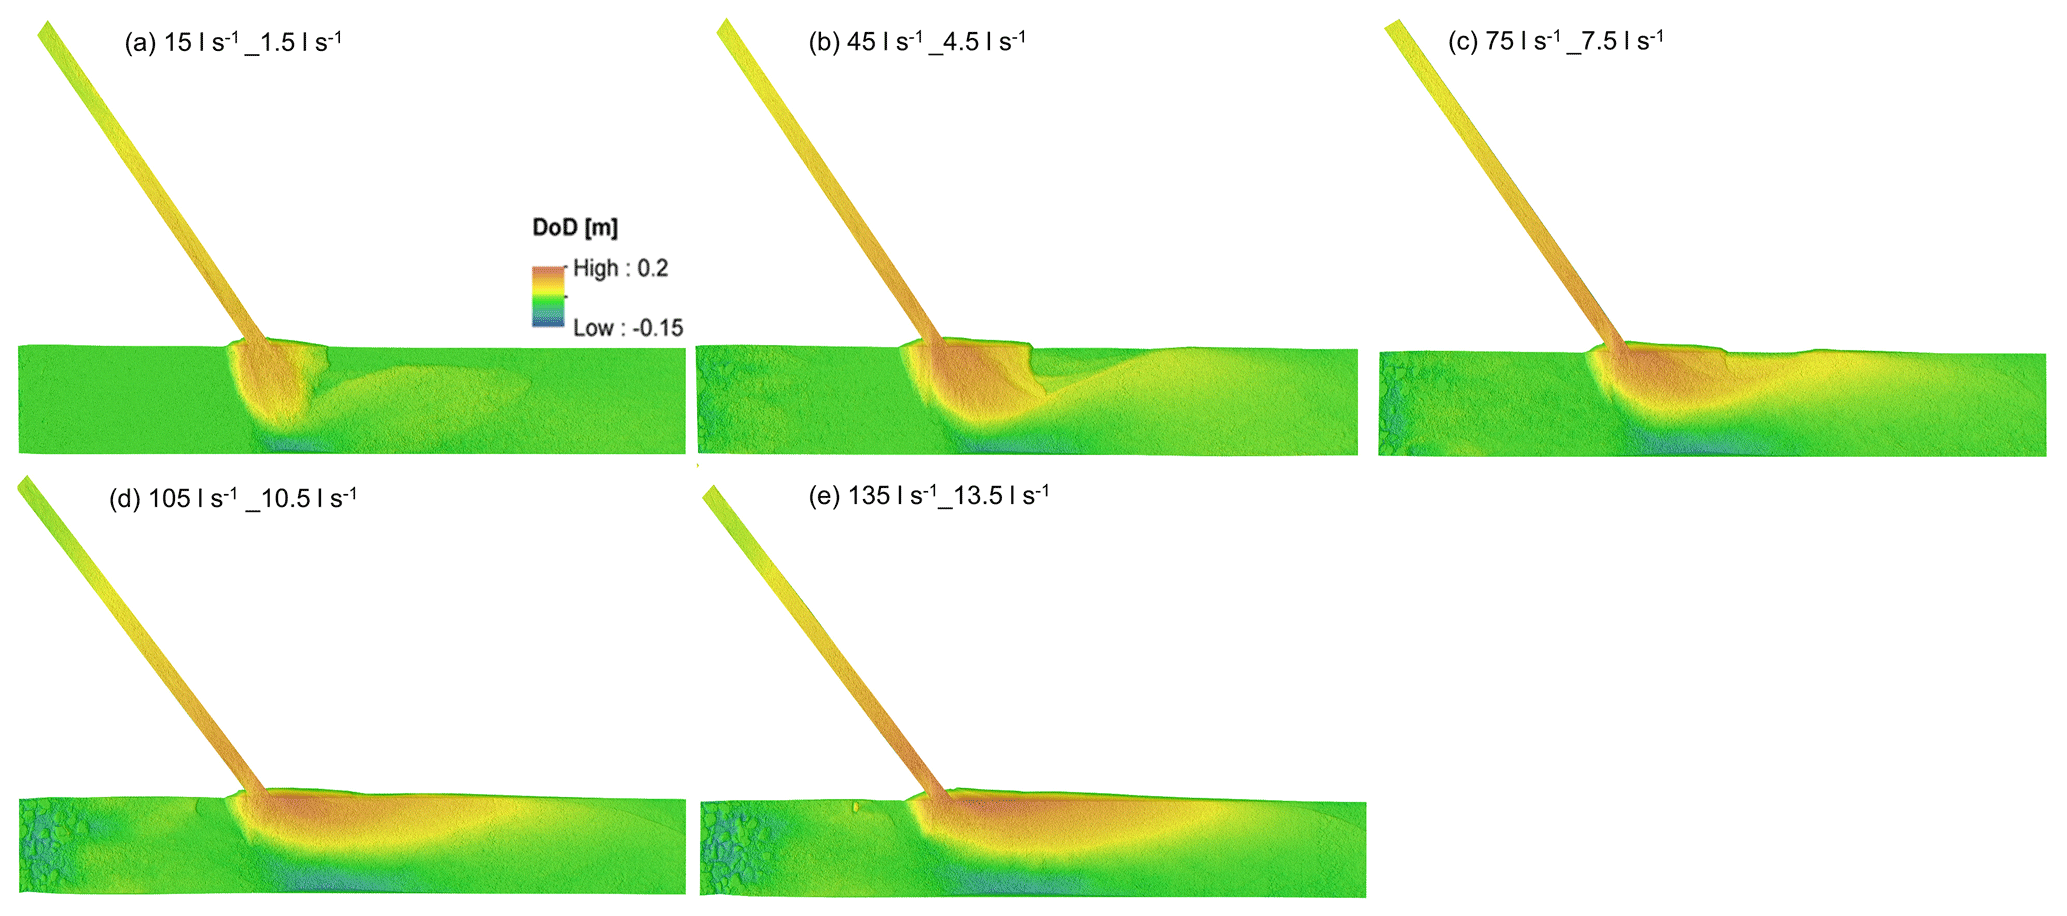
Figure A9Confluence morphologies for experiments 41–45 with a 10 % sediment concentration, a 45° confluence angle, and a 10 % tributary gradient.
Table A1Characteristic grain sizes from samples taken in the tributary channel, the geomorphic units (depositional or scour hole), and the recovery zone in all of the experiments. Bold text indicates that the sampled grain size was larger than the input-mix grain size.

Data are available from the corresponding author upon reasonable request.
TSPO: conceptualization, data curation, formal analysis, investigation, methodology, visualization, writing – original draft preparation (with input from all co-authors). TK: formal analysis, data curation. BM: conceptualization, methodology, writing – review and editing. JH: formal analysis, investigation, writing – review and editing. AA: conceptualization, writing – review and editing. FC: conceptualization, supervision, project administration, funding acquisition, writing – review and editing. BG: conceptualization, supervision, project administration, funding acquisition, writing – review and editing.
The contact author has declared that none of the authors has any competing interests.
Publisher's note: Copernicus Publications remains neutral with regard to jurisdictional claims made in the text, published maps, institutional affiliations, or any other geographical representation in this paper. While Copernicus Publications makes every effort to include appropriate place names, the final responsibility lies with the authors.
The authors would like to thank the Department of Innovation, Research, University and Museums of the Autonomous Province of Bolzano for funding the project “Towards an Efficient Design of River Confluences to Manage Intense Sediment Impacts from Tributary Torrents”. This project and the accompanying funding provided the framework to conduct detailed investigations into mountain river confluence hydraulics and morphology. Additionally, we acknowledge the funding of the project Anid/Conicyt Fondecyt Regular Folio 1200091, titled “Unravelling the Dynamics and Impacts of Sediment-Laden Flows in Urban Areas in Southern Chile as a Basis for Innovative Adaptation (sedimpact)” led by Bruno Mazzorana.
This research has been supported by the Provincia autonoma di Bolzano – Alto Adige (grant no. 24/34).
This paper was edited by Andreas Günther and reviewed by two anonymous referees.
Ancey, C.: Bedload transport: A walk between randomness and determinism. part 1. the state of the art, J. Hydraul. Res., 58, 1–17, https://doi.org/10.1080/00221686.2019.1702594, 2020a.
Ancey, C.: Bedload transport: A walk between randomness and determinism. part 2. challenges and prospects, J. Hydraul. Res., 58, 18–33, https://doi.org/10.1080/00221686.2019.1702595, 2020b.
Aufleger, M.: Flussmorphologische Modell. Grundlagen und Anwendungsgrenzen. Berichte des Lehrstuhls und der Versuchsanstalt für Wasserbau und Wasserwirtshaft, Band Nr. 104, TU München, 198–207, 2006.
Aulitzky, H.: Preliminary two-fold classification of debris torrents, in: Vol. 4, Conference Proceedings of Interpraevent 1980, 8–12 September 1980, Bad Ischl, Austria, 285–309, 1980.
Aulitzky, H.: The debris flows of Austria, Bull. Eng. Geol. Environ., 40, 5–13, https://doi.org/10.1007/BF02590338, 1989.
Baranovskiy, N. V.: The development of application to software origin pro for informational analysis and forecast of forest fire danger caused by thunderstorm activity, J. Automat. Inf. Sci., 51, 12–23, https://doi.org/10.1615/jautomatinfscien.v51.i4.20, 2019.
Benda, L., Andras, K., Miller, D., and Bigelow, P.: Confluence effects in rivers: Interactions of basin scale, network geometry, and disturbance regimes, Water Resour. Res., 40, 1–15, https://doi.org/10.1029/2003wr002583, 2004.
Best, J. L.: Flow Dynamics at River Channel Confluences: Implications for Sediment Transport and Bed Morphology, in: Recent Developments in Fluvial Sedimentology, SEPM Special Publication, edited by: Etheridge, F. G., Flores, R. M., and Harvey, M. D., Society for Sedimentary Geology, Tulsa, OK, 27–35, https://doi.org/10.2110/pec.87.39.0027, 1987.
Best, J. L.: Sediment transport and bed morphology at river channel confluences, Sedimentology, 35, 481–498, https://doi.org/10.1111/j.1365-3091.1988.tb00999.x, 1988.
Biron, P., Roy, A. G., Best, J. L., and Boyer, C. J.: Bed morphology and sedimentology at the confluence of unequal depth channels, Geomorphology, 8, 115–129, https://doi.org/10.1016/0169-555x(93)90032-w, 1993.
Biron, P., Roy, A. G., and Best, J. L.: Turbulent flow structure at concordant and discordant open-channel confluences, Exp. Fluids, 21, 437–446, https://doi.org/10.1007/bf00189046, 1996.
Blöschl, G., Hall, J., Parajka, J., Perdigão, R. A., Merz, B., Arheimer, B., Aronica, G. T., Bilibashi, A., Bonacci, O., Borga, M., Čanjevac, I., Castellarin, A., Chirico, G. B., Claps, P., Fiala, K., Frolova, N., Gorbachova, L., Gül, A., Hannaford, J., Harrigan, S., Kireeva, M., Kiss, A., Kjeldsen, T. R., Kohnová, S., Koskela, J. J., Ledvinka, O., Macdonald, N., Mavrova-Guirguinova, M., Mediero, L., Merz, R., Molnar, P., Montanari, A., Murphy, C., Osuch, M., Ovcharuk, V., Radevski, I., Rogger, M., Salinas, J. L., Sauquet, E., Šraj, M., Szolgay, J., Viglione, A., Volpi, E., Wilson, D., Zaimi, K., and Živković, N.: Changing climate shifts timing of European floods, Science, 357, 588–590, https://doi.org/10.1126/science.aan2506, 2017.
Blöschl, G., Kiss, A., Viglione, A., Barriendos, M., Böhm, O., Brázdil, R., Coeur, D., Demarée, G., Llasat, M. C., Macdonald, N., Retsö, D., Roald, L., Schmocker-Fackel, P., Amorim, I., Bělínová, M., Benito, G., Bertolin, C., Camuffo, D., Cornel, D., Doktor, R., Elleder, L., Enzi, S., Garcia, J. C., Glaser, R., Hall, J., Haslinger, K., Hofstätter, M., Komma, J., Limanówka, D., Lun, D., Panin, A., Parajka, J., Petrić, H., Rodrigo, F. S., Rohr, C., Schönbein, J., Schulte, L., Silva, L. P., Toonen, W. H. J., Valent, P., Waser, J., and Wetter, O.: Current European flood-rich period exceptional compared with past 500 years, Nature, 583, 560–566, https://doi.org/10.1038/s41586-020-2478-3, 2020.
Boyer, C., Roy, A. G., and Best, J. L.: Dynamics of a river channel confluence with discordant beds: Flow turbulence, bed load sediment transport, and bed morphology, J. Geophys. Res., 111, F04007, https://doi.org/10.1029/2005jf000458, 2006.
Bradbrook, K. F., Biron, P. M., Lane, S. N., Richards, K. S., and Roy, A. G.: Investigation of controls on secondary circulation in a simple confluence geometry using a three-dimensional numerical model, Hydrol. Process., 12, 1371–1396, https://doi.org/10.1002/(SICI)1099-1085(19980630)12:8<1371::AID-HYP620>3.0.CO;2-C, 1998.
Bunte, K., and Abt, S. R.: Sampling surface and subsurface particle size distributions in wadable gravel- and cobble-bed streams for analysis in sediment transport, hydraulics, and streambed monitoring, Gen. Tech. Rep. RMRS-GTR-74, US Dep. of Agric., For. Serv., Rocky Mt. Res. Stn., Fort Collins, Colorado, USA, p. 428, https://doi.org/10.2737/RMRS-GTR-74, 2001.
Chanson, H.: The hydraulics of open channel flow, Butterworth-Heinemann, Oxford, UK, https://doi.org/10.1016/B978-0-7506-5978-9.X5000-4, 2004.
Chow, V. T.: Open Channel Hydraulics, McGraw-Hill, New York, ISBN 9780070859067, 1959.
Darby, S. E. and Van De Wiel, M. J.: Models in fluvial geomorphology, in Tools in Fluvial Geomorphology, edited by: Kondolf, G. M. and Piégay, H., John Wiley, Chichester, UK, 503–537, https://doi.org/10.1002/9781118648551.ch17, 2003.
Davies, T. R. H., and A. J. Sutherland: Extremal hypotheses for river behaviour, Water Resour. Res., 19, 141–148, https://doi.org/10.1029/WR019i001p00141, 1983.
Delacre, M., Leys, C., Mora, Y., and Lakens, D.: Taking Parametric Assumptions Seriously: Arguments for the Use of Welch's F-test instead of the Classical F-test in One-Way ANOVA, Int. Rev. Soc. Psychol., 32, 13, https://doi.org/10.5334/irsp.198, 2019.
De Serres, B., Roy, A., Biron, P., and Best, J. L.: Three-dimensional flow structure at a river channel confluence with discordant beds, Geomorphology, 26, 313–335, https://doi.org/10.1016/S0169-555X(98)00064-6, 1999.
Dunn, O. J.: Multiple comparisons using rank sums, Technometrics, 6, 241–252, https://doi.org/10.1080/00401706.1964.10490181, 1964.
Embleton-Hamann, C.: Geomorphological Hazards in Austria, in: Geomorphological Hazards of Europe, edited by: Embleton, C. and Embleton-Hamann, C., Elsevier Science Amsterdam, the Netherlands, 1–30, https://doi.org/10.1016/S0928-2025(97)80002-8, 1997.
Ferguson, R. and Hoey, T.: Effects of Tributaries on Main-Channel Geomorphology, in: River Confluences, Tributaries and the Fluvial Network, edited by: Rice, S. P, Roy, A. G., and Rhoads, B. L., John Wiley & Sons Hoboken, New Jersey, 183–206, https://doi.org/10.1002/9780470760383.ch10, 2008.
Gems, B., Sturm, M., Vogl, A., Weber, C., and Aufleger , M.: Analysis of Damage Causing Hazard Processes on a Torrent Fan – Scale Model Tests of the Schnannerbach Torrent Channel and its Entry to the Receiving Water, in: Conference Proceedings of Interpraevent 2014 in the Pacific Rim, 25–28 November 2014, Nara, Japan, 170–178, 2014.
Gems, B., Kammerlander, J., Aufleger, M., and Moser, M.: Fluviatile Feststoffereignisse, in: ExtremA 2019, Aktueller Wissensstand zu Extremereignissen alpiner Naturgefahren in Österreich, edited by: Glade, T., Mergili, M., and. Sattler K., Vienna University Press, 287–321, ISBN 9783847110927, 2020.
Guillén-Ludeña, S., Franca, M. J., Cardoso, A. H., and Schleiss, A.: Hydro-morphodynamic evolution in a 90° movable bed discordant confluence with low discharge ratio, Earth Surf. Proc. Land., 40, 1927–1938, https://doi.org/10.1002/esp.3770, 2015.
Guillén-Ludeña, S., Cheng, Z., Constantinescu, G., and Franca, M. J.: Hydrodynamics of mountain-river confluences and its relationship to sediment transport, J. Geophys. Res.-Earth, 122, 901–924, https://doi.org/10.1002/2016jf004122, 2017.
Hanus, S., Hrachowitz, M., Zekollari, H., Schoups, G., Vizcaino, M., and Kaitna, R.: Future changes in annual, seasonal and monthly runoff signatures in contrasting Alpine catchments in Austria, Hydrol. Earth Syst. Sci., 25, 3429–3453, https://doi.org/10.5194/hess-25-3429-2021, 2021.
Heller, V.: Scale effects in physical hydraulic engineering models, J. Hydraul. Res., 49, 293–306, https://doi.org/10.1080/00221686.2011.578914, 2011.
Hübl, J. and Moser, M.: Risk management in Lattenbach: A case study from Austria, WIT Press, 333–342, https://doi.org/10.2495/deb060321, 2006.
Hübl, J., Ganahl, E., Bacher, M., Chiari, M., Holub, M., Kaitna, R., Prokop, A., Dunwoody, G., Forster, A., and Schneiderbauer, S.: Dokumentation der Wildbachereignisse vom 22./23. August 2005 in Tirol, Band 1: Generelle Aufnahme (5W-Standard); IAN Report 109 Band 1, Institut für Alpine Naturgefahren, Universität für Bodenkultur-Wien, unveröffentlicht, 2005.
Hübl, J., Eisl, J., and Tadler, R.: Ereignisdokumentation 2012, Jahresrückblick der Ereignisse, IAN Report 150, Band 3, Institut für Alpine Naturgefahren, Universität für Bodenkultur – Wien, unveröffentlicht, 2012.
Kammerlander, J., Gems, B., Sturm, M., and Aufleger, M.: Analysis of Flood Related Processes at Confluences of Steep Tributary Channels and Their Respective Receiving Streams – 2d Numerical Modelling Application, in: Conference Proceedings of Interpraevent 2016, 30 May–2 June 2016,Lucerne, Switzerland, 319–326, 2016.
Keiler, M., Knight, J., and Harrison, S.: Climate change and geomorphological hazards in the Eastern European Alps, Philos. T. Roy. Soc. A, 368, 2461–2479, https://doi.org/10.1098/rsta.2010.0047, 2010.
Knight, J. and Harrison, S.: Sediments and future climate, Nat. Geosci., 2, 230–230, https://doi.org/10.1038/ngeo491, 2009.
Lane, E. W.: The importance of fluvial morphology in hydraulic engineering, J. Hydraul. Eng.-ASCE, 81, 1–17, 1955.
Leite Ribeiro, M., Blanckaert, K., Roy, A. G., and Schleiss, A. J.: Hydromorphological implications of local tributary widening for river rehabilitation, Water. Resour. Res., 48, 201–217, https://doi.org/10.1029/2011wr011296, 2012a.
Leite Ribeiro, M., Blanckaert, K., Roy, A. G., and Schleiss, A. J.: Flow and sediment dynamics in channel confluences J. Geophys. Res.-Earth, 117, F01035, https://doi.org/10.1029/2011jf002171, 2012b.
Liu, T., Fan, B., and Lu, J.: Sediment-flow interactions at channel confluences: A flume study, Adv. Mech. Eng., 7, 1–9, https://doi.org/10.1177/1687814015590525, 2015.
Löschner, L., Herrnegger, M., Apperl, B., Senoner, T., Seher, W., and Nachtnebel, H. P.: Flood risk, climate change and settlement development: a micro-scale assessment of Austrian municipalities, Reg. Environ. Change, 17, 311–322, https://doi.org/10.1007/s10113-016-1009-0, 2017.
Massey, F. J.: The Kolmogorov-Smirnov test for goodness of fit, J. Am. Stat. Assoc., 46, 68–78, https://doi.org/10.1080/01621459.1951.10500769, 1951.
Maxwell, S. E. and Delaney, H. D.: Designing experiments and analyzing data, in: 2nd Edn., Routledge, New York, https://doi.org/10.4324/9781410609243, 2004.
McKnight, P. E. and Najab, J.: Mann–Whitney U Test, in: The Corsini Encyclopedia of Psychology 1-1, John Wiley & Sons, Hoboken, New Jersey, https://doi.org/10.1002/9780470479216.corpsy0524, 2010.
Meunier, M.: Eìleìments d'hydraulique Torrentielle, Cemagref, France, EAN13 9782759212088, 1991.
Miller, J. P.: High mountain streams: effects of geology on channel characteristics and bed material. Mem. State Bureau of Mines and Mineral Resources, New Mexico Institute of Mining & Technology, Socorro, New Mexico, 1–53, https://geoinfo.nmt.edu/publications/monographs/memoirs/downloads/4/Memoir_04.pdf (last access: 1 August 2023), 1958.
Moder, K.: Alternatives to F-test in one-way ANOVA in case of heterogeneity of variances (a simulation study), Psychol. Test Assess. Model., 52, 343–353, 2010.
Mosley, M. P.: An experimental study of channel confluences, J. Geol., 84, 535–562, https://doi.org/10.1086/628230, 1976.
Mueller, E. R. and Pitlick, J.: Morphologically based model of bed load transport capacity in a headwater stream, J. Geophys. Res., 110, F02016, https://doi.org/10.1029/2003jf000117, 2005.
Oliveto, G. and Hager, W. H.: Further results to time dependent local scour at bridge elements, J. Hydraul. Eng., 131, 97–105, https://doi.org/10.1061/(ASCE)0733-9429(2005)131:2(97), 2005.
Penna, N., De Marchis, M., Canelas, O. B., Napoli, E., Cardoso, A. H., and Gaudio, R.: Effect of the Junction Angle on Turbulent Flow at a Hydraulic Confluence, Water, 10, 469, https://doi.org/10.3390/w10040469, 2018.
Prenner, D., Hrachowitz, M., and Kaitna, R.: Trigger characteristics of torrential flows from high to low alpine regions, Austria, Sci. Total. Environ., 658, 958–972, https://doi.org/10.1016/j.scitotenv.2018.12.206, 2018.
Rhoads, B. and Kenworthy, S.: Flow structure at an asymmetrical confluence, Geomorphology, 11, 273–293, https://doi.org/10.1016/0169-555X(94)00069-4, 1995.
Rice, S.: Which tributaries disrupt downstream fining along gravel-bed rivers?, Geomorphology, 22, 39–56, https://doi.org/10.1016/s0169-555x(97)00052-4, 1998.
Roca, M., Martín-Vide, J. P., and Martin-Moreta, P.: Modelling a torrential event in a river confluence, J. Hydrol., 364, 207–215, https://doi.org/10.1016/j.jhydrol.2008.10.020, 2009.
Rom, J., Haas, F., Hofmeister, F., Fleischer, F., Altmann, M., Pfeiffer, M., Heckmann, T., and Becht, M.: Analysing the large-scale debris flow event in July 2022 in Horlachtal, Austria, using remote sensing and measurement data, Geosci. J., 13, 100, https://doi.org/10.3390/geosciences13040100, 2023.
Roy, A. and Bergeron, N.: Flow and particle paths at a natural river confluence with coarse bed material, Geomorphology, 3, 99–112, https://doi.org/10.1016/0169-555x(90)90039-s, 1990.
Rudolf-Miklau, F. and Suda, J.: Design Criteria for Torrential Barriers, in: Dating Torrential Processes on Fans and Cones. Advances in Global Change Resource, vol. 47, edited by: Schneuwly-Bollschweiler, M., Stoffel, M., and Rudolf-Miklau, F., Springer, Dordrecht, https://doi.org/10.1007/978-94-007-4336-6_26, 2013.
Ruxton, G. D. and Beauchamp, G.: Time for some a priori thinking about post hoc testing, Behav. Ecol., 19, 690–693, https://doi.org/10.1093/beheco/arn020, 2008.
Sawyer, S.: Analysis of Variance: The Fundamental Concepts, J. Man. Manipul. Ther., 17, 27E–38E, https://doi.org/10.1179/jmt.2009.17.2.27E, 2009.
Steinskog, D. J., Tjøstheim, D. B., and Kvamstø, N. G.: A cautionary note on the use of the Kolmogorov–Simonov test for normality, Mon. Weather Rev., 135, 1151–1157, https://doi.org/10.1175/mwr3326.1, 2007.
Stevenson, K. J.: Review of OriginPro 8.5, J. Am. Chem. Soc., 133, 5621–5621, https://doi.org/10.1021/ja202216h, 2011.
Stoffel, M.: Magnitude–frequency relationships of debris flows – a case study based on field surveys and tree-ring records, Geomorphology, 116, 67–76, https://doi.org/10.1016/j.geomorph.2009.10.009, 2010.
Stoffel, M. and Huggel, C.: Effects of climate change on mass movements in mountain environments, Prog. Phys. Geogr., 36, 421–439, https://doi.org/10.1177/0309133312441010, 2012.
St. Pierre Ostrander, T., Holzner, J., Mazzorana, B., Gorfer, M., Andreoli, A., Comiti, F., and Gems, B.: Confluence morphodynamics in mountain rivers in response to intense tributary bedload input, Earth Surf. Proc. Land., 48, 2277–2298, https://doi.org/10.1002/esp.5613, 2023.
Sturm, M., Gems, B., Keller, F., Mazzorana, B., Fuchs, S., Papathoma-Köhle, M., and Aufleger, M.: Experimental analyses of impact forces on buildings exposed to fluvial hazards, J. Hydrol., 565, 1–13, https://doi.org/10.1016/j.jhydrol.2018.07.070, 2018.
Trevisani, S., Cavalli, M., and Marchi, L.: Reading the bed morphology of a mountain stream: A geomorphometric study on high-resolution topographic data, Hydrol. Earth Syst. Sci., 14, 393–405, https://doi.org/10.5194/hess-14-393-2010, 2010.
Wang, X. K., Wang, X., Lu, W., and Liu, T.: Experimental study on flow behavior at open channel confluences, Front. Struct. Civ. Eng., 1, 211–216, https://doi.org/10.1007/s11709-007-0025-z, 2007.
Welch, B. L.: The generalization of `student's' problem when several different population variances are involved, Biometrika, 34, 28–35, https://doi.org/10.1093/biomet/34.1-2.28, 1947.
White, W. R., R. Bettess, and Paris, E.: Analytical approach to river regime, J. Hydraul. Div. Am. Soc. Civ. Eng., 108, 1179–1193, https://doi.org/10.1061/JYCEAJ.0005914, 1982.
Williams, G. P.: Flume width and water depth effects in sediment-transport experiments – Sediment transport in alluvial channels, USGS Professional Paper, USGS, https://doi.org/10.3133/pp562h, 1970.
Witte, R. S. and Witte, J. S.: Statistics, in: 11th Edn., Wiley and Sons, Hoboken, New Jersey, ISBN 1119386055, 2017.
Wohl, E. E.: Mountain rivers revisited. American Geophysical Union/Geopress, Washington, D.C., ISBN 9780875903231, 2010.
Yang, C. T.: Minimum unit stream power and fluvial hydraulics, J. Hydraul. Div. Am. Soc. Civ. Eng., 102, 919–934, https://doi.org/10.1061/JYCEAJ.0004589, 1976.
Yang, C. T. and Song, C. C. S.: Theory of minimum rate of energy dissipation, J. Hydraul. Div. Am. Soc. Civ. Eng., 105, 769–784, https://doi.org/10.1029/WR017i004p01014, 1979.
Young, W. J. and Warburton, J.: Principles and practice of hydraulic modelling of braided gravel-bed rivers, J. Hydrol. NZ, 35, 175–198, 1996.
Zarn, B.: Lokale Gerinneaufweitung: Eine Massnahmezur Sohlenstabilisierung der Emme bei Utzenstorf (Localriver expansion: A measure to stabilize the bed of Emme River at Utzendorf), VAW Mitteilung 118, edited: Vischerr, D., ETH Zurich, Zurich, https://ethz.ch/content/dam/ethz/special-interest/baug/vaw/vaw-dam/documents/das-institut/mitteilungen/1990-1999/118.pdf (last access: 3 September 2023), 1992.