the Creative Commons Attribution 4.0 License.
the Creative Commons Attribution 4.0 License.
 | 23 Apr 2024
Modeling of indoor 222Rn in data-scarce regions: an interactive dashboard approach for Bogotá, Colombia
Martín Domínguez Durán
María Angélica Sandoval Garzón
Carme Huguet
Radon (222Rn) is a naturally occurring gas that represents a health threat due to its causal relationship with lung cancer. Despite its potential health impacts, several regions have not conducted studies, mainly due to data scarcity and/or economic constraints. This study aims to bridge the baseline information gap by building an interactive dashboard (http://ircmodelingdashboard.eu.pythonanywhere.com/, last access: 17 April 2024) that uses inferential statistical methods to estimate the spatial distribution of indoor radon concentration (IRC) for a target area. We demonstrate the functionality of the dashboard by modeling IRC in the city of Bogotá, Colombia, using 30 in situ measurements. IRC measured was the highest reported in the country, with a geometric mean of 91±14 Bq m−3 and a maximum concentration of 407 Bq m−3. In 57 % of the residences, RC exceeded the WHO's recommendation of 100 Bq m−3. A prediction map for houses registered in Bogotá's cadaster was built in the dashboard by using a log-linear regression model fitted with the in situ measurements, together with meteorological, geologic and building-specific variables. The model showed a cross-validation root mean squared error of 57 Bq m−3. Furthermore, the model showed that the age of the house presented a statistically significant positive association with RC. According to the model, IRC measured in houses built before 1980 presents a statistically significant increase of 72 % compared to IRC of those built after 1980 (p value = 0.045). The prediction map exhibited higher IRC in older buildings most likely related to cracks in the structure that could enhance gas migration in older houses. This study highlights the importance of expanding 222Rn studies in countries with a lack of baseline values and provides a cost-effective alternative that could help deal with the scarcity of IRC data and get a better understanding of place-specific variables that affect IRC spatial distribution.
- Article
(10209 KB) - Full-text XML
- BibTeX
- EndNote


Radon gas (Rn) represents a natural hazard that can have great impact on human health and remains largely unexplored in some regions (World Health Organization, 2019). This noble gas is colorless, odorless, highly radioactive and part of the 238U decay chain (Field, 2015). In 1988, 222Rn was classified as a group-1 carcinogenic agent (IARC, 1988) because it and its decay products (i.e., 218Po and 214Po) emit alpha particles and, at high 222Rn concentrations (i.e., above 100 Bq m−3), these particles can affect the lung's epithelial tissues and lead to the development of lung cancer and other medical conditions (Auvinen et al., 2005; Turner et al., 2012; Field, 2015; Lehrer et al., 2017; Ruano-Ravina et al., 2017). The risk of lung cancer increases 16 % for every 100 Bq m−3 increment in concentrations of residential 222Rn (e.g., Darby et al., 2005). In the 66 countries that have had national 222Rn surveys, it is estimated that 226 057 people die every year from lung cancer due to 222Rn exposure (Gaskin et al., 2018). This type of estimation has prompted some national and international entities to assess levels of residential 222Rn and implement policies to address this public health issue (WHO, 2009).
Despite radon's proven adverse health effects, there remain evident disparities between countries regarding 222Rn policies and monitoring programs. In 2007 an international 222Rn survey was carried out by the World Health Organization (WHO). In it, 32 countries, of which 81 % are part of the Global North, presented their mean values of residential radon (WHO, 2007); 12 years later, the Global Health Observatory showed that the number of countries that have reported their average levels of indoor radon had risen to 44. However, only 22 % of these countries are in the Global South (see Fig. 1a). Furthermore, only 1 out of the 24 countries committed to evaluating indoor radon concentration (IRC) using a national radon database is in the Global South (see Fig. 1b). For multiple countries, especially in Latin America, Africa and Asia, discrete studies, in which mean levels were calculated for one or two cities, were used to report national levels. Nevertheless, as radon presents high spatial variability, this type of discrete study cannot represent an entire country. To address and understand its spatial variability, radon mapping has been employed in previous studies (Cohen et al., 1994; Tollefsen et al., 2011). However, even though efforts have been made in the Global South (Hadad and Mokhtari, 2015; Idriss et al., 2020), these solutions are more prevalent and widespread in countries located in the Global North. This can be associated with the limited dataset availability in the Global South.
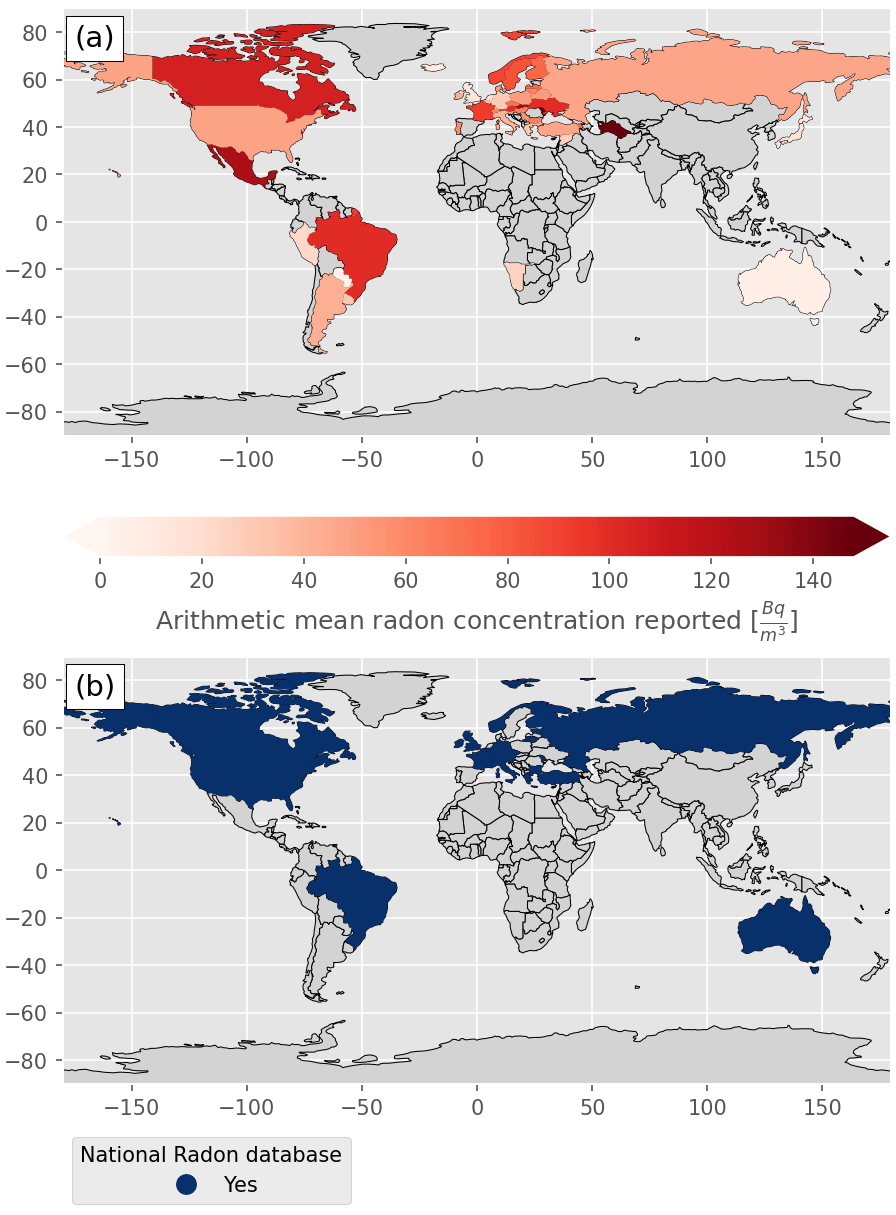
Figure 1Spatial distribution of measurements of indoor radon by country. Countries colored in grey have not reported any radon information. (a) Arithmetic mean values reported per country (Bq m−3). (b) Countries with an existing radon database are colored in blue. Data retrieved from World Health Organization (2019).
In terms of action levels, even though some organizations like the WHO and the United States Environmental Protection Agency (US EPA) recommend IRC to remain under 100 and 148 Bq m−3, respectively, multiple countries still do not have any action level or their levels do not align with the ones recommended (US EPA, 1987; WHO, 2009). In South and Central America, only seven countries have governmental regulations in which action levels are presented. Notably, countries like Argentina or Chile do not have any regulations for indoor radon. Additionally, the action levels in the countries with regulations largely surpass the recommended values (Giraldo-Osorio et al., 2020). For instance, in the case of Colombia, the action level is 400 Bq m−3 and there is no 222Rn monitoring program (Ministerio de Minas y Energía, 2002).
While efforts have been made to assess this public health issue in Latin America and the Caribbean (LAC), IRC remains largely unexplored in the region (Canoba et al., 2002; Giraldo-Osorio et al., 2020). For instance, in Colombia only two studies of residential 222Rn have been conducted so far, both in the urban and rural areas of Manizales with 18 and 202 dwellings measured, respectively (Garzon et al., 2013; Giraldo-Osorio et al., 2021). There is thus a clear lack of baseline information about this carcinogenic gas in the country as well as the LAC region. This lack of baseline information may be a reason why regulations regarding 222Rn are outdated or still missing in the region (Giraldo-Osorio et al., 2020). It is paramount to find innovative ways to bridge this information gap more efficiently. In this study, the potential of dashboards to give place-specific estimates of IRC is presented.
Dashboards are organized information systems whose main objective is to summarize quantitative data in a way that can be easily understood and used by a target audience (Nijkamp and Kourtit, 2022). In public health, dashboards may guide agency decisions on resource allocation (Dasgupta and Kapadia, 2022). The dashboard created in this study aims to understand the variables that can affect the radon distribution for a specific place, provide summarized IRC information for place-specific policy and decision-making, guide the direction in which further studies should be made, and be a potential tool to estimate the IRC distribution in cities where IRC measurements are scarce. To the best of the authors' knowledge this is the first dashboard developed for performing radon modeling.
The high spatial variability of radon is well known and has been associated with three main types of variables that could act as predictors of IRC: meteorological, geologic and building-specific variables (e.g., Gundersen et al., 1993; Karpińska et al., 2009; Mullerova et al., 2017). These variables can either increase or decrease levels of residential IRC, and their influence depends greatly on the location. For example, a city's IRC might be highly dependent on building-specific variables, while another city's IRC might be more influenced by geologic variables. Understanding the factors associated with IRC distribution in a city is crucial to assessing the magnitude of a possible public health hazard.
Several models have previously been used to estimate radon concentrations in residences (Demoury et al., 2013; Elío et al., 2017; Vienneau et al., 2021). These models can be either mechanistic or statistical. Some advantages of statistical models are that they quantify the relationship between variables and that they allow the inclusion of different types of variables, even if the underlying association between them is not yet well understood. On the other hand, mechanistic models are based on the understanding of the physical mechanisms that control a phenomenon. For instance, in the case of indoor air quality, mechanistic models are made to understand the mechanisms governing the transport of the pollutant (Wei et al., 2019). The dashboard designed in this study uses a log-linear regression model to recognize the most influential variables and estimate IRC by using these variables as predictors. Unlike similar studies employing various prediction strategies (Demoury et al., 2013; Elío et al., 2017; Vienneau et al., 2021), the dashboard presented in this study distinguishes itself by seamlessly combining statistical models with a user-friendly interface. This integration enhances usability without extensive technical expertise, marking a significant advancement in the accessibility and applicability of radon concentration estimation tools.
Even though Bogotá's geologic, climatic and construction characteristics could facilitate high IRC, no baseline studies have been conducted in the city. This makes Bogotá an ideal place to evaluate the performance of the dashboard in estimating the IRC spatial distribution in a data-scarce region through statistical learning.
The structure of this paper is as follows. The methodology is presented in Sect. 2, where the study area and the data acquisition are presented first (Sect. 2.1) and then the statistical analysis and the dashboard architecture are explained in Sect. 2.2. Next, the results for the city of Bogotá are presented and discussed in Sect. 3. First, the levels of indoor radon detected in situ are presented in Sect. 3.1. Then, in Sect. 3.2 and 3.3 the results of the modeling dashboard are discussed in terms of the potential influential factors for high IRC and the potential hazard posed by 222Rn in Bogotá. Next, the dashboard's functionality was assessed in Sect. 3.4.
2.1 Study area and data acquisition
2.1.1 Study area
Bogotá is located at the western side of the eastern Andes cordillera at an average altitude of 2640 m a.s.l. (above sea level) (Fig. 2). The urban area of Bogotá is divided in 20 localities, 5 of which were included in the present study (Fig. 2; Departamento Administrativo Nacional de Estadística, 2018b). Bogotá's temperature ranges between 8 and 19 °C throughout the year, with an annual average value of 13 °C. It has an average precipitation of 80 mm per month throughout the year with a minimum of around 40 mm in January and a maximum of around 120 mm in May (IDEAM, 2015). The geology of the Bogotá region is characterized by outcrops from the late Cretaceous to the Quaternary (Montoya and Reyes, 2007). According to the Geologic Map of Colombia (Gómez Tapias et al., 2015) the main lithologies in Bogotá with their respective chronostratigraphic codes are limestones and shales (k1k6-Stm) near the municipality of La Calera, alluvial fans and colluvial deposits (Q-ca) to the east of the city, and clays (Q1-l) in the central area of Bogotá (see Fig. B1). Additionally, due to an excessive extraction of water from underlying aquifers, there is strong subsidence in the city, reaching values of 3.5 cm yr−1 (Mora-Paez et al., 2020). Furthermore, Bogotá's rapid growth in the first half of the 20th century resulted in nearly 35 % of the houses in the city being built over 40 years ago (Departamento Administrativo Nacional de Estadística, 2018a).
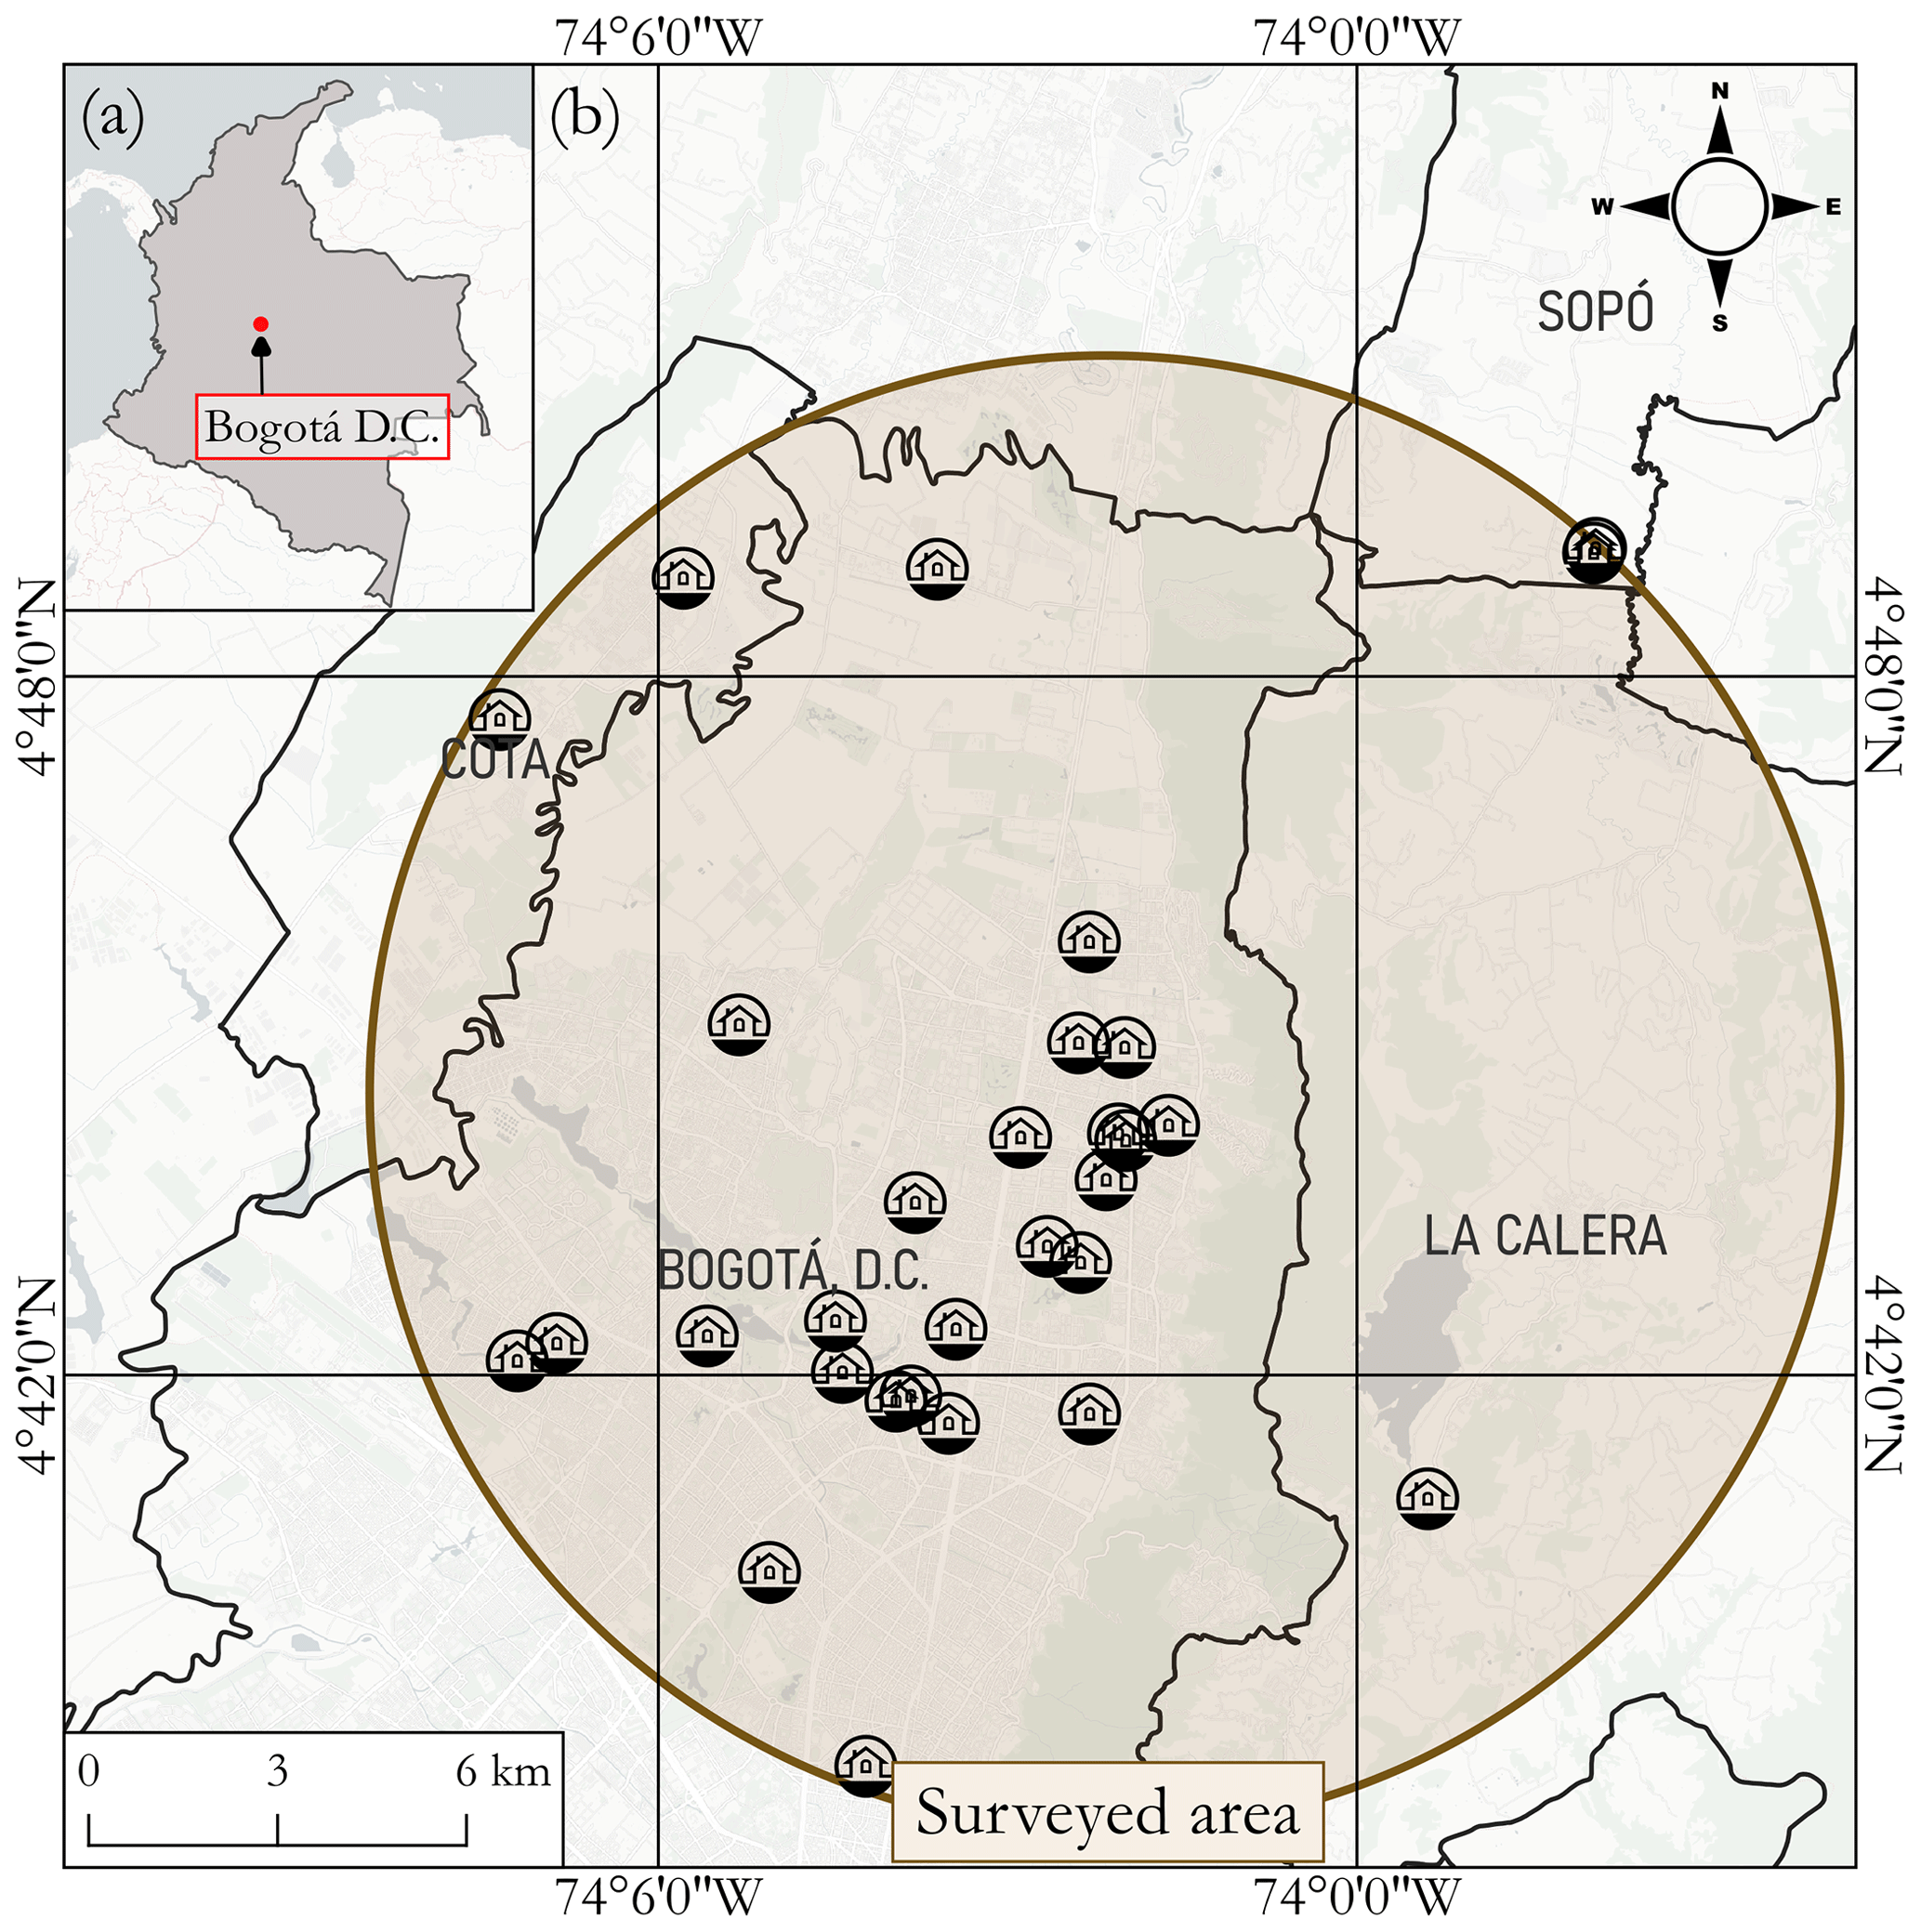
Figure 2Map of the study area. (a) General map of Colombia with the study area marked in red. (b) Detailed map of the surveyed area with the 30 dwellings where measurements were made. Bogotá, D.C: Bogotá, Distrito Capital. Basemap source: © OpenStreetMap contributors, the GIS User Community and Departamento Administrativo Nacional de Estadística (2018b).
2.1.2 222Rn sampling
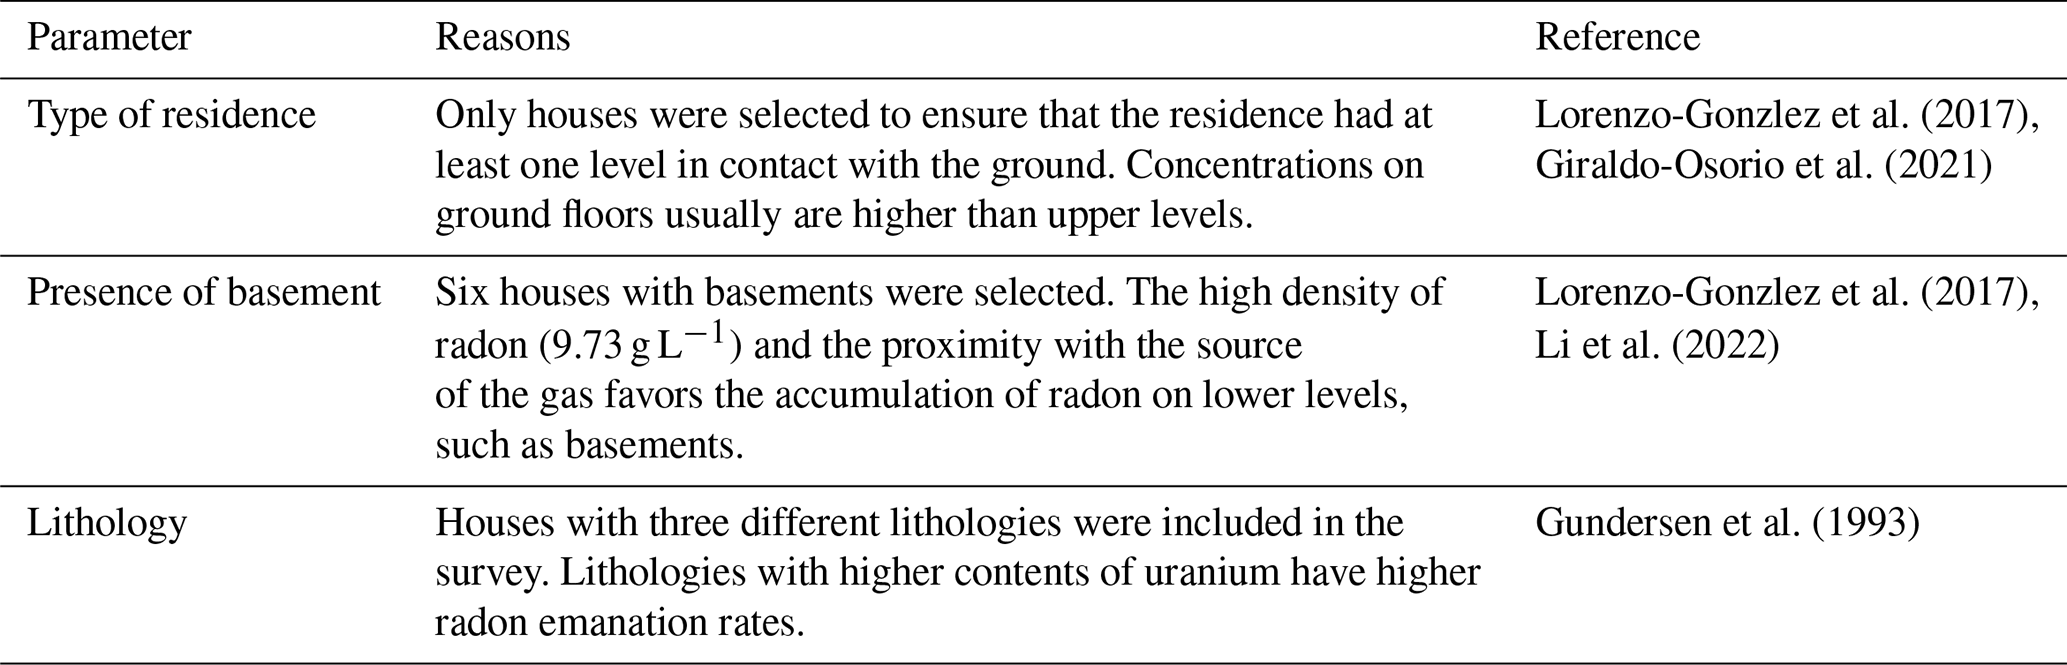
Since this study was performed during the COVID-19 pandemic, an online registration form was sent via social media and filled out by 79 owners of residences who wanted to participate. Based on previous studies the selection criteria to determine which dwellings would be sampled were the type of residence (house or apartment), the presence of a basement (Lorenzo-Gonzlez et al., 2017; Giraldo-Osorio et al., 2021; Li et al., 2022) and the lithology below the dwelling (Gundersen et al., 1993; Salazar et al., 2004; Maestre and Iribarren, 2018). The influence of these factors on IRC is presented in Table 1. The selection of houses was also made to ensure that indoor measurements in the five localities surveyed would have a minimum sampling rate of one sample every 15 km2.
Lorenzo-Gonzlez et al. (2017)Giraldo-Osorio et al. (2021)Lorenzo-Gonzlez et al. (2017)Li et al. (2022)Gundersen et al. (1993)Table 1Criteria considered to select the studied residences based on factors reported to enhance indoor radon concentrations (Gundersen et al., 1993; Giraldo-Osorio et al., 2021; Li et al., 2022).
Several methods for measuring radon currently exist; however, the most economic and widely used is the alpha-track detectors (e.g., Field, 2015). In this study, Kodak LR-115 alpha-track detectors were placed in the selected houses for a period of 35 d between 20 February and 28 March 2021. The detectors were supplied by the Applied Nuclear Physics and Simulation (FINUAS) laboratory, and the diffusion chambers were assembled as shown in Fig. 3.
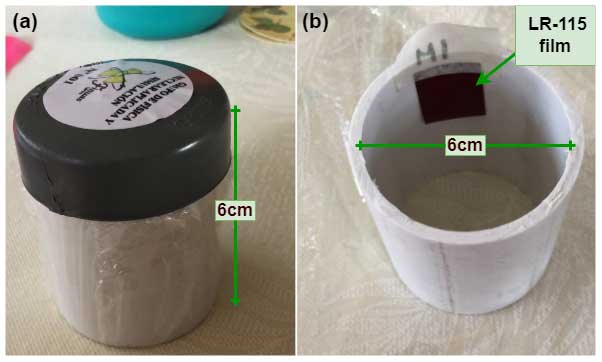
Figure 3Images showing the diffusion chambers used to detect radon. (a) Outside of the diffusion chamber (assembled). (b) Inside of the chamber with the location of the LR-115 film.
The LR-115 film was placed in the upper part of the diffusion chamber as described by Nikolaev and Ilić (1999) (see Fig. 3b). The dimensions of the diffusion chamber were selected to ensure that the conversion factor (1.4 tracks cm−2 (kBq m−3 h)−1) used by Faisca et al. (1992) could be applied. This conversion factor has been used with LR-115 film and validated against active methods (see Rojas-Arias et al., 2020, for details).
The alpha-track detectors were placed at a height of 60–180 cm above the ground; at a minimum distance of 15 cm from the walls; and away from doors, windows and electronic devices to avoid environmental interference that may induce larger measurement errors (Lorenzo-Gonzlez et al., 2017). Additionally, a thin film of polyethylene was added to the lower part of the chamber to avoid humidity and/or dust. Once installed, residents of the dwellings sent pictures of the sensors on a weekly basis so that any changes in the location and/or conditions of the detector could be recorded.
After the 35 d exposure, the detectors were retrieved and shipped to the FINUAS lab in Tunja, Colombia, where they were analyzed. The analysis consisted of etching the LR-115 film with the process described by Rojas-Arias et al. (2020). The alpha-track density (ρtr) was then determined by counting the number of etched tracks per square centimeter under the microscope. Afterwards, IRC was calculated using the conversion factor determined by Faisca et al. (1992) as described in Eq. (1).
where ρtr represents the density of alpha tracks (tracks per square centimeter), t is the time exposed (h) and the conversion factor (CF = (1.4 tracks cm−2 (kBq m−3 h)−1) is the same determined by Faisca et al. (1992).
To evaluate the precision of the detectors, duplicate LR-115 film was included in 11 of the diffusion chambers selected randomly and placed in front of the other film inside the diffusion chamber. The relative percent difference (RPD) was calculated as suggested by WHO (2009) (see Eq. 2).
2.1.3 Data acquisition of independent variables and pre-processing
The predictor variables for fitting the regression model, which include geologic, meteorological and building-specific factors, were acquired from multiple sources. These sources included an online form completed by the participants and six other distinct data sources listed in Table A1. The spatial distribution of the meteorological and geologic variables can be found in Appendix B in the additional images.
The regression model used three dummy variables which included the house age and two variables related to the lithology. For the variables explaining the lithologies in the area, the reference category was selected to be the lithology characterized by clays (Q1-l). Furthermore, the houses built after 1980 were chosen as the reference category for the house age variable.
Finally, the dataset to which the regression model was applied was retrieved from Bogotá's cadaster dataset. A subset of the dataset was selected while making sure that the residences followed two criteria: (i) buildings with less than three stories (houses) and (ii) buildings where one of the three studied lithologies, analyzed in the statistical analysis, was present. The data of the predictor variables were finally added to each house in this dataset.
The result of the pre-processing resulted in two tabular datasets that from now on will be called the in situ dataset and cadaster dataset for simplicity. In the first one, the data consisted of the in situ measurements and the predictor variables. On the other hand, the second one contains the spatial and predictor information of the houses in the cadaster to which the regression model was applied.
2.2 Dashboard for modeling of indoor Rn
Once data for both the radon measurements and the predictors have been gathered, the IRC can be modeled by using the dashboard (http://ircmodelingdashboard.eu.pythonanywhere.com/, last access: 17 April 2024) created in this study. In the following section, both the underlying statistical analysis and the dashboard architecture are presented.
2.2.1 Statistical analysis
The statistical analysis consisted of (i) fitting a log-linear regression model to the dataset with in situ measurements, (ii) evaluating the performance using cross-validation, (iii) undergoing a process of feature selection, (iv) fitting a final log-linear regression model, (v) estimating the radon concentration using the final model and (vi) visualizing the IRC estimations spatially (Fig. 4).
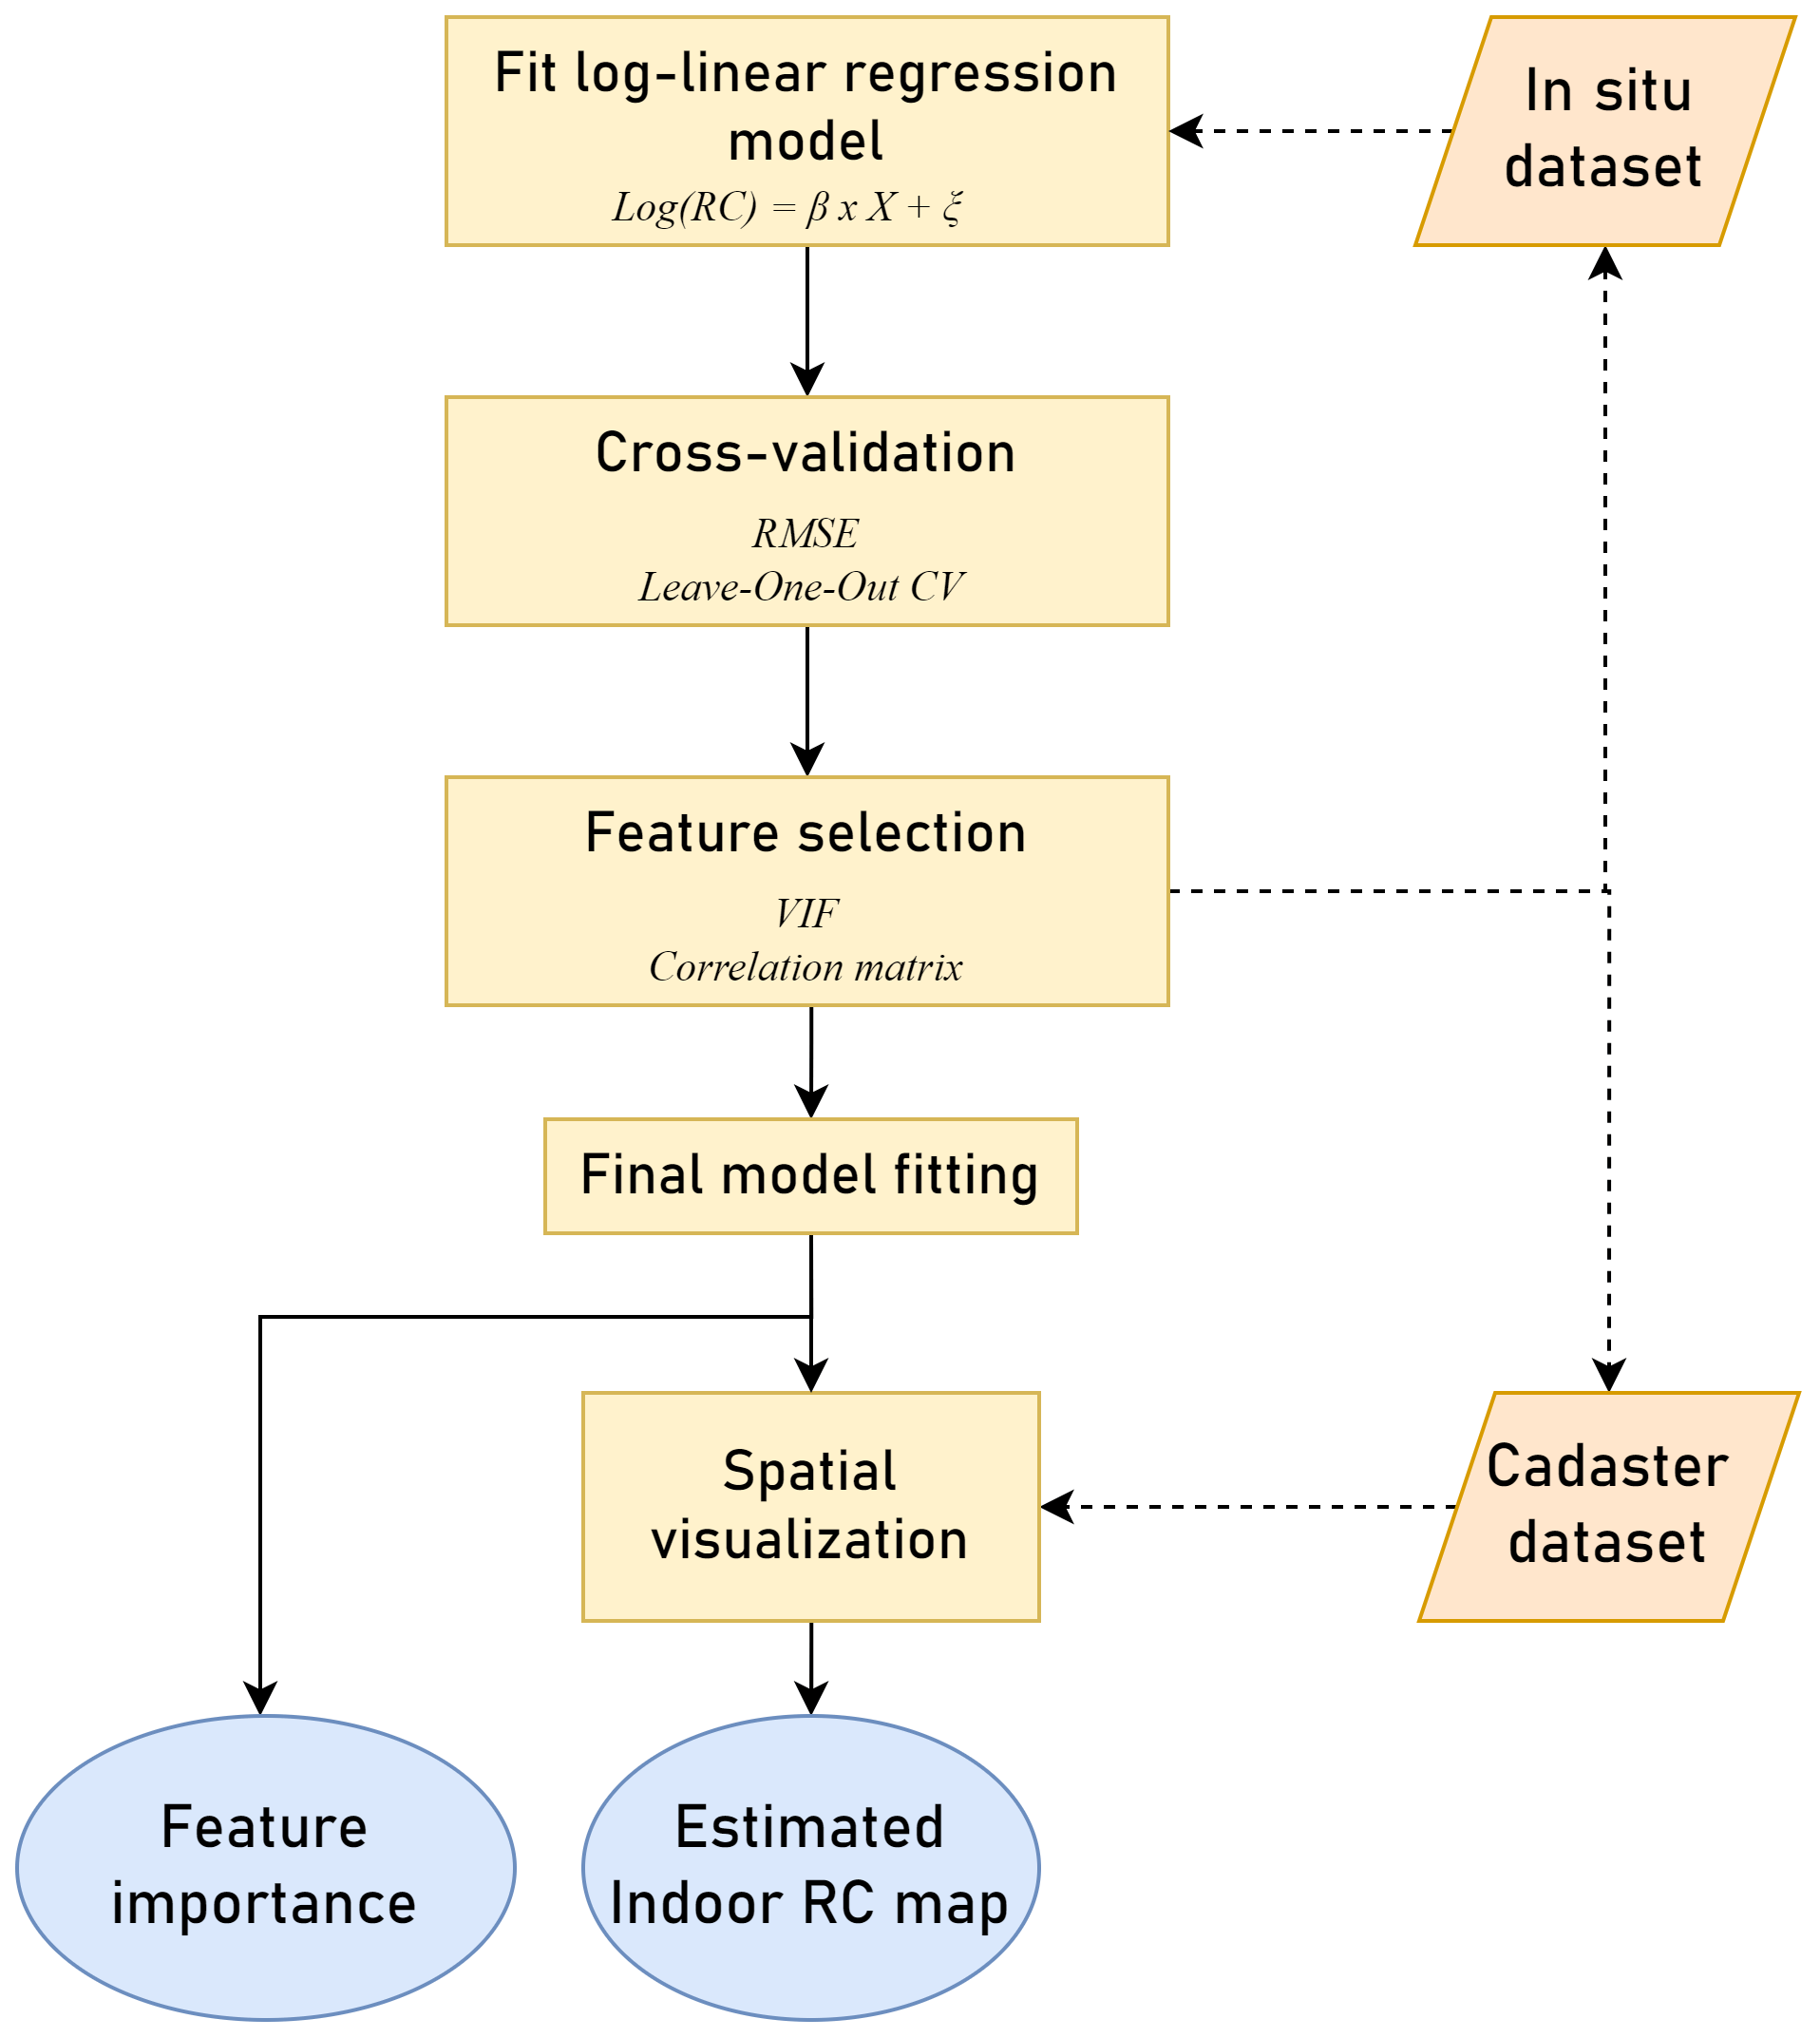
Figure 4Flowchart of the statistical analysis performed using Python 3.11. Yellow represents processes executed for the statistical analysis. Blue represents outputs of the analysis. Orange represents input datasets: the in situ dataset is composed of the in situ IRC measurements and the predictor variables. The cadaster dataset contains the spatial and predictor information of the houses in the cadaster to which the regression model was applied. CV: cross-validation, VIF: variance inflation factor.
Regression analysis
A log-linear multivariate regression model was used to establish the association between one dependent variable (log (IRC)) and five independent variables. The model included geologic, meteorological and construction variables. Similar approaches have been used to estimate IRC in other study areas (Demoury et al., 2013; Vienneau et al., 2021; Alber et al., 2023). The log-linear regression model was fitted with Eq. (3). Every independent variable in the log-linear model can be interpreted by finding a percentage change in IRC due to an increase of that independent variable by a unit. This percentage change can be calculated for each variable as described in Eq. (4). The statistical analysis was performed using the statsmodels and scikit-learn packages in Python 3.11.
where β represents a vector with coefficients for each independent variable, X is a matrix with the values of the independent variables and ξ is the error.
Cross-validation
The performance of the regression model was assessed using the leave-one-out cross-validation approach. This cross-validation method gives an estimation of the test error that is approximately unbiased (Hastie et al., 2021). To measure the error of the model, the root mean squared error (RMSE) was used as described in Eq. (5).
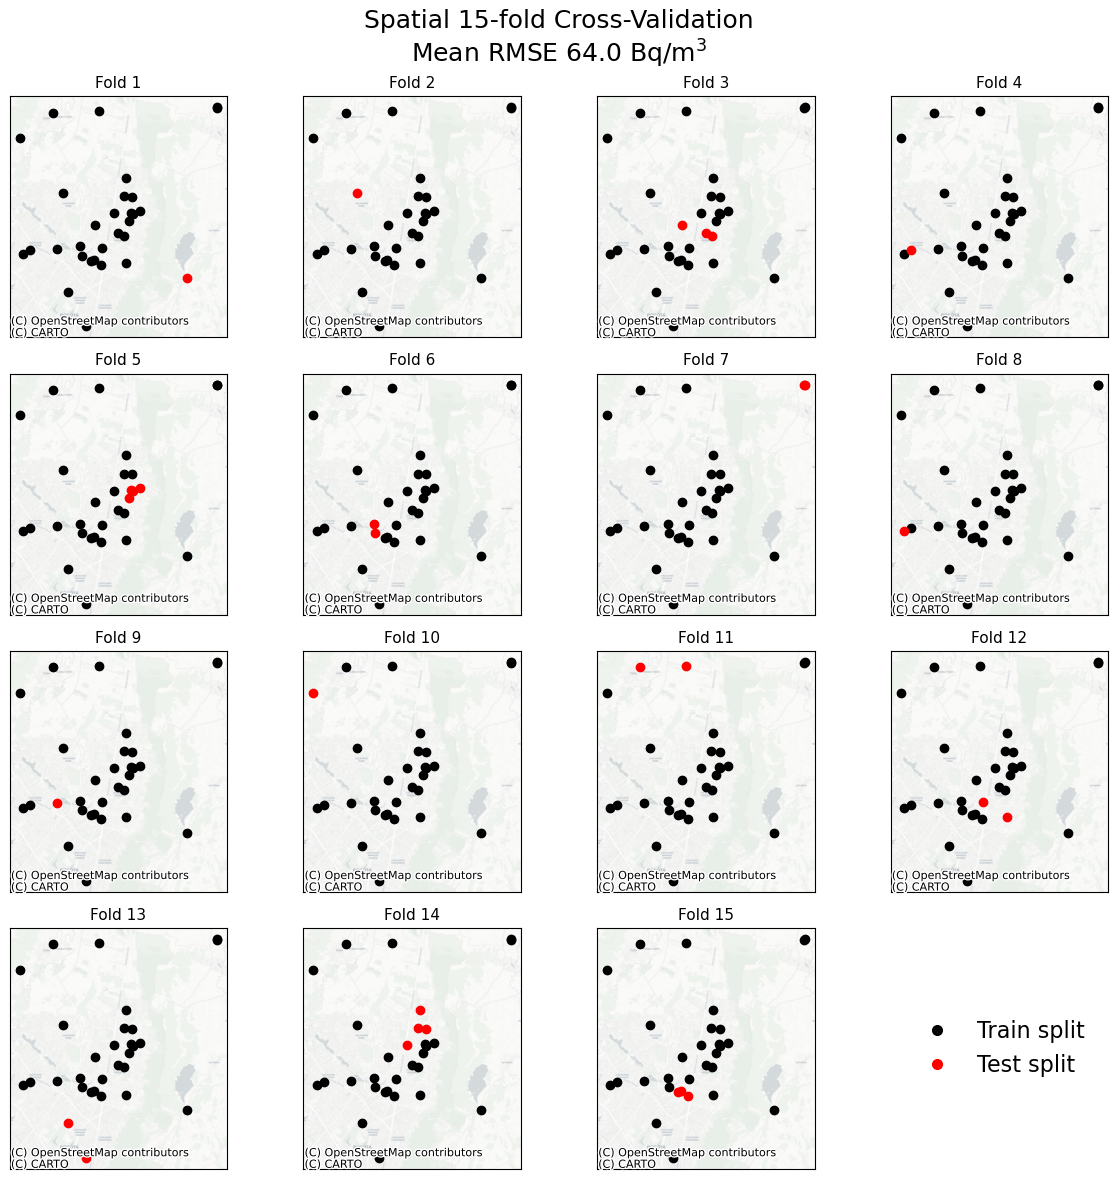
In addition to the leave-one-out cross-validation, the Python package spacv (https://github.com/SamComber/spacv, last access: 17 April 2024) was used to perform a 15-fold spatial cross-validation to further validate the robustness and generalization capabilities of the regression model's predictions (Comber, 2024). Spatial cross-validation accounts for potential spatial auto-correlations in the data, providing a more comprehensive assessment of the model's performance across diverse spatial contexts (Beigaitė et al., 2022).
Feature selection
Originally, the log-linear model included four more variables that we considered could have an association with high IRC (fault proximity, temperature, urban/rural area and land subsidence). Nevertheless, they were later removed to reduce the chance of overfitting and increase the model performance by focusing on the most informative features. According to their high variance inflation factor, the variables of land subsidence, temperature and urban/rural area introduced multicollinearity problems into the model; therefore they were discarded. Moreover, since fault proximity values in houses of Bogotá are above the 150 m threshold that previous authors have shown to have a significant association with higher IRC in dwellings, this variable was not considered in the present study (Drolet and Martel, 2016). Removing these features did not substantially affect the cross-validation estimation of the test error.
Final model fitting
The fitting of the final model was finally done with the selected features. The final log-linear regression model followed Eq. (3) and was trained using the statsmodels and scikit-learn packages in Python 3.11.
Spatial visualization
The log-linear multivariate regression model fitted with the in situ dataset was used to produce a map of estimated IRC with the cadaster dataset. The IRC estimated for the houses was then aggregated in a grid of cells of 100 m × 100 m. The grid was created and then visualized using the GeoPandas and Plotly packages in Python 3.11.
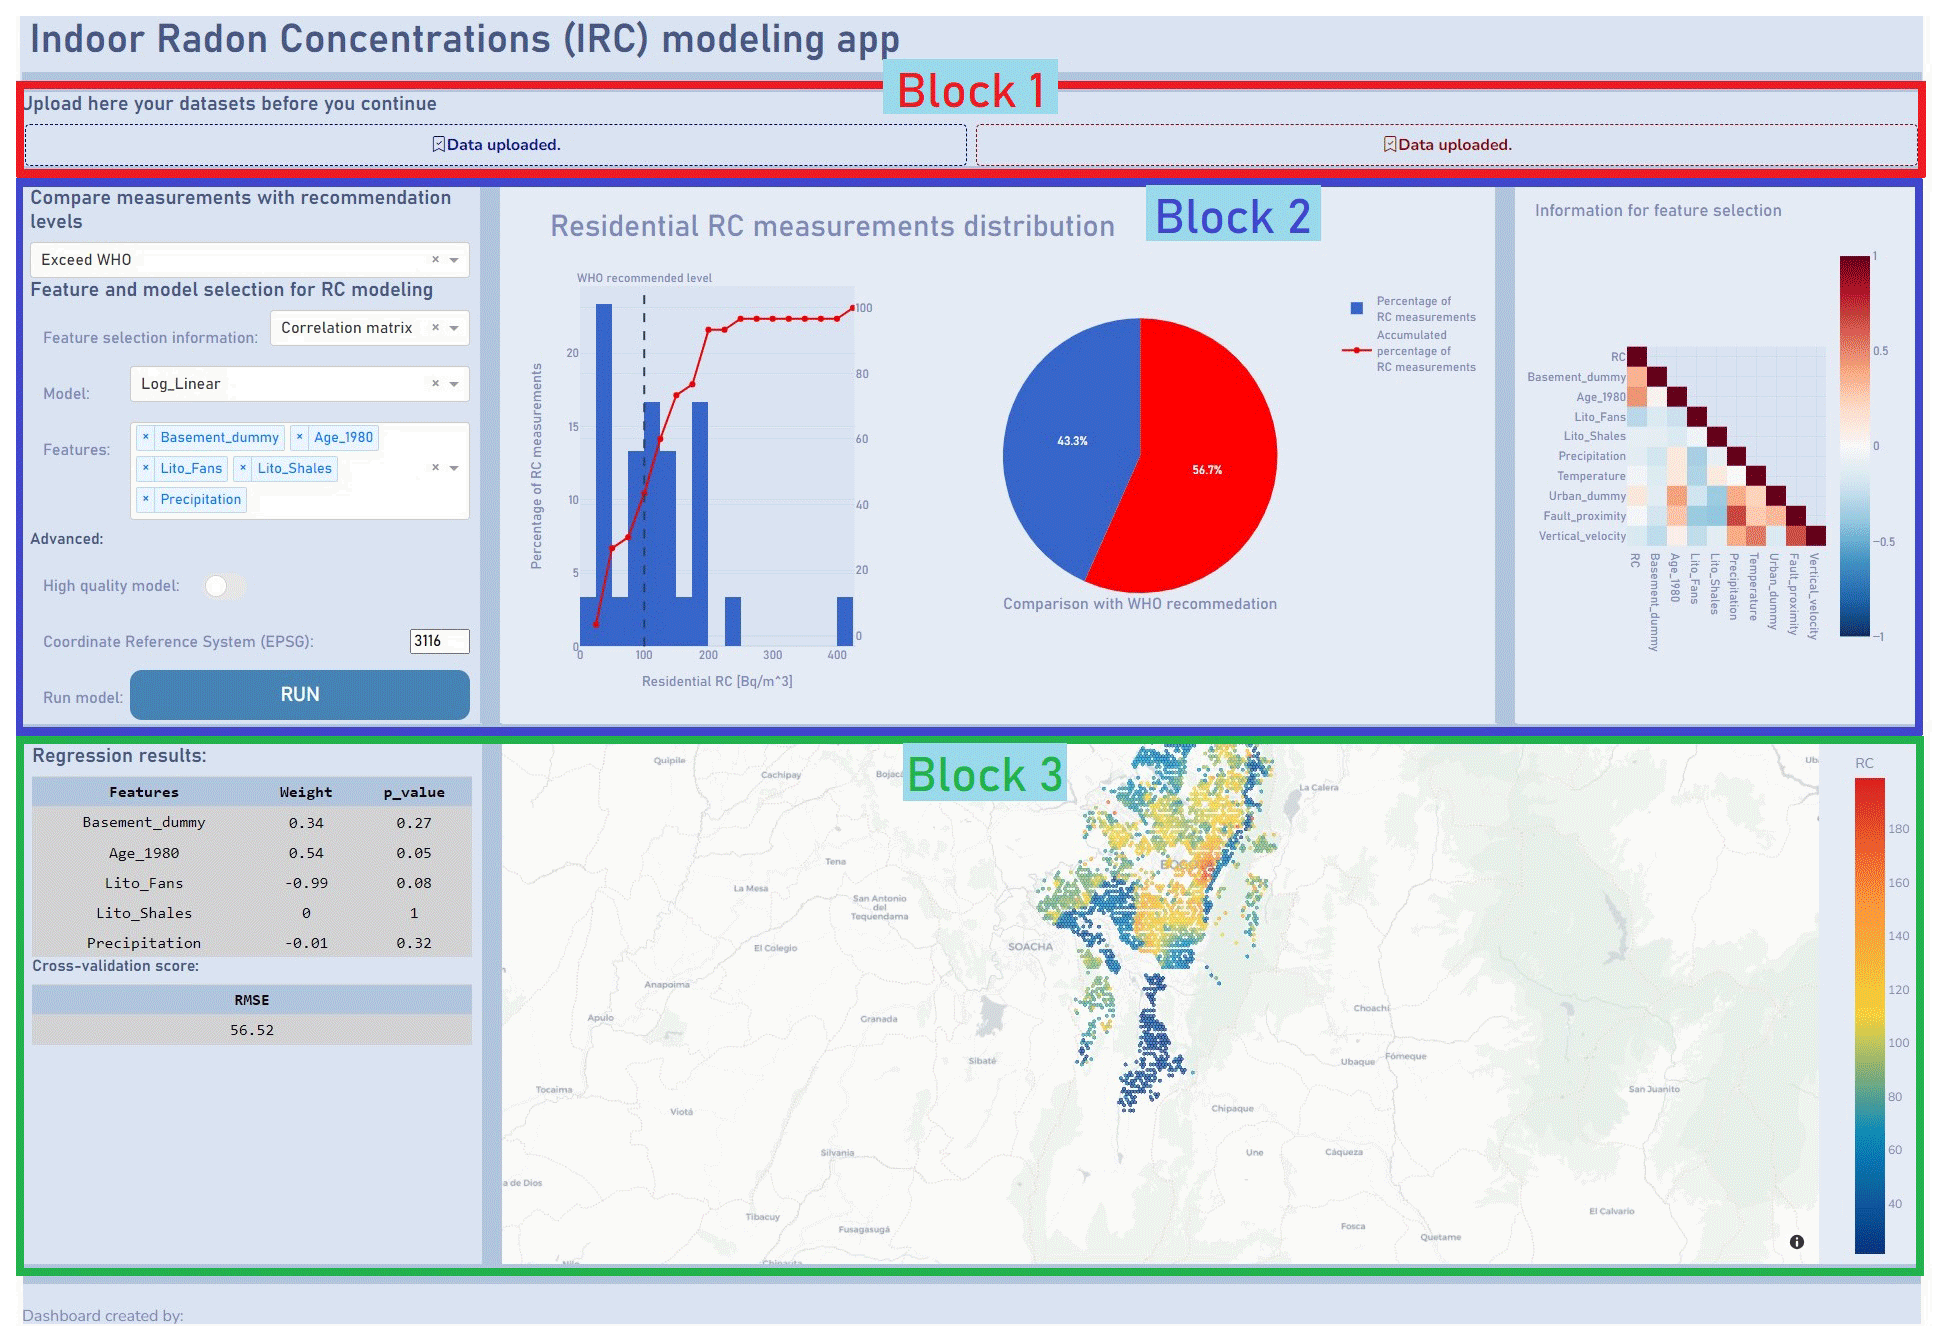
Figure 5Overview of the layout of the dashboard developed for the modeling of indoor radon concentration. The three blocks that make up the dashboard are highlighted in red (1), blue (2) and green (3). Block 1 is the data-uploading block, where the user can upload both datasets used for modeling (the in situ measurements and the cadaster dataset). Block 2 presents visualizations of the in situ data and allows the user to choose the parameters and run the model. In this block the IRC distribution can be observed and some statistics from the in situ dataset can be obtained (i.e., the percentage of measurements exceeding reference levels and correlations between covariates). Block 3 is the result block, where in the left panel the feature importance can be observed and in the right panel the prediction map is presented. The dashboard can be accessed at https://ircmodelingdashboard.eu.pythonanywhere.com/ (last access: 17 April 2024).
2.2.2 Dashboard design
A dashboard web application that allows for the modeling and spatial visualization of estimated IRC by using in situ measurements was developed. The dashboard layout consists of three main blocks that are shown in Fig. 5. In the first block, the user is expected to add the two sets of tabular data (previously called the in situ and cadaster dataset). Then, the second block allows the user to explore the in situ data, choose the parameters for the modeling and run the model (left section of block 2 in Fig. 5). The visualizations in this block show the distribution of IRC measured with respect to reference levels, a correlation matrix of the predictors in the in situ dataset and the variance inflation factor for the predicted variables (right section of block 2 in Fig. 5). Furthermore, the parameters that can be chosen by the user are the type of model to be fitted, features selected to train the model, a high-quality model to get a higher-spatial-resolution result and the projected coordinate reference system in which the cadaster data are projected. Finally, the third block exhibits the results of the model. On the left side the feature importance and the cross-validation scores are presented, and on the right side the spatial distribution modeled is presented in an interactive map.
The dashboard web application was built and deployed using the Dash package in Python 3.11 and the servers of pythonanywhere.com (https://eu.pythonanywhere.com/, last access: 17 April 2024). Furthermore, the dashboard can be accessed at http://ircmodelingdashboard.eu.pythonanywhere.com/ (last access: 17 April 2024).
3.1 Levels of indoor radon
The measured radon concentrations in the 30 dwellings selected ranged between 15 and 407±10 Bq m−3, with a geometric mean of 91 Bq m−3 (Fig. 6a). The result of the 11 duplicates was a relative percent difference (RPD) of 14 %, which falls within the typical uncertainty (10 %–25 %) reported for alpha-track detectors (WHO, 2009).
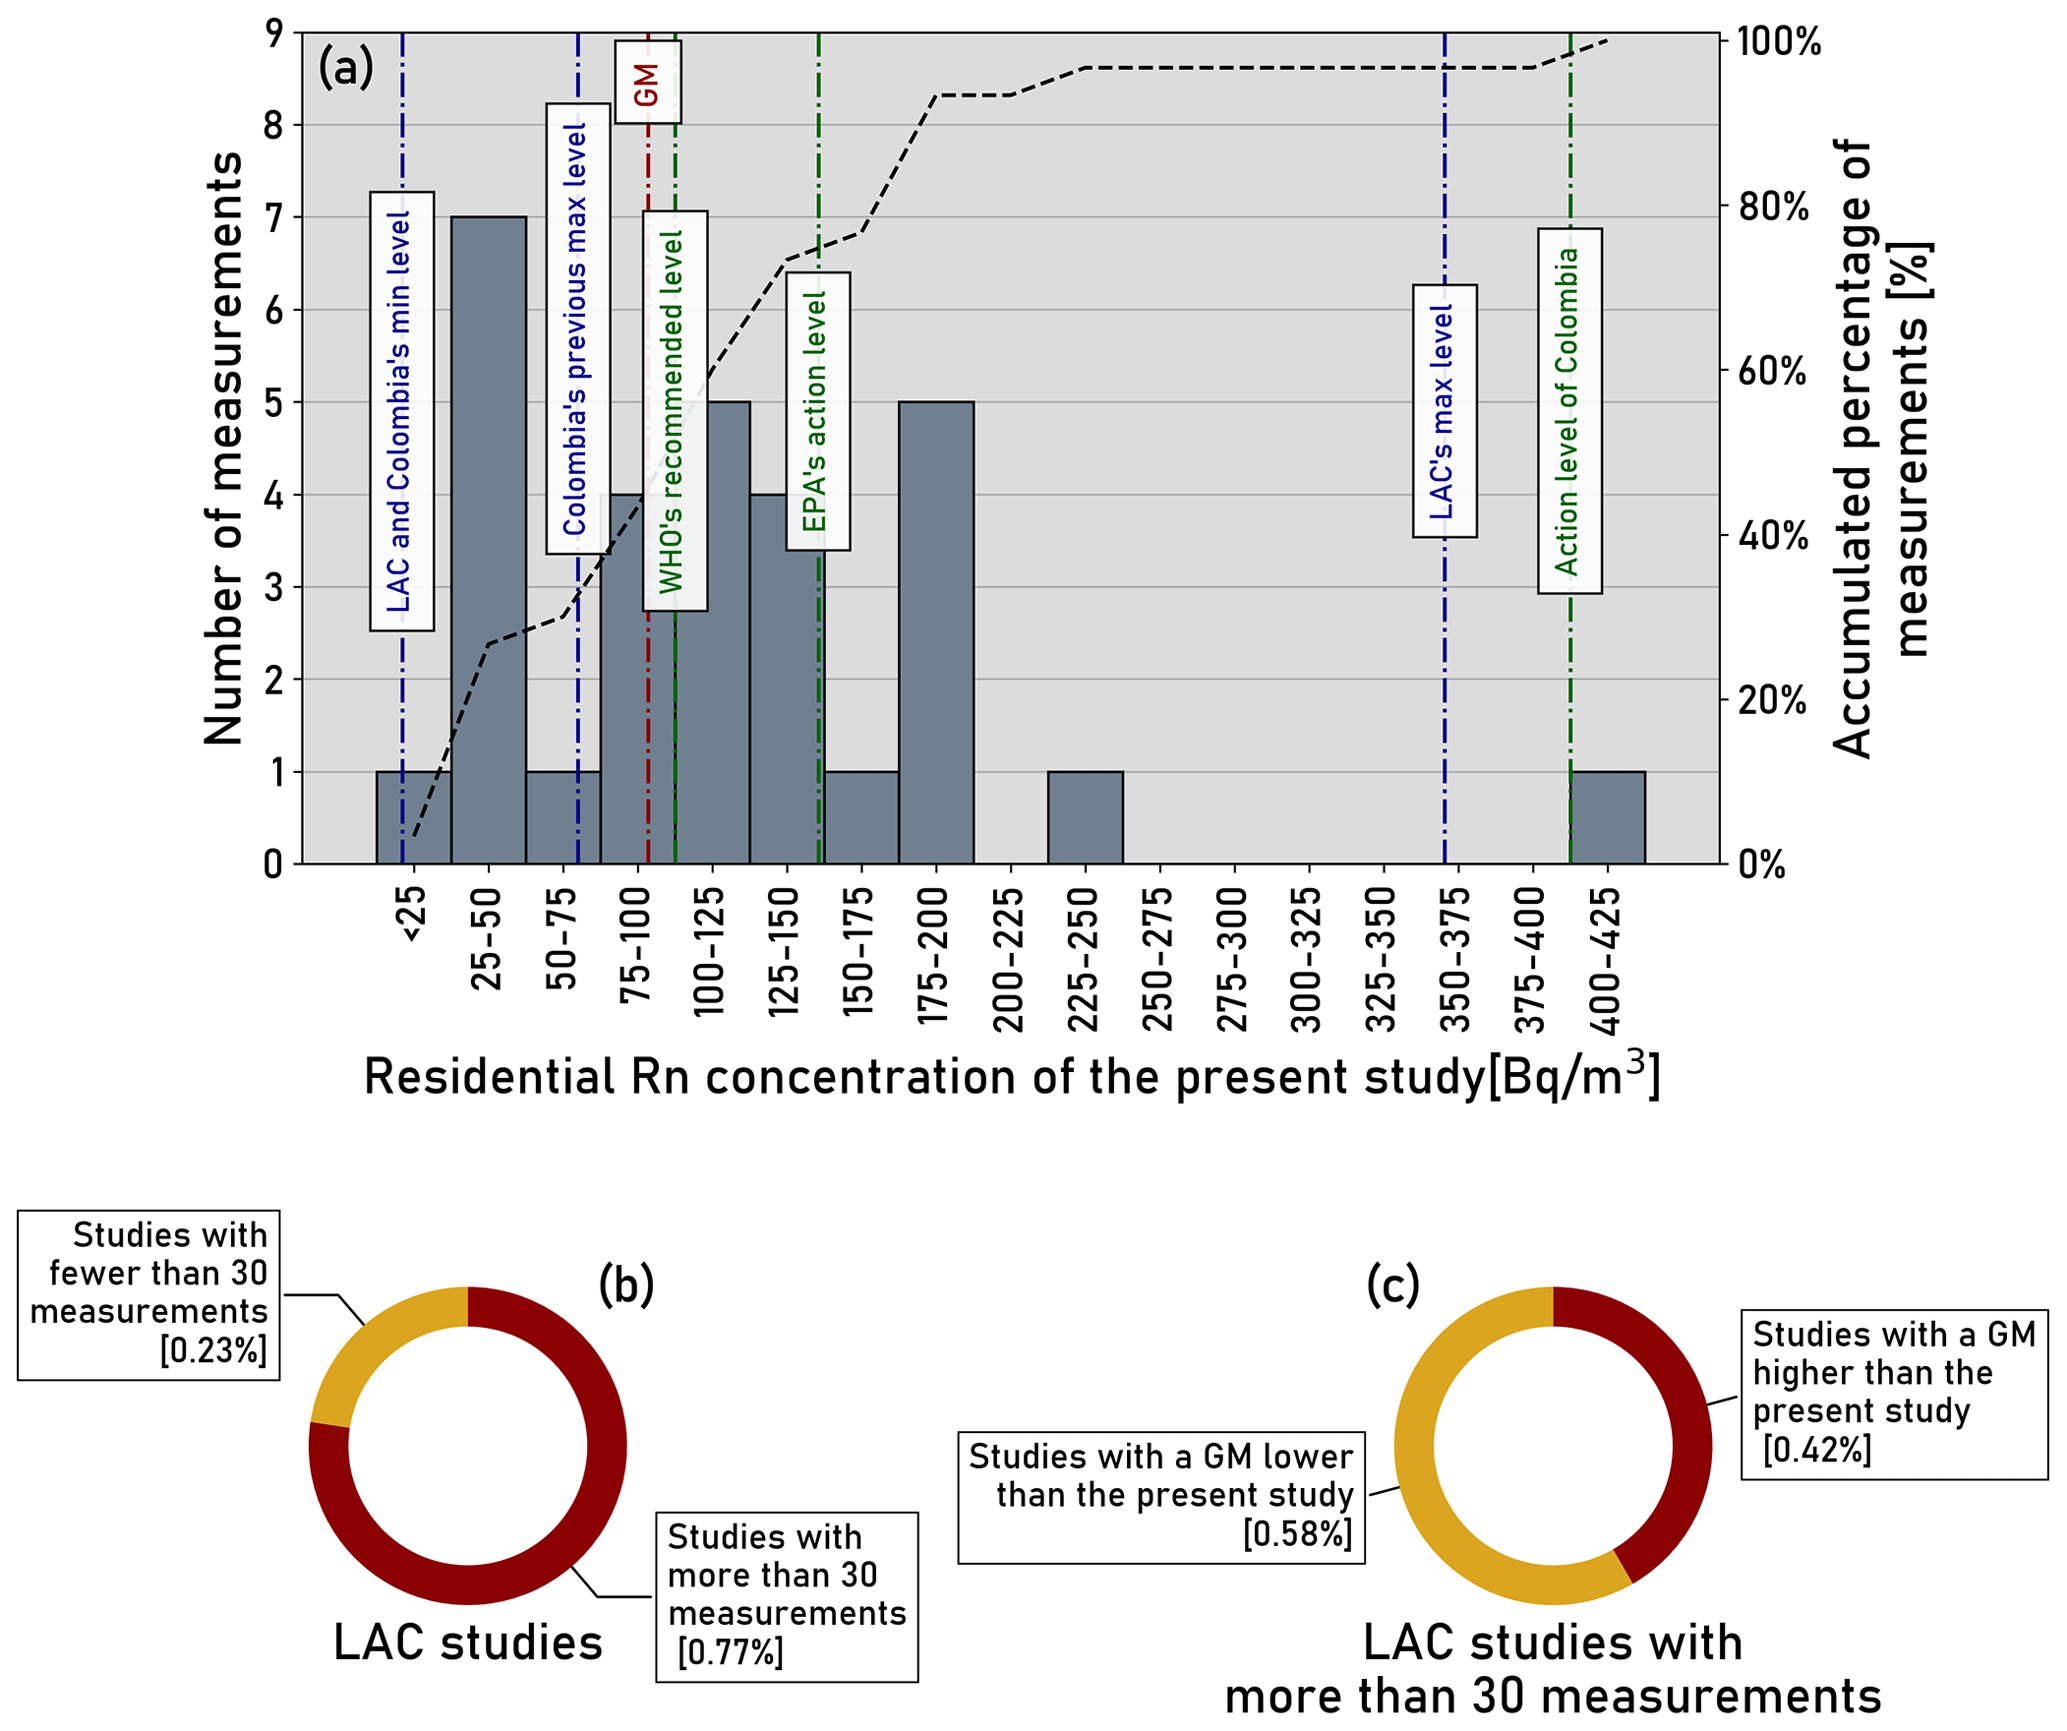
Figure 6(a) Measured radon concentrations shown as a histogram of measured IRC in the Bogotá region within the context of Colombia and Latin America and the Caribbean (LAC). The geometric mean (GM) is indicated by the dashed red line. The dashed black line represents the accumulated percentage of samples. Dashed green lines represent reference levels, and dashed blue lines show the minimum and maximum average values reported in studies in Colombia and the LAC region. (b) Ratio of studies made in the LAC region with more or less than 30 measurements. (c) Ratio of studies with more than 30 measurements that have a greater or lower geometric mean than the one obtained in the current study. Information retrieved from Table 1 in Giraldo-Osorio et al. (2020).
3.1.1 Reported radon levels in the LAC region and reference levels
The study of residential 222Rn in Latin America and the Caribbean (LAC) remains largely unexplored (Giraldo-Osorio et al., 2020). This was the third study of indoor 222Rn conducted in Colombia and had the second largest number of observations (Giraldo-Osorio et al., 2020). Both previous studies were conducted in Manizales and presented a mean IRC of 8.5 and 68 Bq m−3 (Giraldo-Osorio et al., 2021). Our study presents the highest levels found in the country. The higher levels found in Bogotá with respect to Manizales could be explained by a smaller ventilation rate, related with a lower frequency of window and door opening, caused by lower mean temperatures (Chao et al., 1997). Additionally, the exclusive measurement in ground floors and basements in our study could also explain the high IRC levels measured (Lorenzo-Gonzlez et al., 2017; Li et al., 2022). The proximity of these areas to radon sources contributes to the higher accumulation of 222Rn in these spaces (Field, 2015).
The mean values reported in the 31 previous studies done in the LAC region ranged between 9 and 358 Bq m−3 (Fig. 6a). The IRC measured in this study is in the upper range of the reported levels for the LAC region. Until 2020, it was reported that 24 out of the 31 studies had measured IRC in more than 30 residences (Giraldo-Osorio et al., 2020, Fig. 6b). The geometric mean IRC of the current study exceeds the geometric mean of 58 % of these 24 studies (Giraldo-Osorio et al., 2020, Fig. 6c). This corroborates the high IRC measured in Bogotá compared to the values reported in the region.
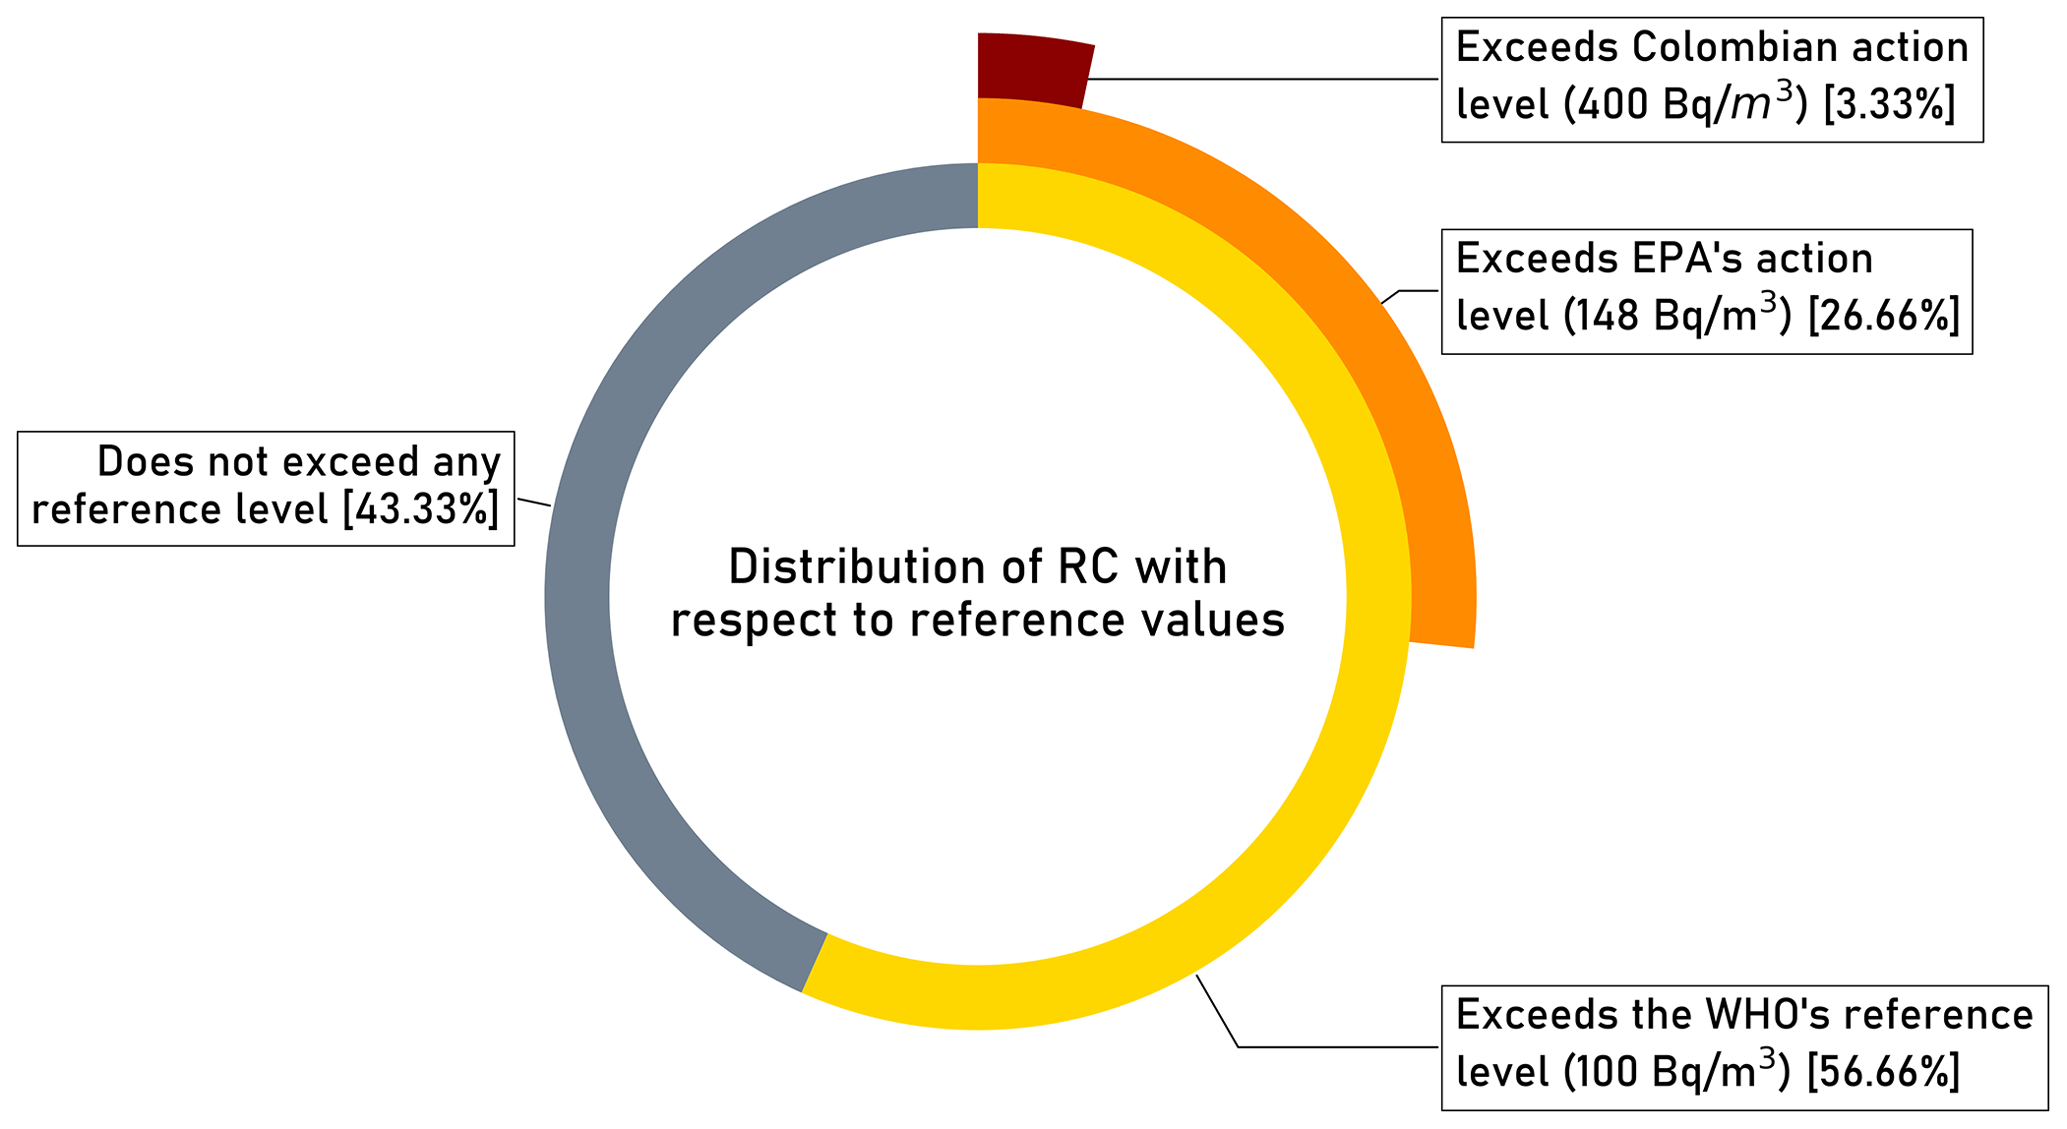
The WHO's recommended level (100 Bq m−3) was exceeded in 57 % of the residences analyzed in this study (Fig. 7). Even though the Colombian action level (400 Bq m−3) was exceeded only in one house (Fig. 7), there is enough scientific evidence to assert that the exposure to IRC, even below the WHO's recommended level, can affect human health (WHO, 2009). Therefore, high IRC levels such as the ones found in this study raise concerns about the potential health impacts that 222Rn could be causing in Bogotá's population.
3.2 Potential influential factors on IRC in the surveyed area
The statistical analysis performed considered five independent geologic, meteorological and construction variables. The results of feature importance derived from the dashboard are presented in Table 2. Moreover, the log-linear regression model presented a leave-one-out cross-validation RMSE of 57 Bq m−3 and a 15-fold spatial cross-validation of 64 Bq m−3 (Fig. D1). The observed high RMSE can be attributed to the limited size of the dataset used for model training. It is anticipated that augmenting the dataset with additional IRC measurements would likely enhance the model's performance. However, it is essential to acknowledge that a significant prediction uncertainty persists in radon modeling, which originates from imperfect environmental predictors and the absence of additional crucial information such as ventilation intensity, building materials and the air tightness of buildings (Petermann et al., 2021). Even though the estimated error is higher than the ones reported in previous studies, the log-linear model found significant associations with predictors that could explain high IRC values in the city (Vienneau et al., 2021). The inferential capability of the dashboard could therefore be used to focus future research and/or policy in high-priority areas.
Table 2Mean radon concentrations () and results of the statistical analysis for each independent variable used as predictor. Results for the log-linear regression model (β and eβ) are presented with a significance level represented by the p value. n represents the number of samples with that possible value. Values denoted in bold represent the reference value for each categorical variable.
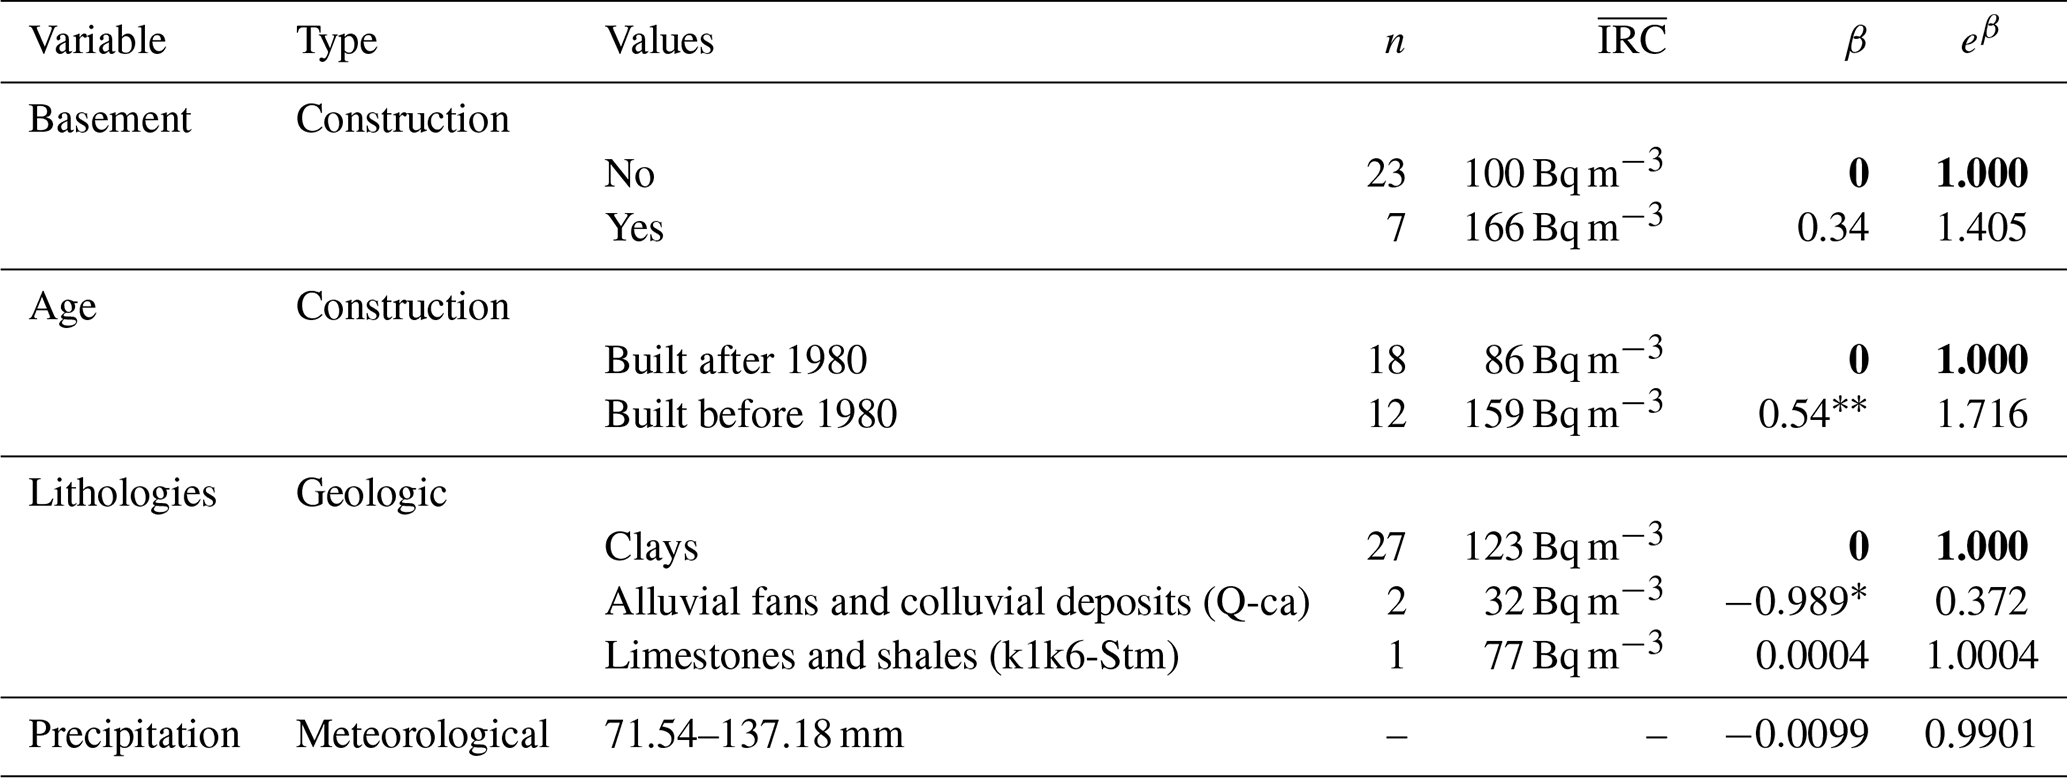
* = p value < 0.10. = p value< 0.05.
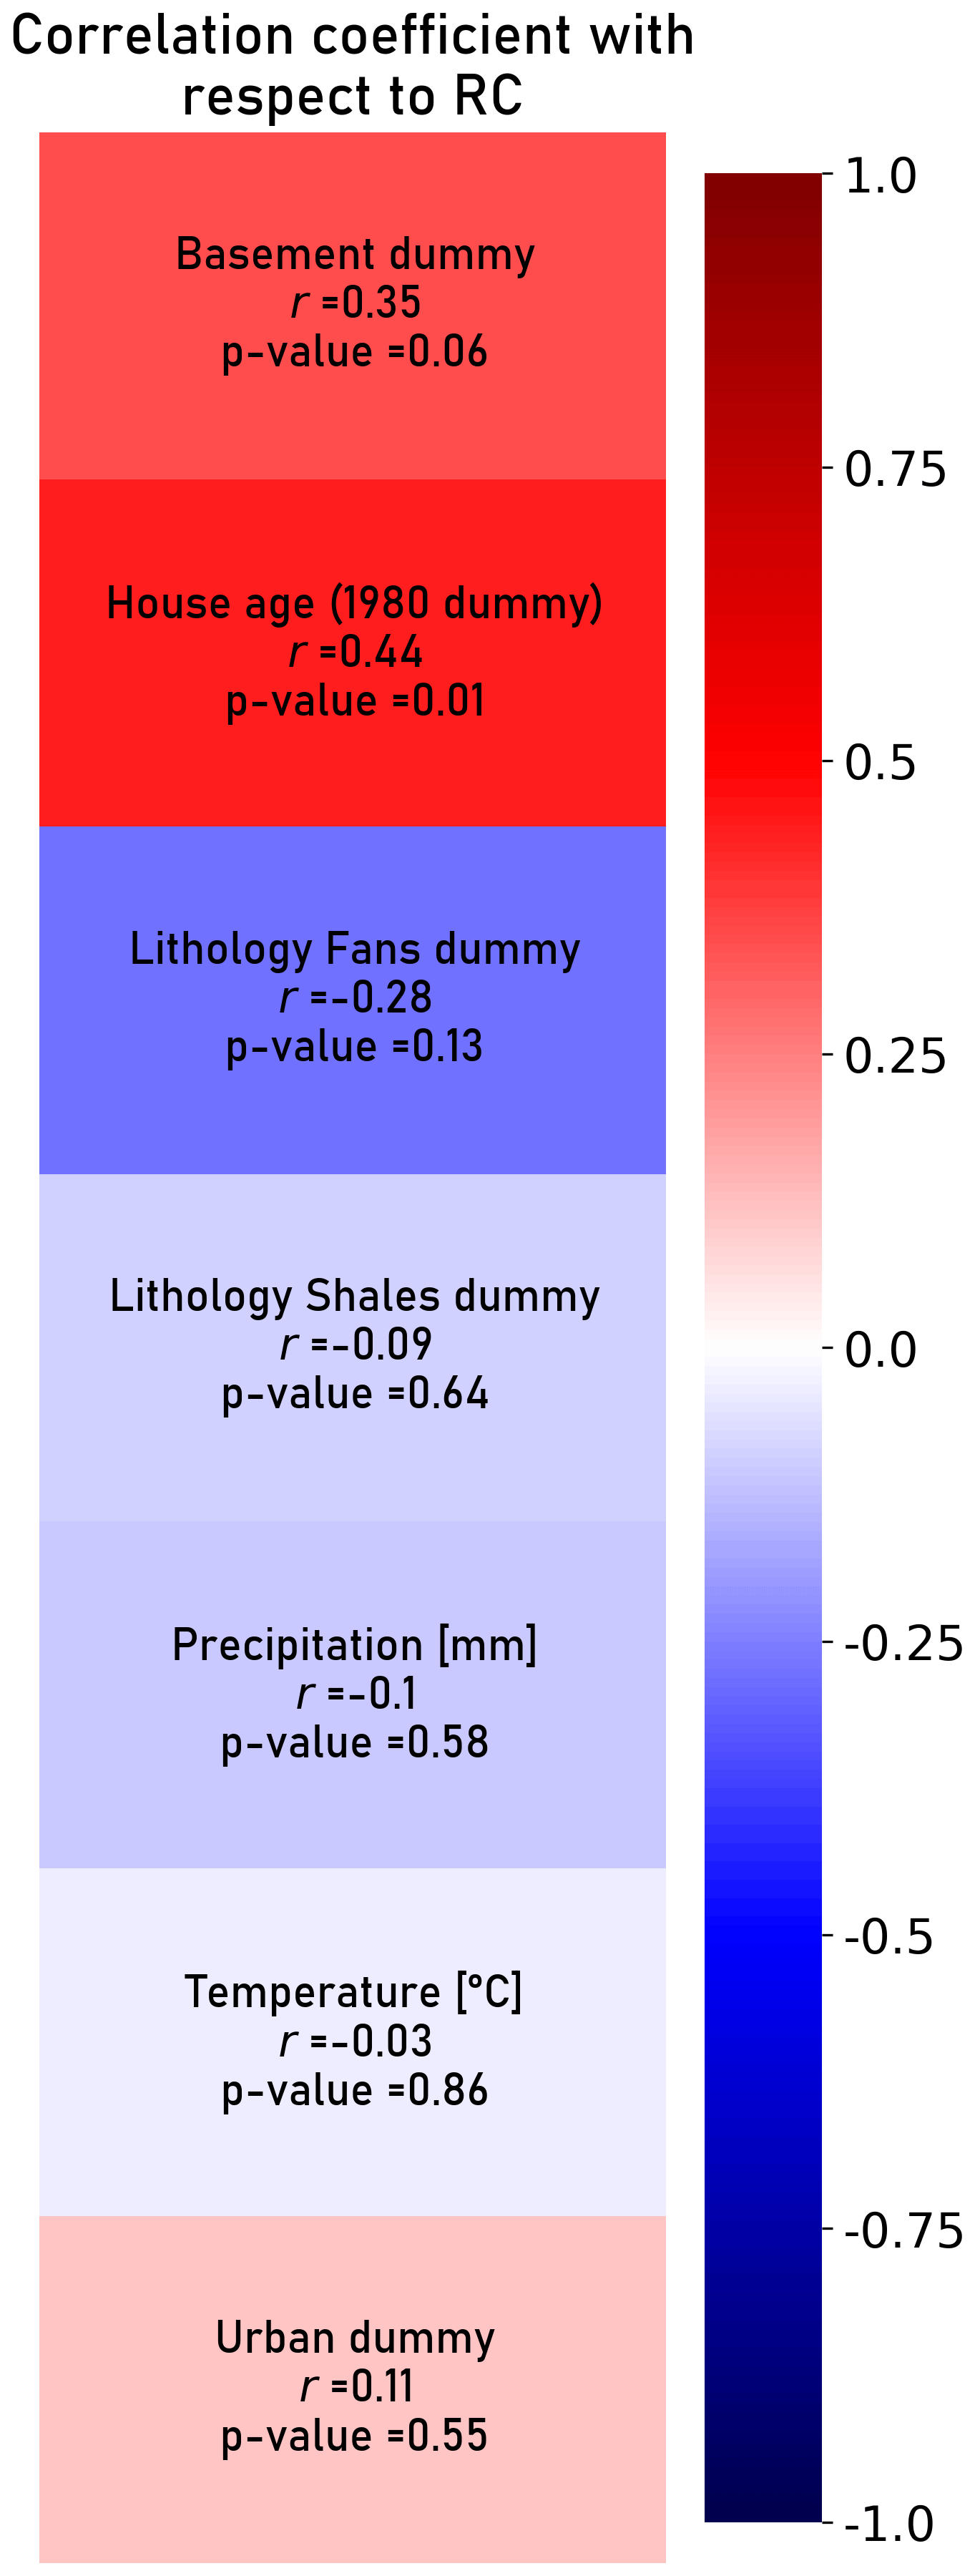
House age was the only construction variable with a statistically significant (p value < 0.05) association with IRC (Table 2). On the other hand, the association of geologic variables with IRC was only marginally significant for the dummy comparing alluvial fans and clays. Finally, the association of meteorological variables with IRC (i.e., precipitation) was not statistically significant in this survey.
Even though the influence of geologic variables on IRC has been extensively documented (e.g., Gundersen et al., 1993; Salazar et al., 2004; Maestre and Iribarren, 2018), the log-linear model fitted only showed a marginally significant association of lower IRC in houses that were built over alluvial fans and colluvial deposits (Q-ca) rather than over clays (Q1-l). The model suggests that IRC could be 63 % lower in houses above alluvial fans and colluvial deposits compared to those above clays. This could be explained by the size of soil particles and the uranium content in the different lithologies. Previous studies have reported positive correlations between Rn emanation and the number of soil particles with diameters below 0.1 mm (Thu et al., 2019); therefore higher Rn emanation rates could be present in clays rather than in alluvial and colluvial deposits that are mainly composed by a sandy matrix (Corredor et al., 2015). Furthermore, according to the Geochemical Atlas of Colombia the uranium content, which has been proven to determine the geogenic 222Rn potential (Gundersen et al., 1993), is slightly higher in soils containing clays (1.93 mg kg−1) than in soils formed in alluvial fans and colluvial deposits (1.904 mg kg−1) (Servicio Geológico Colombiano, 2016).
Several studies have concluded that residential IRC shows important seasonal variations throughout the year because of changes in temperature and precipitation (e.g., Burke et al., 2010; Mullerova et al., 2017; Schubert et al., 2018; Crockett et al., 2018). The present study aimed to gauge the potential association of the spatial distribution of these two meteorological factors with IRC throughout a measuring period of 35 d. However, since both variables introduced multicollinearity problems to the regression, the analysis was only done with precipitation data. Precipitation did not present a statistically significant association with IRC in the regression model. Despite this, previous studies suggest that the highest IRC in Bogotá could be measured in January and the lowest could be measured in May, due to the previously reported negative association of precipitation with IRC (Schubert et al., 2018; Mullerova et al., 2017; Grasty, 1994). Additionally, the results of previous surveys indicate that higher indoor 222Rn could be measured during nighttime (5 °C) in the city as a result of the negative association of mean air temperature with IRC (Schubert et al., 2018). Temporal variations of IRC should be taken into account for future studies.
The main factor to correlate with IRC was found to be the house age (r=0.44, p value = 0.01, Fig. C1). In addition, the log-linear model suggests that IRC in houses built before 1980 could be 72 % higher than in houses built after 1980. The positive association of house age with IRC has been widely studied and is usually explained by the increase of cracks and the lack of continuity of construction materials, which can enhance 222Rn migration (Karpińska et al., 2009). For the specific case of Bogotá's dwellings, those factors could be exacerbated throughout the years because of the occurrence of land subsidence throughout the city as has been seen in cities with similar characteristics, such as Mexico City (Poreh et al., 2020). Likewise, land subsidence and the occurrence of other geologic phenomena such as earthquakes could, in turn, have a cumulative effect on structural damage of dwellings increasing IRC measured in old houses. Considering that 35 % of the houses registered in Bogotá's cadaster were built over 40 years ago, the positive association of this variable with IRC points to a high probability of having 222Rn hazard zones in the city.
Finally, a positive correlation was found between IRC and the measurements in a basement (r=0.35, p value = 0.06, Fig. C1). This is supported by previous studies (e.g., Lorenzo-Gonzlez et al., 2017; Giraldo-Osorio et al., 2021; Li et al., 2022) and can be explained by the proximity to radon sources, which favors its accumulation in ground floors and basements (Field, 2015). Even though only 0.5 % of the houses registered in Bogotá have a basement, measuring IRC in these areas was important since one-third of the basements measured were used as bedrooms for domestic workers. This could significantly increase 222Rn exposure on this population group. Besides, most of the basements surveyed in the present studied were not registered in Bogotá's cadaster; thus the cadaster's information could provide an underestimation of potential 222Rn exposure in the city.
3.3 Potential hazard posed by residential 222Rn in Bogotá
The high IRC measured in the current study suggests that this gas could pose a health risk in the city. Likewise, events such as the COVID-19 pandemic could significantly increase 222Rn exposure in Bogotá's dwellings due to the implementation of measures like lockdowns, where residents are compelled to stay indoors. Given the size of Bogotá's population, it is paramount to conduct more sampling campaigns to understand the dimensions of the problem.
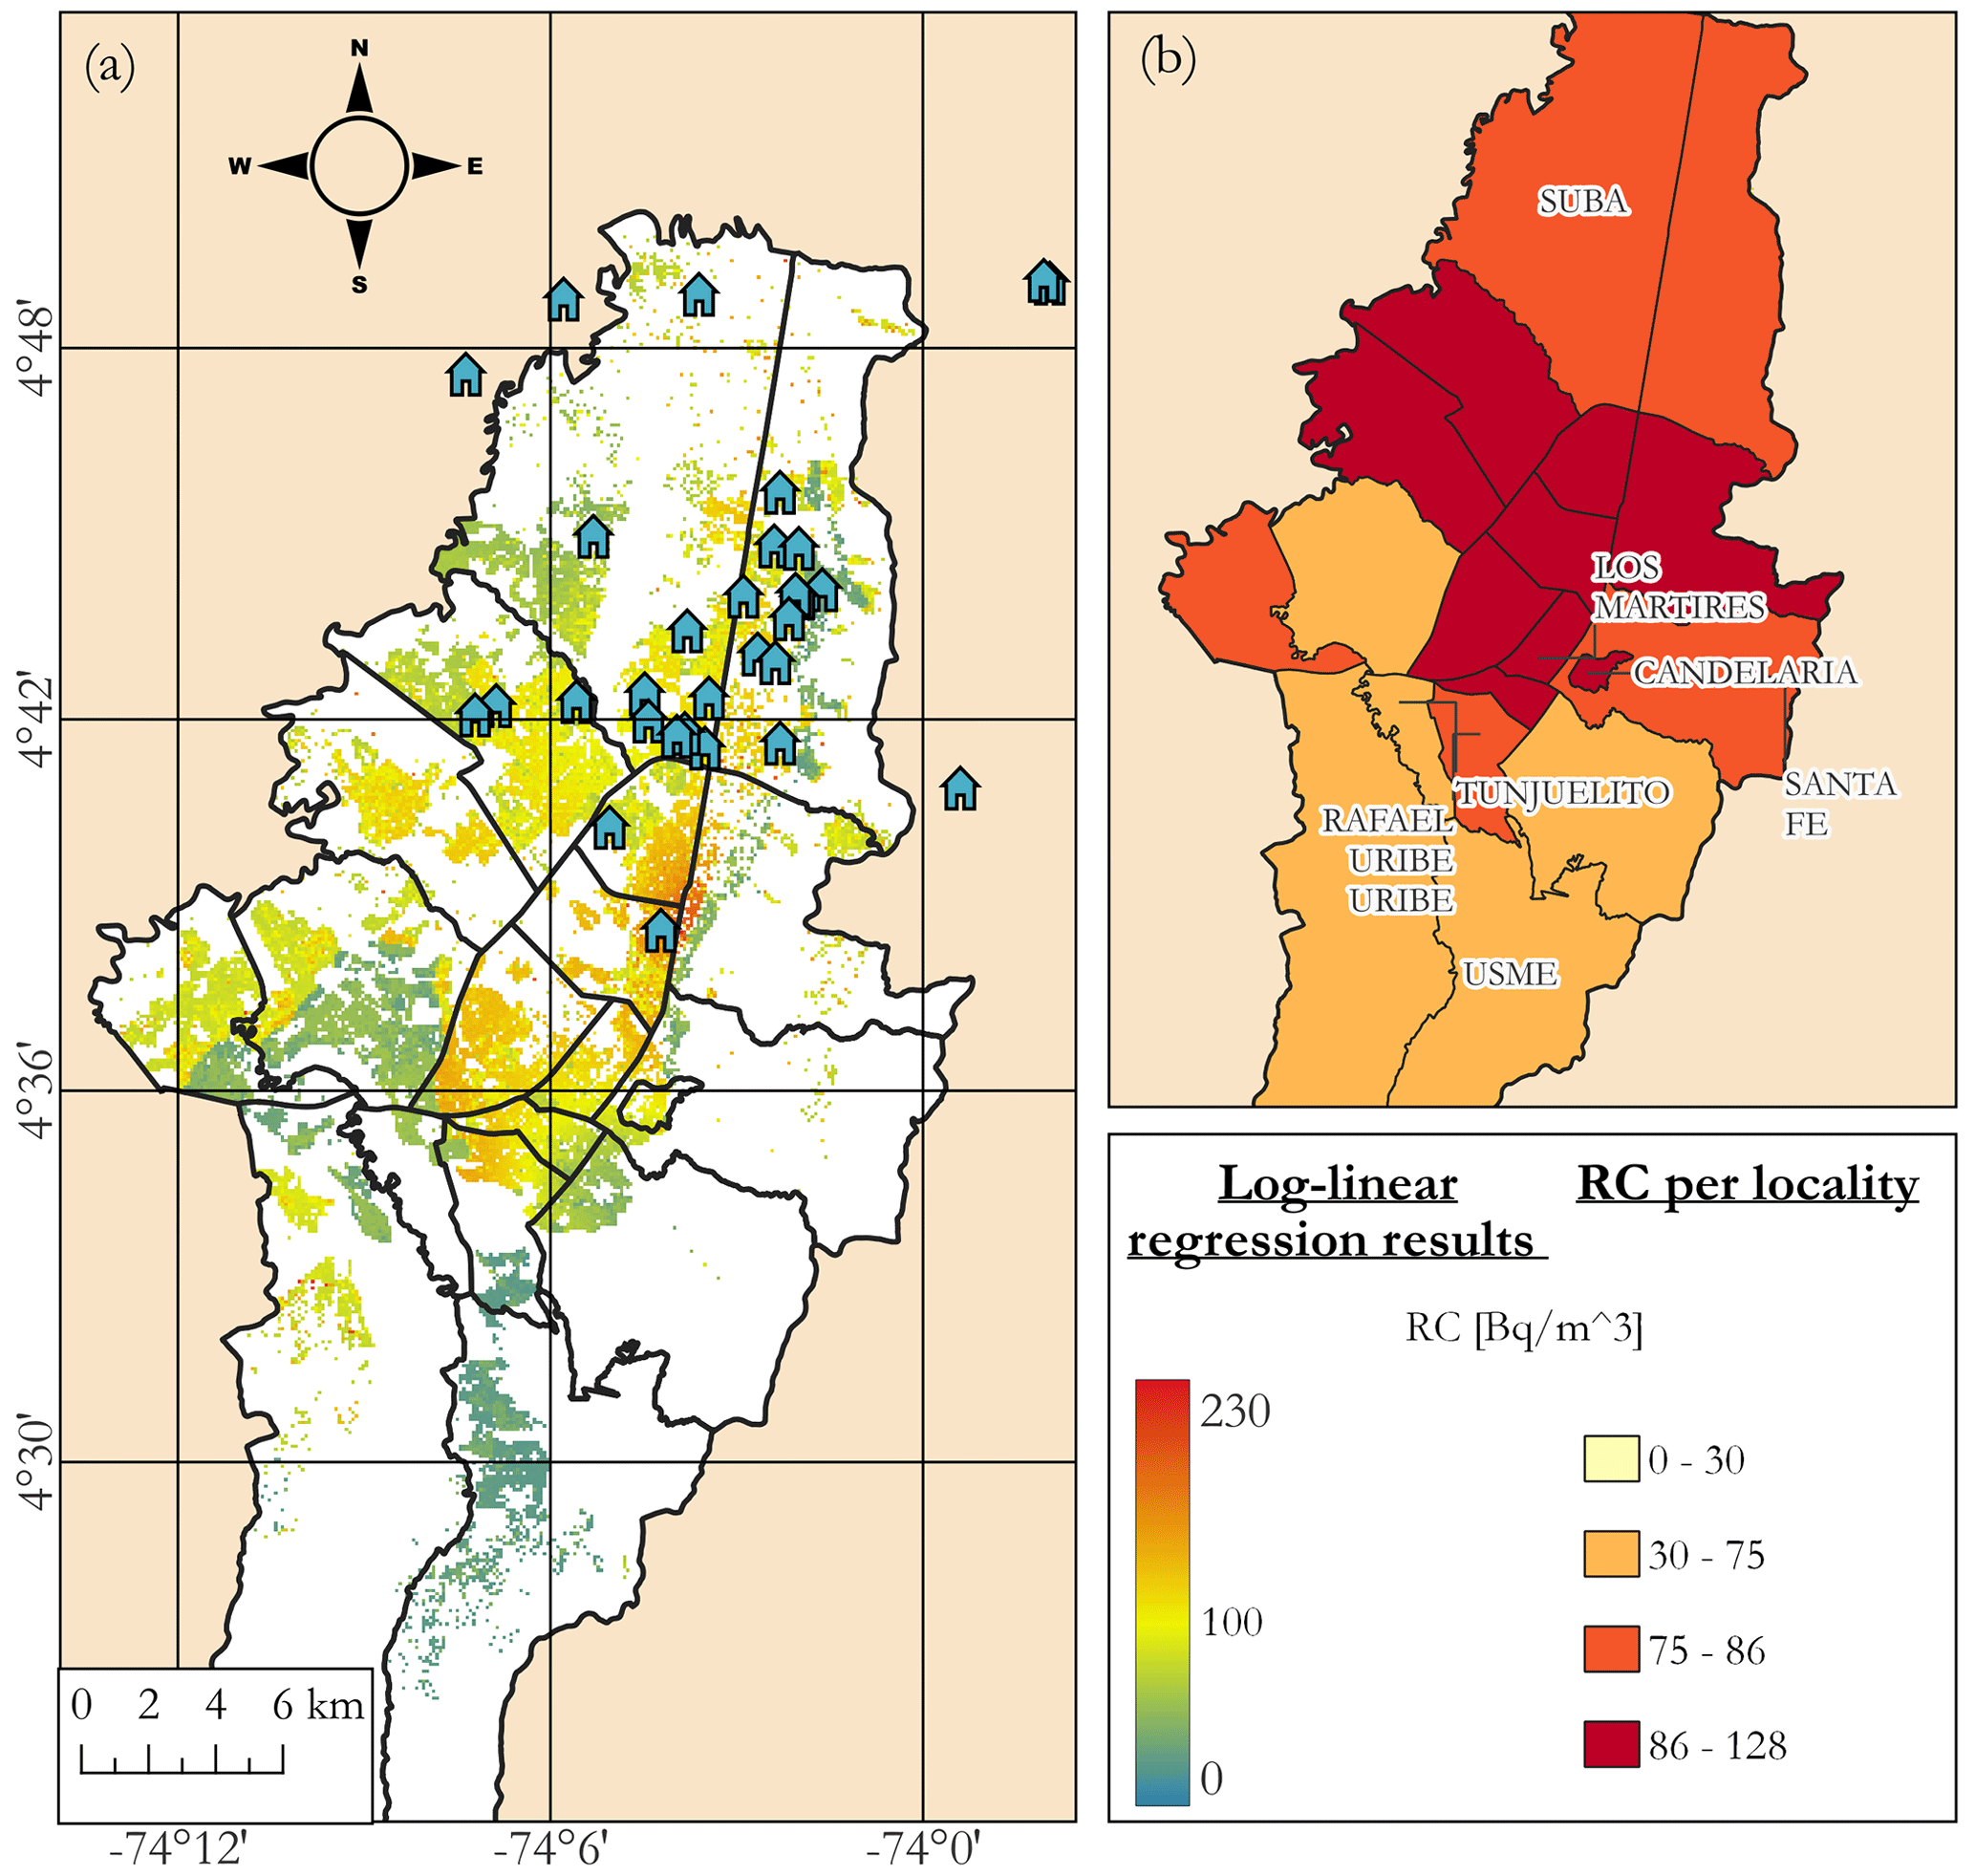
Figure 8Application of log-linear regression model to houses registered on Bogotá's cadaster. (a) 222Rn concentrations predicted using a fitted linear regression model. Orange and red pixels exceed the WHO's recommended level, while green and blue values are below this level. Markers in cyan represent the houses where measurements were taken. (b) Predicted IRC in each locality of Bogotá. Basemap source: Departamento Administrativo Nacional de Estadística (2018b).
3.3.1 Prediction map
Considering the absence of monitoring programs in the country and that our study had a limited sample set, the modeling dashboard developed in this study was used to create a prediction map of the potential distribution of IRC. This map represents an alternative to assess the magnitude of 222Rn hazard in the city and establish target areas for future studies (Fig. 8). The map predicted IRC ranging from 21 to 220 Bq m−3. Moreover, considering the smoothing tendency of the models used and that prediction uncertainty was not accounted for in the statistical analysis, the model suggests that a minimum of 32 % of the 551 570 houses (177 008 residences) could have IRC above the WHO's recommended level (Fig. 8a; WHO, 2009). Considering that the mean household density in Bogotá is 2.9 inhabitants per household, a total of 513 323 people could be exposed to IRC above recommended levels. Notably, the average IRC in the localities of Los Mártires, Fontibón, Teusaquillo, Barrios Unidos and Puente Aranda was estimated to be above 100 Bq m−3 (Fig. 8b). All of these localities are found near downtown Bogotá, which is the oldest area of the city. Even though the map created in our study shows the highest predicted IRC in zones built before 1980, it is necessary to extend the direct measurements to other areas to confirm our predictions.
3.4 Dashboard performance
The dashboard built in this study was able to detect place-specific variables associated with the distribution of residential IRC in the city of Bogotá. In this case, a significant association between the house age and the residential IRC was found. This variable should be considered for the planning of further studies in the city. Moreover, the dashboard successfully provided summarized information of the in situ measurements, the effect of the variables on residential IRC modeled and the spatial distribution of IRC in Bogotá. These results show the great potential of the dashboard to assess this public health issue and guide national entities in the implementation of policies and monitoring programs to address this issue.
3.5 Study limitations
Even though the present study provides insight into what the situation of 222Rn hazard could be in the city of Bogotá, the findings must be evaluated with some limitations in mind. Firstly, the prediction map is built to have a better understanding of a potential distribution of IRC in Bogotá's dwellings; however, these estimations cannot be used to replace in situ IRC measurements. Secondly, to have a more accurate public health perspective in the analysis of indoor 222Rn, exposure to the gas should be quantified. Thirdly, in the statistical analysis most of the variables did not have a significant association with IRC, and this could be due to the small sample set and not representative distribution. Moreover, to corroborate the high values measured using the passive methods, the use of active measurements are recommended to check measurement correctness. Finally, variations in IRC caused by meteorological factors should be determined considering the temporal variability and not only the spatial distribution; to do so, the inclusion of active measurements is also suggested. These limitations were the result of budgetary and time constraints. This preliminary study provides baseline information about IRC and indicates that more geological substrates as well as a temporally wider climatic range should be taken into account to improve the understanding of Rn distribution in the city.
High IRC values were found in the Bogotá region, with 57 % exceeding the WHO's recommended level and a geometric mean (91 Bq m−3) that surpassed the mean values found in 58 % of the previous studies done in Latin America and the Caribbean. Furthermore, the high IRC measured points to the importance of updating the action levels of residential Rn in Colombia to address a potential public health hazard posed by Rn. These public policies should be accompanied by rigorous monitoring of the exposure to the gas by people inside residences.
The house age and the presence of clays, rather than alluvial and colluvial deposits, showed a significant and marginal association with high IRC. The log-linear model fitted suggests that IRC in houses built before 1980 could be 72 % higher than in those built after 1980. This could be due to the increase of cracks in the dwelling, a phenomenon that could be exacerbated by the occurrence of land subsidence in the city. The presence of alluvial and colluvial deposits rather than clays could decrease IRC as a consequence of the size of the soil particles and the different uranium content in these lithologies.
A prediction map was built in the dashboard using a log-linear regression model to establish areas of high Rn in the city. The map suggests that the oldest areas in Bogotá could present high radon concentrations. According to the estimations of this map, at least 513 323 citizens in Bogotá could be exposed to concentrations above the WHO's recommended level. While it is a first approach, our prediction map cannot replace IRC measurements.
The use of the dashboard built in this study along with inferential statistics was demonstrated to be an efficient alternative for bridging the baseline information gap that is present in countries like Colombia, where IRC measurements are scarce. The performance of the dashboard was evaluated with the results of an exploratory study in Bogotá, Colombia.
While this is an important study to bridge the baseline 222Rn information gap in the city, considering that this study used only 30 measurements of IRC, it is important to expand the coverage of monitoring campaigns of residential Rn in Bogotá, focusing particularly on the localities with older houses that according to the dashboard results could present a higher potential of having high IRC.
Table A1Information about the data acquisition of the initial independent variables used as predictors in the log-linear regression model.
B1 Geologic variables
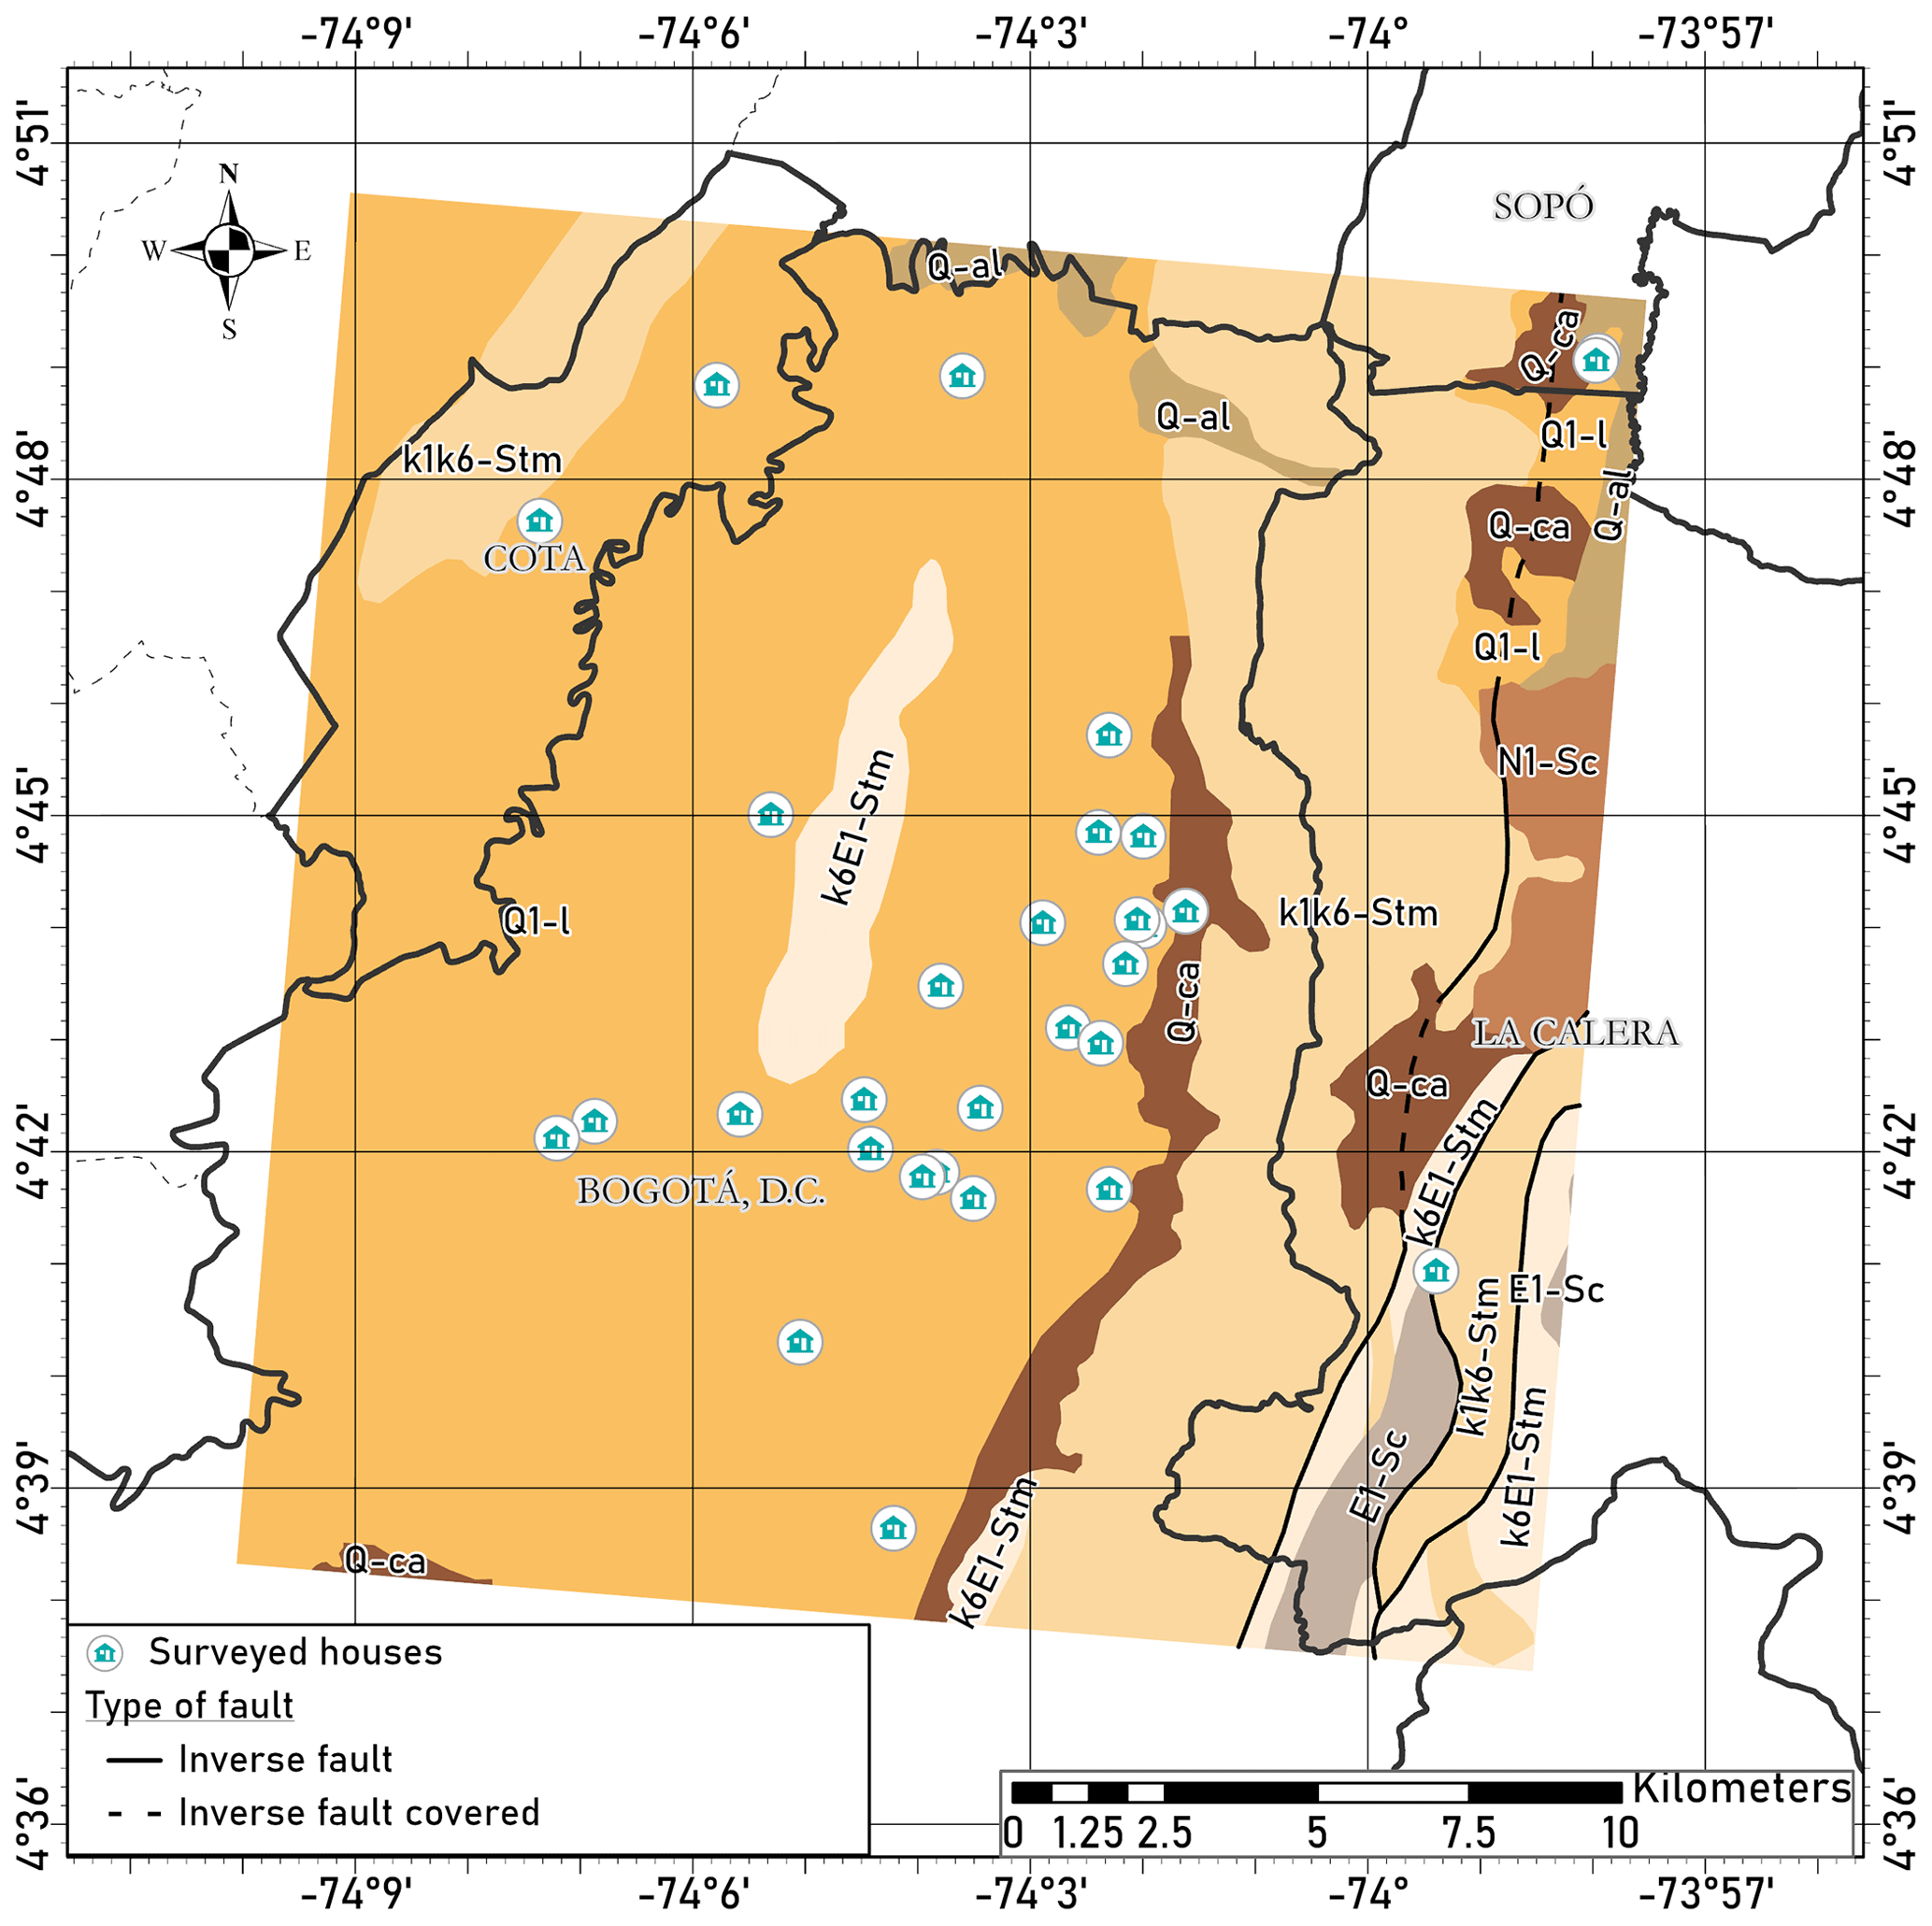
Figure B1Lithology in the Bogotá region. Information retrieved from Gómez Tapias et al. (2015).
B2 Meteorologic variables
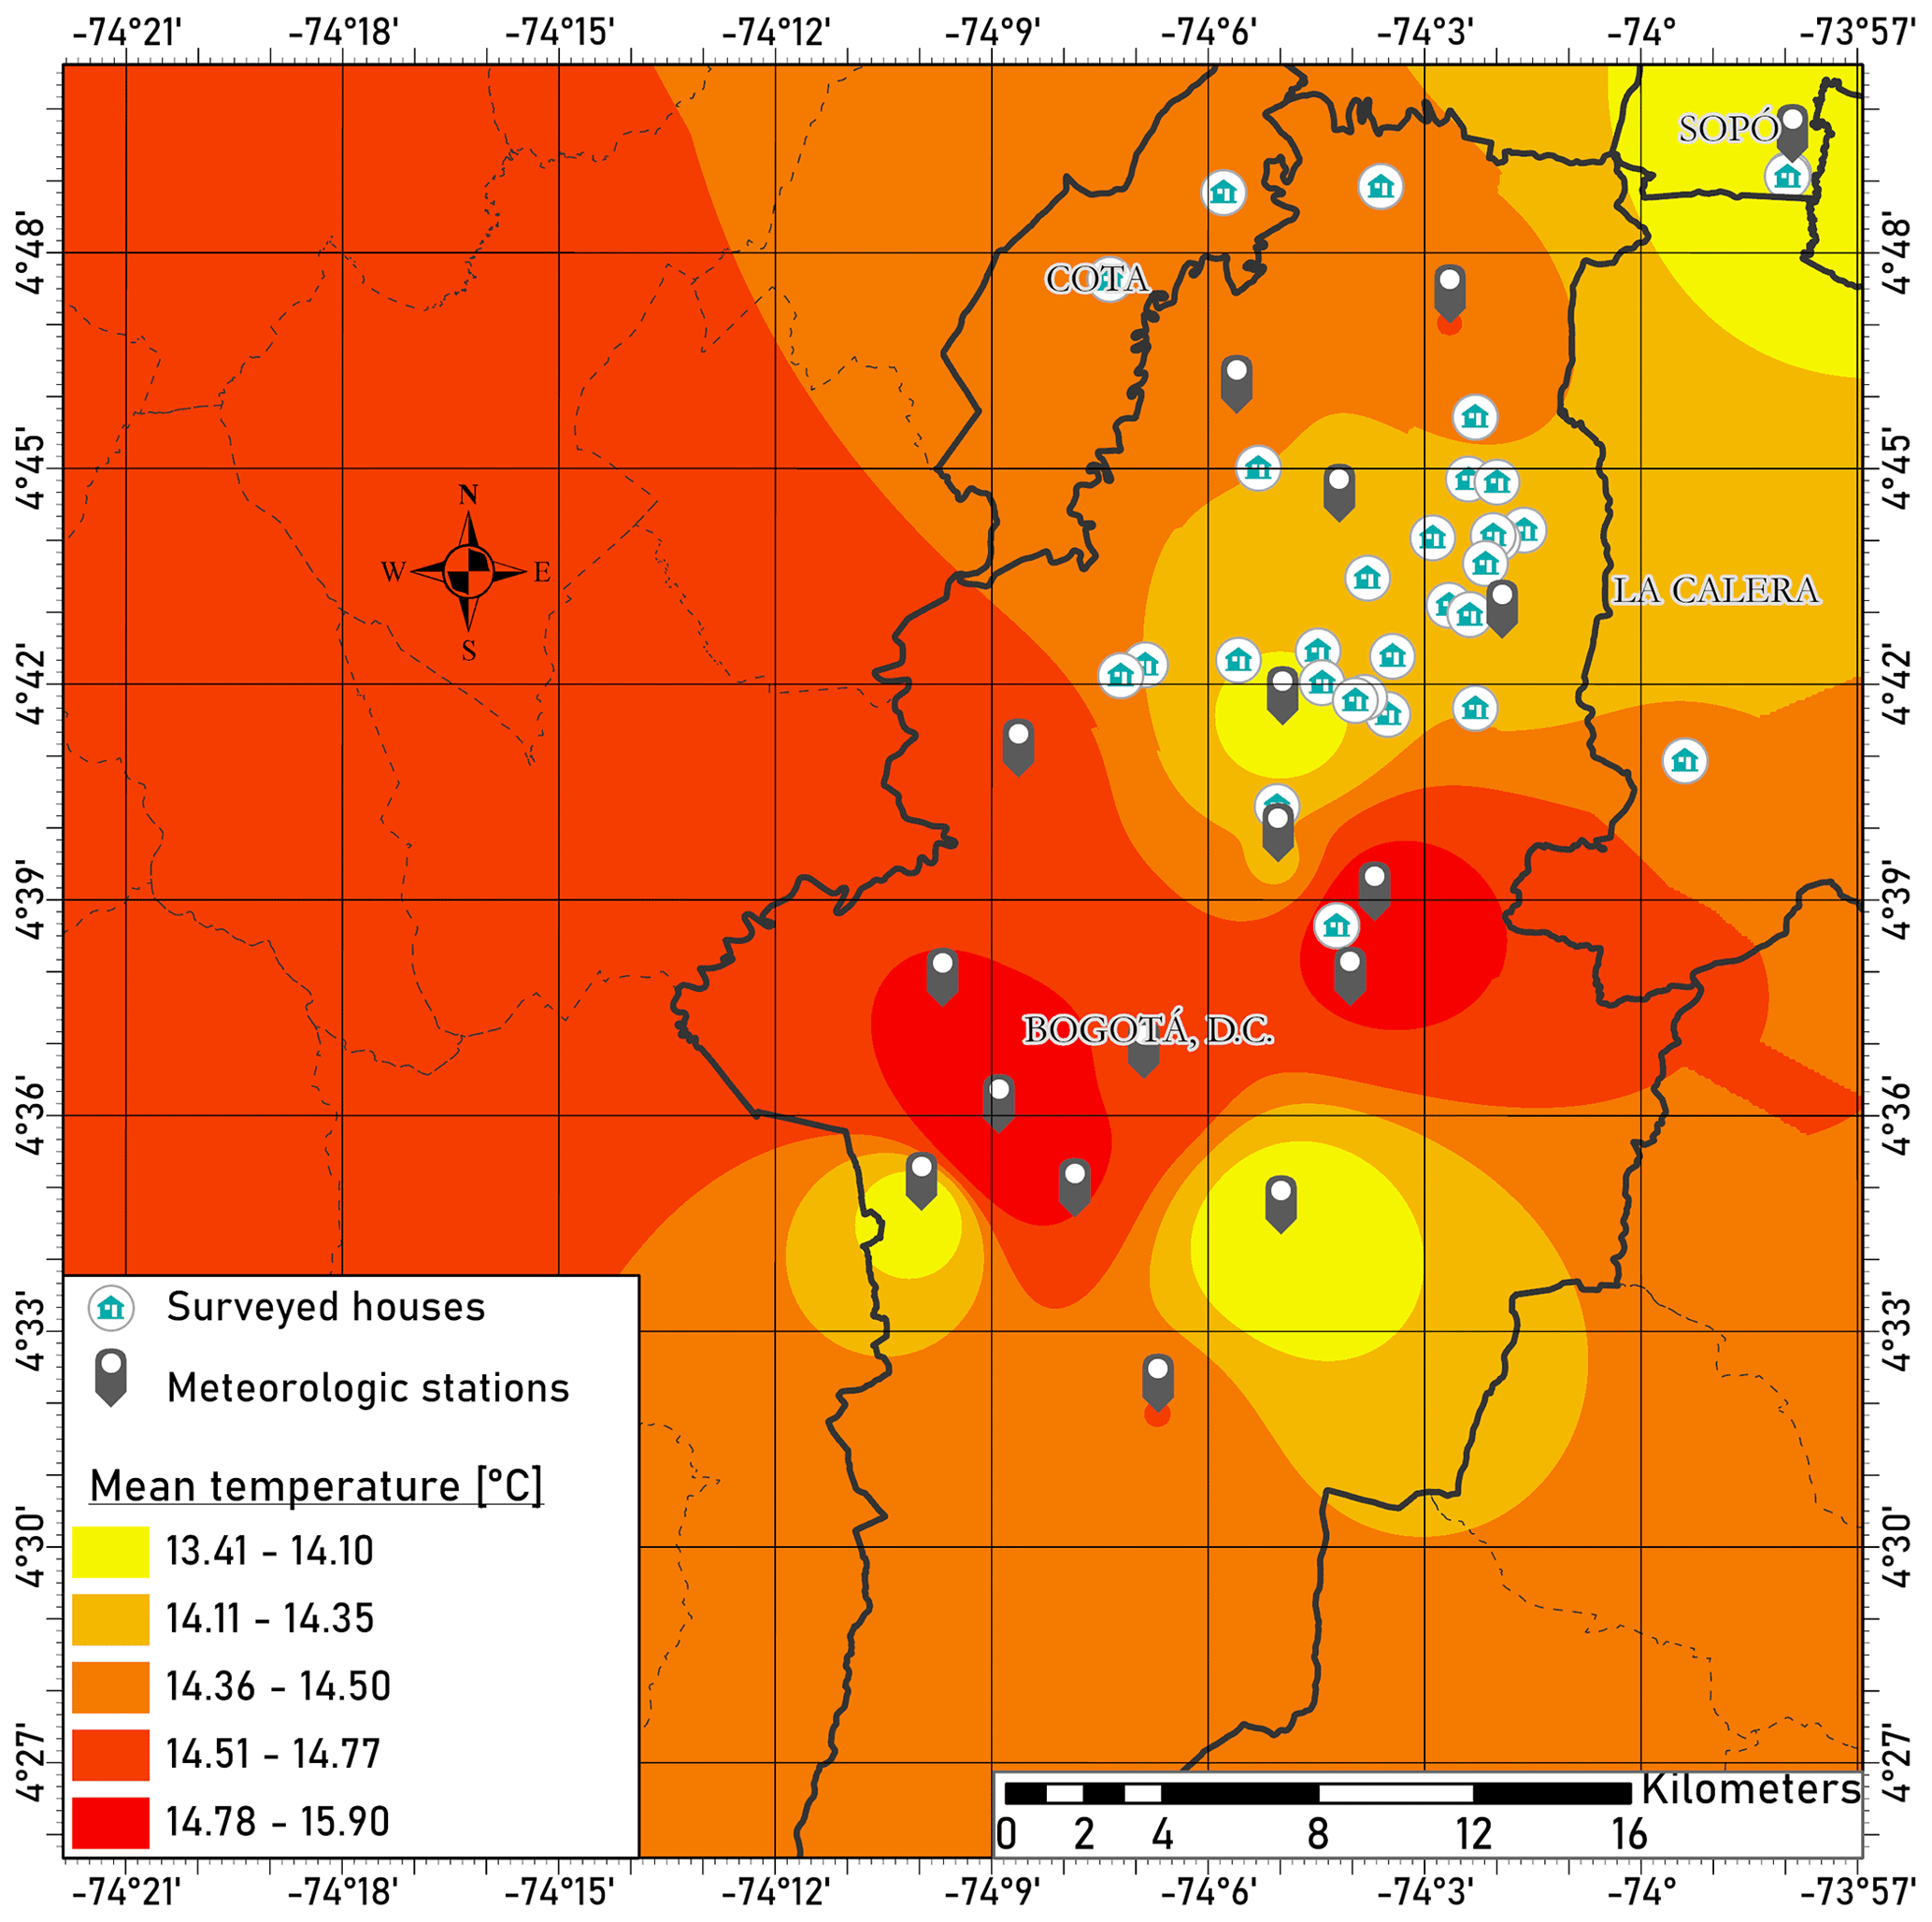
Figure B2Mean temperature over the time window in the Bogotá region. Information retrieved from the Instituto de Hidrología, Meteorología y Estudios Ambientales (IDEAM) and Red de Monitoreo de Calidad del Aire de Bogotá (RMCAB) and interpolated using inverse distance weight.
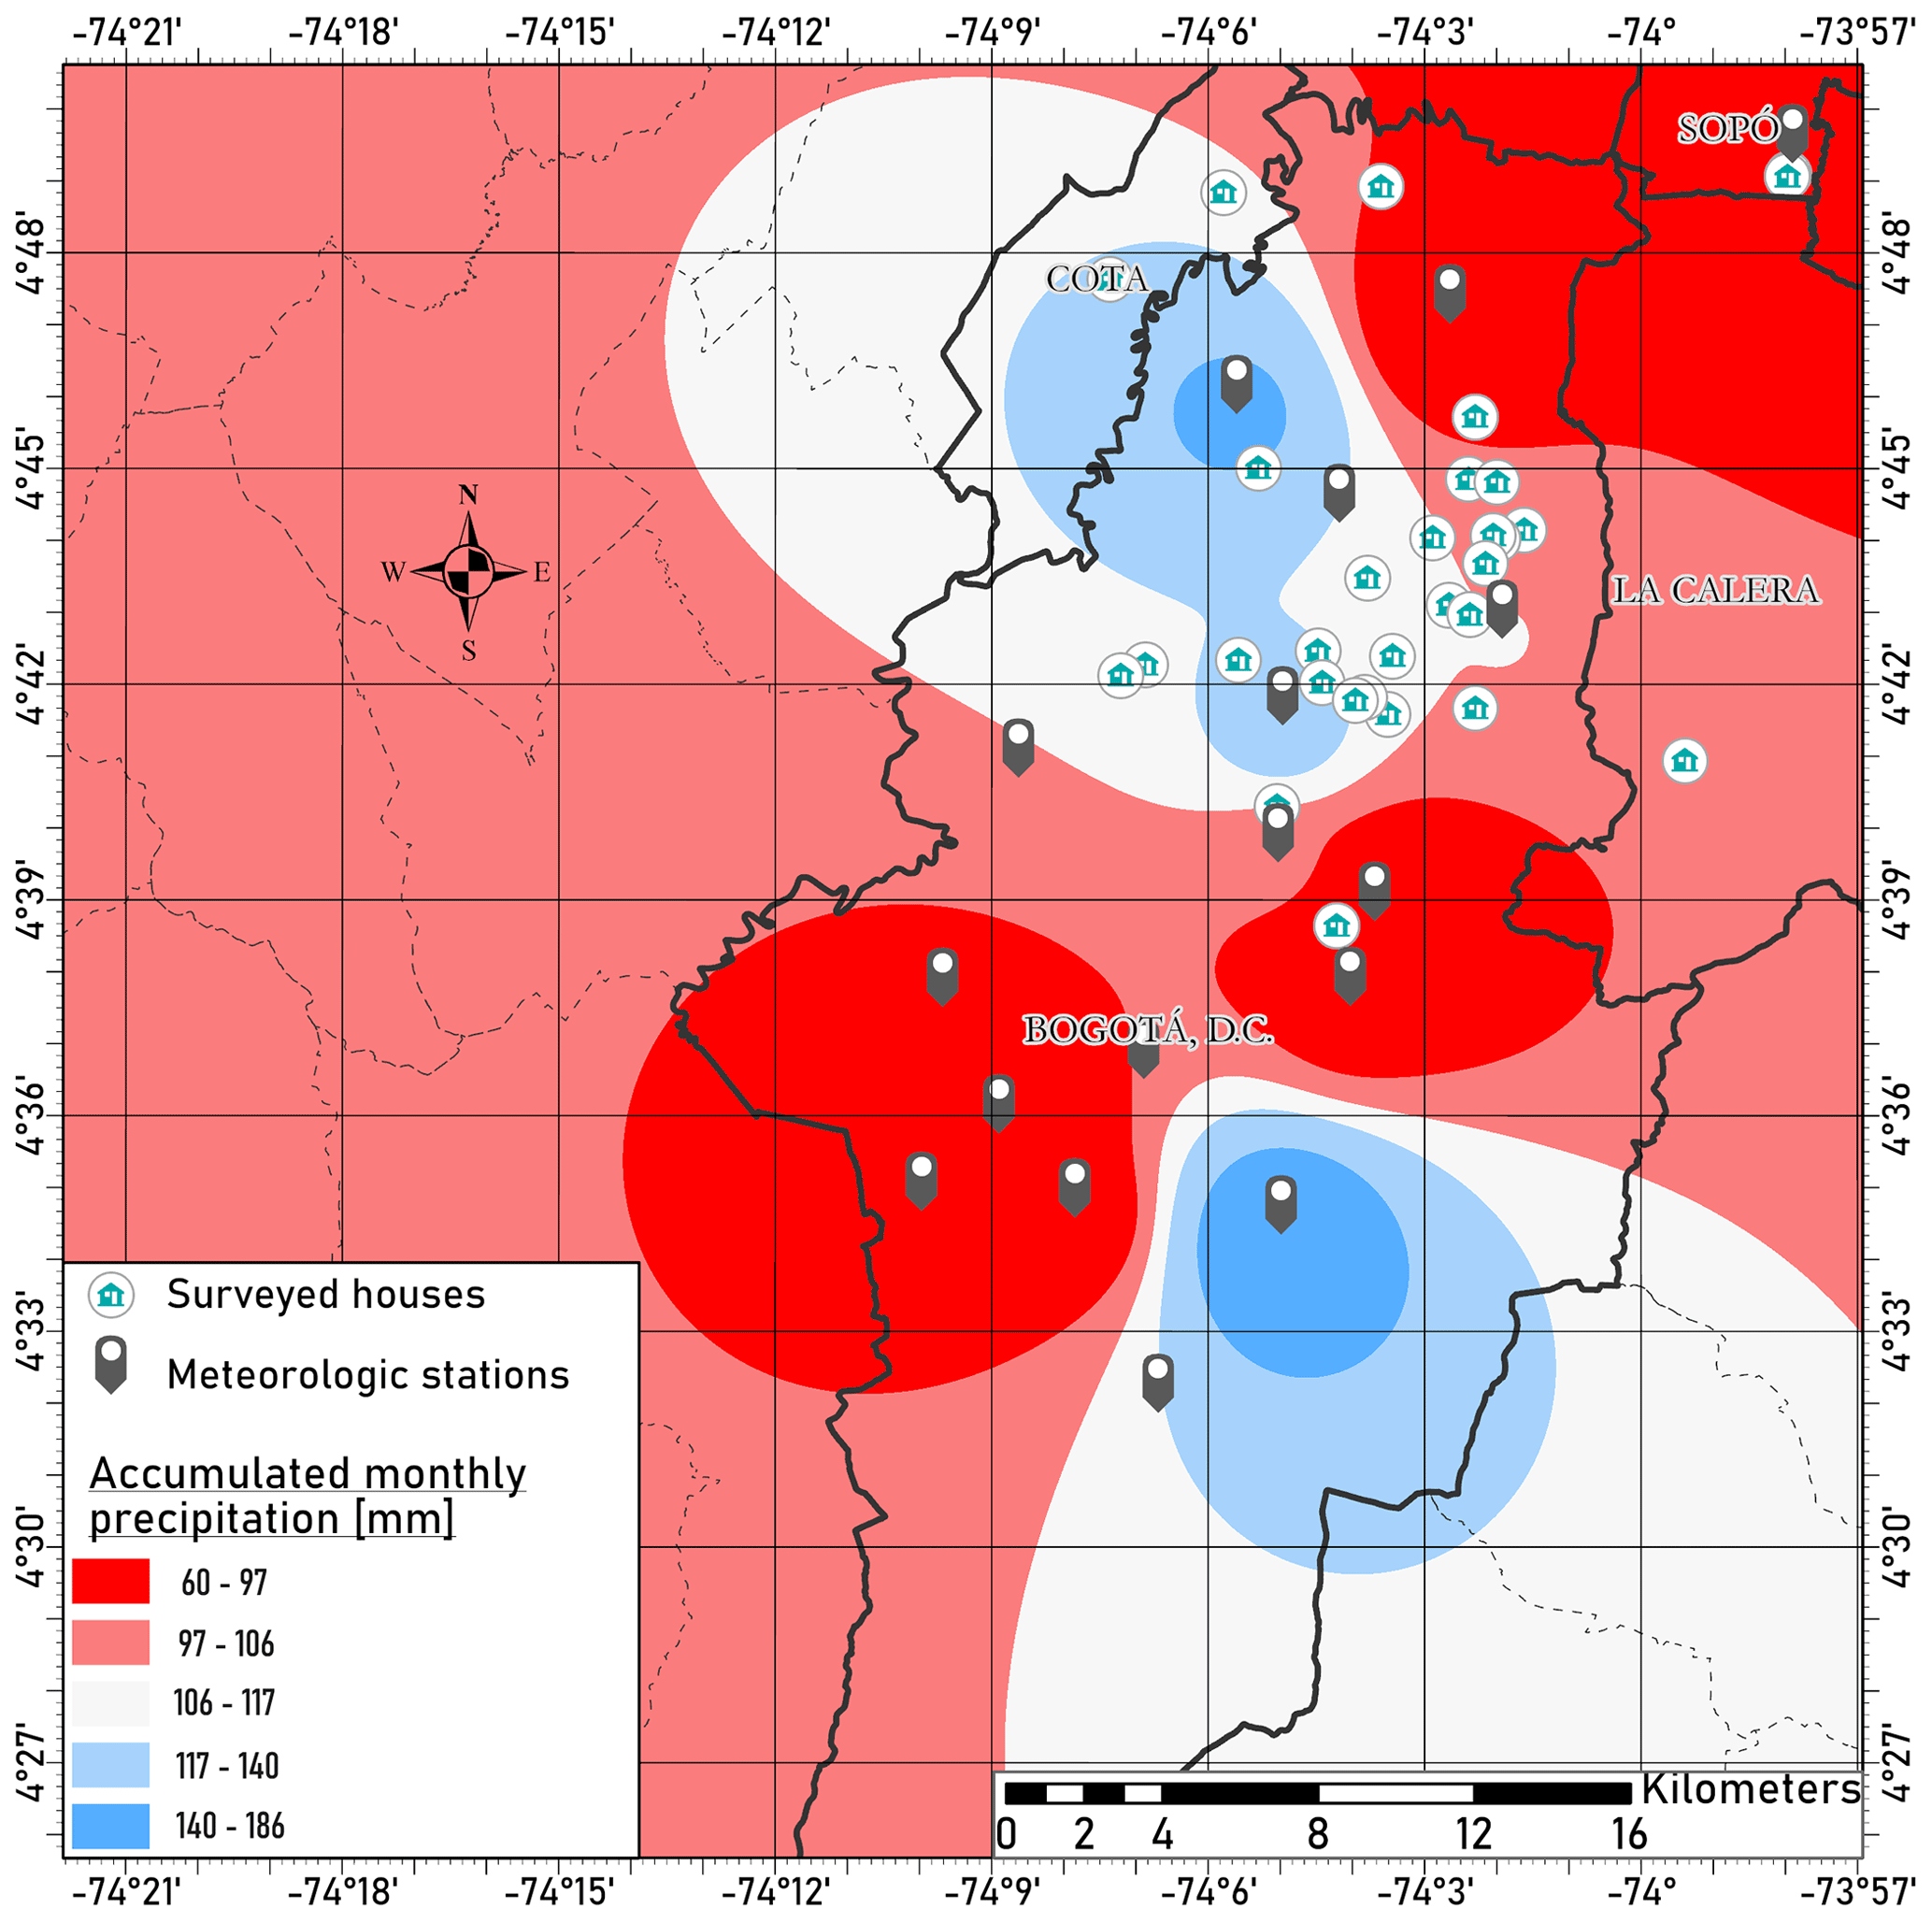
Figure B3Accumulated monthly precipitation over the time window in the Bogotá region. Information retrieved from the Instituto de Hidrología, Meteorología y Estudios Ambientales (IDEAM) and Red de Monitoreo de Calidad del Aire de Bogotá (RMCAB) and interpolated using inverse distance weight.
Code and datasets are available at https://doi.org/10.5281/zenodo.11024517 (Dominguez, 2024).
MDD: conceptualization, methodology, software, formal analysis, investigation, data curation, writing (original draft), visualization and project administration. MASG: methodology, validation, investigation, resources, data curation, writing (review and editing) and supervision. CH: conceptualization, investigation, writing (review and editing), supervision and project administration.
The contact author has declared that none of the authors has any competing interests.
Publisher's note: Copernicus Publications remains neutral with regard to jurisdictional claims made in the text, published maps, institutional affiliations, or any other geographical representation in this paper. While Copernicus Publications makes every effort to include appropriate place names, the final responsibility lies with the authors.
The authors express special gratitude to Juan Pablo Ramos Bonilla for his guidance during the development of the statistical analysis and the manuscript writing. Additionally, the authors show gratitude to Laszlo Sajo-Bohus for his support and guidance during the writing of the manuscript. The authors also thank FINUAS (Applied Nuclear Physics and Simulation) laboratory for their collaboration with the measurement reading and the donation of LR-115 film. The authors want to thank the Faculty of Science at the University of the Andes for providing funding (project no. INV-2021-128-2286 to Carme Huguet).
This research has been supported by the University of the Andes (grant no. INV-2021-128-2286).
This paper was edited by Olivier Dewitte and reviewed by two anonymous referees.
Alber, O., Laubichler, C., Baumann, S., Gruber, V., Kuchling, S., and Schleicher, C.: Modeling and predicting mean indoor radon concentrations in Austria by generalized additive mixed models, Stochastic Environmental Research and Risk Assessment, Springer, Berlin, Heidelberg, 1–15, https://doi.org/10.1007/s00477-023-02457-6, 2023. a
Auvinen, A., Salonen, L., Pekkanen, J., Pukkala, E., Ilus, T., and Kurttio, P.: Radon and other natural radionuclides in drinking water and risk of stomach cancer: A case-cohort study in Finland, International journal of cancer, Journal international du cancer, 114, 109–113, https://doi.org/10.1002/ijc.20680, 2005. a
Beigaitė, R., Mechenich, M., and Žliobaitė, I.: Spatial Cross-Validation for Globally Distributed Data, in: Discovery Science, edited by: Pascal, P. and Ienco, D., Springer Nature Switzerland, Cham, 127–140, ISBN 978-3-031-18840-4, 2022. a
Burke, Ó., Long, S., Murphy, P., Organo, C., Fenton, D., and Colgan, P. A.: Estimation of seasonal correction factors through Fourier decomposition analysis – a new model for indoor radon levels in Irish homes, J. Radiolog. Protect., 30, 433–443, https://doi.org/10.1088/0952-4746/30/3/002, 2010. a
Canoba, A., López, F. O., Arnaud, M. I., Oliveira, A., Neman, R. S., Hadler, J. C., Iunes, P. J., Paulo, S. R., Osorio, A. M., Aparecido, R., Rodriguez, C., Moreno, V., Vasquez, R., Espinosa, G., Golzarri, J. I., Martínez, T., Navarrete, M., Cabrera, I., Segovia, N., Peña, P., Taméz, E., Pereyra, P., López-Herrera, M. E., and Sajo-Bojus, L.: Indoor radon measurements in six Latin American countries, Geofísica Internacional, 41, 453–457, 2002. a
Chao, C. Y., Tung, T. C., and Burnett, J.: Influence of ventilation on indoor radon level, Build. Environ., 32, 527–534, https://doi.org/10.1016/S0360-1323(97)00017-6, 1997. a
Cohen, B. L., Stone, C. A., and Schilken, C. A.: Indoor Radon Maps of the United States, Health Phys., 66, 201–205, https://doi.org/10.1097/00004032-199402000-00011, 1994. a
Comber, S.: SamComber/spacv, GitHub [code], https://github.com/SamComber/spacv (last access: 12 June 2020), 2024. a, b
Corredor, V. E., Terraza-Melo, R., and Etayo-Serna, F.: Geología de la plancha 228 Bogotá Noreste, 82–86, https://recordcenter.sgc.gov.co/B14/23008010024691/documento/pdf/2105246911101000.pdf (last access: 22 April 2024), 2015. a
Crockett, R. G. M., Groves-Kirkby, C. J., Denman, A. R., and Phillips, P. S.: Significant annual and sub-annual cycles in indoor radon concentrations: seasonal variation and correction, Geol. Soc. Lond. Spec. Publ., 451, 35–47, https://doi.org/10.1144/SP451.2, 2018. a
Darby, S., Hill, D., Auvinen, A., Barros-Dios, J. M., Baysson, H., Bochicchio, F., Deo, H., Falk, R., Forastiere, F., Hakama, M., Heid, I., Kreienbrock, L., Kreuzer, M., Lagarde, F., Mäkeläinen, I., Muirhead, C., Oberaigner, W., Pershagen, G., Ruano-Ravina, A., Ruosteenoja, E., Rosario, A. S., Tirmarche, M., Tomáscaron;ek, L., Whitley, E., Wichmann, H.-E., and Doll, R.: Radon in homes and risk of lung cancer: collaborative analysis of individual data from 13 European case-control studies, BMJ, 330, 223, https://doi.org/10.1136/bmj.38308.477650.63, 2005. a
Dasgupta, N. and Kapadia, F.: The Future of the Public Health Data Dashboard, Am. J. Publ. Health, 112, 886–888, https://doi.org/10.2105/AJPH.2022.306871, 2022. a
Demoury, C., Ielsch, G., Hemon, D., Laurent, O., Laurier, D., Clavel, J., and Guillevic, J.: A statistical evaluation of the influence of housing characteristics and geogenic radon potential on indoor radon concentrations in France, J. Environ. Radioactiv., 126, 216–225, https://doi.org/10.1016/j.jenvrad.2013.08.006, 2013. a, b, c
Departamento Administrativo Nacional de Estadística: Censo nacional de población y vivienda, https://www.datos.gov.co/Estad-sticas-Nacionales/Censo-Nacional-de-Poblaci-n-y-Vivienda-CNPV-2018/qzc6-q9qw (last access: 20 November 2021), 2018a. a
Departamento Administrativo Nacional de Estadística: Marco Geoestadístico Nacional, https://www.dane.gov.co/files/geoportal-provisional/index.html (last access: 20 November 2021), 2018b. a, b, c
Drolet, J.-P. and Martel, R.: Distance to faults as a proxy for radon gas concentration in dwellings, J. Environ. Radioactiv., 152, 8–15, https://doi.org/10.1016/j.jenvrad.2015.10.023, 2016. a
Dominguez, M.: mdominguezd/RnSurvey_Bogota_DataAnalysis: RnSurveyBog (v.0.1), Zenodo [code and data set], https://doi.org/10.5281/zenodo.11024517, 2024. a
Elío, J., Crowley, Q., Scanlon, R., Hodgson, J., and Long, S.: Logistic regression model for detecting radon prone areas in Ireland, Sci. Total Environ., 599–600, 1317–1329, https://doi.org/10.1016/j.scitotenv.2017.05.071, 2017. a, b
Faisca, M., Teixeira, M., and Bettencourt, A.: Indoor Radon Concentrations in Portugal – A National Survey, Radiat. Protect. Dosimet., 45, 465–467, https://doi.org/10.1093/rpd/45.1-4.465, 1992. a, b, c
Field, R. W.: Radon: An Overview of Health Effects, Refer. Mod. Earth Syst. Environ. Sci., 4, 745–753, https://doi.org/10.1016/B978-0-444-52272-6.00095-7, 2015. a, b, c, d, e
Garzon, G., Hincapie, W., and Salazar, S.: Indoor Air: Radiological geohazard https://www.researchgate.net/publication/257068243_Indoor_Air_Radiological_geohazard_survey_in_the_southeast_of_Manizales_city_Colombia (last access: 22 April 2024), 2013. a
Gaskin, J., Coyle, D., Whyte, J., and Krewksi, D.: Global Estimate of Lung Cancer Mortality Attributable to Residential Radon, Environ. Health Perspect., 126, 057009, https://doi.org/10.1289/EHP2503, 2018. a
Giraldo-Osorio, A., Ruano-Ravina, A., Varela-Lema, L., Barros-Dios, J. M., and Pérez-Ríos, M.: Residential Radon in Central and South America: A Systematic Review, Int. J. Environ. Res. Publ. Health, 17, 4550, https://doi.org/10.3390/ijerph17124550, 2020. a, b, c, d, e, f, g, h
Giraldo-Osorio, A., Ruano-Ravina, A., Pérez-Ríos, M., Varela-Lema, L., Barros-Dios, J. M., and Arias-Ortiz, N. E.: Residential Radon in Manizales, Colombia: Results of a Pilot Study, Int. J. Environ. Res. Publ. Health, 18, 1228 , https://doi.org/10.3390/ijerph18031228, 2021. a, b, c, d, e, f
Gómez Tapias, J., Montes Ramírez, N., Nivia, A., and Diederix, H.: Mapa Geológico de Colombia 2015, ResearchGate, https://doi.org/10.13140/RG.2.1.1310.2802, 2015. a, b, c, d, e, f
Grasty, R. L.: Summer outdoor radon variations in Canada and their relation to soil moisture, Health Phys., 66, 185–193, https://doi.org/10.1097/00004032-199402000-00009, 1994. a
Gundersen, L. C. S., Schumann, R. R., and White, S. W.: The USGS/EPA State Radon Potential Assessments: An Introduction, Geological Radon Potential of EPA Region 9, USGS, 1–15, https://pubs.usgs.gov/of/1993/0292i/report.pdf (last access: 22 April 2024), 1993. a, b, c, d, e, f
Hadad, K. and Mokhtari, J.: Indoor radon variations in central Iran and its geostatistical map, Atmos. Environ., 102, 220–227, 2015. a
Hastie, T., Tibshirani, R., James, G., and Witten, D.: An introduction to statistical learning, in: 2nd Edn., Springer, 102, 178–181 https://doi.org/10.1007/978-1-4614-7138-7, 2021. a
IARC: Evaluation of the carcinogenic risks to humans: Man mad Mineral Fibres and Radon, no. 43 in IARC Monographs, International Agency for Research on Cancer, Lyon, France, https://www.iaea.org/publications/10478/the-environmental-behaviour-of-radium-revised-edition (last access: 22 April 2024), 1988. a
IDEAM: Atlas Interactivo Climatológico, http://atlas.ideam.gov.co/visorAtlasClimatologico.html (last access: 22 April 2024), 2015. a
Idriss, H., Salih, I., and Elzain, A. E. A.: Environmental radon mapping in Sudan, orderly review, J. Taibah Univers. Sci., 14, 1059–1066, 2020. a
Karpińska, M., Mnich, Z., Kapala, J., and Szpak, A.: The Evaluation of Indoor Radon Exposure in Houses, Pol. J. Environ. Stud., 18, 1005–1012, 2009. a, b
Lehrer, S., Rheinstein, P., and Rosenzweig, K.: Association of Radon Background and Total Background Ionizing Radiation with Alzheimer's Disease Deaths in U.S. States, J. Alzheimer's Disease, 59, 1–5, https://doi.org/10.3233/JAD-170308, 2017. a
Li, L., Stern, R. A., Blomberg, A. J., Kang, C.-M., Wei, Y., Liu, M., Peralta, A. A., Lawrence, J., Vieira, C. L. Z., and Koutrakis, P.: Ratios between Radon Concentrations in Upstairs and Basements: A Study in the Northeastern and Midwestern United States, Environ. Sci. Technol. Lett., 9, 191–197, https://doi.org/10.1021/acs.estlett.1c00989, 2022. a, b, c, d, e
Lorenzo-González, M., Ruano-Ravina, A., Peón, J., Piñeiro, M., and Barros-Dios, J.: Residential radon in Galicia. A cross-sectional study in a radon-prone area, J. Radiolog. Protect., 37, 728–741, https://doi.org/10.1088/1361-6498/aa7922, 2017. a, b, c, d, e, f
Maestre, C. and Iribarren, V.: The Radon Gas in Underground Buildings in Clay Soils. The Plaza Balmis Shelter as a Paradigm, Int. J. Environ. Res. Publ. Health, 15, 1004, https://doi.org/10.3390/ijerph15051004, 2018. a, b
Ministerio de Minas y Energía: Resolución 18-1434, Reglamento de Protección y Seguridad Radiológica, https://www.suin-juriscol.gov.co/viewDocument.asp?id=4032693 (last access: 22 April 2024), 2002. a, b
Montoya, D. and Reyes, G.: Geología de la sabana de Bogotá, no. 28 in Publicaciones especiales del INGEOMINAS, Instituto Colombiano de Geología y Minería, Bogotá, Colombia, https://www2.sgc.gov.co/biblioteca/Documents/Biblioteca/Geologia de la sabana de bogota.pdf (last access: 22 April 2024), 2007. a
Mora-Paez, H., Díaz-Mila, F., and Cardona, L.: Mapping Land Subsidence in Bogotá, Colombia, Using the Interferometric Synthetic Aperture Radar (InSAR) Technique with TerraSAR–X Images, The Geology of Colombia, Volume 4 Quaternary, Servicio Geológico Colombiano, Publicaciones Geológicas Especiales, 38, 515–548, https://doi.org/10.32685/pub.esp.38.2019.16, 2020. a
Mullerova, M., Holý, K., Blahušiak, P., and Bulko, M.: Study of radon exhalation from the soil, J. Radioanal. Nucl. Chem., 315, 237–241, https://doi.org/10.1007/s10967-017-5657-4, 2017. a, b, c
Nijkamp, P. and Kourtit, K.: Place-Specific Corona Dashboards for Health Policy: Design and Application of a `Dutchboard', Sustainability, 14, 836, https://doi.org/10.3390/su14020836, 2022. a
Nikolaev, V. and Ilić, R.: Etched track radiometers in radon measurements: a review, Radiat. Meas., 30, 1–13, https://doi.org/10.1016/S1350-4487(98)00086-9, 1999. a
Petermann, E., Meyer, H., Nussbaum, M., and Bossew, P.: Mapping the geogenic radon potential for Germany by machine learning, Sci. Total Environ., 754, 142291, https://doi.org/10.1016/j.scitotenv.2020.142291, 2021. a
Poreh, D., Pirasteh, S., and Cabral-Cano, E.: Assessing subsidence of Mexico City from InSAR and LandSat ETM+ with CGPS and SVM, ResearchSquare, https://doi.org/10.21203/rs.3.rs-19761/v2, 2020. a
Rojas-Arias, N., Sandoval-Garzón, M., Medina-Higuera, J., Sajo-Bohus, L., and Martínez-Ovalle, S.: Seasonal variation of the S-index as it relates to the concentration of 222Rn inside a bunker that stores radioactive material, Appl. Radiat. Isotop., 162, 109173, https://doi.org/10.1016/j.apradiso.2020.109173, 2020. a, b
Ruano-Ravina, A., Aragonés, N., Kelsey, K., Pérez-Rios, M., Piñeiro, M., Lopez-Abente, G., and Barros-Dios, J.: Residential radon exposure and brain cancer: An ecological study in a radon prone area (Galicia, Spain), Sci. Rep., 7, 111372, https://doi.org/10.1038/s41598-017-03938-9, 2017. a
Salazar, S., Hincapié, W., and Garzón, G.: El gas rad'on: Una amenaza radiactiva natural, Boletín de Geología, 26, 87–93, 2004. a, b
Schubert, M., Musolff, A., and Weiss, H.: Influences of meteorological parameters on indoor radon concentrations (222Rn) excluding the effects of forced ventilation and radon exhalation from soil and building materials, J. Environ. Radioactiv., 192, 81–85, https://doi.org/10.1016/j.jenvrad.2018.06.011, 2018. a, b, c
Secretaría Distrital de Planeación: Suelos, Bogotáá D.C., https://datosabiertos.bogota.gov.co/dataset/suelos-bogota-d-c (last access: 24 April 2021), 2019. a
Servicio Geológico Colombiano: Atlas Geoquímico de Colombia, https://www.datos.gov.co/en/dataset/Atlas-Geoqu-mico-de-Colombia-V2016/n7ys-w9cf (last access: 20 November 2021), 2016. a
Thu, H. N. P., Thang, N. V., Loan, T. T. H., Dong, N. V., and Hao, L. C.: Natural radioactivity and radon emanation coefficient in the soil of Ninh Son region, Vietnam, Appl. Geochem., 104, 176–183, https://doi.org/10.1016/j.apgeochem.2019.03.019, 2019. a
Tollefsen, T., Gruber, V., Bossew, P., and De Cort, M.: Status of the European indoor radon map, Radiat. Protect. Dosimet., 145, 110–116, https://doi.org/10.1093/rpd/ncr072, 2011. a
Turner, M. C., Krewski, D., Chen, Y., Pope, C. A., Gapstur, S. M., and Thun, M. J.: Radon and COPD mortality in the American Cancer Society Cohort, Eur. Respirat. J., 39, 1113–1119, https://doi.org/10.1183/09031936.00058211, 2012. a
UAECD – Unidad Administrativa Especial de Catastro Distrital: Predios, Bogotáá D.C., https://datosabiertos.bogota.gov.co/dataset/predios-bogota (last access: 24 April 2021), 2020. a
US EPA: Radon Reference Manual, Office of Radiation Programs, Washington, D.C., USA, https://nepis.epa.gov/Exe/ZyNET (last access: 22 April 2024), 1987. a, b
Vienneau, D., Boz, S., Forlin, L., Flückiger, B., de Hoogh, K., Berlin, C., Bochud, M., Bulliard, J.-L., Zwahlen, M., and Röösli, M.: Residential radon – Comparative analysis of exposure models in Switzerland, Environ. Pollut., 271, 116356, https://doi.org/10.1016/j.envpol.2020.116356, 2021. a, b, c, d
Wei, W., Ramalho, O., Malingre, L., Sivanantham, S., Little, J. C., and Mandin, C.: Machine learning and statistical models for predicting indoor air quality, Indoor Air, 29, 704–726, https://doi.org/10.1111/ina.12580, 2019. a
WHO: Survey on Radon Guidelines, Programmes and Activities, 22–23, https://apps.who.int/iris/rest/bitstreams/1274941/retrieve (last access: 22 April 2024), 2007. a
WHO: WHO handbook on indoor radon, World health organization, Geneva, Switzerland, ISBN 9789241547673, 2009. a, b, c, d, e, f, g
World Health Organization: Global Health Observatory data repository, http://www.who.int/gho/en/ (last access: 29 November 2021), 2019. a, b
- Abstract
- Introduction
- Materials and methods
- Results and discussion
- Conclusions
- Appendix A: Data acquisition
- Appendix B: Spatial distribution of independent variables
- Appendix C: Correlation coefficients
- Appendix D: Spatial cross-validation
- Code and data availability
- Author contributions
- Competing interests
- Disclaimer
- Acknowledgements
- Financial support
- Review statement
- References