the Creative Commons Attribution 4.0 License.
the Creative Commons Attribution 4.0 License.
 | 01 Mar 2023
Sensitivity analysis of a built environment exposed to the synthetic monophasic viscous debris flow impacts with 3-D numerical simulations
Zhijian Zhang
Guoping Xiang
The characteristics of exposed built environments have a significant effect on debris flow impacts on buildings, but knowledge about their interactions is still limited. This paper presents a sensitivity analysis on the peak impact forces on a whole building resulting from the built environment parameters, including the orientation, opening scale of the target building, and azimuthal angle and distance of surrounding buildings. The impact forces were obtained from the monophasic viscous debris flow with a synthetic and simplified hydrograph using the FLOW-3D model, a computational fluid dynamics approach, verified through the physical modeling results. The results show that the surrounding buildings' properties have significant roles in determining the peak impact forces. A shielding effect or canalization effect, which reduces or increases impact forces, respectively, can be produced by changing the azimuth angle. A deflection wall for building protection is recommended according to the shielding effect. A narrowed flow path, determined by both the azimuth angle and distance, has a significant effect on the variation in impact forces. In addition, it is concluded that a splitting wedge should be designed following a criterion of avoiding the highest flow depth – the maximum approaching angle – appearing near the longest wall element. The protruding parts caused by changing the building's orientation contribute to increasing impact loads within a shielding area. A limited opening scale effect is observed on the whole building if there is sufficient time for material intrusion. The insights gained contribute to a better understanding of building vulnerability indicators and local migration design against debris flow hazard.
- Article
(11523 KB) - Full-text XML
- BibTeX
- EndNote


In mountain environments, buildings are the elements of greatest concern with regard to debris flow hazard risks (Zeng et al., 2015; Fuchs et al., 2019; Luo et al., 2020). Compared to strong structures such as railway bridges, common residential buildings are more easily damaged by debris flows (Hu et al., 2012; Huang and Tang, 2014). Furthermore, the damage to buildings has been demonstrated to contribute greatly to casualties and property loss based on a large number of catastrophic debris flow events (Tang et al., 2011; Zhang et al., 2018; Chen et al., 2021). In recent decades, the understanding, assessment, and eventual reduction in building exposure and vulnerability have been brought into focus in mountain hazard mitigation (Holub and Fuchs, 2009; Fuchs et al., 2015, 2017).
In the classical S-shaped vulnerability curves, a quantitative assessment approach based on interactions between process intensities and building damage, considerable ranges in the loss ratio were found for moderate process intensities (Fuchs et al., 2012). This is in good agreement with the fact that two buildings located exactly at the same place, despite experiencing the same process intensity, do not always suffer the same degree of loss (Papathoma-Köhle, 2016; Papathoma-Köhle et al., 2017). Process intensity is not decisive in terms of building damage, and some building characteristics of the building itself and its surroundings play critical roles in the degree of damage induced by debris flow. This understanding has also been confirmed by the spatial distribution of building damage ratios in the debris flow torrents of the Austrian Alps (Fuchs et al., 2012).
Currently, the characteristics of an exposed building, including the orientation, openings and surrounding environments, have been reported to be important to the impact forces of torrential hazards (Jakob et al., 2012; Sturm et al., 2018a). As far as building orientation is concerned, it is commonly recommended to individually analyze wall elements of different orientations. It is widely accepted that walls with faces perpendicular to the stream are generally exposed to higher dynamic pressures due to the larger effective contact area (Mead et al., 2017; Manawasekara et al., 2016). However, limited studies to date have examined the impact performance of a whole building. In terms of building openings such as windows, doors and light shafts, it is well established that the impact forces on the building envelope tend to decrease once the flow penetrates openings (Mazzorana et al., 2014; Gems et al., 2016). However, this process is regarded to be at the expense of greater building loss due to the higher impact forces on interior walls and greater indoor property losses (Totschnig et al., 2011; Mead et al., 2017). Recent developments regarding the surroundings of built environments have attracted much attention. The existence of surrounding buildings definitely reduces the impact forces on a particular building due to the deflection of the flow and the shielding of the element at risk; however, this may also increase the impact forces by redirecting or canalizing the flow and forcing the flow to impact the building (Gao et al., 2017; Sturm et al., 2018b). Therefore, it remains difficult to make a general statement regarding whether the effect of surrounding buildings is negative or positive (Sturm et al., 2018a).
Although considerable efforts have been devoted to the relationships between building characteristics and debris flow impacts, only some simple trends, rather than quantitative results about the effects of factors, have been determined. Knowledge regarding the interactions between the built environment parameters and impact loads is still limited, and considerable research gaps still exist regarding (1) the identification of the built environment parameters with the greatest influence on debris flow impacts, (2) detailed explanations of each built environment factor and (3) the interrelations between these parameters.
Because field measurement of debris flow impacts is nearly impossible, laboratory experiments and numerical modeling are regarded as feasible alternatives for capturing interactions, and they may provide insights into the impact of debris flows in the interior and against the exterior of buildings (Gems et al., 2016; Papathoma-Köhle, 2016). In this study, a sensitivity analysis was conducted based on 3-D numerical simulation, and the effects of various built environment factors on the impact forces of debris flows were quantitatively analyzed and compared. Debris flow numerical simulations were conducted using the FLOW-3D model, a commercial computational fluid dynamics (CFD) program. Kim et al. (2021) conducted a sensitivity analysis of five parameters for fine sediment trapping and energy reduction with a debris flow slit-type barrier via a FLOW-3D numerical model and metamodels. These kinds of methods offer opportunities for performing a sensitivity analysis with limited data (Kim et al., 2019, 2021). These results can be applied to determine the indicators and to improve weightings for reliable building vulnerability assessment and to enhance the knowledge about built environment improvement and local migration design.
In the following, the reliability of the numerical model was first confirmed by comparison with a physical dam-break experiment. A sensitivity analysis was then performed using metamodels and global sensitivity analysis (GSA). The built environment parameters considered in this study were the orientation (Or) and opening scale (Op) of the target building and the azimuthal angle (A) and distance (D) of the surrounding buildings. Finally, the effects of each parameter and their interactions on the peak impact forces of the overall building were explained in detail.
2.1 Model description
The identification of complex geometry and 3-D flow tracking are the key steps in the process-response simulation between buildings and debris flows. However, the current numerical codes used for debris flow simulations consider the flow depth to be small relative to the tangential length scale and simplify this factor to represent shallow water flow. They have only second-order accuracy in space, as the effects of complex 3-D topography and the vertical mobility of debris flows are not considered (Y. Zhang et al., 2021). To avoid the abovementioned limitations, it is necessary to use an efficient 3-D numerical approach to accurately capture the debris flow behaviors considering the influences of building geometry.
FLOW-3D, a 3-D finite-volume-based CFD model, is considered one of the most efficient tools for predicting hydraulic phenomena with strong turbulent components and inconsistent free water surfaces. FLOW-3D was designed to address the Reynolds-averaged Navier–Stokes equations (RANS) (Jones and Launder, 1972), implementing the volume of fluid (VOF) methods (Hirt and Nichols, 1981) and fractional area–volume obstacle representation (FAVOR) (Hirt and Sicilian, 1985). The advanced TruVOF method can be used to precisely track the 3-D transient free fluid surface. Its unique FAVOR mesh processing technology can define independent and complex geometry within the structured mesh and avoid the shortcomings of the traditional finite difference method in complex boundary fitting (Y. Zhang et al., 2021). The FAVOR processor can generate area fractions for each cell face in the grid by determining which corners of the face are inside of a defined geometry and incorporate geometry effects into the governing equations. As a result of a robust capacity to deal with the data in both the fluid and solid phases, the FLOW-3D code is considered to be appropriate for analyzing the interactions between debris flows and exposed buildings.
In this study, the renormalized group (RNG) model-based k-ε turbulence model and the general moving objects (GMO) model are applied to build a fluid–solid-coupled model of the debris flow impact. The RNG k-ε model is a modification of the standard k-ε model, which takes the turbulent vortex into account and provides an analytic formula for the Prandtl number, as well as an analytic formula for low Reynolds number flow viscosity (Franco et al., 2021). These features make the RNG model more reliable and accurate for a broader flow than the standard k-ε model (Yin et al., 2015). In recent years, the RNG model has been applied in simulations of landslide surges (Yin et al., 2015; Hu et al., 2020), the entrainment effects of debris avalanches (Hu et al., 2019), dam-break floods (Zhuang et al., 2020) and the runout characteristics of debris flows (Y. Zhang et al., 2021), with good results.
The turbulent kinetic energy and the turbulence dissipation balance equations of the RNG k-ε model in FLOW-3D are as following:
where kT is the turbulent kinetic energy; VF is the fractional volume open to flow; and Ax, Ay and Az are the fractional area open to flow in the x, y and z directions, respectively. PT is the turbulent kinetic energy production term, GT is the buoyancy production term, Diff is the diffusion term, and εT is the turbulence dissipation term. In the RNG model of FLOW-3D, CDIS1 and CDIS3 are dimensionless user-adjustable parameters that have defaults of 1.42 and 0.2, respectively, and CDIS2 is determined from kT and PT (Flow Science, Inc., 2014).
In this study, a series of debris flow simulations based on the RNG model with various building characteristics were executed. From the characteristics of the RNG k-ε model, the type of debris flow involved in this study was determined as mudflow or viscous debris flow, in which a single-phase fluid was assumed and solid particles were treated as suspension and mixed with the fluid phase well. The division between solid and fluid was assumed to be difficult; therefore, the granular deposition was not considered in this study.
With the help of the GMO model in FLOW-3D, the combined hydraulic force due to normal pressure and shear stress can be calculated in the space system. The normal pressure and shear force of an impacted object in x, y and z directions can be gained at each time step. Due to the complex geometry and variable built environments, the impacted elements of target building were changing in the different scenarios. In this study, therefore, the target building was treated as a whole bearing structure to keep consistency of analysis. All over the grids covering building surface would be calculated when contacting with the flow. The GMO model can simulate the rigid body motion, which is either user prescribed or dynamically coupled with fluid flow. In this study, the target building and surrounding buildings were all prescribed to be the fixed and nondeformable rigid models. The raw impact force data were collected at an interval of 0.001 s from the numerical code and averaged manually over 10 points (0.01 s) to reduce uncertainty (Song et al., 2021).
2.2 Model validation
The interaction between a dam break and the structure has become a classic benchmark for the validation of fluid–structure interaction (Liu et al., 2021). The accuracy of the model will be validated by means of the experimental setup previously used in Gomez-Gesteira and Dalrymple (2004). This experiment has been referred to as a “bore in a box”, where it was a dam-break and structure-impact problem confined within a rectangular box. The geometric dimensions of the experimental model are shown in Fig. 1. The rectangular tank is 1.60 m long, 0.61 m wide and 0.75 m high. The tank is considered to be a smooth surface, and its surface roughness (k) is set to 0 m (Liu et al., 2021). The volume of water initially contained behind a thin gate at one end of the box is 0.4 m long, 0.61 m wide and 0.3 m high. An initial layer of water (approximately 1 cm deep) existed on the bottom of the tank. The obstacle, which is 0.12 m × 0.12 m × 0.75 m in size, is placed 0.5 m downstream of the gate and 0.24 m from the nearest sidewall of the tank. The surface roughness of the obstacle is not determined. Therefore, ko (0, 0.001, 0.002 or 0.003 m) is selected for sensitivity analysis to determine if this parameter could reasonably reflect the macromechanical behaviors of the dam-break test. The time history of the impact force on the structure was measured with a load cell.
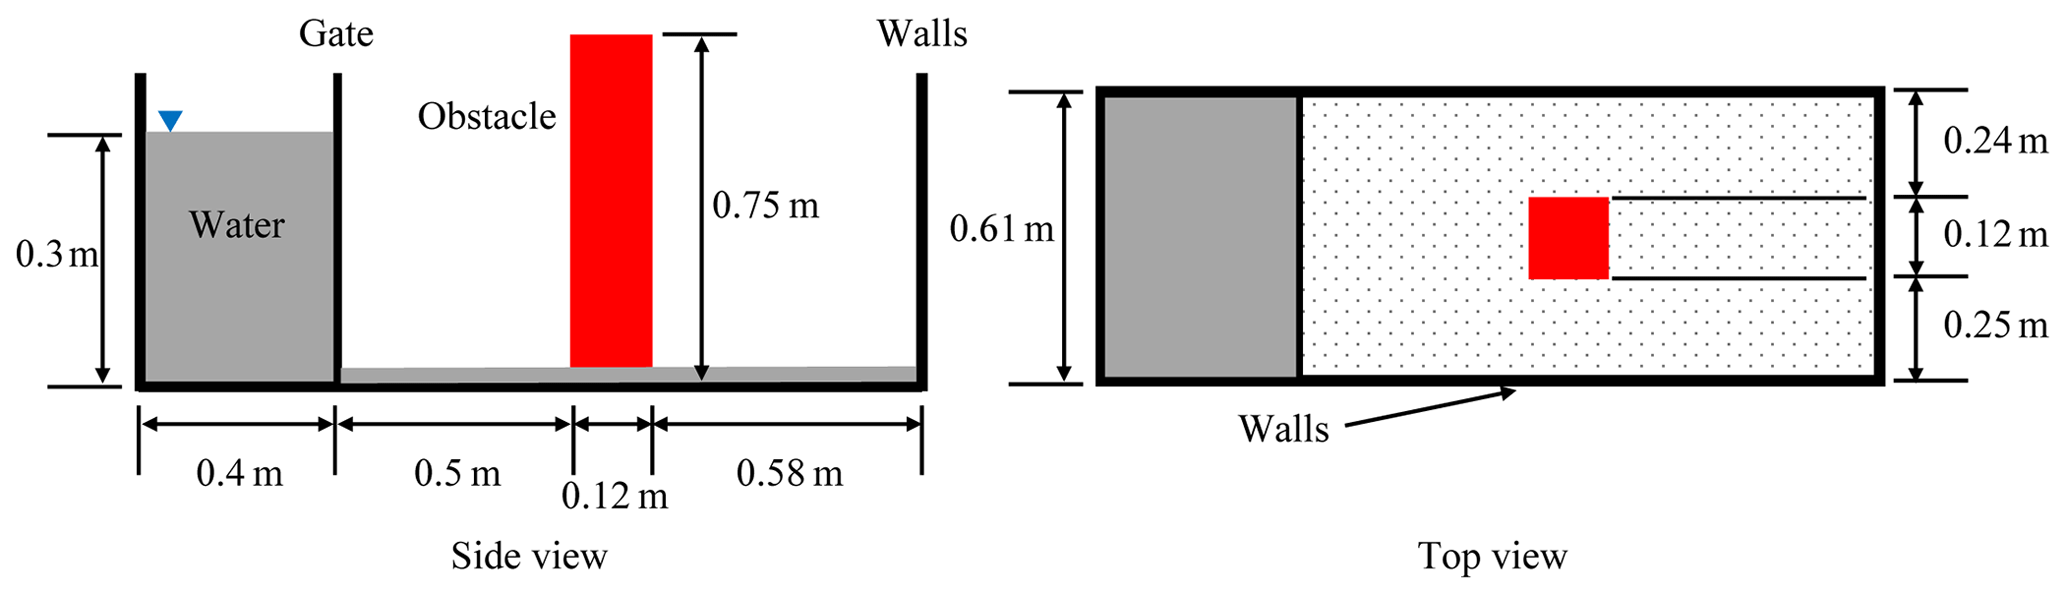
In the numerical simulation, the analysis domain was discretized into a grid with a cell size of 0.01 m, which was equal to a cube with a 0.01 m side in a 3-D model. The fluid properties were set to be the density of 1000 kg m−3 and viscosity of 0.001 Pa s. The motion of fluid was computed by means of the RNG k-ε model in FLOW-3D. The obstacle and gate were controlled by the GMO module; specifically this obstacle was set as a fixed and nondeformable rigid body, and the gate was prescribed to be lifted 0.3 m along the z+ direction. The time history of impact forces and the corresponding dynamic processes were selected to validate the accuracy of the numerical simulation. The direction of the force was considered positive when exerted in the y+ direction.

Figure 2The dam-break simulation (a) comparison between numerical (dotted lines) and experimental values (red line) of the force exerted on the structure. (b) Wave evolution: (t = 0.32 s) the wave is colliding with the front of the obstacle; (t = 0.58 s) the wave is wrapping around the structure, colliding together and continues moving toward the tank wall; and (t = 1.44 s) the reflected wave is hitting the back of the obstacle.
Figure 2a shows the general agreement of numerical forces obtained by means of the RNG and GMO coupled model with experimental data, particularly the positions of both peaks, which correspond to the wave hitting the front and the back of the structure and were reasonably reproduced by the numerical model. This indicates that the impact force has a very low sensitivity to ko; this study does not pay too much attention to the value of this parameter, and the surface roughness (k) of all the impacted objects in the numerical simulation is set to 0 m. Figure 2b shows the evolution of the wave generated by the dam break and the initial layer of water on the bottom. At t = 0.32 s, the wave is colliding with the front of the obstacle. At t = 0.58 s, the wave is wrapping around the structure, colliding together and continues moving toward the tank wall. At t = 1.44 s, the reflected wave is hitting the back of the obstacle.
2.3 Numerical model setup
As shown in Fig. 3, a depositional fan model with a length of 120 m, width of 120 m and monogradient of 5∘ was numerically constructed. This deposition fan was treated as a rigid bed model; therefore, the bed material scour would not happen in this study. To sum up, the bed variation induced by sediment transport processes, including sediment deposition and bed scour, was not considered. The surface roughness (k) of 0.05 m was set, meaning that the deposition fan surface was roughened with 5 cm diameter particles, for the representation of the natural environment surrounding mountainous buildings.
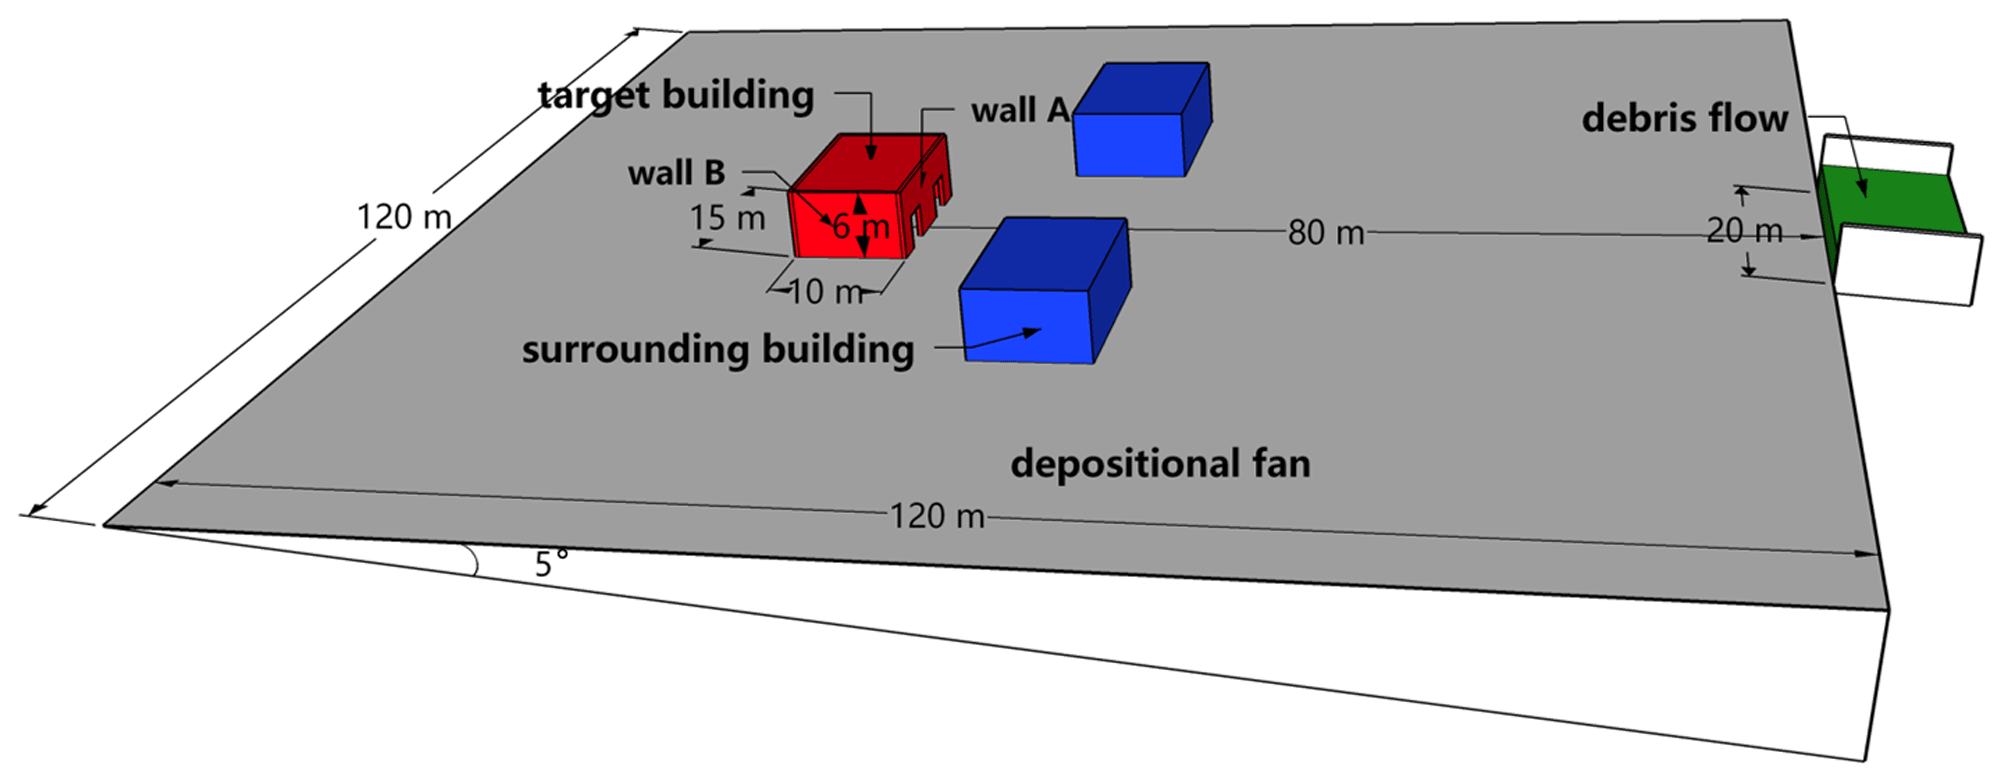
Figure 3Overview of the components of a 3-D deposition fan model for debris flow impact simulation on buildings.
The realistic debris flow inflow discharge and duration are essential for a truthful analysis of impact forces. A 3-D numerical simulation with a realistic hydrograph, however, needs a large amount of computer memory and processing time. It is difficult to accept in the sensitivity analysis, in which the sufficient experimental groups are required. In this study, a synthetic and simplified inflow hydrograph was set at the top center of the deposition fan. Specifically, the debris flow discharge was fixed as 500 m3 s−1, which can be of some interest for a large magnitude of debris flow, and the inflow duration was limited to 5 s. The inflow cross section was rectangular, with a channel base width of 20 m, flow depth of 2.5 m, inclination angle of 5∘ and an initial velocity of 10 m s−1. In consideration of the distance between the inflow cross section and target building, a computation time of 15 s, triple the inflow duration, was set for the FLOW-3D modeling, to ensure all the debris flow can flow through the target building. The peak impact force was treated as the maximum value in a relatively complete impact process. In order to compare with some realistic building damage cases, for example the Qipan gully and Zhouqu debris flows in the west of China, the rheological properties of the numerical model was set as the viscous debris flow. Therefore, the debris flow density was set as 2000 kg m−3 and viscosity was empirically 1.0 Pa s (Takahashi, 2007).
The target and surrounding building models, with a length of 15 m, width of 10 m, height of 6 m (equal to two floors) and wall thickness of 0.35 m, were designed in accordance with representative buildings in the mountainous areas of western China. To maintain a balance between the computational accuracy and time cost, the whole computation domain was discretized at intervals of 0.5 m. The planar center of the target building was set at 80 m downstream of the debris flow inflow, as shown in Fig. 3. The embedded domain of the target building should be refined further following two principles: (1) its cell size must be less than the wall thickness of 0.35 m. This is because it is possible that the wall geometry may intersect a cell face more than once in the case of the building rotating, and the corresponding cell edge is assumed to be either fully inside the object or fully outside; some lacks of wall surface will be produced. (2) The boundaries of the embedded and external meshes must be overlapped for the computation stability, that is, the external cell size is a multiple of embedded cell size. To sum up, the cell size of the target building domain was determined as 0.25 m. The total number of computational cells was 1 645 600, and the computer memory of a single simulation was about 20 GB.
Because the sensitivity analysis requires extensive simulation results to consider the combinations of all the factors, the representative factors that could be adjusted in the FLOW-3D simulation were chosen (Kim et al., 2021). The orientation (Or) and opening scale (Op) of the target building and the azimuthal angle (A) and distance (D) of the surrounding buildings with respect to the target building were considered to be the key built environment parameters for debris flow impact loads.
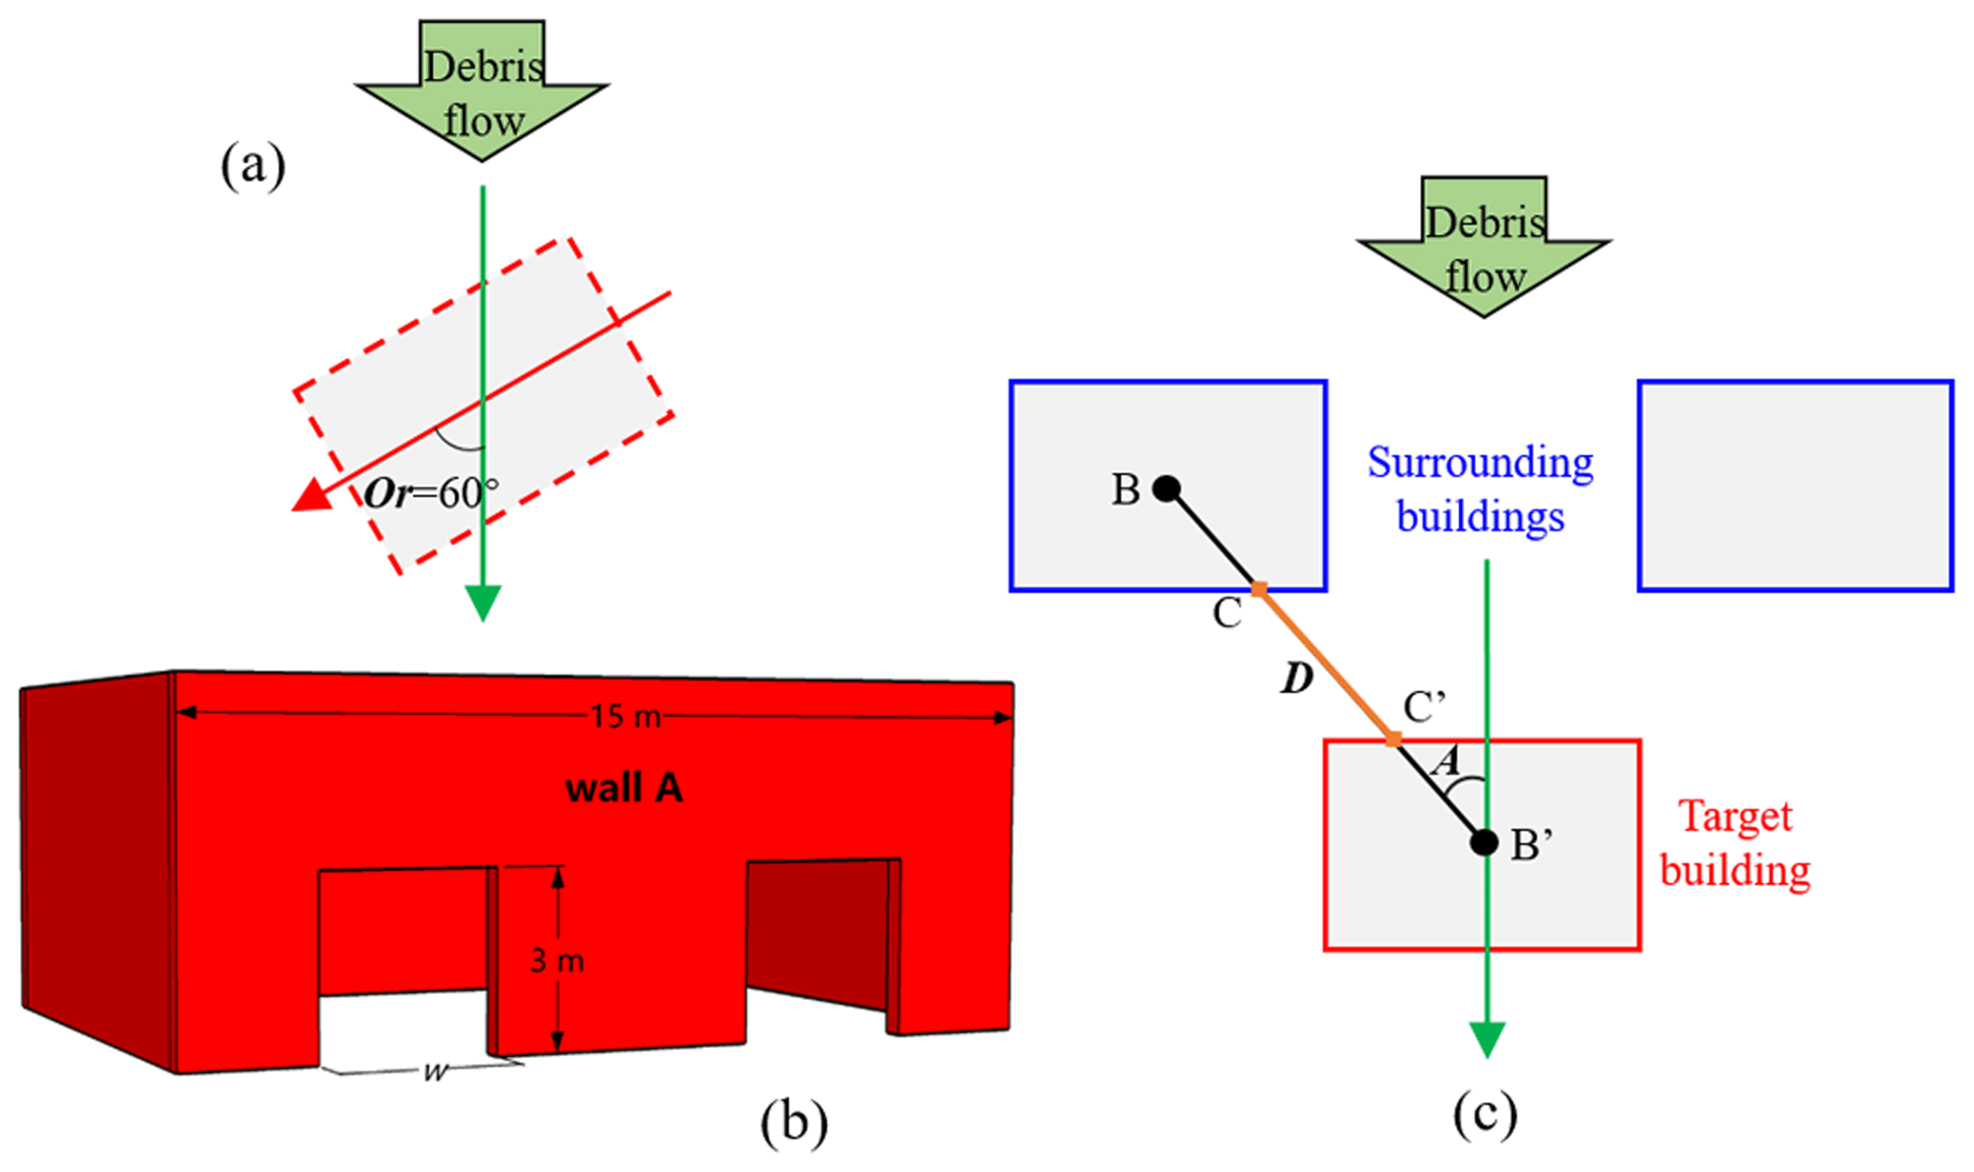
Figure 4The schematic drawings of the target building and surrounding buildings: (a) orientation of target building (Or), (b) opening scale of the target building (Op), and (c) azimuth angle (A) and distance (D) of surrounding building with respect to the target building.
In this study, the orientation (Or) of the target building was defined as the angle between the building's long axis and the debris flow's main flow path, as shown in red and green in Fig. 4a, and ranged from 0 to 90∘. An orientation of 0∘ meant that the long axis of the building was parallel to the debris flow path, and the perpendicular case was represented by an orientation of 90∘. As far as building openings are concerned, it is well known that several features of openings are of great importance in terms of building damage, such as which wall they are located on and their size, height and structure (Gems et al., 2016; Faisal et al., 2018; Papathoma-Köhle et al., 2019). However, it remains challenging to analyze these parameters with a single model. In this study, the size of the opening was only selected to be analyzed to reduce computing costs. As shown in Fig. 4b, two symmetrical openings with a constant height of 3 m were placed in wall A. Therefore, the opening scale (Op) was defined as the proportion of the total opening width (double w) to the length of wall A.
The azimuthal angle (A) of the surrounding buildings was defined as the angle between the line of the geometric center of buildings (e.g., line B–B' in Fig. 4c) and the main flow path (green line in Fig. 4c). There were no surrounding buildings downstream of the target building. Except for the scenario of an azimuthal angle of 0∘, two surrounding buildings were placed symmetrically on both sides of the target building. The distance (D) between the surrounding building and target building was defined as the straight-line distance between two points located on the overlap between the line of the buildings' geometric centers and building envelope, as shown by the orange line C–C' in Fig. 4c.
3.1 Metamodel modeling
Abundant simulation results are required for assessing the effect of built environment parameters on the debris flow impact force. Due to the considerable time consumed and computational cost, a mathematical metamodel was constructed using a small fraction of the simulation results. A metamodel, referred to as a surrogate model, is a “model of a model”, a simplified model of an actual model using mathematical construction. Numerous accurate simulation results can be generated based on the metamodel relation or algorithm between input and output (Booker et al., 1999; Hoffman et al., 2003). Of the various metamodel modeling methods, the Kriging model – or Gaussian process (GP) – is considered to be the most suitable for the unbiased prediction of a deterministic model and is also fitted to simulation I/O data obtained for global experimental areas (Kleijnen, 2016). In this study, the GP was selected and executed through JMP® Pro 16.0.0, a commercial statistical software designed by the SAS Institute Inc.
Table 1Simulation conditions.
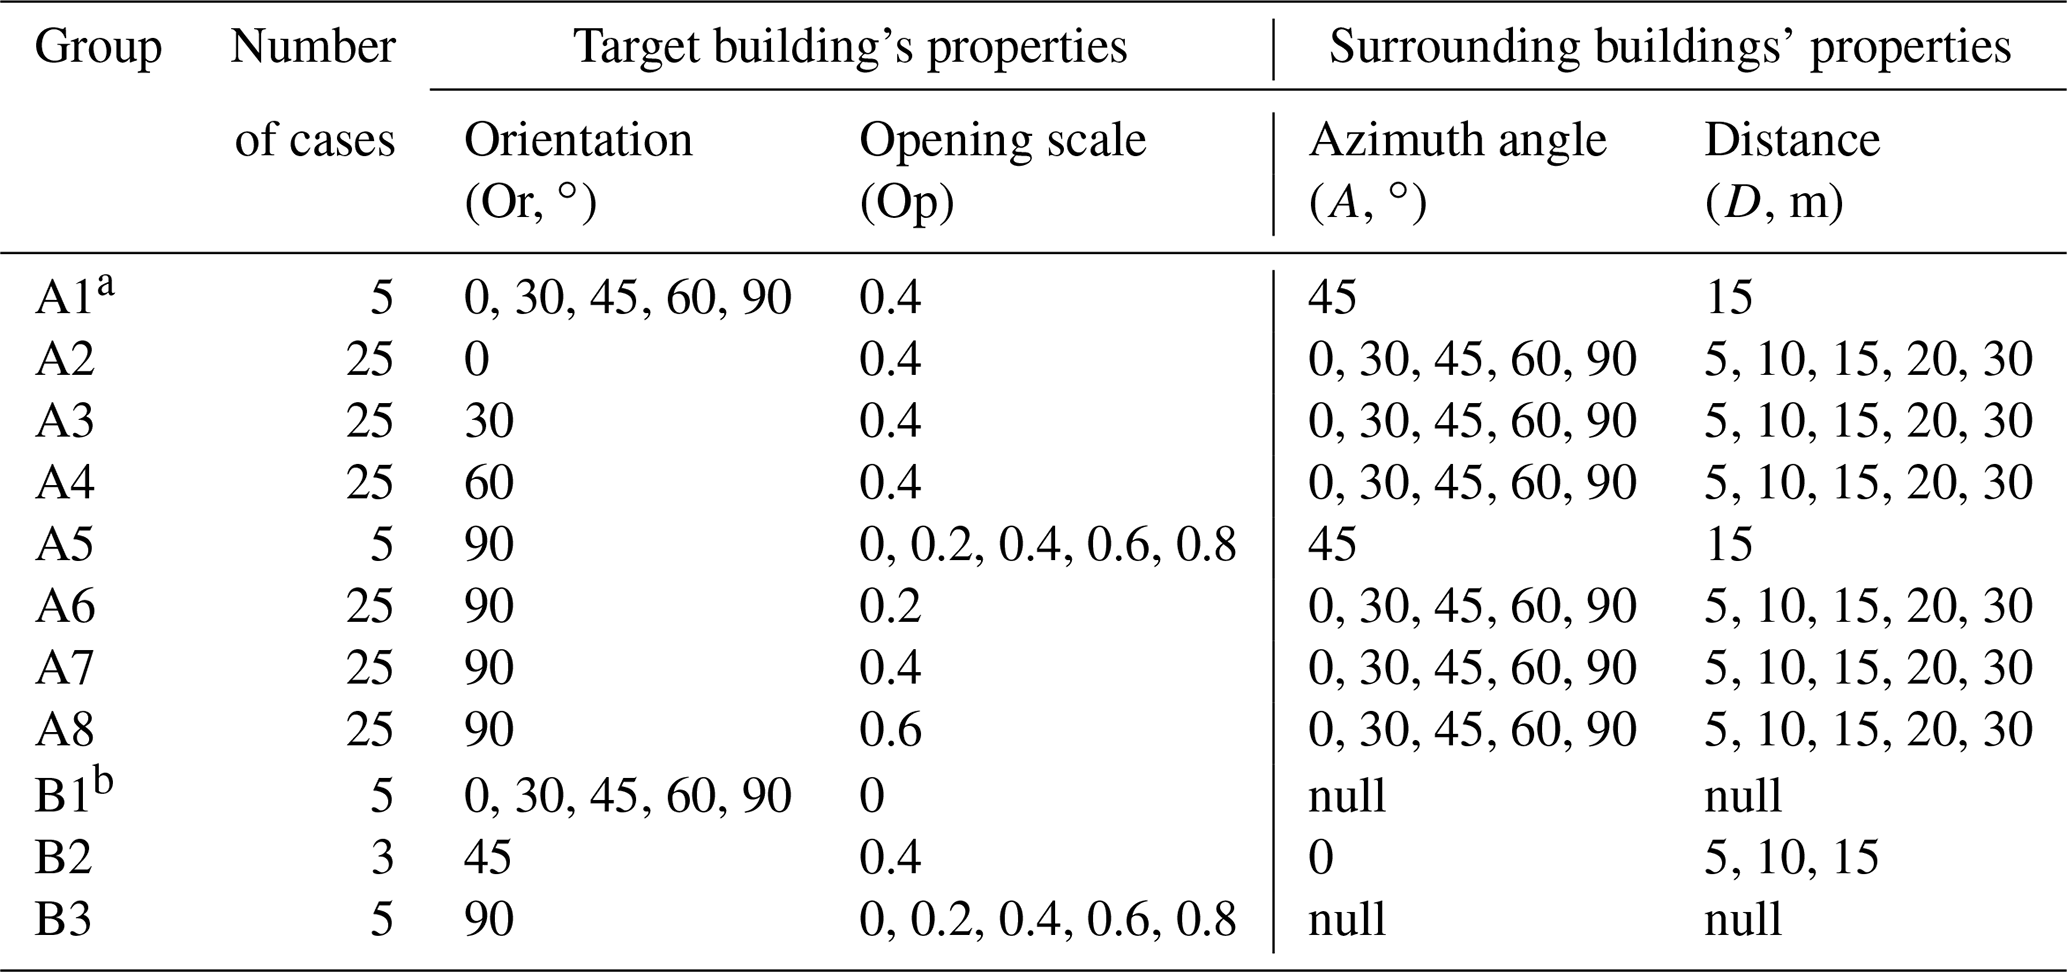
a Simulation group “A” was designed for the metamodel modeling. b Simulation group “B” was designed for the detailed interpretations of sensitivity analysis results.
In this study, the metamodels representing the objective function were created using the 160 samples shown in Table 1. In the metamodel modeling, the variation range of the orientation (Or) was from 0 to 90∘, the opening scale (Op) was from 0 to 0.8∘, the azimuthal angle (A) was from 0 to 90∘ and the distance (D) was from 5 to 30 m. The coefficient of determination (R2) of regression analysis in the GP model was 0.88. At this accuracy, a total of 10 000 new simulation results were obtained from random values in the specified ranges of the four input variables for use in the subsequent sensitivity analysis.
3.2 Sensitivity analysis
Sensitivity analysis aims to understand the relative importance of uncertain input variables to the model response (J. Zhang et al., 2021). As opposed to local sensitivity analysis, GSA can be performed by an all-at-a-time method, where output variations are induced by varying all input factors simultaneously, and thus, the sensitivity of each factor considers the direct influence of the factor, as well as the joint influence caused by the factor interactions (Kim et al., 2019). GSA allows a ranking among the input parameters to be established according to their influence on the variability of the output. In this study, GSA was conducted to simultaneously consider both the main and interaction effects of input parameters on debris flow impact. A variance-based GSA (VBSA), also referred to as Sobol's indices, is usually recommended. This method is applicable over the whole space of random input data and can also deal with nonlinear responses and measure the effect of interactions in nonadditive systems (Saltelli et al., 2010). The basic principle of Sobol's indices is that the variance of model output is decomposed into fractions within a probabilistic framework that can be attributed to inputs and sets of inputs (Sobol, 1993):
where the partial variances are calculated as follows:
Sobol's indices are defined as the relative contribution of the partial variances to the total variance following the decomposition in Eq. (1):
such that
where the index Si measures the separate contribution of each variable xi to the output variance without interaction with any other inputs; hence, Si is commonly referred to as the first-order effect index or the main effect index. The higher-order indices in Eq. (4) measure the interactive contribution to the total variance. Using Si, Sij and higher-order indices, we can therefore infer the impacts of each input variable and the interaction of variables on the output variance (J. Zhang et al., 2021). In this study, only the second-order effect index, reflecting the interaction between every two factors, was considered. The total contribution of variable i is as follows:
which measures the contributions of variable xi and its interactions to the output variance. If the input xi has a , then it contributes 50 % of the overall variance of output. In Sobol's sensitivity analysis, the input factors with a sensitivity index below 0.01 are usually considered noninfluential to the output (Sarrazin et al., 2016). Unlike the first-order indices,
because the interaction effect between, for example, xi and xj is included in both and . The sum of is equal to 1 if and only if the model is purely additive without any interaction effects.
In this study, Sobol's global sensitivity indices were calculated using the SobolGSA model, a general purpose GUI-driven GSA software developed by Kucherenko and Zaccheus (2023; https://www.imperial.ac.uk/process-systems-engineering/research/free-software/sobolgsa-software/, last access: 23 February 2023). SobolGSA evaluates the effect of a factor while all other factors are varied as well, and thus, it accounts for interactions between variables and does not depend on the choice of a nominal point like local sensitivity analysis methods. The set of available GSA techniques includes screening method- (the Morris measure), variance- (Sobol's indices, FAST) and derivative-based sensitivity measures. All techniques implemented in SobolGSA make use of either quasi-Monte Carlo sampling based on Sobol's sequences or standard Monte Carlo sampling (Sobol et al., 2011; Kucherenko et al., 2015).
4.1 Results of global sensitivity analysis
Global sensitivity indices and total sensitivity indices for debris flow impacts are listed in Table 2, and the main and total effects of each parameter are expressed in Fig. 5. From the main effect indices, the peak impact force is most sensitive to the azimuth angle, with a maximum value of 0.6303, which represents 63.03 % of the overall variance in the debris flow peak impact loads. The most influential second-order effect index, with a value of 0.1842, was obtained for the interaction between the azimuth angle and the distance of the surrounding buildings. This result also highlights the importance of the surrounding buildings' azimuth angle to the debris flow impact over the distance's main effect index of 0.0095. The sums of all main effect and second-order effect indices are 0.7648 and 0.2352, respectively, indicating that single built environment parameters have a more significant effect on the debris flow impact on a building.
Table 2Global sensitivity indices and total sensitivity indices. The values in bold font are the maximum main effect and second-order effect indices.
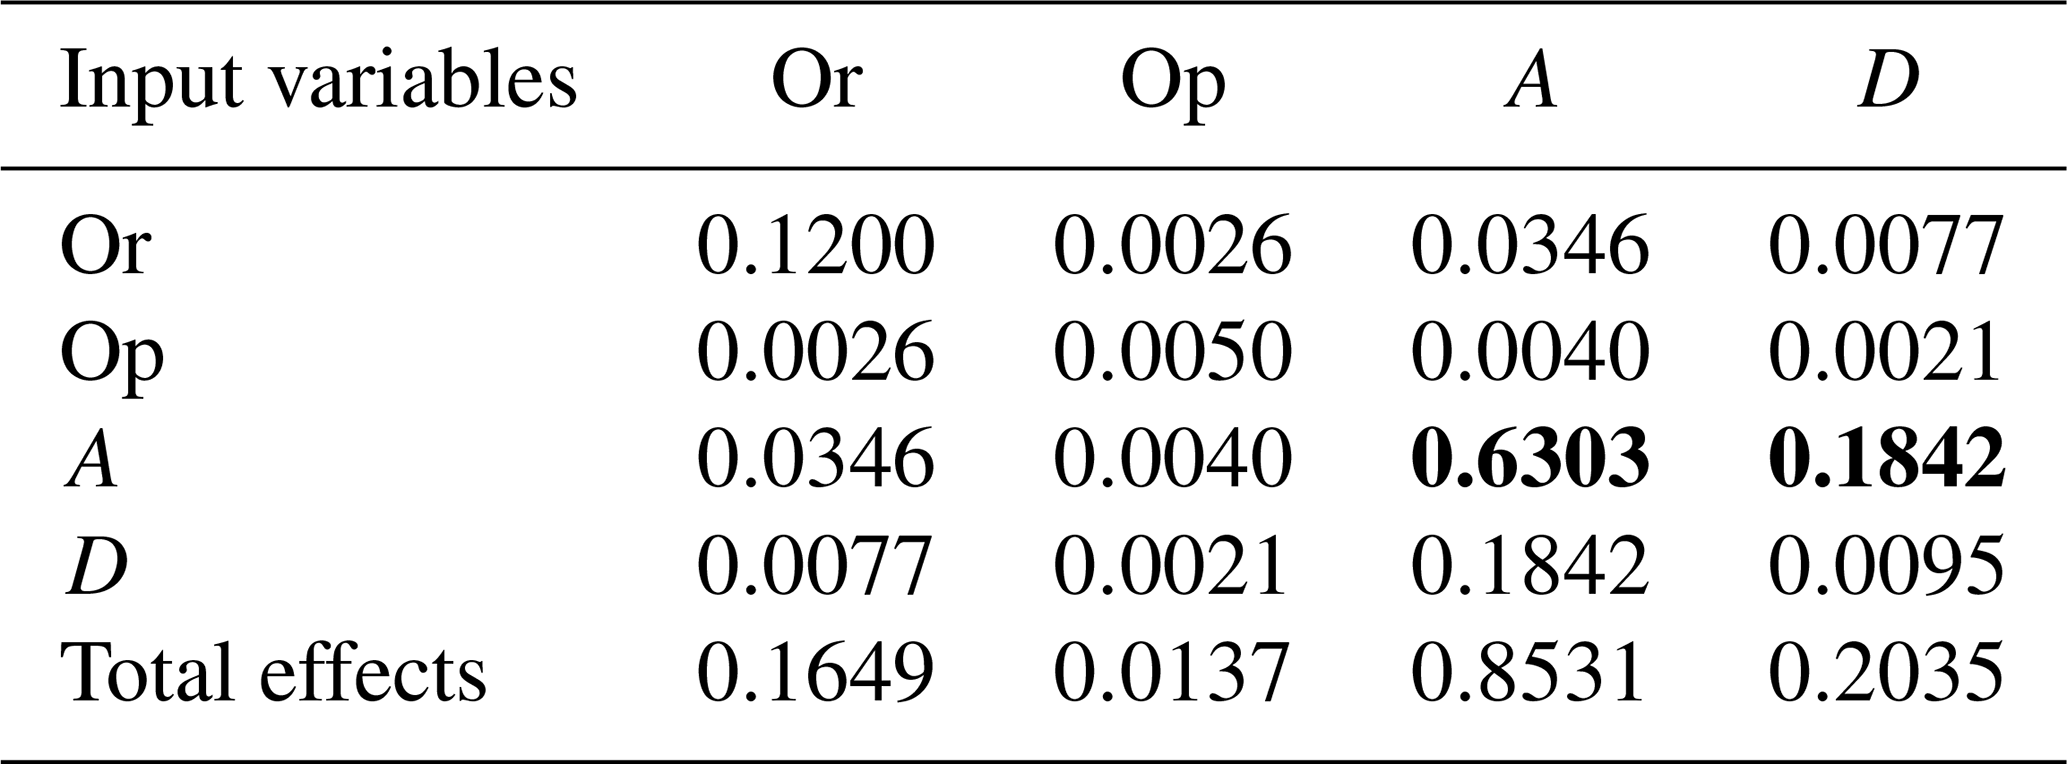
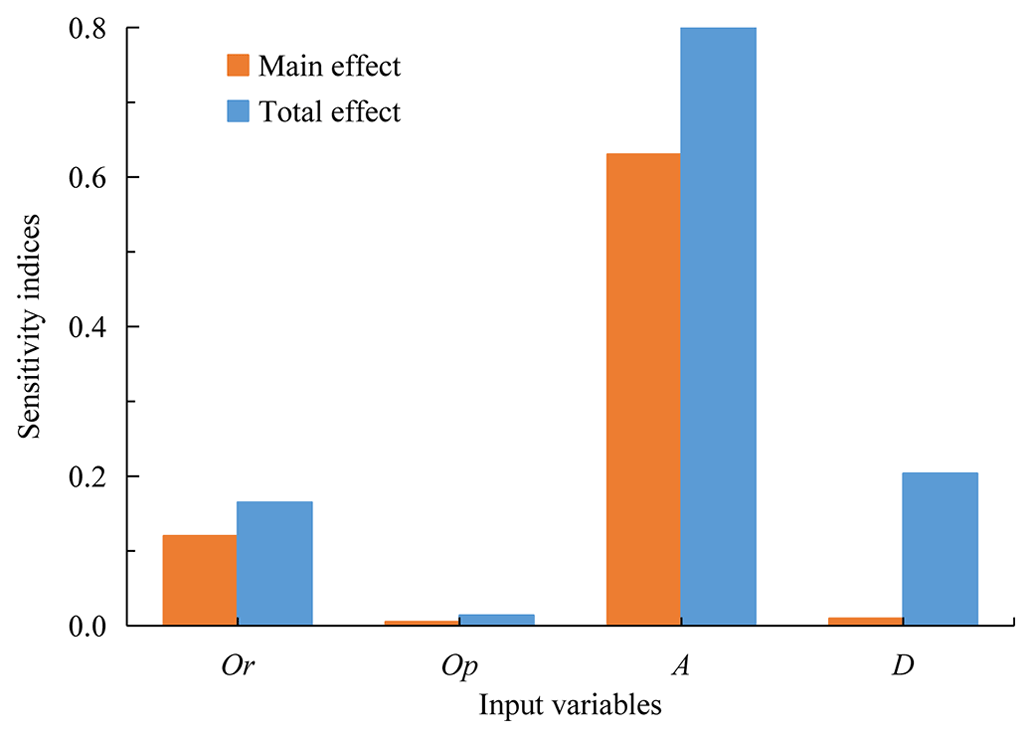
From the total effect indices, on the other hand, the importance of the built environment parameters to the debris flow impact responses is ranked as follows: azimuth angle (A) > distance (D) > orientation (Or) > opening scale (Op), and their total effect indices are 0.8531, 0.2035, 0.1649 and 0.0137, respectively. The sum of the main effects of the target building's properties (Or + Op) is 0.1786 and that of the surrounding buildings' properties (A + D) is 1.0566, indicating that the surrounding buildings' properties are more significant than the target building's properties on the peak impact forces.
Finally, it is concluded that the azimuth angle and distance of the surrounding buildings and the target building's orientation are the key factors and must be carefully considered in the assessment of building vulnerability to debris flow impacts. It is highly recommended to further study the effect of the surrounding buildings' azimuth angles. Although the scale of building openings indeed has a nonsignificant effect on debris flow impacts in this study, the other features of building openings, such as their location, height and structure, should be discussed in more depth.
4.2 Effect of the surrounding buildings' azimuthal angles
As shown in Fig. 6, the peak impact forces of the debris flow change with the increasing azimuth angles in the simulation scenarios at an orientation of 90∘, an opening scale of 0.4 and a distance of 5 m (Or90-Op0.4-Ax-D5, where x represents a variable). The variations in the peak impact forces are calculated with the background value of 3717 kN from the scenario with an orientation of 90∘, opening scale of 0.4 and no surrounding buildings (Or90-Op0.4-Anull-Dnull, where null means the value is not relevant). The azimuth angles have different kinds of effects on debris flow impacts, as shown in the different colored zones in Fig. 6:
-
Shielding effect. In the cases of azimuth angles of 0∘ (Or90-Op0.4-A0-D5) and 30∘ (Or90-Op0.4-A30-D5), the peak impact forces are only 796 and 1193 kN, and the corresponding variations (ΔF) are −78.58 % and −67.90 %, respectively, which are located in the blue shielding effect region (ΔF < −10 %) in Fig. 6. It is indicated that the target building is protected effectively in a shielding area produced by the surrounding buildings. This result is consistent with previous case studies wherein some representative catastrophic debris flow events were observed. In the Zhouqu debris flow event shown in Fig. 7, which occurred in the province of Gansu in northwestern China, on 7 August 2010, building B, next to the extensively damaged building A, suffered no damage apart from its first story being buried (Hu et al., 2012). Similarly, in the Qipan gully debris flow case (Zeng et al., 2015), which occurred in the city of Wenchuan in southwestern China during rainstorms on 11 July 2013, building B, shielding protected from the completely damaged building A, was exposed to only slight damage, as shown in region I of Fig. 8. As shown in Fig. 9, a deflection wall was designed following the principles of the shielding effect and can be repeatedly used to protect an entire building ensemble from gravitational mass movements, such as the snow avalanches, in the mountain areas of Austria (Holub et al., 2012). This design of local protection can provide an effective reference for debris flow mitigation.
-
Canalization effect. As reported by Sturm et al. (2018a) through flume tests, the existence of surrounding buildings may narrow the flow path and even redirect debris flows, leading to an increasing process intensity toward other buildings (Gao et al., 2017). In these numerical simulations, the azimuth angle of 45∘ (Or90-Op0.4-A45-D5) has the most significant canalization effect on the target building and produces the steepest rise in the peak impact force, with 29.14 % growth to a maximum value of 4800 kN, as shown in the orange region (ΔF > 10 %) of Fig. 6. As shown in region IV of Fig. 8, building I was exposed to extensive damage in the Qipan gully debris flow partly because of the canalization effect induced by surrounding building J.
-
Noneffect. The peak impact forces in the cases of azimuth angles of 60∘ (Or90-Op0.4-A60-D5) and 90∘ (Or90-Op0.4-A90-D5) are 3584 and 3725 kN, respectively, close to the background value (3717 kN), and the corresponding variations are also close to 0, located in the green region (−10 % ≤ ΔF ≤ 10 %) of Fig. 6. This indicates that there are very small or even negligible effects on the impact loads of the target building. It is important to highlight that the shielding effect has the greatest influence on debris flow impact loads, because this effect yields the maximum variation in peak impact forces.

Figure 6Variations of peak impact forces with increasing azimuth angles in the scenarios of the orientation of 90∘ and the opening scale of 0.4 and distance of 5 m (Or90-Op0.4-Ax-D5).
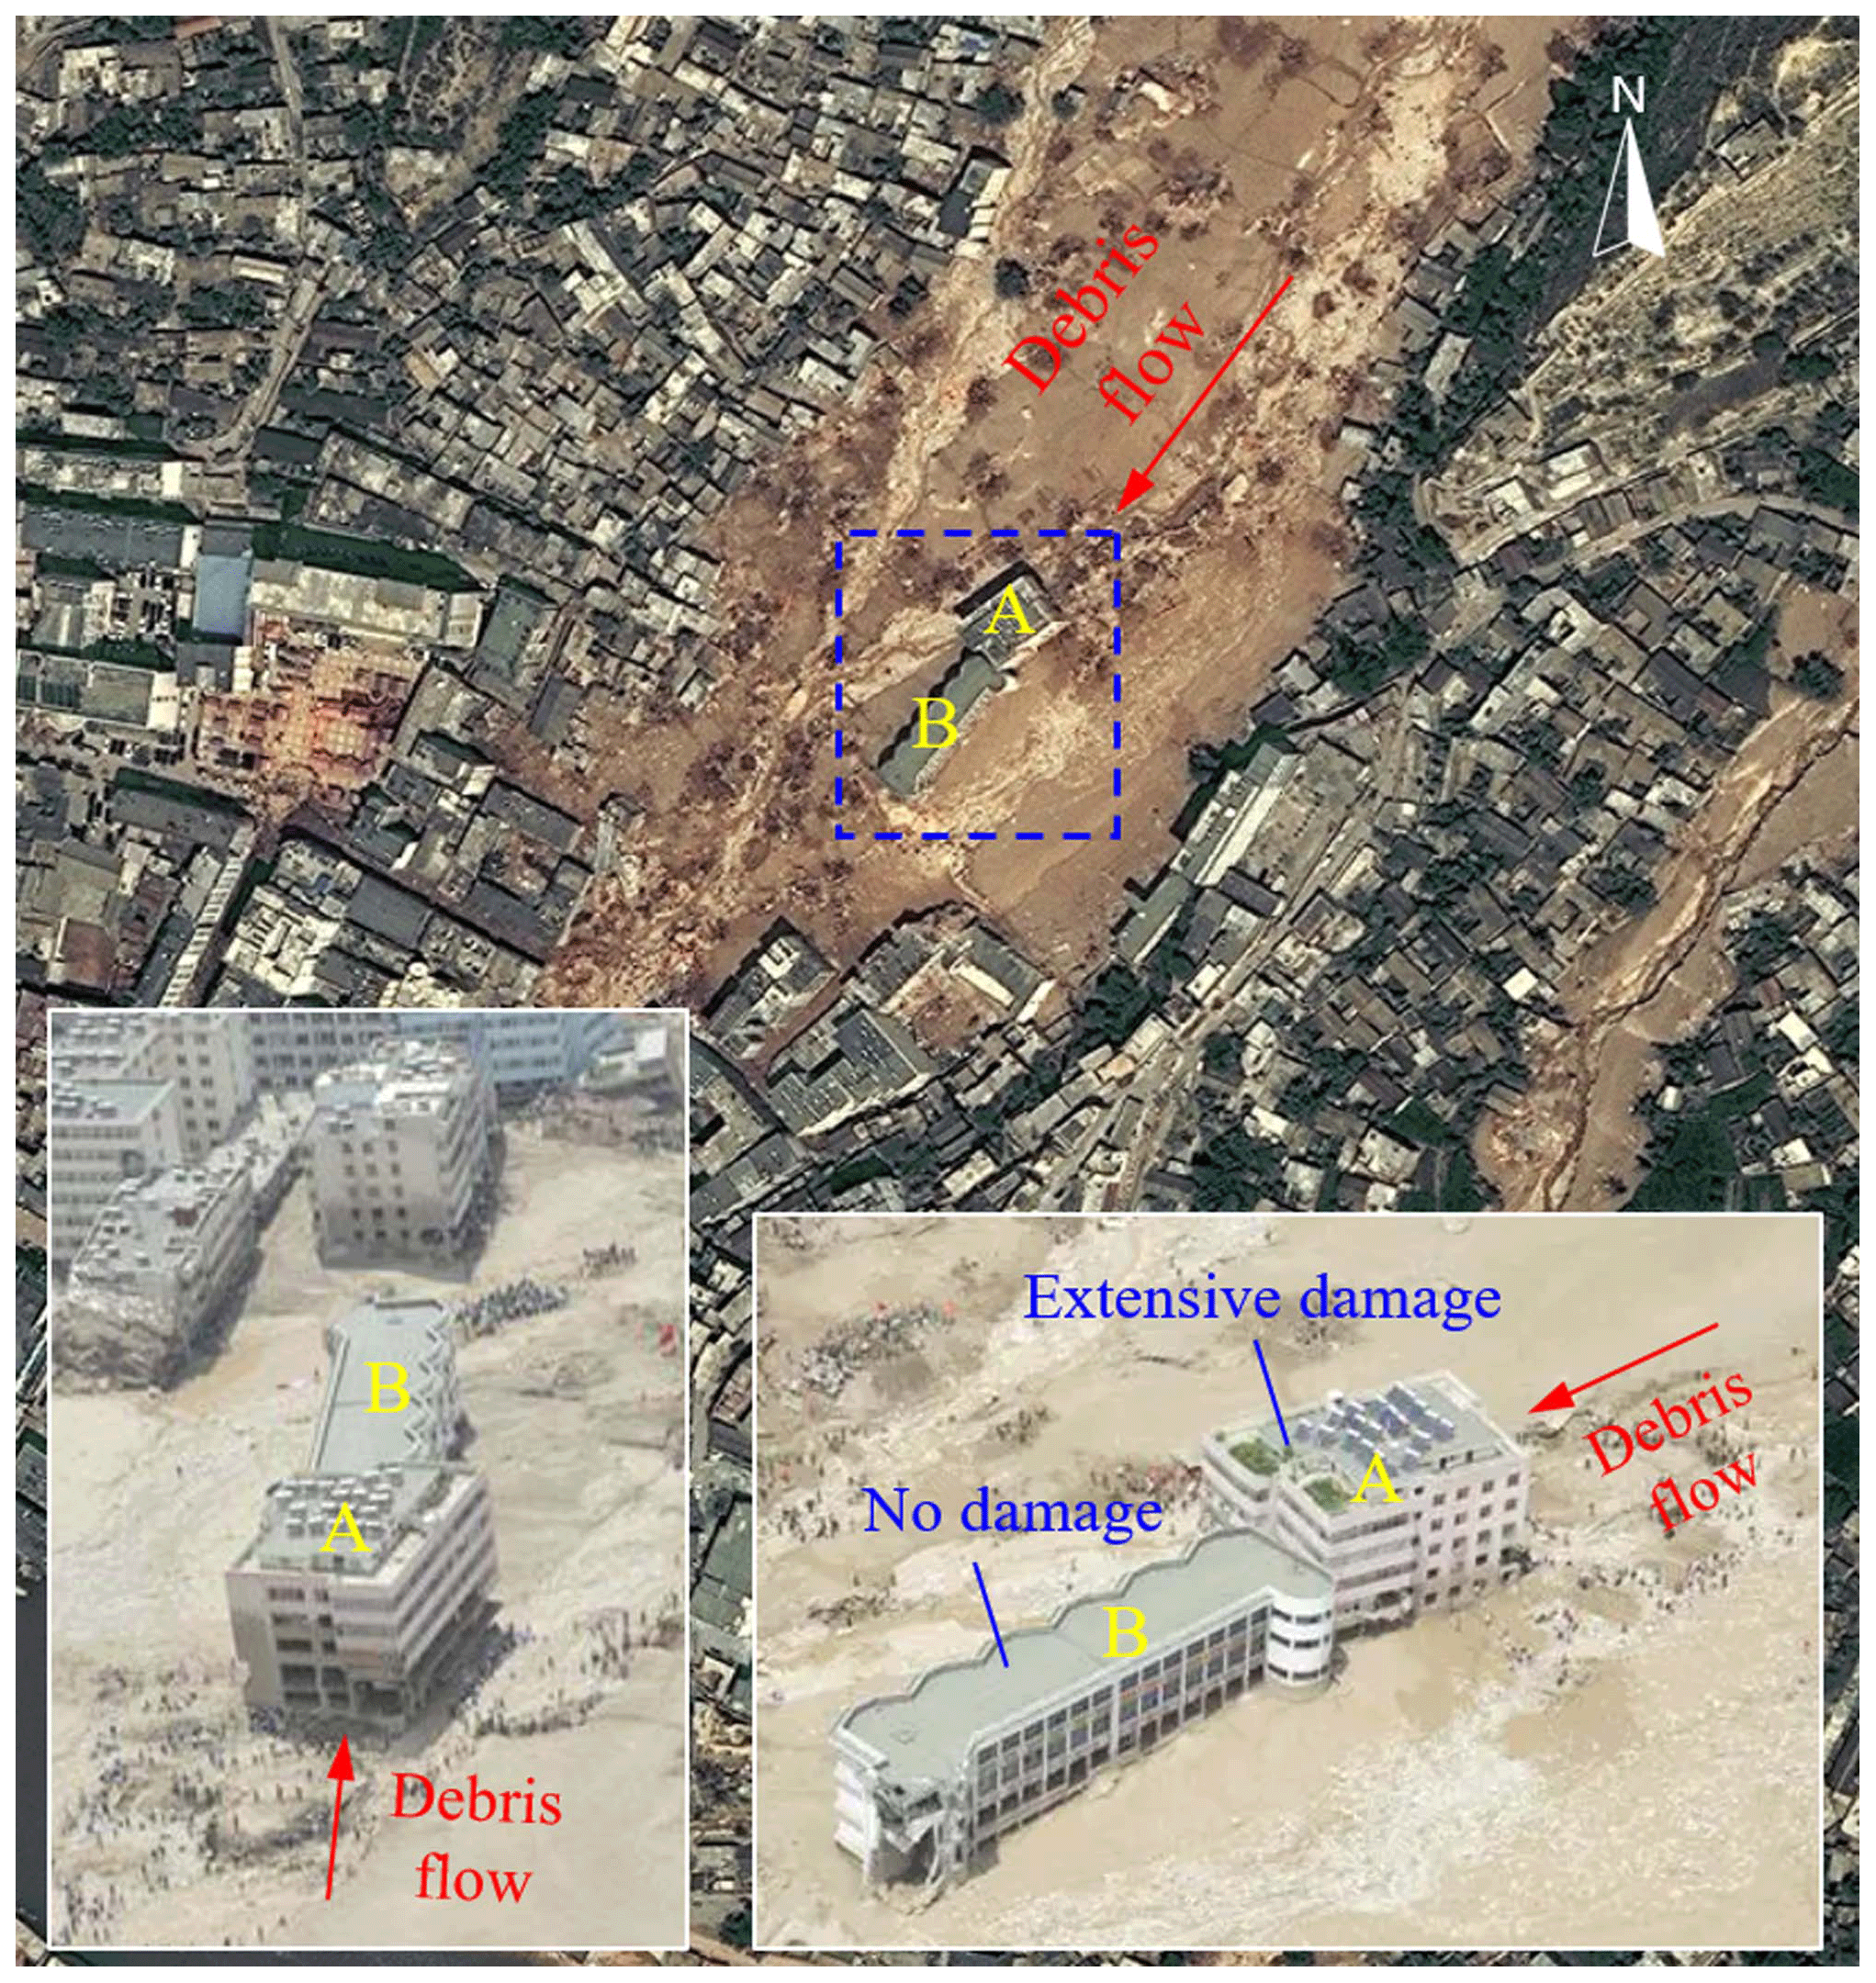
Figure 7Distribution of damaged buildings in the Zhouqu debris flow event. Orthophoto map is from DigitalGlobe's WorldView-2 satellite on 22 October 2010 published by NASA (ref: https://earthobservatory.nasa.gov/images/45329/landslide-in-zhouqu-china, last access: 23 February 2023); the aerial photo is referred from the website of http://slide.news.sina.com.cn/c/slide_1_5039_12703.html (last access: 23 February 2023; Tang et al., 2011).

Figure 8Distribution of damaged buildings in the Qipan gully debris flow event. Orthophoto map is from the Basic Geographic Information Center of the province of Sichuan, China, 21 July 2013.
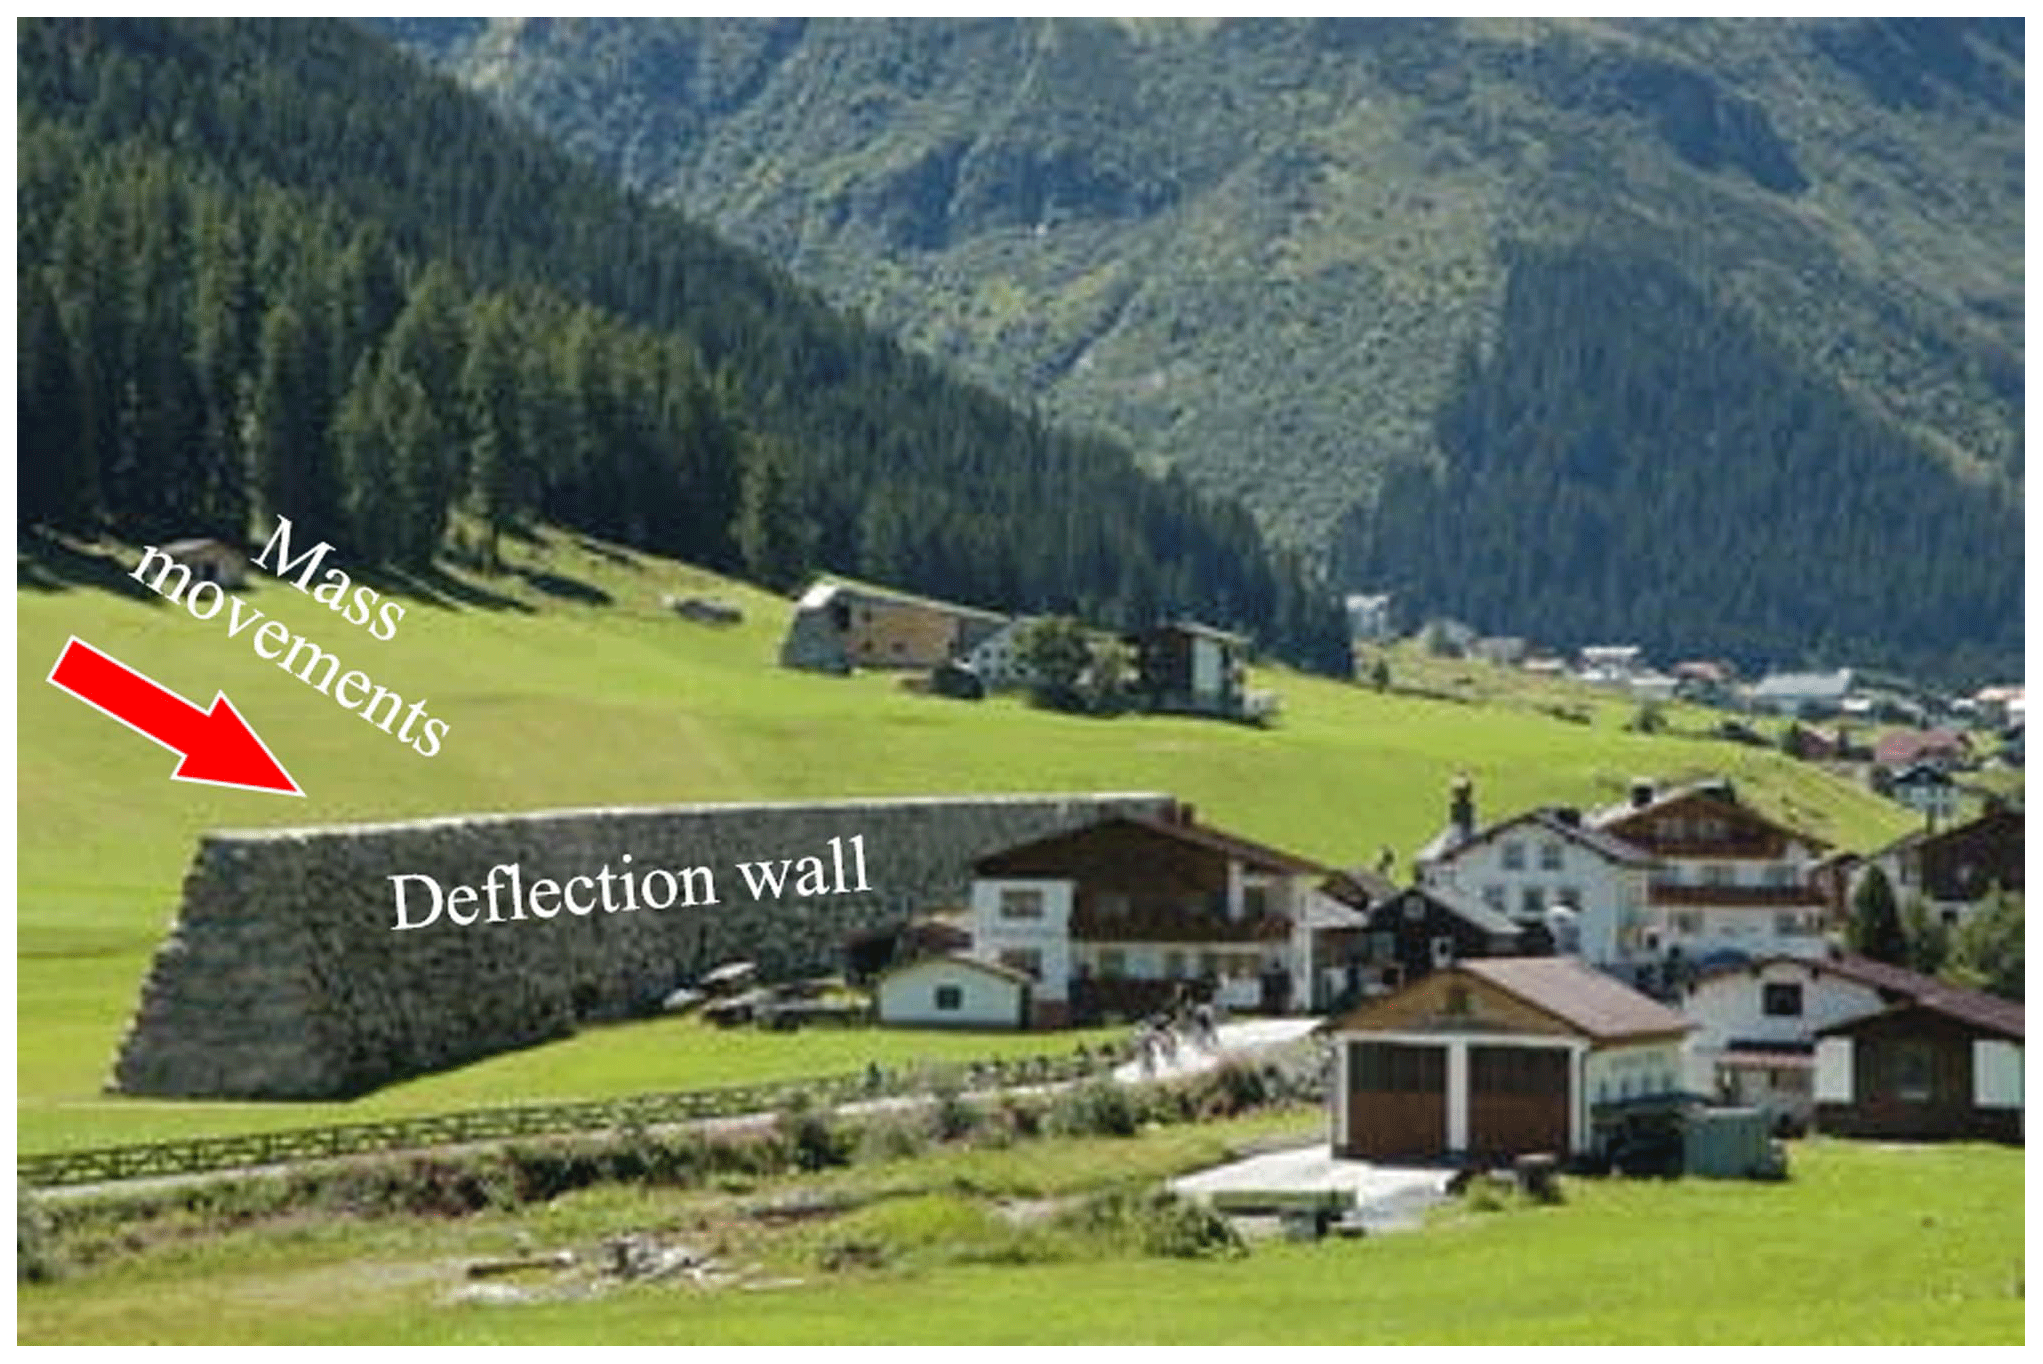
Figure 9A deflection wall used to protect an entire building ensemble from the impact of medium-magnitude events (Galtur Tschafein, Austria) (Holub et al., 2012).
4.3 Effect of the distance to the surrounding buildings
As shown in Fig. 10, the variations in peak impact forces change with the surrounding buildings' distances in conjunction with the influences of azimuth angles. The scenario of the orientation of 90∘ and opening of 0.4 (Or90-Op0.4-Ax-Dx) is taken as an example, and the background value (Or90-Op0.4-Anull-Dnull) is still 3717 kN. According to the results of the sensitivity analysis, the most significant second-order effect comes from the interaction between the azimuth angle and distance, which can be divided into an amplification of the shielding effect or a reduction in the canalization effect, as shown in Fig. 10.
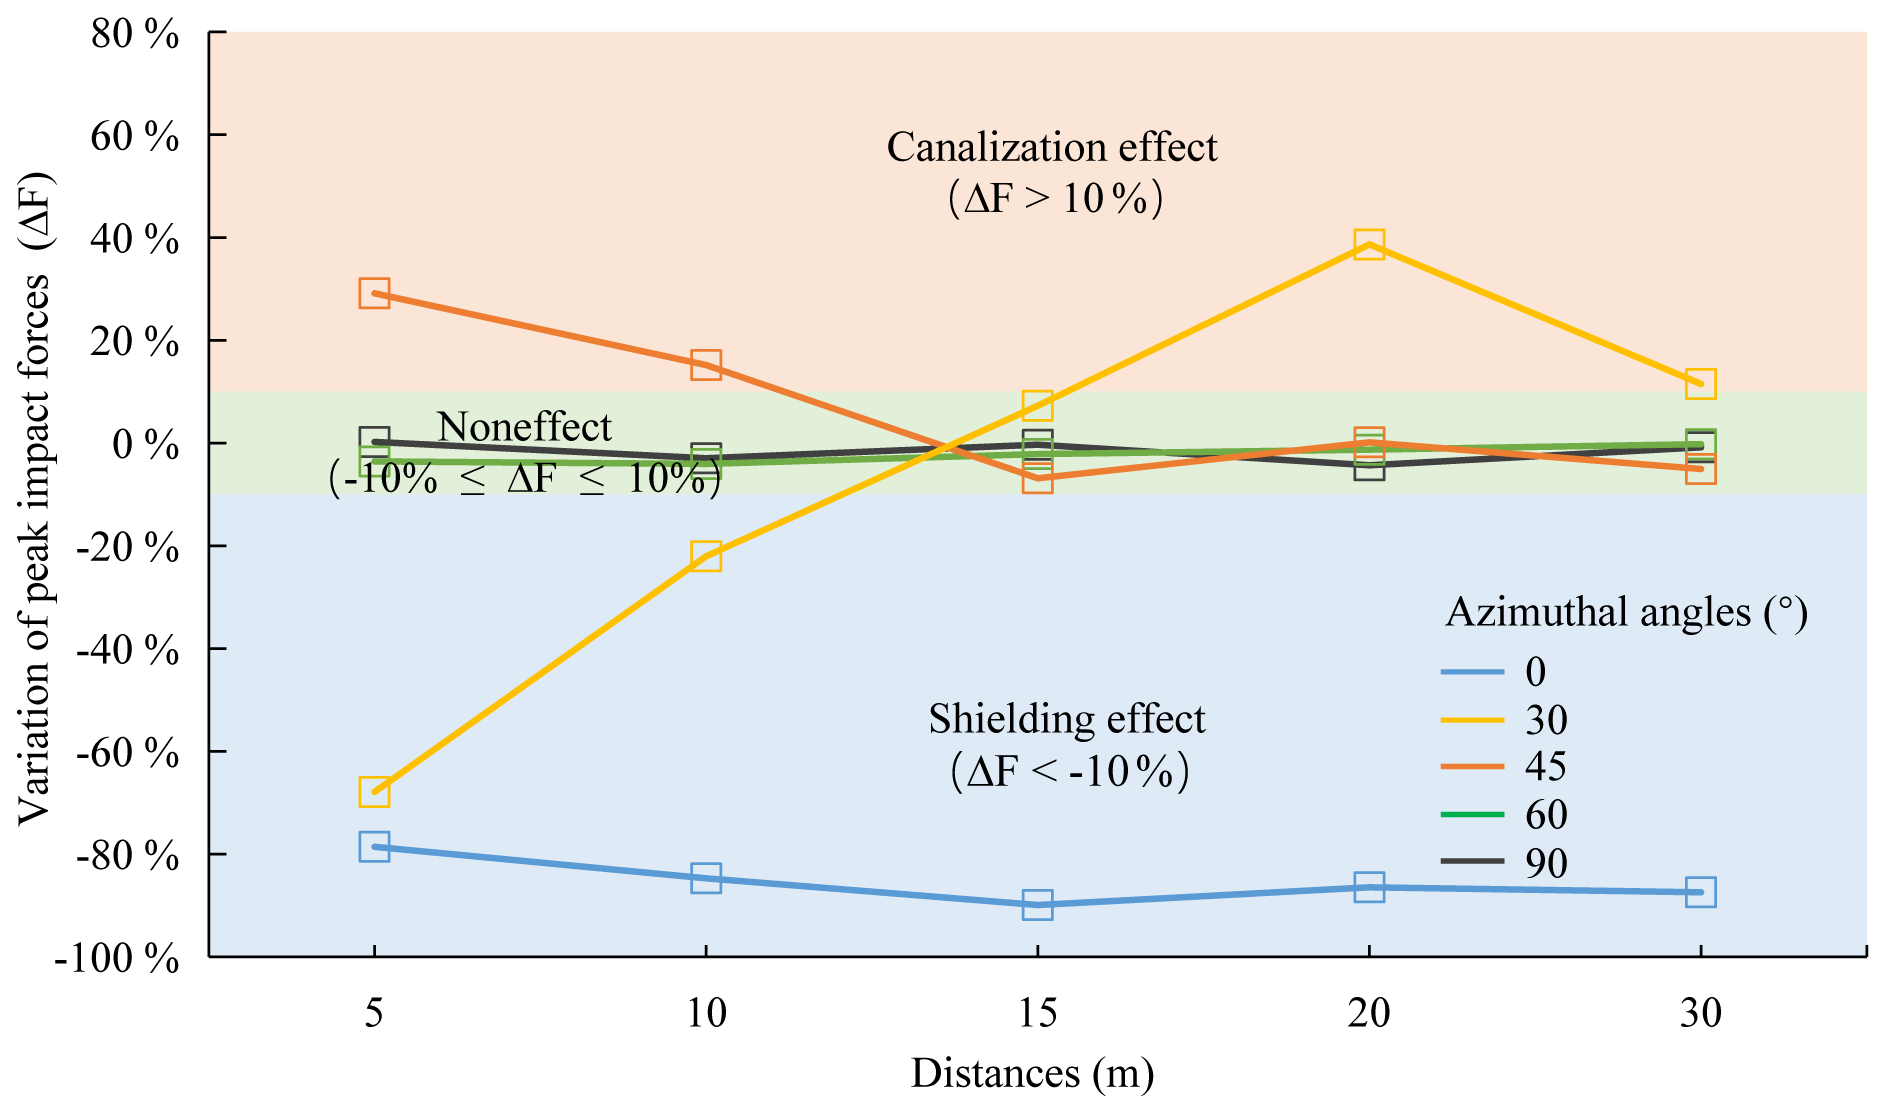
Figure 10Peak impact forces change with the surroundings' distances under the influence of azimuth angles in the scenarios of the orientation of 90∘ and the opening scale of 0.4 (Or90-Op0.4-Ax-Dx).
-
Amplification of the shielding effect. The peak impact forces are found to be reduced gradually with increasing surrounding building distance in the case of an azimuth angle of 0∘ (Or90-Op0.4-A0-Dx), with a 5 m distance yielding 796 kN and a 30 m distance yielding 467 kN, and the corresponding variations in peak impact forces are approximately −78.58 % and −87.44 %. The shielding effects at an azimuth angle of 0∘ are amplified with increasing surrounding distance. This process occurs because there is a broader shielding area further downstream of the surrounding building when the debris flow path is separated by an obstacle at a fixed angle of spread, as shown in Fig. 11. Furthermore, there is likely a small-scale debris flow conflux zone close to the surrounding building, as shown in the red zone of Fig. 11. Buildings upstream, therefore, may suffer from a higher impact load in the same debris flow shielding area. As shown in region III of Fig. 8, the lower a building's damage degree, the further away the completely damaged building D is in the back shielding area. Building E, next to building D, is exposed to moderate damage, and other shielding-protected buildings, such as buildings F, G and H, experience only slight damage from lateral abrasion and accumulation. However, the amplified shielding effect inevitably disappears further downstream due to the confluence of debris flow runoff. The range of the shielding area mainly depends on the debris flow properties, especially the friction coefficient and dynamic viscosity (Liang et al., 2021). Further investigation of the effective shielding-protection area is needed.
-
Reduction in the canalization effect. The canalization effect mainly occurs under a surrounding building at an azimuth angle of 45∘, as mentioned above; however, this kind of effect could be lessened under the influence of the surrounding buildings' distances. As shown by the red line in Fig. 10, the maximum peak impact force under an azimuth angle of 45∘, with a value of 4800 kN, appears with a distance of 5 m (Or90-Op0.4-A45-D5). Then, the peak impact forces decrease rapidly with greater distances, especially in the distance range of less than 15 m. The peak impact force at a distance of 15 m (Or90-Op0.4-A45-D15) is reduced to 3462 kN, which is very close to the background value (3717 kN). It is indicated that the canalization effect under an azimuth angle of 45∘ may have vanished completely at this point. As shown in the computational results at 8.0 s in Fig. 12, the increase in flow velocity in the narrowed flow paths due to building blockage decreases with increasing surrounding building distances. The increased-velocity debris flows, on the other hand, tend to flow away from the target building in the cases of greater surrounding building distances. Therefore, the variations in peak impact forces are close to 0 due to the lower flow velocity and fewer intruding materials in the scenarios of surrounding building distances beyond 15 m. In general, a greater distance results in a lower impact force.
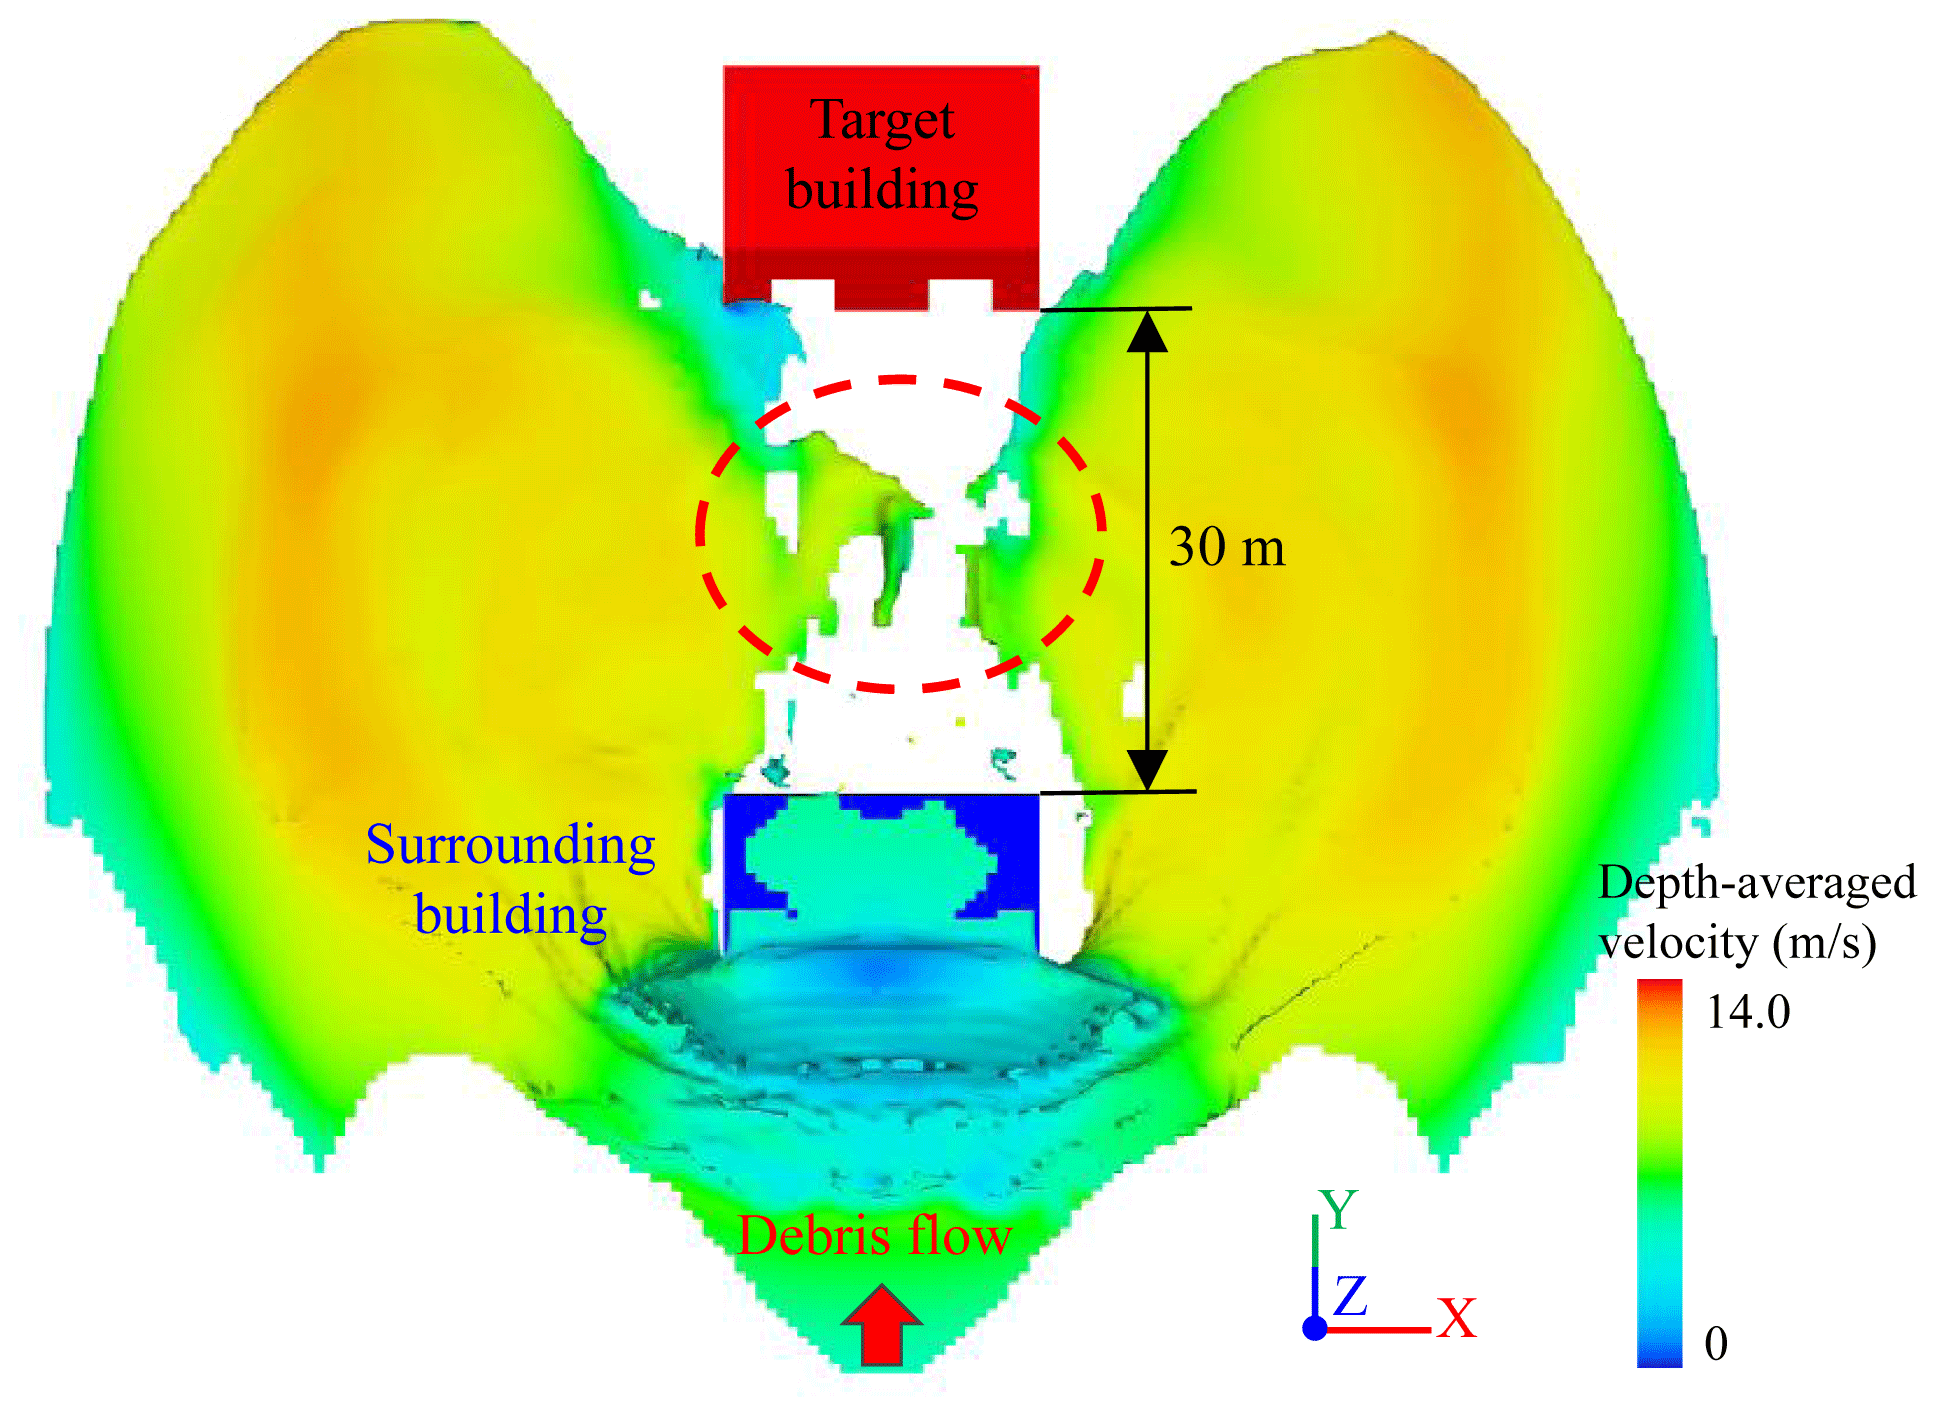
Figure 11There is the lower debris flow intensities further away surrounding building within a shielding area, in the scenario of Or90-Op0.4-A0-D30 at a simulation time of 8.0 s. The local debris flow conflux is delineated with the dotted red line (the snapshot has been rotated 30∘ counterclockwise along the x axis, similarly hereinafter).
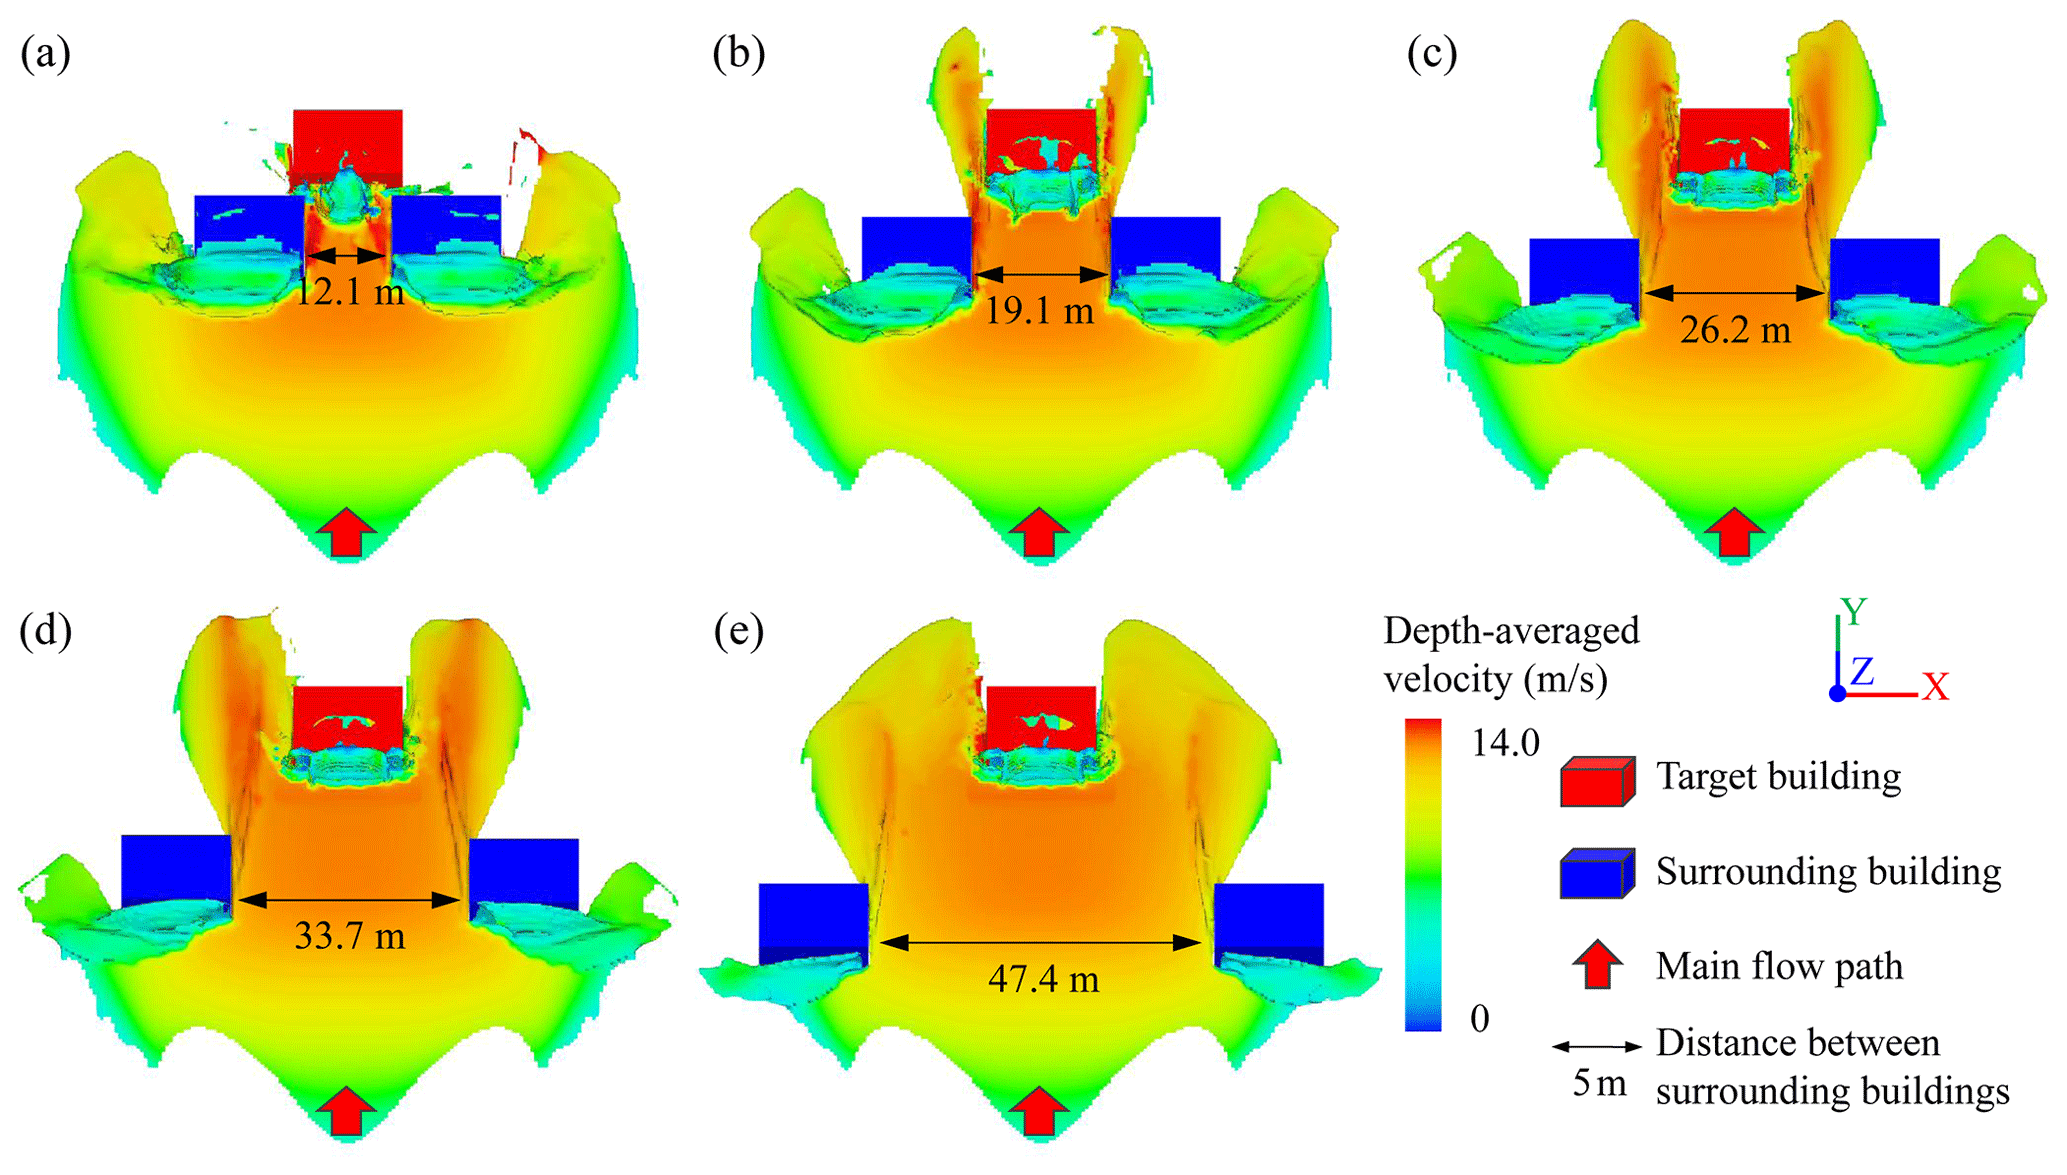
Figure 12Snapshots for debris flow intensities in the scenarios of Or90-Op0.4-A45-Dx at a simulation time of 8.0 s. Panel (a) is the case of Or90-Op0.4-A45-D5, (b) is the case of Or90-Op0.4-A45-D10, (c) is the case of Or90-Op0.4-A45-D15, (d) is the case of Or90-Op0.4-A45-D20 and (e) is the case of Or90-Op0.4-A45-D30.
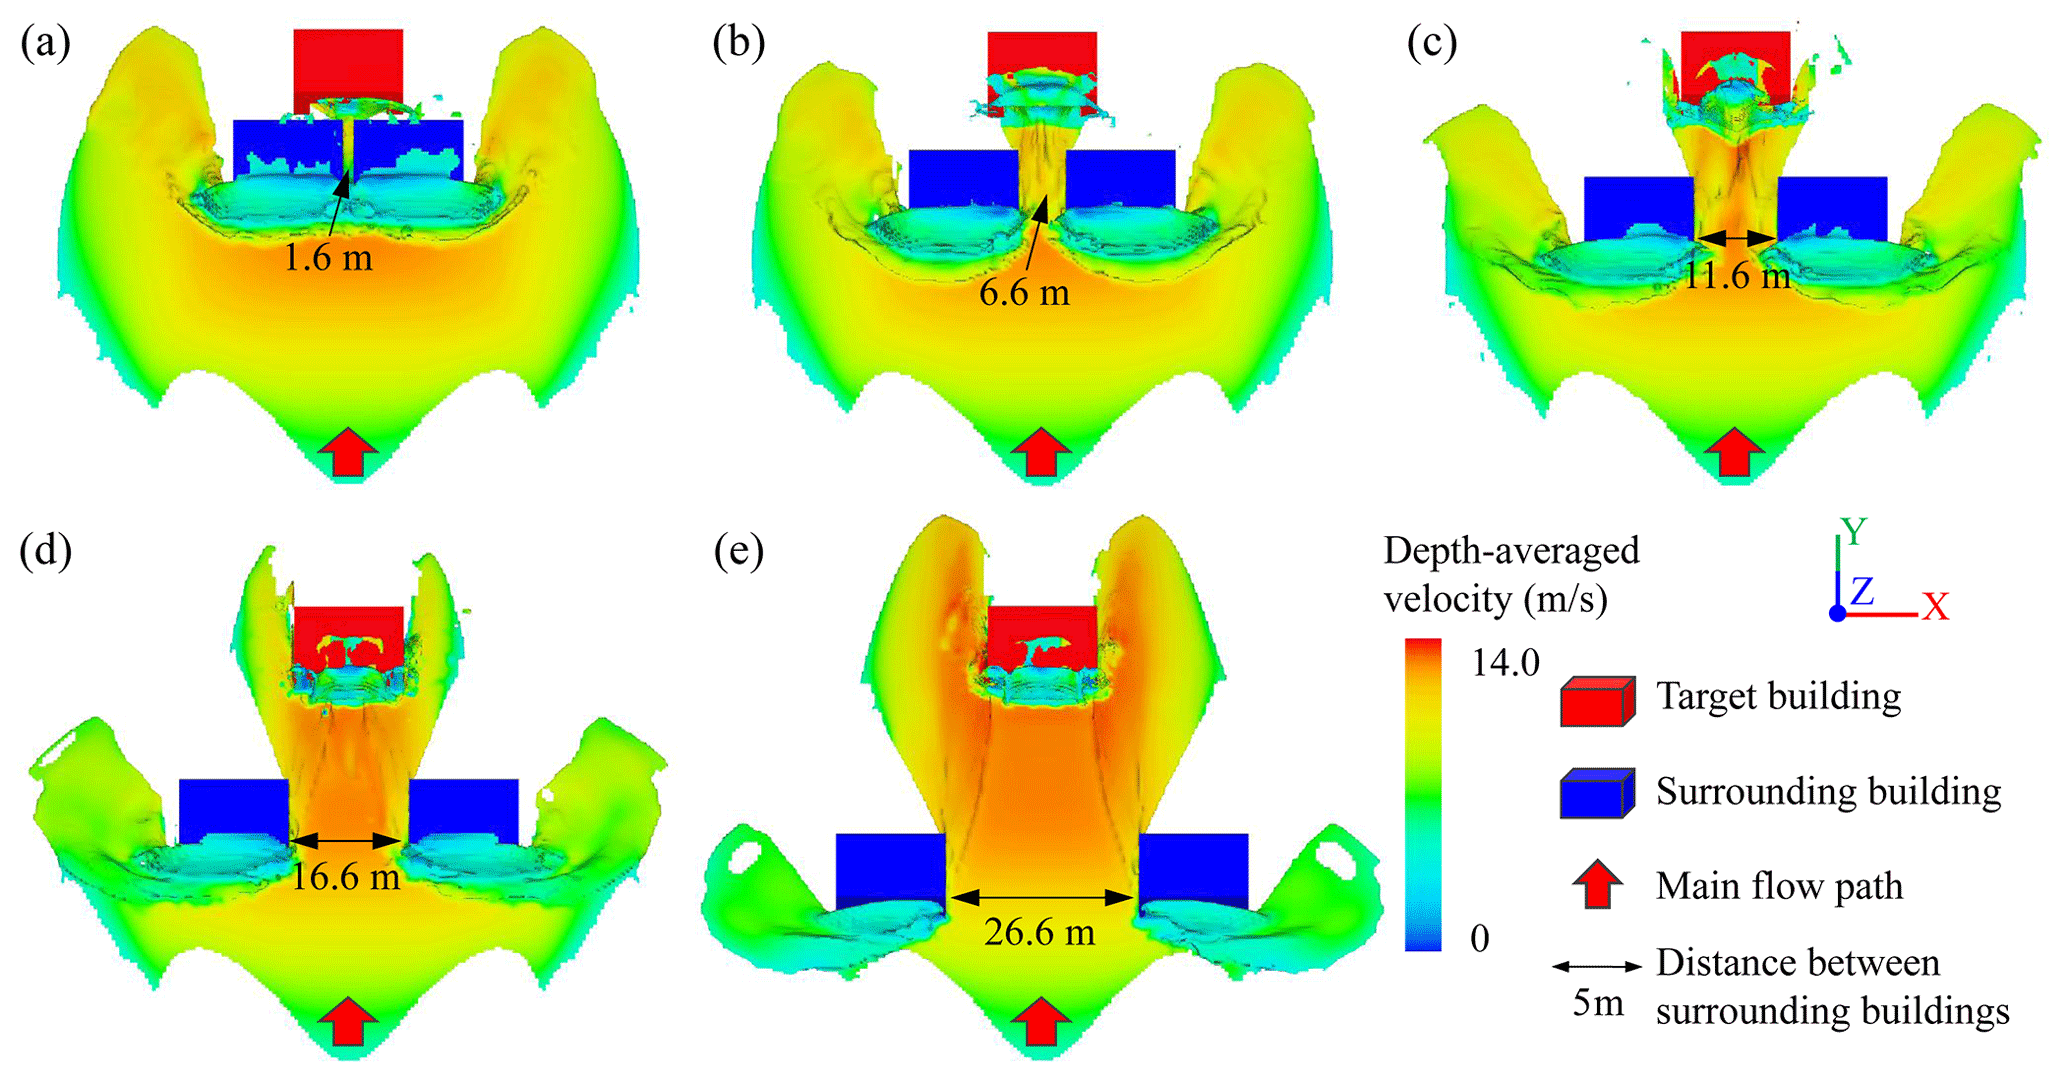
Figure 13Snapshots for debris flow intensities in the scenarios of Or90-Op0.4-A30-Dx at a simulation time of 8.0 s. Panel (a) is the case of Or90-Op0.4-A30-D5, (b) is the case of Or90-Op0.4-A30-D10, (c) is the case of Or90-Op0.4-A30-D15, (d) is the case of Or90-Op0.4-A30-D20 and (e) is the case of Or90-Op0.4-A30-D30.
A smaller surrounding building distance, however, does not necessarily indicate a larger impact force. With surrounding building distances of 5 and 10 m, impact force shielding effects occur under the condition of an azimuth angle of 30∘ (Or90-Op0.4-A30-D5 and Or90-Op0.4-A30-D10), as shown in Fig. 13, and the corresponding variations in peak impact loads are −67.90 % and −22.03 %, respectively. The width of the narrowed flow path, which is determined by the factors of the azimuth angle and surrounding building distance, could account for this fact. The flow paths are so narrow, with widths of 1.6 and 6.6 m, respectively, like bottlenecks, that not much flow passes through them, as shown in Fig. 13a and b. Thereafter, the canalization effect occurs at distances beyond 15 m and reduces and even disappears gradually with increasing surrounding building distance and the corresponding wider flow paths. It is found that the ratio of the width of the narrowed flow path to the length of the target building has a significant effect on the increase in impact force. The largest peak impact force is most likely to be found under a ratio of approximately one, for example, the ratios of 0.8 in the case of Or90-Op0.4-A45-D5 (Fig. 12a) and 1.1 of Or90-Op0.4-A30-D20 (Fig. 13d).
4.4 Effect of the orientation
4.4.1 Single-factor analysis of orientation
As shown in Fig. 14, the peak impact forces of debris flows are ordered as follows: Or90 > Or60 > Or0 > Or45 ≈ Or30, and the corresponding values are 3560, 2591, 2334, 1917 and 1912 kN, respectively, when only the target building's orientation is considered (Orx-Op0-Anull-Dnull). It is generally accepted that the impact load of a debris flow is a comprehensive outcome from many characteristic parameters, including the debris flow density, velocity, impact contact area and approaching angle (Liu et al., 2021). It is assumed that the debris flow density is constant in the computational process of impact forces in the FLOW-3D model.
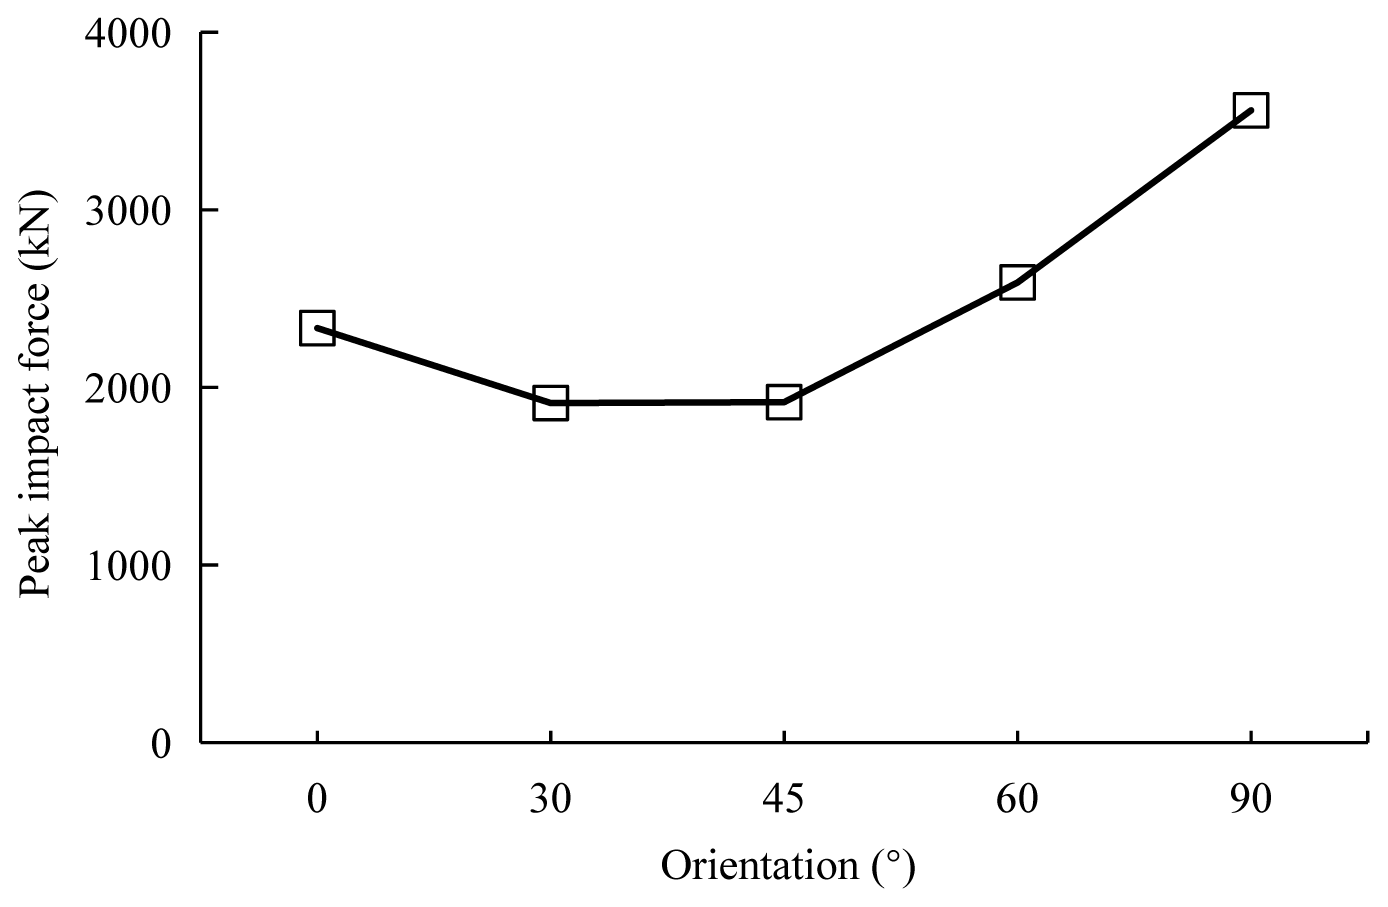
Figure 14Peak impact forces change with the target building's orientations in the scenarios of no openings and no surroundings (Orx-Op0-Anull-Dnull).
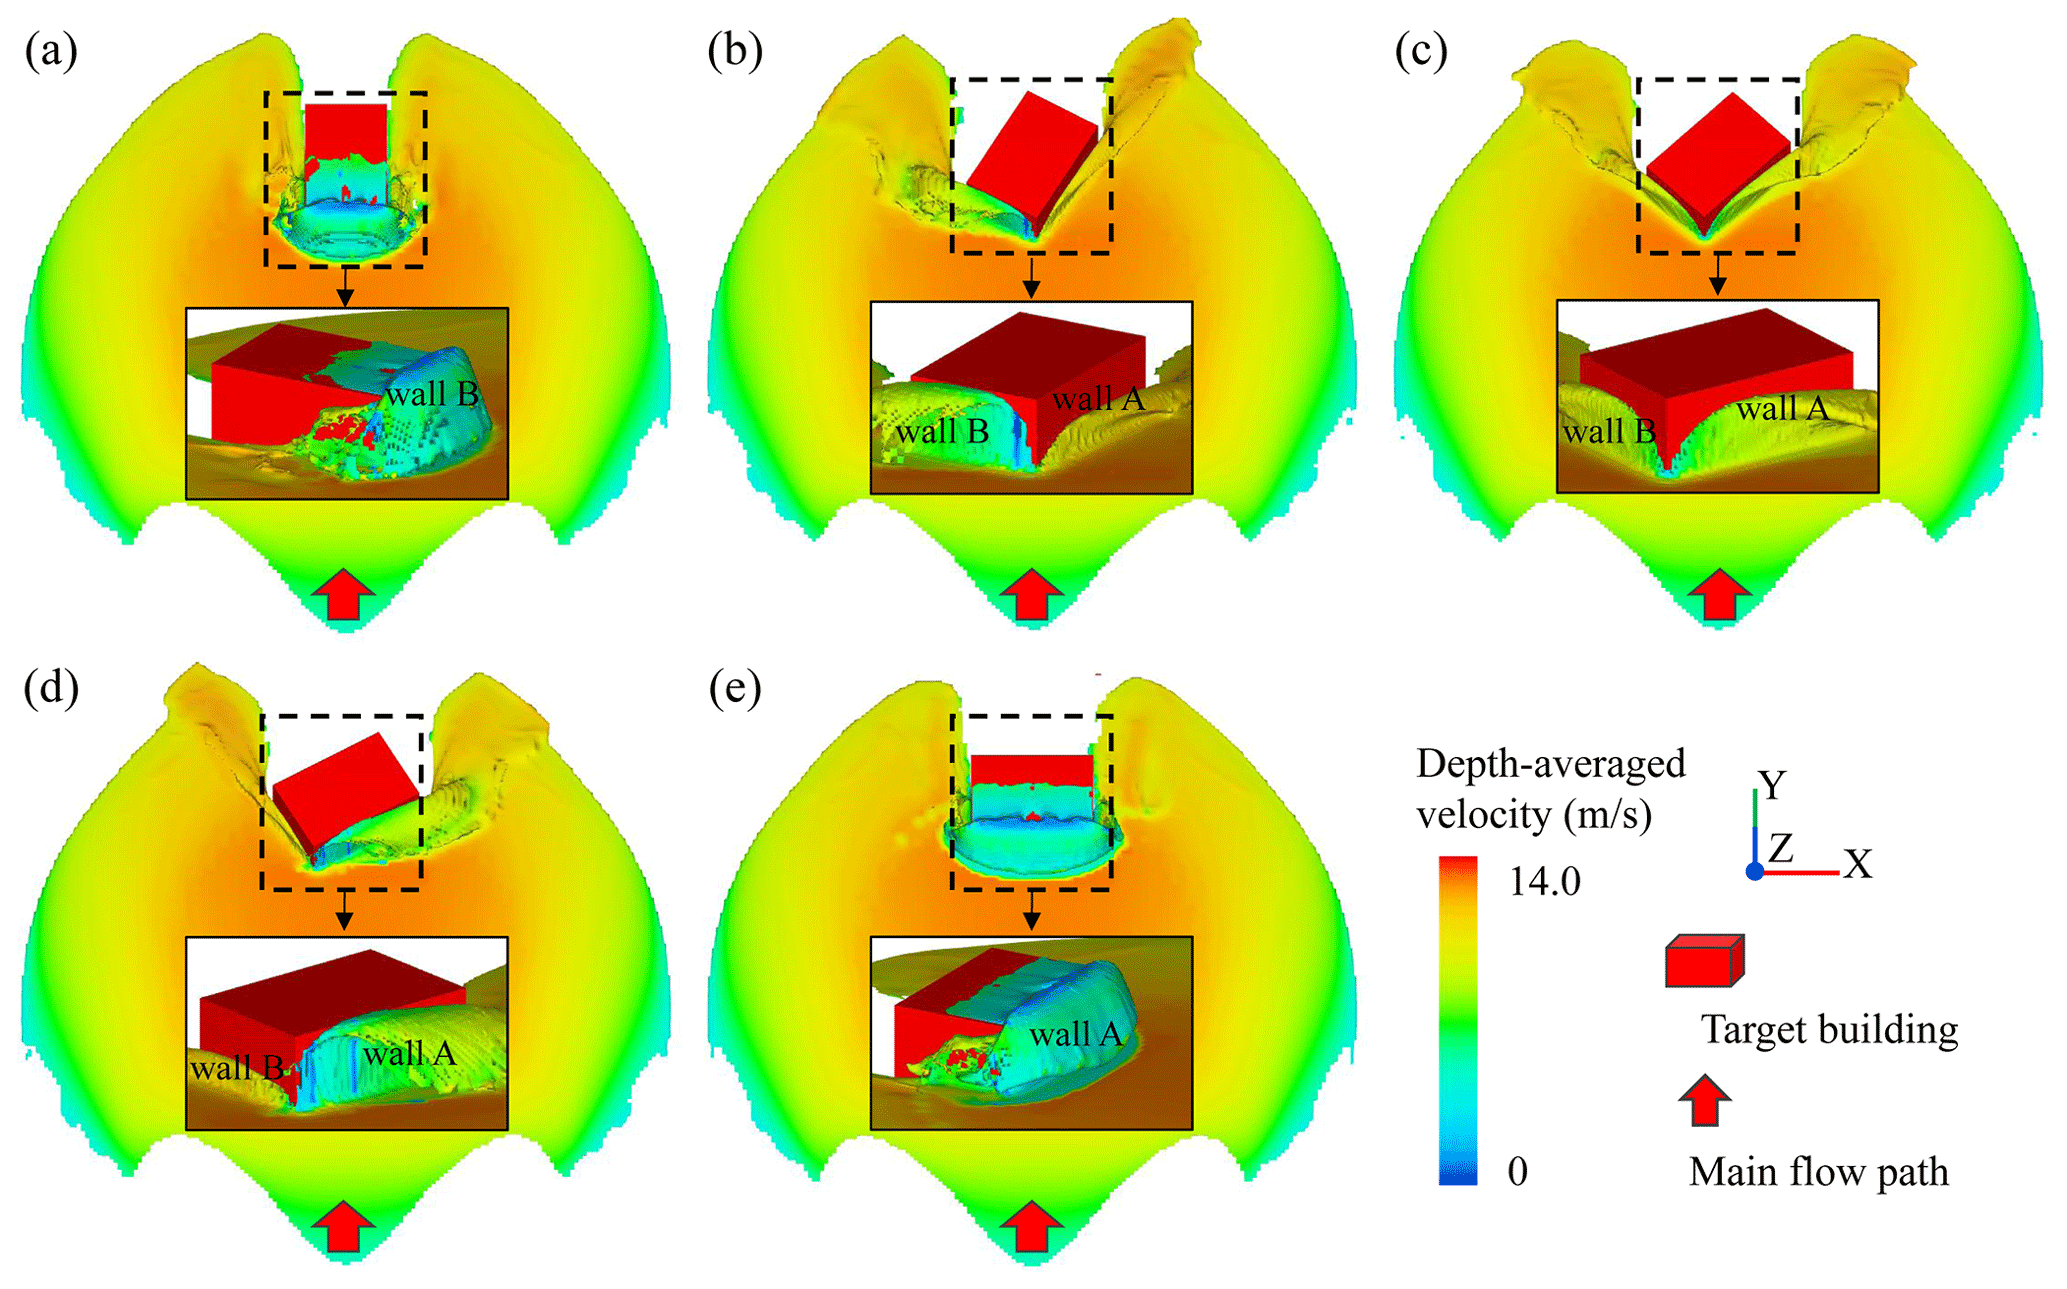
Figure 15Snapshots for debris flow intensities in the scenarios of Orx-Op0-Anull-Dnull at a simulation time of 8.0 s. Panel (a) is the case of Or0-Op0-Anull-Dnull, (b) is the case of Or30-Op0-Anull-Dnull, (c) is the case of Or45-Op0-Anull-Dnull, (d) is the case of Or60-Op0-Anull-Dnull and (e) is the case of Or90-Op0-Anull-Dnull.
The impact contact area, a product of the wall length and effective height, where the latter is the minimum value between the wall height and flow depth, can be used to explain the debris flow impact responses in the case of orientations of 0∘ (Or0-Op0-Anull-Dnull) and 90∘ (Or90-Op0-Anull-Dnull). In the simulations shown in Fig. 15a and e, the single wall element, wall B or wall A, is vertically impacted by debris flows, and the surging flows go beyond the wall height. The length of the impacted wall elements, therefore, should contribute to the difference in the peak impact pressures. The mainly impacted wall element in the orientation of 90∘ – wall A of 15 m – is obviously longer than that of the orientation of 0∘, wall B of 10 m. A larger contact area results in a greater impact force.
Walls A and B are simultaneously exposed to debris flows in the orientations of 30, 45 and 60∘, as shown in Fig. 15b–d. In these cases, the debris flow impact loads, to a large extent, are dominated by the approaching angle, which is defined here as the general, temporally independent angle of the wall element to the main flow path, with a range of 0∘ (parallel) to 90∘ (vertical). Generally, there are higher flow velocities and lower surge flow depths in the cases of smaller approaching angles and vice versa. The highest flow depth occurs in the neighborhood of wall A, the longest wall of the target building, in the scenario with an orientation of 60∘ (Or60-Op0-Anull-Dnull), as shown in Fig. 15d. In contrast, the lowest flow depth appears near wall A, with an orientation of 30∘ (Or30-Op0-Anull-Dnull), as shown in Fig. 15b. This could be the main reason why the impact force of the target building with 60∘ orientation is larger than the one of 30∘ orientation. However, even so, better migration performances, such as lower impact loads and larger shielding areas, are produced in these cases than in the case with an orientation of 90∘. Similar to this idea, a splitting wedge, with a triangular shape and two downslope-directed sides, was constructed at the process-oriented side of an exposed building to protect against snow avalanches in the Swiss Alps, as shown in Fig. 16. It was confirmed that splitting wedges, with this very distinctive shape, were considerably effective in maintaining its stability and offering a larger protected zone for the other neighboring buildings. It also provides a good model for building protection design in debris-flow-prone areas. The main criterion for the effective operation of such a structure is avoiding the highest flow depth – the maximum approaching angle – appearing near the longest wall element.
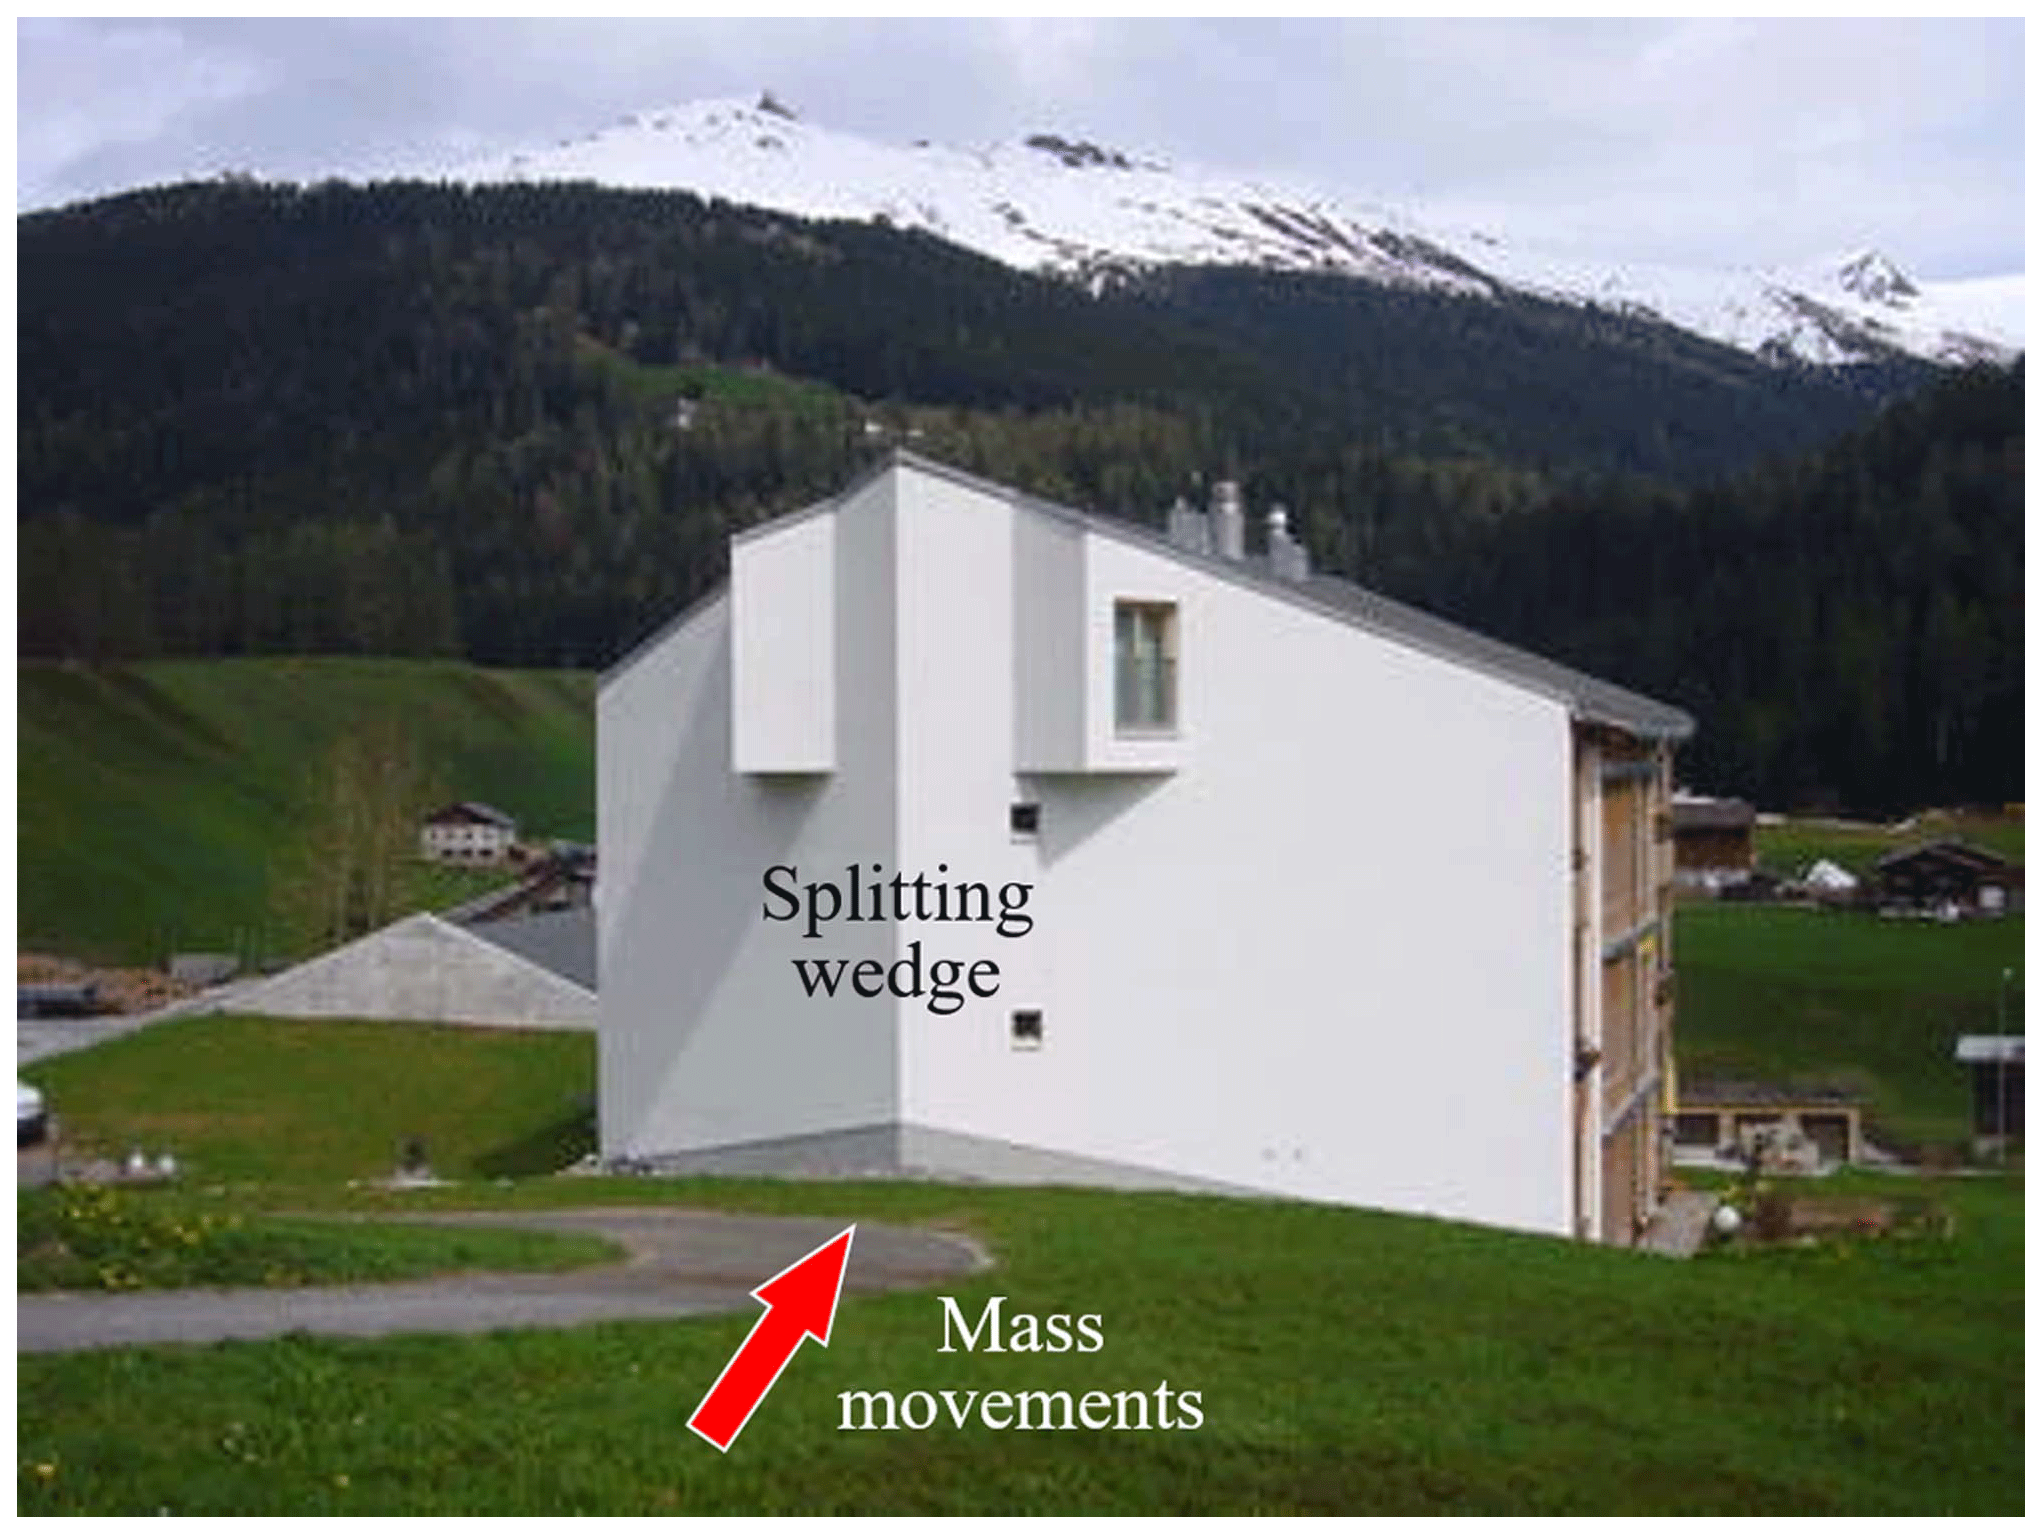
Figure 16Splitting wedge directly connected to the exposed object (Davos Frauenkirch, Switzerland) (Holub et al., 2012).
Last but not least, flip-though impacts, caused by the backwater effect, which is a special phenomenon when debris flow hits a barrier wall, runs up, bounces backward, blocks and converges with the remaining debris (Takahashi, 2007; Song et al., 2021), contributing greatly to the peak impact forces of orientations 0∘ (Or0-Op0-Anull-Dnull) and 90∘ (Or90-Op0-Anull-Dnull), as shown in Fig. 17. The impact forces with an orientation of 0∘ reach their peak when the debris flow first collides with the wall and runs up. The peak impact load with an orientation of 90∘ comes from the secondary waves overtaking the flow front, after the flow bounces off the wall, collides and converges with the flow approaching from behind (Iverson et al., 2010; Choi et al., 2018).
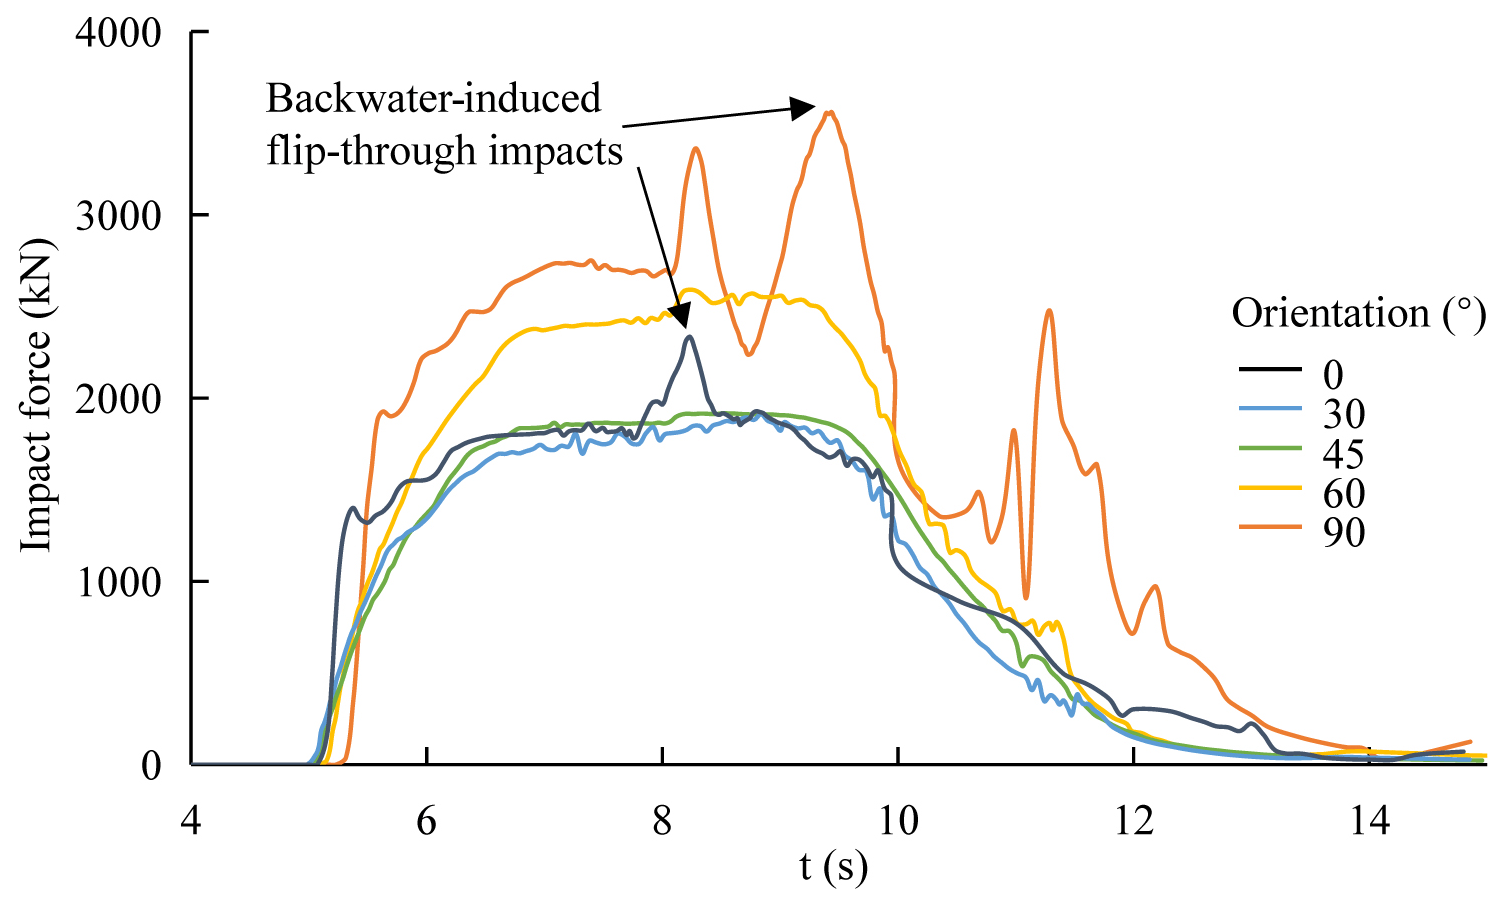
Figure 17Impact forces time history with changing orientations in the scenarios of Orx-Op0-Anull-Dnull after a simulation time of 4.0 s.
4.4.2 Interaction between orientation and surroundings
The single-factor analysis of orientation explained why the buildings with orientations of 30, 45 and 60∘ have better migration effects. This knowledge has to be reconsidered, however, when the effect overlaps with the surrounding buildings' shielding effects. It is found that buildings with orientations of 30, 45 and 60∘ are more likely to be damaged by debris flows within a shielding area. For instance, the maximum peak impact forces with surrounding buildings' distances of 5 m (Or60-Op0.4-A0-D5), 10 m (Or60-Op0.4-A0-D10) and 15 m (Or60-Op0.4-A0-D15), as shown in Fig. 18, are different from those of the single-factor analysis of orientation. The protruding parts of the target building caused by the changing orientations significantly contribute to the increase in impact forces (Hu et al., 2012; Zeng et al., 2015). A larger protruding portion of a building results in a greater probability of being exposed and corresponding larger impact forces. The largest protruding areas are exposed to debris flows at an orientation of 60∘, as shown in Fig. 19d-1 and d-2). This can be confirmed by Fig. 8d. Although the main structure of building E is in the shielding area of building D, its protruding part is still completely destroyed by debris flows.
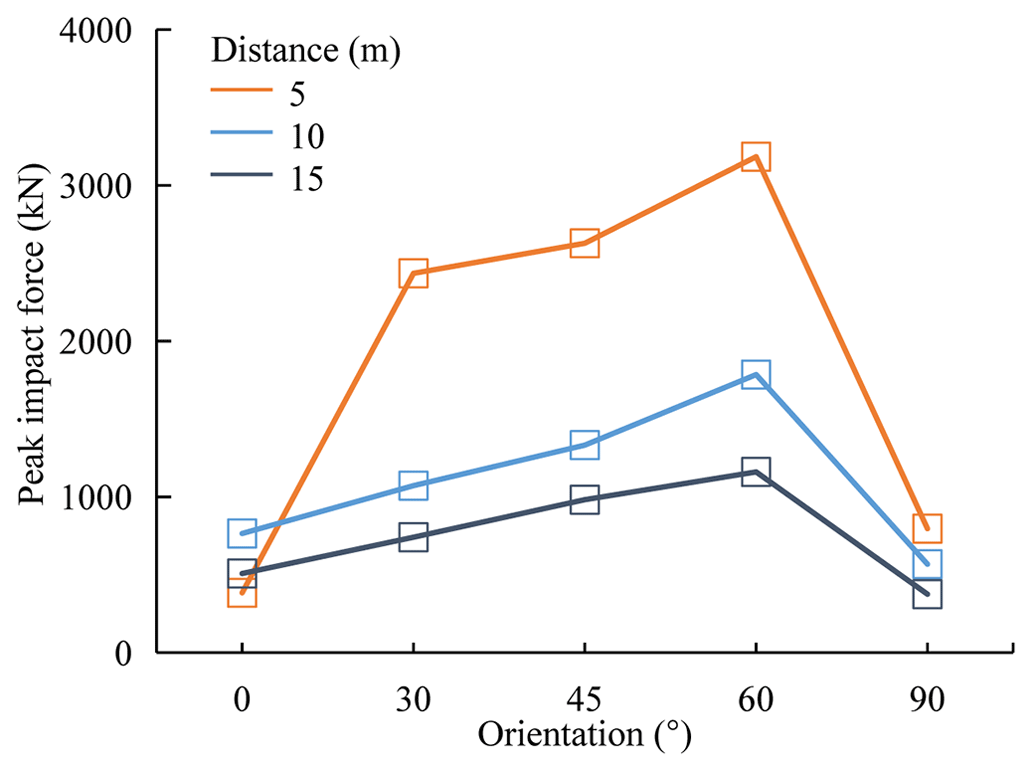
Figure 18Peak impact forces change with the target building's orientations under the shielding effect. The orange line shows the case of Orx-Op0.4-A0-D5, the blue line shows the case of Orx-Op0.4-A0-D10 and the gray line shows the case of Orx-Op0.4-A0-D15.
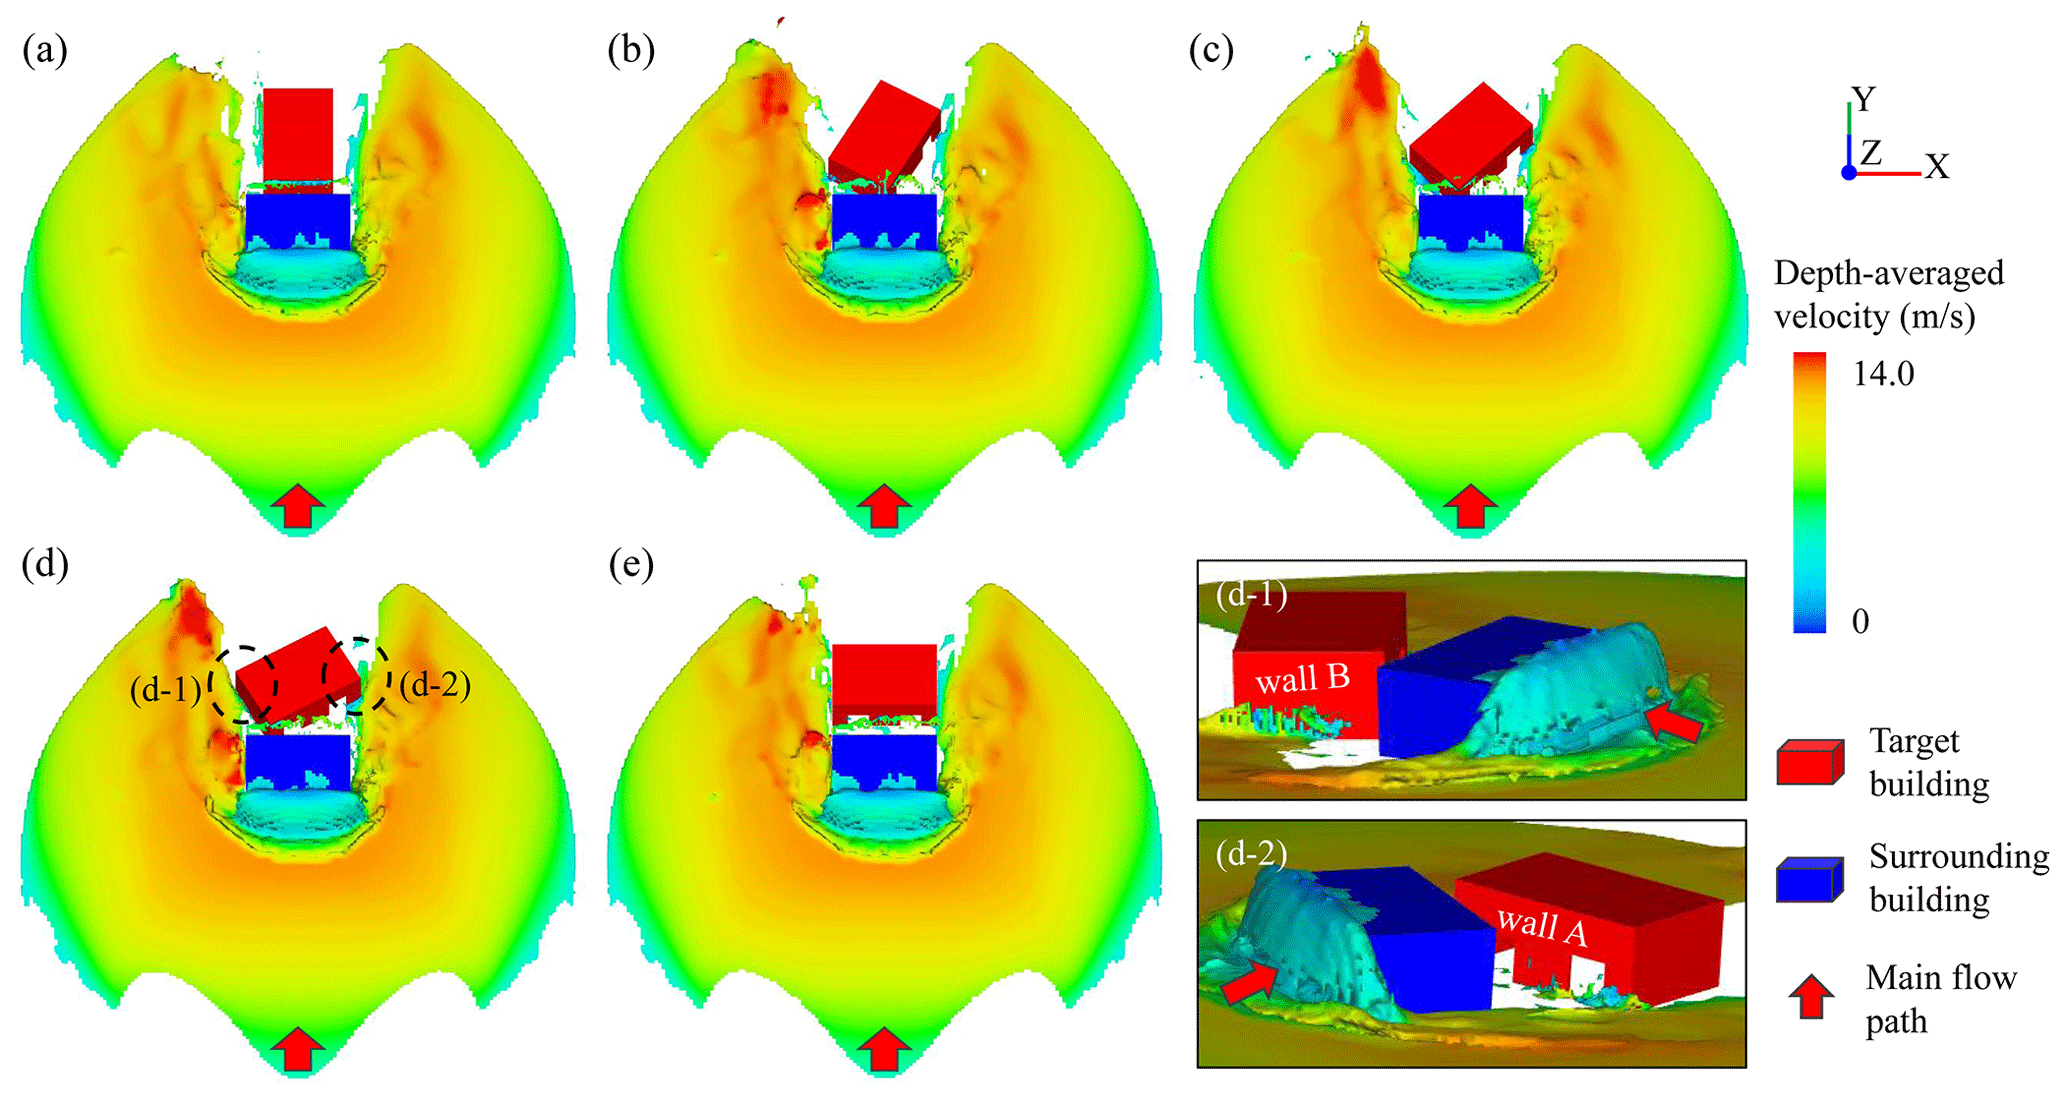
Figure 19Snapshots for debris flow intensities in scenarios of Orx-Op0.4-A0-D5 at a simulation time of 8.0 s. Panel (a) is the case of Or0-Op0.4-A0-D5, (b) is the case of Or30-Op0.4-A0-D5, (c) is the case of Or45-Op0.4-A0-D5, (d) is the case of Or60-Op0.4-A0-D5 and (e) is the case of Or90-Op0.4-A0-D5. Panels (d-1) and (d-2) show in detail that the protruding portions of the target building are exposed to debris flow.
4.5 Effect of the opening scale
According to the sensitivity analysis results, the opening scale is the least important factor for debris flow impacts, as it yields the minimum first-order effect index, 0.0050, and the minimum total effect index, 0.0137. From the results with an orientation of 90∘ and no surrounding buildings (Or90-Opx-Anull-Dnull), shown in Fig. 20, the peak impact forces of the target building change very slightly with increasing opening scale. There is a maximum peak impact force of 3945 kN in the case of openings with a scale of 0.8 (Or90-Op0.8-Anull-Dnull), which is approximately 15.38 % larger than the 3419 kN of openings with a scale of 0.2 (Or90-Op0.2-Anull-Dnull). Interestingly, the impact responses of the target building are different with different opening scales. Specifically, there are smaller impact forces in the cases of larger opening scales when only wall A of the target building is impacted, that is, in the early stage of debris flow impact from 5.3 to 6.2 s, as shown in Fig. 21. In this stage, the maximum impact pressure of 865 kN of an opening scale of 0.8 is approximately half of the 1618 kN of an opening scale of 0.2; this is due to the difference in the effective impacted areas. From this perspective, the mitigation performance of single wall elements with more openings is proven (Mazzorana et al., 2014; Gems et al., 2016). Thereafter, the impact load of the overall building increases rapidly following the abundant intrusion of materials through openings after 6.2 s, as shown in Fig. 21. Due to the greater accessibility and higher flow velocity, there is faster growth in impact pressure in the scenarios with the larger opening scales. Finally, after the two above-described impact stages are combined, there are only slight differences between multiple scales of openings in terms of peak impact forces. This indicates that the mitigation function of openings for the whole building is very limited if the time for material intrusion is sufficient.
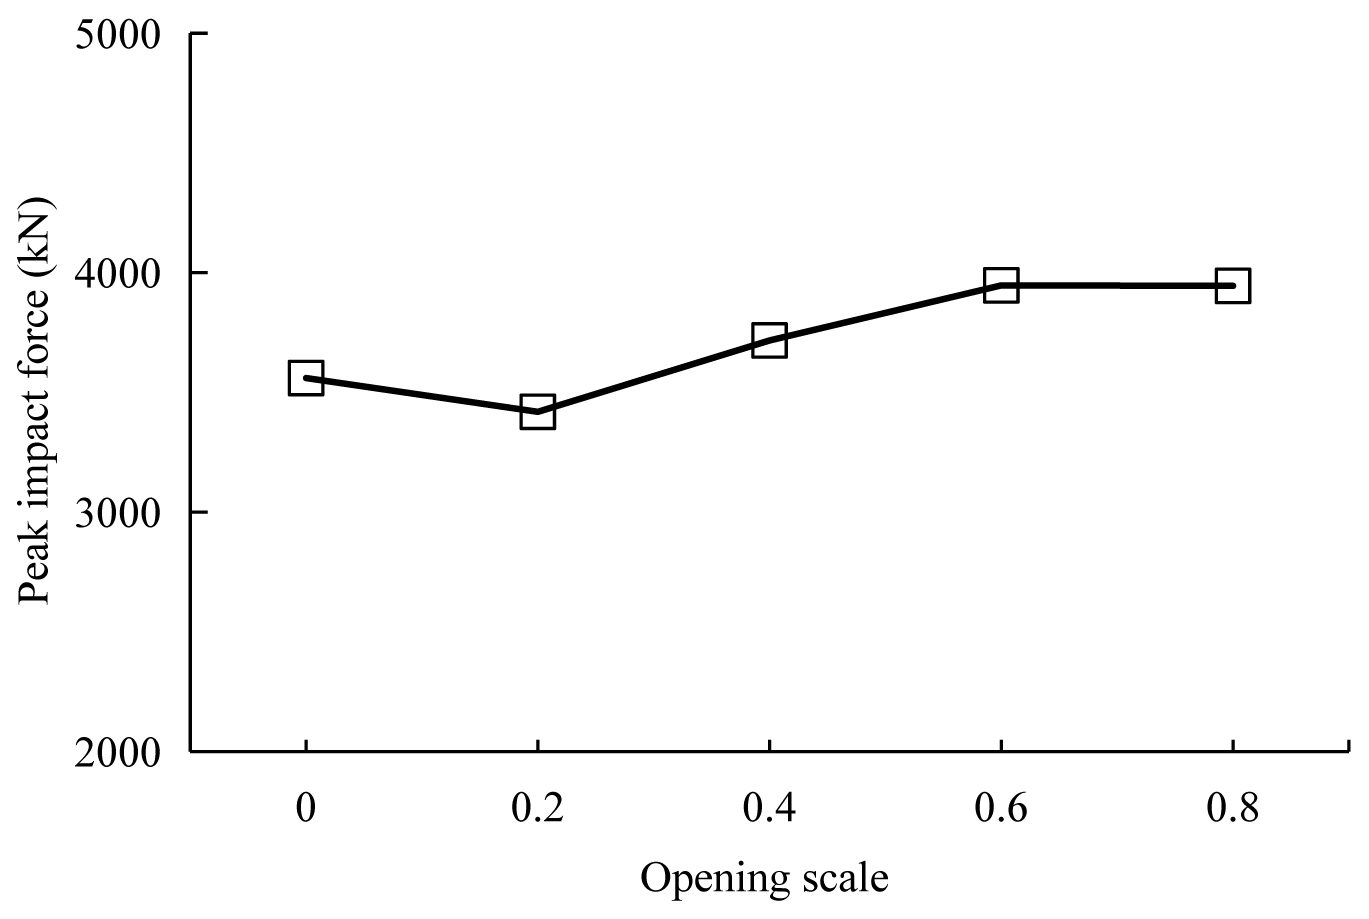
Figure 20Peak impact forces change with the target building's opening scale in the scenarios of Or90-Opx-Anull-Dnull.
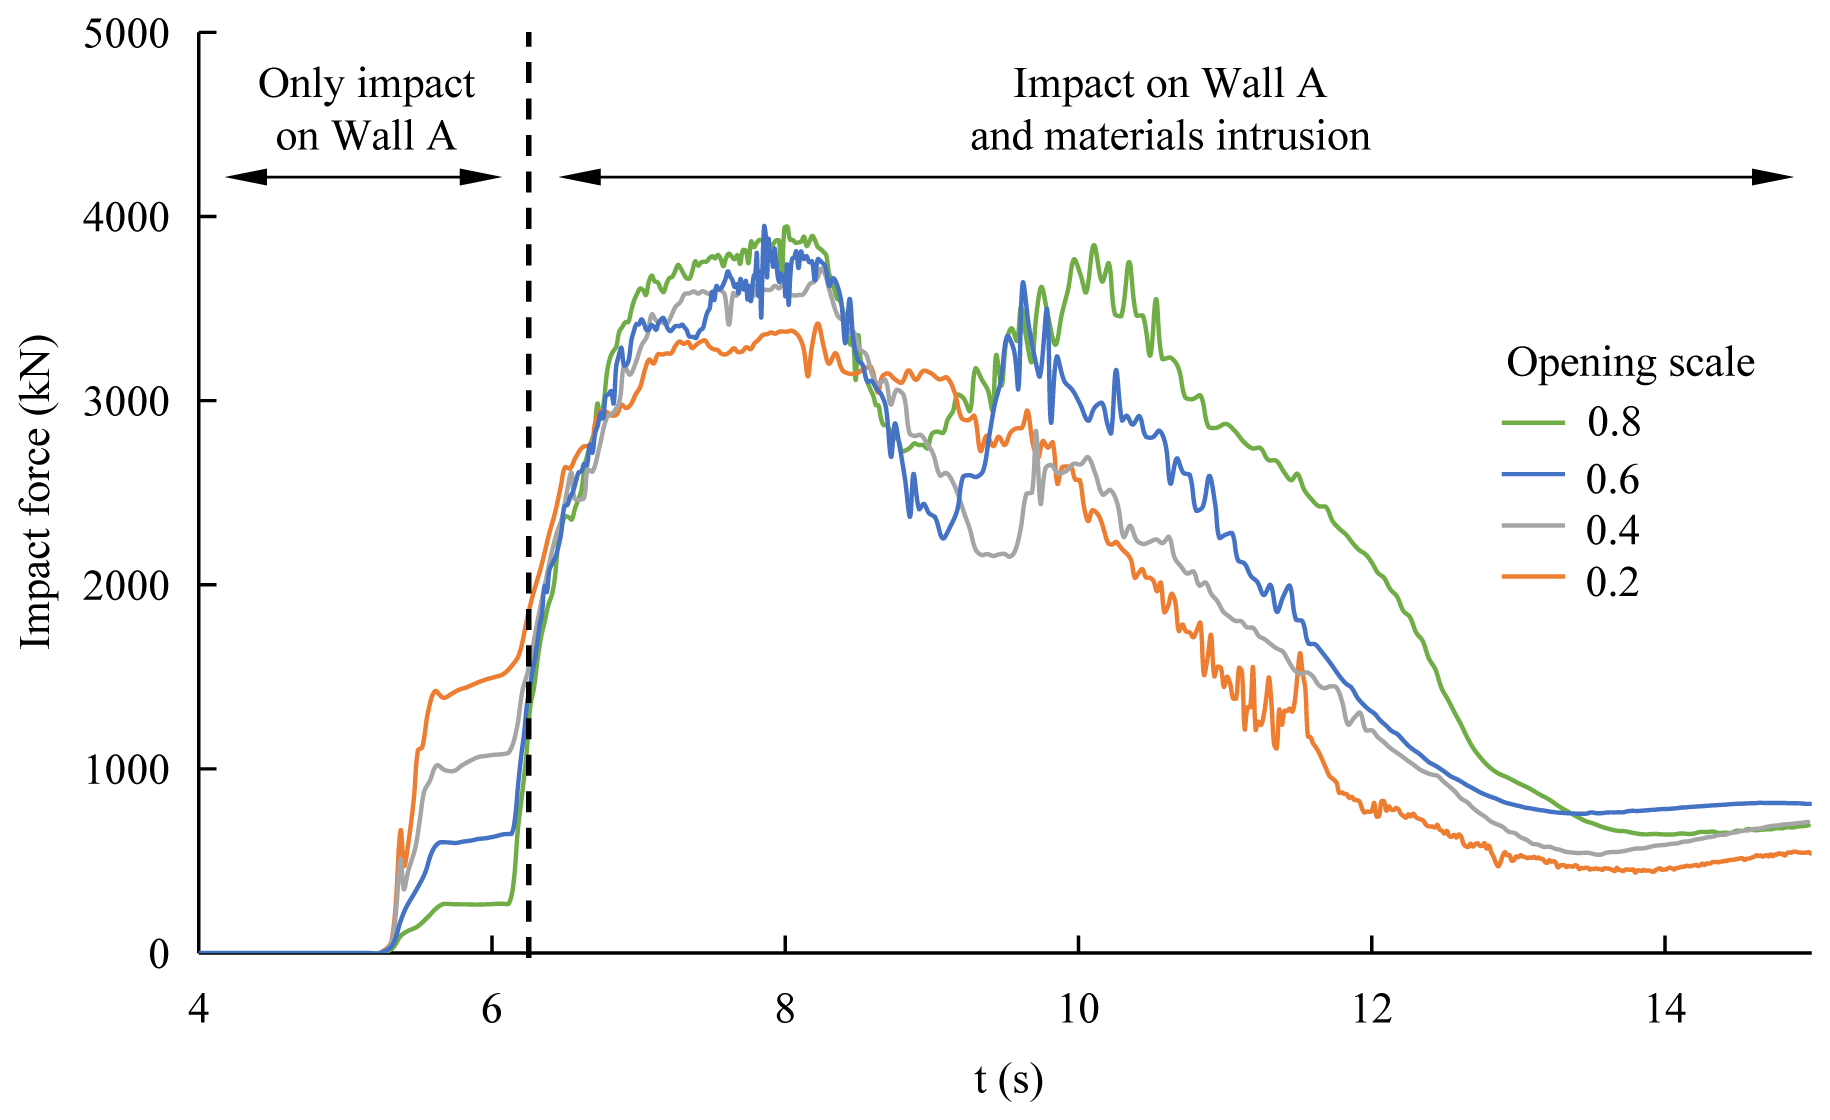
Figure 21Impact force time history with changing opening scales in the scenarios of Or90-Opx-Anull-Dnull after a simulation time of 4.0 s.
The effects of representative built environment parameters on the debris flow impacts on a whole building were explored through FLOW-3D simulations after validation with a published dam-break experiment. Four parameters influencing the impact responses of the whole building induced by debris flows were considered in this study: the orientation and opening scale of the target building and the azimuthal angle and distance of the surrounding buildings. The debris flow impact performance was evaluated using the measurable indicator of the peak impact force acting on the overall building. It is important to stress that the presented study and results were subject to a number of assumptions and limitations: (1) the type of debris flow was limited as mudflow or viscous debris flow, the solid was assumed to be mixed well with the fluid phase, and the sediment deposition was not considered; (2) the deposition fan was simplified for the modeling, for example, the drainage channel and bed scour had been ignored; (3) the inflow condition was different with the realistic debris flow hydrograph, the discharge was fixed as 500 m3 s−1 and duration was limited to 5s, and the peak impact force was treated as the maximum value within the computation time of 15 s. Finally, the main outcomes of the study may be outlined as follows:
-
The GSA based on metamodels with 160 cases reveals that the ranking of the importance of the built environment parameters on debris flow impacts from the results of total effect indices is azimuth angle (A) > distance (D) > orientation (Or) > opening scale (Op). The azimuth angle of the surrounding buildings alone contributes to 63.03 % of the overall variance of the debris flow peak impact load. The properties of the surrounding buildings, including the azimuth angle and distance, are found to have a more significant influence on the peak impact forces.
-
The azimuth angle has a shielding or canalization effect on debris flow impacts. The shielding effect, a form of reducing impact pressures, mainly appears in the scenarios with a surrounding building azimuth angle of 0∘. The canalization effect, caused by narrowing and redirecting of the flow path, is a form of increasing impact forces and occurs at an azimuth angle of 45∘. A deflection wall for building protection is recommended, as this provides a shielding effect. The interaction between the azimuth angle and distance can be divided into the amplification of the shielding effect and the reduction in the canalization effect. The former is where buildings are less impacted with a limited increase in distance within a shielding area. Further investigation on the effective area of shielding protection is needed. The latter is where the peak impact force induced by the canalization effect decreases rapidly with a greater distance. The ratio of the width of the narrowed flow path to the length of the target building has a significant effect on the variation in the impact forces, and the maximum peak impact pressure appears at a ratio of approximately one.
-
These parameters involving the building's impact response, including the impact contact area, approaching angle and flip-though impact, contribute to the debris flow impact forces when only the orientation factor is considered. A splitting wedge is recommended for an effective design, mitigating the threat of debris flow, and the main criterion is avoiding the highest flow depth – the maximum approaching angle – appearing near the longest wall element. The buildings with orientations of 30, 45 and 60∘ are more likely to be impacted by debris flows in a shielding area due to the exposed protruding parts produced by the building's rotations. As far as openings are concerned, although the mitigation performance of this single wall element has been proven, a limited effect on the whole building is observed when there is enough time for material intrusion.
It is obvious that the quantitative descriptions about the interactions between the built environment and impact forces can be useful to the built environment improvement and local adaptation measures for the impact force reduction, which are assumed as a low-cost and efficient approach for mitigating the building's structural damages. And more significantly, the present paper has extended the knowledge about the influence factors on debris flow intensity. It is demonstrated that some artificial building factors can not be ignored, except for the natural environments, in deciding the spatial pattern of the process intensity. Further research about their relative importance with the 3-D numerical simulation and sensitivity analysis can promote the relative intensity evaluation of the building, especially in terms of the indicator selection and weighting, which may open a future topic of the debris flow hazard assessment. For the building vulnerability assessment, the indicators can be mainly divided into two kinds: the exterior process intensity and interior building resistance. The process intensity, for example the flow depth, velocity, impact force or the other proxy, was assumed absolutely necessary, either in the curve-based approach or the indicator-based approach (Martinez-Carvajal et al., 2018). From the current literature, however, there is some confusion in selecting the surrounding factors and process intensity indicator. To be specific, some surrounding factors or also called protection factors, including the surrounding buildings, building row, wall around the building, natural barriers and so on, were still selected when the debris flow intensity had been indirectly considered (Dall'Osso et al., 2009, 2016; Papathoma-Köhle et al., 2019). These indicators should be independent of each other theoretically. From the views of the present paper, these surrounding factors have a significant influence on the process intensity. Therefore, the process intensity should be exclusive with the surrounding factors. The building feature factors are mainly considered to be acted on the building resistance, including the material, structure, number of stories, foundation strength and so on. However, it is not hard to find that some building indicators, for example the orientation, shape and openings, can rebuild the process intensity. As a result, the effect of the representative building feature indicators on the building vulnerability needs an in-depth discussion in future. Last but not least, a more universal, robust index may be developed using the numerical simulation approach, which can improve the locality limits resulting from the empirical data, to some extent.
The sensitivity analysis in this study is executed by the SobolGSA model (https://www.imperial.ac.uk/process-systems-engineering/research/free-software/sobolgsa-software/, upon registration; Kucherenko and Zaccheus, 2023).
All data used during the study are available from the corresponding author by request.
XH and ZZ contributed to the original idea and study design. XH, ZZ and GX participated in the field survey. XH and ZZ conducted the simulation and analysis. XH wrote the original manuscript, and ZZ and GX provided comments and revised the manuscript. All the co-authors contributed to scientific interpretations of the results.
The contact author has declared that none of the authors has any competing interests.
Publisher’s note: Copernicus Publications remains neutral with regard to jurisdictional claims in published maps and institutional affiliations.
This research has been supported by the National Natural Science Foundation of China (grant no. 41907396), the Science and Technology Research Program of the Chongqing Municipal Education Commission (grant no. KJQN201900535), the Chongqing Normal University Funding Program (grant no. 21XWB007), the Chongqing Normal University Postgraduate Research and Innovation Project (grant no. YKC21047), and the Scientific Research Project of the Department of Natural Resources of the Province of Sichuan (grant no. KJ-2021-14).
This paper was edited by David J. Peres and reviewed by Hernans Martinez and one anonymous referee.
Booker, A. J., Dennis, J. E., Rank, P. D., Serafini, D. B., Torczon, V., and Trosset, M. W. A rigorous framework for optimization of expensive functions by surrogates, Struct. Optimization, 17, 1–13, https://doi.org/10.1007/BF01197708, 1999.
Chen, M., Tang, C., Zhang, X., Xiong, J., and Li, M.: Quantitative assessment of physical fragility of buildings to the debris flow on 20 August 2019 in the Cutou gully, Wenchuan, southwestern China, Eng. Geol., 293, 106319, https://doi.org/10.1016/j.enggeo.2021.106319, 2021.
Choi, S. K., Lee, J. M., and Kwon, T. H.: Effect of slit-type barrier on characteristics of water-dominant debris flows: small-scale physical modeling, Landslides, 15, 111–122, https://doi.org/10.1007/s10346-017-0853-4, 2018.
Dall'Osso, F., Gonella, M., Gabbianelli, G., Withycombe, G., and Dominey-Howes, D.: A revised (PTVA) model for assessing the vulnerability of buildings to tsunami damage, Nat. Hazards Earth Syst. Sci., 9, 1557–1565, https://doi.org/10.5194/nhess-9-1557-2009, 2009.
Dall'Osso, F., Dominey-Howes, D., Tarbotton, C., Summerhayes, S., and Withycombe, G.: Revision and improvement of the PTVA-3 model for assessing tsunami building vulnerability using “international expert judgment”: introducing the PTVA-4 model, Nat. Hazards, 83, 1229–1256, https://doi.org/10.1007/s11069-016-2387-9, 2016.
Faisal, N. A. A., Ghani, A., and Salim, N.: The ability of wall openings to reduce flood induced forces on residential building, International Journal of GEOMATE, 14, 63–69, https://doi.org/10.21660/2018.46.7306, 2018.
Flow Science, Inc.: FLOW-3D v11.0.3 User Manual, Santa Fe, USA, 2014.
Franco, A., Moernaut, J., Schneider-Muntau, B., Strasser, M., and Gems, B.: Triggers and consequences of landslide-induced impulse waves-3D dynamic reconstruction of the Taan Fiord 2015 tsunami event, Eng. Geol., 294, 106384, https://doi.org/10.1016/j.enggeo.2021.106384, 2021.
Fuchs, S., Ornetsmüller, C., and Totschnig, R.: Spatial scan statistics in vulnerability assessment: an application to mountain hazards, Nat. Hazards, 64, 2129–2151, https://doi.org/10.1007/s11069-011-0081-5, 2012.
Fuchs, S., Keiler, M., and Zischg, A.: A spatiotemporal multi-hazard exposure assessment based on property data, Nat. Hazards Earth Syst. Sci., 15, 2127–2142, https://doi.org/10.5194/nhess-15-2127-2015, 2015.
Fuchs, S., Röthlisberger, V., Thaler, T., Zischg, A., and Keiler, M.: Natural hazard management from a coevolutionary perspective: Exposure and policy response in the European Alps, Ann. Am. Assoc. Geogr., 107, 382–392, https://doi.org/10.1080/24694452.2016.1235494, 2017.
Fuchs, S., Keiler, M., Ortlepp, R., Schinke, R., and Papathoma-Köhle, M.: Recent advances in vulnerability assessment for the built environment exposed to torrential hazards: Challenges and the way forward, J. Hydrol., 575, 587–595, https://doi.org/10.1016/j.jhydrol.2019.05.067, 2019.
Gao, L., Zhang, L. M., and Chen, H. X.: Two-dimensional simulation of debris flow impact pressures on buildings, Eng. Geol., 226, 236–244, https://doi.org/10.1016/j.enggeo.2017.06.012, 2017.
Gems, B., Mazzorana, B., Hofer, T., Sturm, M., Gabl, R., and Aufleger, M.: 3-D hydrodynamic modelling of flood impacts on a building and indoor flooding processes, Nat. Hazards Earth Syst. Sci., 16, 1351–1368, https://doi.org/10.5194/nhess-16-1351-2016, 2016.
Gomez-Gesteira, M. and Dalrymple, R. A.: Using a three-dimensional smoothed particle hydrodynamics method for wave impact on a tall structure, J. Waterw. Port. Coast., 130, 63–69, https://doi.org/10.1061/(ASCE)0733-950X(2004)130:2(63), 2004.
Hirt, C. W. and Nichols, B. D.: Volume of fluid (VOF) method for the dynamics of free boundaries, J. Comput. Phys., 39, 201–225, https://doi.org/10.1016/0021-9991(81)90145-5, 1981.
Hirt, C. W. and Sicilian, J. M.: A porosity technique for the definition of obstacles in rectangular cell meshes, 4th International Conference on Numerical Ship Hydrodynamics, Washington, D.C., 24 September 1985, 1–19, https://trid.trb.org/view/394627 (last access: 23 February 2023), 1985.
Hoffman, R. M., Sudjianto, A., Du, X., and Stout, J.: Robust piston design and optimization using piston secondary motion analysis, SAE Technical Paper, No. 2003-01-0148, https://doi.org/10.4271/2003-01-0148, 2003.
Holub, M. and Fuchs, S.: Mitigating mountain hazards in Austria – legislation, risk transfer, and awareness building, Nat. Hazards Earth Syst. Sci., 9, 523–537, https://doi.org/10.5194/nhess-9-523-2009, 2009.
Holub, M., Suda, J., and Fuchs, S.: Mountain hazards: reducing vulnerability by adapted building design, Environ. Earth Sci., 66, 1853–1870, https://doi.org/10.1007/s12665-011-1410-4, 2012.
Hu, K. H., Cui, P., and Zhang, J. Q.: Characteristics of damage to buildings by debris flows on 7 August 2010 in Zhouqu, Western China, Nat. Hazards Earth Syst. Sci., 12, 2209–2217, https://doi.org/10.5194/nhess-12-2209-2012, 2012.
Hu, Y., Chen, M., and Zhou, J.: Numerical simulation of the entrainment effect during mass movement in high-speed debris avalanches, Arab. J. Geosci., 12, 14, https://doi.org/10.1007/s12517-018-4199-6, 2019.
Hu, Y., Yu, Z., and Zhou, J.: Numerical simulation of landslide-generated waves during the 11 October 2018 Baige landslide at the Jinsha River, Landslides, 17, 2317–2328, https://doi.org/10.1007/s10346-020-01382-x, 2020.
Huang, X. and Tang, C.: Formation and activation of catastrophic debris flows in Baishui River basin, Sichuan Province, China, Landslides, 11, 955–967, https://doi.org/10.1007/s10346-014-0465-1, 2014.
Iverson, R. M., Logan, M., Lahusen, R. G., and Berti, M.: The perfect debris flow? Aggregated results from 28 large-scale experiments, J. Geophys. Res.-Earth, 115, F03005, https://doi.org/10.1029/2009JF001514, 2010.
Jakob, M., Stein, D., and Ulmi M.: Vulnerability of buildings to debris flow impact, Nat. Hazards, 60, 241–261, https://doi.org/10.1007/s11069-011-0007-2, 2012.
Jones, W. P. and Launder, B. E.: The prediction of laminarization with a two-equation model of turbulence, Int. J. Heat Mass Tran., 15, 301–314, https://doi.org/10.1016/0017-9310(72)90076-2, 1972.
Kim, M., Lee, S., Kwon, T., Choi, S., and Jeon, J.: Sensitivity analysis of influencing parameters on slit-type barrier performance against debris flow using 3D-based numerical approach, Intt. J. Sediment Res., 36, 50–62, https://doi.org/10.1016/j.ijsrc.2020.04.005, 2021.
Kim, M. J., Lee, S. R., Jeon, J. S., and Yoon, S.: Sensitivity analysis of bentonite buffer peak temperature in a high-level waste repository, Ann. Nucl. Energy, 123, 190–199, https://doi.org/10.1016/j.anucene.2018.09.020, 2019.
Kleijnen, J. P. C.: Regression and Kriging metamodels with their experimental designs in simulation: A review, Eur. J. Oper. Res., 256, 1–16, https://doi.org/10.1016/j.ejor.2016.06.041, 2016.
Kucherenko, S. and Zaccheus, O.: SobolGSA mode, Imperial College London [code], https://www.imperial.ac.uk/process-systems-engineering/research/free-software/sobolgsa-software/, last access: 23 February 2023.
Kucherenko, S., Albrecht, D., and Saltelli, A.: Exploring multi-dimensional spaces: a Comparison of Latin Hypercube and Quasi Monte Carlo Sampling Techniques, arXiv [preprint], https://doi.org/10.48550/arXiv.1505.02350, 10 May 2015.
Liang, H., Li, J., Liu, F., Zhang, L., Gang, F., Li, M., and He, S.: Simulation of debris flow impacting bridge pier tests based on smooth particle hydromechanics method, Rock and Soil Mechanics, 42, 1473–1484, https://doi.org/10.16285/j.rsm.2020.1107, 2021 (in Chinese with English abstract).
Liu, C., Yu, Z., and Zhao, S.: A coupled SPH-DEM-FEM model for fluid-particle-structure interaction and a case study of Wenjia gully debris flow impact estimation, Landslides, 18, 2403–2425, https://doi.org/10.1007/s10346-021-01640-6, 2021.
Luo, H. Y., Fan, R. L., Wang, H. J., and Zhang, L. M.: Physics of building vulnerability to debris flows, floods and earth flows, Eng. Geol., 271, 105611, https://doi.org/10.1016/j.enggeo.2020.105611, 2020.
Manawasekara, C., Mizutani, N., and Aoki, S.: Influence of openings and orientation on tsunami generated forces on buildings, Journal of Disaster Research, 11, 670–679, https://doi.org/10.20965/jdr.2016.p0670, 2016.
Martinez-Carvajal, H. E., de Moraes Guimaraes Silva, M. T., Garcia-Aristizabal, E. F., Aristizabal-Giraldo, E. V., and Larios-Benavides, M. A.: A mathematical approach for assessing landslide vulnerability, Earth Sci. Res. J., 22, 251–273, https://doi.org/10.15446/esrj.v22n4.68553, 2018.
Mazzorana, B., Simoni, S., Scherer, C., Gems, B., Fuchs, S., and Keiler, M.: A physical approach on flood risk vulnerability of buildings, Hydrol. Earth Syst. Sci., 18, 3817–3836, https://doi.org/10.5194/hess-18-3817-2014, 2014.
Mead, S. R., Magill, C., Lemiale, V., Thouret, J.-C., and Prakash, M.: Examining the impact of lahars on buildings using numerical modelling, Nat. Hazards Earth Syst. Sci., 17, 703–719, https://doi.org/10.5194/nhess-17-703-2017, 2017.
Papathoma-Köhle, M.: Vulnerability curves vs. vulnerability indicators: application of an indicator-based methodology for debris-flow hazards, Nat. Hazards Earth Syst. Sci., 16, 1771–1790, https://doi.org/10.5194/nhess-16-1771-2016, 2016.
Papathoma-Köhle, M., Gems, B., Sturm, M., and Fuchs, S.: Matrices, curves and indicators: A review of approaches to assess physical vulnerability to debris flows, Earth-Sci. Rev., 171, 272–288, https://doi.org/10.1016/j.earscirev.2017.06.007, 2017.
Papathoma-Köhle, M., Schlögl, M., and Fuchs, S.: Vulnerability indicators for natural hazards: an innovative selection and weighting approach, Sci. Rep., 9, 15026, https://doi.org/10.1038/s41598-019-50257-2, 2019.
Saltelli, A., Annoni, P., Azzini, I., Campolongo, F., and Tarantola, S.: Variance based sensitivity analysis of model output. Design and estimator for the total sensitivity index, Comput. Phys. Commun., 181, 259–270, https://doi.org/10.1016/j.cpc.2009.09.018, 2010.
Sarrazin, F., Pianosi, F., and Wagener, T.: Global sensitivity analysis of environmental models: Convergence and validation, Environ. Modell. Softw., 79, 135–152, https://doi.org/10.1016/j.envsoft.2016.02.005, 2016.
Sobol, I. M.: Sensitivity estimates for nonlinear mathematical models, Math. Model. Comput. Exp,, 1, 407–414, 1993.
Sobol, I. M., Asotsky, D., Kreinin, A., and Kucherenko, S.: Construction and comparison of high-dimensional Sobol' generators, Wilmott, 2011, 64–79, https://doi.org/10.1002/wilm.10056, 2011.
Song, D., Chen, X., Zhou, G. G. D., Lu, X., Cheng, G., and Chen, Q.: Impact dynamics of debris flow against rigid obstacle in laboratory experiments, Eng. Geol., 291, 106211, https://doi.org/10.1016/j.enggeo.2021.106211, 2021.
Sturm, M., Gems, B., Keller, F., Mazzorana, B., Fuchs, S., Papathoma-Köhle, M., and Aufleger, M.: Understanding impact dynamics on buildings caused by fluviatile sediment transport, Geomorphology, 321, 45–59, https://doi.org/10.1016/j.geomorph.2018.08.016, 2018a.
Sturm, M., Gems, B., Keller, F., Mazzorana, B., Fuchs, S., Papathoma-Köhle, M., and Aufleger, M.: Experimental analyses of impact forces on buildings exposed to fluvial hazards, J. Hydrol., 565, 1–13, https://doi.org/10.1016/j.jhydrol.2018.07.070, 2018b.
Takahashi, T.: Debris Flow Mechanics, Prediction and Countermeasures, Taylor & Francis Group, London, UK, ISBN 978-0-203-94628-2, 2007.
Tang, C., Rengers, N., van Asch, Th. W. J., Yang, Y. H., and Wang, G. F.: Triggering conditions and depositional characteristics of a disastrous debris flow event in Zhouqu city, Gansu Province, northwestern China, Nat. Hazards Earth Syst. Sci., 11, 2903–2912, https://doi.org/10.5194/nhess-11-2903-2011, 2011.
Totschnig, R., Sedlacek, W., and Fuchs, S.: A quantitative vulnerability function for fluvial sediment transport, Nat. Hazards, 58, 681–703, https://doi.org/10.1007/s11069-010-9623-5, 2011.
Yin, Y. P., Huang, B., Chen, X., Liu, G., and Wang, S.: Numerical analysis on wave generated by the Qianjiangping landslide in Three Gorges Reservoir, China, Landslides, 12, 355–364, https://doi.org/10.1007/s10346-015-0564-7, 2015.
Zeng, C., Cui, P., Su, Z., Lei, Y., and Chen, R.: Failure modes of reinforced concrete columns of buildings under debris flow impact, Landslides, 12, 561–571, https://doi.org/10.1007/s10346-014-0490-0, 2015.
Zhang, J., Termaath, S., and Shields M. D.: Imprecise global sensitivity analysis using bayesian multimodel inference and importance sampling, Mech. Syst. Signal Pr., 148, 107162, https://doi.org/10.1016/j.ymssp.2020.107162, 2021.
Zhang, S., Zhang, L., Li, X., and Xu, Q.: Physical vulnerability models for assessing building damage by debris flows, Eng. Geol., 247, 145–158, https://doi.org/10.1016/j.enggeo.2018.10.017, 2018.
Zhang, Y., Chen, J., Tan, C., Bao, Y., Han, X., Yan, J., and Mehmood, Q.: A novel approach to simulating debris flow runout via a three-dimensional CFD code: a case study of Xiaojia Gully, B. Eng. Geol. Environ., 80, 5293–5313, https://doi.org/10.1007/s10064-021-02270-x, 2021.
Zhuang, Y., Yin, Y., Xing, A., and Jin, K.: Combined numerical investigation of the Yigong rock slide-debris avalanche and subsequent dam-break flood propagation in Tibet, China, Landslides, 17, 2217–2229, https://doi.org/10.1007/s10346-020-01449-9, 2020.