the Creative Commons Attribution 4.0 License.
the Creative Commons Attribution 4.0 License.
 | 27 Feb 2023
Improving the predictability of the Qendresa Medicane by the assimilation of conventional and atmospheric motion vector observations. Storm-scale analysis and short-range forecast
Diego S. Carrió
The coastal population in the western Mediterranean Basin is frequently affected by high-impact weather events that produce huge economic and human losses. Among the wide spectrum of maritime severe weather events, tropical-like Mediterranean cyclones (a.k.a. medicanes) draw particular attention, specially due to their poor predictability. The accurate prediction of this kind of event still remains a key challenge to the weather forecast community, mainly because of (i) errors in the initial conditions, (ii) lack of accuracy of modeling micro-scale physics processes and (iii) chaotic behavior inherent to numerical weather prediction models. The 7 November 2014 Qendresa Medicane, that took place over the Sicilian channel affecting the islands of Lampedusa, Pantelleria and Malta, was selected for this study because of its extremely low predictability behavior in terms of its track and intensity. To enhance the prediction of Qendresa, a high-resolution (4 km) ensemble-based data assimilation technique, known as ensemble Kalman filter (EnKF), is used. In this study, both in situ conventional and satellite-derived observations are assimilated with the main objective of improving Qendresa's model initial conditions and thus its subsequent forecast. The performance of the EnKF system and its impact on the Qendresa forecast are quantitatively assessed using different deterministic and probabilistic verification methods. A discussion in terms of the relevant physical mechanisms adjusted by the EnKF is also provided. Results reveal that the assimilation of both conventional and satellite-derived observations improves the short-range forecasts of the trajectory and intensity of Qendresa. In this context, the relevance of assimilating satellite-derived observations to improve the pre-convective estimation of Qendresa's upper-level dynamics is shown, which is key to obtain a realistic track and intensity forecast of this event.
- Article
(13809 KB) - Full-text XML
- Companion paper
- BibTeX
- EndNote


The western Mediterranean region is often affected by high-impact weather phenomena (e.g., tornadoes, hail storms, tropical cyclones or flash floods) which produce huge economic losses and fatalities. Although numerical weather prediction models have significantly improved during the last few years, the proper prediction of such extreme weather events (timing and location) in the western Mediterranean remains a challenge. Many extreme weather events affecting the Mediterranean coastlands initiate over the sea, where in situ observations are scarce. This lack of information impacts negatively on the representation of the initial state of the atmosphere and consequently on the accuracy of the numerical forecasts (Wu et al., 2013). Over the last few years, different sophisticated methods have been designed and implemented to improve the estimation of the atmospheric state in numerical weather prediction models from both in situ and remote sensing instruments, such as Doppler radars or meteorological instruments on board satellites (Rabier, 2005; Palmer and Hagedorn, 2006; Shen et al., 2016; Geer et al., 2018). These methods are known as data assimilation (DA) techniques (Daley, 1993; Evensen, 2009; Kalnay, 2003), which basically combines information from numerical weather prediction forecasts with all the available observations to create a new set of initial conditions that better represent the current state of the atmosphere.
Among the entire set of high-resolution observation platforms available, the assimilation of both ground-based radar (e.g., Snyder and Zhang, 2003) and satellite (Jones et al., 2015) observations have been demonstrated to be very valuable in order to enhance the predictability of tropical cyclones, heavy precipitation events or even tornadoes. Several studies have shown the benefits of assimilating radar data and found that both radial velocity and reflectivity observations provide information leading to improvements of convective-scale analyses and their corresponding forecasts (Snyder and Zhang, 2003; Dowell et al., 2004; Tong and Xue, 2005; Dawson et al., 2012; Aksoy et al., 2009; Yussouf et al., 2013). In general, radar data assimilation studies are focused on performing accurate analysis of already mature convective systems with the main aim of improving the very short-range forecasts (i.e., minutes–few hours) of severe weather events, such as storm-scale tornado circulations. However, the correct representation of the pre-convective environment, which is key to obtain short-range (i.e., hours–few days) forecasts, has received somewhat less attention. Improving the time and location forecast of convection initiation has been demonstrated to be a significant challenge (Kain et al., 2013), and for this reason the research line focused on determining a way to include information relating to convection initiation into the numerical model is receiving greater interest in the research community (Mecikalski et al., 2013). In general, radar instruments are located inland, and thus, they are typically used to study extreme weather phenomena that take place over land. Although they provide valuable high-temporal–space information on the initiation and development of different kinds of weather events, an obvious disadvantage is the fact that they can not provide valuable information about weather events that are first initiated offshore and afterwards impact populated coastal areas, producing high socio-economic losses, such as tropical cyclones.
Due to the limited oceanic and maritime coverage of meteorological radars, the assimilation of satellite-derived observations emerged as a potential solution (Vukicevic et al., 2004, 2006; Polkinghorne et al., 2010; Polkinghorne and Vukicevic, 2011; Zupanski et al., 2011; Jones et al., 2013; Zhang et al., 2013). Current satellite instruments provide high-spatial and high-temporal observational coverage of the whole globe, solving the radar problem over maritime bodies. Assimilation of satellite observations is actually performed following two different approaches. The first approach consists of assimilating direct satellite infrared and microwave radiances via a radiative transfer model (RTM) (Vukicevic et al., 2004; McNally et al., 2006; Otkin, 2010; Zupanski et al., 2011). This approach has the main advantage that it avoids uncertainties associated with various retrieval algorithms that differ from satellite to satellite (Derber and Wu, 1998; Errico, 2000) and generally performs best in clear-sky regions. However, the assimilation of cloudy radiances increases the uncertainties and adds the complication of potential differences in cloud microphysics assumptions between the model and the RTM (Zupanski et al., 2011). Satellite radiances usually contain high correlated errors between different frequency bands (Bormann and Bauer, 2010), hampering its proper assimilation without introducing significant errors. Furthermore, radiance observations are frequently biased, which is particularly significant when convective scales are considered, considerably limiting the assimilation and in consequence the forecast skill. Although recent bias correction methods have shown benefits in global data assimilation configurations (e.g., Derber and Wu, 1998; Fertig et al., 2009; Miyoshi et al., 2010; Kumar et al., 2012; Otkin et al., 2018; Ma et al., 2020), the procedure for regional data assimilation is not well established. The second method used to assimilate satellite data is through the use of derived products, known as retrievals, such as profiles of geophysical quantities (T, q, CO, etc.) or cloud water paths. Retrievals are easier to assimilate and interpret, because they provide information that can be directly related with atmospheric variables, and its assimilation avoids the use of relatively complex RTM. However, one should always consider that atmospheric retrievals are sensitive to many factors, including the first guess that usually comes from a coarse global numerical weather model that could result too inaccurate (Hannon et al., 1996; Li et al., 2000; Zhang et al., 2014). To avoid dealing with nonlinearities associated with the assimilation of radiance observations using RTM, only satellite-derived products will be considered in this study.
Over the last few years, much efforts have been dedicated to improving the forecasting of tropical cyclones (TCs), which can cause flooding, heavy rain and strong winds, resulting in numerous casualties and huge property damage. Despite the recent improvements of numerical weather prediction (NWP) systems, the correct forecasting of TC track and intensity remains a big challenge (DeMaria et al., 2014; Dorian et al., 2018; Choy et al., 2020; Walker et al., 2020). In addition, a TC's life cycle occurs mainly over the ocean, where a lack of in situ observations are present, and thus limiting our ability to determine potentially relevant aspects of the atmospheric state. Data assimilation techniques play a crucial role in improving the knowledge of initial conditions and the subsequent forecasts through the effective use of the available observations. Thus, assimilating special observations collected during field experiments (e.g., aircraft or rawinsonde) and satellite-derived observations over the ocean is expected to produce a more accurate representation of the initial conditions and their respective forecasts of these extreme weather events. Among the wide variety of satellite-derived products, atmospheric motion vectors (AMVs) have been found to improve TC track forecasts in global numerical weather prediction systems (e.g., Le Marshall et al., 2008; Goerss, 2009; Langland et al., 2009). AMVs provide information on the local horizontal wind covering with great detail the mid- and upper-tropospheric layers over the ocean. They are derived from sequential satellite images by tracking the motion of targets including cirrus clouds, gradients in water vapor and small cumulus clouds (Velden et al., 1997). Much attention has recently been paid to the impact of assimilating AMV observations, as well as investigating the mitigation of the negative impacts of correlated data from remote sensing instruments. These studies highlight the impact of such observations on the TC track and structure, leaving the discussion about the intensity of the cyclone in the background (Houze et al., 2006).
A particular type of Mediterranean cyclone has drawn the attention of the meteorological scientific community. These cyclones share some morphological characteristics with TCs, such as having a warm core, axisymmetry and a cloud-free eye. In consequence, they are referred to as medicanes, which is the acronym of Mediterranean hurricanes (Emanuel, 2005). These cyclones are relatively small in size and are associated with strong winds and heavy precipitation (Ernst and Matson, 1983; Rasmussen and Zick, 1987; Lagouvardos et al., 1999; Fita et al., 2007), generating high impacts on exposed people and property assets (Jansa et al., 2001; Gómez et al., 2003; De Zolt et al., 2006). Although several studies have investigated this kind of phenomena (Jansa et al., 2014), physical mechanisms of medicanes are still poorly understood, and the numerical predictability of such events is considerably low. This is mainly due to the small size of these cyclones, the strong heat fluxes from the sea and the lack of in situ observations present in the Mediterranean Sea.
It is important to note that, although conventional and AMV observations have already been assimilated for some TC events (e.g., Pu et al., 2008; Romine et al., 2013; Wu et al., 2014), the conclusions obtained from these studies might not be suitable for medicane events taking place in the Mediterranean Basin. Indeed, as far as the author is aware at the time of writing this paper, the present study assesses for the first time the potential of assimilating AMVs to improve the predictability of a medicane. The proper assimilation of observations in this area also represents a major challenge due to the lack of available in situ observations and their location over complex topography, seriously affecting the quality control (QC) process of such observations and thus their correct assimilation. Taking into account this challenge, one of the main objectives of this study is to find the most efficient way of using the available observations to obtain an accurate representation of the genesis and evolution of a medicane. Among the different available medicanes, the so-called Qendresa, which took place in southern Sicily between 7 and 8 November 2014 and was poorly forecasted, was selected to perform this study. More precisely, the correct prediction of both the northward loop trajectory followed by Qendresa and its intensification still remain a major challenge for most current mesoscale convection-permitting numerical weather models (Carrió et al., 2017; Pytharoulis et al., 2018; Cioni et al., 2018; Noyelle et al., 2019; Bouin and Lebeaupin Brossier, 2020). Results obtained from high-resolution numerical sensitivity experiments indicated the relevant role of the upper-level potential vorticity (PV) effect on its cyclogenesis during early stages of the event (Carrió et al., 2017), helping to set up a favorable environment for deep convection, intense latent heat release and thus, the medicane development. Therefore, with the aim of improving the representation of the upper-level dynamics of Qendresa and consequently its predictability, the assimilation of AMV observations is conducted in this study.
Overall, the present study is focused for the first time on the improvement of the predictability of the Qendresa Medicane through the assimilation of in situ conventional and high-temporal- and high-spatial-resolution satellite-derived observations using the advanced EnKF data assimilation technique (Evensen, 2003). This study is structured as follows. In Sect. 2 a brief description of the Qendresa Medicane is presented. Section 3 provides information about the numerical tools and the experimental configuration used for the simulations that are planned to be performed. Results from the assimilation of different observations and their impact on the short-range forecast are provided in Sect. 4. Finally, conclusions and further work is presented in Sect. 5.
During 7 November 2014 an intense small cyclonic system with tropical-like features (medicane) affected the western and central Mediterranean Basin. This small cyclonic system initiated in the Sicilian channel during the first hours of 7 November and evolved east–north-eastward, reaching its maximum intensity over Malta, where it was categorized as a medicane. At this moment, a small well-defined spiral-to-circular cloud shape showing a clear eye was visible through Meteosat Second Generation imagery (Fig. 1). In addition, intermittent deep convection around the eyer was also observed. In the following hours, the medicane continued progressing north-eastward towards the eastern coast of Sicily (Catania), where it started its dissipation phase when it made landfall.
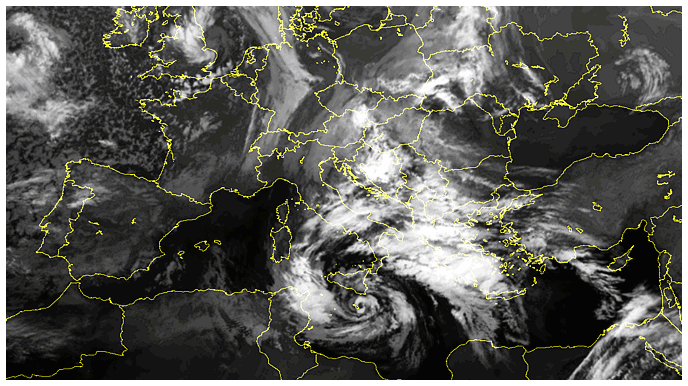
Figure 1IR-MSG satellite imagery at 18:00 UTC on 7 November 2014.
This episode was influenced by the upper-level synoptic situation that was mainly dominated by an intense trough associated with a PV streamer extending from northern Europe to southern Algeria (Africa). At the surface, general cyclonic circulation was present over the western Mediterranean influenced by the North Atlantic Subtropical High system and a high-pressure system over the eastern Mediterranean. During 6 November, the upper-level trough became negatively tilted, and the PV streamer eventually disconnected from the northern nucleus, evolving into an intense upper-level cutoff during the late hours of 7 November. A more detailed description of the synoptic situation associated with this medicane event and the physical mechanisms involved in the genesis and posterior evolution of this medicane through high-resolution numerical sensitivity experiments can be found in Carrió et al. (2017). Overall, results obtained from these sensitivity experiments indicated the relevant role of the upper-level PV effect on the medicane development.
The present study aims to highlight the main challenges in accurately predicting this type of small-scale intense cyclones in terms of both trajectory and intensity features, in addition to shedding light on the limitations exposed by sophisticated data assimilation techniques, such as the EnKF. It is hypothesized that the low predictability of Qendresa is likely associated with the difficulty of current mesoscale convection-permitting numerical weather models to accurately depict the atmospheric state (i.e., initial conditions) of the cyclone over the sea (southern Sicily), due to the lack of in situ observations present. To assess the potential of the EnKF in improving the predictability of this extreme weather event, we compare the trajectory and intensity features obtained by the assimilation of different available weather instruments. Due to the lack of in situ observations present over the maritime region where the medicane took place, infrared imagery was used as a proxy to visually identify the center of the cyclone and estimate the track followed by Qendresa (Fig. 2). It is observed how the cyclone initiated over the Pantelleria region and during the subsequent hours it moved eastwards, becoming a tropical-like cyclone, and sweeping across Malta, where it was reflected northeastwards, reaching the offshore of Catania. Finally, when the cyclone started its dissipation phase, the cyclone suffered an abrupt cyclonic counterclockwise deviation, towards the eastern coast of Sicily, when it made landfall. The accurate prediction of this loop-like trajectory poses a clear challenge to current convection-permitting numerical models, mainly because of a misrepresentation of the upper-level dynamics (see Carrió et al., 2017; Pytharoulis et al., 2018; Mylonas et al., 2019). Therefore, the assimilation of AMVs is expected to improve the prediction of the cyclone track and also the prediction of its intensity.
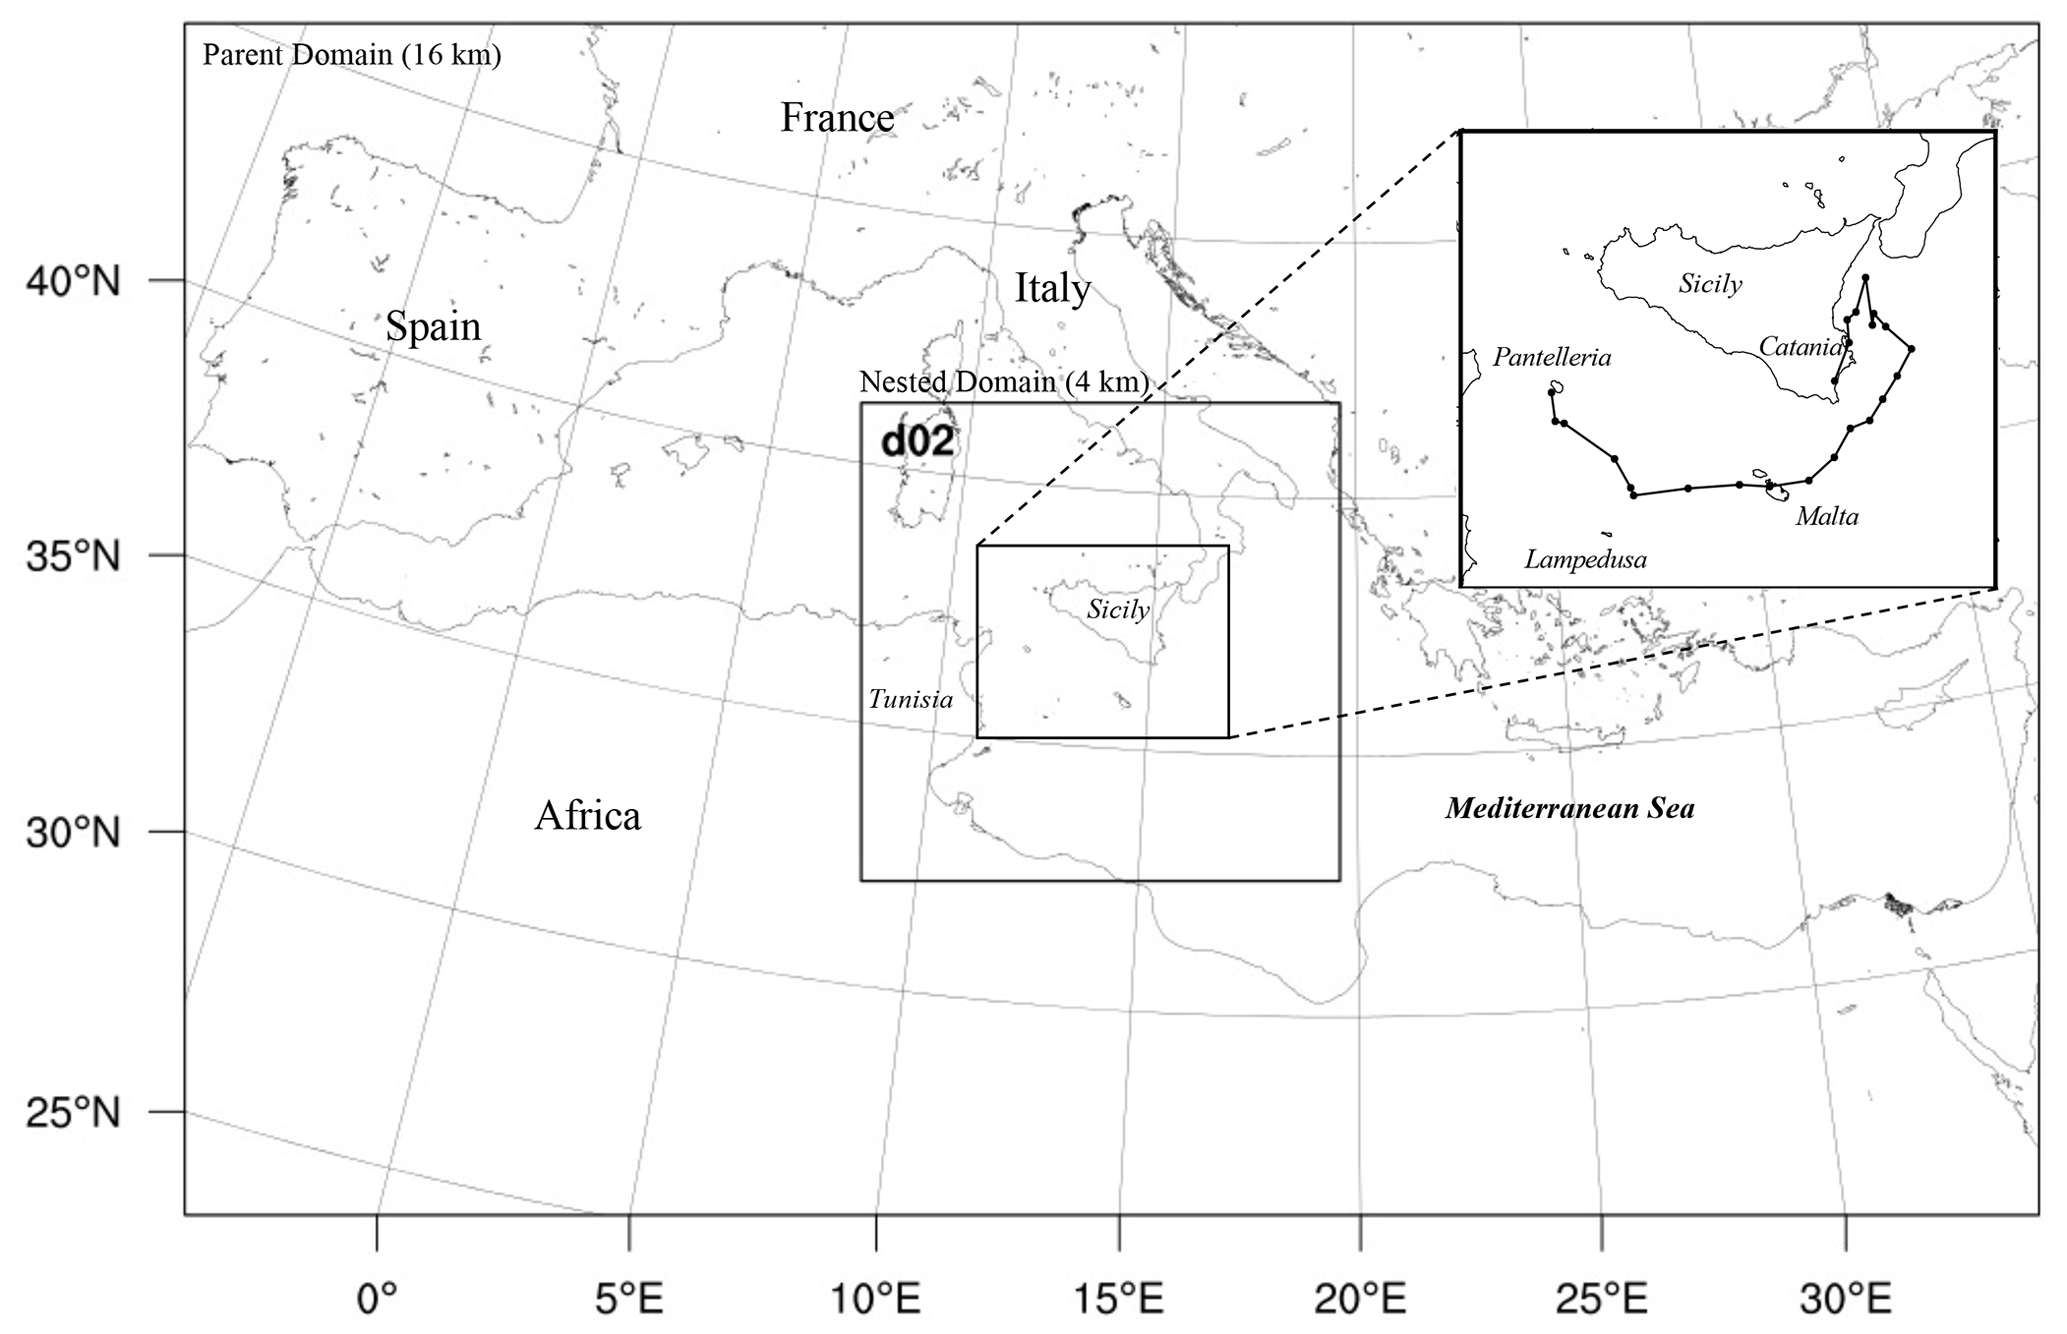
Figure 2Numerical domain used for the multi-scale simulations performed in this study. The top-right embedded diagram shows the observed track of the medicane viewed from infrared satellite imagery.
In terms of the intensification of the medicane, and taking into account the scarce number of observations over the sea, METAR reports from land locations close to the cyclone path (i.e., Pantelleria, Lampedusa, Malta and the Catanian coast for geographical references) were used to provide direct measurements of the small cyclone (Fig. 3). In particular, during the afternoon of 7 November the center of the cyclone crossed right over Luqa airport (Malta), so the pressure registered by the station can be treated as a good representation of the surface pressure section across the cyclone at that time. The barometer recorded a pressure drop of nearly 20 hPa in 6 h and a minimum pressure value of 985 hPa at 16:45 UTC. In addition, wind values registered in Malta also provide valuable information about the shape and symmetry of the cyclone. In particular, intense wind speeds with gusts exceeding 42.7 m s−1 that precedes and follows a relatively calmed period around 16:45 UTC provides a clear signature of the cyclone's eye structure (Fig. 3).
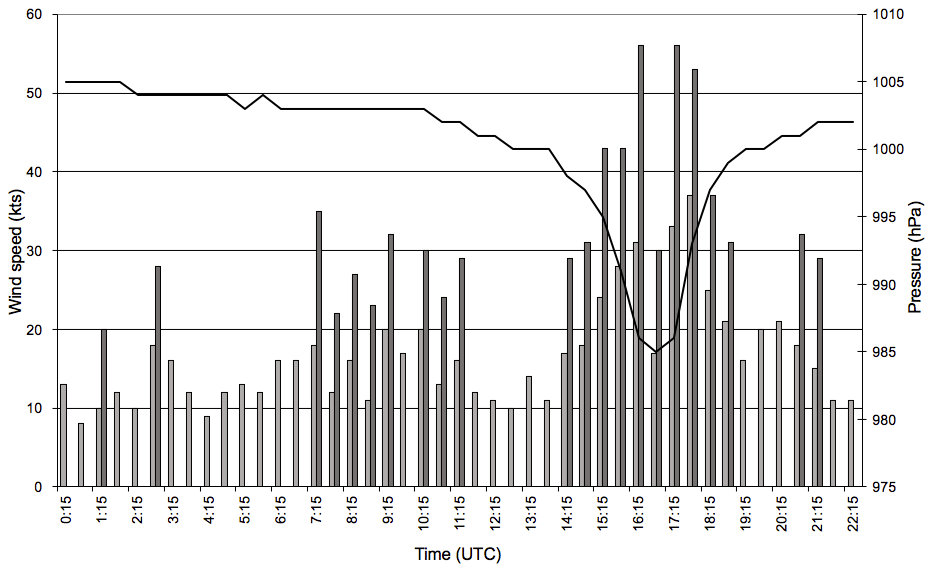
Figure 3Surface pressure (hPa, solid line), sustained wind and gusts (m s−1, light and dark gray bars, respectively) from the METAR station in Malta. Indicated times (in UTC) are for 7 November 2014.
3.1 Numerical weather model
The numerical simulations presented in this study are performed using version 3.7 of the Advanced Weather Research and Forecasting Model (WRF-ARW, Skamarock et al., 2008). These simulations used a multi-scale ensemble system based on two one-way nested domains to better account for mesoscale and storm-scale processes involved in the genesis and evolution of Qendresa (Fig. 2). The parent domain is centered over the central part of the Mediterranean Sea, covering most of the European region and the northern part of Africa, with a horizontal grid resolution of 16 km and 51 terrain-following η levels up to 50 hPa (). The nested domain is centered over Sicily (southern Italy) with a grid resolution of 4 km (). The numerical experiments are performed using a 36-member ensemble, which was designed as in Carrió and Homar (2016), using initial and boundary conditions from the EPS-ECMWF, which has a horizontal and vertical spectral triangular truncation of T639L62 (∼31 km horizontal grid resolution).
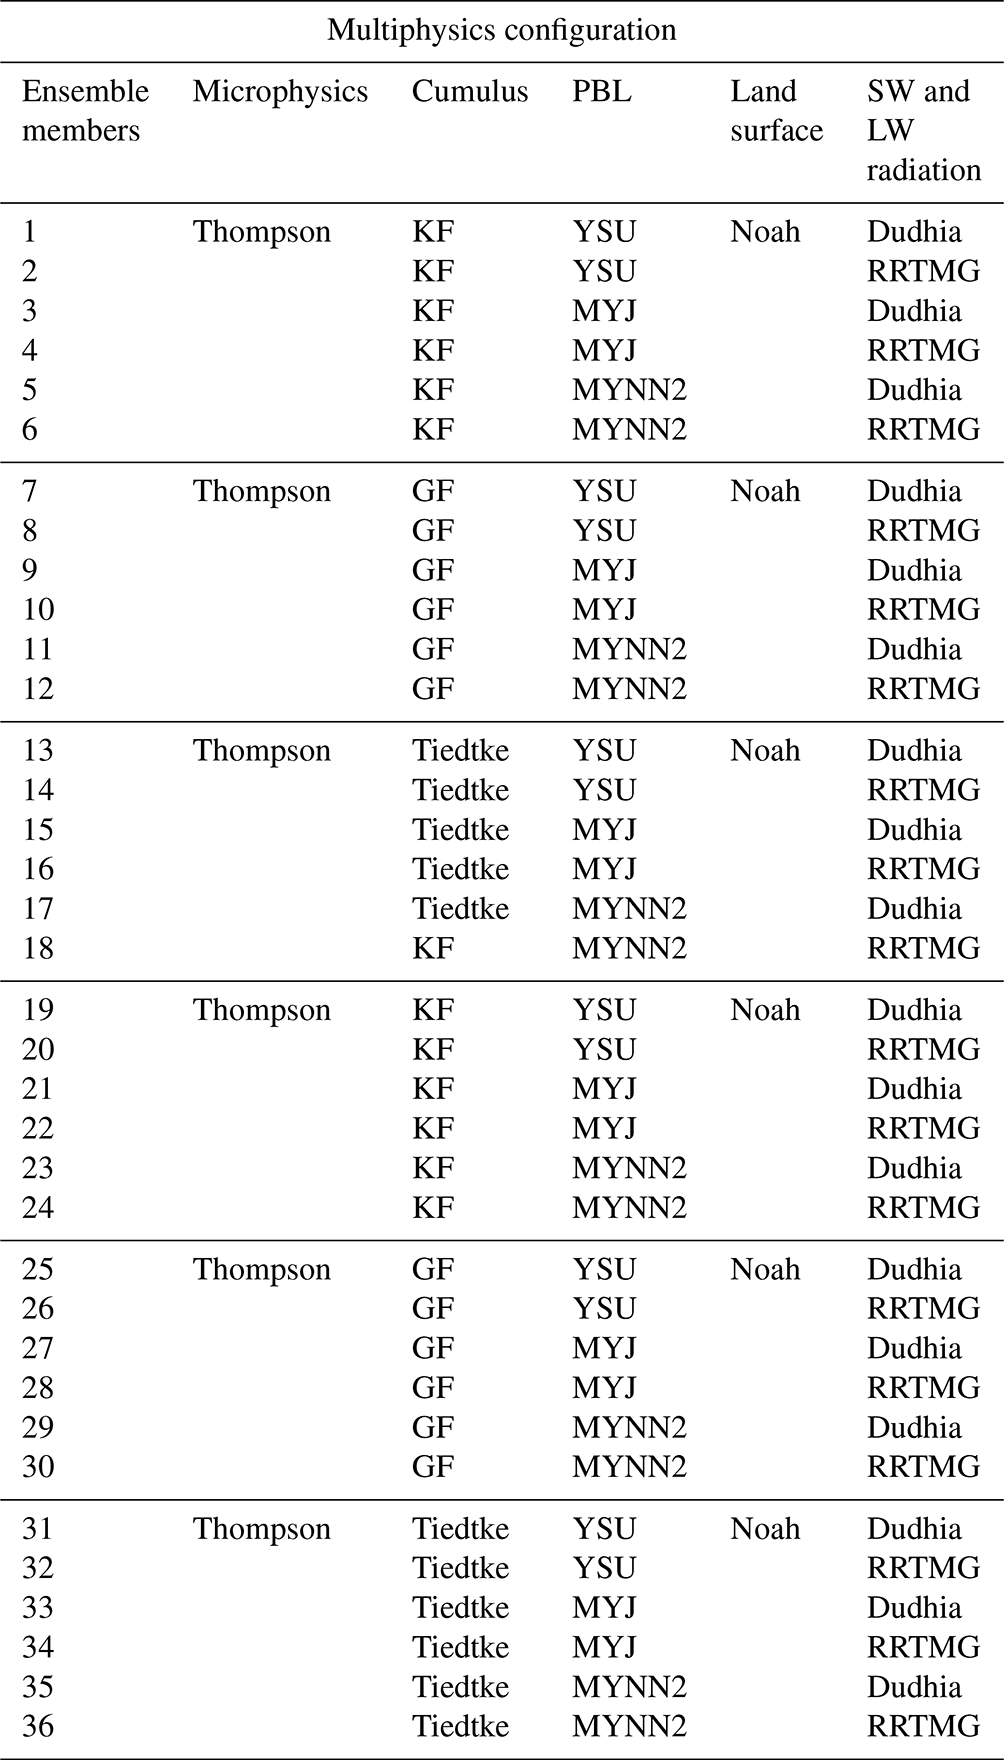
To address the uncertainties in the numerical model different combinations of physics schemes were used among its members (Table 1). In particular, the physics variability includes three planetary boundary layer (PBL) schemes (Yonsei University (Hong et al., 2006), Mellor–Yamada–Janjić (Janjic, 1990), and Mellor–Yamada–Nakanishi–Niino level 2.5 (Nakanishi and Niino, 2006)), two short- and longwave radiation (SW and LW) schemes (Dudhia (Dudhia, 1989) and RRTMG (Iacono et al., 2008)), and three cumulus parameterization schemes (Kain–Fritsch (Kain and Fritsch, 1990; Kain, 2004), Tiedtke (Tiedtke, 1989), and Grell–Freitas (Grell and Freitas, 2014)). Common to all the ensemble members we have the Thompson microphysics (Thompson et al., 2004). The above-mentioned parameterization schemes are identical for the parent and inner numerical domains. Note that the main objective of this paper is not to investigate the sensitivity of grid resolution and the role of different parameterizations to the Qendresa forecast skill. However, if one is interested in the potential effect of these aspects to the Qendresa forecast, see recent work from Pytharoulis et al. (2018) and Mylonas et al. (2019).
Table 1Multi-physics parameterizations used on the WRF ensemble system presented in this study. Here PBL, SW and LW stand for planetary boundary layer, shortwave and longwave, respectively.
3.2 Observations
In order to improve the initial conditions of Qendresa over the sea and in consequence, its forecast towards populated areas, two different observational sources of information were assimilated: the in situ conventional and the satellite-derived observations. Conventional in situ observations were obtained from the global Meteorological Assimilation Data Ingest System (MADIS), where meteorological variables such as temperature, humidity, pressure, and both wind speed and direction are collected from rawinsondes, buoys, ship reports, aircrafts (ACARs) and also from meteorological aerodrome reports (METARs), among others. One of the main advantages of using MADIS observations is the fact that they are quality controlled through spatial and temporal consistency checks.1 For this particular study, only observations from buoys, METARs and rawinsondes have been considered, providing data every hour and covering the entire Mediterranean region. However, it is noteworthy that the maritime area where the medicane took place remains poorly observed by in situ instruments (Fig. 4).
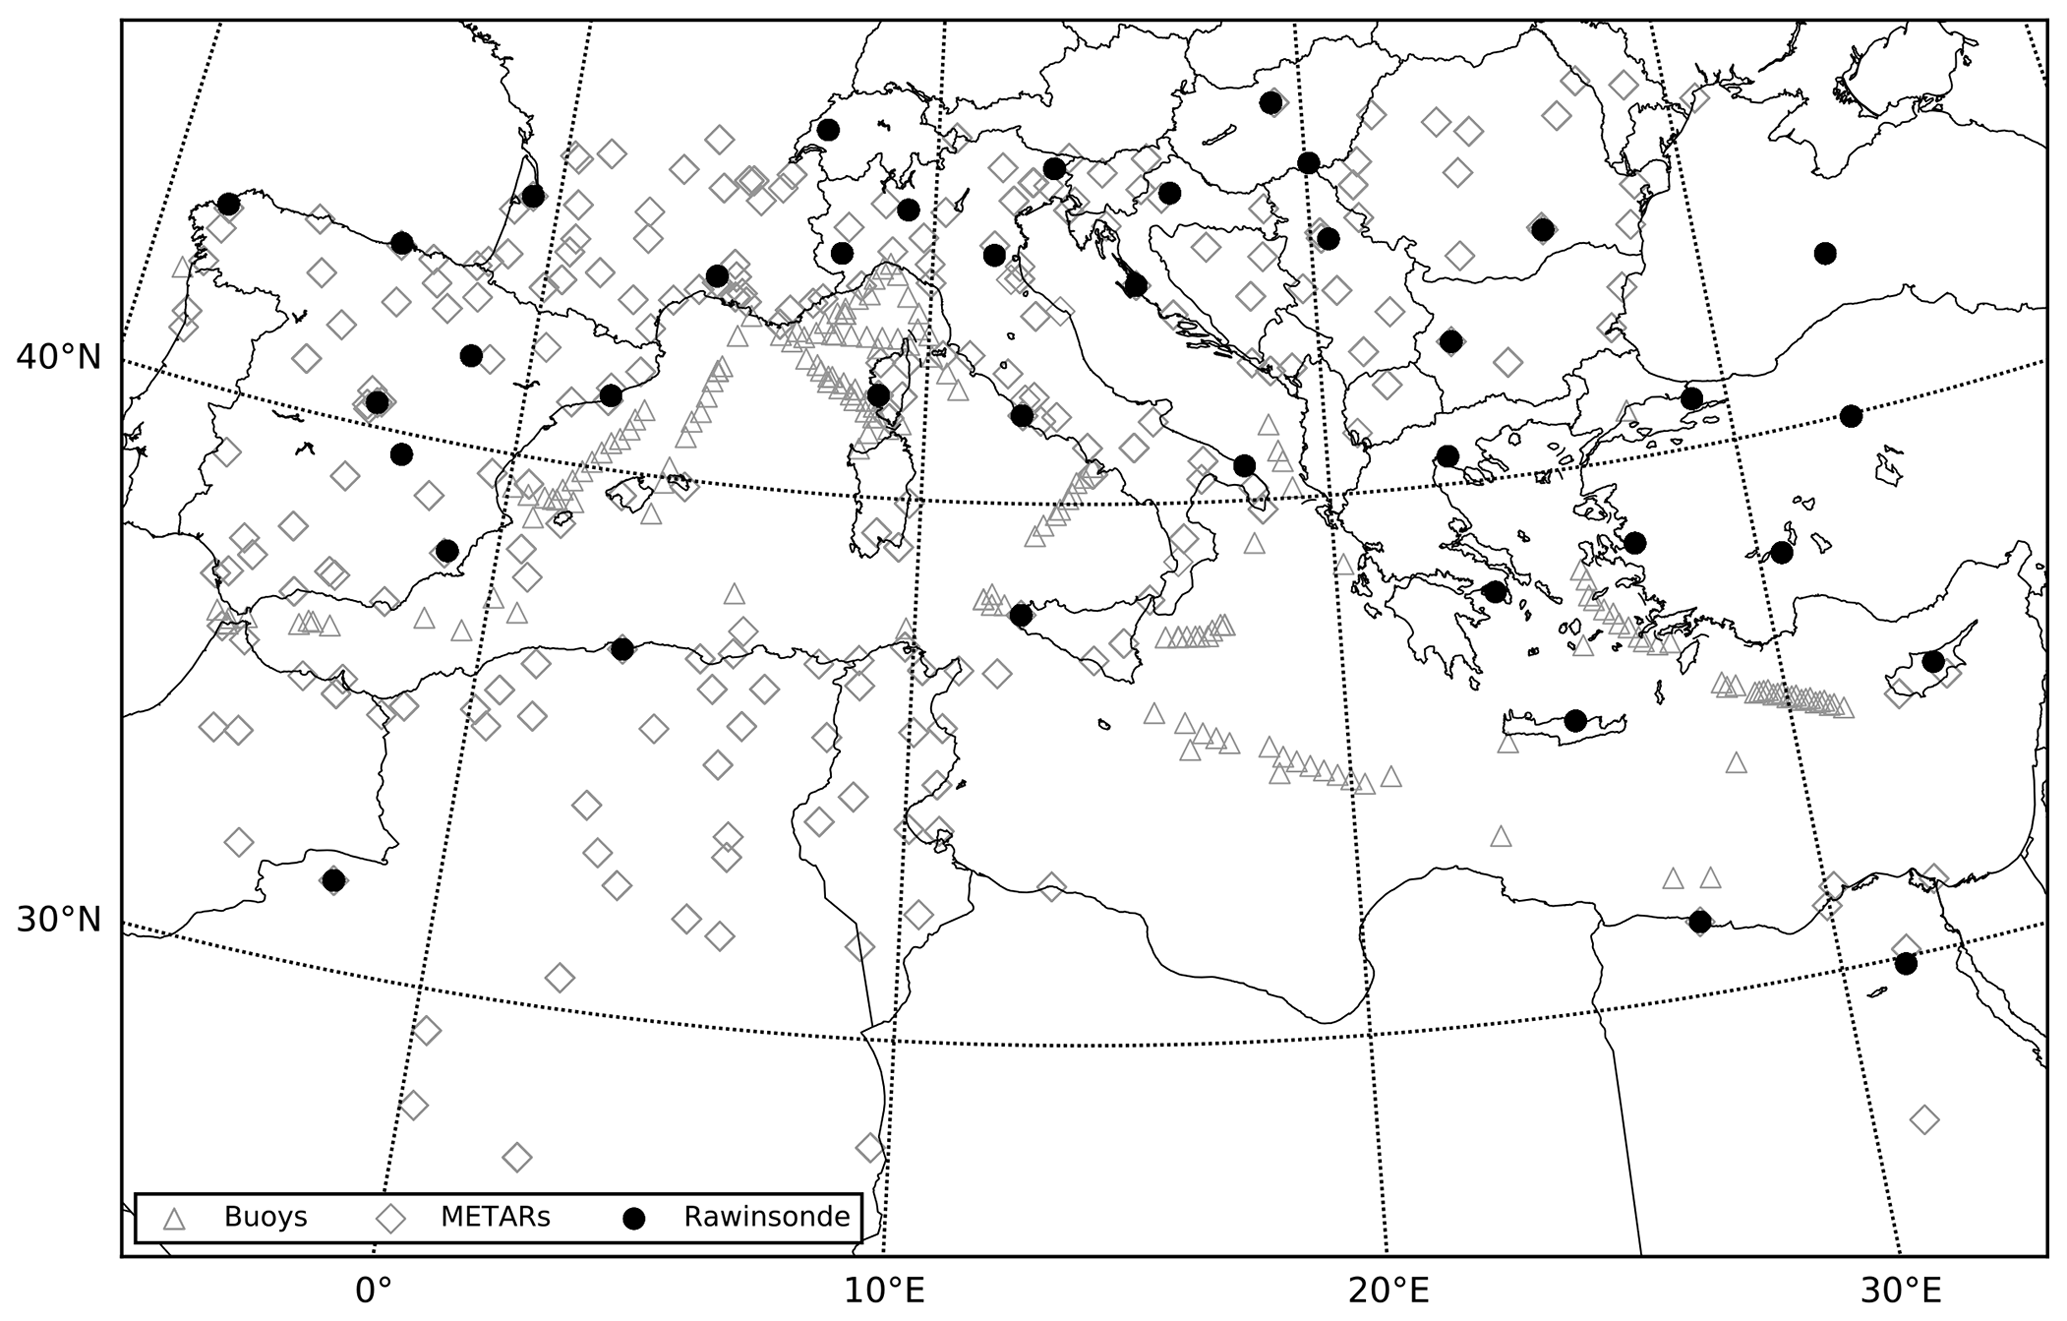
Figure 4Spatial distribution of in situ conventional observations from the MADIS database (buoys, METARs and rawinsondes) assimilated every hour between 12:00 UTC on 6 November and 00:00 UTC on 7 November 2014.
With the main aim of improving the representation of the state of the atmosphere over those poorly observed regions over the sea, a cloud-based satellite-derived product known as atmospheric motion vectors (AMVs; Schmetz et al., 1993), which provides high-spatial and high-temporal resolution information about the local horizontal winds (both speed and direction values) at different vertical pressure levels, was used. Taking into account that the upper-level dynamics played a key role in the genesis and development of this medicane (see Carrió et al., 2017) it is expected that the assimilation of such observations will contribute to significantly enhance the predictability of this medicane, improving both its trajectory and intensity. Although the potential effect of assimilating this kind of observation has already been assessed for TCs (Pu et al., 2008; Goerss, 2009; Langland et al., 2009; Romine et al., 2013; Wu et al., 2015), it has not been assessed over short life span smaller cyclones, such as medicanes, which are less predictable than tropical cyclones.
Although the assimilation of AMVs is promising to improve the short-range forecast of Qendresa, its 1 h temporal resolution availability could be a disadvantage. Instead, a more frequent satellite-derived wind product from the EUMETSAT database, referred to as rapid-scan atmospheric motion vectors2 (RSAMVs), which provides data every 20 min, is used (Fig. 5). In the present study, RSAMV observations at all heights below the tropopause are obtained from five different spectral channels (water vapor 6.2 µm, water vapor 7.3 µm, infrared 10.8 µm, visual 0.8 µm and high-resolution visual channel), all combined into one product. Note that the spatial coverage of this product is limited along the latitudes from 35 to 90∘ N, and for this reason no wind information is depicted in the bottom part of the numerical domain shown in Fig. 5.

Figure 5Raw EUMETSAT's RSAMV observations depicted at different vertical levels by different channels at 12:00 UTC on 7 November 2014 over the Mediterranean region. (a) High-resolution visual channel 0.75 µm, (b) water vapor 6.2 µm and (c) infrared 10.8 µm. The RSAMV final product (combination of all spectral channels) is also depicted in figure panel (d). Wind information is only valid at the center of the wind vectors.
When dealing with RSAMV observations it is important to note that the different spectral channels do not identify exclusively different layers of the atmosphere; they overlap. For instance, spectral channel number 1 could identify the same wind observation that channel number 4 could identify. However, it is not common that both channels provide precisely the same value of such observation; they are slightly different. For this reason, to avoid possible inconsistencies in the DA process due to the assimilation of different observation values from different spectral channels, only the wind observations from infrared 10.8 µm are assimilated, which provides wind information for the entire troposphere. Before assimilating these observations, a quality control (QC) check was also performed to reject non-physical and/or outlier observations that could deteriorate the quality of the analysis and its successive forecast. Specifically, in this study four main QC checks were performed to all the conventional and RSAMV observations. In the first QC check, surface observations were rejected if the model terrain and observational height numbers differ significantly from each other. This is applied to avoid inconsistencies between the physical representation of topography in the numerical model and the actual measurements. In this study, a threshold of 500 m was used. The second QC check consists of reducing instabilities or noise generated by the assimilation of observations near the domain boundaries (see Romine et al., 2013). This procedure is performed excluding observations located within five grid lengths from the lateral boundaries of the numerical model. The third QC check is applied to reject outlier observations, such observations with non-physical values or those which would result in unacceptably large increments in the analysis after their assimilation, that could destabilize the numerical model. This method is based on the square difference between the prior ensemble mean and the observation values. In this study, if the squared difference exceeds 3 times the sum of the prior and the observation error variances, then the observation is rejected. Finally, to minimize the unwanted effect of having spatially correlated errors associated with high-density observations, such as RSAMVs, a superobbing technique consisting of reducing the data density through spatially averaging the observations within a predefined prism is applied (e.g., Pu et al., 2008; Romine et al., 2013; Wu et al., 2013; Honda et al., 2018). In this study, RSAMV observations were thinned using a prism with horizontal dimensions of (128×128) km2 and a 25 hPa vertical extent. It is important to note that these prism dimension values were determined after several sensitivity simulations, in which they provided the most accurate analysis of the environmental conditions preceding the medicane event.
In order to assimilate these two types of observations (i.e., conventional and satellite-derived) it is crucial to assign the corresponding observational error value, which in this case is measured by the standard deviation. The observational error values used in this study for the conventional observations are analogous to Table 3 in Romine et al. (2013) with minor exceptions: METAR altimeter (1.5 hPa), marine altimeter (1.20 hPa), and METAR and marine temperature (1.75 K). Regarding the observational error associated with RSAMV, and after several sensitivity tests tuning this parameter, a standard deviation error of 1.4 m s−1 was used, which produced the best analysis.
3.3 EnKF data assimilation configuration
The ingestion of the above-mentioned observations within the WRF numerical weather model is expected to improve the estimation of the precondition thermodynamic environment that led to the formation of the Qendresa medicane, and in consequence, enhance its short-range track and intensity forecasts. To this purpose, the data assimilation scheme used for this study is the parallel version of the ensemble adjustment Kalman filter (EAKF; Anderson, 2001) from the trunk release branch (revision 9240) of the Data Assimilation Research Testbed software system (DART; Anderson and Collins, 2007; Anderson et al., 2009).
In particular, the conventional and satellite-derived observations were assimilated with hourly and 20 min frequency, respectively, using a data assimilation window from 12:00 UTC, 6 November, to 00:00 UTC, 7 November 2014. In each data assimilation cycle the EAKF algorithm updates a set of model prognostic variables and also some diagnostic fields. In this study the EAKF updates the three-dimensional wind fields, the potential temperature perturbation, the geopotential perturbation and the dry air surface pressure perturbation, as well as the water vapor and the following hydrometeor fields: mixing ratio of cloud, rain, ice, snow, and graupel and the number of concentration of rain and ice. Regarding the diagnostic fields the EAKF updates the 10 m wind fields, 2 m temperature, 2 m moisture and surface pressure.
The computational cost of implementing DA schemes in real applications such as this study forced the author to use a moderate ensemble size (i.e., 20–50 members). However, covariance estimates obtained from this modest ensemble produce spurious correlations that severely deteriorate the analysis from the data assimilation process (Hacker et al., 2007). To reduce the negative effect of sampling errors a localization technique (Houtekamer and Mitchell, 1998) based on a distance weighting function that tends to zero as the distance from the observation location increases is used (Sobash and Stensrud, 2013). In this study a Gaussian localization function referred to as the fifth-order piece-wise rational function (Gaspari and Cohn, 1999) is used. For the horizontal and vertical localizations, a half-radius of 510 km and 3 km is used, respectively.
Associated with the use of a moderate ensemble there exists an important issue related to the collapse of the ensemble spread after each analysis cycle (Anderson and Anderson, 1999), which will also deteriorate the analysis from the DA process. To avoid having such an under-dispersive system, an adaptative spatially and temporally varying inflation technique is applied to the prior ensemble state vector (i.e., before the assimilation step) in each assimilation cycle (Anderson and Collins, 2007; Anderson et al., 2009). This technique requires two parameters: the mean of the initial inflation factor and its standard deviation. According to previous studies (e.g., Carrió et al., 2019) a mean initial inflation value of 1.0 with 0.6 standard deviation was used here.
3.4 Experimental setup
To quantitatively assess the potential impact of assimilating conventional, and specially RSAMV observations, in the forecast skill of Qendresa, the following four different data assimilation simulations were performed (Fig. 6).
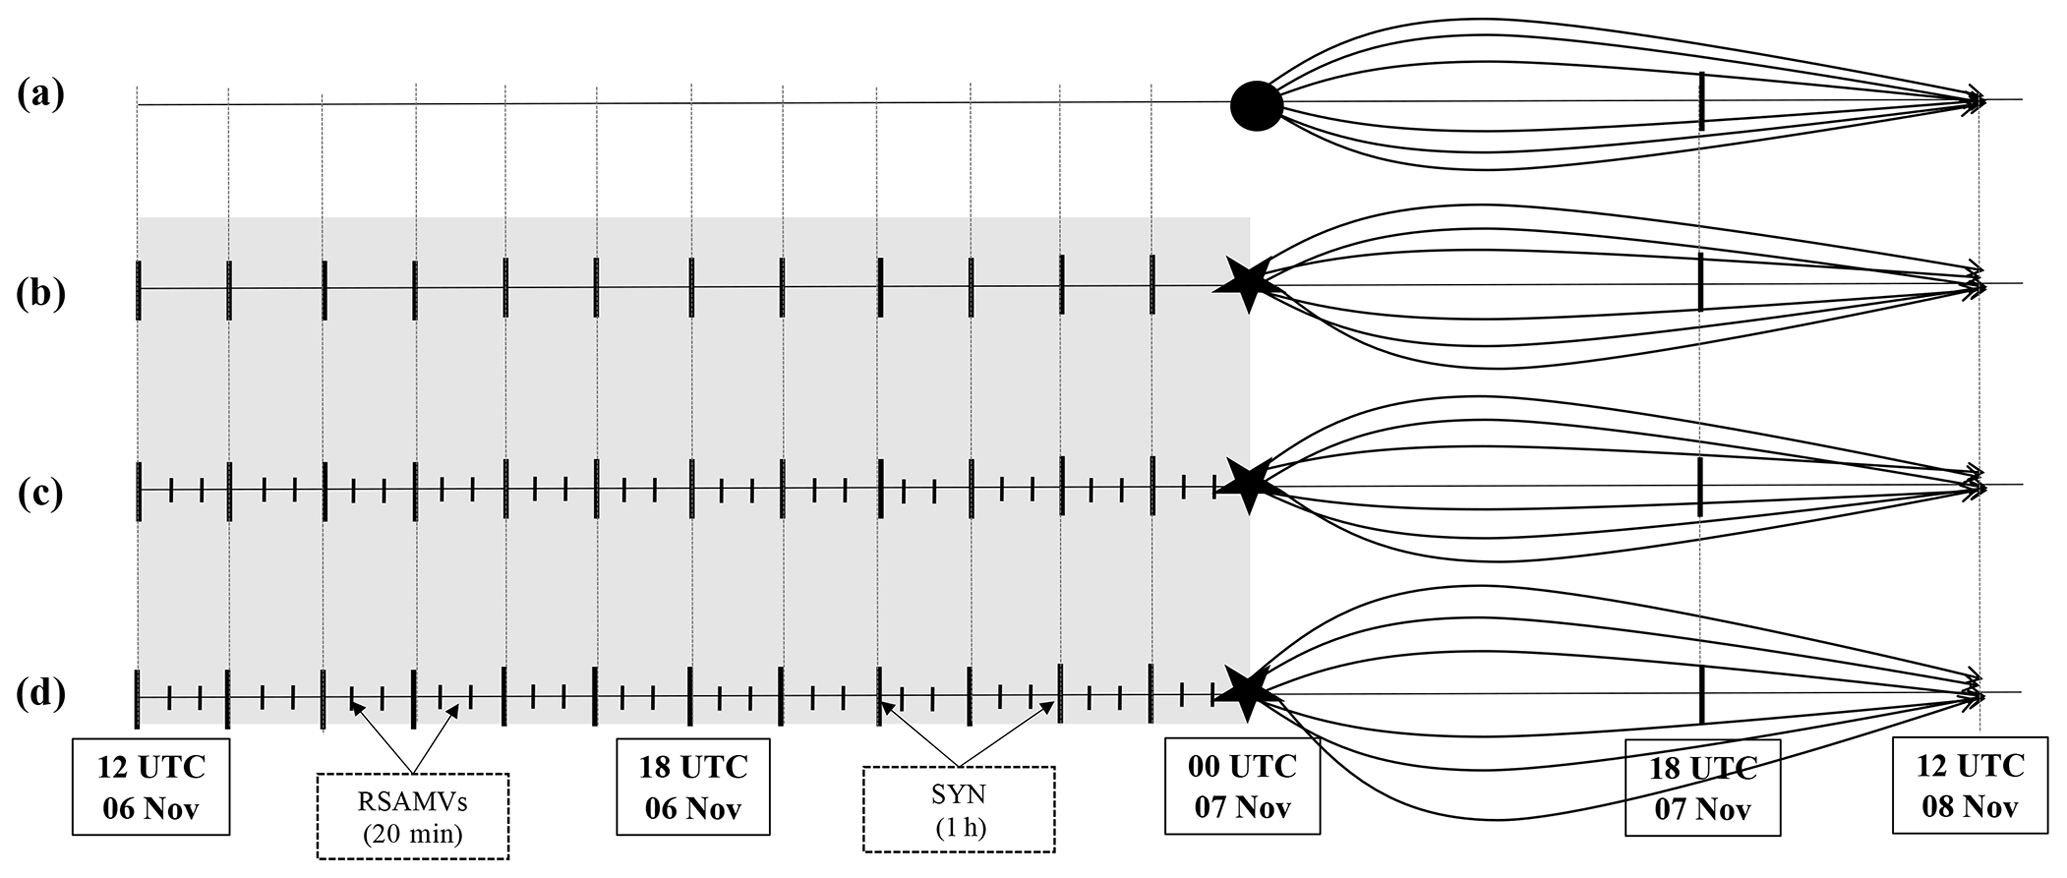
Figure 6Schematic representation of the different numerical experiment designs performed in this study. (a) NODA, (b) SYN, (c) RSAMV and (d) CNTRL DA experiments. The shaded area corresponds to the assimilation windows between 12:00 UTC, 6 November, and 00:00 UTC, 7 November, where observations are assimilated. The black dot represents the initiation time of the forecast for the NODA experiment. Black stars represent the final analysis obtained from the different DA experiments and from which the subsequent free forecast is initiated.
3.4.1 NODA experiment
With the main objective of assessing the value of assimilating different types of observations, it is required to have an analogous numerical forecast but without assimilating observations (NODA). In this way, the effects of assimilating different types of observations can be assessed by a direct comparison between NODA and the other DA experiments. The NODA experiment is simply a direct downscaling from ECMWF-EPS from 00:00 UTC, 7 November, to 12:00 UTC, 8 November 2014 (Fig. 6a). It is important to highlight that the choice of starting the NODA experiment at 00:00 UTC, 7 November, instead of starting at 12:00 UTC, 6 November, was made intentionally to extract general conclusions applicable to an operational framework. In other words, we are interested in comparing the DA experiments using observation until 00:00 UTC, 7 November, that could operationally be performed during the first hours of 7 November, with the most accurate experiment without assimilating observations that could also be run at the same time. Therefore, the forecast differences between each DA experiment and NODA will directly be attributed to the impact of the observations and also to the DA configuration used in each DA experiment.
3.4.2 SYN experiment
SYN is intended to improve synoptic-scale and mesoscale environments through the assimilation of in situ conventional observations. In particular, such observations are METARs, rawinsondes and buoys. To achieve this objective, the following experiment consists of two main stages: (i) the analysis update obtained by the data assimilation procedure and (ii) the free ensemble forecast initialized from such analysis. The analysis update is designed to assimilate conventional observations hourly within an assimilation window from 12:00 UTC, 6 November, to 00:00 UTC, 7 November 2014. At the end of this process, a new estimation of the atmospheric state due to the assimilation of the above-mentioned conventional observations is obtained. Then, a free 36 h forecast is launched using the ensemble analysis obtained at 00:00 UTC, 7 November, as initial conditions (Fig. 6b).
3.4.3 RSAMV experiment
This experiment is analogous to SYN, with the main difference that only RSAMV observations from the EUMETSAT database are assimilated. However, in this case the updated frequency for assimilating these observations has increased to 20 min instead to the hourly data assimilation frequency used in SYN (Fig. 6c). It is expected that the assimilation of RSAMVs will contribute to enhance the numerical representation of the atmospheric flow, specially the upper-level dynamics, which have been shown key during the cyclogenesis of Qendresa. The assimilation of RSAMV has already been shown to contribute to the improvement of the intensity and track forecasts of TCs. However, it is important to highlight that these studies typically assimilate such observations once TCs are fully developed (i.e., mature phase). In this case we are interested to study the impact of assimilating these observations on the pre-convective environment that leads to the initiation and posterior evolution of this medicane.
3.4.4 CNTRL experiment
The CNTRL experiment is designed with the main objective of assessing the potential effect of assimilating both in situ conventional and RSAMV observations to improve the track and the intensification forecasts of Qendresa (Fig. 6d). Specifically, conventional and RSAMV observations are both assimilated on the hour (i.e., 12:00, 13:00 UTC, etc.), and only RSAMV observations are assimilated every 20 min (i.e., 12:00, 12:20, 12:40, 13:00 UTC, etc.). Similar to the above-mentioned experiments, after obtaining the last analysis at the end of the assimilation window (00:00 UTC, 7 November), a 36 h free ensemble forecast is launched from such analysis. This experiment has the advantage of taking the benefit of the RSAMV observations to improve the representation of the upper-level atmospheric circulation and also accounting for the surface conventional observations improving the analysis at low levels and mainly over the sea surface, where analysis errors are larger than over land.
4.1 Observation-space diagnostics
To quantitatively assess the data assimilation performance during the 12 h data assimilation window, the following widely used observation-space diagnostics (Yussouf et al., 2013; Wheatley et al., 2015; Carrió et al., 2019) are computed before and after each hourly data assimilation cycle using the background and EnKF analysis model states, from the CNTRL experiment, mapped to the observation locations: (i) the root mean square error innovation (RMSI), (ii) the bias (model-obs), (iii) the total ensemble spread (TS; Dowell and Wicker, 2009) and finally (iv) the consistency ratio (CR; Dowell et al., 2004). These diagnostics and the rest of the diagnosis computed in this subsection are computed for the entire set of the assimilated type of observations (i.e., METARs, buoys, rawinsondes and RSAMVs). However, for the sake of brevity only results from METAR diagnostics are shown here. More details of these diagnostics can be found in Carrió et al. (2022).
Results from these diagnostics clearly show the positive effect of the assimilation process, significantly reducing the RMSI after each data assimilation cycle for all kinds of observations (Fig. 7). In agreement with these results, the bias score is also showing a significant decrease with time for the different observation types. For METAR observations, the bias values indicate that the model underpredicts the observed variables (Fig. 7a, b). On the contrary, bias associated with RSAMVs indicates that, generally, the model overpredicts the observed wind observations (Fig. 7c, d). The evolution of the total spread (TS) shows values tending to an approximated value of 0.9, indicating that the data assimilation system performance is stable. In addition, the evolution of TS is similar to the RMSI evolution, resulting in consistency ratio (CR) values near 1.0 (Fig. 8). Recall that a consistency ratio of 1.0 indicates that the prior spread of the ensemble is a good approximation of the forecast error taking into account the observational error assigned. For this case, CR values get closer to 1.0 at the end of the data assimilation window, confirming that our prior ensemble is a fair sample from the truth distribution.
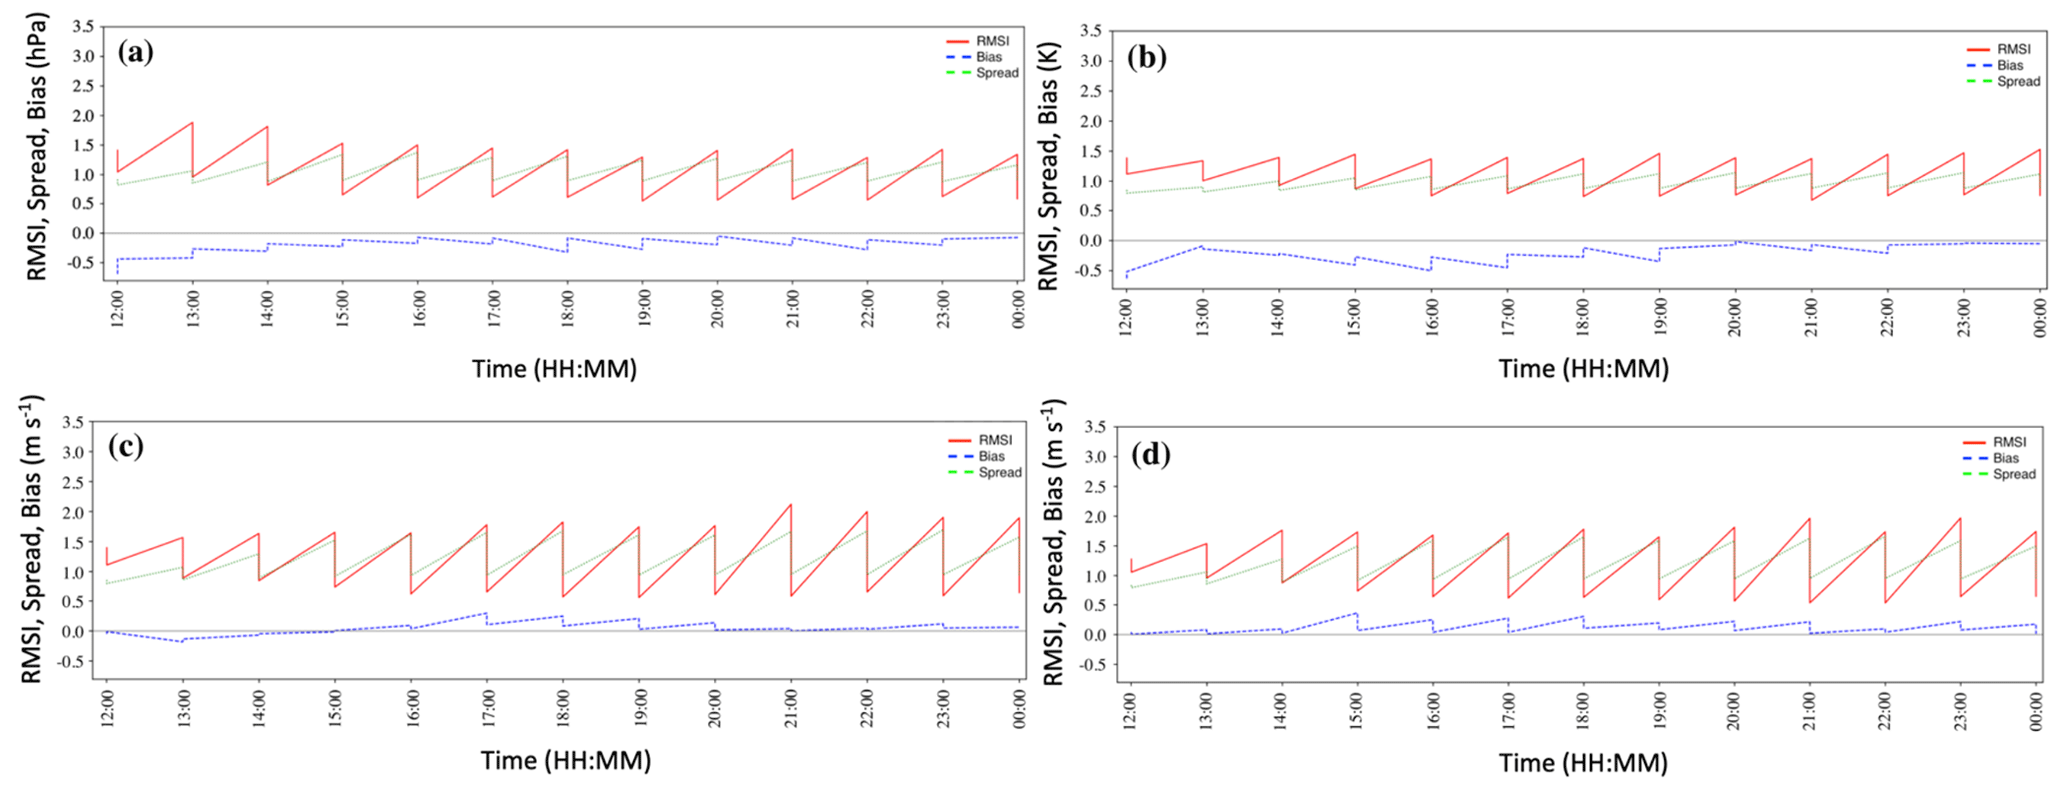
Figure 7Sawtooth plots depicting the evolution of the RMSI, bias and total spread during the assimilation window for the METAR (a) altimeter and (b) temperature observations and for the RSAMV (c) U wind and (d) V wind observations.
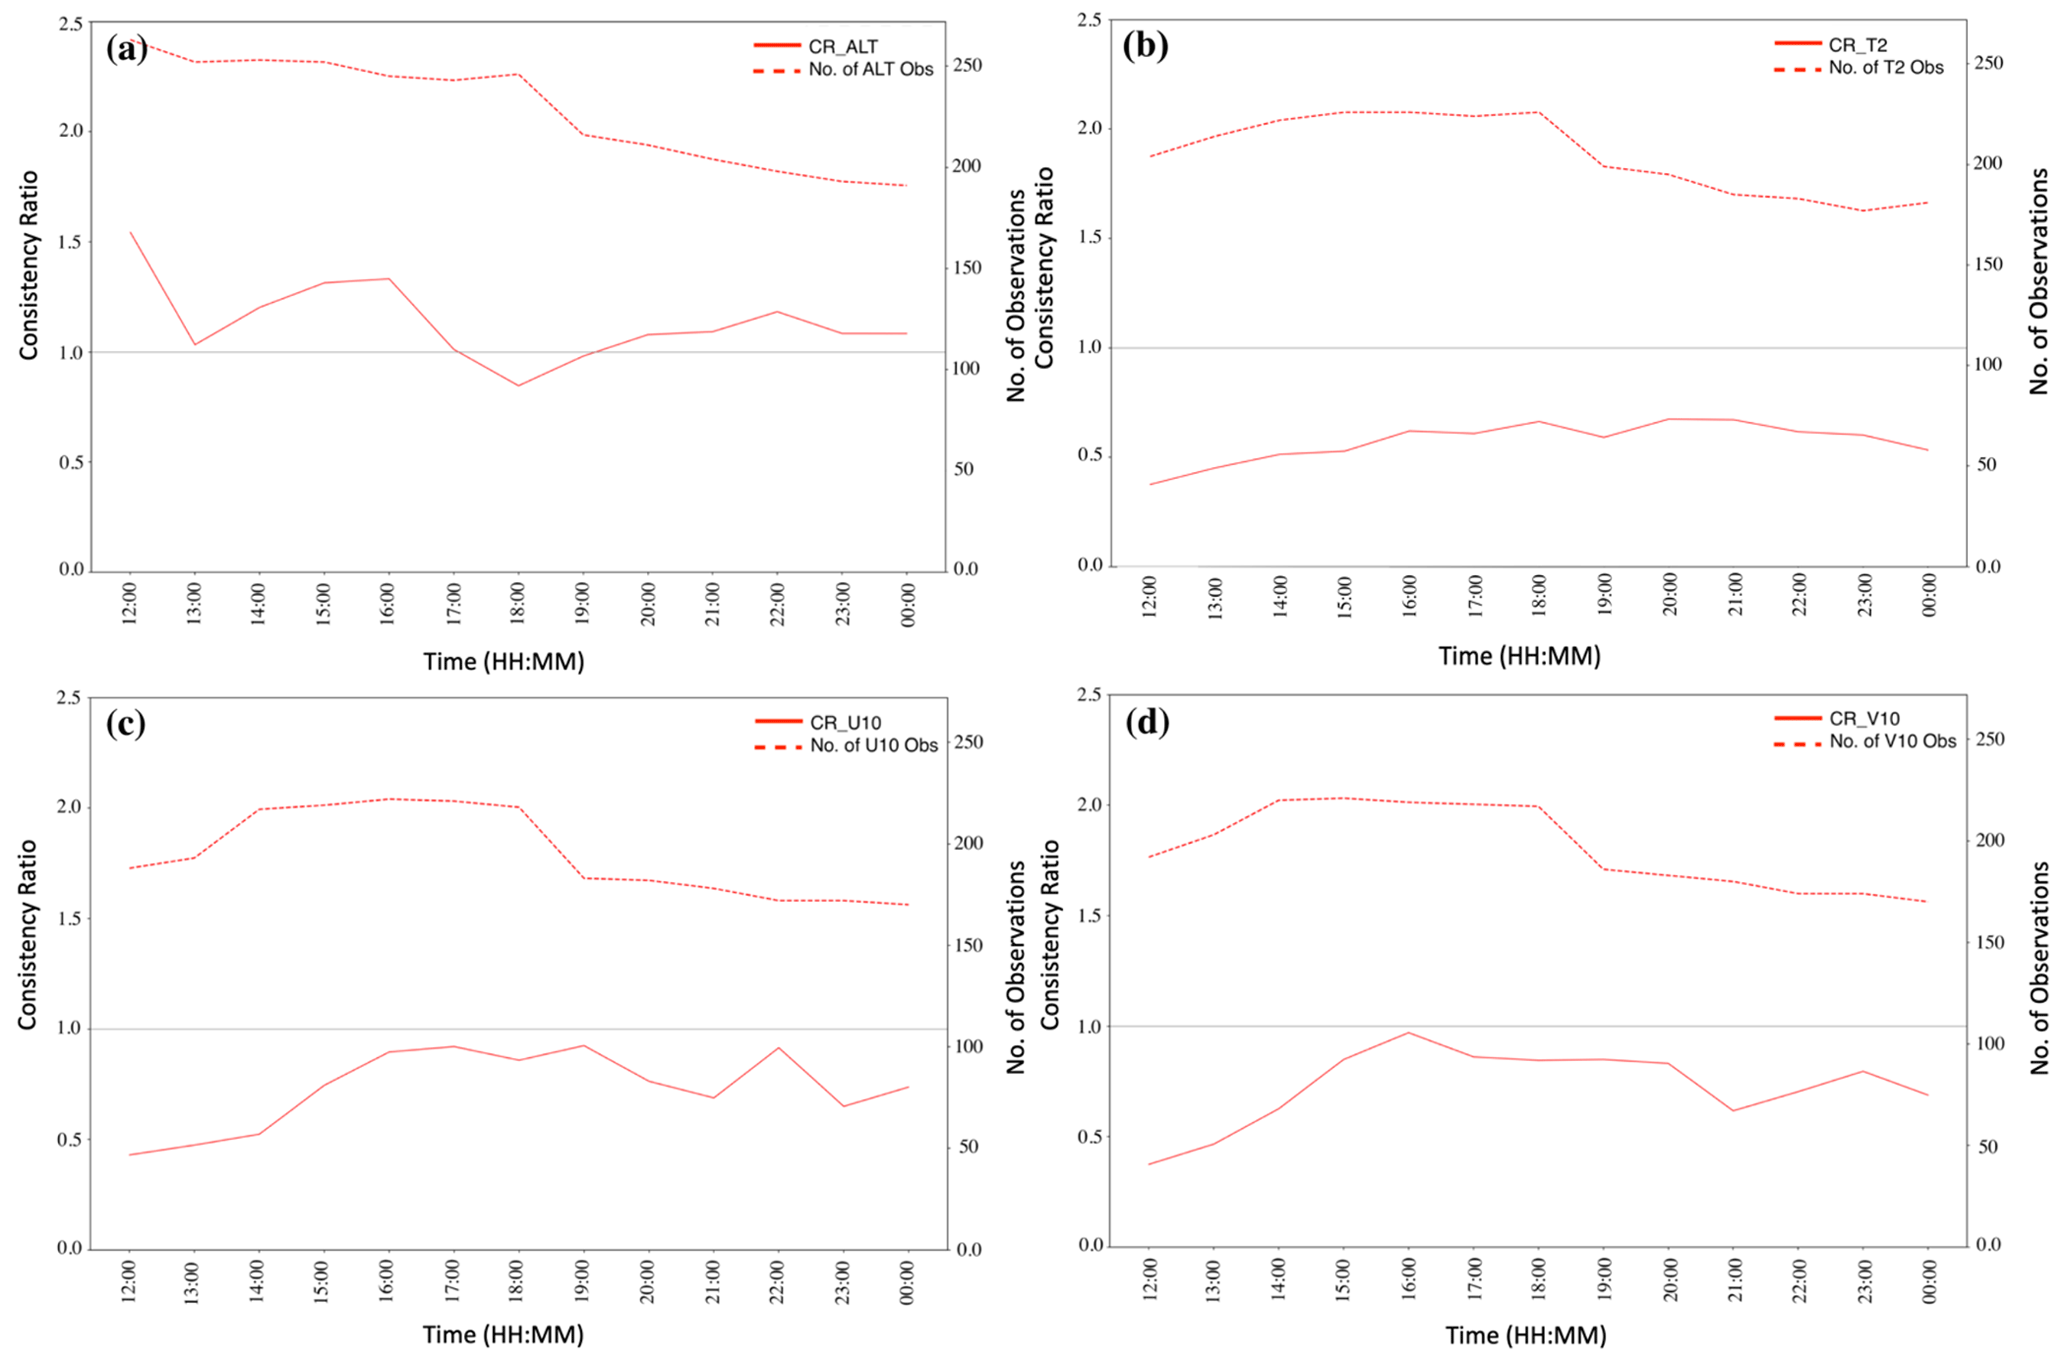
Figure 8Evolution of the CR during the assimilation window for the METAR (a) altimeter and (b) 2 m temperature observations and for the RSAMV (c) U wind and (d) V wind observations. The number of observations assimilated at each data assimilation cycle is depicted by the dotted line.
To further evaluate the performance of the data assimilation system, an additional diagnostic was used in this study. This diagnostic computes the squared correlation coefficient R2 between the observations and model values. In particular, R2 is computed using the prior and posterior states to show the effect of the data assimilation system on the model state (Fig. 9a). In this case, Fig. 9a clearly shows the benefits of assimilating the RSAMVs obtained at the end of the data assimilation window at 00:00 UTC, 7 November: before the assimilation of RSAMVs the prior state differs significantly from the observations, as observed by the off-diagonal distribution of grey dots. However, after the assimilation of RSAMVs, the posterior state closely matches the observations, as the blue points indicated being distributed over the diagonal. This effect is quantitatively measured by the increment of R2 from 0.874 to 0.996.
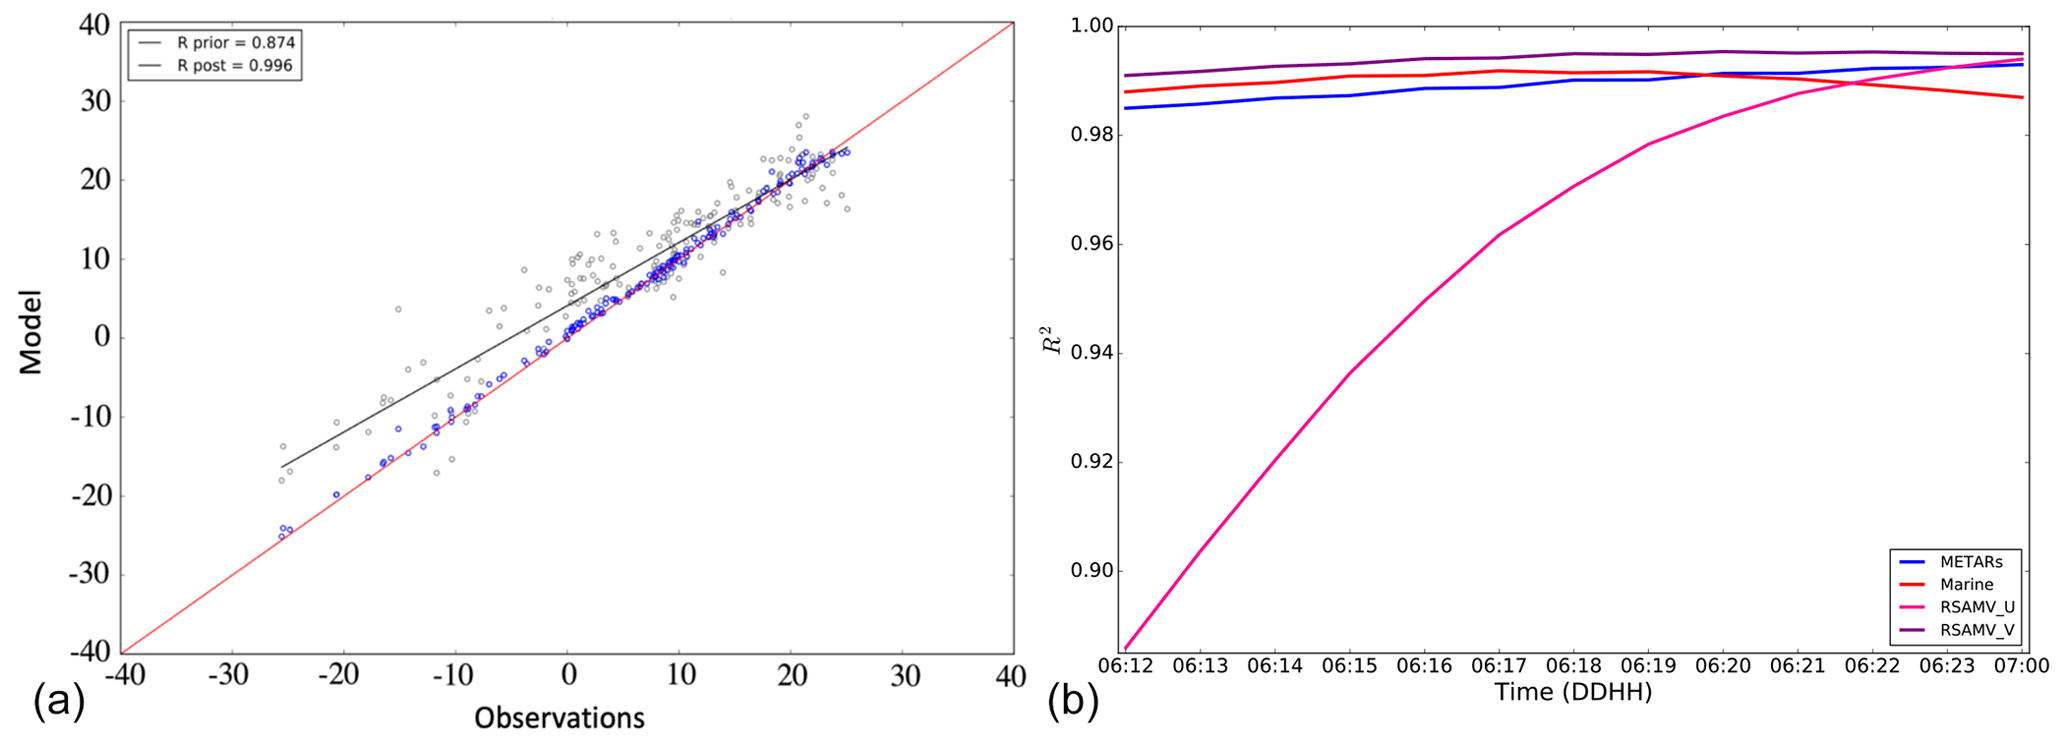
Figure 9(a) Squared correlation coefficient computed before (grey dots) and after (blue dots) the assimilation of pressure data from maritime buoys, referred to as prior and posterior, at 00:00 UTC, 7 November. The black line represents the prior linear regression line, and the red line represents a perfect linear regression line. (b) Evolution of the squared correlation for different observation types assimilated during the entire assimilation window is shown.
To understand the impact of the assimilation of different types of observations along the data assimilation window, the evolution of the squared correlation score for each type of observation assimilated (i.e., METARs, maritime (buoys), U component and V component of the wind from RSAMVs) is computed (Fig. 9b). Results show high squared correlation values for almost all the assimilation cycles, indicating a good correspondence between the posterior model state and the observations. In the case of the U component of the three-dimensional wind, a lower correspondence between the model and the observations during the first assimilation cycles is observed. However, as new RSAMV observations are assimilated in the following steps, the squared correlation increases. At the end of the assimilation window, the squared correlation values for the wind U component become practically the same as the V-component values.
4.2 Model-space diagnostics
Once we obtained the EnKF analyses at 00:00 UTC, 7 November, we started a 36 h free ensemble forecast for each of the numerical experiments (i.e., NODA, SYN, RSAMV and CNTRL). Due to the inherent difficulty to accurately predict the observed trajectory and intensity of this medicane event (Pytharoulis et al., 2018), the potential impact of assimilating the above-mentioned observations to simulate the observed trajectory of the medicane and its intensification is investigated. Model output verification scores shown in this subsection are computed using an independent set of different observations not assimilated previously, which will consist of (a) the surface pressure registered at the METAR located in the airport of Malta, where the cyclone crossed over it, and (b) the approximated medicane track obtained by visual inspection of infrared satellite imagery.
4.2.1 DA impact on Qendresa's track forecast
Forecast results from NODA show that although most of the ensemble members (29/36) simulate small vortex circulations, the associated trajectories (“inverted-U” shape) differ significantly from the observations (“U” shape), particularly during the mature stage of the medicane (Fig. 10a). In general, most ensemble members show a rapid northward evolution towards the central part of Sicily and then abruptly change direction towards the south-east. For the SYN experiment, which assimilates conventional observation, the cyclone trajectory follows a U shape (i.e., first moving towards the southeast, then moving to the east and finally moving towards the northeast) similar to the trajectory observed over satellite imagery (Fig. 10b). Although the shape of the trajectory agrees with observations, the location is not accurate. In general, trajectories are shifted towards the east. In the case of the RSAMV experiment, in which only wind observations from satellites are assimilated, a similar behavior is detected, but now more diversity among ensemble members is observed (Fig. 10c). Finally, the CNTRL experiment, which assimilates conventional and satellite wind observations, shows cyclone trajectories resembling the SYN experiment without significant discrepancies (Fig. 10d).
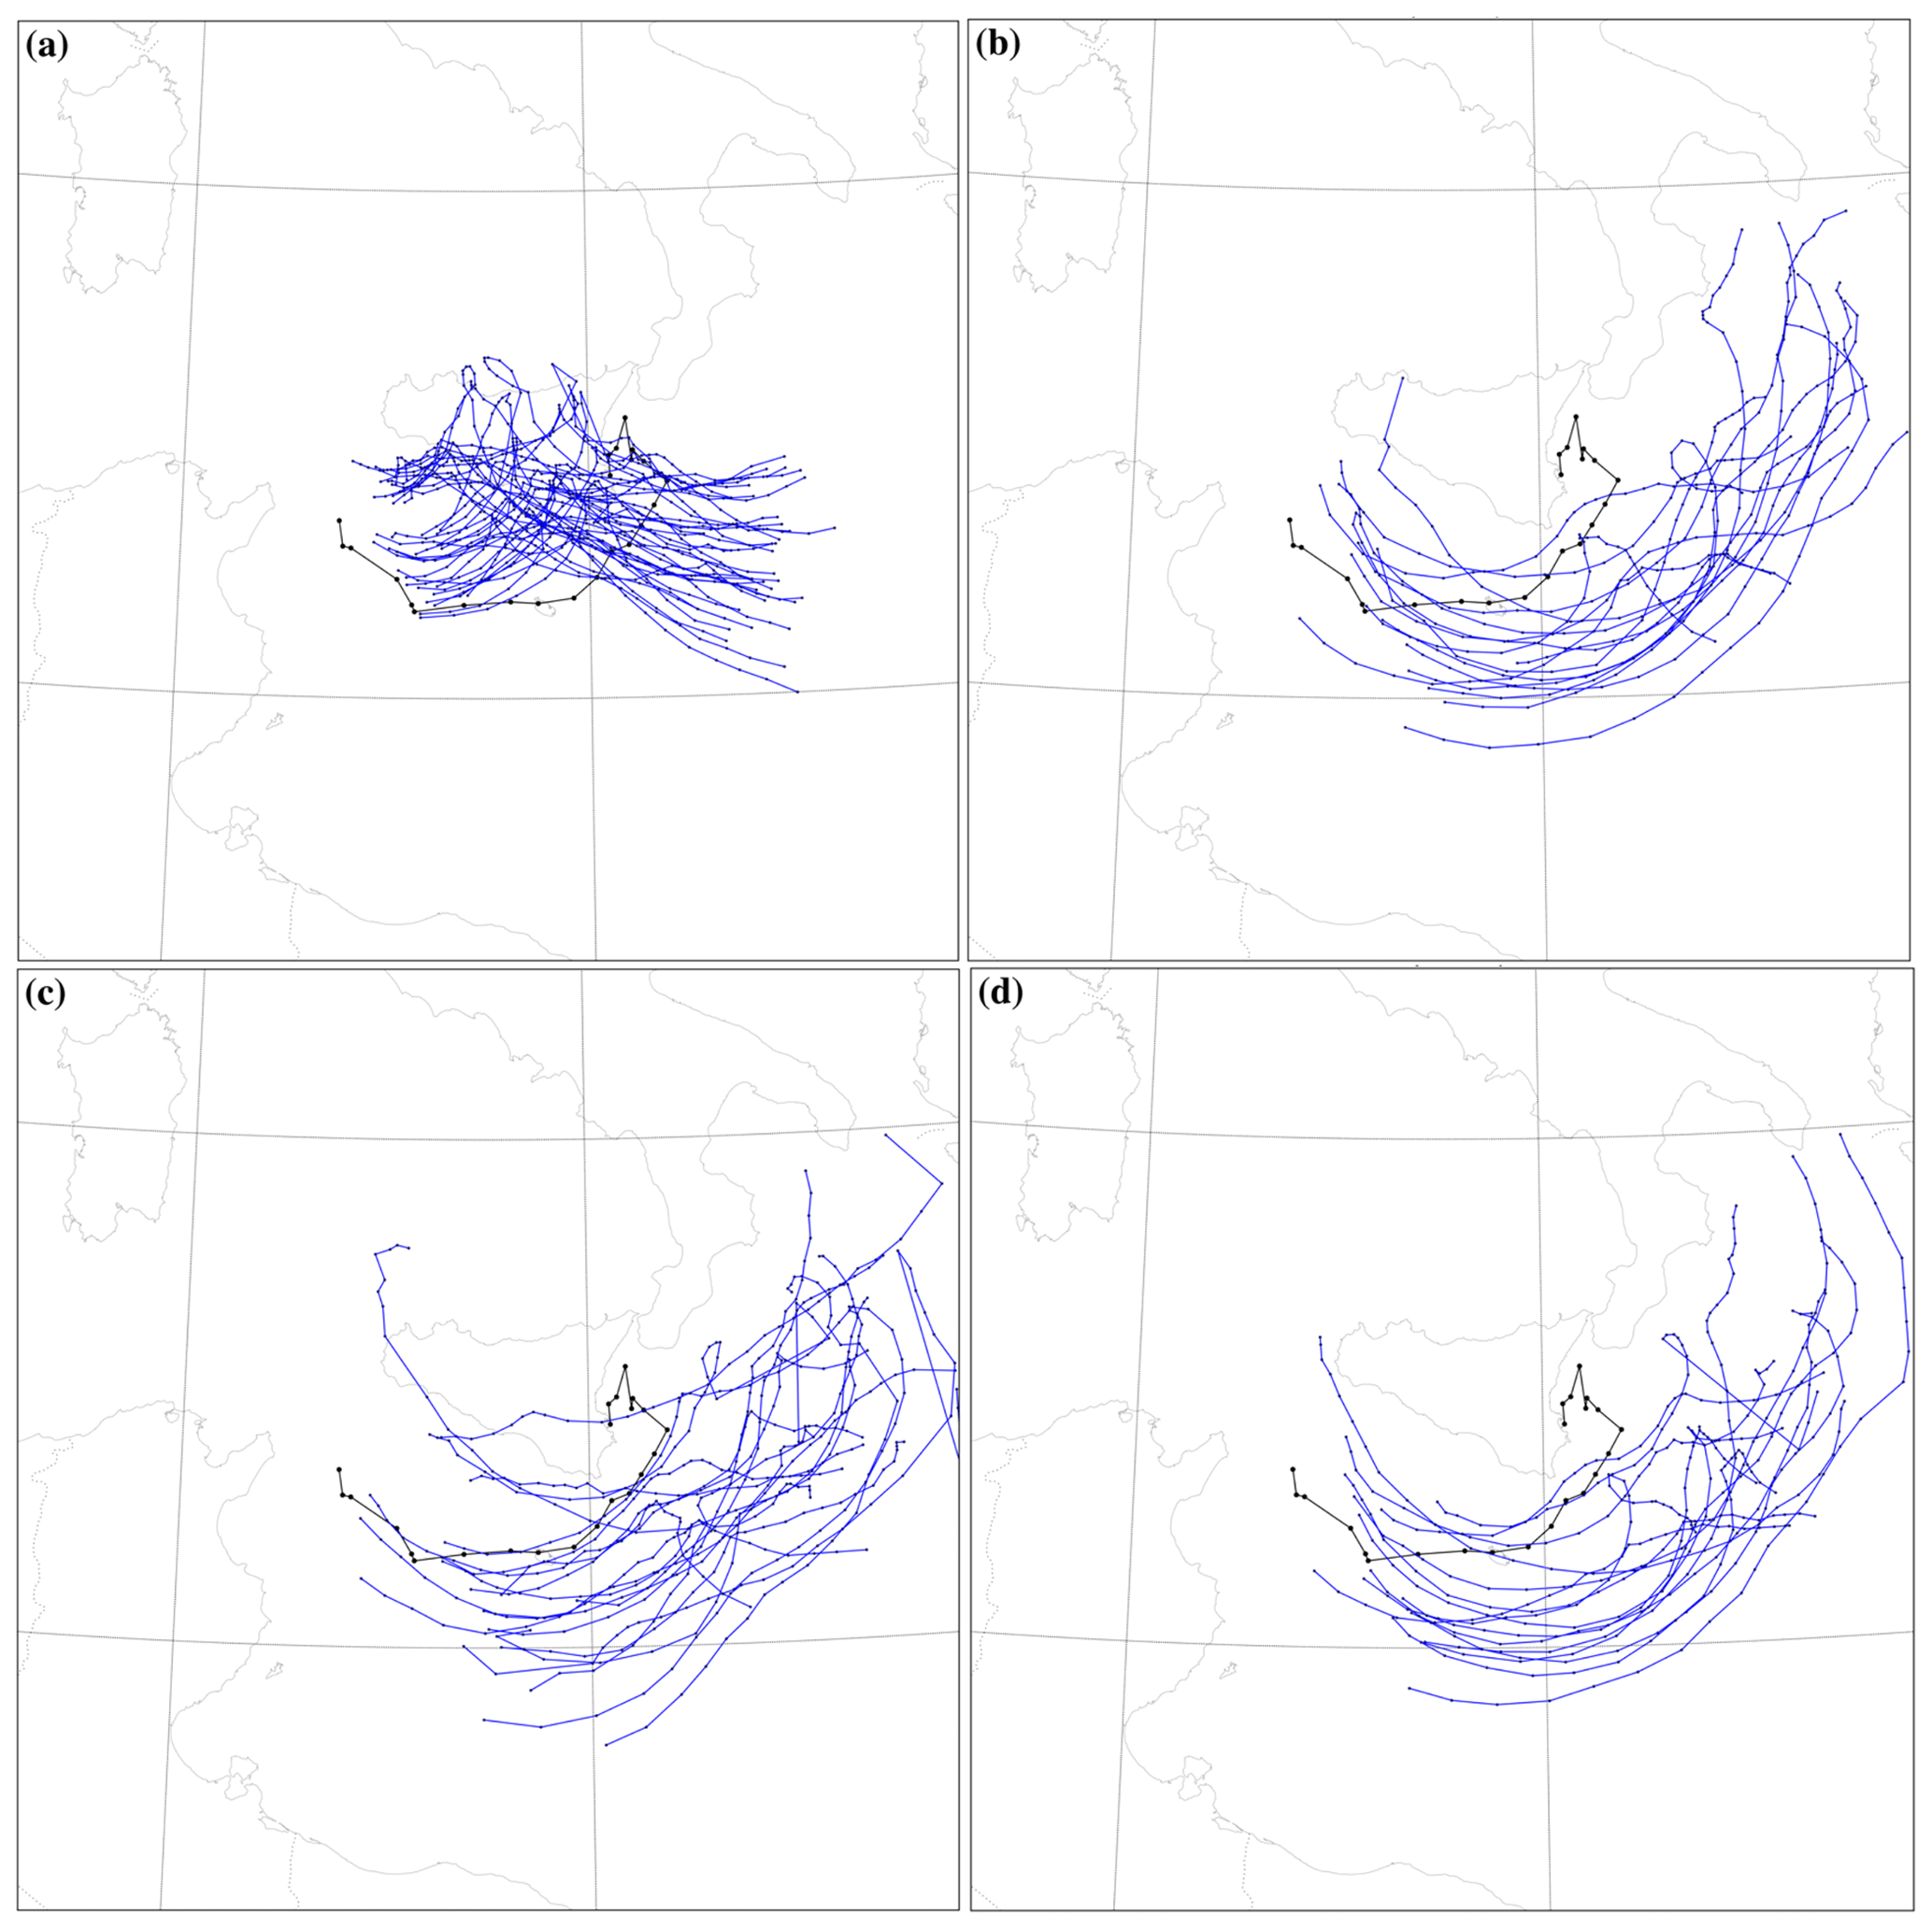
Figure 10Trajectory of cyclones generated by each ensemble member (solid blue lines) by the (a) NODA, (b) SYN, (c) RSAMV and (d) CNTRL experiments from 11:00 UTC, 7 November, to 12:00 UTC, 8 November 2014. Solid black lines depict the trajectory of the medicane observed from satellite imagery.
In the case of the data assimilation experiments (i.e., SYN, RSAMV and CNTRL), no cyclone signature was identifiable during the first hours of forecast. It was not until 11:00 UTC, 7 November, when small vortex circulations appeared. For this reason, the trajectories depicted in Fig. 10 correspond to the period from 11:00 UTC, 7 November, to 12:00 UTC, 8 November. It is also noteworthy that for the data assimilation experiments not all ensemble members depict cyclonic circulations. In fact, for the SYN experiment only 17/36 ensemble members generate a small-scale isolated cyclone, while in the RSAMV, a reduced number of members simulates cyclones (16/36), and finally in the CNTRL experiment, this number is increased to 21/36. These results reveal the positive effect of assimilating both conventional and RSAMVs to improve the predictability of this medicane event.
Looking at the ensemble of cyclones' trajectories for each experiment we can state that some of them depict the evolution of the cyclone significantly different to the observed one, but some of them also depict trajectories resembling the observations. Taking this into account, we have also represented, for each experiment, the track from the ensemble member that subjectively resembles most of the medicane trajectory observed by satellite imagery (Fig. 11). For this purpose, we seek two main features: (a) the medicane center should cross as close as possible to Malta and ideally (b) the track of the medicane should show signals of a loop ending on the eastern coast of Sicily. Among these results, only the CNTRL experiment is able to depict the curvature (i.e., loop) of the cyclone trajectory in a similar way that is observed. However, the entire track of the cyclone has a notable southward bias.

Figure 11Best cyclone's trajectory depicted by each experiment, (a) NODA, (b) SYN, (c) RSAMV and (d) CNTRL, from 11:00 UTC, 7 November, to 12:00 UTC, 8 November 2014.
To assess the error associated with the cyclone's trajectory, the distance between the ensemble mean center of the simulated cyclone and the observed one is computed for each time step (Fig. 12). Before the moment of maximum intensity (i.e., approximately at 18:00 UTC, 7 November) the NODA experiment depicts a mean track error lower than the data assimilation experiments. However, as we get closer to the maximum intensity of the cyclone, data assimilation experiments depict lower error values than NODA until 00:00 UTC, 8 November. In this period of time, mean track error values from the data assimilation experiments become indistinguishable between them. After 00:00 UTC, 8 November, the errors associated with the data assimilation experiments start to grow, and the error associated with NODA start to decrease until the end of the simulation. Note that the large difference between NODA and the data assimilation experiments at the end of the simulation is associated with the fact that the impact of the initial conditions decreases significantly after 23–24 h of free forecast. In other words, the model starts to “forget” the information introduced in the initial conditions from the different types of observations assimilated. Regarding the ensemble spread of each experiment (shaded areas in Fig. 12), it is shown that all data assimilation experiments have larger spread than NODA. Because the number of ensemble members between NODA and the DA experiments used to compute the track error differs significantly, special caution should be taken when making conclusions comparing NODA and the data assimilation results.
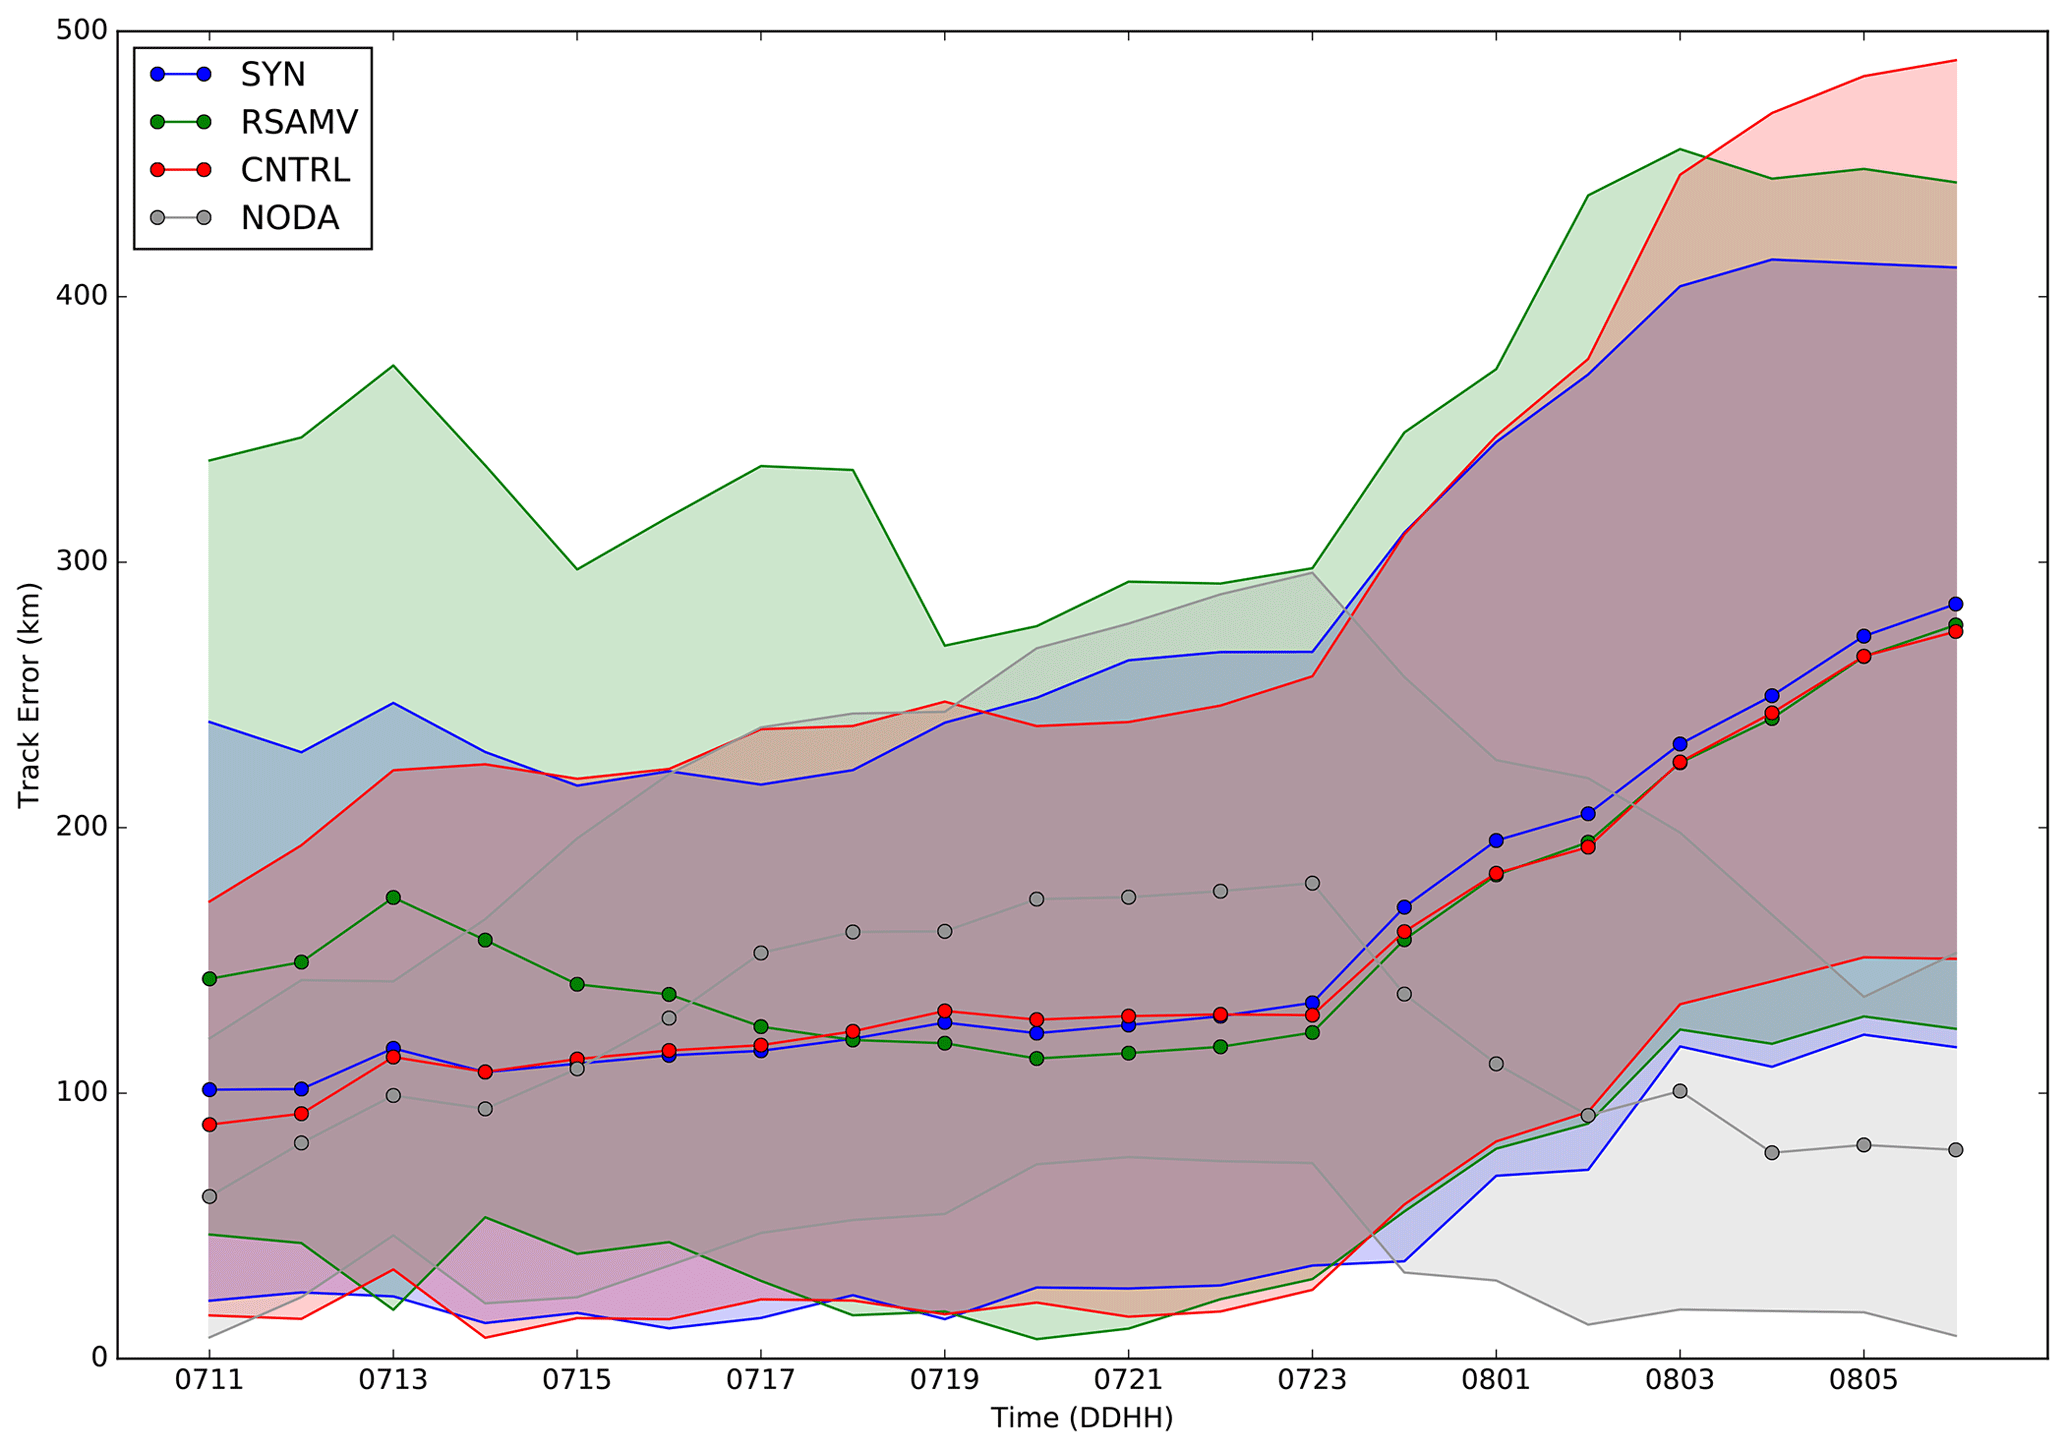
Figure 12Ensemble mean (solid lines) and ensemble spread (shaded areas) of track error (km) associated with NODA_0700, SYN, RSAMV and CNTRL experiments from 11:00 UTC, 7 November, to 12:00 UTC, 8 November 2014.
4.2.2 DA impact on Qendresa's intensification forecast
Taking into account the inherent difficulty of the models in properly predicting the intensity of TCs, the effect of assimilating conventional and RSAMV observations is explored. In this case, the lack of in situ observations over the region where Qendresa took place is the main challenge to properly verify the cyclone's intensity forecasts in a Lagrangian sense (following the medicane evolution). Instead, we took advantage of the fact that the medicane crossed over Malta, where METAR instruments registered a pressure drop greater than 20 hPa in 6 h, reaching a minimum surface pressure value of 985 hPa. In this context, to assess the skill of the different numerical experiments, the METAR information from the Malta airport was used. Specifically, the surface pressure evolution measured by the METAR at Malta was compared against the obtained from the ensemble members simulating the medicane for each experiment. To achieve this comparison, for each ensemble member performing the medicane, we take the evolution of the surface pressure of the closest trajectory grid point to Malta airport and then compare it with the METAR observations.
Results from the NODA experiment show that the ensemble mean fits the observations accurately during the first hours of the forecast, from 00:00 to 15:00 UTC, 7 November (Fig. 13). However, during the intensification phase, the ensemble mean identifies the surface pressure minimum at the same time it was observed, but it does not reach the 985 hPa minimum observed value. Then, the cyclone starts its dissipation phase in which the ensemble mean is not well adjusted to the observations between 19:00 UTC, 7 November, and 06:00 UTC, 8 November. A closer inspection to the ensemble members shows that the surface pressure minimum is reached at different times between 12:00 UTC, 7 November, and 05:00 UTC, 8 November. In other words, the minimum surface pressure depicted by the NODA ensemble system has a large temporal spread, with most of the ensemble members simulating a minimum pressure earlier than the observed, but others showing some delay. It is also important to note that some of the ensemble members reach surface minimum pressure values similar to the observations. In contrast, the SYN experiment significantly reduces the above-mentioned temporal spread, showing most of the ensemble members laying near the observed barogram (Fig. 13b). In this case, the assimilation of in situ conventional observations has contributed in a better prediction of the minimum surface pressure.
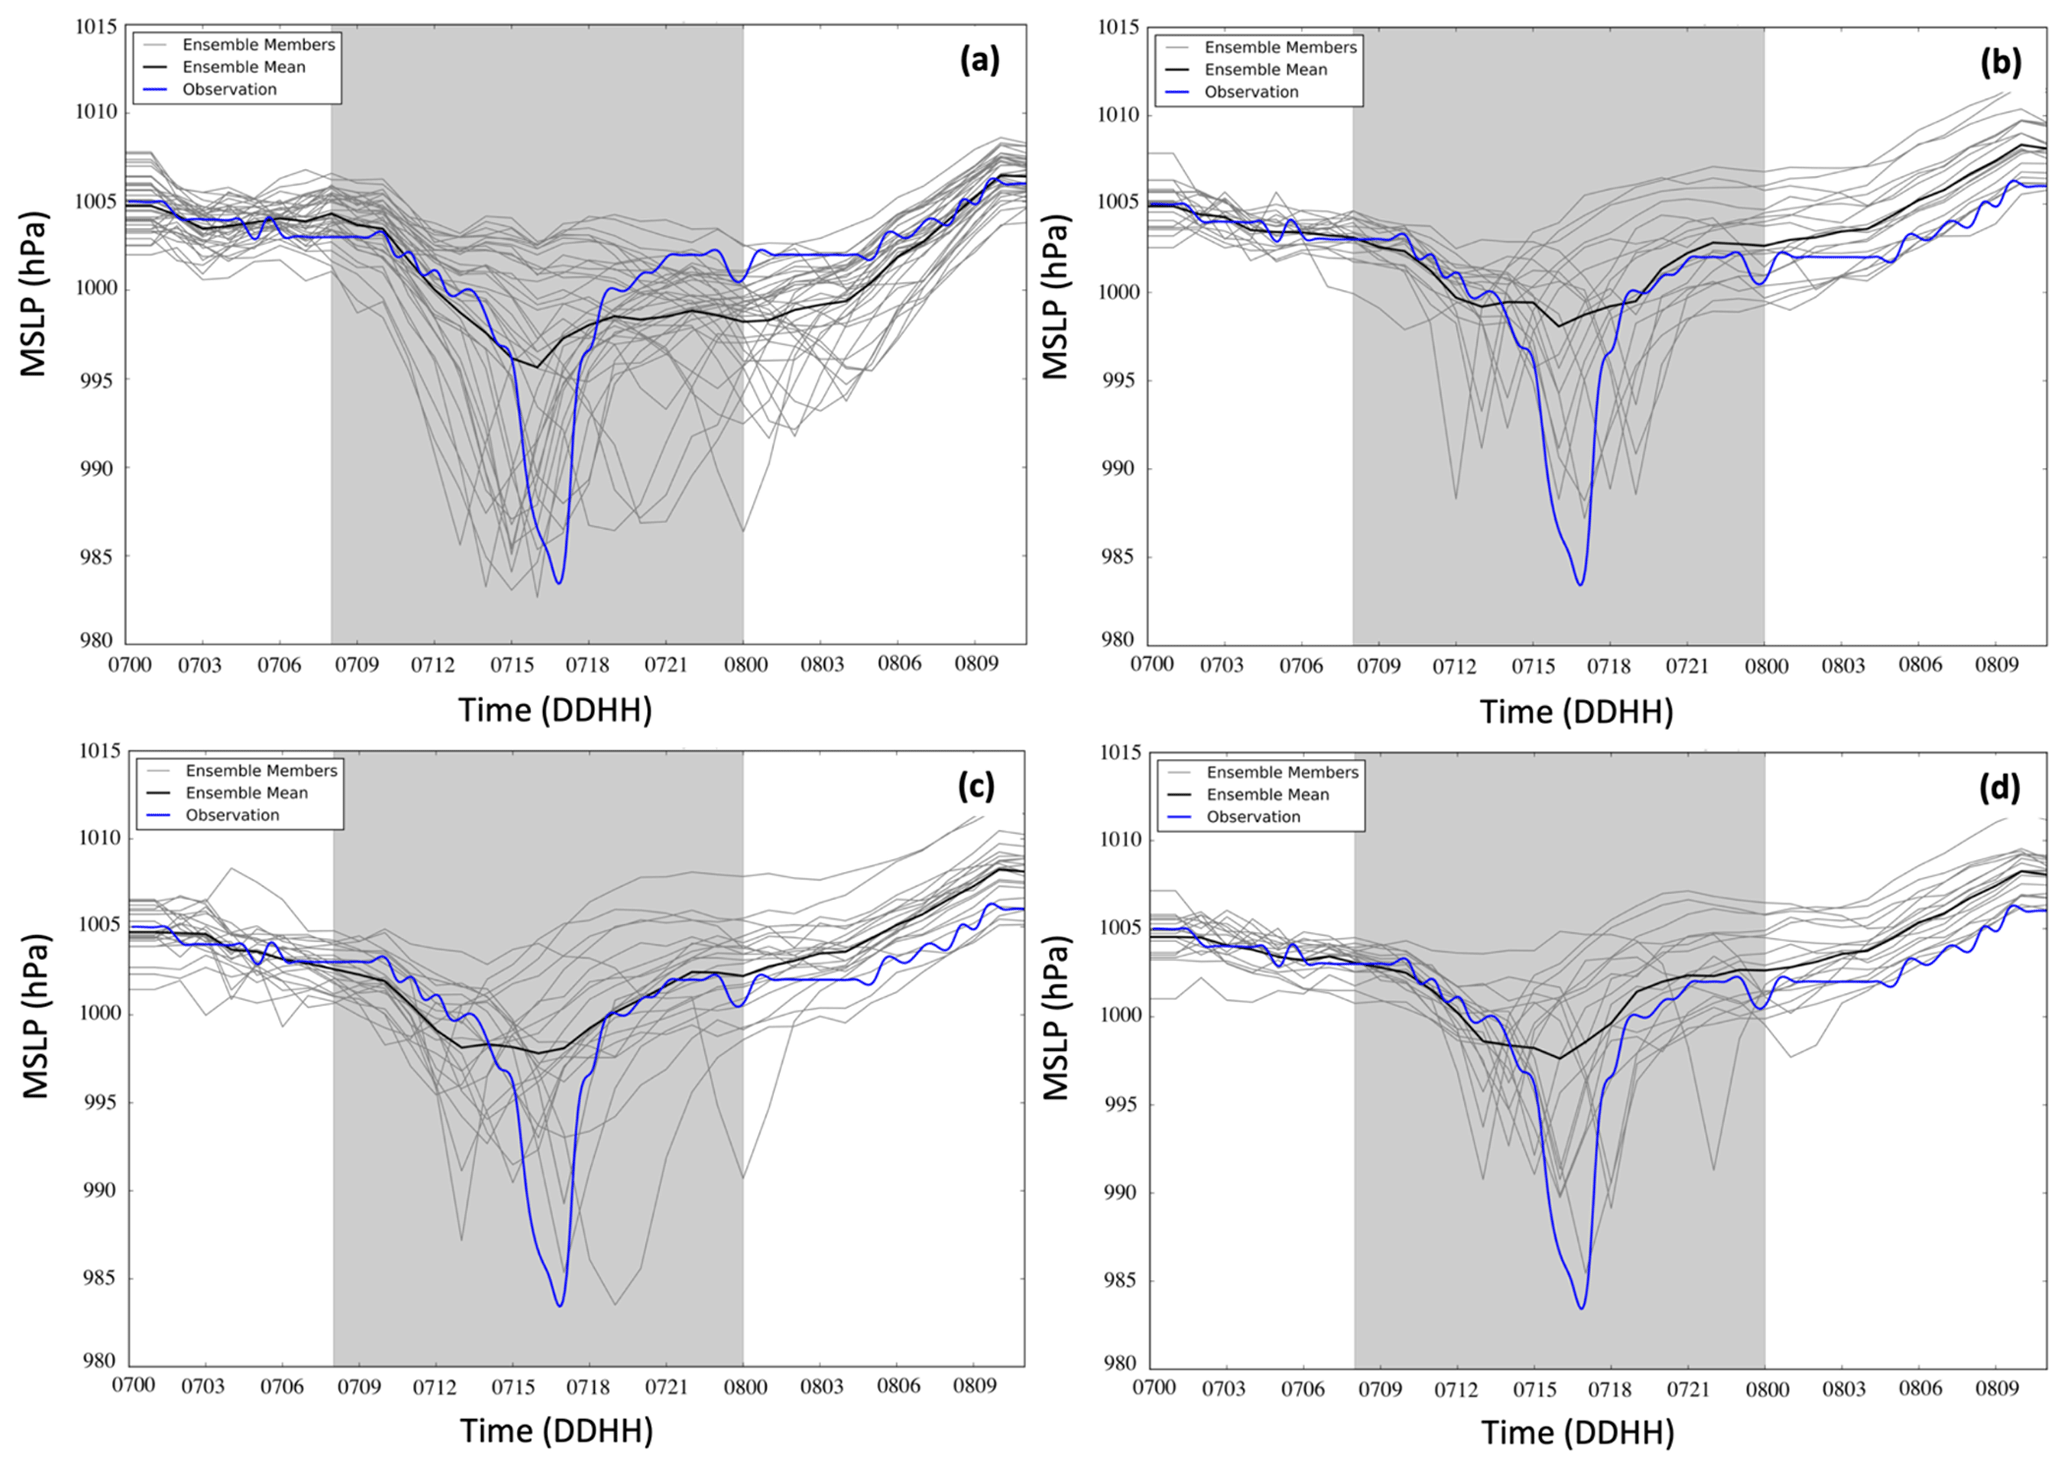
Figure 13Ensemble (solid grey lines) and ensemble mean (solid black lines) surface pressure evolution at the closest grid point to Malta for (a) NODA, (b) SYN, (c) RSAMV and (d) CNTRL experiments. Surface pressure registered by METARs in Malta's airport is also depicted (solid blue lines). Grey shaded area represents the most intense period of the medicane, which we are most interested in.
A closer inspection at the time the minimum surface pressure was observed (i.e., 17:00 UTC, 7 November) reveals that several ensemble members depict the minimum pressure at the same time, although the simulated cyclone is shallower than the observed. When only RSAMV observations are assimilated, some members simulate deep cyclones but again with great variability among ensemble members (Fig. 13c). It seems that the assimilation of only RSAMV observations is not enough to improve the relevant low-level atmospheric structures. Finally, the CNTRL experiment shows similar results to the SYN simulation, but in this case the ensemble members that correctly simulate the maximum depth of the cyclone at 17:00 UTC show lower surface pressure values than the ones observed by the SYN experiment (Fig. 13d). The ensemble spread of CNTRL is also reduced in comparison with the rest of the numerical experiments.
To quantitatively assess the goodness of these results we decided to use the lagged correlation between the ensemble members and the observations (Fig. 13). The correlation measures how the V shape of the surface pressure evolution signal fits the observations from METARs, accounting for its temporal shifting. In this sense, a correlation of 1 would mean that the specific ensemble member has the same V-shaped pressure evolution than the observations and also that the minimum for both of them is found at the same time. Taking into account that some ensemble members deepen faster or slower than observed, we compute lagged correlations between ensemble members and observations (Fig. 14). For the NODA experiment, the correlation of the ensemble members and the observations is maximum when a delay of 1 h is applied to the forecasts (Fig. 14a). In this case, the correlation value for the median of the ensemble is approximately 0.4, with some ensemble members depicting a correlation value larger than 0.9 and others a smaller value than −0.2. For the SYN experiment, the maximum correlation values for the ensemble members occur when a temporal delay of 1 h is applied (Fig. 14b). In this case, the ensemble median is approximately 0.4, and the third quartile is now higher than in the NODA experiment. When RSAMVs are the only observations assimilated, it can be seen that the highest correlation is found for a temporal lag of −1 h (Fig. 14c). However, in this case, the median of the ensemble shows a correlation value closer to 0.5. Finally, the CNTRL experiment shows again a maximum correlation for a temporal lag of −1 h, with a correlation value of 0.5 for the median of the ensemble and maximum correlation values of close to 1 for some of the ensemble members (Fig. 14d). All the above results indicate that CNTRL is the experiment which best verifies against the observations.
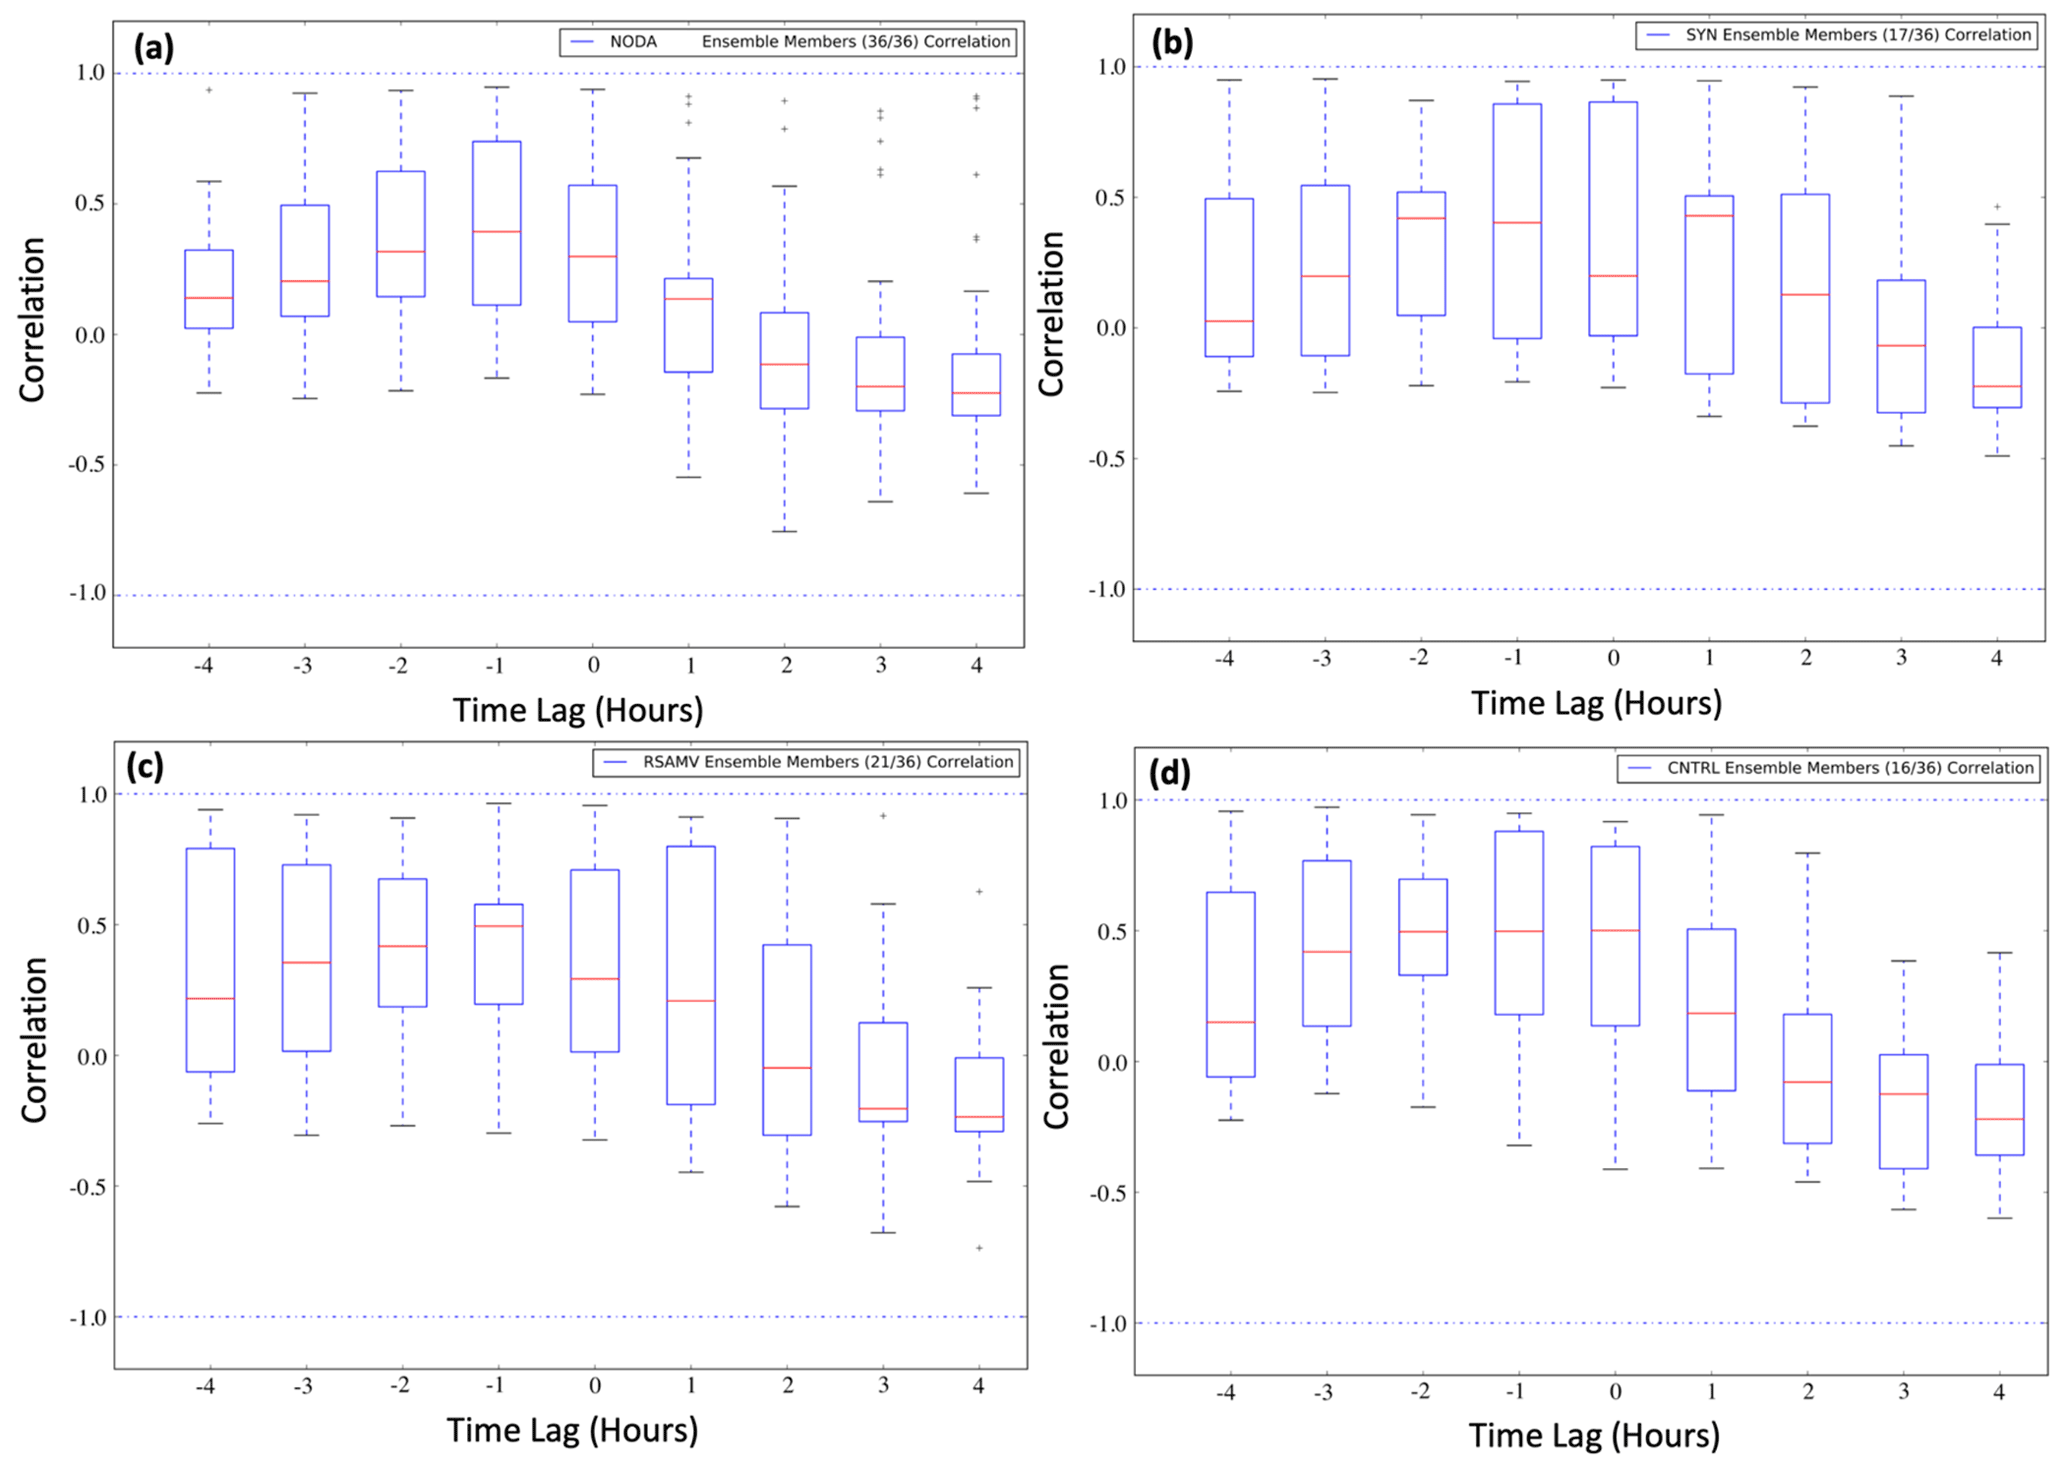
Figure 14Whisker plots depicting the lagged correlation values between the observations and the ensemble members for the different experiments (a) NODA, (b) SYN, (c) RSAMV and (d) CNTRL. The correlation is calculated taking into account that the V-shaped signature corresponding to the observations is shifted 4 h to the left and 4 h to the right.
4.3 A deeper understanding of the effects of EnKF on Qendresa's forecast
In order to better understand how the assimilation of different types of observations using the EnKF affects the forecast results of this low-predictable medicane event, we analyze different meteorological fields among the numerical experiments performed in this study, and we compare them against ERA5 reanalysis, which accurately depicts Qendresa's track and intensity. The good agreement of ERA5 and the observations is because ERA5 provides high-temporal resolution fields (i.e., hourly) obtained from the assimilation of vast numbers of observations (most of them satellite radiances), although they are found on a 30 km grid resolution mesh. It is important to note that to obtain ERA5 analysis AMVs have been assimilated. However, the RSAMV observations assimilated in this study, which are available every 20 min, are not used to produce ERA5 analysis (Hersbach et al., 2020). For the sake of brevity, here we showed these comparisons at two specific times, 00:00 and 18:00 UTC on 7 November 2014. We chose 00:00 UTC, because it is the initial condition state of all forecasts. Then, we focused on 18:00 UTC, because at that time, the cyclone reached its maximum intensity over Malta.
First, the mean sea level pressure (MSLP) obtained from the different numerical experiments were analyzed in comparison to ERA5 analysis (Fig. 15). Among all the experiments, NODA was the only that depicts an incipient low-pressure system resembling the one in ERA5. Regarding the data assimilation experiments, shallower and broader low-pressure systems, which are also shifted northwards towards the western part of Sicily, were identified. Differences between ERA5 and the data assimilation experiments clearly show a circular negative region of MSLP offshore Tunisia, indicating that these experiments clearly fail in performing an accurate representation of the initial conditions of the atmosphere for this event. At 18:00 UTC, the only experiment performing a deep cyclone structure is again NODA. However, an MSLP dipole over Malta from the differences between NODA and ERA5 indicates that the cyclone simulated by NODA is located north-westwards from the ERA5 cyclone. Instead, data assimilation experiments predict less intense low-pressure systems that are located southeaster of Malta. Thus, initial conditions obtained from the assimilation of in situ conventional and RSAMV observations are facilitating the increase of the cyclone's phase velocity, but in contrast, initial conditions from NODA are reducing such velocity.
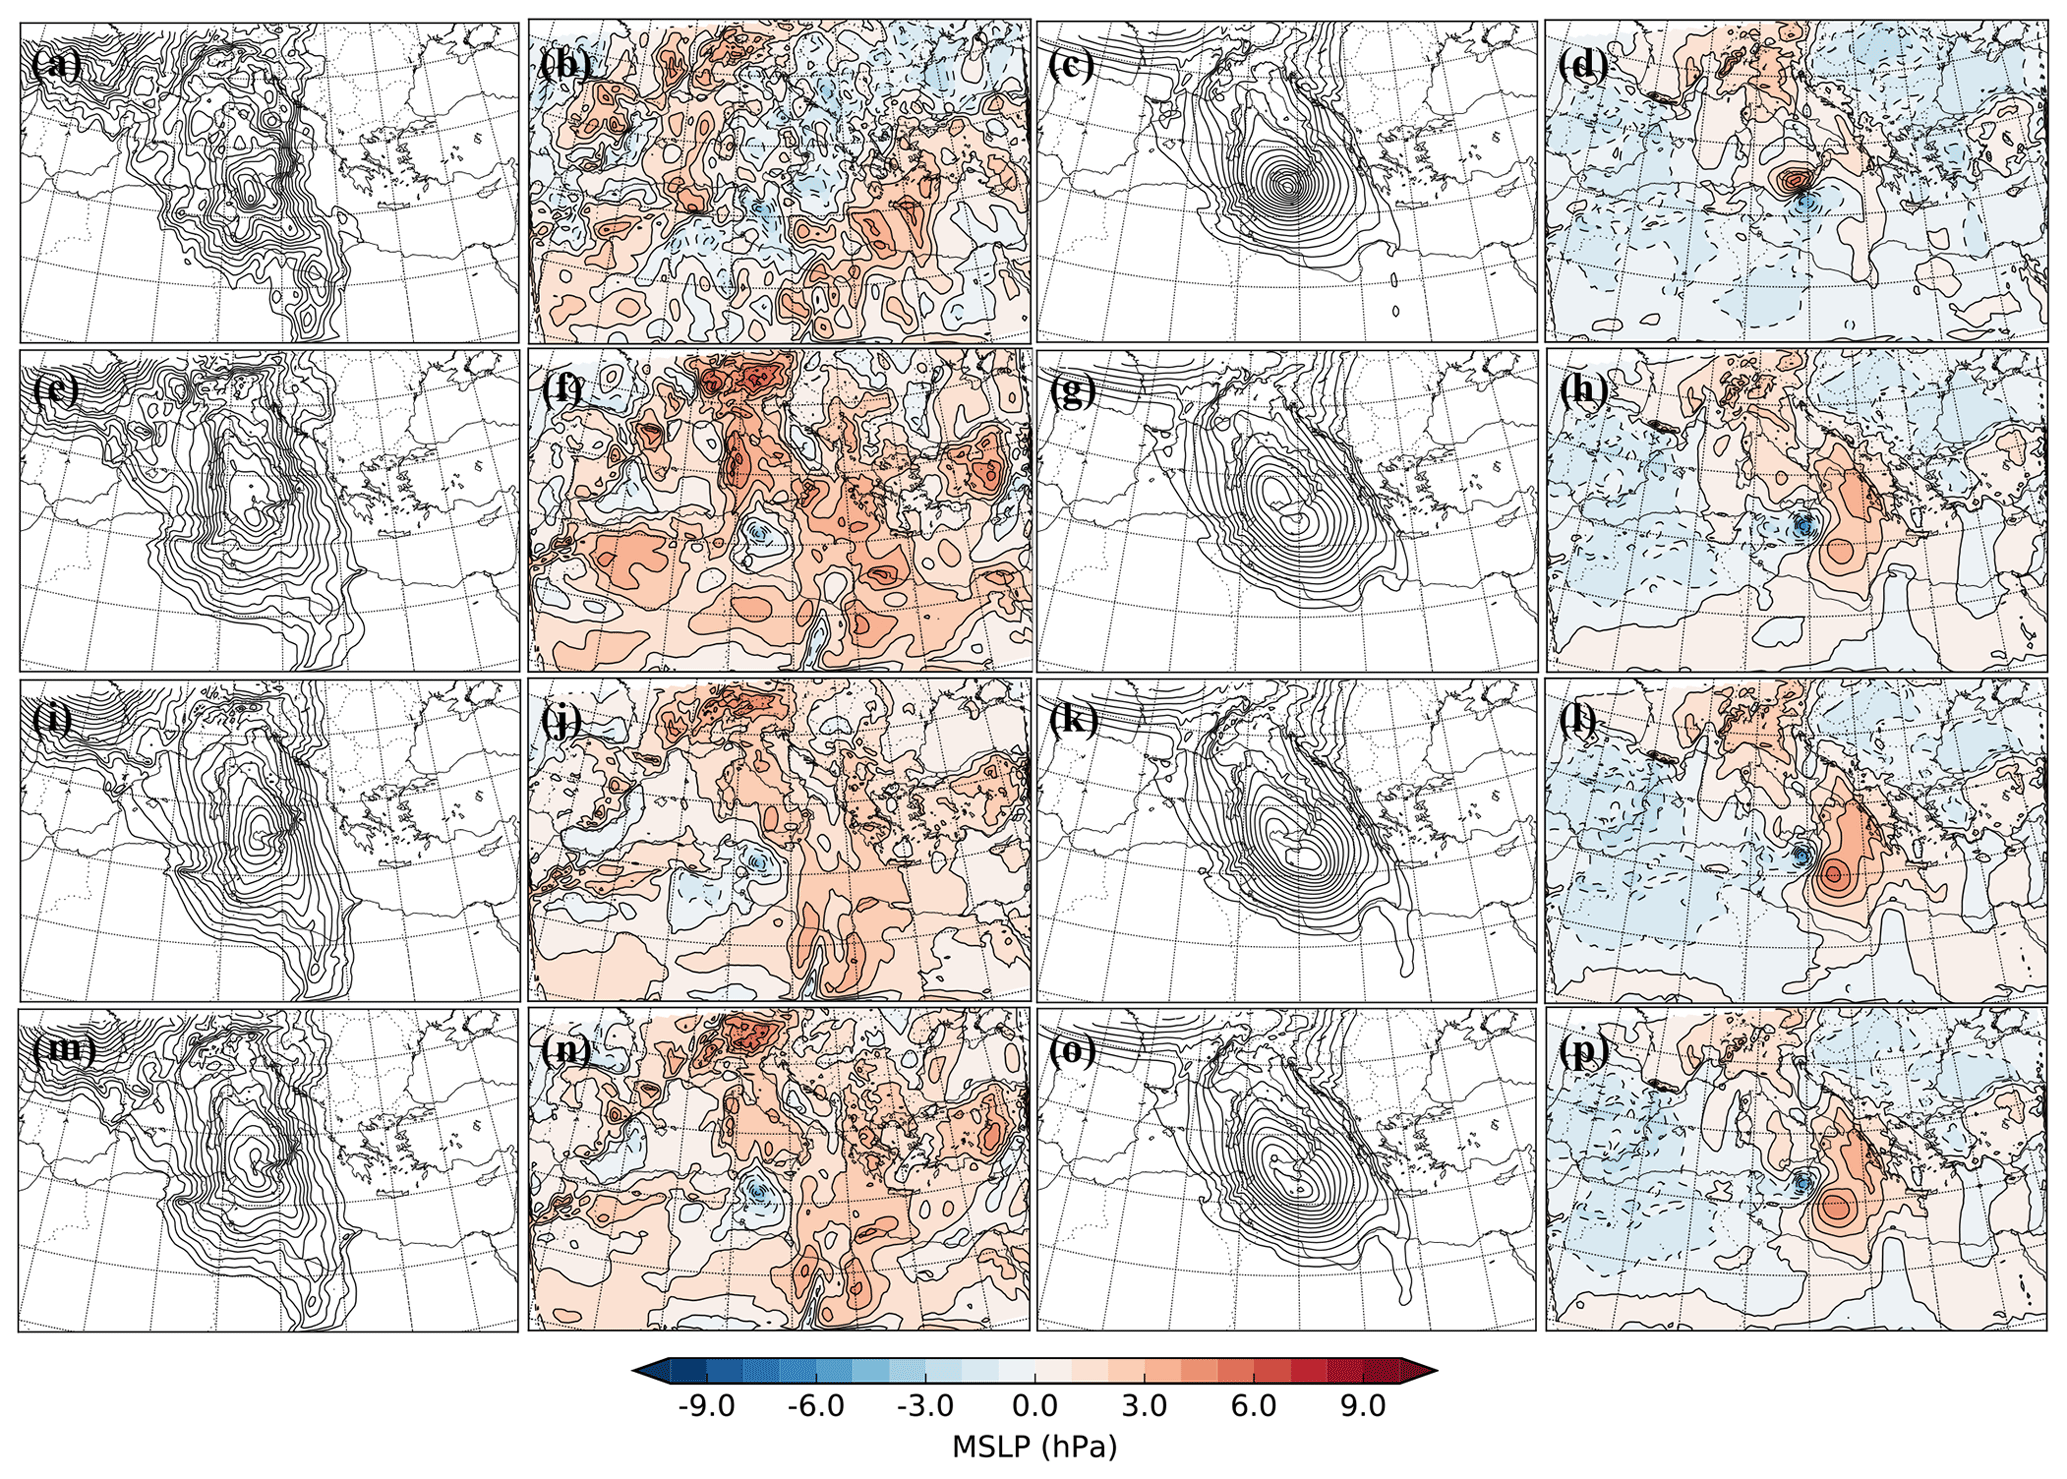
Figure 15Comparison of the MSLP between the numerical experiments and the ERA5 analysis at 00:00 UTC (initial conditions) and 18:00 UTC (maximum intensity registered at Malta). NODA, SYN, RSAMV and CNTRL experiments are shown in the first, second, third and fourth row, respectively. MSLP simulated by the different experiments at 00:00 and 18:00 UTC are shown in the first and third column, respectively, and the differences between ERA5 and the experiments are shown in the second and fourth columns, respectively.
Taking into account the fact that it was showed before that the predictability of this medicane event is strongly associated with the upper-level dynamics, it was also analyzed the geopotential height at 500 hPa and the potential vorticity at 300 hPa.
Regarding the geopotential height at 500 hPa, ERA5 initially shows a strong negative tilted trough with two geopotential minimum centers, one over the eastern part of the Balearic Islands and the other located over the south of Tunisia (Fig. 16). All numerical experiments correctly represent the negative tilted trough, but only NODA performs the above-mentioned two minimum centers of geopotential height with high accuracy. The data assimilation experiments represent a less intense trough (blue shaded areas), specially over the minimum located over Tunisia.

Figure 16Comparison of the geopotential at 500 hPa between the numerical experiments and the ERA5 analysis at 00:00 UTC (initial conditions) and 18:00 UTC (maximum intensity registered at Malta). NODA, SYN, RSAMV and CNTRL experiments are shown in the first, second, third and fourth row, respectively. 500 hPa-geopotential is performed by the different experiments at 00:00 and 18:00 UTC are shown in the first and third column, respectively, and the differences between ERA5 and the experiments are performed in the second and fourth column, respectively.
At 18:00 UTC, a cutoff is predicted by all experiments, being deeper in NODA than any other data assimilation experiments. However, significant differences in the location of the cutoff are found between these experiments. In the NODA experiment, the cutoff is centered approximately over the central part of Sicily, whereas ERA5 locates the center of the cutoff between the eastern part of Sicily and Malta. The other experiments share the same characteristics: the simulated cutoff is faster (eastwards) than the analyzed in ERA5. This can be easily seen by looking at the geopotential dipoles in Fig. 16d, h, l, p, which are located in southern Sicily.
Finally, due to its primary role in the cyclogenesis dynamics, we also analyzed the PV at 300 hPa for the entire set of numerical experiments (Fig. 17). In general, the PV anomaly predicted by the different experiments is very similar to the PV shown in ERA5 but with smaller amplitude and weaker PV gradients. The main difference between the data assimilation experiments and NODA is that the PV streamer in the latter is more intense. It is important to note that there is no significant differences among the PV structures simulated by the different data assimilation experiments. In the case of SYN, this is likely attributable to the lack of impact at such altitudes from the assimilation of a reduced set of conventional observations. In the case of the RSAMV, the effect is also very small. This is mainly attributed to the fact that a moderate horizontal covariance localization length scale of 50 km, which is necessary to avoid having correlated observation errors, is used. This, together with the fact that only a few RSAMV observations were reported at 300 hPa, are the main reasons for this experiment to not significantly change the PV trough. At 18:00 UTC, the analyzed PV streamer shows a very intense circular PV structure (∼10 PVU) centered over Malta, whereas the numerical experiments predict a wide area of PV with maximum values of 7 PVU over southern Greece.
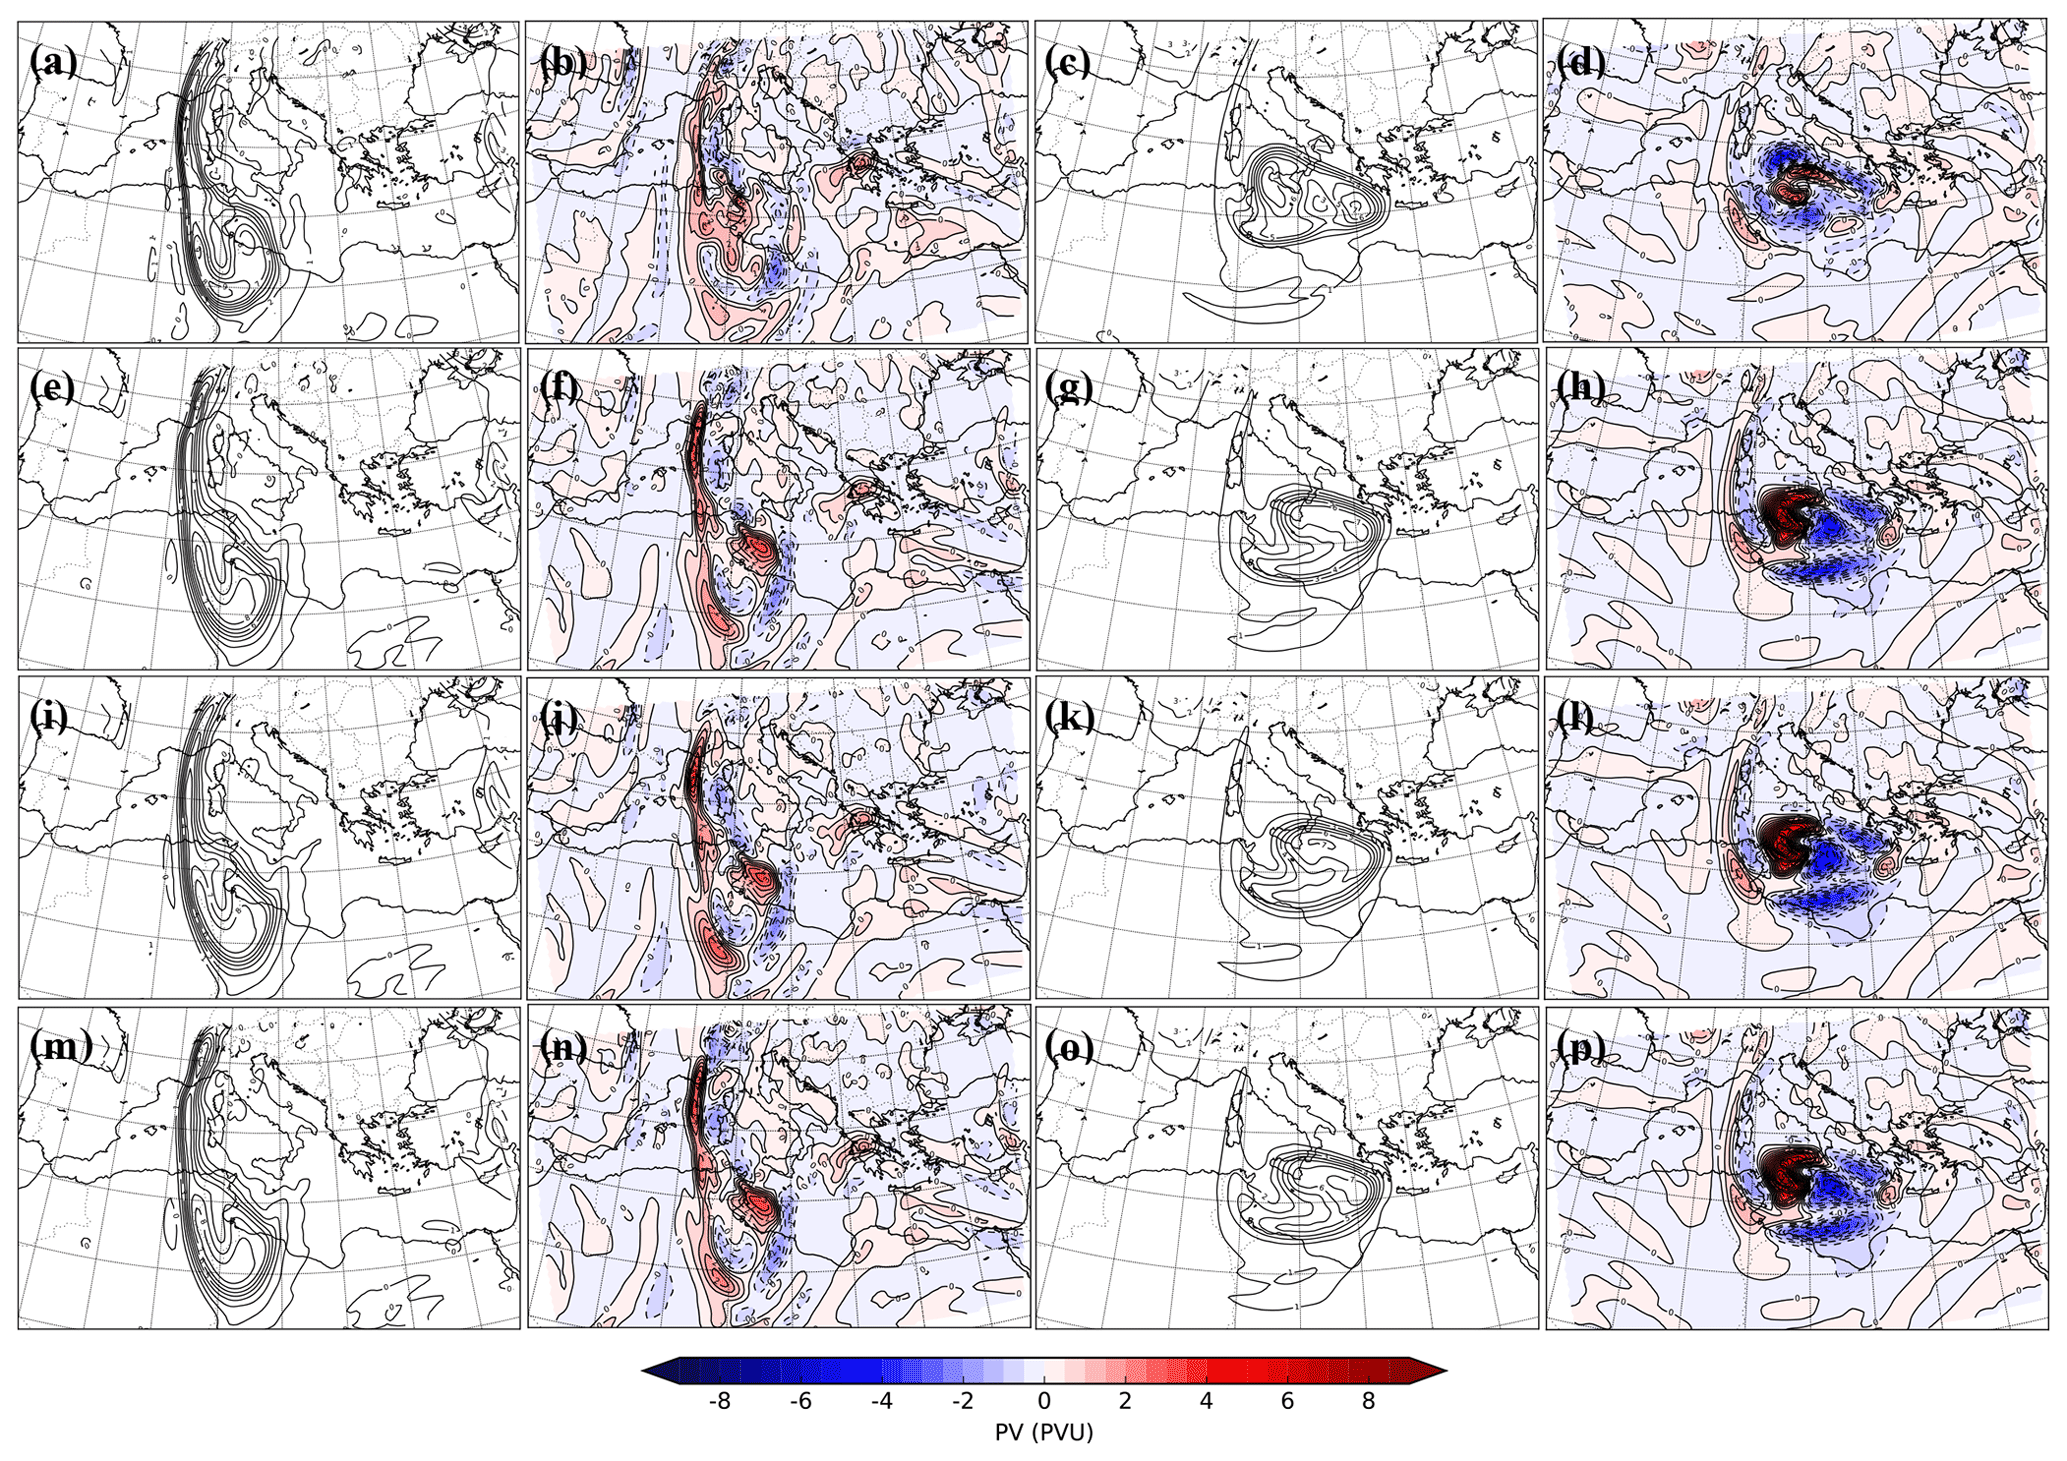
Figure 17Comparison of PV at 300 hPa between the numerical experiments and the ERA5 analysis at 00:00 UTC (initial conditions) and 18:00 UTC (maximum intensity registered at Malta). NODA, SYN, RSAMV and CNTRL experiments are shown in the first, second, third and fourth row, respectively. PV at 300 hPa depicted by the different experiments at 00:00 and 18:00 UTC is shown in the first and third column, respectively. The differences between ERA5 and the numerical experiments are shown in the second and fourth column, respectively.
The present study aims to explore the influence of assimilating RSAMV in combination with in situ conventional observations to enhance the forecast of a rare type of Mediterranean tropical-like cyclone, known as medicanes, which is also known to produce high socio-economic impacts to populated coastal regions in the Mediterranean Basin. The medicane discussed here took place over the sea between 6 and 8 November 2014 and severely affected Malta. Specifically, this weather event was selected due to its low-predictable behavior associated with the poor initial condition estimations of the atmosphere over the sea. Although data assimilation techniques have been applied to predict tropical cyclones or typhoons, they have not been applied (as far as the author is aware) to medicanes, which are much less predictable events. The analysis obtained from the EnKF (new initial conditions) is expected to provide a more accurate representation of the mesoscale environment, and thus forecasts started from this initial condition are also expected to provide more accurate predictions. It is noteworthy that real case data assimilation studies typically assimilate observations from the moment that the phenomena of interest are well observed and developed. In the case of tropical cyclone data assimilation studies, observations are assimilated when the tropical cyclone is already formed. However, in this study we are interested in improving, from an operational point of view, the pre-convective environment before this medicane event initiated and in this sense improving the warning systems associated with this phenomena.
To study the effect of the assimilation of conventional and RSAMV observations a set of four numerical experiments that provide initial conditions at 00:00 UTC on 7 November was designed. In the first experiment, SYN, only in situ conventional observations were assimilated. In the second experiment, RSAMV, only rapid scan atmospheric motion vector observations were assimilated. In the third experiment, CNTRL, both conventional and RSAMV observations were assimilated, and finally, in the NODA experiment, no data assimilation was performed. Results of these experiments were classified into two groups referring to the cyclone's track and intensity. Regarding the track of the cyclone, results indicated that in general, ensemble members did not predict accurate trajectories, being the NODA, the experiment that worse simulated the cyclone track, and being the RSAMV, the one that better predicts the observed trajectory during the mature phase of the medicane. However, cyclones' trajectories produced by the different data assimilation experiments were shifted towards the east, without performing the track loop observed through satellite imagery. This fact could be associated with the upper-level dynamics that act as a triggering mechanism of convection, as the comparison of the different experiments with ERA5 shows. In terms of the intensity of the cyclone, the CNTRL experiment was found to be the best simulation predicting the intensity of the medicane using lagged correlation verification, with a correlation median value of nearly 0.5 and some of the ensemble members depicting correlation values close to 1.
By analyzing the ensemble mean evolution of the surface pressure for all the experiments and comparing them against ERA5 analysis we found that data assimilation experiments (SYN, RSAMV and CNTRL) were simulating the center of the cyclone eastwards of the center of the ERA5 cyclone. To better understand this behavior, we analyzed the upper-level dynamics through the geopotential at 500 hPa and the PV at 300 hPa. Geopotential at 500 hPa simulated by the data assimilation experiments show a well-defined cutoff also displaced towards the east of the cutoff depicted by ERA5. Then, PV at 300 hPa depicted a broad and weak structure centered between south Italy and south Greece, in contrast to the clear, intense structure centered over Malta depicted by ERA5. In other words, the assimilation of RSAMV did not significantly modify such upper-level structures, which are crucial for the correct prediction of this medicane event. We hypothesize that this result could be attributable to the fact that the availability of RSAMV observations in the upper levels of the atmosphere was marginal, and hence, the DA system was not able to properly correct the upper-level dynamics of this weather event.
Please contact the author for information about the reproducibility of results using supercomputers.
The author has declared that there are no competing interests.
Publisher’s note: Copernicus Publications remains neutral with regard to jurisdictional claims in published maps and institutional affiliations.
This article is part of the special issue “Coastal hazards and hydro-meteorological extremes”. It is not associated with a conference.
The author acknowledges the Ministerio de Universidades (Plan de Recuperación, Transformación y Resiliencia) and the NextGenerationEU, which supports his current postdoctoral position. This research is sponsored by the Ministerio de Ciencia e Innovación - Agencia Estatal de Investigación/TRAMPAS (PID2020-113036RB-I00/AEI/10.13039/501100011033). The author thankfully acknowledges Météo-France for supplying the data and HyMeX database teams (ESPRI/IPSL and SEDOO/OMP) for their help in accessing the data. The author also acknowledges the computer resources at MareNostrum IV and the technical support provided by the Barcelona Supercomputer Center (RES-AECT-2017-1-0014, RES-AECT-2017-2-0014), required to perform the high-resolution simulations presented in this study. Thanks to Louis Wicker and Kent Knopfmeier from the National Severe Storm Laboratory for their technical assistance implementing the EnKF system. Special thanks to Víctor Homar for his valuable comments to improve the quality of this study.
This research has been supported by the ARC Centre of Excellence for Climate Extremes (grant no. CE170100023).
This paper was edited by Piero Lionello and Joanna Staneva, and reviewed by two anonymous referees.
Aksoy, A., Dowell, D. C., and Snyder, C.: A multicase comparative assessment of the ensemble Kalman filter for assimilation of radar observations. Part I: Storm-scale analyses, Mon. Weather Rev., 137, 1805–1824, 2009. a
Anderson, J., Hoar, T., Raeder, K., Liu, H., Collins, N., Torn, R., and Avellano, A.: The data assimilation research testbed: A community facility, B. Am. Meteorol. Soc., 90, 1283–1296, 2009. a, b
Anderson, J. L.: An ensemble adjustment Kalman filter for data assimilation, Mon. Weather Rev., 129, 2884–2903, 2001. a
Anderson, J. L. and Anderson, S. L.: A Monte Carlo implementation of the nonlinear filtering problem to produce ensemble assimilations and forecasts, Mon. Weather Rev., 127, 2741–2758, 1999. a
Anderson, J. L. and Collins, N.: Scalable implementations of ensemble filter algorithms for data assimilation, J. Atmos. Ocean. Tech., 24, 1452–1463, 2007. a, b
Bormann, N. and Bauer, P.: Estimates of spatial and interchannel observation-error characteristics for current sounder radiances for numerical weather prediction. I: Methods and application to ATOVS data, Q. J. Roy. Meteor. Soc., 136, 1036–1050, 2010. a
Bouin, M.-N. and Lebeaupin Brossier, C.: Impact of a medicane on the oceanic surface layer from a coupled, kilometre-scale simulation, Ocean Sci., 16, 1125–1142, https://doi.org/10.5194/os-16-1125-2020, 2020. a
Carrió, D. and Homar, V.: Potential of sequential EnKF for the short-range prediction of a maritime severe weather event, Atmos. Res., 178, 426–444, 2016. a
Carrió, D., Homar, V., Jansà, A., Romero, R., and Picornell, M.: Tropicalization process of the 7 November 2014 Mediterranean cyclone: Numerical sensitivity study, Atmos. Res., 197, 300–312, 2017. a, b, c, d, e
Carrió, D., Homar, V., and Wheatley, D.: Potential of an EnKF storm-scale data assimilation system over sparse observation regions with complex orography, Atmos. Res., 216, 186–206, 2019. a, b
Carrió, D., Jansà, A., Homar, V., Romero, R., Rigo, T., Ramis, C., Hermoso, A., and Maimó, A.: Exploring the benefits of a Hi-EnKF system to forecast an extreme weather event. The 9th October 2018 catastrophic flash flood in Mallorca, Atmos. Res., 265, 105917, https://doi.org/10.1016/j.atmosres.2021.105917, 2022. a
Choy, C. W., Lau, D. S., and He, Y.: Super typhoons Hato (1713) and Mangkhut (1822), part II: Challenges in forecasting and early warnings, Weather, vol. 9999, 2020. a
Cioni, G., Cerrai, D., and Klocke, D.: Investigating the predictability of a Mediterranean tropical-like cyclone using a storm-resolving model, Q. J. Roy. Meteor. Soc.,, 144, 1598–1610, 2018. a
Daley, R.: Atmospheric data analysis, Cambridge university press, ISBN: 0-521-38215-7, 1993. a
Dawson II, D. T., Wicker, L. J., Mansell, E. R., and Tanamachi, R. L.: Impact of the environmental low-level wind profile on ensemble forecasts of the 4 May 2007 Greensburg, Kansas, tornadic storm and associated mesocyclones, Mon. Weather Rev., 140, 696–716, 2012. a
DeMaria, M., Sampson, C. R., Knaff, J. A., and Musgrave, K. D.: Is tropical cyclone intensity guidance improving?, B. Am. Meteorol. Soc., 95, 387–398, 2014. a
Derber, J. C. and Wu, W.-S.: The use of TOVS cloud-cleared radiances in the NCEP SSI analysis system, Mon. Weather Rev., 126, 2287–2299, 1998. a, b
De Zolt, S., Lionello, P., Nuhu, A., and Tomasin, A.: The disastrous storm of 4 November 1966 on Italy, Nat. Hazards Earth Syst. Sci., 6, 861–879, https://doi.org/10.5194/nhess-6-861-2006, 2006. a
Dorian, T., Ward, B., and Chen, Y.-L.: Tropical Cyclone Amos (2016) Forecasting Challenges: A Model’s Perspective, Tropical Cyclone Research and Review, 7, 172–178, 2018. a
Dowell, D. C. and Wicker, L. J.: Additive noise for storm-scale ensemble data assimilation, J. Atmos. Ocean. Tech., 26, 911–927, 2009. a
Dowell, D. C., Zhang, F., Wicker, L. J., Snyder, C., and Crook, N. A.: Wind and temperature retrievals in the 17 May 1981 Arcadia, Oklahoma, Supercell: Ensemble Kalman Filter Experiments, Mon. Weather Rev., 132, 1982–2005, 2004. a, b
Dudhia, J.: Numerical study of convection observed during the winter monsoon experiment using a mesoscale two-dimensional model, J. Atmos. Sci., 46, 3077–3107, 1989. a
Emanuel, K.: Genesis and maintenance of “Mediterranean hurricanes”, Adv. Geosci., 2, 217–220, https://doi.org/10.5194/adgeo-2-217-2005, 2005. a
Ernst, J. and Matson, M.: A Mediterranean tropical storm?, Weather, 38, 332–337, 1983. a
Errico, R. M.: The dynamical balance of leading singular vectors in a primitive-equation model, Q. J. Roy. Meteor. Soc., 126, 1601–1618, 2000. a
Evensen, G.: The ensemble Kalman filter: Theoretical formulation and practical implementation, Ocean Dynam., 53, 343–367, 2003. a
Evensen, G.: Data assimilation: the ensemble Kalman filter, Springer, Berlin, ISBN: 978-3-642-03711-5, 2009. a
Fertig, E. J., BAEK, S.-J., Hunt, B. R., Ott, E., Szunyogh, I., Aravéquia, J. A., Kalnay, E., Li, H., and Liu, J.: Observation bias correction with an ensemble Kalman filter, Tellus A, 61, 210–226, 2009. a
Fita, L., Romero, R., Luque, A., Emanuel, K., and Ramis, C.: Analysis of the environments of seven Mediterranean tropical-like storms using an axisymmetric, nonhydrostatic, cloud resolving model, Nat. Hazards Earth Syst. Sci., 7, 41–56, https://doi.org/10.5194/nhess-7-41-2007, 2007. a
Gaspari, G. and Cohn, S. E.: Construction of correlation functions in two and three dimensions, Q. J. Roy. Meteor. Soc., 125, 723–757, 1999. a
Geer, A. J., Lonitz, K., Weston, P., Kazumori, M., Okamoto, K., Zhu, Y., Liu, E. H., Collard, A., Bell, W., Migliorini, S., Chambon, P., Fourrié, N., Kim, M.-J., Köpken-Watts, C., and Schraff, C.: All-sky satellite data assimilation at operational weather forecasting centres, Q. J. Roy. Meteorol. Soc., 144, 1191–1217, 2018. a
Goerss, J. S.: Impact of satellite observations on the tropical cyclone track forecasts of the Navy Operational Global Atmospheric Prediction System, Mon. Weather Rev., 137, 41–50, 2009. a, b
Gómez, M., Álvarez, E., Carretero, J., Pérez, B., Rodríguez, I., Serrano, O., and Sotillo, M.: OCEANOGRAPHIC AND ATMOSPHERIC ANALYSIS OF THE 10-16 NOVEMBER 2001 STORM IN THE WESTERN MEDITERRANEAN, in: Proceedings of the 4th EGS Plinius Conference on Mediterranean Storm, Mallorca, Spain, 5 pp., 2003. a
Grell, G. A. and Freitas, S. R.: A scale and aerosol aware stochastic convective parameterization for weather and air quality modeling, Atmos. Chem. Phys., 14, 5233–5250, https://doi.org/10.5194/acp-14-5233-2014, 2014. a
Hacker, J. P., Anderson, J. L., and Pagowski, M.: Improved vertical covariance estimates for ensemble-filter assimilation of near-surface observations, Mon. Weather Rev., 135, 1021–1036, 2007. a
Hannon, S. E., Strow, L. L., and McMillan, W. W.: Atmospheric infrared fast transmittance models: A comparison of two approaches, in: Optical Spectroscopic Techniques and Instrumentation for Atmospheric and Space Research II, SPIE, 2830, 94–105, 1996. a
Hersbach, H., Bell, B., Berrisford, P., Hirahara, S., Horányi, A., Muñoz-Sabater, J., Nicolas, J., Peubey, C., Radu, R., Schepers, D., Simmons, A., Soci, C., Abdalla, S., Abellan, X., Balsamo, G., Bechtold, P., Biavati, G., Bidlot, J., Bonavita, M., De Chiara, G., Dahlgren, P., Dee, D., Diamantakis, M., Dragani, R., Flemming, J., Forbes, R., Fuentes, M., Geer, A., Haimberger, L., Healy, S., Hogan, Robin J., Hólm, E., Janisková, M., Keeley, S., Laloyaux, P., Lopez, P., Lupu, C., Radnoti, G., de Rosnay, P., Rozum, I., Vamborg, F., Villaume, S., and Thépaut, J.-N.: The ERA5 global reanalysis, Q. J. Roy. Meteor. Soc., 146, 1999–2049, 2020. a
Honda, T., Miyoshi, T., Lien, G.-Y., Nishizawa, S., Yoshida, R., Adachi, S. A., Terasaki, K., Okamoto, K., Tomita, H., and Bessho, K.: Assimilating all-sky Himawari-8 satellite infrared radiances: A case of Typhoon Soudelor (2015), Mon. Weather Rev., 146, 213–229, 2018. a
Hong, S. Y., Noh, Y., and Dudhia, J.: A new vertical diffusion package with an explicit treatment of entrainment processes, Mon. Weather Rev., 134, 2318—2341, 2006. a
Houtekamer, P. L. and Mitchell, H. L.: Data assimilation using an ensemble Kalman filter technique, Mon. Weather Rev., 126, 796–811, 1998. a
Houze Jr., R. A., Chen, S. S., Lee, W.-C., Rogers, R. F., Moore, J. A., Stossmeister, G. J., Bell, M. M., Cetrone, J., Zhao, W., and Brodzik, S. R.: The hurricane rainband and intensity change experiment: Observations and modeling of Hurricanes Katrina, Ophelia, and Rita, B. Am. Meteorol. Soc., 87, 1503–1522, 2006. a
Iacono, M. J., Delamere, J. S., Mlawer, E. J., Shephard, M. W., Clough, S. A., and Collins, W. D.: Radiative forcing by long-lived greenhouse gases: Calculations with the AER radiative transfer models, J. Geophys. Res., 113, D13103, https://doi.org/10.1029/2008JD009944, 2008. a
Janjic, Z. I.: The step-mountain coordinate: Physical package, Mon. Weather Rev., 118, 1429–1443, 1990. a
Jansa, A., Genoves, A., Picornell, M. A., Campins, J., Riosalido, R., and Carretero, O.: Western Mediterranean cyclones and heavy rain. Part 2: Statistical approach, Meteorol. Appl., 8, 43–56, 2001. a
Jansa, A., Alpert, P., Arbogast, P., Buzzi, A., Ivancan-Picek, B., Kotroni, V., Llasat, M. C., Ramis, C., Richard, E., Romero, R., and Speranza, A.: MEDEX: a general overview, Nat. Hazards Earth Syst. Sci., 14, 1965–1984, https://doi.org/10.5194/nhess-14-1965-2014, 2014. a
Jones, T. A., Stensrud, D. J., Minnis, P., and Palikonda, R.: Evaluation of a forward operator to assimilate cloud water path into WRF-DART, Mon. Weather Rev., 141, 2272–2289, 2013. a
Jones, T. A., Stensrud, D., Wicker, L., Minnis, P., and Palikonda, R.: Simultaneous radar and satellite data storm-scale assimilation using an ensemble Kalman filter approach for 24 May 2011, Mon. Weather Rev., 143, 165–194, 2015. a
Kain, J. S.: The Kain-Fritsch convective parameterization: an update, J. Appl. Meteorol., 43, 170–181, 2004. a
Kain, J. S. and Fritsch, J. M.: A one-dimensional entraining/detraining plume model and its application in convective parameterization, J. Atmos. Sci., 47, 2784–2802, 1990. a
Kain, J. S., Coniglio, M. C., Correia, J., Clark, A. J., Marsh, P. T., Ziegler, C. L., Lakshmanan, V., Miller, S. D., Jr., Dembek, S. R., Weiss, S. J., Kong, F., Xue, M., Sobash, R. A., Dean, A. R., Jirak, I. L., and Melick, C. J.: A feasibility study for probabilistic convection initiation forecasts based on explicit numerical guidance, B. Am. Meteorol. Soc., 94, 1213–1225, 2013. a
Kalnay, E.: Atmospheric modeling, data assimilation and predictability, Cambridge University Press, ISBN: 978-0-521-79179-3, 2003. a
Kumar, S. V., Reichle, R. H., Harrison, K. W., Peters-Lidard, C. D., Yatheendradas, S., and Santanello, J. A.: A comparison of methods for a priori bias correction in soil moisture data assimilation, Water Resources Research, 48, W03515, https://doi.org/10.1029/2010WR010261, 2012. a
Lagouvardos, K., Kotroni, V., Nickovic, S., Jovic, D., Kallos, G., and Tremback, C.: Observations and model simulations of a winter sub-synoptic vortex over the central Mediterranean, Meteorol. Appl., 6, 371–383, 1999. a
Langland, R. H., Velden, C., Pauley, P. M., and Berger, H.: Impact of satellite-derived rapid-scan wind observations on numerical model forecasts of Hurricane Katrina, Mon. Weather Rev., 137, 1615–1622, 2009. a, b
Le Marshall, J., Jung, J., Zapotocny, T., Redder, C., Dunn, M., Daniels, J., Riishojgaard, L. P.: Impact of MODIS atmospheric motion vectors on a global NWP system, Aust. Meteorol. Mag., 57, p. 45, 2008. a
Li, J., Wolf, W. W., Menzel, W. P., Zhang, W., Huang, H.-L., and Achtor, T. H.: Global soundings of the atmosphere from ATOVS measurements: The algorithm and validation, J. Appl. Meteorol., 39, 1248–1268, 2000. a
Ma, C., Wang, T., Jiang, Z., Wu, H., Zhao, M., Zhuang, B., Li, S., Xie, M., Li, M., Liu, J., and Wu, R.: Importance of bias correction in data assimilation of multiple observations over eastern China using WRF-Chem/DART, J. Geophys. Res.-Atmos., 125, e2019JD031465, https://doi.org/10.1029/2019JD031465, 2020. a
McNally, A., Watts, P., A Smith, J., Engelen, R., Kelly, G., Thépaut, J., and Matricardi, M.: The assimilation of AIRS radiance data at ECMWF, Q. J. Roy. Meteor. Soc., 132, 935–957, 2006. a
Mecikalski, J. R., Minnis, P., and Palikonda, R.: Use of satellite derived cloud properties to quantify growing cumulus beneath cirrus clouds, Atmos. Res., 120, 192–201, 2013. a
Miyoshi, T., Sato, Y., and Kadowaki, T.: Ensemble Kalman filter and 4D-Var intercomparison with the Japanese operational global analysis and prediction system, Mon. Weather Rev., 138, 2846–2866, 2010. a
Mylonas, M. P., Douvis, K. C., Polychroni, I. D., Politi, N., and Nastos, P. T.: Analysis of a Mediterranean Tropical-Like Cyclone. Sensitivity to WRF Parameterizations and Horizontal Resolution, Atmosphere, 10, 425, https://doi.org/10.3390/atmos10080425, 2019. a, b
Nakanishi, M. and Niino, H.: An improved Mellor–Yamada level-3 model: Its numerical stability and application to a regional prediction of advection fog, Bound.-Lay. Meteorol., 119, 397–407, 2006. a
Noyelle, R., Ulbrich, U., Becker, N., and Meredith, E. P.: Assessing the impact of sea surface temperatures on a simulated medicane using ensemble simulations, Nat. Hazards Earth Syst. Sci., 19, 941–955, https://doi.org/10.5194/nhess-19-941-2019, 2019. a
Otkin, J. A.: Clear and cloudy sky infrared brightness temperature assimilation using an ensemble Kalman filter, J. Geophys. Res., 115, D19207, https://doi.org/10.1029/2009JD013759, 2010. a
Otkin, J. A., Potthast, R., and Lawless, A. S.: Nonlinear bias correction for satellite data assimilation using Taylor series polynomials, Mon. Weather Rev., 146, 263–285, 2018. a
Palmer, T. and Hagedorn, R.: Chapter 16 - Observations, assimilation and the improvement of global weather prediction-some results from operational forecasting and ERA-40, in: Predictability of weather and climate, Cambridge University Press, https://doi.org/10.1017/CBO9780511617652, 2006. a
Polkinghorne, R. and Vukicevic, T.: Data assimilation of cloud-affected radiances in a cloud-resolving model, Mon. Weather Rev., 139, 755–773, 2011. a
Polkinghorne, R., Vukicevic, T., and Evans, K. F.: Validation of cloud-resolving model background data for cloud data assimilation, Mon. Weather Rev., 138, 781–795, 2010. a
Pu, Z., Li, X., Velden, C. S., Aberson, S. D., and Liu, W. T.: The impact of aircraft dropsonde and satellite wind data on numerical simulations of two landfalling tropical storms during the tropical cloud systems and processes experiment, Weather Forecast., 23, 62–79, 2008. a, b, c
Pytharoulis, I., Kartsios, S., Tegoulias, I., Feidas, H., Miglietta, M., Matsangouras, I., and Karacostas, T.: Sensitivity of a Mediterranean Tropical-Like Cyclone to Physical Parameterizations, Atmosphere, 9, 436, https://doi.org/10.3390/atmos9110436, 2018. a, b, c, d
Rabier, F.: Overview of global data assimilation developments in numerical weather-prediction centres, Q. J. Roy. Meteor. Soc., 131, 3215–3233, https://doi.org/10.1256/qj.05.129, 2005. a
Rasmussen, E. and Zick, C.: A subsynoptic vortex over the Mediterranean with some resemblance to polar lows, Tellus A, 39, 408–425, 1987. a
Romine, G. S., Schwartz, C. S., Snyder, C., Anderson, J. L., and Weisman, M. L.: Model bias in a continuously cycled assimilation system and its influence on convection-permitting forecasts, Mon. Weather Rev., 141, 1263–1284, 2013. a, b, c, d, e
Schmetz, J., Holmlund, K., Hoffman, J., Strauss, B., Mason, B., Gaertner, V., Koch, A., and Van De Berg, L.: Operational cloud-motion winds from Meteosat infrared images, J. Appl. Meteorol. Clim., 32, 1206–1225, 1993. a
Shen, F., Min, J., and Xu, D.: Assimilation of radar radial velocity data with the WRF Hybrid ETKF–3DVAR system for the prediction of Hurricane Ike (2008), Atmos. Res., 169, 127–138, 2016. a
Skamarock, W., Klemp, J., Dudhia, J., Gill, D., Barker, D., Duda, M., Huang, X., Wang, W., and Powers, J.: A description of the Advanced Research WRF Version 3, NCAR technical note, Mesoscale and Microscale Meteorology Division, National Center for Atmospheric Research, Boulder, Colorado, USA, https://doi.org/10.5065/D68S4MVH, 2008. a
Snyder, C. and Zhang, F.: Assimilation of Simulated Doppler Radar Observations with an Ensemble Kalman Filter, Mon. Weather Rev., 131, 1663–1677, 2003. a, b
Sobash, R. A. and Stensrud, D. J.: The impact of covariance localization for radar data on EnKF analyses of a developing MCS: Observing system simulation experiments, Mon. Weather Rev., 141, 3691–3709, 2013. a
Thompson, G., Rasmussen, R. M., and Manning, K.: Explicit forecasts of winter precipitation using an improved bulk microphysics scheme. Part I: Description and sensitivity analysis, Mon. Weather Rev., 132, 519–542, 2004. a
Tiedtke, M.: A comprehensive mass flux scheme for cumulus parameterization in large-scale models, Mon. Weather Rev., 117, 1779–1800, 1989. a
Tong, M. and Xue, M.: Ensemble Kalman filter assimilation of Doppler radar data with a compressible nonhydrostatic model: OSS experiments, Mon. Weather Rev., 133, 1789–1807, 2005. a
Velden, C. S., Hayden, C. M., Nieman, S. J., Menzel, W. P., Wanzong, S., and Goerss, J. S.: Upper-tropospheric winds derived from geostationary satellite water vapor observations, B. Am. Meteorol. Soc., 78, 173–195, 1997. a
Vukicevic, T., Greenwald, T., Zupanski, M., Zupanski, D., Vonder Haar, T., and Jones, A.: Mesoscale cloud state estimation from visible and infrared satellite radiances, Mon. Weather Rev., 132, 3066–3077, 2004. a, b
Vukicevic, T., Sengupta, M., Jones, A., and Haar, T. V.: Cloud-resolving satellite data assimilation: Information content of IR window observations and uncertainties in estimation, J. Atmos. Sci., 63, 901–919, 2006. a
Walker, E., Mitchell, D., and Seviour, W.: The numerous approaches to tracking extratropical cyclones and the challenges they present, Weather, 75, 336–341, 2020. a
Wheatley, D. M., Knopfmeier, K. H., Jones, T. A., and Creager, G. J.: Storm-scale data assimilation and ensemble forecasting with the NSSL Experimental Warn-on-Forecast System. Part I: Radar data experiments, Weather Forecast., 30, 1795–1817, 2015. a
Wu, T.-C., Liu, H., Majumdar, S. J., Velden, C. S., and Anderson, J. L.: Influence of assimilating satellite-derived atmospheric motion vector observations on numerical analyses and forecasts of tropical cyclone track and intensity, Mon. Weather Rev., 142, 49–71, 2014. a
Wu, T.-C., Velden, C. S., Majumdar, S. J., Liu, H., and Anderson, J. L.: Understanding the influence of assimilating subsets of enhanced atmospheric motion vectors on numerical analyses and forecasts of tropical cyclone track and intensity with an ensemble Kalman filter, Mon. Weather Rev., 143, 2506–2531, 2015. a
Wu, X., Zhang, S., Liu, Z., Rosati, A., and Delworth, T.: A study of impact of the geographic dependence of observing system on parameter estimation with an intermediate coupled model, Clim. Dynam., 40, 1789–1798, 2013. a, b
Yussouf, N., Gao, J., Stensrud, D. J., and Ge, G.: The impact of mesoscale environmental uncertainty on the prediction of a tornadic supercell storm using ensemble data assimilation approach, Adv. Meteorol., 2013, 731647, https://doi.org/10.1155/2013/731647, 2013. a, b
Zhang, J., Li, Z., Li, J., and Li, J.: Ensemble retrieval of atmospheric temperature profiles from AIRS, Adv. Atmos. Sci., 31, 559–569, 2014. a
Zhang, S. Q., Zupanski, M., Hou, A. Y., Lin, X., and Cheung, S. H.: Assimilation of precipitation-affected radiances in a cloud-resolving WRF ensemble data assimilation system, Mon. Weather Rev., 141, 754–772, 2013. a
Zupanski, D., Zhang, S. Q., Zupanski, M., Hou, A. Y., and Cheung, S. H.: A prototype WRF-based ensemble data assimilation system for dynamically downscaling satellite precipitation observations, J. Hydrometeorol., 12, 118–134, 2011. a, b, c
Details on the quality control procedures can be found online at https://madis.ncep.noaa.gov/madis_qc.shtml (last access: 15 February 2023).
This product is obtained using the Spinning Enhanced Visible and Infrared Imager (SEVIRI) instrument on board the Meteosat Second Generation (MSG) satellite, which has a scanning frequency of as low as 5 min. The final product is obtained averaging four consecutive images.