the Creative Commons Attribution 4.0 License.
the Creative Commons Attribution 4.0 License.
 | 09 Feb 2023
Evolution of multivariate drought hazard, vulnerability and risk in India under climate change
Venkataswamy Sahana
Changes in climate and socio-economic conditions pose a major threat to water security, particularly in the densely populated, agriculture-dependent and rapidly developing country of India. Therefore, for cogent mitigation and adaptation planning, it is important to assess the future evolution of drought hazard, vulnerability and risk. Earlier studies have demonstrated projected drought risk over India on the basis of frequency analysis and/or hazard assessment alone. This study investigates and evaluates the change in projected drought risk under future climatic and socio-economic conditions by combining drought hazard and vulnerability projections at a country-wide scale. A multivariate standardized drought index (MSDI) accounting for concurrent deficits in precipitation and soil moisture is chosen to quantify droughts. Drought vulnerability assessment is carried out combining exposure, adaptive capacity and sensitivity indicators, using a robust multi-criteria decision-making method called the Technique for Order Preference by Similarity to an Ideal Solution (TOPSIS). In the worst-case scenario for drought hazard (RCP2.6-Far future), there is a projected decrease in the area under high or very high drought hazard classes in the country by approximately 7 %. Further, the worst-case scenario for drought vulnerability (RCP6.0-SSP2-Near future) shows a 33 % rise in the areal extent of high or very high drought vulnerability classes. The western Uttar Pradesh, Haryana and western Rajasthan regions are found to be high risk under all scenarios. Bivariate choropleth analysis shows that the projected drought risk is majorly driven by changes in drought vulnerability attributable to societal developments rather than changes in drought hazard resulting from climatic conditions. The present study can aid policy makers, administrators and drought managers in developing decision support systems for efficient drought management.
- Article
(5112 KB) - Full-text XML
-
Supplement
(2118 KB) - BibTeX
- EndNote


Droughts play a major role in water resource planning and management, agronomy, and freshwater availability (Mishra and Singh, 2010, 2011). Droughts may be exacerbated by climate change or societal developments or through a combination of the two. For building drought resilience, it is important to assess the role of these changes on the evolution of drought at regional scales, particularly for rapidly growing heavily agriculture-dependent countries such as India. Though socio-economic development is reported to have a greater impact on the water availability compared to the climate-induced impacts in some regions across the globe, the role of climate change cannot be entirely eliminated (Koutroulis et al., 2019). Representative Concentration Pathways (RCPs; van Vuuren et al., 2011) that are radiative forcing scenarios for different greenhouse gas emission levels are commonly used for climate change impact studies. Shared Socioeconomic Pathways (SSPs; O'Neill et al., 2017), on the other hand, provide different narratives of future societal development. Plausible combinations of different RCPs and SSPs are useful to study the future projections of drought risk (Kim et al., 2020).
According to the Intergovernmental Panel on Climate Change (IPCC) Fifth Assessment Report (AR5) (IPCC, 2014), the risk of an extreme event can be quantified as a product of hazard, vulnerability and exposure. Drought hazard is a function of magnitude and occurrence probability of drought events. On the other hand, drought vulnerability is the degree to which a region is susceptible to drought and is a function of sensitivity, adaptive capacity and exposure components. These components in turn describe the socio-economic, physical and infrastructural factors and are illustrated through drought vulnerability indicators. A comprehensive drought risk assessment involves the proper selection of drought indicators for hazard analysis and the proper selection of drought vulnerability indicators and reliable aggregation technique for vulnerability analysis (Carrão et al., 2016; Naumann et al., 2014; Sahana et al., 2021). By virtue of taking into consideration both drought hazard and vulnerability, a combination of RCP and SSP scenarios offer a comprehensive approach for drought risk projection.
Several studies have carried out risk assessments of drought and water availability across different regions of the world under changing climate and socio-economic conditions. Singh and Kumar (2019) quantified the water availability in the Indian region due to climate and demographic changes. Ahmadalipour et al. (2019) carried out drought risk assessment in the African region for different population growth and climate change scenarios. Chen et al. (2021) evaluated the effect of changing climate, population and GDP on the drought risk for China. Park et al. (2021) presented drought risk projections under changing meteorological conditions and socio-economic scenarios for South Korea. A comprehensive drought risk assessment for Europe was carried out by Koutroulis et al. (2018) under changing climate and socio-economic scenarios by evaluating exposure, sensitivity and adaptive capacity components for the projected period. Along similar lines, Koutroulis et al. (2019) quantified the global water availability under high-end climate change. Water use vulnerability was assessed by Kim et al. (2020) for a river basin in Korea for different climate and socio-economic scenarios.
For the Indian region, projections of drought hazard and/or risk and water availability have been developed in earlier studies using climate scenarios alone (Aadhar and Mishra, 2020, 2021; Gupta et al., 2020; Gupta and Jain, 2018) with the exception of Singh and Kumar (2019), who consider the role of both climate and socio-economic scenarios for obtaining future projections of water availability (Singh and Kumar, 2019). However, Singh and Kumar (2019) represent future socio-economic changes using a simplistic approach that considers changes in population alone. A combination of RCP and SSP scenarios by integrating hazard and vulnerability information is required to assess drought risk in India in the near and far future. Further, most studies that assess drought hazard under climate change scenarios consider either univariate or multivariate approaches based on precipitation deficits and temperature effects (Aadhar and Mishra, 2020, 2021; Gupta et al., 2020; Gupta and Jain, 2018). However, droughts can often manifest as a complex interplay of multiple influencing variables, necessitating a multivariate approach for the characterization of drought hazard (Sahana et al., 2020). For the agrarian country of India, agro-meteorological drought hazard projections should consider deficits in precipitation or soil moisture or both.
The present study aims at comprehensive drought risk projections for India by accomplishing the following objectives: (a) multivariate drought hazard projection using a multivariate standardized drought index (MSDI) that considers concurrent deficits in precipitation and soil moisture for future warming scenarios, (b) drought vulnerability projection considering combinations of RCP and SSP scenarios, using a list of drought vulnerability indicators that represent exposure, sensitivity and adaptive capacity components, (c) drought risk projection integrating hazard and drought vulnerability information, (d) development of bivariate choropleth plots under future scenarios to quantify the individual roles of climate and societal changes in driving drought risk, and (d) identification of regions and zones that are expected to be under the worst drought risk conditions in the near and far future.
2.1 Data
2.1.1 Hydro-climatic variables
The multivariate drought risk assessment focusing on agricultural drought requires a combined analysis of precipitation and soil moisture data. The drought hazard assessment for the baseline period (1980–2015) requires observed hydro-climatic variables. Gridded daily precipitation data (mm; precipitation: https://www.imdpune.gov.in/cmpg/Griddata/Rainfall_25_NetCDF.html, last access: 20 November 2020) at 0.25∘ lat long resolution are obtained from the India Meteorological Department (IMD) (Pai et al., 2014). This dataset has been employed in various studies over the Indian region (Sahana et al., 2021). Gridded monthly root-zone soil moisture data (m3 m−3) over the Indian region at lat long resolution are obtained from Modern-Era Retrospective Analysis for Research and Application (MERRA-Land) (soil moisture: https://disc.gsfc.nasa.gov/datasets/MST1NXMLD_5.2.0/summary?keywords=MERRA-land, last access: 14 April 2018). This dataset has been employed for drought studies across the world (Farahmand and AghaKouchak, 2015; AghaKouchak, 2015) and also for Indian regions (Sahana et al., 2020, 2021). The above two datasets are regridded to a common spatial resolution of 0.5∘ lat long and rescaled to monthly resolution for the historical drought hazard assessment. Re-gridding of the observed datasets to 0.5∘ lat long resolution is carried out using the triangulation-based linear interpolation method (Watson and Philip, 1984). Further, monthly time series of spatial variation in terms of standard deviation of precipitation and soil moisture from their observed and rescaled datasets is shown in Fig. S1 in the Supplement. It is observed that the rescaling of datasets from their parent resolution to 0.5∘ lat long results in no additional variability.
In order to evaluate the projected drought hazard over India, the projected precipitation and soil moisture data at a spatial resolution of 0.5∘ lat long are obtained from the Inter-Sectoral Impact Model Intercomparison Project (ISIMIP) (Warszawski et al., 2014). The historical (1980–2005) and projected (2006–2099) data from available general circulation models (GCMs), namely GFDL-ESM2M, HADGEM2-ES, IPSL-CM5A-LR and MIROC5, and for two RCPs – RCP2.6 and RCP6.0 – are downloaded from the ISIMIP data portal (https://esg.pik-potsdam.de/search/isimip/, last access: 9 September 2020). The daily precipitation data (kg m−2 s−1) are already downscaled and bias-corrected with respect to global-level observed precipitation from EWEMBI (EartH2Observe observations, WFDEI and ERA-Interim data Merged and Bias-corrected for ISIMIP). These data have been previously used to study the soil moisture droughts for Europe (Grillakis, 2019) and terrestrial water storage in mainland China (Jia et al., 2020). The country-wide average annual precipitation for the projected period is higher compared to the baseline periods as shown in Fig. S2. As a part of ISIMIP2b experiments, the LPJmL impact model (Sitch et al., 2003), a global vegetation model that is capable of representing fine-resolution physical processes using carbon, water and energy balance equations (Schaphoff et al., 2018) under a changed climate, is driven by the bias-corrected GCM precipitation to simulate the root-zone soil moisture (kg m−2). For our study, the soil moisture data up to three layers accounting for 1 m depth are used. The country-wide average annual soil moisture for the projected period is slightly lower compared to the baseline periods as shown in Fig. S3. The observed and simulated country-wide average of monthly precipitation and soil moisture for the period 1980–2005 is presented in Fig. S4. The performance of all the ISIMIP models are comparable with that of the observed data except for the soil moisture during monsoon months. The lowered soil moisture estimates from LPJmL model (ISIMIP experiments) simulations compared to the MERRA-Land soil moisture observations for the monsoon months could be due to overestimation of LPJmL's simulated run-off (Zaherpour et al., 2018). Although the simulated soil moisture data underestimate the monsoon months' soil moisture (June, July, August, September) during the historic period (1980–2005) (Fig. S4), we did not perform the bias correction, since we intend to capture the variability in the soil moisture rather than the magnitudes for drought index calculation. The projected daily precipitation is cumulated over each month to get the monthly precipitation values and its units converted from kilograms per square metre per second (kg m−2 s−1) to millimetres (mm). The projected monthly soil moisture (average monthly soil moisture) from the model is converted from kilograms per square metre (kg m−2) to cubic metres per cubic metre (m3 m−3). The ensemble mean of monthly precipitation and soil moisture from different GCMs is computed. Further, these ensemble mean monthly precipitation and soil moisture time series are used for drought hazard assessment. Although climate variables from CMIP6 are available, drought responses by CMIP5 models are similar to those of CMIP6 (Cook et al., 2020). Hence we proceeded with the CMIP5 data for drought hazard assessment.
2.1.2 Drought vulnerability indicators
The country-wide drought vulnerability indicators adopted for drought vulnerability assessment are listed in Table 1, along with their sources, spatial and temporal distribution, units, method of data generation, relevance, and correlation to drought vulnerability for both the observed (around the year 2010) and projected datasets (2005–2100). The presented drought vulnerability indicators comprise sensitivity, exposure and adaptive capacity indicators (Table 1). Drought vulnerability indicators such as groundwater availability, irrigation index and waterbody fraction for the projected period are not directly available. Hence, these indicators are proxied by representative indicators (Table 1) through multiple linear regression (MLR). An extensive vulnerability assessment encompasses other social and economic vulnerability indicators such as those used by Meza et al. (2020). However, for a densely populated and rapidly developing nation such as India, the acquisition of reliable datasets on these indicators is often challenging. Most importantly, the unavailability of projections of these indicators over the Indian region limits their use in this study, since our primary goal is to compare baseline drought risk with that under future projected climate change. Further, the weightages for the categorical vulnerability indicators for drought vulnerability assessment are adopted from Ekrami et al. (2016), Sahana et al. (2021), and Thomas et al. (2016) and are given in Table S1 in the Supplement. Finally, drought vulnerability indicators are extracted for the RCP2.6-SSP2 and RCP6.0-SSP2 scenarios for the periods 2060 and 2100 so as to represent different climate and socio-economic scenarios for the near-future and far-future periods respectively. In general, socio-economic development is a slow process that takes time to be reflected in terms of significant changes in the socio-economic indicators (Dellink et al., 2017). Further, the majority of the drought vulnerability and/or risk studies across the globe have adopted a static vulnerability assessment that represents drought vulnerability as a snapshot in time (Hagenlocher et al., 2019). Therefore, we used the static vulnerability indicators for the years 2010, 2060 and 2099 to quantify drought vulnerability for the baseline, far-future and near-future periods respectively.
Table 1Drought vulnerability indicators used for drought vulnerability assessment. The sources for indicators in the baseline period and the projected period along with their relevance and correlation with drought vulnerability are presented. Representative indicators to arrive at the drought vulnerability indicators for projected period are also listed.
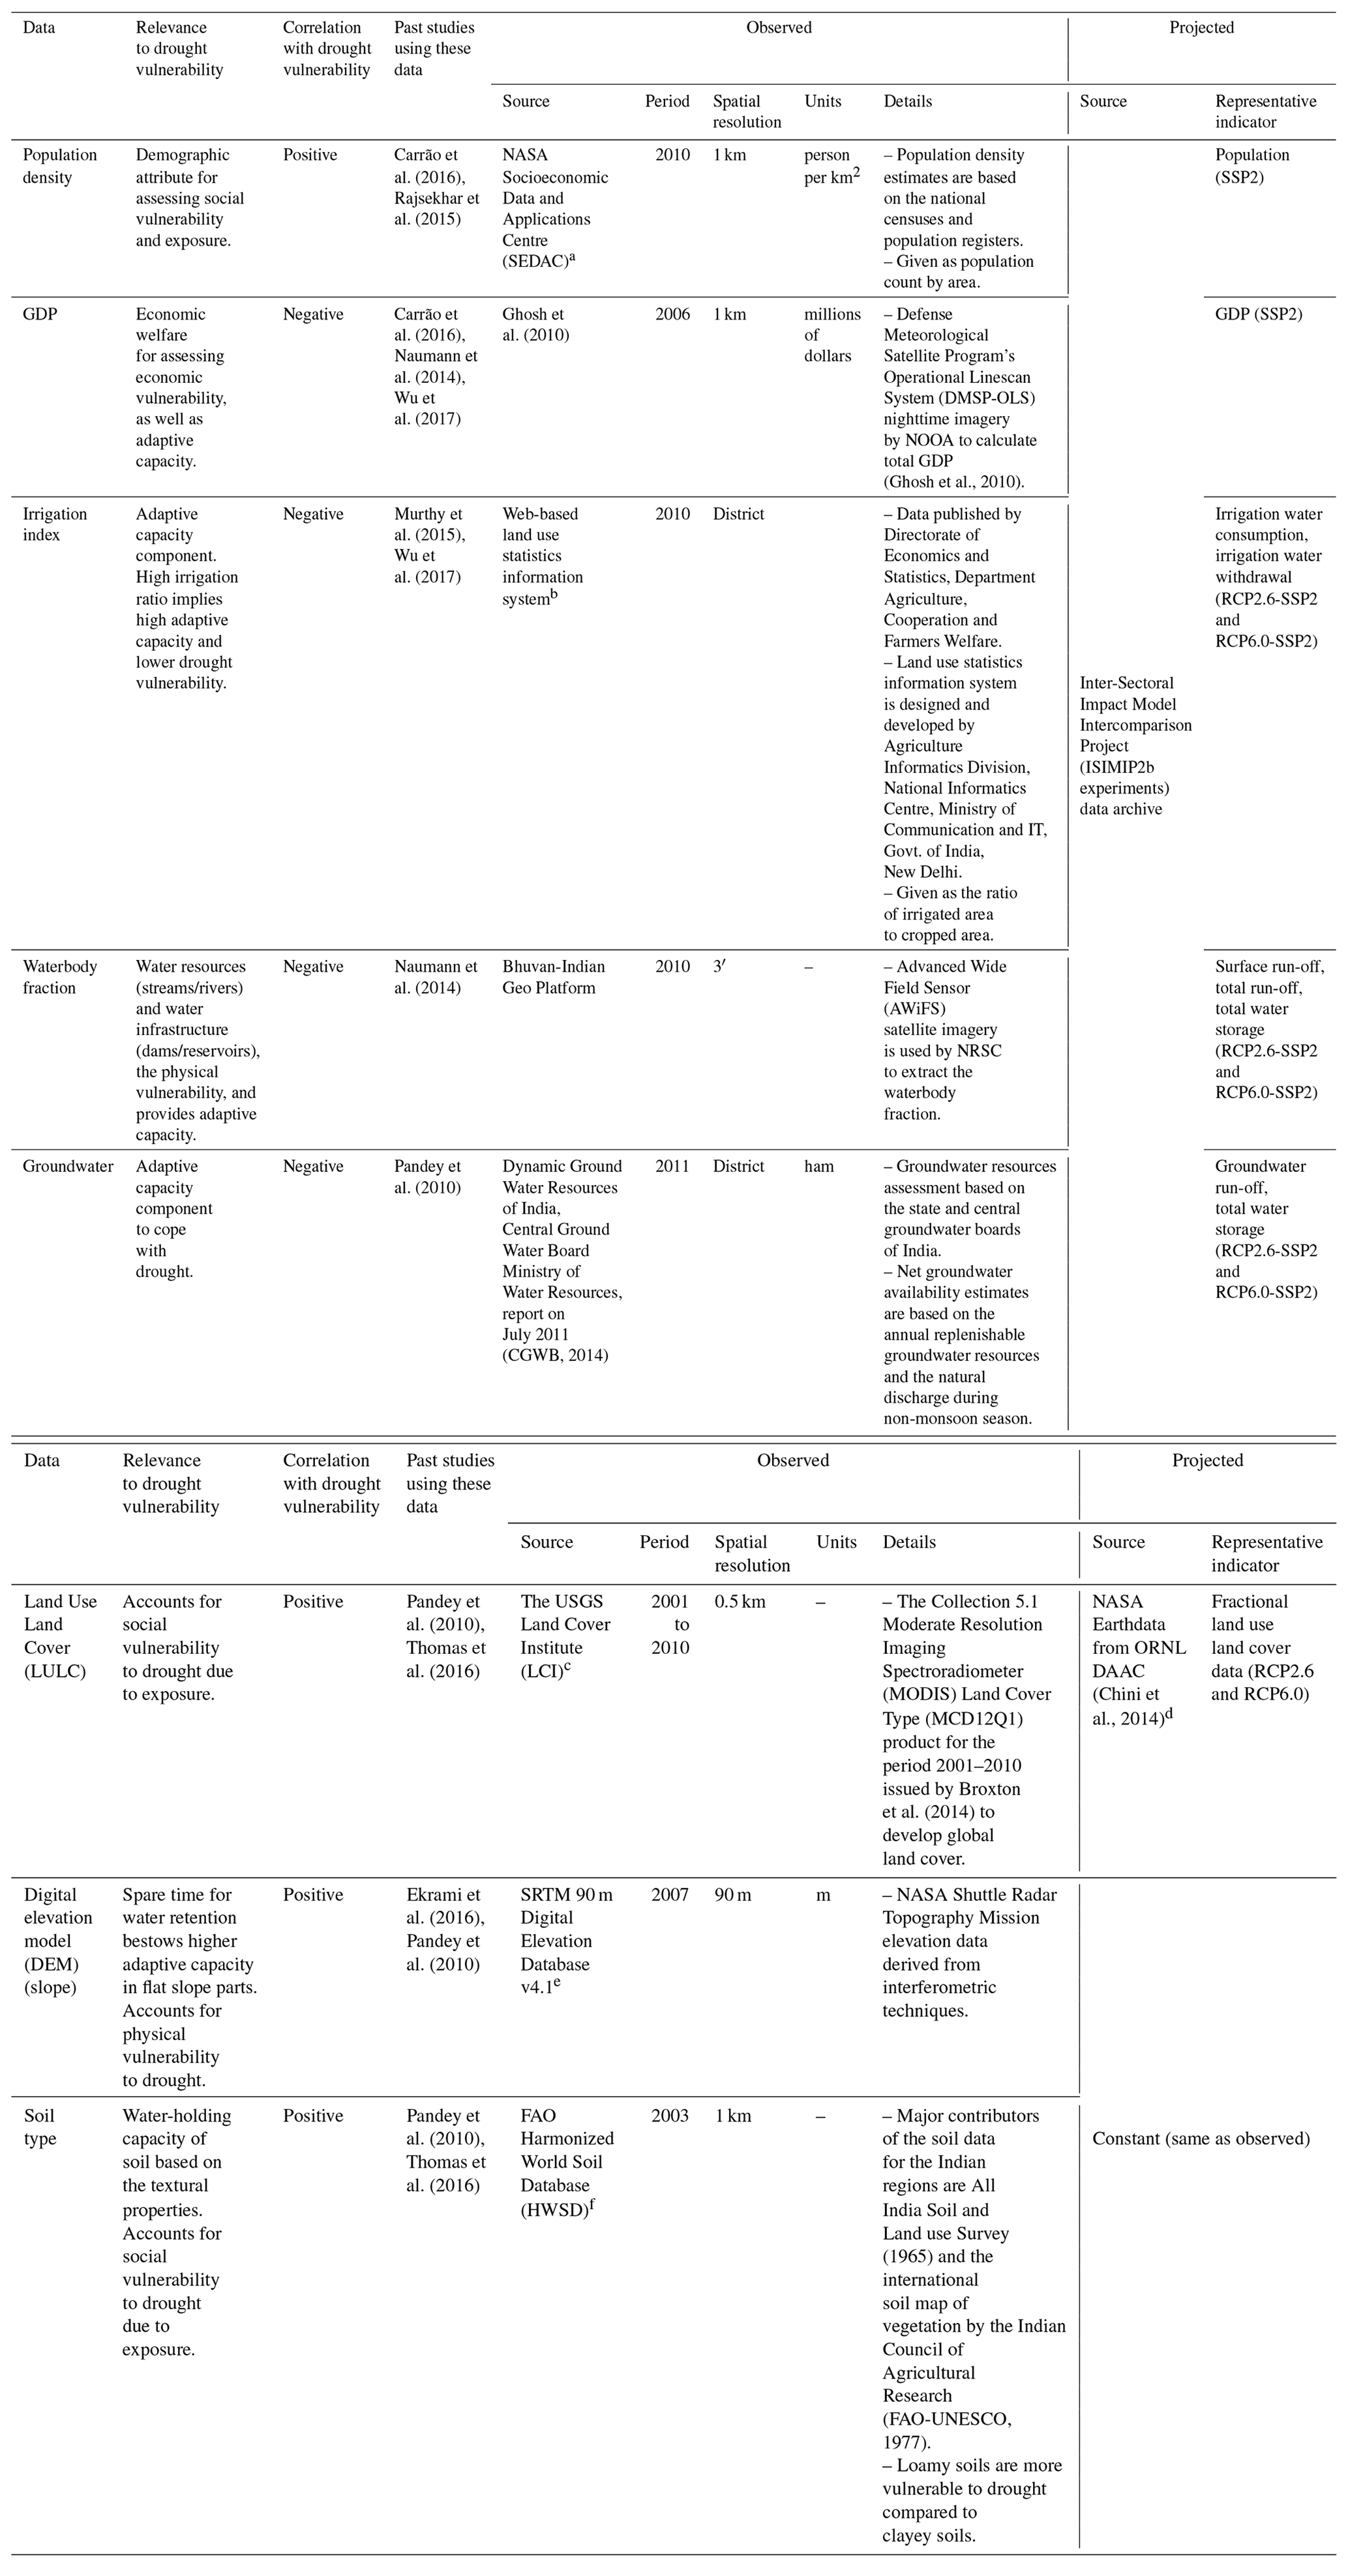
a http://sedac.ciesin.columbia.edu/data/set/gpw-v4-population-density (last access: 20 November 2020)
b https://aps.dac.gov.in/LUS/Index.htm (last access: 20 November 2020)
c https://lpdaac.usgs.gov/products/mcd12q1v006/ (last access: 28 January 2023)
d https://doi.org/10.3334/ORNLDAAC/1248
e http://www.cgiar-csi.org/data/srtm-90m-digital-elevation-database-v4-1#download (last access: 20 November 2020)
f http://www.fao.org/soils-portal/soil-survey/soil-maps-and-databases/harmonized-world-soil-database-v12/en/ (last access: 20 November 2020)
Drought vulnerability indicators such as population density and GDP for the year 2010 from the SSP2 pathway are comparable with their respective observed dataset, with small/negligible difference between the observed and SSP-simulated datasets (Fig. S5). Further, drought vulnerability indicators such as groundwater availability, irrigation index and waterbody fraction for the projected period are not directly available. Hence, these indicators are proxied by their representative indicators (Table 1) using multiple linear regression (MLR). Consequently, irrigation ratio, groundwater availability and waterbody fraction for the projected period are derived based on relationships between them and the representative variables in the baseline period, and therefore consistency is ensured. The land use harmonization (LUH) (Chini et al., 2014) dataset provides the fractional land use classes for the time period 1500–2100. The historical maps of crop and pasture data from HYDE 3.1 (Hurtt et al., 2011) and estimates of historical national wood harvest and of shifting cultivation are used as input for 1500–2005. Further, the projections of LULC for 2005–2100 are based on the integrated assessment model (IAM) implementations of the RCPs. Each IAM for different RCPs is used as input to the earth system models (ESMs) for future carbon and climate projections. Therefore, LULC scenarios are based on RCPs. LUH is a credible dataset for LULC projection and has been previously used for drought risk projection in the South Asian region (Chou et al., 2019). Further, LULC projections can also be derived based on the land use models, using past LULC data and socio-economic factors to drive the land use change. However, the development of such models at country scale is beyond the scope of the present study.
2.2 Methods
The methodology adopted to study the evolution of drought risk is given in Fig. 1.
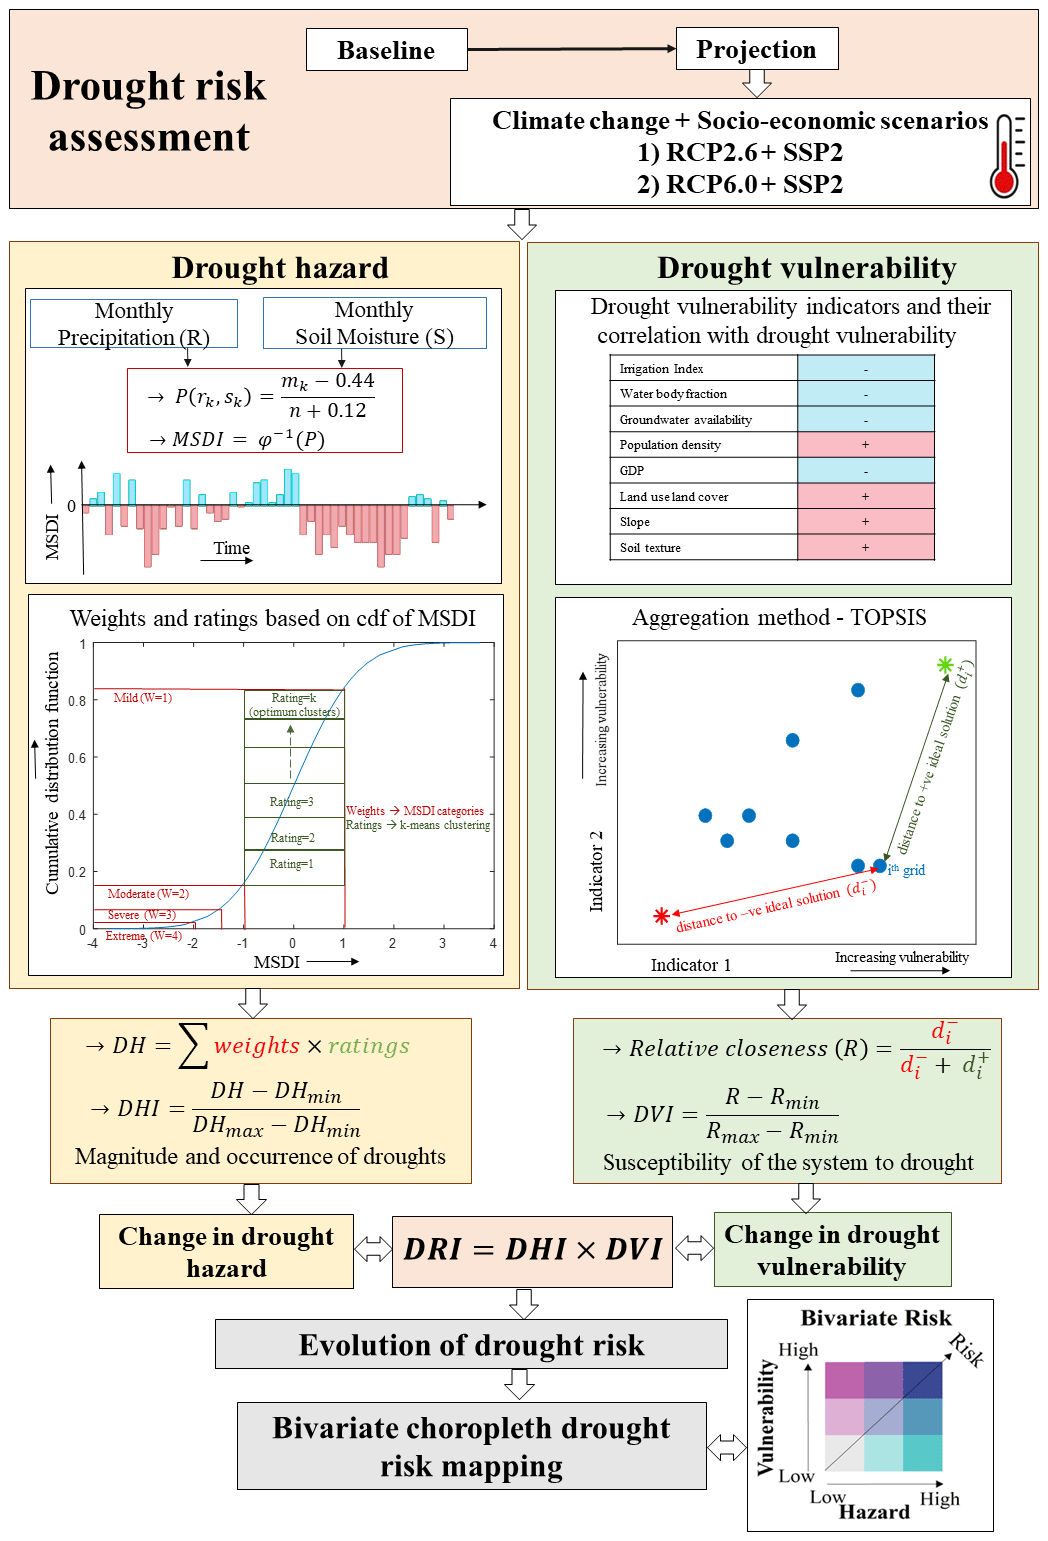
Figure 1Framework to assess drought risk evolution. Monthly rainfall and monthly soil moisture are used to compute the multivariate standardized drought index (MSDI). Weights and ratings system of MSDI is adopted to further compute drought hazard index (DHI). Multi-criteria decision-making technique – TOPSIS – is used to calculate drought vulnerability index (DVI) considering eight drought vulnerability indicators. The product of DHI and DVI is the drought risk index (DRI). Drought risk assessment is carried out for the baseline (1980–2015), near-future (2021–2050) and far-future (2061–2100) periods for various climate and socio-economic scenarios.
2.2.1 Drought hazard assessment
Drought hazard forms an important component of drought risk assessment. Here, we assess the country-wide drought hazard based on the deficits in precipitation and soil moisture. Therefore, the multivariate standardized drought index (MSDI) of the non-parametric form is computed using the bivariate case of the Gringorten plotting position formula (Gringorten, 1963). MSDI is equally capable of capturing deficits individually in precipitation or soil moisture or their joint deficit, considering dependence between these two variables. This is a unique advantage of MSDI (Hao and AghaKouchak, 2014) over other univariate indices. Further, MSDI is capable of representing the onset, propagation and termination of drought. In Fig. S6, considering −0.8 as the threshold for drought trigger, it can be seen that whenever either the standardized precipitation index (SPI) or the standardized streamflow index (SSI) falls below this threshold, MSDI covers the critical trajectory and offers a conservative characterization of drought, thereby capturing attenuation and lag effects. The steps involved in the calculation of MSDI is presented below.
-
The joint probability distribution of the 1-month timescale precipitation (R) and soil moisture (S) is given by
where r and s represent the value of the random variables R and S respectively, and p represents the joint probability of the precipitation and soil moisture.
-
For the sample size n, the count of occurrence of the pair (ri,si) for ri≤rk and si≤sk is denoted as mk. rk and sk here denote the kth observation for precipitation and soil moisture respectively. The number of joint occurrences (mk) of precipitation and soil moisture pair below rk and sk from the whole set of observations is used to calculate empirical joint probability for the kth observation based on the bivariate Gringorten plotting position (Gringorten, 1963) as
-
The above empirical joint probability is then standardized to obtain the multivariate index MSDI.
where φ is the standard normal distribution function. Since the empirical distributions use ranks of data instead of actual values, the sample size should be sufficiently large.
The method of drought hazard assessment followed in the present study is based on Kim et al. (2015). Hazard is measured as the product of magnitude and the associated frequency of occurrence of an event. The MSDI time series at each region is categorized into four groups similar to Mckee et al. (1993). These categories are assigned weights according to the magnitude of MSDI value. Higher weights will be assigned to the worst (high negative) MSDI values, and vice versa. Further, each weight category is divided into different clusters based on the frequency of occurrence of MSDI values. The total number of clusters for ratings in each MSDI category is determined using the prominent k-means data clustering algorithm. Higher ratings will be assigned to the cluster with high-frequency values, and vice versa. The weightage and rating scheme are depicted graphically in Fig. 1. In the k-means clustering technique, the distance between the data points is computed using the squared Euclidean distance metric. To avoid the convergence to local minima, the k-means algorithm is run with 100 random initial seeds with 10 000 iterations. The Calinski–Harabasz index (CHI) (Caliński and Harabasz, 1974) is used to determine the optimum number of clusters and is given by
where n= number of data points, K= number of clusters, BGSS is the amount of scatter between groups, G{k}= centroid of the kth cluster, G= centroid of all the observations, WGSS is within the group scatter, and WGSS, where are the observations. The k-means clustering algorithm is driven for 1 to n clusters. The number of clusters that gives highest value of CHI is the optimum number of clusters. This optimum number of clusters is used for assigning ratings. The categorized weightages and computed ratings are used to calculate the drought hazard (DH) for every region as below.
where t is the length of the MSDI time series. Although the weightages and ratings are intrinsically linked, the above scheme assures drought hazard quantification based on magnitudes and frequencies. The DH values from Eq. (5) are standardized as shown below to obtain the drought hazard index (DHI) that varies between 0 and 1.
The weighing and rating scheme to calculate DHI for a randomly chosen grid are given in Table S2.
2.2.2 Drought vulnerability assessment
Drought vulnerability forms another important component of drought risk assessment. Several aggregation techniques have been employed in past studies to combine the drought vulnerability indicators to assess drought vulnerability. However, we use the robust method TOPSIS (Technique for Order Preference by Similarity to an Ideal Solution; Hwang and Yoon, 1981) owing to its fewer rank reversal probabilities (Sahana et al., 2021). The steps involved in drought vulnerability assessment are outlined below.
-
The standardization of numerical drought vulnerability indicators (irrigation index, waterbody fraction, groundwater availability, population density and GDP) is carried out such that their values vary between 0 and 1.
Suitable weights are assigned to categorical drought vulnerability indicators (LULC, slope and soil texture), following Thomas et al. (2016) and Sahana et al. (2021) (Table S1). This gives the decision matrix nij, where represents the number of regions and represents the number of drought vulnerability indicators.
-
The above decision matrix nij is associated with the indicator weights wj obtained from the analytic hierarchy process (AHP) method (Sahana et al., 2021). This gives the weighted decision matrix vij:
-
Positive (A+) and negative (A−) ideal solutions are calculated for each of the indicators.
where I and J are associated with the benefit and cost criteria respectively. Here population density, LULC, slope and soil texture that bear a positive correlation with the drought vulnerability are considered as benefit criteria. On the other hand, irrigation index, groundwater availability, waterbody fraction and GDP that bear a negative correlation with drought vulnerability are considered as cost criteria.
-
Positive () and negative () separation measures for each region i are computed based on A+ and A− (also shown in Fig. 1).
-
The relative closeness (Ri) of each region to the positive ideal solution is calculated as
Ri signifies vulnerability of region i to drought. R is further standardized to vary between 0 and 1 to obtain the drought vulnerability index (DVI).
2.2.3 Drought risk assessment
The hazard and vulnerability information computed in the form of DHI and DVI, respectively, are combined to evaluate the drought risk. Accordingly, the drought hazard capturing the droughts in baseline (1980–2015), near-future (2021–2060) and far-future (2061–2099) periods is combined with drought vulnerability at 2010, 2060 and 2099 respectively. The definition of risk as provided by the IPCC (AR5) (IPCC, 2014) is adopted. Though the AR5 delineates exposure as a separate component of the risk, we have included exposure to be an integral part of the vulnerability following Vittal et al. (2020), since such a definition is unlikely to affect the overall conclusions of risk assessment.
Drought risk values computed using Eq. (15) are further standardized spatially to obtain the drought risk index (DRI). Standardization of drought risk at each grid is carried out using the equation
Standardization is performed such that the values are distributed between 0 and 1 so as to classify different risk categories. Further, circumstances such as highly vulnerable population being exposed to mild droughts or no droughts at all may arrive and are handled well due to the integrated assessment of drought risk. For example, if the hazard is low in a region, it is likely to be classified as “low to moderate” in terms of drought risk despite having high vulnerability.
Apart from representing the risk as a product of hazard and vulnerability, it can also be represented using a bivariate choropleth (Mohanty et al., 2020). The colour scale of these bivariate choropleths is characterized by all possible combinations of DHI and DVI classes. Such maps clearly demarcate the hazard-driven and vulnerability-driven risk.
3.1 Drought hazard
3.1.1 Projection of hydro-climatic variables
The multi-model ensemble precipitation and soil moisture data from the four GCMs are used for drought hazard assessment. The country-wide accumulated data (summed over all grids) of these hydro-climatic variables are shown in Fig. 2. The projected precipitation, as well as soil moisture, for the RCP6.0 scenario is high compared to the RCP2.6 scenario. Further, it is noted that the variability in both the variables increases with time. However, the variability in the hydro-climatic variables in the baseline period is high compared to the projected period.
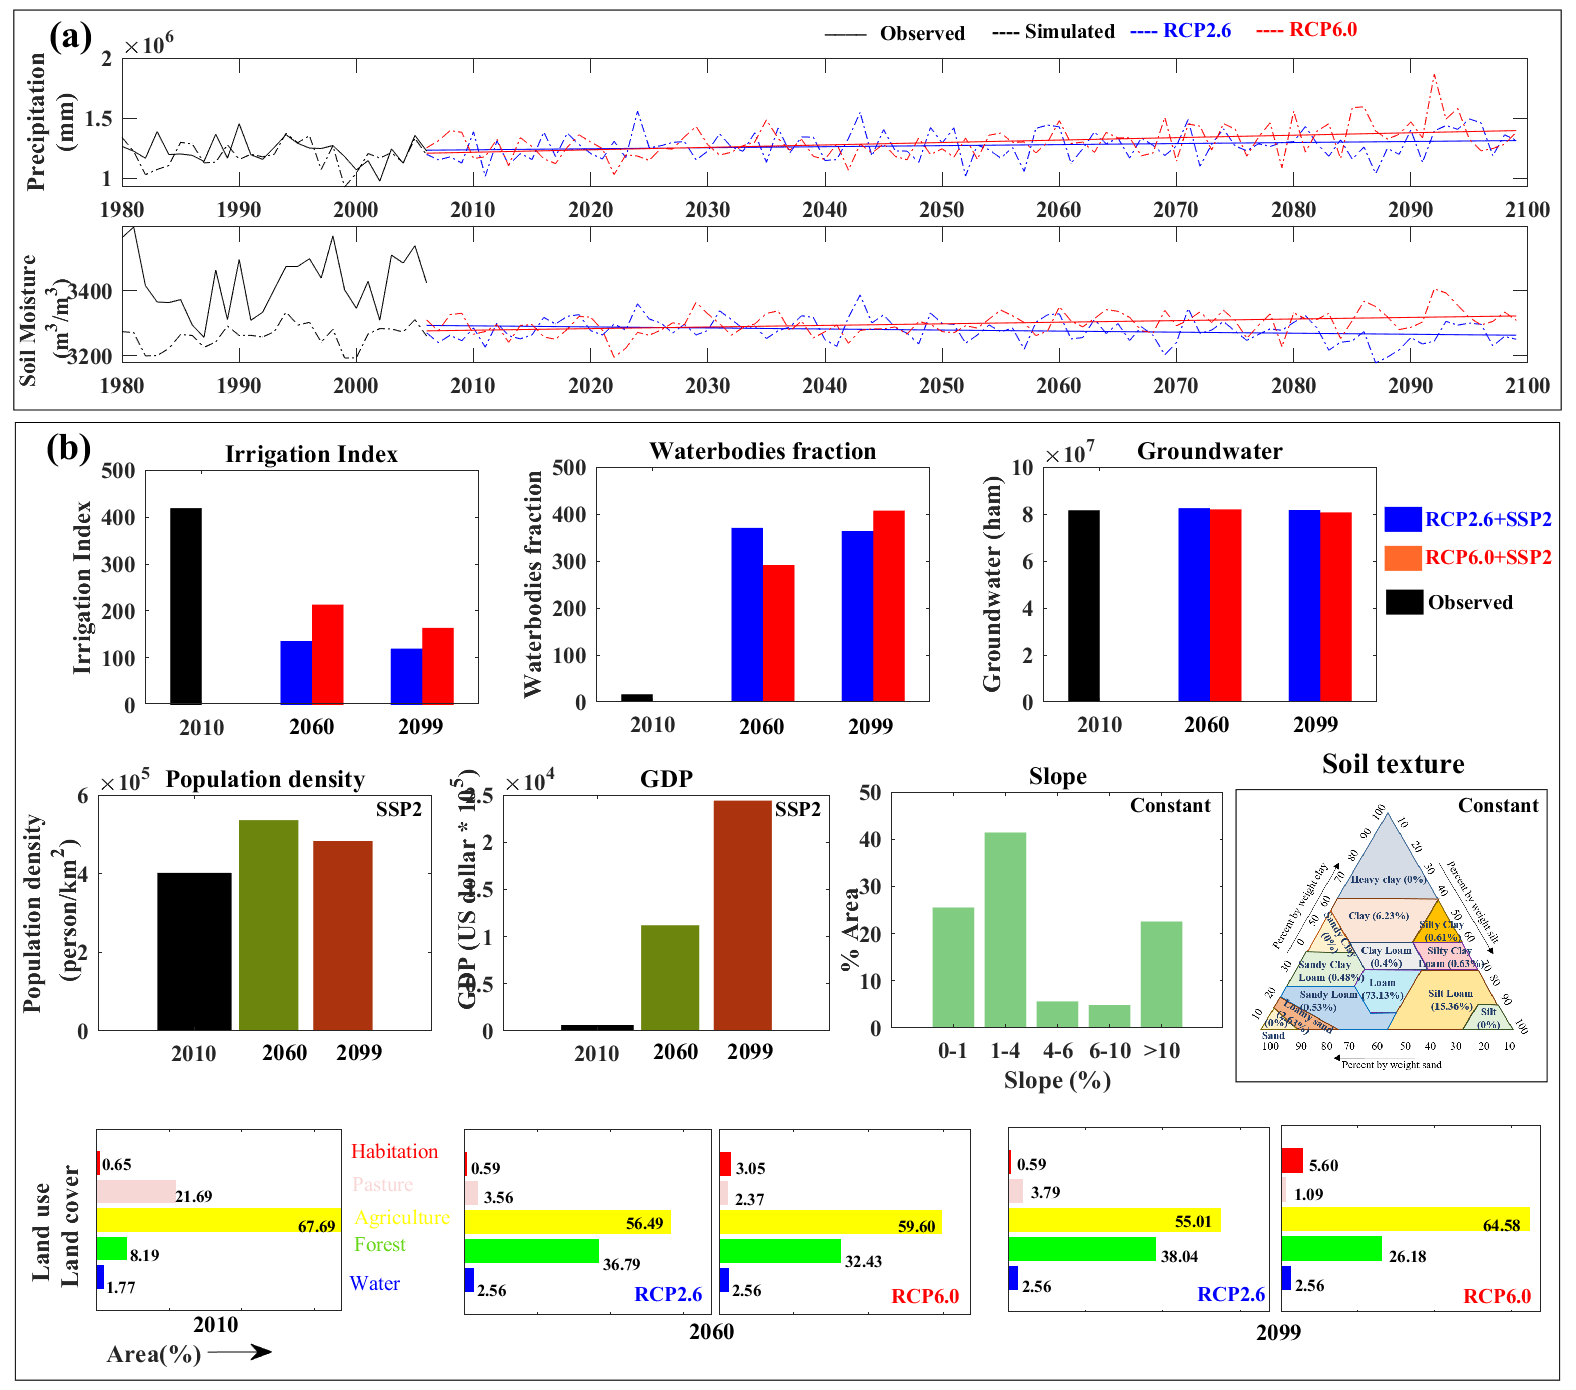
Figure 2Datasets used for drought risk assessment. (a) Projected hydro-climatic variables such as monthly precipitation and monthly soil moisture are used for drought hazard assessment. (b) Projected drought vulnerability indicators such as irrigation index, waterbody fraction, groundwater availability, population, GDP and land use land cover, along with static drought vulnerability indicators such as slope and soil texture, are used for drought vulnerability assessment. Datasets for projected period are divided into near future (2021–2060) and far future (2061–2100) to check the evolution of drought risk.
3.1.2 Projection of drought hazard
The multi-model ensemble drought hazard for different RCP scenarios and time slices along with the baseline period are shown in Fig. 3. The indices representing drought hazard are classified into five categories based on an equal classification scheme: 0–0.2 (very low), 0.2–0.4 (low), 0.4–0.6 (medium), 0.6–0.8 (high) and 0.8–1 (very high). The MSDI-based drought hazard maps developed for the baseline period match well with hazard maps developed from other multivariate indices such as SPEI (Gupta et al., 2020), compared to those developed from the univariate SPI (Vittal et al., 2020). It is observed that the projected hazard over many regions is less severe compared to the baseline period. However, certain parts of north-western India and eastern coastal regions are in the high drought hazard class. The hazard transition from the baseline to different scenarios is presented in Fig. 4. The baseline and projected scenarios of drought hazard are represented using five different classes – very low, low, medium, high and very high. Every region (grid) of the country may transit from one class in the baseline scenario to another class in the projected scenario or remain in the same class for both baseline and projected scenarios. In the transition matrix we compute the percent area of the country that transitioned from one hazard class to other to quantify the effect of climate change. The upper triangle in the figure represents the percent area transition from lower to higher hazard classes, the lower triangle represents the percent area transition from higher to lower hazard classes, and the diagonal elements represent the percent area with no transition.
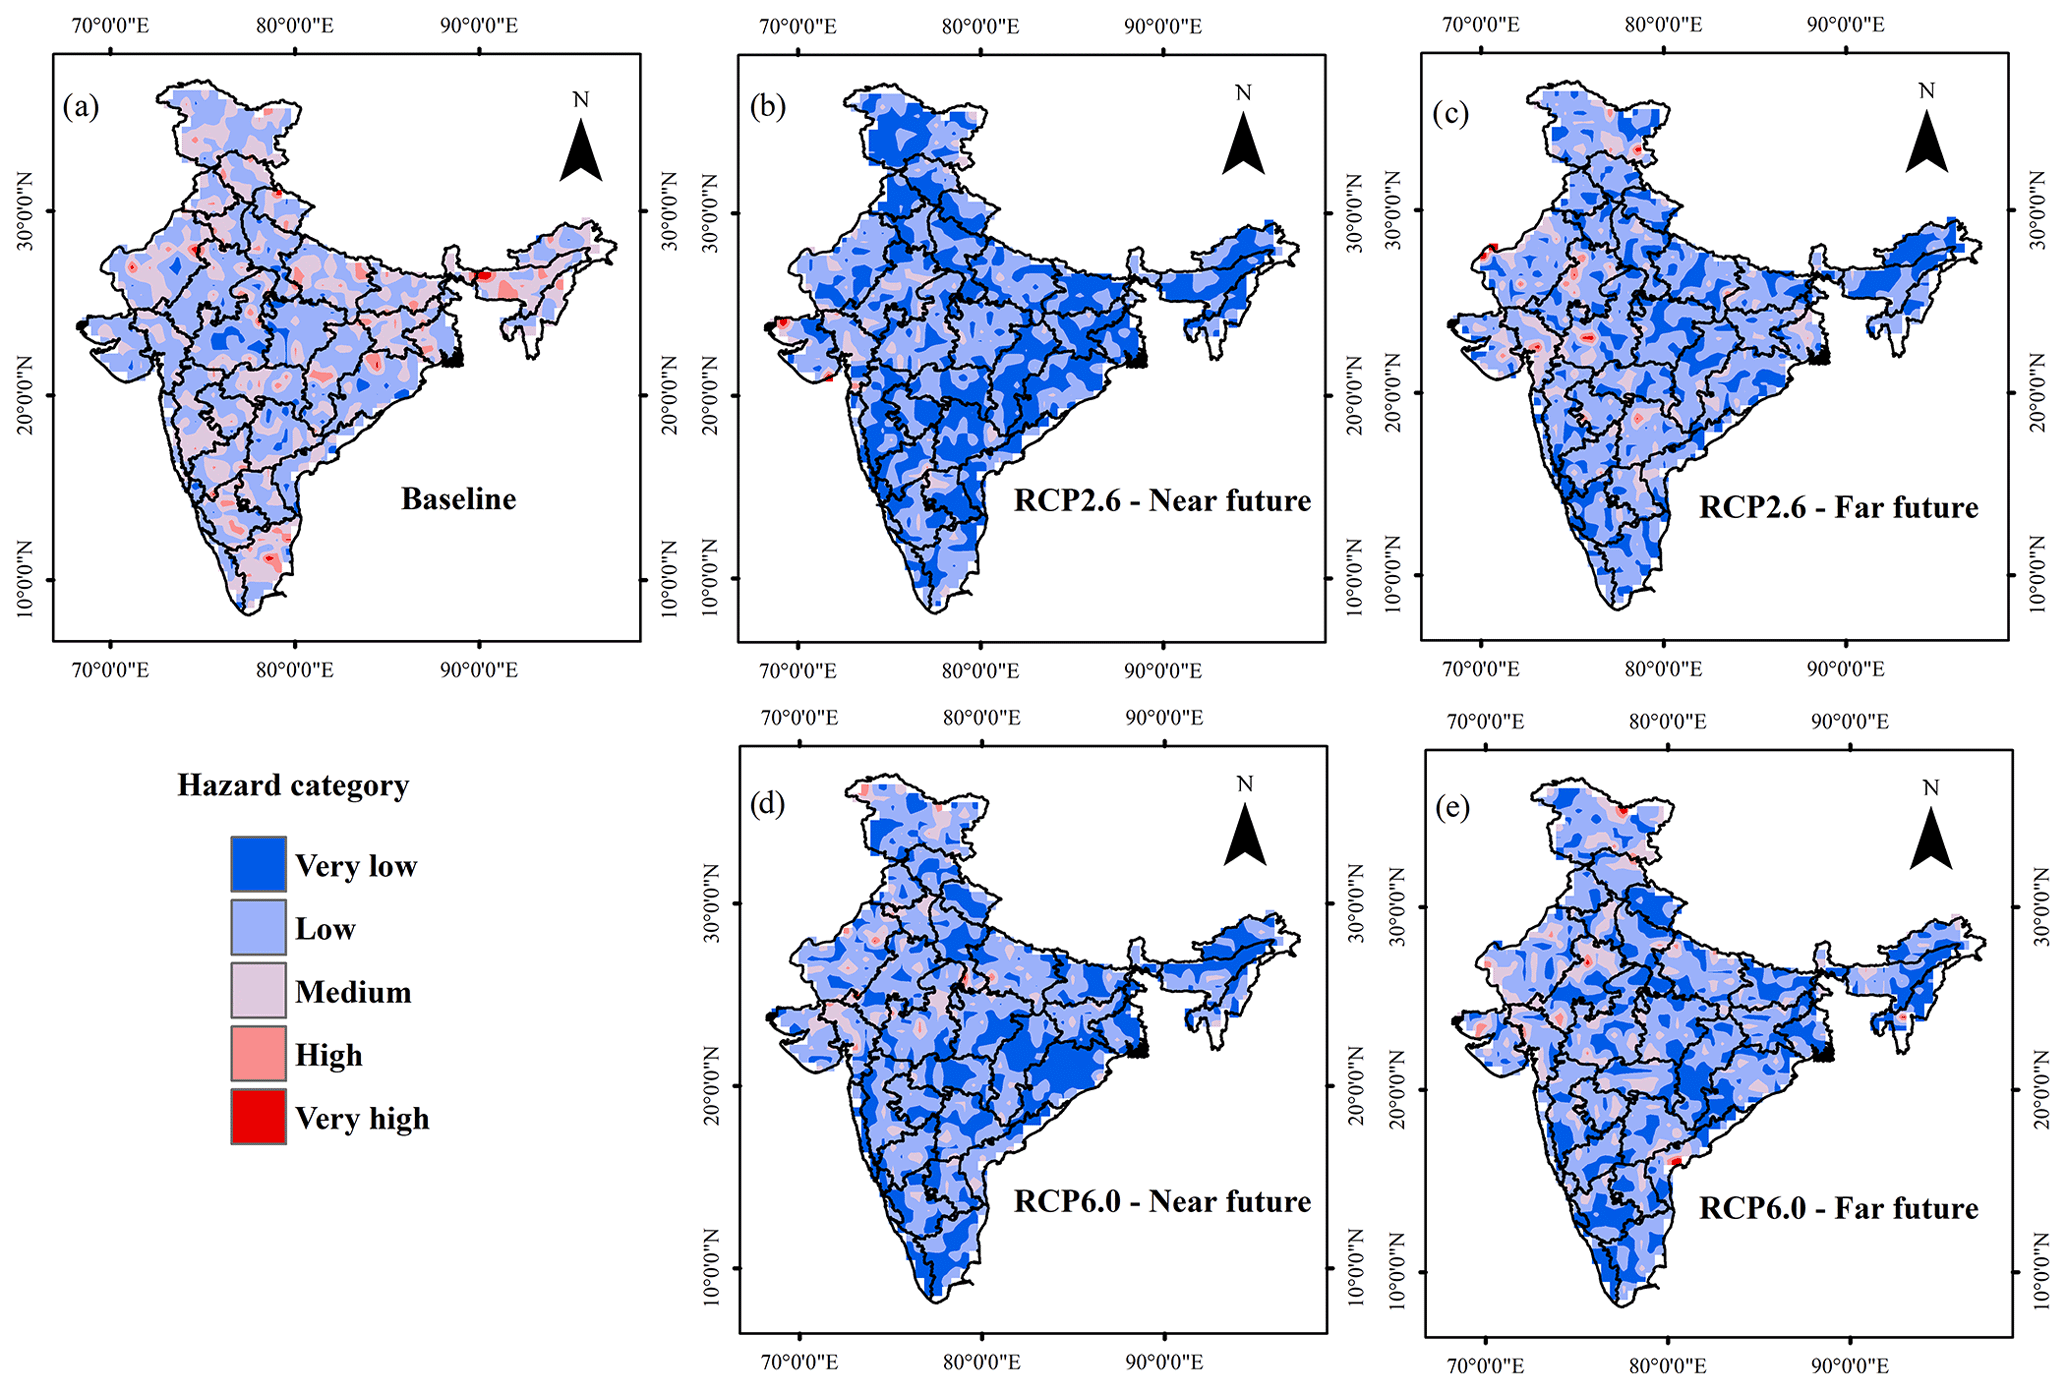
Figure 3Multi-model ensemble drought hazard maps for the scenarios (a) baseline, (b) RCP2.6-Near future, (c) RCP2.6-Far future, (d) RCP6.0-Near future and (e) RCP6.0-Far future.
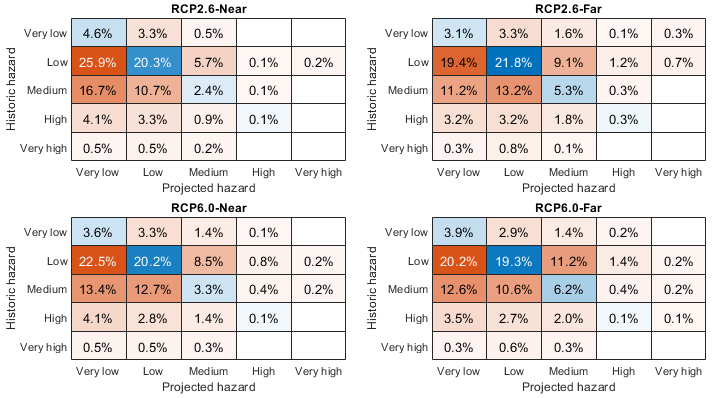
Figure 4Transition of drought hazard from baseline period to projected period. The value in each cell represents the change in percent area of the country from one hazard class to another. The red colour shows transition, and blue represents no transition.
In general, a transition from higher hazard classes to lower hazard classes is observed under the projected scenarios, implying that more regions in the country are expected to come under the low hazard category in the future. From Figs. 2a, S2 and S3, we see that precipitation and soil moisture for the projected period show an increasing trend. Further, it is to be noted that the hazard assessment using MSDI is based on the long-term mean and variability in these drought indicators under a probabilistic analysis framework and not necessarily the magnitudes of precipitation and soil moisture. Here we see that the projections of these indicators exhibit lower variability compared to the baseline period (Fig. 2a). Therefore, it is observed that many regions undergo the transition from high hazard to low hazard. The future drought hazard assessment using the projected hydro-climatic variables revealed that more than 35 % area of the country is expected to be in the low hazard class, compared to 8 % in the baseline period (refer Figs. 4 and 10). It is also interesting that the area in the high hazard class is greater in the far future compared to the near future irrespective of the RCP scenarios. This is ascribed to the higher variability in the hydro-climatic variables in the far-future compared to the near-future period that resulted in a higher magnitude of drought events. Of all the future drought hazard scenarios considered, the RCP2.6-Far scenario revealed the largest area (2.8 %) in the high and very high hazard classes. This accounts for a 7 % reduction in high and very high hazard classes compared to the baseline scenario. It is observed that north-western India and parts of Jammu, Kashmir, Andhra Pradesh and Marathwada come in the high hazard classes.
It is interesting to note that the probabilistic Budyko framework-based projected annual per capita water availability analysis (PCWA) for the Indian region by Singh and Kumar (2019) shows a decrease in PCWA in a 2.0 ∘C warmer world compared to a 1.5 ∘C warmer world under CMIP5-based mitigation, medium stabilization and high-end (RCP8.5) climate change scenarios, indicating high hazard in the far future. Similarly, a higher drought hazard is observed in the far future compared to the near future by Gupta and Jain (2018) and Gupta et al. (2020), who performed SPEI-based drought hazard analysis using CMIP5 GCMs under high-end climate change. Further, frequency-based soil moisture drought analysis by Aadhar and Mishra (2020, 2021) and SPEI-based drought frequency analysis by Zhai et al. (2020) show an increased drought frequency in the future period over South Asia compared to the baseline period. This shows that the far-future period is more prone to drought hazard than the near-future period. On the other hand, a few studies such as Koutroulis et al. (2019) and Cook et al. (2020), who used CMIP5 and CMIP6 simulations respectively, show that drought exposure and frequency over the Indian region decrease with time. Such contradicting observations are possibly due to the selection of low-skill GCMs (Aadhar and Mishra, 2020) in Koutroulis et al. (2019) and Cook et al. (2020). It is to be noted that the four GCMs considered in the present study for precipitation and soil moisture simulations are bias-corrected for precipitation and cover more uncertainty in temperature and precipitation changes compared to other GCM subsets (McSweeney et al., 2015). However, the inclusion of other skilled GCMs can account for the wide range of uncertainty in the drought hazard assessment.
3.2 Drought vulnerability
3.2.1 Projection of drought vulnerability indicators
The varying drought vulnerability indicators for the drought vulnerability assessment are shown in Fig. 2. It is observed that GDP increases with time continuously, whereas population reaches its peak during the end of the near future (2060) and decreases gradually by the end of the century. The representative indicators obtained through human influences, varying land use and water abstractions according to the RCP2.6-SSP2 and RCP6.0-SSP2 conditions are used to derive the drought vulnerability indicators such as irrigation index, waterbody fraction and groundwater availability for the projected period. It is observed that the irrigation index decreases with time for RCP2.6-SSP2 and RCP6.0-SSP2 projections. The waterbody fraction remains constant for the RCP2.6-SSP2 projection and increases with time for the RCP6.0-SSP2 projection. Further, groundwater availability remains constant for RCP2.6-SSP2 and RCP6.0-SSP2 projections. The biggest difference in land use land cover changes is observed in the RCP6.0 condition compared to RCP2.6. It is also seen that percent area under habitation increases continuously with time in the case of RCP6.0. Slope and soil texture data are assumed to be constant (Fig. S7).
3.2.2 Projection of drought vulnerability
The multi-model ensemble drought vulnerability projections for different scenarios are presented in Fig. 5. It is observed that many regions of the country are expected to be more vulnerable to drought compared to the baseline period. In general, parts of north-western and eastern India and the southern coast are observed to be in the high vulnerability class in the future scenarios. The transition of drought vulnerability from one class of vulnerability from baseline to another class of vulnerability in the future is given in Fig. 6. It can be observed that the drought vulnerability under RCP6.0-SSP2 scenario is worst compared to the RCP2.6-SSP2 scenario, since a high transition from lower vulnerability classes to higher vulnerability classes is observed in the former case. As much as 42.9 % area transits from lower vulnerability classes to higher vulnerability classes under RCP6.0-SSP2-Near future. Also, a 33 % increase in the area in the high and very high vulnerability classes is observed in this worst-case scenario, with north-western India, the western coast, and parts of Chhattisgarh, Odisha and Jharkhand in the very high vulnerability class.

Figure 5Multi-model ensemble drought vulnerability maps for the scenarios (a) baseline, (b) RCP2.6-SSP2-Near future, (c) RCP2.6-SSP2-Far future, (d) RCP6.0-SSP2-Near future and (e) RCP6.0-SSP2-Far future.
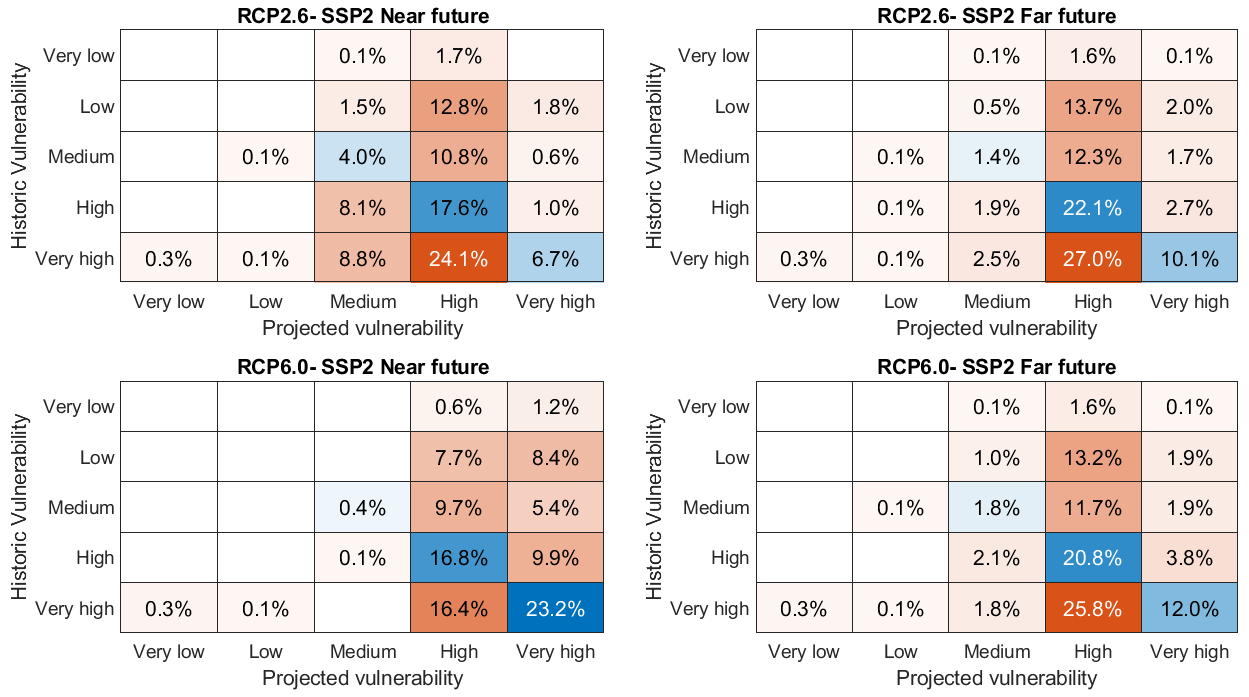
Figure 6Transition of drought vulnerability from baseline period to projected period. The value in each cell represents the change in percent area of the country from one vulnerability class to another. The red colour shows transition, and blue represents no transition.
In the global freshwater vulnerability analysis conducted by Koutroulis et al. (2019), although they show that the sensitivity component of the overall freshwater vulnerability is increasing with time, an increasing adaptive capacity and decreasing exposure are reducing India's vulnerability to drought. However, our study shows an increasing vulnerability to drought, considering sensitivity, adaptive capacity and exposure factors. Such contradicting observations in drought vulnerability are possibly due to the choice of low-skill GCMs in Koutroulis et al. (2019). Further, the socio-economic challenges for adaptation and mitigation in different SSP narratives are led by different development pathways (O'Neill et al., 2017). Therefore, the adoption of other SSPs in drought vulnerability assessments may unveil other plausible drought vulnerability projections.
Next, we aggregate hazard and vulnerability information on meteorological sub-division scale (Meteorological sub-divisions are the meteorologically homogenous regions identified by India Meteorological Department; Kelkar and Sreejith, 2020) to identify the sub-divisions under critical drought condition due to the interplay of hazard and vulnerability. Scatter of drought hazard and drought vulnerability for 30 sub-divisions is shown in Fig. S8. It is seen that the western Rajasthan, Haryana and western Uttar Pradesh sub-divisions are expected to have high drought risk compared to the other sub-divisions in all the scenarios. Further, the number of sub-divisions falling under critical drought risk (DHI >0.25, DVI >0.75) is high in the case of the RCP6.0-SSP2 scenario, with 22 meteorological sub-divisions having high vulnerability (DVI >0.75), particularly in the RCP6.0-SSP2-Near future scenario.
3.3 Drought risk
3.3.1 Projection of drought risk
The multi-model ensemble drought hazard and vulnerability projections under different scenarios are combined according to Eq. (15) to obtain drought risk projections (Fig. 7). It is to be noted that the validation of the drought risk map for the baseline period (1980–2015) has been carried out by Sahana et al. (2021), based on the disaster data in terms of number of people affected. It is noted that parts of Rajasthan, Madhya Pradesh, Maharashtra, Orissa and Tamil Nadu, Kerala, Chhattisgarh, Haryana, Himachal Pradesh, Chandigarh, Assam, and Nagaland that are in the moderate to severe drought risk category have experienced moderate to worse drought disaster. Further, the drought risk estimates for the baseline period from the present study compares well with regional-scale drought risk studies in India such as those for Andhra Pradesh (Murthy et al., 2015), Bearma basin (Thomas et al., 2016) and Maharashtra (Swami and Parthasarathy, 2021). From the drought risk projections, it is noted that parts of north-western India are expected to be more prone to drought risk compared to the baseline period. On the other hand, central Indian regions are expected to switch to lower risk classes. The transition of drought risk from one class of vulnerability from baseline to another class of risk in the future is given in Fig. 8. The highest transition (30 % area) from lower risk to higher risk classes is observed in the RCP6.0-SSP2-Far future scenario. Also, overall drought risk reduces by 0.8 % in this scenario compared to the baseline. It is interesting to note that the RCP6.0-SSP2-Far future scenario is not the worst-case scenario in drought vulnerability projection, yet it turned out to be the worst-case scenario in drought risk projection due to high drought hazard projection, revealing the importance of comprehensive drought risk assessment. Risk is an outcome of the interaction between hazard and vulnerability and is also a function of time. The fact that worst-case scenarios are different for drought hazard and drought vulnerability indicates dissimilar behaviour of drought hazard and vulnerability indicators in inducing drought risk. For example, population density is high in the near-future period (2060) compared to the far-future period (2100), while precipitation is continuously increasing in the projected period. A combination of such different hazard and vulnerability behaviour in a given time period is effectively captured through comprehensive risk analysis. Therefore, though the RCP6.0-SSP2-Far future scenario is not the worst-case scenario for drought vulnerability compared to RCP6.0-SSP2-Near future, the interaction of high hazard with moderate to high vulnerability resulted in the worst drought risk scenario in the case of RCP6.0-SSP2-Far future. However, in general, when the changes in drought risk for all the future scenarios are compared with the baseline, it is observed that the area falling under drought risk due to drought vulnerability is increased (Fig. 9). It is to be noted that the water availability projections for India by Koutroulis et al. (2019) show decreasing drought risk with time, as opposed to the increasing drought risk from the present study. The choice of climate change scenarios and climate models by Koutroulis et al. (2019) could be a possible reason for such a difference. Further, projected bivariate choropleth maps for unique combinations of DHI and DVI are presented in Fig. 9. It is seen that most of the regions are constituted by low hazard and high vulnerability, indicating the high impact of societal developments rather than climate-invoked changes. Hence it is important to take the drought mitigation plans based on the socio-economic conditions instead of just considering hydro-climatic conditions of the region of interest. Consolidated results showing the percent area of different classes of drought hazard, vulnerability and risk under various climate and socio-economic scenarios are given in Fig. 10. Of all the future drought hazard scenarios considered, the RCP2.6-Far scenario revealed the largest area (2.8 %) in the high and very high hazard classes. In the case of drought vulnerability, as much as 42.9 % area transits from lower-vulnerability classes to higher-vulnerability classes under RCP6.0-SSP2-Near future, with 93 % area of the country in the high and very high drought vulnerability classes. Further, in the worst-case drought risk scenario (RCP6.0-SSP2-Far future), it is observed that 2.7 % area of the country is in the high and very high drought risk classes.
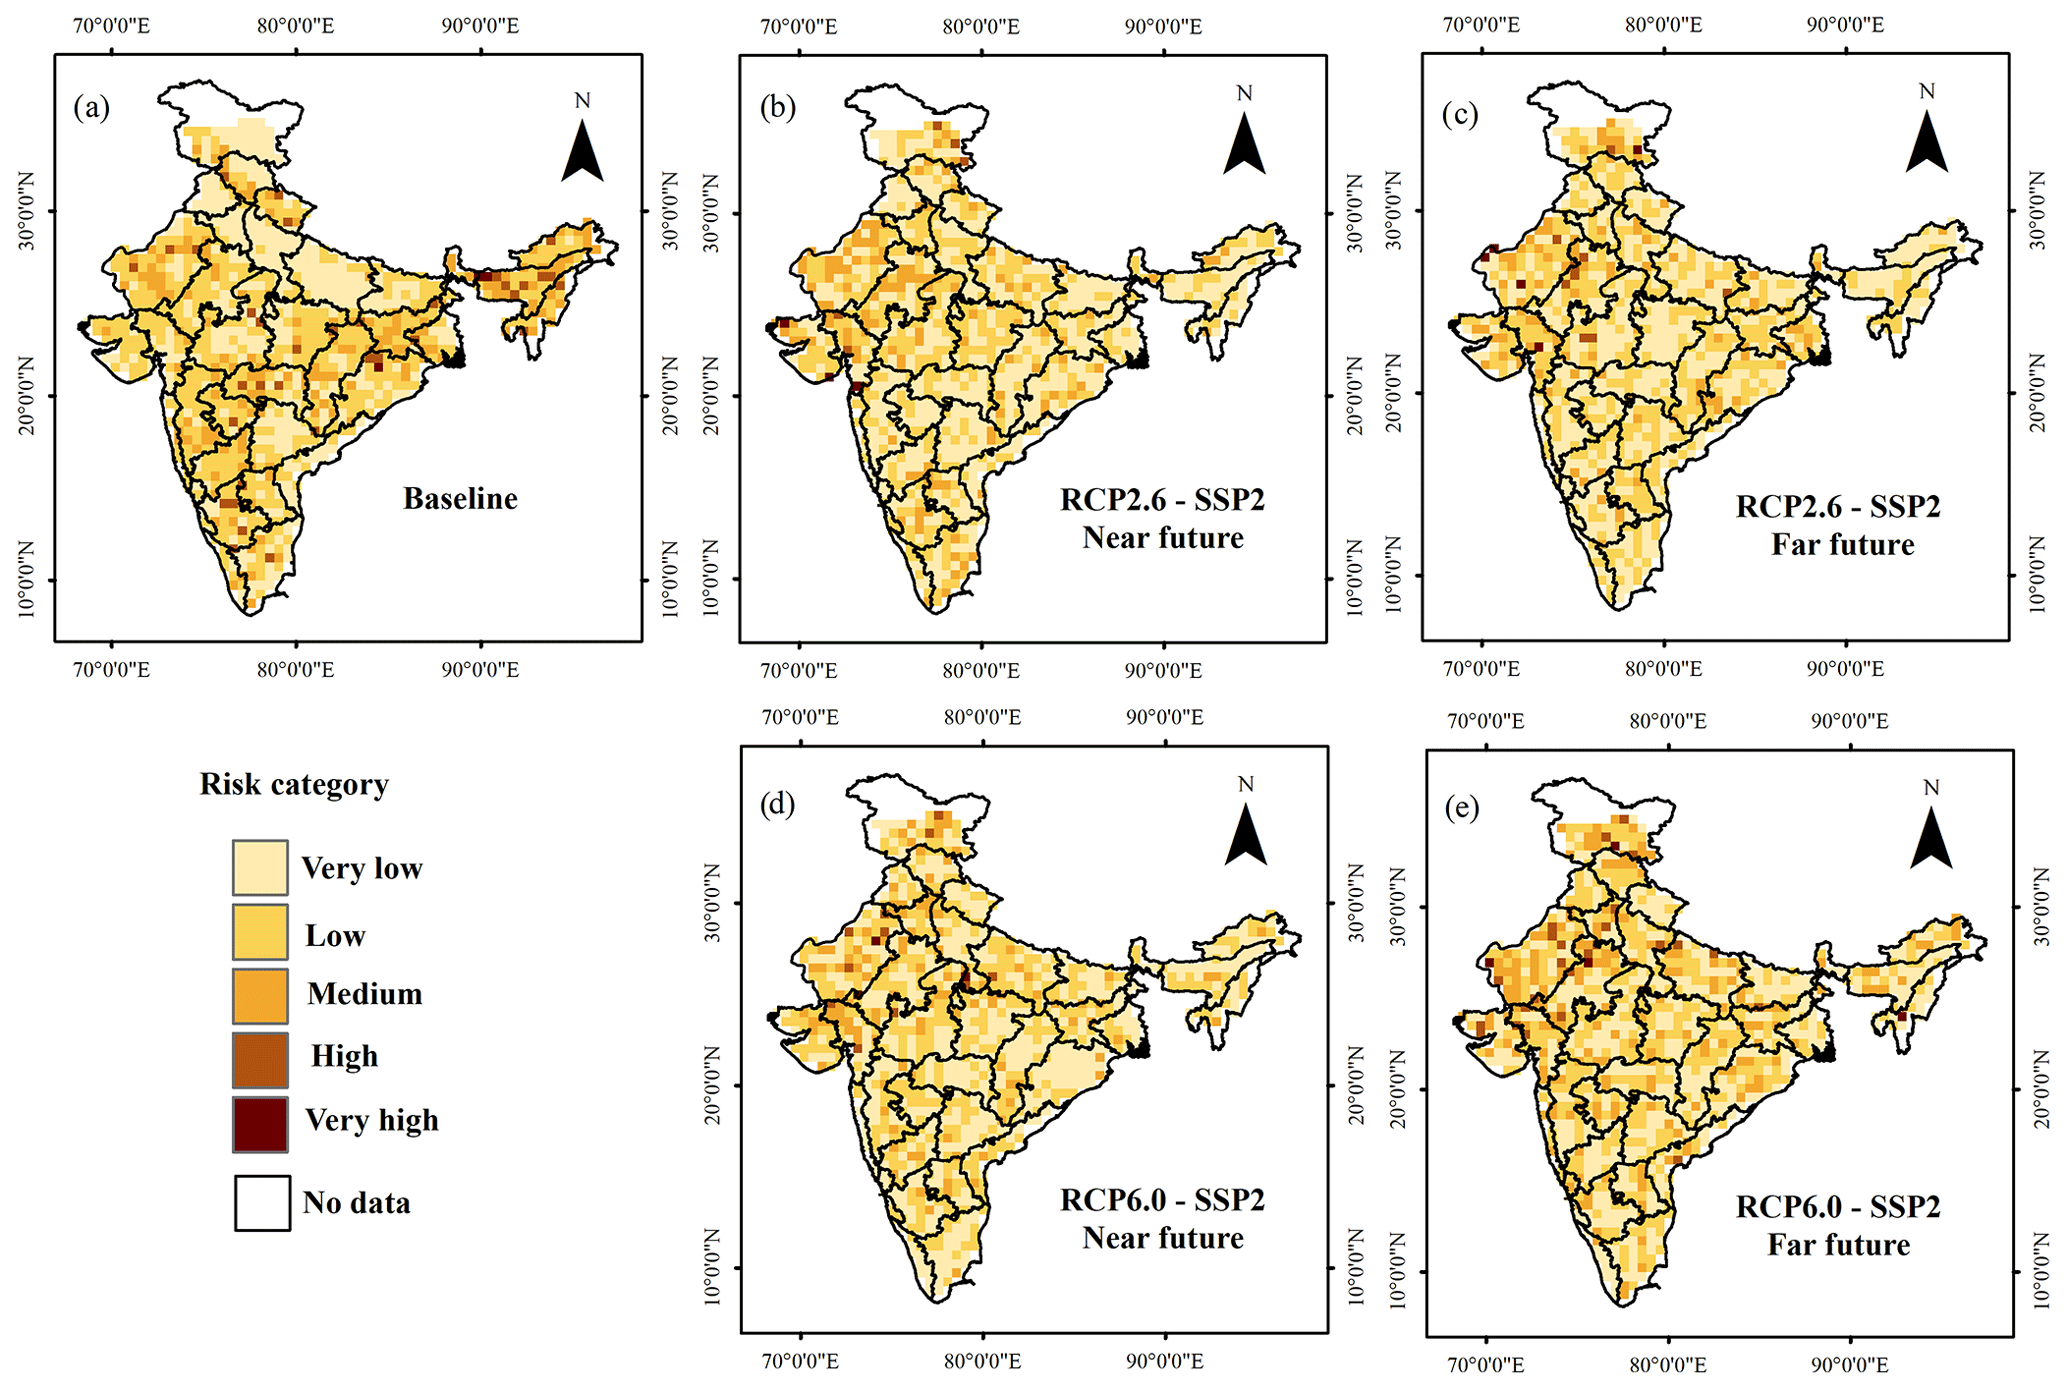
Figure 7Multi-model ensemble drought risk maps for the scenarios (a) baseline, (b) RCP2.6-SSP2-Near future, (c) RCP2.6-SSP2-Far future, (d) RCP6.0-SSP2-Near future and (e) RCP6.0-SSP2-Far future.
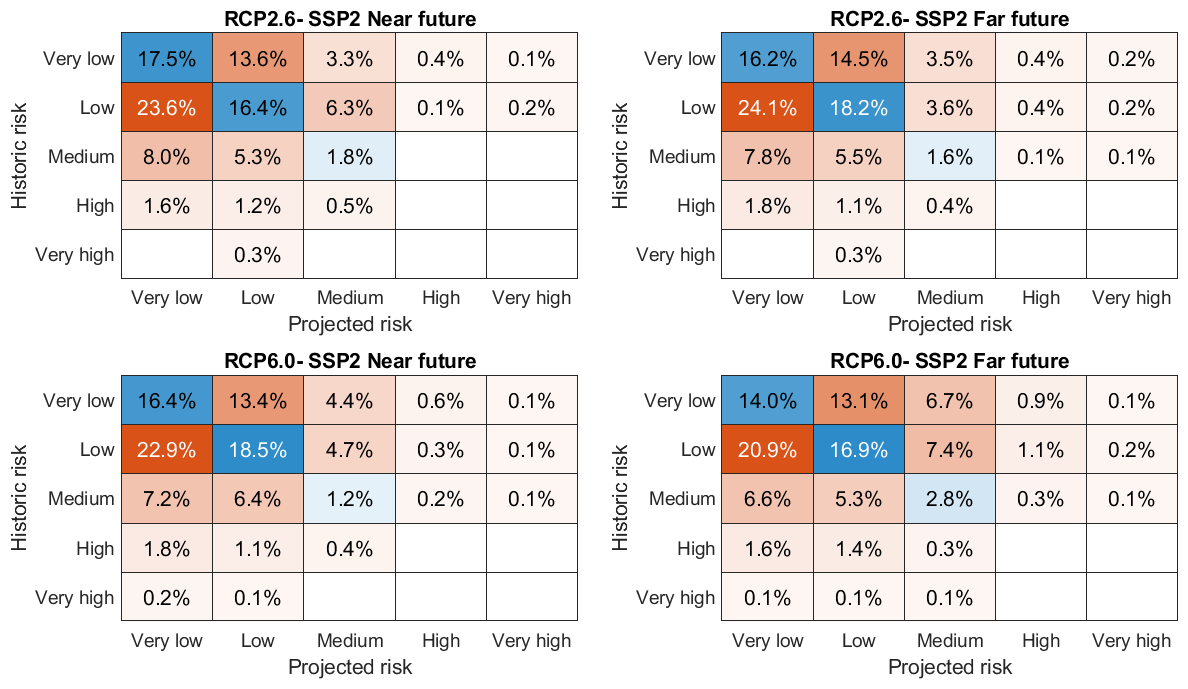
Figure 8Transition of drought risk from baseline period to projected period. The value in each cell represents the change in percent area of the country from one risk class to another. The red colour shows transition, and blue represents no transition.
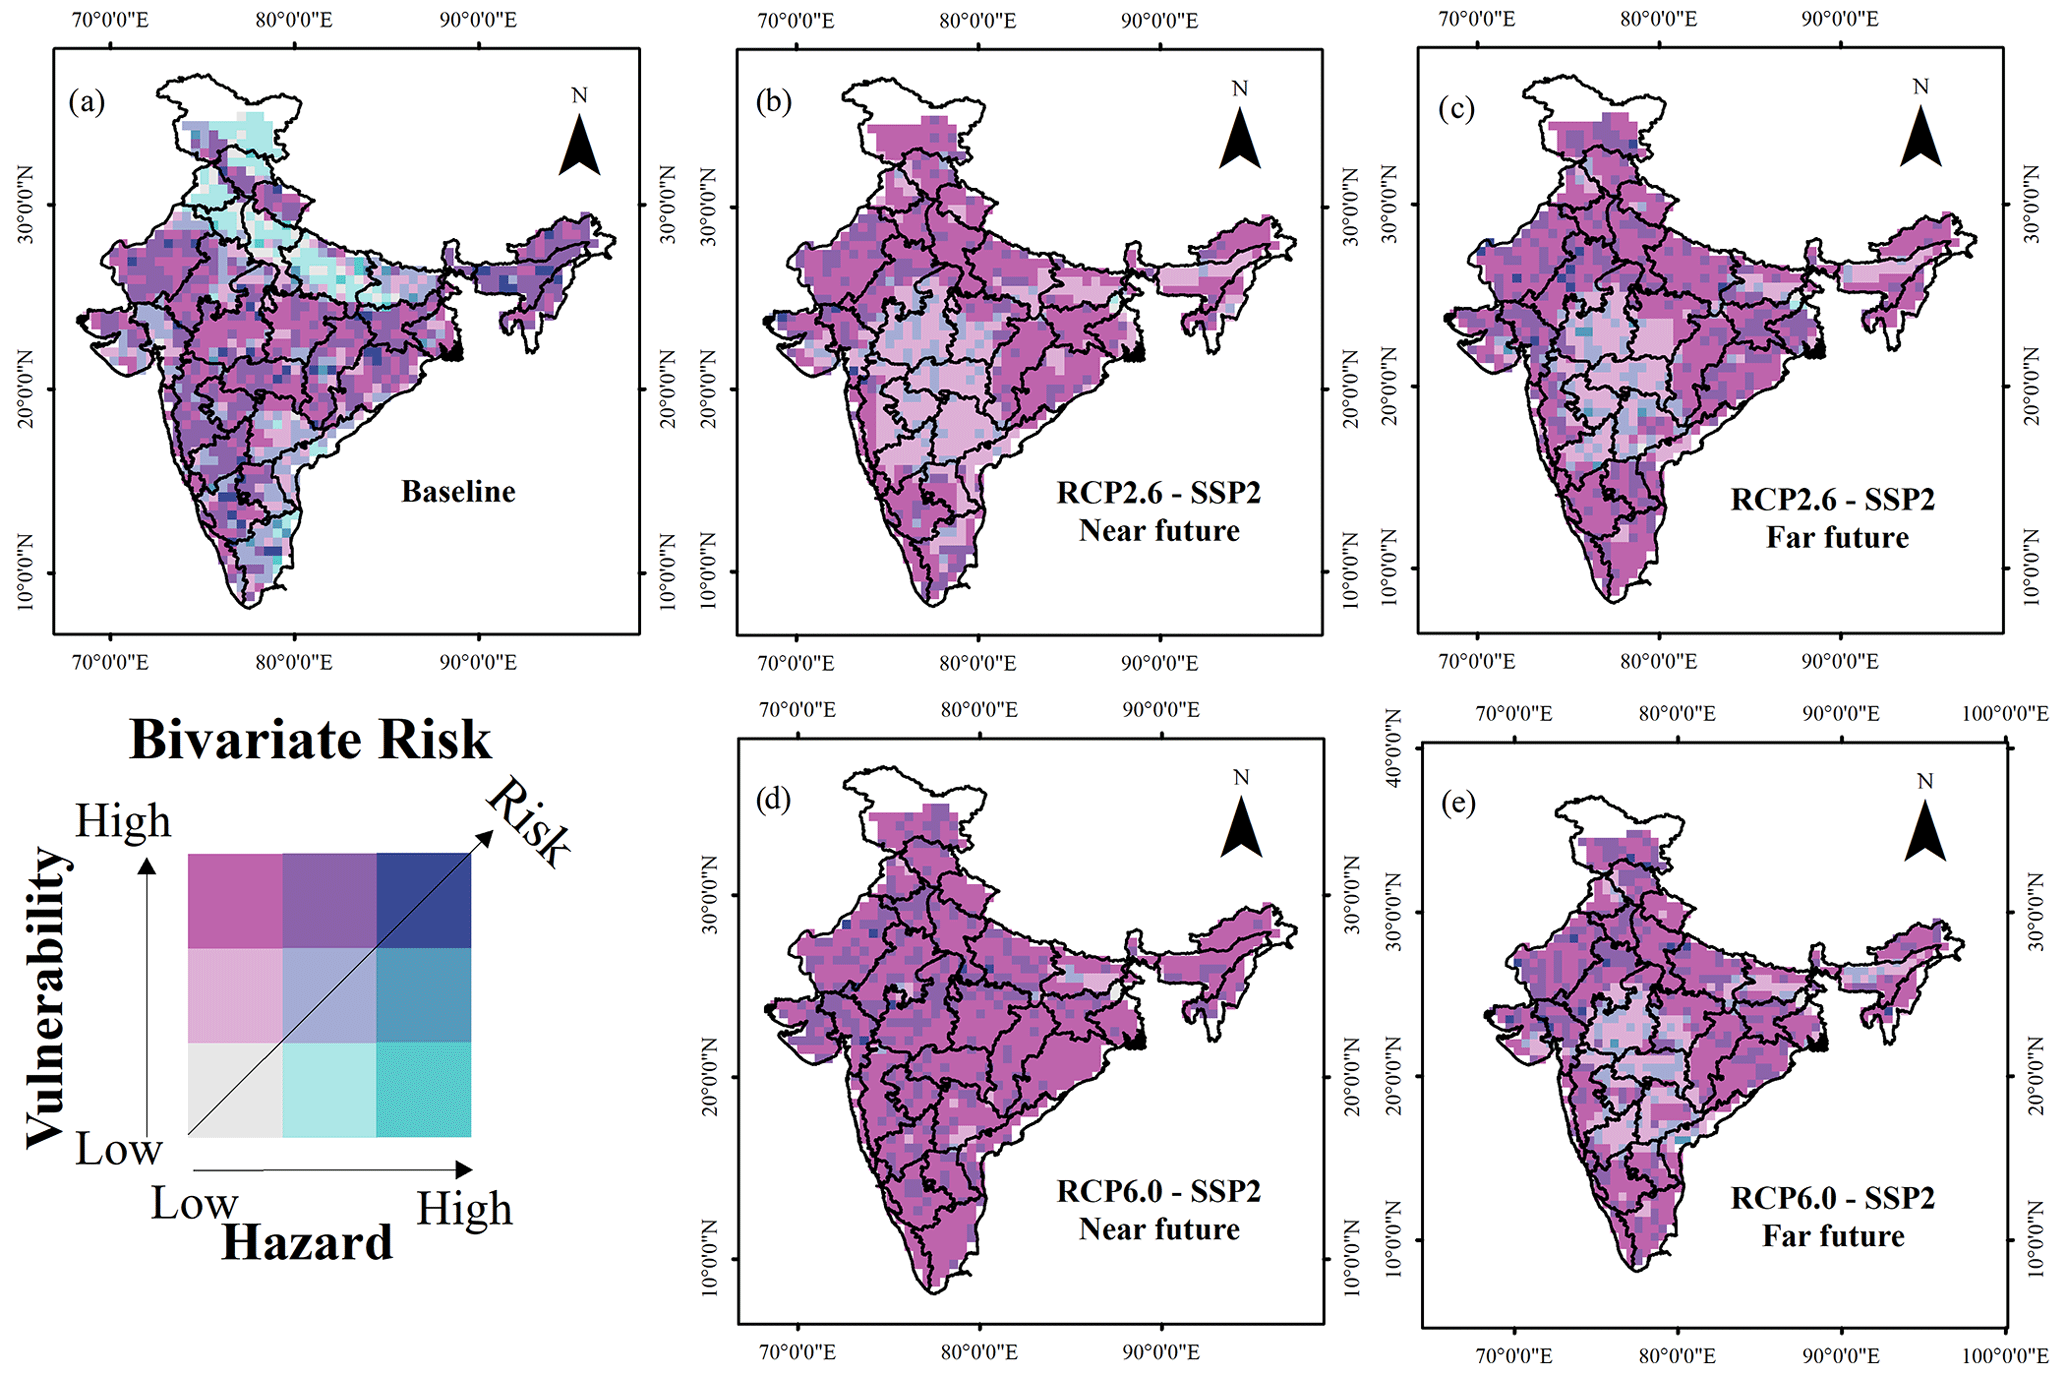
Figure 9Bivariate choropleth drought risk maps showing hazard-driven and vulnerability-driven drought risk for the scenarios (a) baseline, (b) RCP2.6-SSP2-Near future, (c) RCP2.6-SSP2-Far future, (d) RCP6.0-SSP2-Near future and (e) RCP6.0-SSP2-Far future.
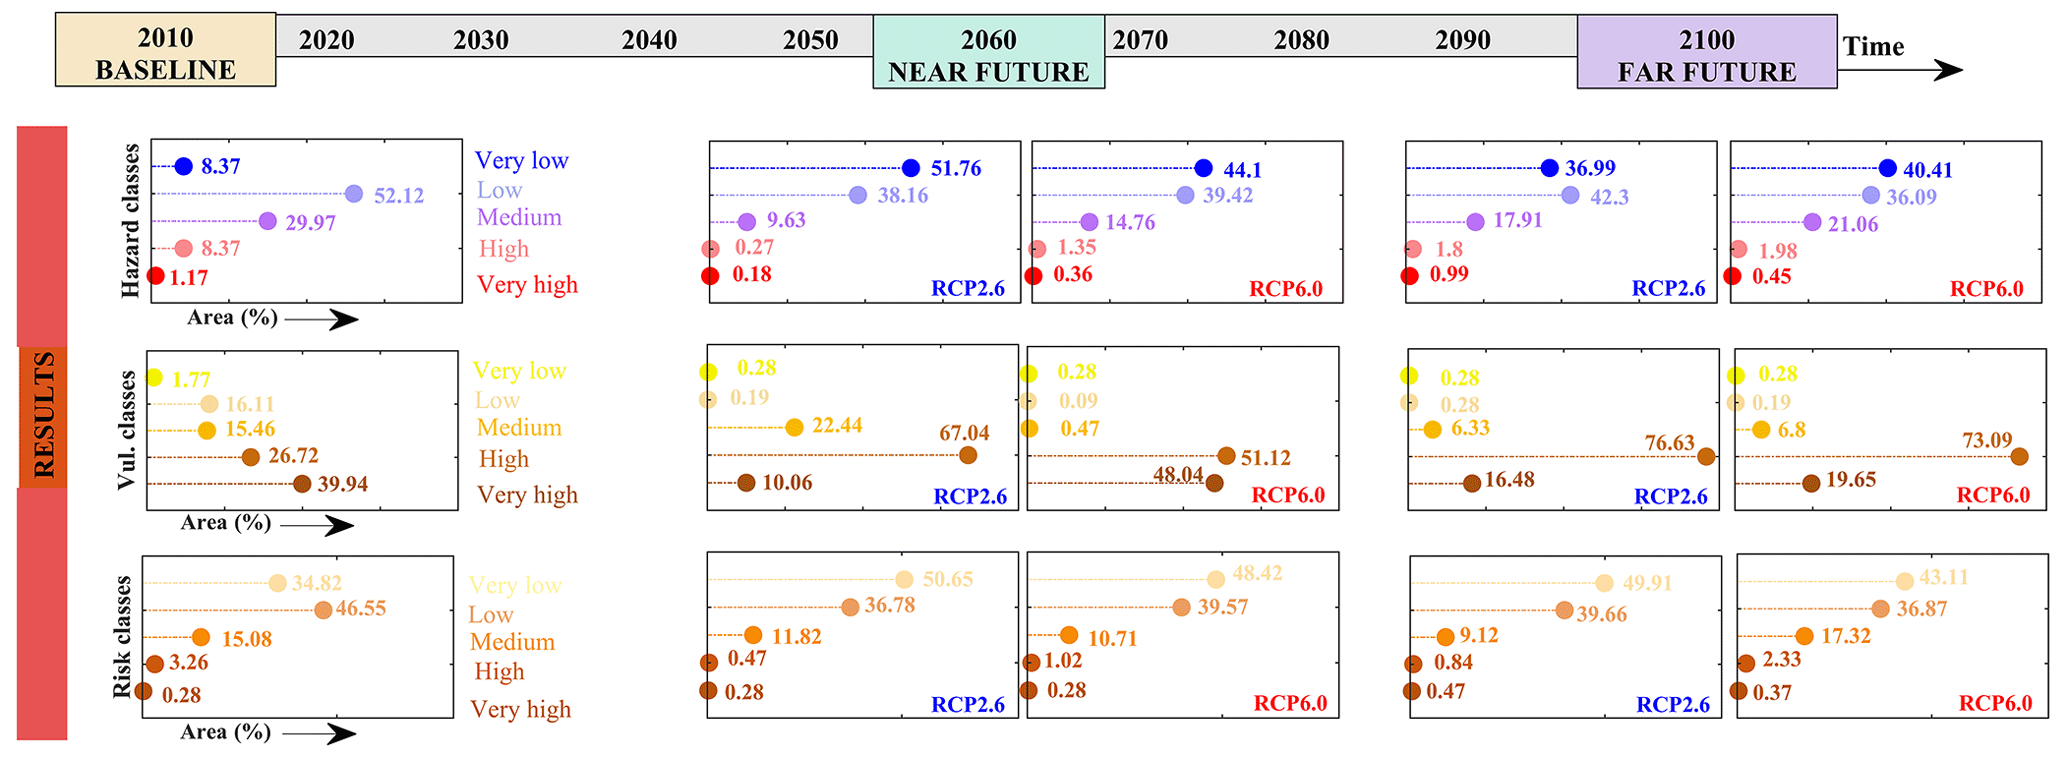
Figure 10Summary of drought risk evolution. Percent area of different classes of drought hazard, vulnerability and risk under various climate and socio-economic scenarios.
3.3.2 Potential applications
The drought hazard, vulnerability and risk projection maps from the present study, developed at 0.5∘ lat long spatial resolution, are comparable with blocks/district-level area. Therefore, these maps can assist the block-level administrators to know region-specific causative factors inducing severe drought risk both in the baseline and projected periods, besides the natural components governing the drought risk. Also, these maps can inform the state or federal disaster management authorities concerning the climate action plans. The change in drought risk at different projected periods can modulate adaptation and mitigation strategies and can be included in decision support systems for drought management. Since drought risk is found to be mainly driven by societal factors, action plans should be directed to improve socio-economic conditions. Groundwater conservation, conjunctive use of surface and groundwater, farmer participation in crop insurance, and water-saving farm practices and technologies are some important measures that can be adopted for raising the socio-economic standards. Further, the framework of our study is applicable for state-wise drought risk assessment with reliable hydro-climatic and socio-economic indicators. Such an assessment can recommend measures for watershed management, irrigation and agricultural practices and reorganizing water demand and supply management at a local scale.
This study presents future projections of drought risk over India under changing climate and socio-economic conditions. This is achieved combining the drought hazard and drought vulnerability projections. Drought hazard assessment is carried out using a multivariate drought index known as MSDI, an indicator of agro-meteorological drought. Drought vulnerability is assessed using a robust multi-criteria decision-making technique called TOPSIS, considering changes in relevant socio-economic indicators. Drought risk projection studies undertaken over the Indian region are based on drought hazard alone, and no consideration has been given to the drought vulnerability component. The present study quantifies the relative contribution of drought hazard and drought vulnerability to the overall drought risk projections in a comprehensive risk framework. Thus, our analysis can aid different stakeholders involved in drought management for adaptation and mitigation plans under changing climate and socio-economic conditions. This marks the significant improvement in our study over existing studies on drought risk assessment in India under climate change. Further, we present for the first time future projected bivariate choropleth plots to identify the drivers of overall drought risk across the country. The multi-model ensemble drought hazard and drought vulnerability are computed for the two RCP–SSP scenarios: RCP2.6-SSP2 and RCP6.0-SSP2 for the near- and far-future timelines. The current study is limited by simulations from a single global vegetation model rather than multiple impact models including hydrologic or land surface simulations. Important conclusions of the study are outlined below.
The MSDI-based drought hazard assessment reveals that more than 35 % area in India is projected to be in the low hazard class as opposed to 8 % in the baseline period possibly due to rising precipitation in the region as projected by climate models. The RCP2.6-Far scenario shows 2.8 % area of the country in the high and very high hazard classes, accounting for a 7 % reduction in those two drought hazard categories. In general, the spatial extent of high and very high hazard classes is greater in the far future compared to the near future.
Drought vulnerability is projected to increase for all scenarios, with 77 % area in the high or very high vulnerability class compared to 66 % in the baseline period. A rise of 33 % area in the high or very high vulnerability class is observed in the RCP6.0-SSP2-Near future scenario. Among the two RCP–SSP scenarios considered, the RCP6.0-SSP2 scenario exhibits the worst case of drought vulnerability due to the high transition from lower to higher vulnerability classes compared to the RCP2.0-SSP2 scenario.
The integration of drought hazard and vulnerability projections shows an overall decrease in drought risk projections, resulting primarily from a reduction in drought hazard. However, a transition from lower to higher risk classes ranging up to 30 % is observed in the RCP6.0-SSP2-Far future scenario. Meteorological sub-divisions such as western Rajasthan, Haryana and western Uttar Pradesh are expected to be at high risk in the projected period under all the scenarios.
Bivariate choropleth analysis shows that future drought risk is significantly driven by increased vulnerability resulting from societal developments rather than climate-induced changes in hazard. Therefore, future efforts on building drought resilience in the country must include strengthening socio-economic conditions.
Code for computing drought hazard, vulnerability and risk is available from the corresponding author upon request (marpita@civil.iitb.ac.in).
The precipitation (https://www.imdpune.gov.in/cmpg/Griddata/Rainfall_25_NetCDF.html, last access: 20 November 2020; Pai et al., 2014) and soil moisture (https://doi.org/10.5067/OQ6B1RHOHBI8; GMAO, 2008) datasets are referred to in Sect. 2.1.1. Data sources for drought hazard and vulnerability analysis are given in Sect. 2.1.1 and Table 1.
The supplement related to this article is available online at: https://doi.org/10.5194/nhess-23-623-2023-supplement.
VS and AM designed the study. VS conducted the analysis, generated the results and wrote the first draft. Both the authors contributed to writing and revising the manuscript.
The contact author has declared that neither of the authors has any competing interests.
Publisher's note: Copernicus Publications remains neutral with regard to jurisdictional claims in published maps and institutional affiliations.
This article is part of the special issue “Drought vulnerability, risk, and impact assessments: bridging the science-policy gap”. It is a result of the EGU General Assembly 2020, 3–8 May 2020.
The authors are thankful to the IMD, Pune, NASA Modern-Era Retrospective Analysis for Research and Application – Land (https://disc.sci.gsfc.nasa.gov/, last access: 14 April 2018), and NASA Global Inventory Modelling and Mapping Studies (https://nex.nasa.gov/nex/projects/1349/, last access: 14 April 2018) for providing essential data for drought hazard assessment, as well as to all the agencies mentioned in Table 1 for providing drought vulnerability indicator datasets and the Potsdam-Institute for Climate Impact Research for providing ISIMIP data (https://esg.pik-potsdam.de/search/isimip/, last access: 9 September 2020) for the drought risk projection study. The authors appreciate the financial support received from the Government of India. The authors also thank Roshan Jha for his comments on the first draft.
This research has been supported by the Department of Science and Technology, Ministry of Science and Technology, India (grant no. ECR/2017/000566) and the Department of Science and Technology, Ministry of Science and Technology, India (grant no. DST/CCP/CoE/140/2018).
This paper was edited by Paolo Tarolli and reviewed by Marthe Wens and two anonymous referees.
Aadhar, S. and Mishra, V.: On the Projected Decline in Droughts Over South Asia in CMIP6 Multimodel Ensemble, J. Geophys. Res.-Atmos., 125, e2020JD033587, https://doi.org/10.1029/2020JD033587, 2020.
Aadhar, S. and Mishra, V.: On the occurrence of the worst drought in South Asia in the observed and future climate, Environ. Res. Lett., 16, 024050, https://doi.org/10.1088/1748-9326/abd6a6, 2021.
AghaKouchak, A.: A multivariate approach for persistence-based drought prediction: Application to the 2010-2011 East Africa drought, J. Hydrol., 526, 127–135, https://doi.org/10.1016/j.jhydrol.2014.09.063, 2015.
Ahmadalipour, A., Moradkhani, H., Castelletti, A., and Magliocca, N.: Future drought risk in Africa: Integrating vulnerability, climate change, and population growth, Sci. Total Environ., 662, 672–686, https://doi.org/10.1016/j.scitotenv.2019.01.278, 2019.
Broxton, P. D., Zeng, X., Sulla-Menashe, D., and Troch, P. A.: A global land cover climatology using MODIS data, J. Appl. Meteorol. Clim., 53, 1593–1605, https://doi.org/10.1175/JAMC-D-13-0270.1, 2014.
Caliński, T. and Harabasz, J.: A dendrite method for cluster analysis, Commun. Stat., 3, 1–27, https://doi.org/10.1080/03610927408827101, 1974.
Carrão, H., Naumann, G., and Barbosa, P.: Mapping global patterns of drought risk: An empirical framework based on sub-national estimates of hazard, exposure and vulnerability, Global Environ. Chang., 39, 108–124, https://doi.org/10.1016/j.gloenvcha.2016.04.012, 2016.
Chen, L., Wang, G., Miao, L., Raj, G. K., Li, S., Amankwah, S. O. Y., Huang, J., Lu, J., and Zhan, M.: Future drought in CMIP6 projections and the socioeconomic impacts in China Liqin Chen, Int. J. Climatol., 41, 4151–4170, https://doi.org/10.1002/joc.7064, 2021.
Chini, L. P., Hurtt, G. C., and Frolking, S.: LUH1: Harmonized Global Land Use for Years 1500-2100, V1, ORNL DAAC [data set], Oak Ridge, Tennessee, USA, https://doi.org/10.3334/ORNLDAAC/1248, 2014.
Chou, J., Xian, T., Zhao, R., Xu, Y., Yang, F., and Sun, M.: Drought risk assessment and estimation in vulnerable eco-regions of China: Under the background of climate change, Sustainability, 11, 4463, https://doi.org/10.3390/su11164463, 2019.
Cook, B. I., Mankin, J. S., Marvel, K., Williams, A. P., Smerdon, J. E., and Anchukaitis, K. J.: Twenty-First Century Drought Projections in the CMIP6 Forcing Scenarios, Earth's Future, 8, e2019EF001461, https://doi.org/10.1029/2019EF001461, 2020.
Dellink, R., Chateau, J., Lanzi, E., and Magné, B.: Long-term economic growth projections in the Shared Socioeconomic Pathways, Global Environ. Chang., 42, 200–214, https://doi.org/10.1016/j.gloenvcha.2015.06.004, 2017.
Ekrami, M., Marj, A. F., Barkhordari, J., and Dashtakian, K.: Drought vulnerability mapping using AHP method in arid and semiarid areas: a case study for Taft Township, Yazd Province, Iran, Environ. Earth Sci., 75, 1039, https://doi.org/10.1007/s12665-016-5822-z, 2016.
FAO-UNESCO: Soil map of the world, 1:5 000 000, Vol. VII, South Asia, UNESCO, Paris, ISBN 92-3-101344-0, 1977.
Farahmand, A. and AghaKouchak, A.: A generalized framework for deriving nonparametric standardized drought indicators, Adv. Water Resour., 76, 140–145, https://doi.org/10.1016/j.advwatres.2014.11.012, 2015.
Ghosh, T., Powell, R. L., Elvidge, C. D., Baugh, K. E., Sutton, P. C., and Anderson, S.: Shedding Light on the Global Distribution of Economic Activity, Open Geogr. J., 148–161, 2010.
GMAO (Global Modeling and Assimilation Office): tavg1_2d_mld_Nx: MERRA Simulated 2D Incremental Analysis Update (IAU) MERRA-Land reanalysis, GEOSldas-MERRALand, Time Average 1-hourly V5.2.0, Goddard Earth Sciences Data and Information Services Center (GES DISC) [data set], Greenbelt, MD, USA, https://doi.org/10.5067/OQ6B1RHOHBI8, 2008.
Grillakis, M. G.: Increase in severe and extreme soil moisture droughts for Europe under climate change, Sci. Total Environ., 660, 1245–1255, https://doi.org/10.1016/j.scitotenv.2019.01.001, 2019.
Gringorten, I. I.: A plotting rule for extreme probability paper, J. Geophys. Res., 68, 813–814, https://doi.org/10.1029/JZ068i003p00813, 1963.
Gupta, V. and Jain, M. K.: Investigation of multi-model spatiotemporal mesoscale drought projections over India under climate change scenario, J. Hydrol., 567, 489–509, 2018.
Gupta, V., Jain, M. K., and Singh, V. P.: Multivariate Modeling of Projected Drought Frequency and Hazard over India, J. Hydrol. Eng., 25, 1–19, https://doi.org/10.1061/(ASCE)HE.1943-5584.0001893, 2020.
Hagenlocher, M., Meza, I., Anderson, C. C., Min, A., Renaud, F. G., Walz, Y., Siebert, S., and Sebesvari, Z.: Drought vulnerability and risk assessments: State of the art, persistent gaps, and research agenda, Environ. Res. Lett., 14, 083002, https://doi.org/10.1088/1748-9326/ab225d, 2019.
Hao, Z. and AghaKouchak, A.: A Nonparametric Multivariate Multi-Index Drought Monitoring Framework, J. Hydrometeorol., 15, 89–101, https://doi.org/10.1175/JHM-D-12-0160.1, 2014.
Hurtt, G. C., Chini, L. P., Frolking, S., Betts, R. A., Feddema, J., Fischer, G., Fisk, J. P., Hibbard, K., Houghton, R. A., Janetos, A., Jones, C. D., Kindermann, G., Kinoshita, T., Klein Goldewijk, K., Riahi, K., Shevliakova, E., Smith, S., Stehfest, E., Thomson, A., Thornton, P., van Vuuren, D. P., and Wang, Y. P.: Harmonization of land-use scenarios for the period 1500-2100: 600 years of global gridded annual land-use transitions, wood harvest, and resulting secondary lands, Climatic Change, 109, 117–161, https://doi.org/10.1007/s10584-011-0153-2, 2011.
Hwang, C. L. and Yoon, K.: Methods for Multiple Attribute Decision Making, in: Multiple Attribute Decision Making. Lecture Notes in Economics and Mathematical Systems, Vol. 186, Springer, Berlin, Heidelberg, https://doi.org/10.1007/978-3-642-48318-9_3, 1981.
IPCC: Climate Change 2014: Impacts, Adaptation and Vulnerability. Contribution of Working Group II to the Fifth Assessment Report of the Intergovernmental Panel on Climate Change. Cambridge University Press, Cambridge and New York, ISBN 978-1-107-05807-1, 2014.
Jia, B., Cai, X., Zhao, F., Liu, J., Chen, S., Luo, X., Xie, Z., and Xu, J.: Potential future changes of terrestrial water storage based on climate projections by ensemble model simulations, Adv. Water Resour., 142, 103635, https://doi.org/10.1016/j.advwatres.2020.103635, 2020.
Kelkar, R. R. and Sreejith, O. P.: Meteorological sub-divisions of india and their geopolitical evolution from 1875 to 2020, Mausam, 71, 571–584, 2020.
Kim, H., Park, J., Yoo, J., and Kim, T. W.: Assessment of drought hazard, vulnerability, and risk: A case study foradministrative districts in South Korea, J. Hydro-Environ. Res., 9, 28–35, https://doi.org/10.1016/j.jher.2013.07.003, 2015.
Kim, H. J., Cho, K., Kim, Y., Park, H., Lee, J. W., Kim, S. J., and Chae, Y.: Spatial Assessment of Water-Use Vulnerability under Future Climate and Socioeconomic Scenarios within a River Basin, J. Water Resour. Plan. Manag., 146, 05020011, https://doi.org/10.1061/(asce)wr.1943-5452.0001235, 2020.
Koutroulis, A. G., Papadimitriou, L. V., Grillakis, M. G., Tsanis, I. K., Wyser, K., and Betts, R. A.: Freshwater vulnerability under high end climate change. A pan-European assessment, Sci. Total Environ., 613–614, 271–286, https://doi.org/10.1016/j.scitotenv.2017.09.074, 2018.
Koutroulis, A. G., Papadimitriou, L. V., Grillakis, M. G., Tsanis, I. K., Warren, R., and Betts, R. A.: Global water availability under high-end climate change: A vulnerability based assessment, Global Planet. Change, 175, 52–63, https://doi.org/10.1016/j.gloplacha.2019.01.013, 2019.
Mckee, T. B., Doesken, N. J., and Kleist, J.: The relationship of drought frequency and duration to time scales, in: 8th Conference on Applied Climatology, Anaheim, California, 17–22 January 1993, 179–184, citeulike-article id:10490403, 1993.
Meza, I., Siebert, S., Döll, P., Kusche, J., Herbert, C., Eyshi Rezaei, E., Nouri, H., Gerdener, H., Popat, E., Frischen, J., Naumann, G., Vogt, J. V., Walz, Y., Sebesvari, Z., and Hagenlocher, M.: Global-scale drought risk assessment for agricultural systems, Nat. Hazards Earth Syst. Sci., 20, 695–712, https://doi.org/10.5194/nhess-20-695-2020, 2020.
McSweeney, C. F., Jones, R. G., Lee, R. W., and Rowell, D. P.: Selecting CMIP5 GCMs for downscaling over multiple regions, Clim. Dynam., 44, 3237–3260, https://doi.org/10.1007/s00382-014-2418-8, 2015.
Mishra, A. K. and Singh, V. P.: A review of drought concepts, J. Hydrol., 391, 202–216, https://doi.org/10.1016/j.jhydrol.2010.07.012, 2010.
Mishra, A. K. and Singh, V. P.: Drought modeling – A review, J. Hydrol., 403, 157–175, https://doi.org/10.1016/j.jhydrol.2011.03.049, 2011.
Mohanty, M. P., H, V., Yadav, V., Ghosh, S., Rao, G. S., and Karmakar, S.: A new bivariate risk classifier for flood management considering hazard and socio-economic dimensions, J. Environ. Manage., 255, 109733, https://doi.org/10.1016/j.jenvman.2019.109733, 2020.
Murthy, C. S., Laxman, B., and Sesha Sai, M. V. R.: Geospatial analysis of agricultural drought vulnerability using a composite index based on exposure, sensitivity and adaptive capacity, Int. J. Disast. Risk Re., 12, 163–171, https://doi.org/10.1016/j.ijdrr.2015.01.004, 2015.
Naumann, G., Barbosa, P., Garrote, L., Iglesias, A., and Vogt, J.: Exploring drought vulnerability in Africa: an indicator based analysis to be used in early warning systems, Hydrol. Earth Syst. Sci., 18, 1591–1604, https://doi.org/10.5194/hess-18-1591-2014, 2014.
O'Neill, B. C., Kriegler, E., Ebi, K. L., Kemp-Benedict, E., Riahi, K., Rothman, D. S., van Ruijven, B. J., van Vuuren, D. P., Birkmann, J., Kok, K., Levy, M., and Solecki, W.: The roads ahead: Narratives for shared socioeconomic pathways describing world futures in the 21st century, Global Environ. Chang., 42, 169–180, https://doi.org/10.1016/j.gloenvcha.2015.01.004, 2017.
Pai, D. S., Latha Sridhar, Rajeevan, M., Sreejith, O. P., Satbhai, N. S., and Mukhopadhyay, B.: Development of a new high spatial resolution () Long period (1901–2010) daily gridded rainfall data set over India and its comparison with existing data sets over the region, MAUSAM, 65, 1–18, 2014 (data available at: https://www.imdpune.gov.in/cmpg/Griddata/Rainfall_25_NetCDF.html, last access: 20 November 2020).
Pandey, R. P., Pandey, A., Galkate, R. V., Byun, H.-R., and Mal, B. C.: Integrating Hydro-Meteorological and Physiographic Factors for Assessment of Vulnerability to Drought, Water Resour. Manag., 24, 4199–4217, https://doi.org/10.1007/s11269-010-9653-5, 2010.
Park, S. Y., Sur, C., Kim, J. S., Choi, S. J., Lee, J. H., and Kim, T. W.: Projected drought risk assessment from water balance perspectives in a changing climate, Int. J. Climatol., 41, 2765–2777, https://doi.org/10.1002/joc.6988, 2021.
Rajsekhar, D., Singh, V. P., and Mishra, A. K.: Integrated drought causality, hazard, and vulnerability assessment for future socioeconomic scenarios: An information theory perspective, J. Geophys. Res., 120, 6346–6378, https://doi.org/10.1002/2014JD022670, 2015.
Sahana, V., Sreekumar, P., Mondal, A., and Rajsekhar, D.: On the rarity of the 2015 drought in India: A country-wide drought atlas using the multivariate standardized drought index and copula-based severity-duration-frequency curves, J. Hydrol. Reg. Stud., 31, 100727, https://doi.org/10.1016/j.ejrh.2020.100727, 2020.
Sahana, V., Mondal, A., and Sreekumar, P.: Drought vulnerability and risk assessment in India: Sensitivity analysis and comparison of aggregation techniques, J. Environ. Manage., 299, 113689, https://doi.org/10.1016/j.jenvman.2021.113689, 2021.
Schaphoff, S., Forkel, M., Müller, C., Knauer, J., von Bloh, W., Gerten, D., Jägermeyr, J., Lucht, W., Rammig, A., Thonicke, K., and Waha, K.: LPJmL4 – a dynamic global vegetation model with managed land – Part 2: Model evaluation, Geosci. Model Dev., 11, 1377–1403, https://doi.org/10.5194/gmd-11-1377-2018, 2018.
Singh, R. and Kumar, R.: Climate versus demographic controls on water availability across India at 1.5 ∘C, 2.0 ∘C and 3.0 ∘C global warming levels, Global Planet. Change, 177, 1–9, https://doi.org/10.1016/j.gloplacha.2019.03.006, 2019.
Sitch, S., Smith, B., Prentice, I. C., Arneth, A., Bondeau, A., Cramer, W., Kaplan, J. O., Levis, S., Lucht, W., Sykes, M. T., Thonicke, K., and Venevsky, S.: Evaluation of ecosystem dynamics, plant geography and terrestrial carbon cycling in the LPJ dynamic global vegetation model, Glob. Change Biol., 9, 161–185, https://doi.org/10.1046/j.1365-2486.2003.00569.x, 2003.
Swami, D. and Parthasarathy, D.: Dynamics of exposure, sensitivity, adaptive capacity and agricultural vulnerability at district scale for Maharashtra, India, Ecol. Indic., 121, 107206, https://doi.org/10.1016/j.ecolind.2020.107206, 2021.
Thomas, T., Jaiswal, R. K., Galkate, R., Nayak, P. C., and Ghosh, N. C.: Drought indicators-based integrated assessment of drought vulnerability: a case study of Bundelkhand droughts in central India, Nat. Hazards, 81, 1627–1652, https://doi.org/10.1007/s11069-016-2149-8, 2016.
van Vuuren, D. P., Edmonds, J., Kainuma, M., Riahi, K., Thomson, A., Hibbard, K., Hurtt, G. C., Kram, T., Krey, V., Lamarque, J.-F., Masui, T., Meinshausen, M., Nakicenovic, N., Smith, S. J., and Rose, S. K.: The representative concentration pathways: an overview, Clim. Change, 109, 5–31, 2011.
Vittal, H., Karmakar, S., Ghosh, S., and Murtugudde, R. G.: A comprehensive India-wide social vulnerability analysis: highlighting its influence on hydro-climatic risk, Environ. Res. Lett., 15, 014005, https://doi.org/10.1088/1748-9326/ab6499, 2020.
Warszawski, L., Frieler, K., Huber, V., Piontek, F., Serdeczny, O., and Schewe, J.: The inter-sectoral impact model intercomparison project (ISI-MIP): Project framework, P. Natl. Acad. Sci. USA, 111, 3228–3232, https://doi.org/10.1073/pnas.1312330110, 2014.
Watson, D. F. and Philip, G. M.: Triangle based interpolation, J. Int. Ass. Math. Geol., 16, 779–795, https://doi.org/10.1007/BF01036704, 1984.
Wu, J., Lin, X., Wang, M., Peng, J., and Tu, Y.: Assessing agricultural drought vulnerability by a VSD Model: A case study in Yunnan Province, China, Sustainability, 9, 918, https://doi.org/10.3390/su9060918, 2017.
Zaherpour, J., Gosling, S. N., Mount, N., Müller Schmied, H., Veldkamp, T. I. E., Dankers, R., Eisner, S., Gerten, D., Gudmundsson, L., Haddeland, I., Hanasaki, N., Kim, H., Leng, G., Liu, J., Masaki, Y., Oki, T., Pokhrel, Y. N., Satoh, Y., Schewe, J., and Wada, Y.: Worldwide evaluation of mean and extreme runoff from six global-scale hydrological models that account for human impacts, Environ. Res. Lett., 13, 065015, https://doi.org/10.1088/1748-9326/aac547, 2018.
Zhai, J., Mondal, S. K., Fischer, T., Wang, Y., Su, B., Huang, J., Tao, H., Wang, G., Ullah, W., and Uddin, M. J.: Future drought characteristics through a multi-model ensemble from CMIP6 over South Asia, Atmos. Res., 246, 105111, https://doi.org/10.1016/j.atmosres.2020.105111, 2020.