the Creative Commons Attribution 4.0 License.
the Creative Commons Attribution 4.0 License.
 | 07 Feb 2023
Validating a tailored drought risk assessment methodology: drought risk assessment in local Papua New Guinea regions
Isabella Aitkenhead
Yuriy Kuleshov
Jessica Bhardwaj
Zhi-Weng Chua
Chayn Sun
Suelynn Choy
Climate change is increasing the frequency and intensity of natural hazards, causing disastrous impacts on vulnerable communities. Pacific Small Island Developing States (SIDS) are of particular concern, requiring resilient disaster risk management consisting of two key elements: proactivity and suitability. Drought risk knowledge can inform resilient risk management, but it is currently underexplored in Pacific SIDS, particularly in the highly vulnerable nation of Papua New Guinea (PNG). A tailored, meaning highly specific to the area under investigation, drought risk assessment methodology is key for expanding risk knowledge in vulnerable communities. A semi-dynamic and tailored drought risk assessment methodology to be utilised in PNG was developed in this research. Representative hazard, vulnerability, and exposure indicators were selected, and integrated geographic information system (GIS) processes were used to produce hazard, vulnerability, exposure, and risk indices and maps. The validity of the risk assessment was investigated with a retrospective risk assessment of drought in PNG (from 2014–2020) paired with a literature assessment (as a ground-truth source), and a sensitivity analysis. The preliminary drought risk assessment methodology demonstrated in this study was overall deemed valid and robust, with supplementary improvements proposed for consideration in future investigation. The developed methodology makes strides in addressing methodological knowledge gaps in drought risk assessment, for global assessments and those specific for PNG, and demonstrates the potential for risk assessment to inform resilient drought management practices in at-risk areas. Overall, the results of this study directly contribute to enhancing provincial drought risk knowledge in PNG.
- Article
(5953 KB) - Full-text XML
-
Supplement
(421 KB) - BibTeX
- EndNote


1.1 Drought in Papua New Guinea
Increased intensity and frequency of natural hazards and disaster events resultant of a changing global climate are already seen to have destructive impacts on the world's most vulnerable communities (Mercer, 2010). Small island developing states (SIDS) in the Pacific include some of the most hazard-vulnerable communities in the world (Bang and Crimp, 2019). Papua New Guinea (PNG) is one such country that has experienced destructive impacts from hazard events. In particular, drought has consistently devastated PNG communities in the past and is predicted to increasingly affect PNG in the future (Kuleshov et al., 2014).
Generally, drought can be described as an extended dry period resulting from rainfall deficiency. However, drought has many definitions for its various types: meteorological (when climactic factors result in dry conditions within an area), hydrological (when water shortages occur after a period of meteorological drought), agricultural (when agricultural productivity is inhibited by meteorological and hydrological drought), and socioeconomic (when dry conditions restrict the supply and demand of commodities) (Wilhite et al., 2014). Drought events across PNG occur mainly as a result of two key climate drivers: El Niño–Southern Oscillation (ENSO) and Indian Ocean Dipole (IOD) (Chua et al., 2020).
In PNG, ENSO alters the distribution of precipitation, often causing precipitation extremes (Horton et al., 2021). ENSO has two key phases: El Niño (warm phase) and La Niña (cold phase). La Niña-associated prolonged rainfall has commonly contributed to floods, whilst El Niño-associated prolonged aridity has commonly contributed to droughts in PNG (Smith et al., 2013). Historically, the 1997–1998 El Niño contributed to severe drought in PNG causing immense loss of life, destruction of crops, and forest fires subsequently causing regional pollution problems (Nicholls, 2001). However, different regions of PNG experience varying climactic effects from El Niño and La Niña (Fig. 1). For example, a mild to moderate La Niña event which occurred in PNG during 2011–2012 resulted in drought conditions in several PNG provinces. Albeit in a La Niña phase, severe precipitation deficits were observed in New Ireland and Milne Bay Province throughout 2010 and the first half of 2011, resulting in drought conditions which contributed to crop destruction, food insecurity, and water shortages (Smith et al., 2013).
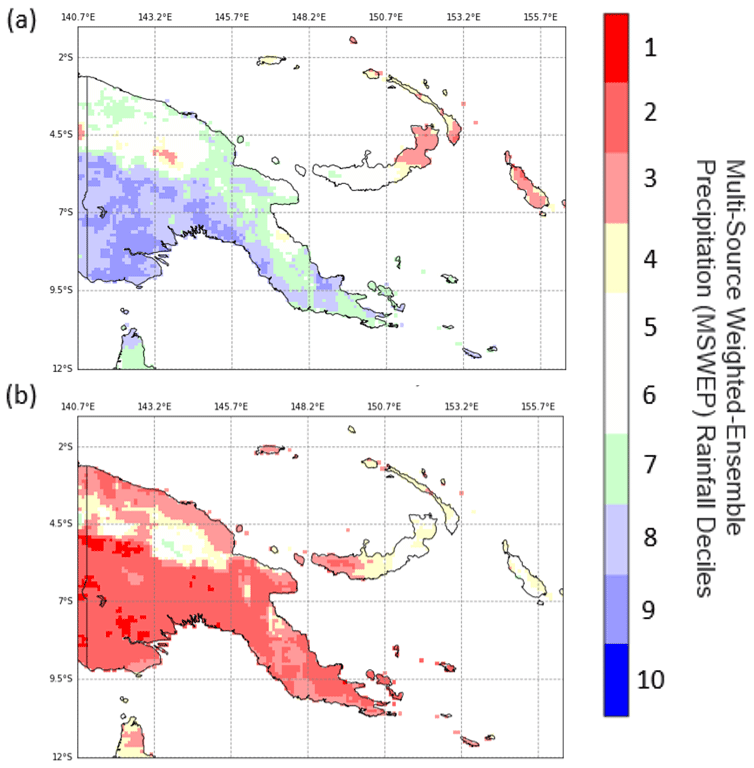
Figure 1Multi-Source Weighted-Ensemble Precipitation (MSWEP) rainfall deciles in (a) La Niña events (La Niña years being 1988, 1989, 1995, 1998, 1999, 2000, 2007, 2010, 2011 and 2020) and (b) El Niño events (El Niño years being 1982, 1987, 1991, 1992, 1994, 1997, 2002, 2006, and 2015) compared to a base period of 1980–2020. Figure adapted from Bhardwaj et al. (2021b).
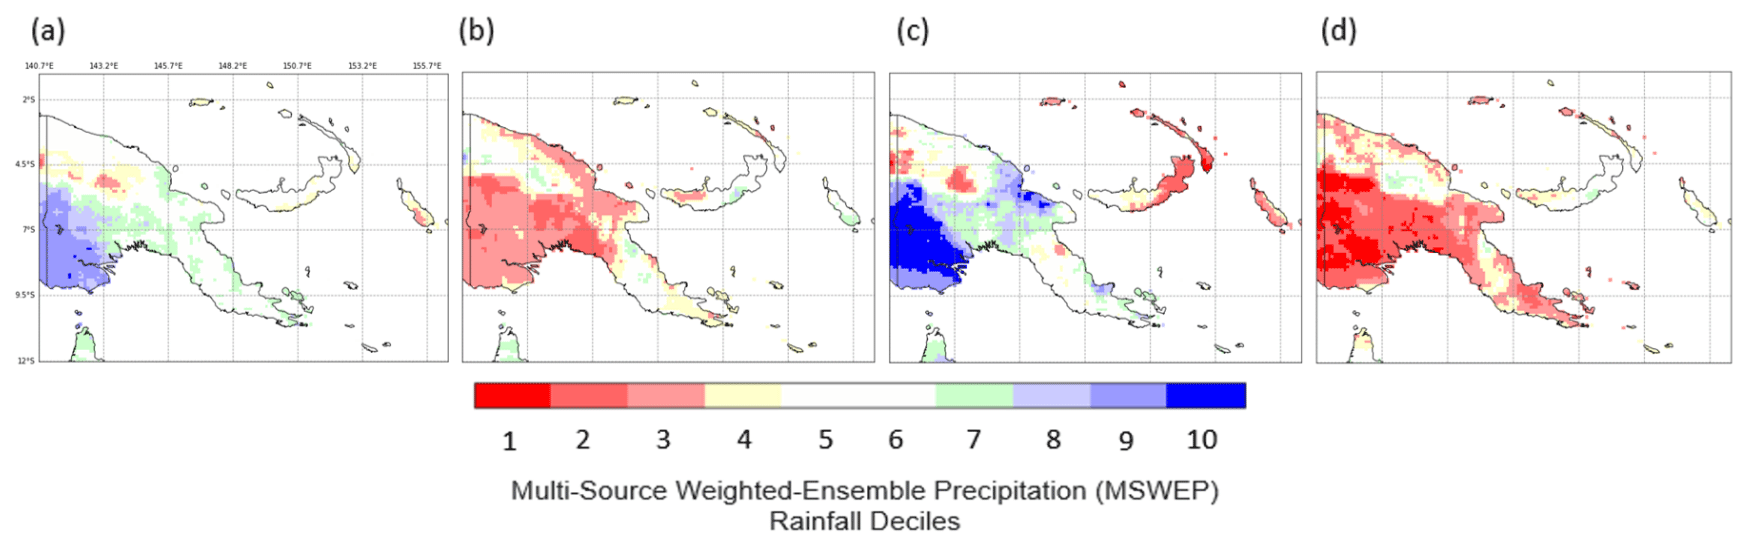
Figure 2Multi-Source Weighted-Ensemble Precipitation (MSWEP) rainfall deciles in response to various climate drivers: (a) negative IOD phase (during 1981, 1989, 1992, 1996, 1998, 2010, 2014, and 2016 years), (b) positive IOD phase (during 1982, 1983, 1994, 1997, 2006, 2012, 2015, and 2019 years), (c) negative IOD phase and La Niña ENSO phase (during 1989, 1998, and 2010 years) and (d) positive IOD phase and El Niño ENSO phase (during 1982, 1994, 1997, 2006, and 2015 years). Deciles are compared to a 1980–2020 base period. Figure adapted from Bhardwaj et al. (2021b).
The effects of ENSO can be influenced by the IOD to further weaken or strengthen trends in rainfall variability (Bhardwaj et al., 2021b). Defined as consistent changes in sea surface temperature variability across the tropical western and eastern Indian Ocean, the IOD can be negative, positive, or neutral. Each IOD phase interacts with ENSO impacts differently (Bhardwaj et al., 2021b). The impacts of interactive IOD and ENSO phases experienced in PNG are shown in Fig. 2. Whilst drought conditions can occur in PNG in any ENSO or IOD phase, extreme drought conditions are most often a result of a positive IOD phase interacting with an El Niño ENSO phase.
1.2 Disaster risk reduction and resilient risk management of droughts in Papua New Guinea
PNG has a lack of coping capacity for managing the risks posed by the drought events which occur across the country, due to limited resource availability, including water and food insecurity, and reactive management practices (Kuleshov et al., 2020). Although drought historically has disastrous impacts on PNG communities, the risk of drought has not been extensively investigated compared to other hazards like tropical cyclones and floods. Due to the lack of drought risk knowledge, and the lack of coping capacity, future disaster risk reduction (DRR) of drought, through resilient drought risk management, is of priority in PNG (Bang and Crimp, 2019).
Globally, resilient drought risk management consists of two key elements: proactivity and suitability. In this instance, proactivity is characterised by controlling a drought risk situation prior to the occurrence of a drought event, rather than responding to drought after it has reached a crisis level (Pulwarty and Sivakumar, 2014). Suitability is seen as the level of appropriateness that drought management strategies have for application at localised levels in vulnerable places. A drought management strategy is deemed suitable if it can be independently implemented by local stakeholders and/or communities and if it addresses the specific impacts faced by local decision-makers (Aitkenhead et al., 2021). Thus, when seeking to increase drought resilience in PNG, the proactivity and suitability of localised drought risk management is of critical focus (Mercer, 2010).
1.3 Investigating drought risk knowledge in PNG: drought risk assessments
Drought risk assessments are increasingly recognised as key to informing proactive and suitable drought risk management decisions, as they aid in increasing risk knowledge and can identify priority management areas. Such assessments are commonly used in global studies investigating drought risk knowledge, and there is potential for application of these assessments in SIDS like PNG (Chen et al., 2003; Rahmati et al., 2020). Drought risk assessments analyse the risk of adverse drought impacts in a particular area. Drought risk is defined as the probability of harmful consequences, or expected losses resulting from interactions between drought hazard (the possible future occurrence of drought hazard events); drought exposure (the total population, its livelihoods and assets in an area in which drought hazard events may occur); and drought vulnerability (the tendency of exposed factors to suffer negative impacts when drought hazard events occur) (Sharafi et al., 2020).
It is widely accepted that there are two types of risk assessments: static and dynamic (Hagenlocher et al., 2020; Wilhite et al., 2014). Dynamic drought risk assessments consider both the spatial and temporal aspects of droughts, using historic, periodically updated, and simulated data. Additionally, dynamic assessments incorporate not only hazard monitoring indicators, but also vulnerability and exposure indicators (Mosquera-Machado and Dilley, 2009). Most drought risk assessments that have been previously conducted on both the global scale, and specifically for PNG, have been static assessments (Hagenlocher et al., 2020). Static assessments provide an estimate of risk factors for a discrete moment in time and space, usually considering only one or two components of risk (e.g. only hazard) (Aerts et al., 2018; Hagenlocher et al., 2020). Dynamic assessments are recommended for use over static assessments as they provide a more holistic assessment of drought risk; drought risk is not static, but rather dynamic in both space and time (Hagenlocher et al., 2020).
The vitality of such dynamic drought risk assessments is demonstrated by Rahmati et al. (2020) in a study of drought risk in a vulnerable area of south-east Queensland, Australia. As a result of their study, Rahmati et al. (2020) provided recommendations detailing areas that are likely to experience adverse drought impacts, within which drought resilience should be improved. The drought risk assessment also had implications for utilising integrated geographic information system (GIS)-based mapping techniques to accurately map and visualise drought risk levels in an area to better inform drought preparedness. Integrated GIS-based mapping techniques for risk assessment include three key components: data integration into GIS, risk assessment tasks, and consideration of risk decision-making (Chen et al., 2003).
The first component, data integration into GIS, consists of data collection and assimilation onto a GIS platform and data transformation and standardisation. Fuzzy logic is a data transformation and standardisation technique increasingly recognised as useful in drought risk mapping (Dayal et al., 2018). As drought risk is dynamic, assessing and mitigating regional drought impacts is likely to involve some level of subjectivity as there are no standard criteria on mapping and quantifying drought risk. The application of fuzzy logic in GIS minimises the subjectivity in drought risk assessment, thus improving the efficiency of risk assessment as a tool for spatial decision-making (Dayal et al., 2018). Risk assessment tasks are then performed on the GIS platform, including individual hazard, vulnerability, and exposure assessments with accompanying mathematic calculations (Hagenlocher et al., 2019). The consideration of risk decision-making is incorporated through efficient data visualisation on GIS risk maps and appropriate dissemination of such products to decision-makers (Blauhut, 2020).
1.4 Validating drought risk assessments to ensure accuracy and usability of results
Drought risk assessments commonly lack adequate validation (Asare-Kyei et al., 2017; Blauhut, 2020). In a review of past risk assessment methodology, Hagenlocher et al. (2019) state that comprehensive validation “has proven to provide relevant information on the reliability, validity, and methodological robustness of risk assessments and their outcomes. However, its application in the field of risk assessment remains largely underdeveloped.”. Among the few studies seeking to validate a risk assessment methodology, including those seeking to validate an assessment solely focused on one component of risk like vulnerability, various validation techniques have emerged (González Tánago et al., 2016).
Validation through result comparison with historical data has been used in several studies (Wu and Wilhite, 2004); however the preciseness of this method has been criticised (Fekete, 2019). Molinari et al. (2019) state that there is “the need of higher quality data to perform validation and of benchmark solutions to be followed in different contexts, along with a greater involvement of end-users”. An alternative technique, incorporating the views of end-users as a “ground-truth” source, called participatory research is becoming increasingly utilised to validate drought monitoring outcomes, including risk assessment results. A ground-truth source provides information that is real or true, given by direct observation or measurement in the real world. For example, drought impact records for a particular event were provided by locals who experienced the event first-hand.
Participatory research is a technique which includes collaboration with stakeholders in a capacity building process as well as consideration of local peoples and expert observations into knowledge systems (Mckenna and Yakam, 2021; Fragaszy et al., 2020). Although participatory research is seen as a promising validation methodology, some past investigations using this method have employed an additional “ground-truth” source to strengthen validation adequacy (González Tánago et al., 2016). For example, Bijaber (2018) verified risk assessment results with historical on-the-ground precipitation and crop data at the national scale in Morocco, as well as the views of experts regarding what conditions were experienced during the study period.
In addition to validating risk assessment results, a statistical sensitivity analysis is also recommended as best practice for validating the selection of drought risk indicators informing the risk assessment (Hangelocher et al., 2019). Sensitivity analysis is used to determine how different values of an independent variable affect a particular dependent variable under a provided set of assumptions. Although recognised as a critical verification tool, previous drought risk assessment studies commonly exclude sensitivity analysis. In a review of past drought risk assessments, Hangelocher et al. (2019) determined that only 12 % of studies conducted a statistical sensitivity analysis, with only four studies employing both a validation of risk assessment outcomes against a ground-truth source and a sensitivity analysis.
In Pacific SIDS like PNG, data availability is scarce. Therefore, validation through comparison with historical independent data is unlikely to be credible. Overall, a strengthened validation methodology using multiple ground-truth sources, and an additional sensitivity analysis, seems most promising for future study of drought risk assessments in PNG.
1.5 Addressing drought risk assessment knowledge gaps in PNG
Generally, drought is insufficiently investigated on the global scale (Blauhut, 2020). Out of the few drought risk assessments previously conducted, most are lacking in effective methodological components (González Tánago et al., 2016). Blauhut (2020) recommends that future studies must “improve the characterisation of drought risks and its components” and “ascertain how this risk can be communicated… to enhance resilience to drought”. Hagenlocher et al. (2019) corroborate that there are major gaps in previous risk assessment methodologies, like a lack of tailored indicator selection.
Tailored drought risk assessment is specific for measuring drought risk in a particular area and produces information for a certain set of stakeholders. This can be achieved by selecting hazard, vulnerability, and exposure indices that specifically consider the climatic, socio-economic, and geographic characteristics of the area being assessed. Thus, generalised indicators would be omitted from the assessment. In recognising the importance of tailoring drought risk assessment through appropriate selection of indicators, Le et al. (2021) selected specific indicators for their agricultural drought risk assessment in Vietnam, based on three criteria: (i) indicators are relevant to agricultural sector; (ii) data for these indicators are quantitative and publicly available, and (iii) indicators are specific to Vietnam's socio-economic conditions.
Table 1An analysis of previous drought assessment studies in PNG outlining the methodological aspects lacking.
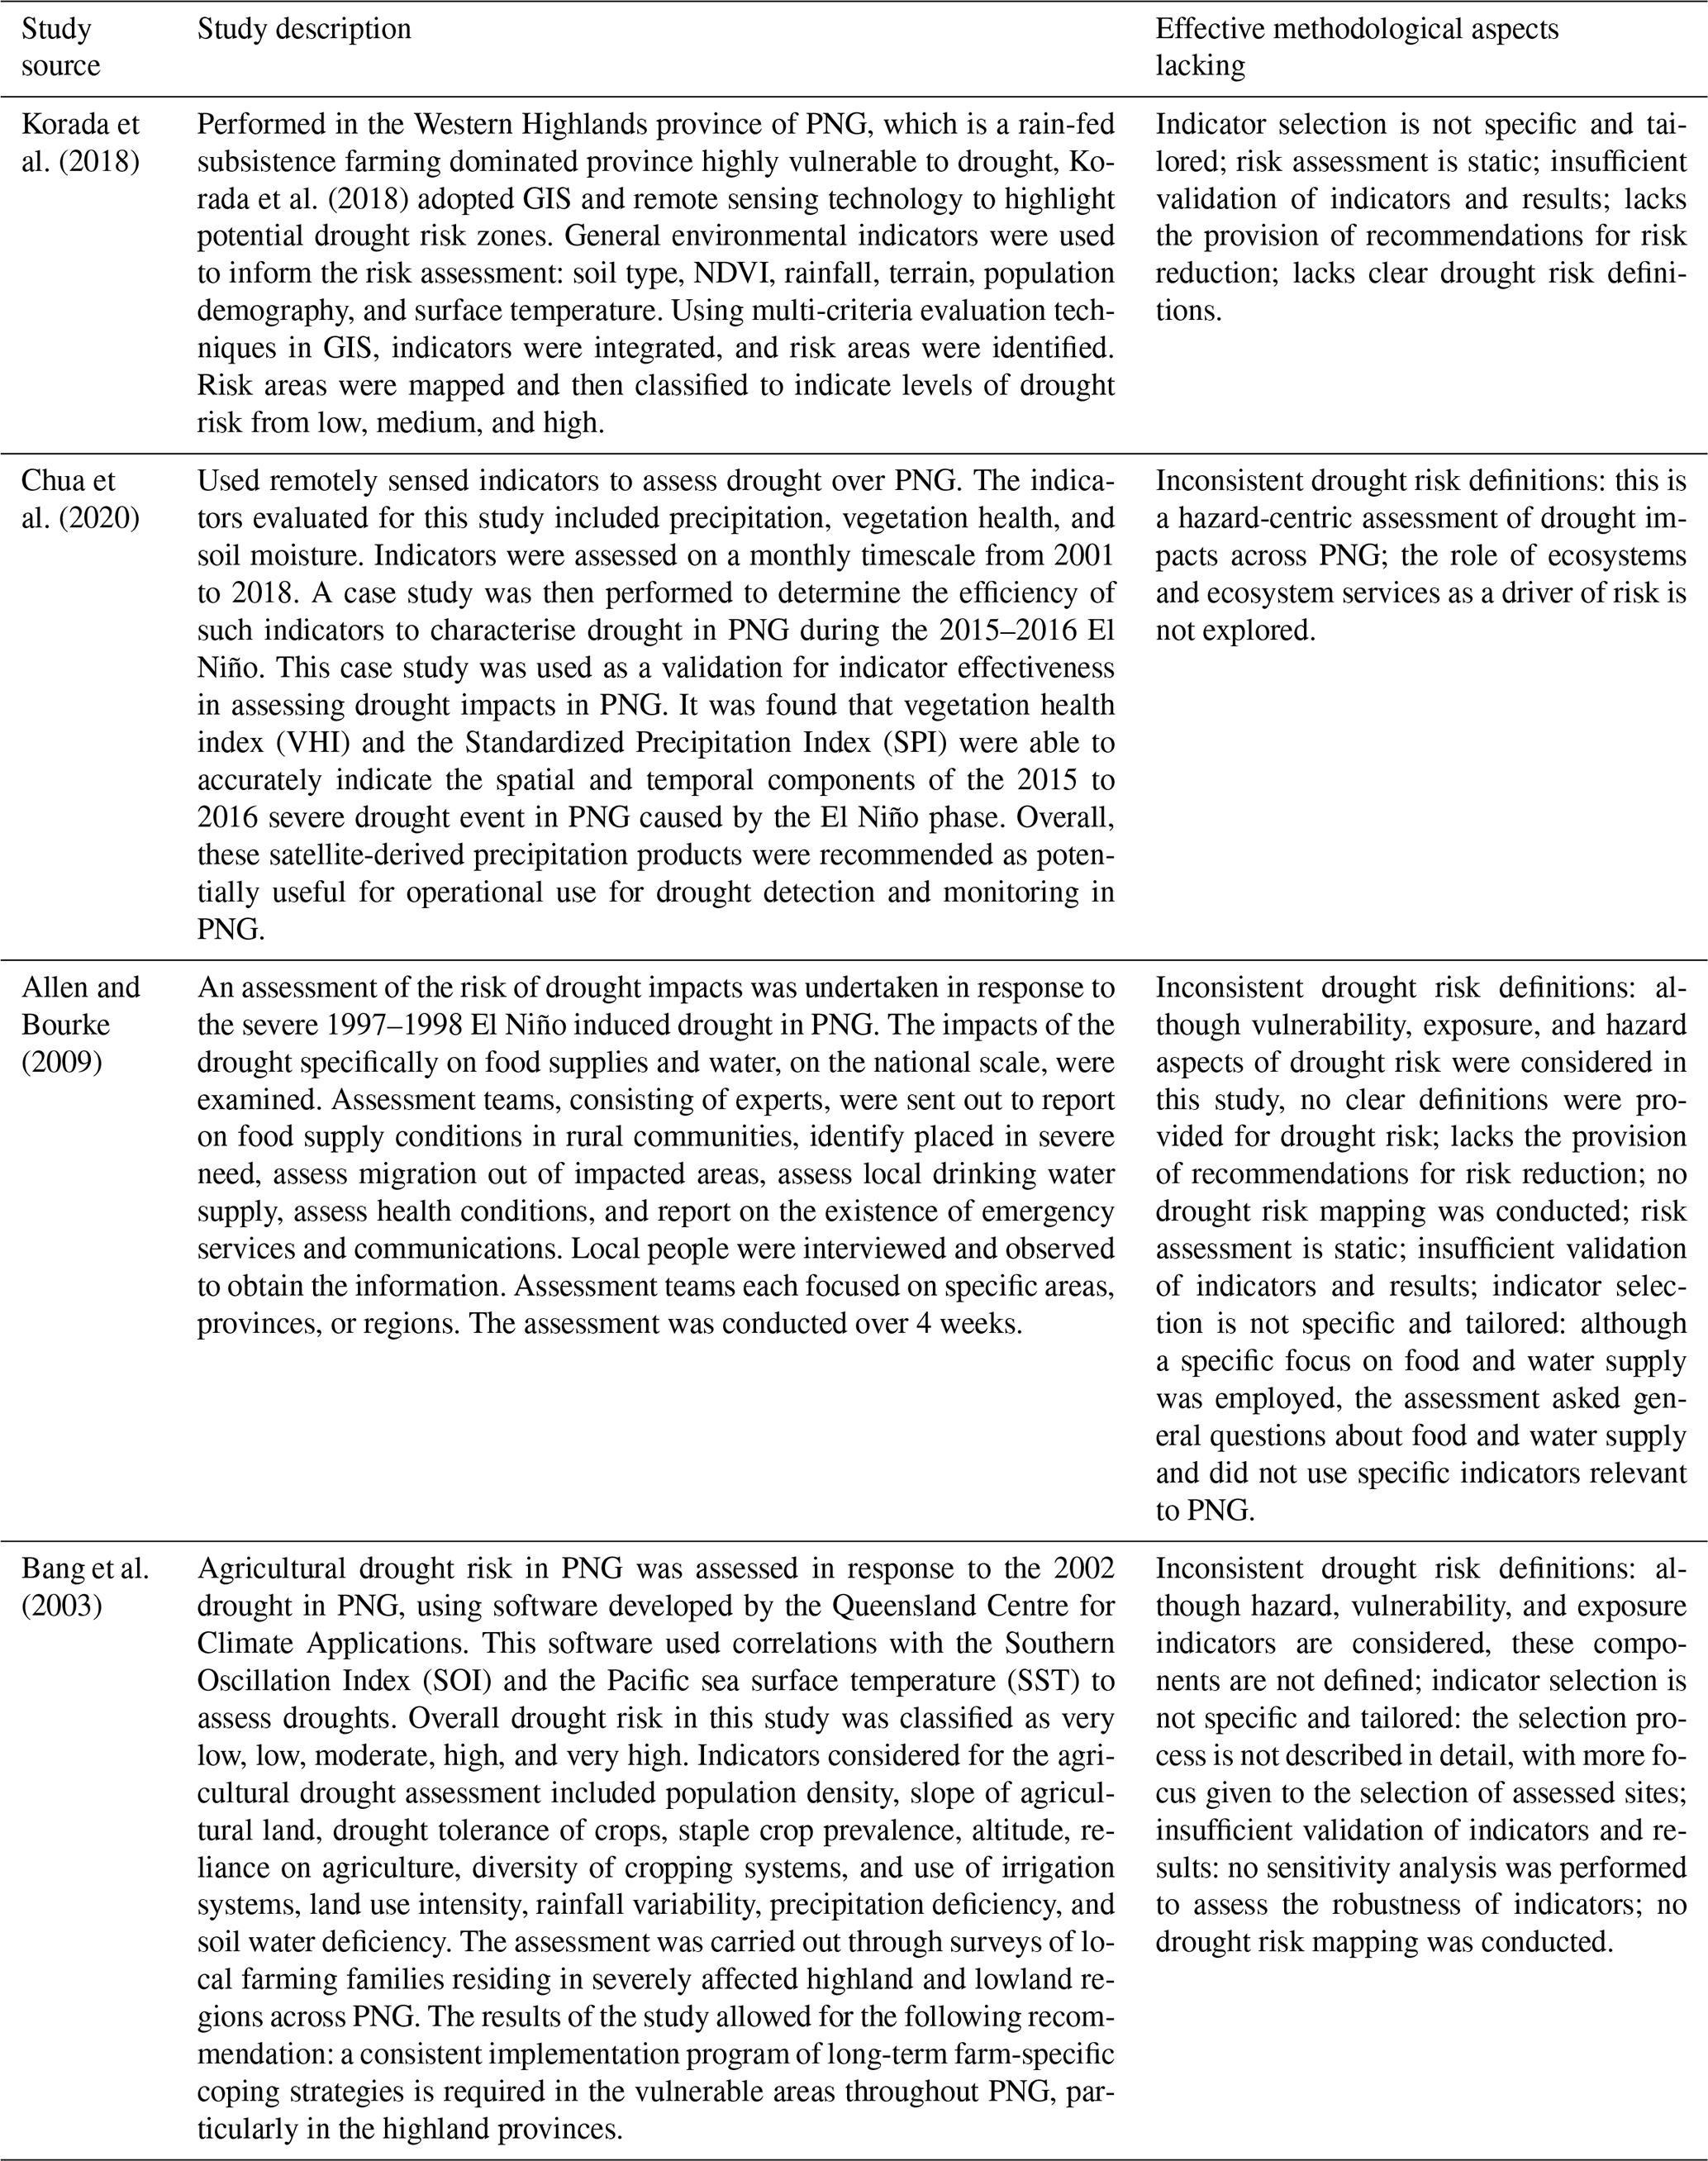
A scarce number of previous studies in PNG, assessing the risk of negative drought impacts, are commonly lacking in effective methodological aspects and do not address key knowledge gaps in drought risk assessment investigation. An analysis of previous drought assessment studies in PNG is provided in Table 1, and the methodological knowledge gaps are outlined. Overall, there is room for future investigation to develop a drought risk assessment to be utilised in PNG that incorporates the most effective methodological aspects, specifically considering the following: tailored and specific indicator selection; consistent drought risk definitions; dynamic rather than static assessment; sufficient validation of indicators and results; and the provision of recommendations for risk reduction.
Accordingly, this study will expand on previous research (Bhardwaj et al., 2021b; Kuleshov et al., 2020) with an aim to increase drought risk knowledge in PNG. Specifically, this research seeks to do the following:
-
demonstrate the potential for tailored drought risk assessments to accurately inform on drought risk levels before, during, and after a drought event and thus contribute to more resilient drought risk management in local areas, using drought in PNG as a case study.
-
develop an effective, dynamic drought risk assessment methodology utilising a GIS-integrated technique and space-based weather and climate extremes observations, conduct a unique and tailored, dynamic drought risk assessment for a retrospective period in PNG, and perform a comprehensive validation of the risk assessment results using literature records as a “ground-truth” source.
The development of the drought risk assessment is intended to aid the PNG National Weather Service (NWS) in informing local PNG stakeholders on which provinces are of highest concern and guide-resilient drought risk management practices within priority communities.
2.1 Study area: PNG
PNG has a population of approximately 8.8 million across its mainland and 600 islands, which have a total land area of 452 860 km2. The country consists of four major regions, within which the 22 provinces of PNG are divided (Fig. 3). The four major PNG regions and their provinces are as follows:
-
Highlands Region consists of Chimbu (Simbu), Eastern Highlands, Enga, Hela, Jiwaka, Southern Highlands, and Western Highlands.
-
New Guinea Islands Region consists of Bougainville, East New Britain, Manus, New Ireland, and West New Britain.
-
Momase Region consists of East Sepik, Madang, Morobe, and Sandaun (West Sepik).
-
Southern Region consists of Central, Gulf, Milne Bay, National Capital District, Oro (Northern), and Western.
PNG is largely mountainous, and much of it is covered with tropical rainforest. The climate of PNG can be described as tropical throughout; however each region of PNG experiences differences in seasonal climactic factors (Fig. 2) (Bhardwaj et al., 2021a). PNG society consists of traditional village-based life, dependent on subsistence and small cash-crop agriculture, as well as modern urban life in the main cities. Economic performance in PNG has historically been based on international prices for exports, fiscal policies, and construction activity. As of 2015, over 2 million Papua New Guineans were poor and/or facing hardship, particularly those based in rural areas (Pacific Islands Forum Secretariat, 2015). Agricultural occupation is consistently important for local livelihoods, with approximately 80 %–85 % of the rural population directly deriving their livelihood from farming (Pacific Islands Forum Secretariat, 2015).
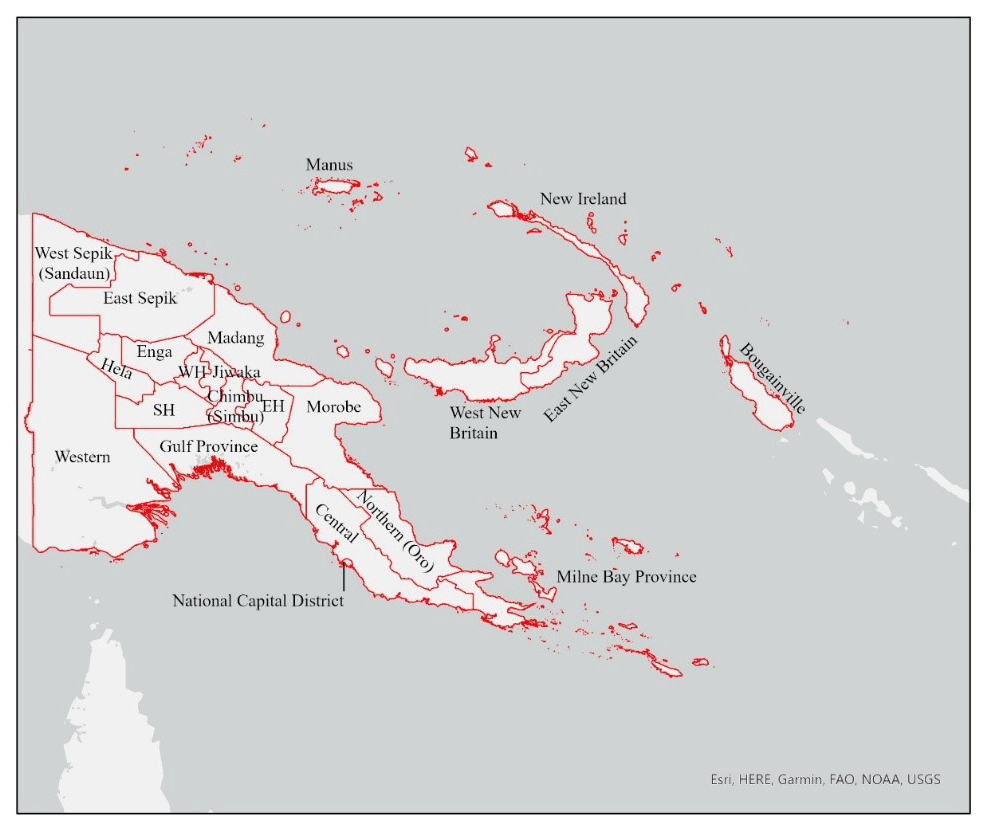
Figure 3PNG map indicating each of the 22 PNG provinces with shortened names for Eastern Highlands (EH), Southern Highlands (SH), and Western Highlands (WH). Map was produced using ArcGIS Pro with an open-source base map.
2.2 Study design
The methodology proposed here addresses the gaps identified in previous studies (Hagenlocher et al., 2019) to achieve a tailored and accurate risk assessment. Hazard, vulnerability, and exposure components are equally considered, and the spatial and temporal aspects of drought are investigated, using retrospective and periodically updated data. The assessment is deemed as semi-dynamic as it has a dynamic hazard component, which can be updated monthly and includes monitoring indicators with data on 3-month cumulative timescales, but also includes more semi-dynamic and static components of vulnerability and exposure, which are updated annually or in some cases (e.g. elevation) remain fixed.
This research is conducted on the provincial level within a 2014–2020 study period. The methodology for this study has four parts:
-
selection of tailored hazard, vulnerability, and exposure indicators appropriate for monitoring drought risk in PNG provinces;
-
calculation and GIS mapping of hazard, vulnerability, exposure, and drought risk indices for retrospective1 years (2014–2020) to determine the occurrence of drought events in PNG in the past;
-
validation of drought risk assessment accuracy through a comparison of the drought risk index results with literature detailing the drought conditions and impacts experienced on the ground at the time of each past PNG drought event;
-
implementation of a sensitivity analysis to enhance the evaluation and validity of the risk assessment.
2.2.1 Methodology: part 1
The risk index produced incorporates equal indices of hazard, vulnerability, and exposure; specific indicators were selected to contribute to these three indices. With drought hazard covering the possible occurrence of drought events in the future, exposure considering the total population, its livelihoods and assets in an area in which drought events occur, and drought vulnerability reflecting the tendency of exposed factors to suffer adverse impacts when a drought event occurs (Sharafi et al., 2020). These definitions remained clear throughout the assessment process, addressing the literature recommendation to consistently characterise drought risk as the risk of negative impacts as a function of three core components: hazard, exposure, and vulnerability (Hagenlocher et al., 2019).
Tailored risk indicators were selected for monitoring drought risk in PNG on the provincial scale, based on the following criteria adapted from Le et al. (2021): (i) indicators are relevant to one or more of the three most drought impacted sectors in PNG (economic sector, agricultural sector, and health sector), (ii) data for these indicators are quantitative and publicly available, and (iii) hazard indicators are highly specific to PNG's climactic conditions, and the vulnerability and exposure indicators are highly specific to PNG's socioeconomic and geographic conditions. An analysis of indicator selection in earlier studies of characteristically similar areas to the 22 provinces of PNG was used to measure the suitability of potential indicators for this study against the selection criteria described above. PNG NWS advice was also sought to approve indicator selection for this study. Additionally, hazard indicators were assessed against recommendations made by WMO in their Handbook of Drought Indicators and Indices (Svoboda and Fuchs, 2016).
Table 2Hazard, vulnerability, and exposure indicators selected for the PNG drought risk assessment. The data source, data resolution and coverage, and weighting for each indicator are included.

∗ As there are limited data for direct indicators of accessibility in terms of road accessibility and health service accessibility, population density has been used as an indirect indicator for accessibility as it is associated with the accessibility level for each province; provinces with low population densities have more rural communities which are expected to have reduced accessibility to infrastructure (e.g. roads) and health services compared to urban communities.
Table 2 displays the chosen hazard, vulnerability, and exposure indicators, indicator data sources, data resolution for each indicator, and the weight applied to each indicator. The reasoning behind the selection of each of these indicators is described in tables that are included in the Supplement. Other potential indicators and the reasons why they were omitted from this study are also described in tables in the Supplement.
Table 3Indicator thresholds that signal different stages of drought risk. These thresholds have been decided upon based on use in past studies (Rahmati et al., 2020; Nasrollahi et al., 2018; Aitkenhead et al., 2021), the advice of the PNG National Weather Service, as well as past data trends in PNG (Chua et al., 2020).

It is important to note the following:
-
All types of droughts were considered when selecting indicators (Supplement), as well as all major sectors across PNG provinces. This was done to provide a holistic risk index for PNG provinces, as each type of drought is known to impact PNG communities (Kuleshov et al., 2020), and each major sector experiencing the effects (Bhardwaj et al., 2021b). However, it was particularly difficult to find indicators suitable for the study context that inform on hydrological drought. Thus, this drought type could not be examined in the PNG drought risk assessment.
-
Publicly accessible data were only available for certain indicators as data availability is poor in PNG (all indicators ultimately selected for use in the risk assessment had publicly accessible data available); thus indicators which could have been more appropriate for use in hindsight had to be omitted. For example, average household consumption of staple food could have been a useful vulnerability indicator, particularly informing on food insecurity. However, data availability was too scarce across PNG for it to be included in the risk assessment (Supplement).
-
Indicator data were only available at certain spatial resolutions. Because of this, a standard spatial resolution was chosen for the recording of data; data were recorded at the provincial level.
-
Space-based monitoring products were used when gathering data for hazard indicators to ensure accuracy. There is a commonly recognised need to increase the utilisation of monitoring of climate extremes from space in disaster risk investigations (Kuleshov et al., 2019; Blauhut, 2020).
Each of the selected hazard, vulnerability, and exposure indicators has varying thresholds for signalling levels of drought risk. Table 3 provides accepted thresholds, outlined by several other studies (Rahmati et al., 2020; Nasrollahi et al., 2018; Aitkenhead et al., 2021), the advice of the PNG National Weather Service, as well as past data trends in PNG (Chua et al., 2020), for each indicator in which “no to mild drought risk”, “moderate drought risk”, or “severe to extreme drought risk” is likely signalled. These thresholds have been determined through an investigation of literature regarding each indicator. For example, SPI and VHI thresholds were decided upon using guidance from Chua et al. (2020). These thresholds are provided as an insight into the general signals given by ranges of values in the indicator data. They were not used further in any calculations.
2.2.2 Methodology: part 2
Data for hazard, vulnerability, and exposure conditions, in each of the 22 PNG provinces within the 2014–2020 study period in PNG, were used to develop a yearly risk index for each year investigated to determine whether it is suspected that a drought event(s) occurred. In this research, we consider a drought event as the occurrence of drought hazard conditions with associated impacts. Integrated-GIS methodology for mapping was used to display yearly risk levels for 2014–2020, on the provincial scale across PNG. Monthly risk indices were also produced for November and December in 2014, January to December of 2015, and November and December in 2016. The monthly results formed a case study of PNG's transition into and out of drought in the strong El Niño year of 2015.
To calculate the hazard, vulnerability, and exposure indices, indicator data were first reclassified by a linear function (using the rescale by function tool in ArcGIS Pro) on a 1–10 scale and then standardised using fuzzy logic in ArcGIS Pro (Environmental Systems Research Institute (Esri) Inc., 2019). Fuzzy logic is processed in ArcGIS Pro through the fuzzy function, which requires the assignment of fuzzy membership classes to data (Eq. 1).
where μA(x) refers to the grade of membership for element x in a fuzzy set A, and the X is the universal set.
Prior to the performance of the fuzzy function, fuzzy membership classes were assigned to each indicator, describing the relationship between it and drought risk as recommended in Rahmati et al. (2020) and Aitkenhead et al. (2021). Two classes of fuzzy membership were assigned in this study: fuzzy small2 and fuzzy large3. Fuzzy values scaled between 0–1 based on the possibility of the indicator data contributing to drought risk, where 0 was assigned to values unlikely to contribute to drought risk, and 1 was assigned to values most likely to contribute.
In fuzzy large, larger inputs have membership values closer to 1. This function is defined by a midpoint value that can be left as a default or manually adjusted to suit specific datasets, which is assigned a membership of 0.5. Equation (2) gives the mathematical expression for fuzzy large membership.
where f1 is the spread and f2 is the assigned midpoint.
In fuzzy small, smaller inputs have membership values closer to 1. Like fuzzy large, it is defined by a either a default or manually assigned midpoint that is given a membership value of 0.5. Equation (3) gives the mathematical expression for fuzzy small membership.
The default midpoint was not used when performing the fuzzy function; the midpoint used for each indicator was based on the mean value in the historical records for indicator data (historical records meaning all available past data; this differs for each indicator. For example, SPI data are available from 2001 onwards.). This ensured that the data were standardised on both a spatial and temporal scale.
The indicator fuzzy values for each year were mapped on the provincial scale as yearly raster layers in ArcGIS Pro4. Thus, a 2014, 2015, 2016, 2017, 2018, 2019, and 2020 standardised raster layer was mapped on the provincial scale for each of the 10 indicators. This was also done for the months investigated as part of the 2015 case study. After standardising indicator data, numerical weights were assigned by researchers to each indicator based on an expert weighting scheme informed by past studies and advice from the PNG NWS. The weights assigned reflected the relative importance and contribution of each indicator to the specific index it informs. This weighting scheme was on a 0–1 scale, with 0 indicating no probable contribution to the relative index and 1 being total probable contribution to the relative index (Frischen et al., 2020). The weights assigned to each hazard, vulnerability, and exposure indicator are shown in Table 2.
By applying weights to indicators, the potential effect of anomalies in individual indicator data is reduced. For example, hazard data anomalies are expected as there is commonly a lag between dry signals from SPI and VHI. The effects of dry conditions recorded in SPI are commonly seen leading up to and during a drought event, whereas the vegetative effects recorded by VHI can sometimes lag and can only become evident once a drought event has commenced (Zhao et al., 2022). Additionally, VHI primarily signals only agricultural drought, whereas SPI is a meteorological drought hazard indicator which can be linked to the impacts of multiple drought types (not only meteorological but also hydrological and agricultural). So, in a holistic drought risk assessment aiming to encompass all forms of drought, as in this study, SPI could be weighted more.
The vulnerability, hazard, and exposure indices were calculated for each province, and spatial maps of the area covering the 22 provinces of PNG (representing vulnerability, exposure, and hazard per unit area) were produced, through the raster calculator in ArcGIS Pro using Eqs. (4), (5), and (6) (Dayal et al., 2018). Vulnerability, hazard, and exposure indices were calculated for each year and month under investigation.
where HI is the hazard index; VI is the vulnerability index; EI is the exposure index; n is the number of hazards, vulnerability, or exposure indicators; refers to the standardised indicators; and wi refers to the respective indicator weight.
The final drought risk index value for each PNG province was then determined and mapped through the integration of the drought vulnerability, hazard, and exposure index maps using the fuzzy gamma overlay function (using a gamma of 0.75) in ArcGIS Pro. The mathematical expression for this function is given in Eq. (7) (Dayal et al., 2018).
where μgamma is the calculated fuzzy membership function, γ is a parameter chosen between 0 and 1; μsum is the fuzzy algebraic SUM and μproduct is the fuzzy algebraic PRODUCT that is mathematically expressed in Eqs. (8) and (9) respectively (Dayal et al., 2018).
where μi is the fuzzy membership for the map, and i equals the number of maps to be combined. In the fuzzy gamma operation, γ = 0 is equivalent to the fuzzy product and γ = 1 is equivalent to fuzzy sum.
Once a final drought risk map was produced for each year and month under investigation, the extent of drought risk displayed was classified into five levels: very mild (0.01 to 0.20 index values), mild (0.21 to 0.40 index values), moderate (0.41 to 0.60 index values), severe (0.61 to 0.80 index values), and extreme (0.81 to 1.00 index values). These classifications are commonly used in drought risk assessments (Dayal et al., 2018; Frischen et al., 2020).
Table 4Risk level pattern observed to determine whether a drought event was suspected as occurring throughout each PNG region. n/a – not applicable.
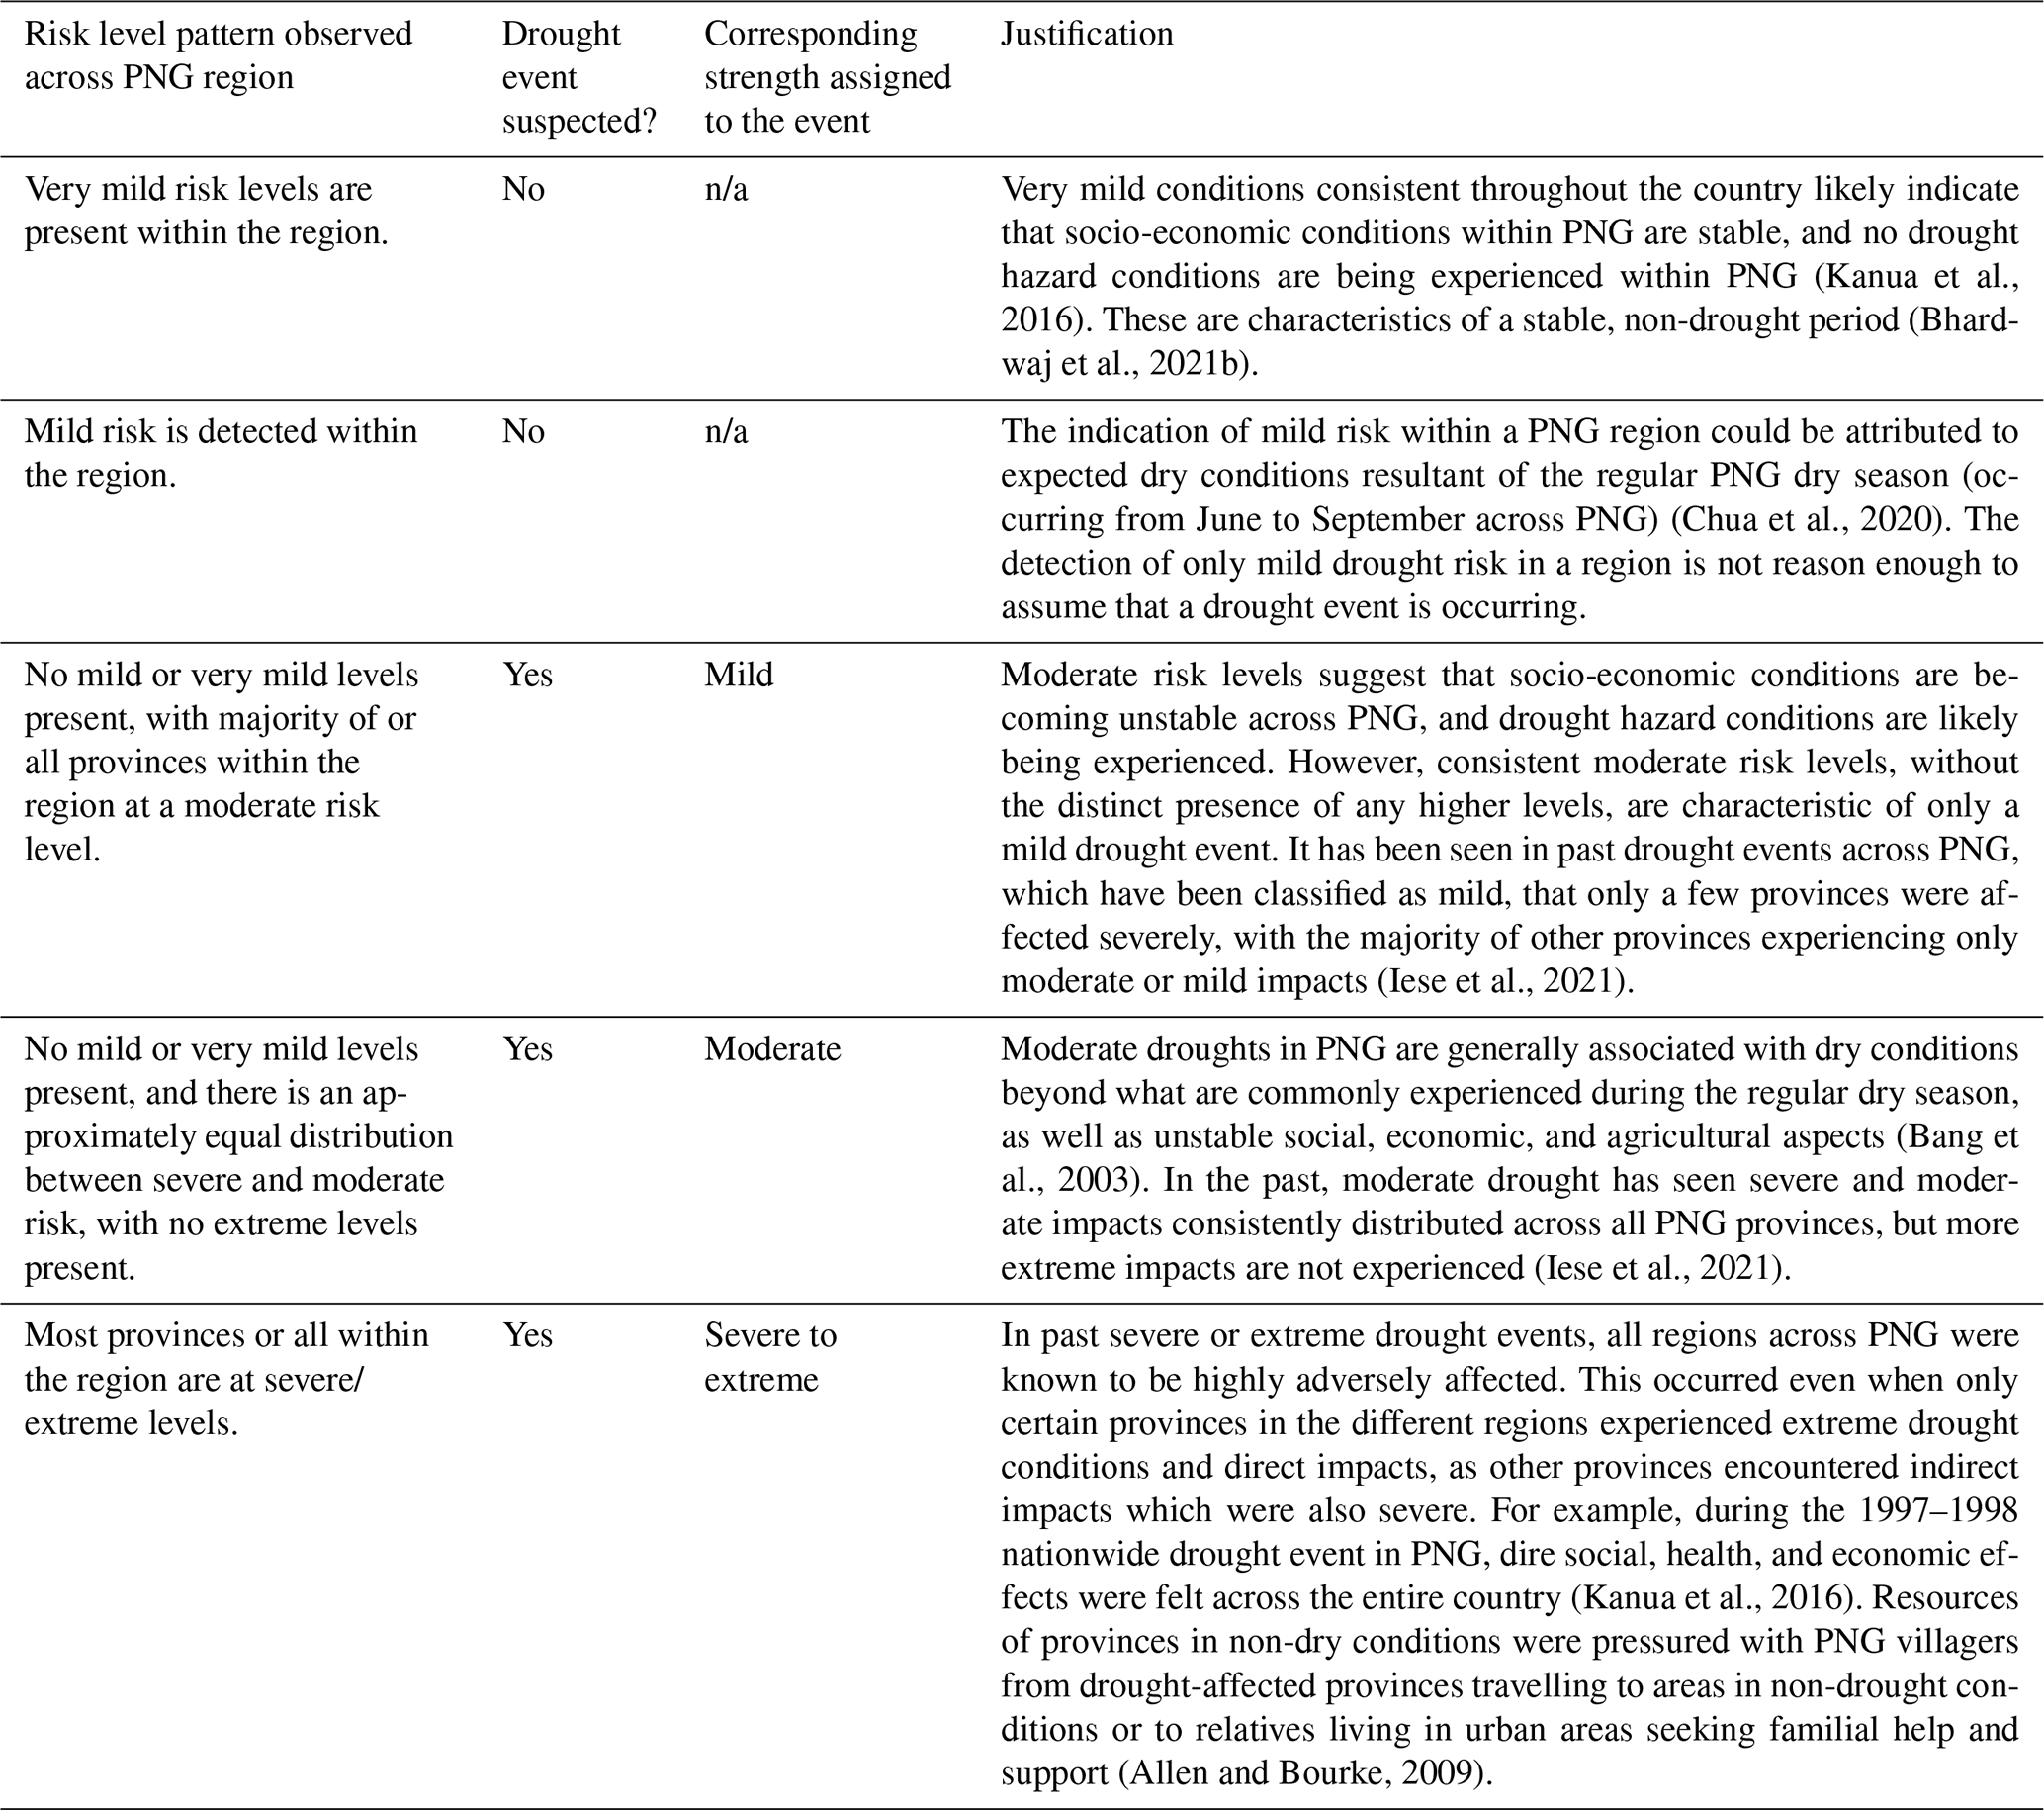
Through observation of the produced drought risk maps, the years in which a nationwide drought event was suspected in PNG were determined. Since PNG is a highly variable nation (in both climatic and geographic characteristics), it is hard to stipulate that drought is occurring as a nationwide event if a handful of scattered provinces are at high risk; it is more suitable to consider drought risk across each of the four regions of PNG. Table 4 outlines the decision rules for when a regional drought event was suspected within the four regions of PNG. Three severity levels were used to classify the strength of the events indicated: mild, moderate, and severe to extreme. The strength of each identified drought event was determined based on the risk level pattern observed across PNG overall. As recognised in the literature describing past drought events across PNG (Bhardwaj et al., 2021b; Bang and Crimp, 2019), if half of the regions in PNG (two out of four) are deemed to be experiencing drought, then a mild to moderate nationwide drought event is likely to be occurring (mild or moderate depending on the severity of risk levels observed in the drought-suspected regions). If the majority or all the regions are suspected to be in drought, then a severe to extreme nationwide drought event is likely to be occurring (severe or extreme depending on the severity of risk levels observed in the drought-suspected regions) (Kanua et al., 2016).
2.2.3 Methodology: part 3
Risk level accuracy was validated through comparison with documented records of observed impacts during the study period as a ground-truth source. Literature sources on this topic were analysed for the period of 2014–2020 to determine when drought events were recorded. The events recorded in the literature were compared to those identified by the risk assessment. The events identified by both the literature and risk assessment were further analysed by comparing the severity of each event indicated by the risk assessment and the severity described in the literature. As in the events identified by the risk assessment, three severity levels were used to classify the strength of the events indicated in the literature: mild, moderate, and severe to extreme. Table 5 displays the information used to formalise the link between impacts reported by literature sources and the three severity classes.
Table 5Information on the types of impacts associated with the three severity classes used to classify drought severity in the literature. Adapted from Allen and Bourke (2009).
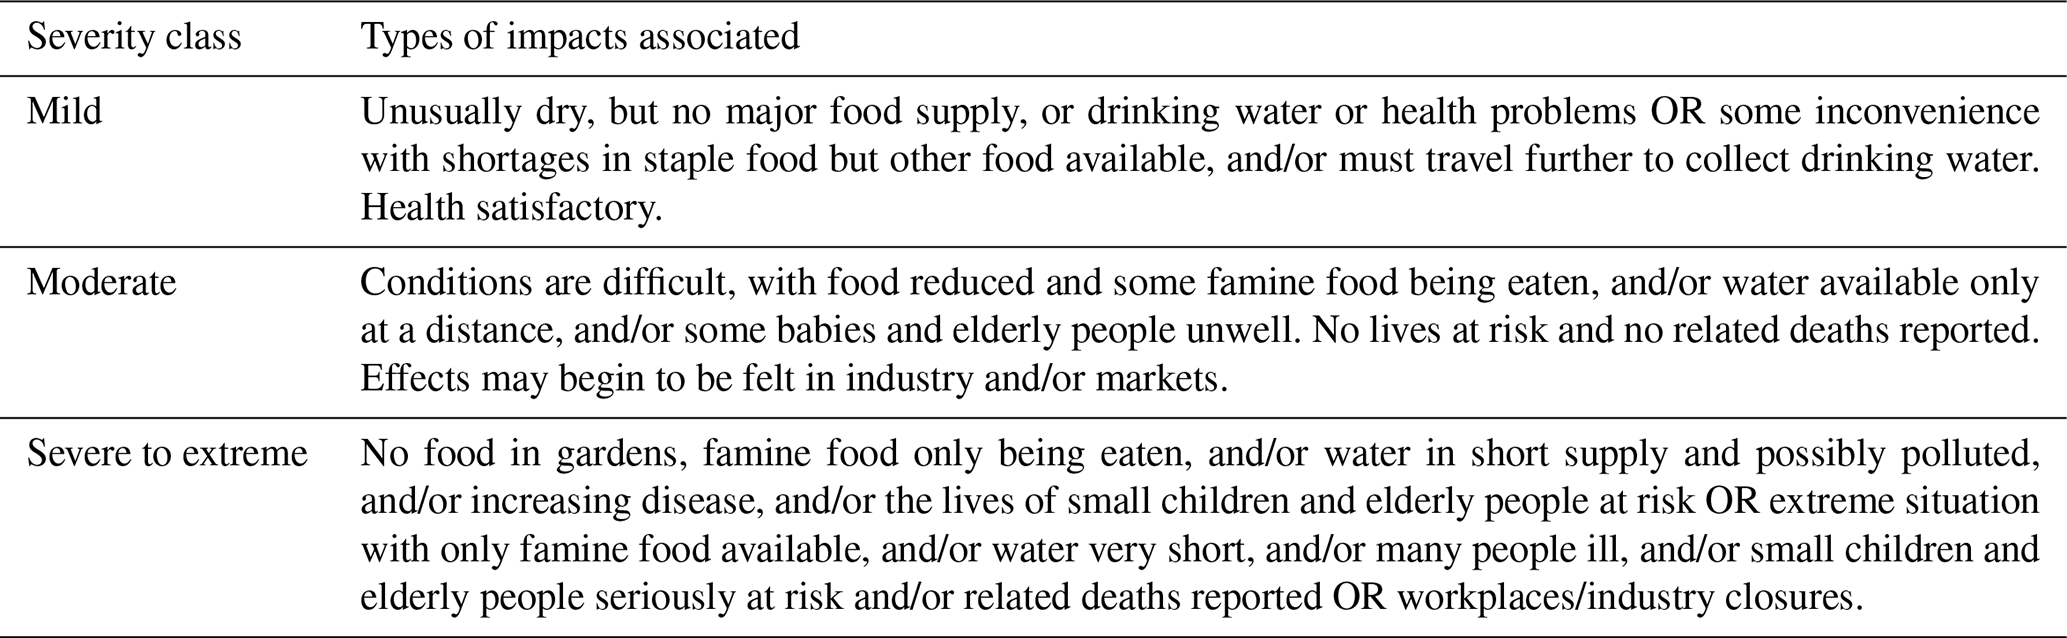
Table 6Inclusion and exclusion criteria for the selection of literature sources to be used in the risk assessment validation.
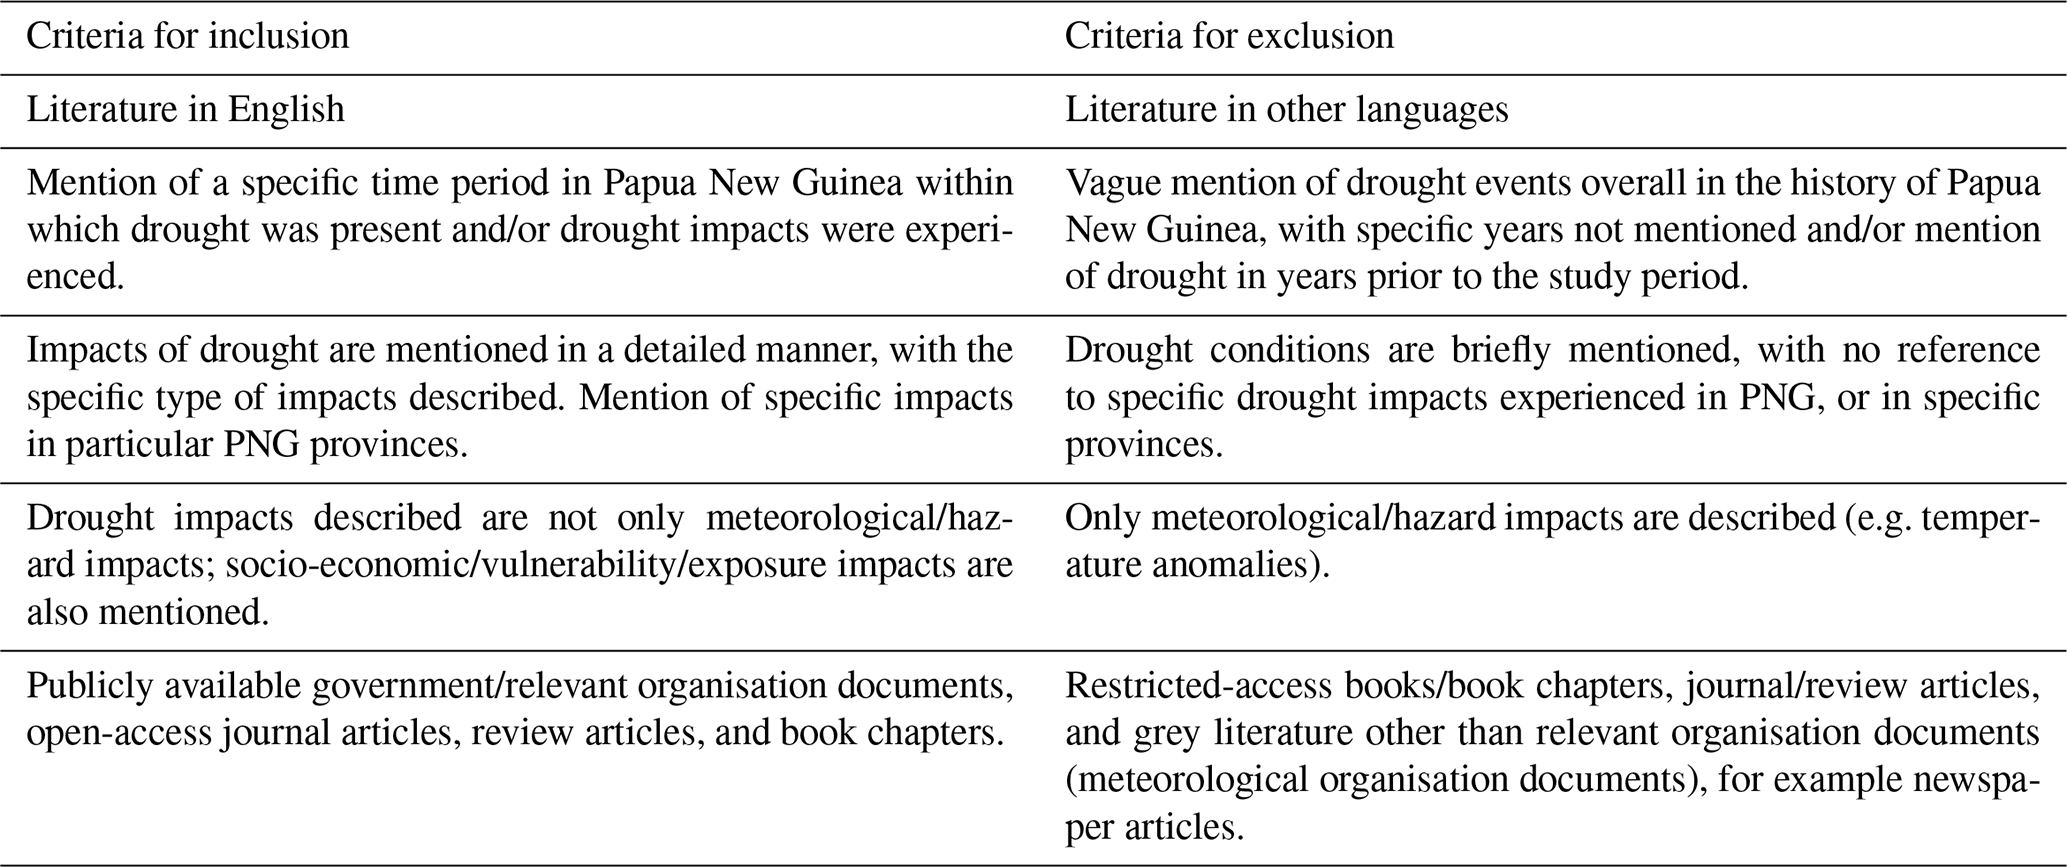
Table 7Search parameters used to gather literature sources for the risk assessment validation.
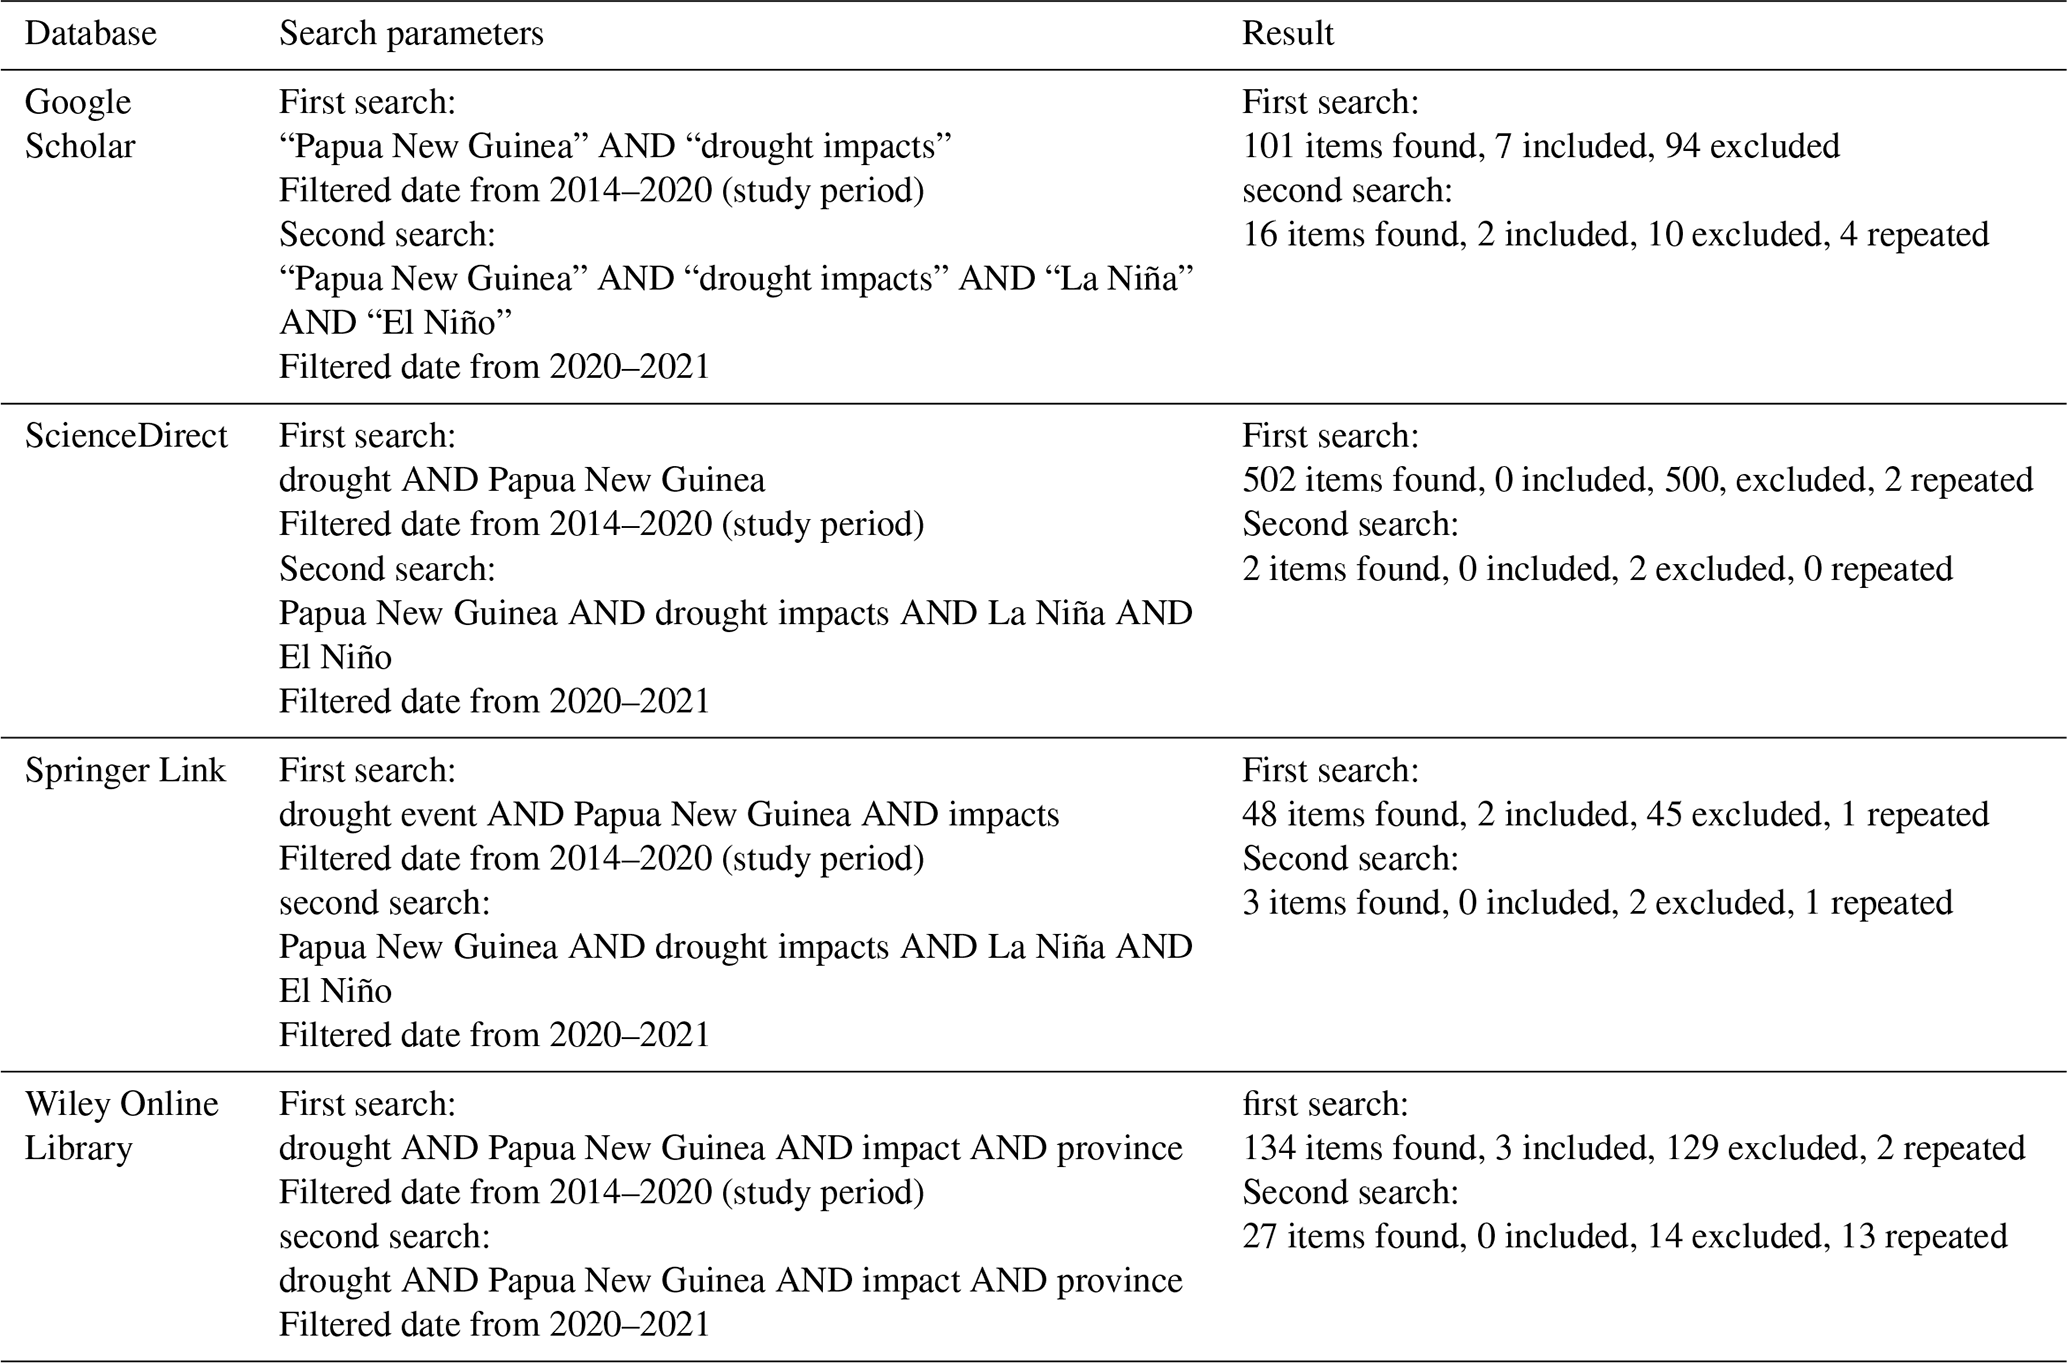
A literature search was undertaken to gather appropriate sources for analysis. Criteria for the inclusion and exclusion of sources were developed, guided by similar past studies (González Tánago et al., 2016) and the requirements of this study. Table 6 displays the criteria used to select sources for this study. The search parameters used to gather the sources are listed in Table 7. Overall a total of 13 sources (Annamalai et al., 2015; Whitfield et al., 2019; Bonnafous et al., 2017; Broughton, 2017; Allan et al., 2019; De Deckker, 2016; Schmidt et al., 2021; Burivalova et al., 2017; Bhardwaj et al., 2021b; Johnson et al., 2019; Bang and Crimp, 2019; World Food Programme, 2019; Mckenna and Yakam, 2021) were included in the literature investigation (Table 8). Each of the 13 sources was analysed, and the following information was recorded: the time of drought mentioned, the severity of drought mentioned, and the types of drought impacts mentioned. The specific provinces mentioned, and the severity of impacts described for such provinces, were also recorded.
Table 8Literature sources used as a ground truth. The source is listed and described with the types of impacts listed in the sources recorded.

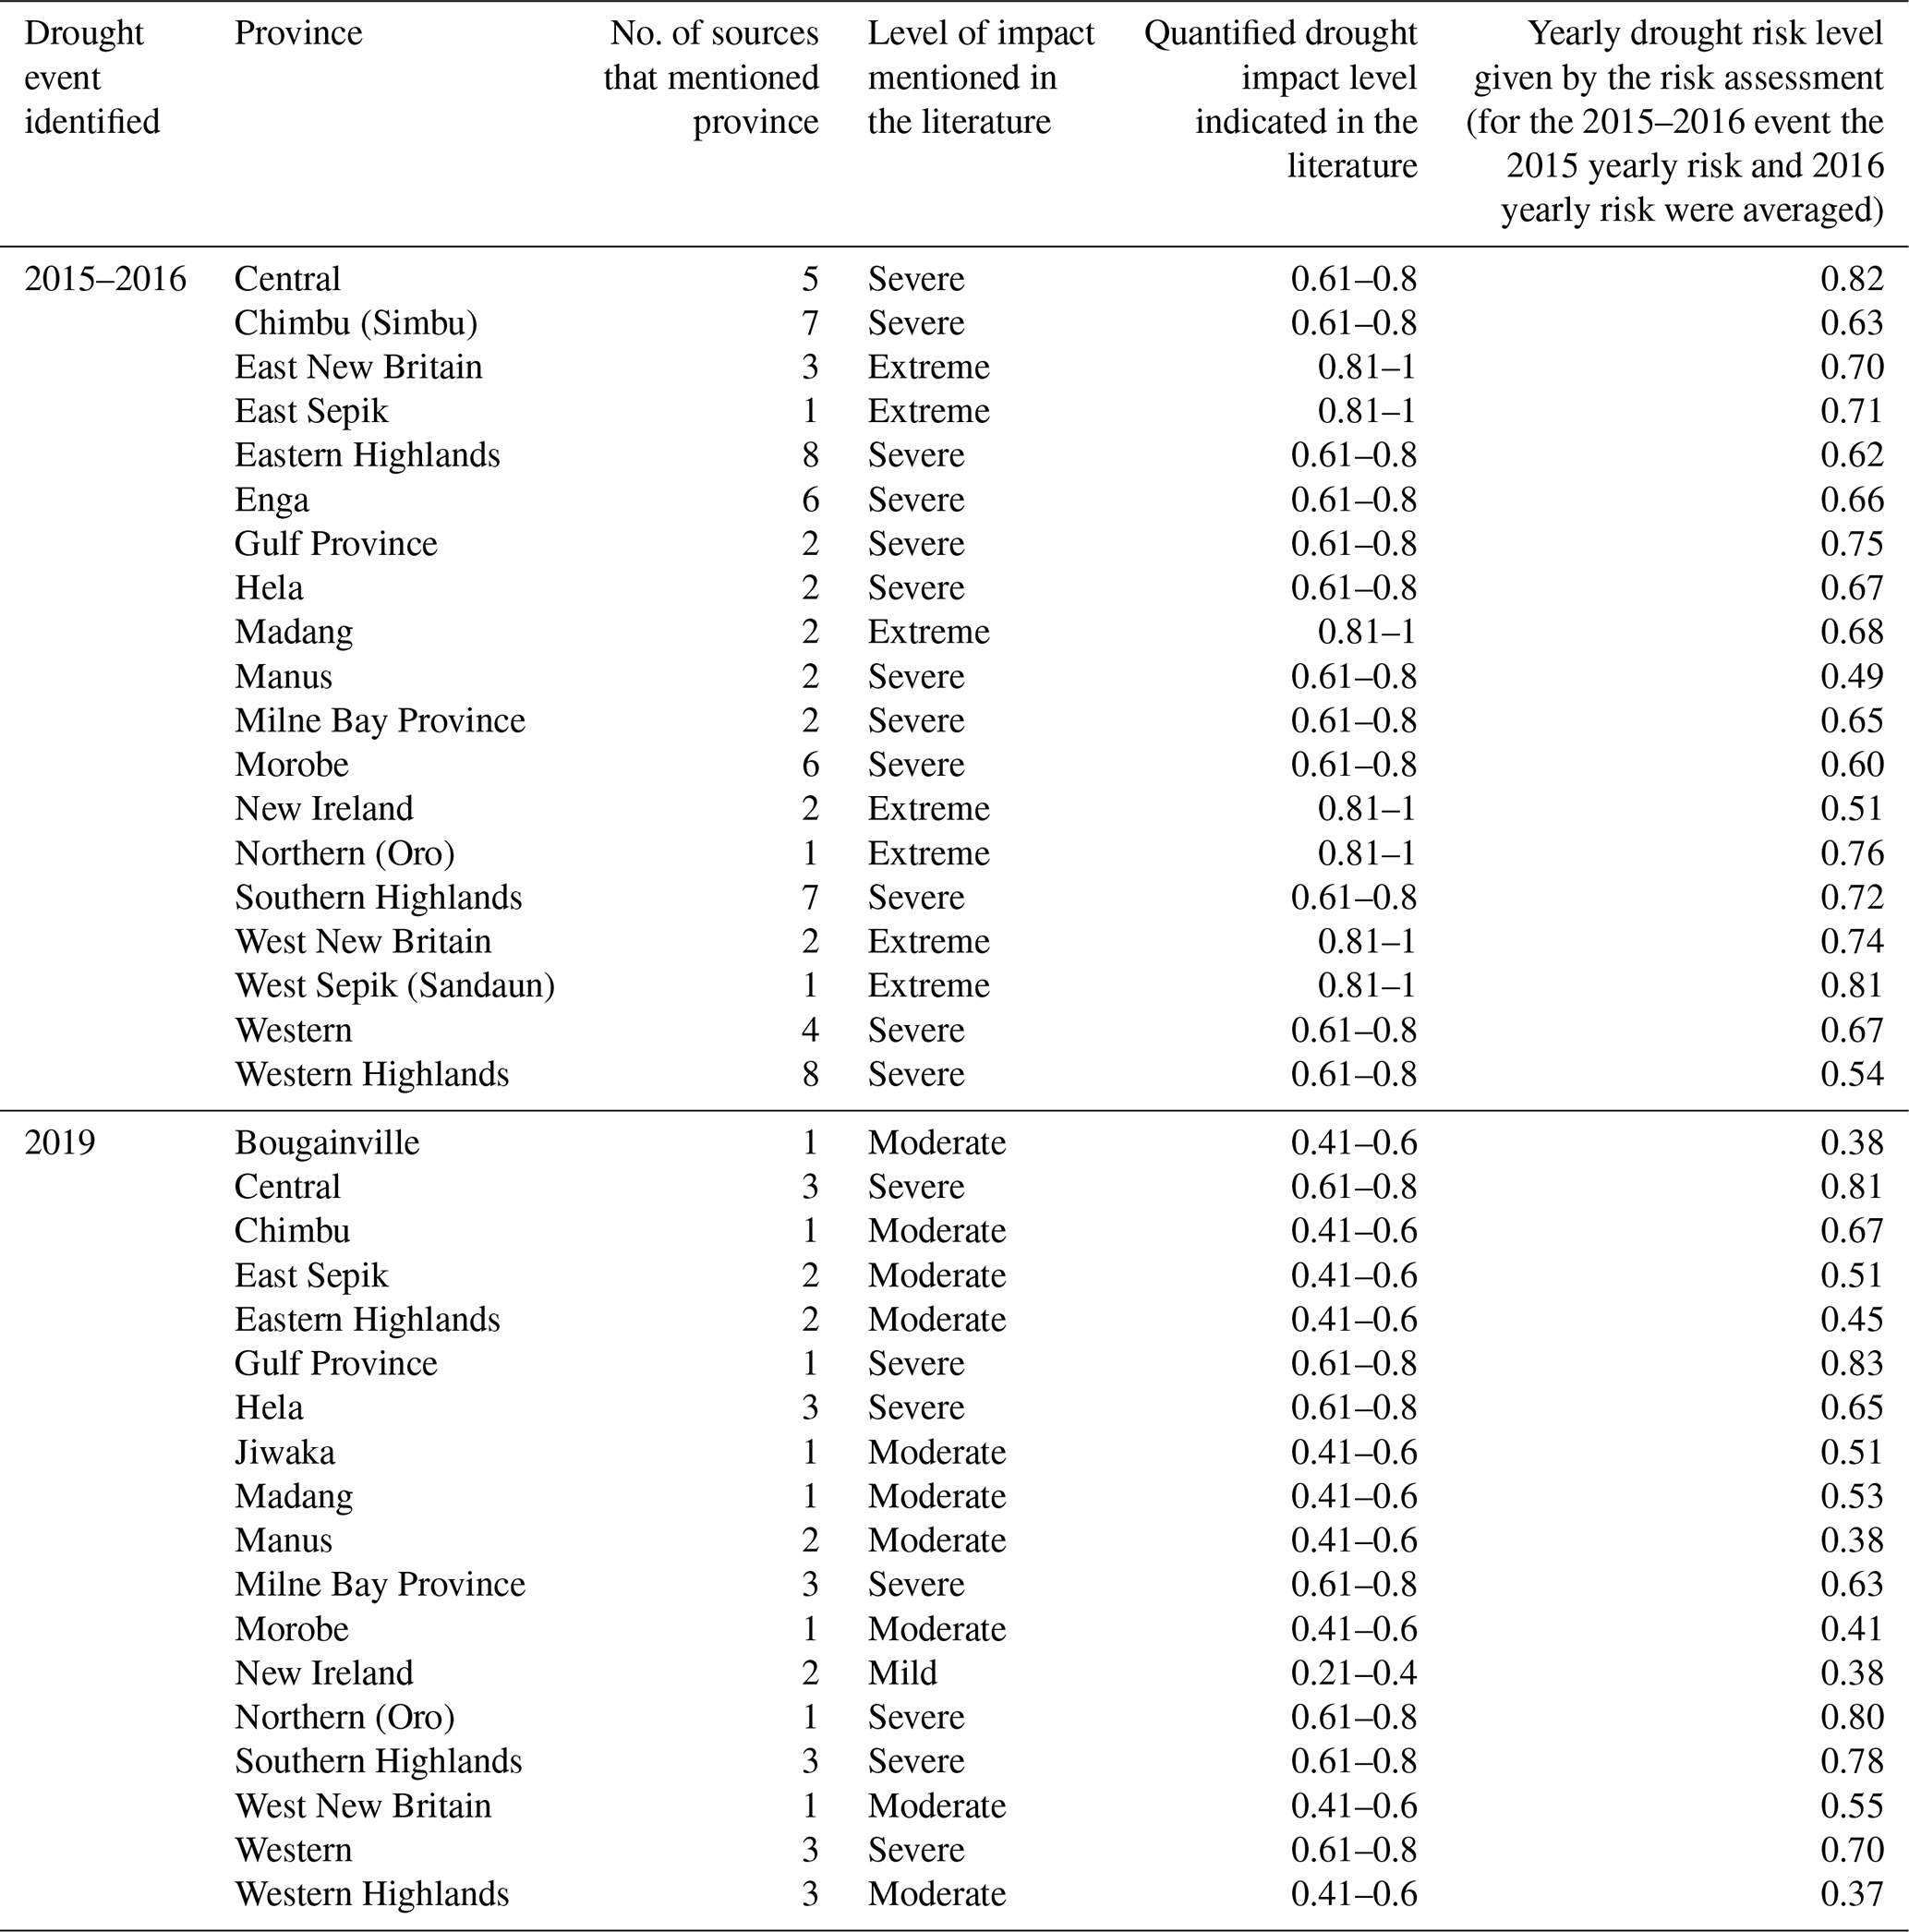
Table 9Individual PNG province mentions in the literature for each drought event as well as the severity level indicated for each province in the literature. Note that not all 22 provinces were mentioned.
To determine if there were significant differences between the severity level for each identified drought event, indicated by the risk assessment compared to literature, two types of statistical test were performed: F test and t test5. These tests were conducted for each drought event identified by the assessment and literature. The F test was firstly conducted to determine whether there were equal variances between the provincial risk levels displayed in the risk assessment, and the impact levels noted for provinces in the literature, for each drought event identified (Table 9). The F value (test statistic), degrees of freedom and the two-tailed p value indicating the level of marginal significance within the test were recorded. Student's t test (assuming equal or unequal variances depending on F-test results) was then conducted to determine the significance of difference between the drought risk levels indicated by the assessment and the impact levels indicated in the literature (Table 9). The t value (test statistic), degrees of freedom, and the two-tailed p value were recorded. The main factor being tested for was if a difference existed between the risk-assessment-given risk levels and the literature-given risk levels. As this is non-specific, a two-tailed p value is deemed appropriate for use (Peskun, 2020). Test assumptions were checked by plotting the data distribution on boxplots. All assumptions were met; thus the tests proceeded. All statistical tests used α = 0.05.
2.2.4 Methodology: part 4
Sensitivity analysis provides insight into how uncertainty in a model's output (in this case the hazard, vulnerability, or exposure index) can be attributed to different sources of uncertainty in the model input (in this case the individual indicators) (González Tánago et al., 2016). A sensitivity analysis was conducted for the risk assessment to determine how sensitive the indices were to changes in indicator values. The analysis results were used to identify priority needs for revising the weighting of indicators, to ensure that the most robust indicators are given the most merit in index calculations. The 2015 year was used as a case study for the sensitivity analysis, as it was the most critical drought year indicated by the risk assessment and identified in the literature. It was deemed that this year would be representative of how the risk assessment would perform in a drought event.
The sensitivity analysis performed was a one-way analysis. As such, one input parameter (indicator) used in the calculation of an output (hazard, vulnerability, or exposure index) was varied individually to assess the impact that it would enact upon the output. For example, the sensitivity of the hazard index to changes in SPI was analysed separately to the sensitivity of the hazard index to changes in VHI. Conducting the sensitivity analysis, the value of each indicator in question was changed in a stepwise manner from 0.1 to 1 with 0.1 increment and outputs for the relevant index (hazard, vulnerability, or exposure) were tabulated; data tables were produced using Microsoft Excel with the “What-If Analysis” function. An example data table is included in Appendix A. The output values were then used to calculate the sensitivity index (SI), indicating the sensitivity of the index in question to the individual indicator in question, following Eq. (10) (adapted from Farok and Homayouni, 2018).
where Dmax is the output result (hazard, vulnerability, or exposure value) when the indicator value in question is set at its maximum value and Dmin is the result for the minimum indicator value. A high SI means high sensitivity, vice versa, with “sensitivity” meaning the magnitude of the index reaction to changes in indicator data.
This process was repeated for all provinces, meaning an SI was produced for each of the 10 indicators used in this study, for each of the 22 provinces investigated. Provincial SIs were averaged to determine an overall SI for each indicator. The higher the indicator SI is, the more sensitive the relative index is to that indicator. The average SI value was used to rank each indicator in terms of sensitivity (first being the most sensitive) in each of the three indices. As it is known that indices comprising of indicators with a high sensitivity index (SI) have a likely reduced robustness, a credibility rank was able to be given to each indicator, based on the sensitivity results (first being the most credible for inclusion in the index) (Anand et al., 2019).
3.1 Comparison of drought risk assessment results and literature findings
Through observing the risk assessment results it was determined that, in 2014, the Highlands Region and New Guinea Islands Region was not suspected of experiencing a drought event. The Momase and Southern regions were both suspected as experiencing drought (severe to extreme drought and moderate drought respectively). As two out of four regions in PNG were indicated as experiencing drought in 2014, it was concluded that a drought event was suspected to be occurring during this time. The strength of the event was determined to be moderate, based off the risk level pattern observed across PNG (Fig. 4). The risk level pattern displayed across PNG was a result of the hazard, vulnerability, and exposure levels. In 2014, high hazard and vulnerability levels were evident across the Momase Region and Southern Region. Exposure levels were high throughout all regions, except for the New Guinea Islands Region (Figs. 4 and 5). In the literature investigation, only 15 % of sources mentioned 2014 as a drought year in PNG (Table 8). The sources that did mention drought impacts throughout 2014 (Allan et al., 2019; Burivalova et al., 2017) deemed such impacts to be severe to extreme. As less than a quarter of sources mentioned 2014 as a drought year, there is insufficient evidence to corroborate the drought risk assessment results to deem 2014 a drought year.
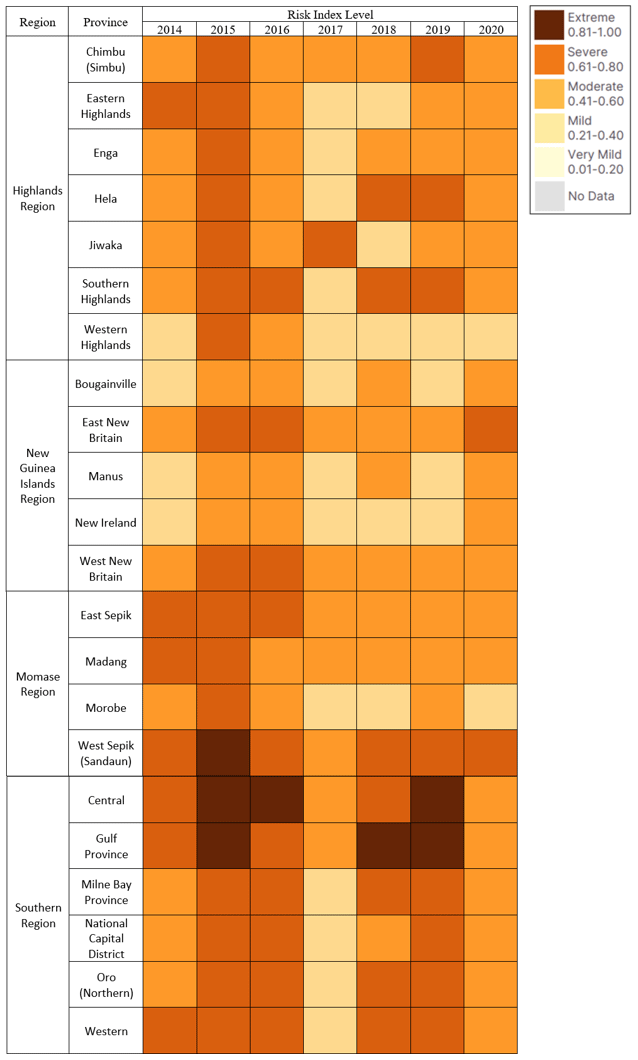
Figure 4Risk index levels for each PNG province calculated from the drought risk assessment conducted for 2014, 2015, 2016, 2017, 2018, 2019, and 2020. Risk index levels are classified on a deepening orange colour scale from very mild (index values from 0.01–0.20) to extreme (index values from 0.81–1.00).
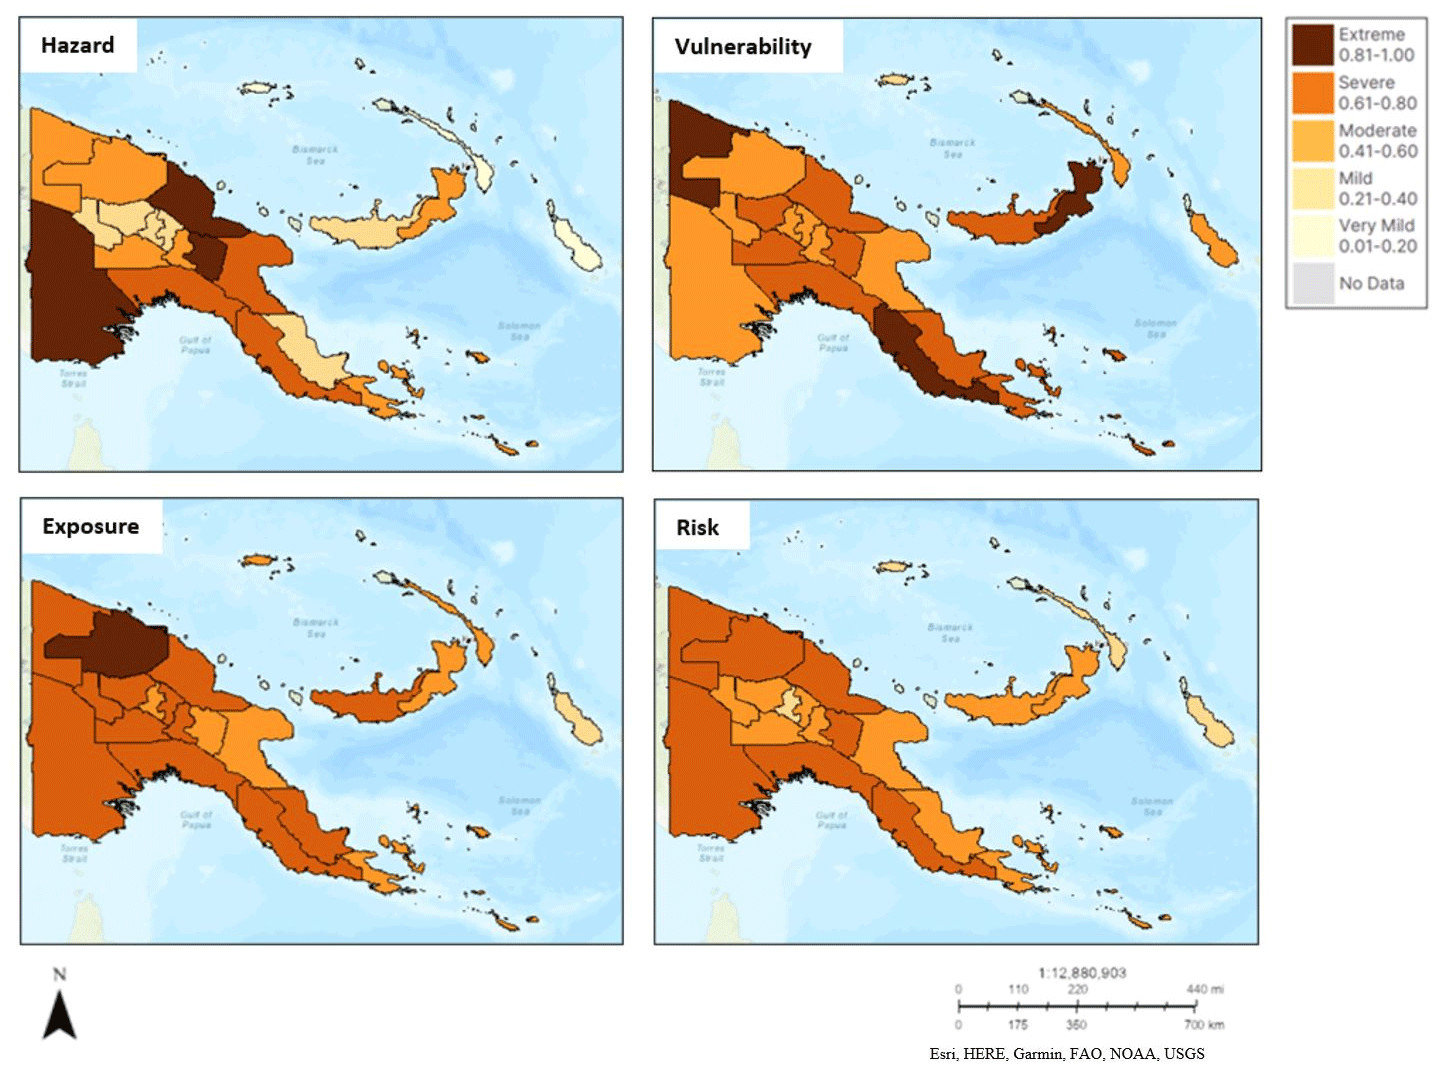
Figure 5Overall drought risk maps of PNG provinces for 2014 including a drought hazard, drought vulnerability, drought exposure, and drought risk map detailing the index level of each province. The index level is classified on a deepening orange colour scale from very mild (index values from 0.01–0.20) to extreme (index values from 0.81–1.00).
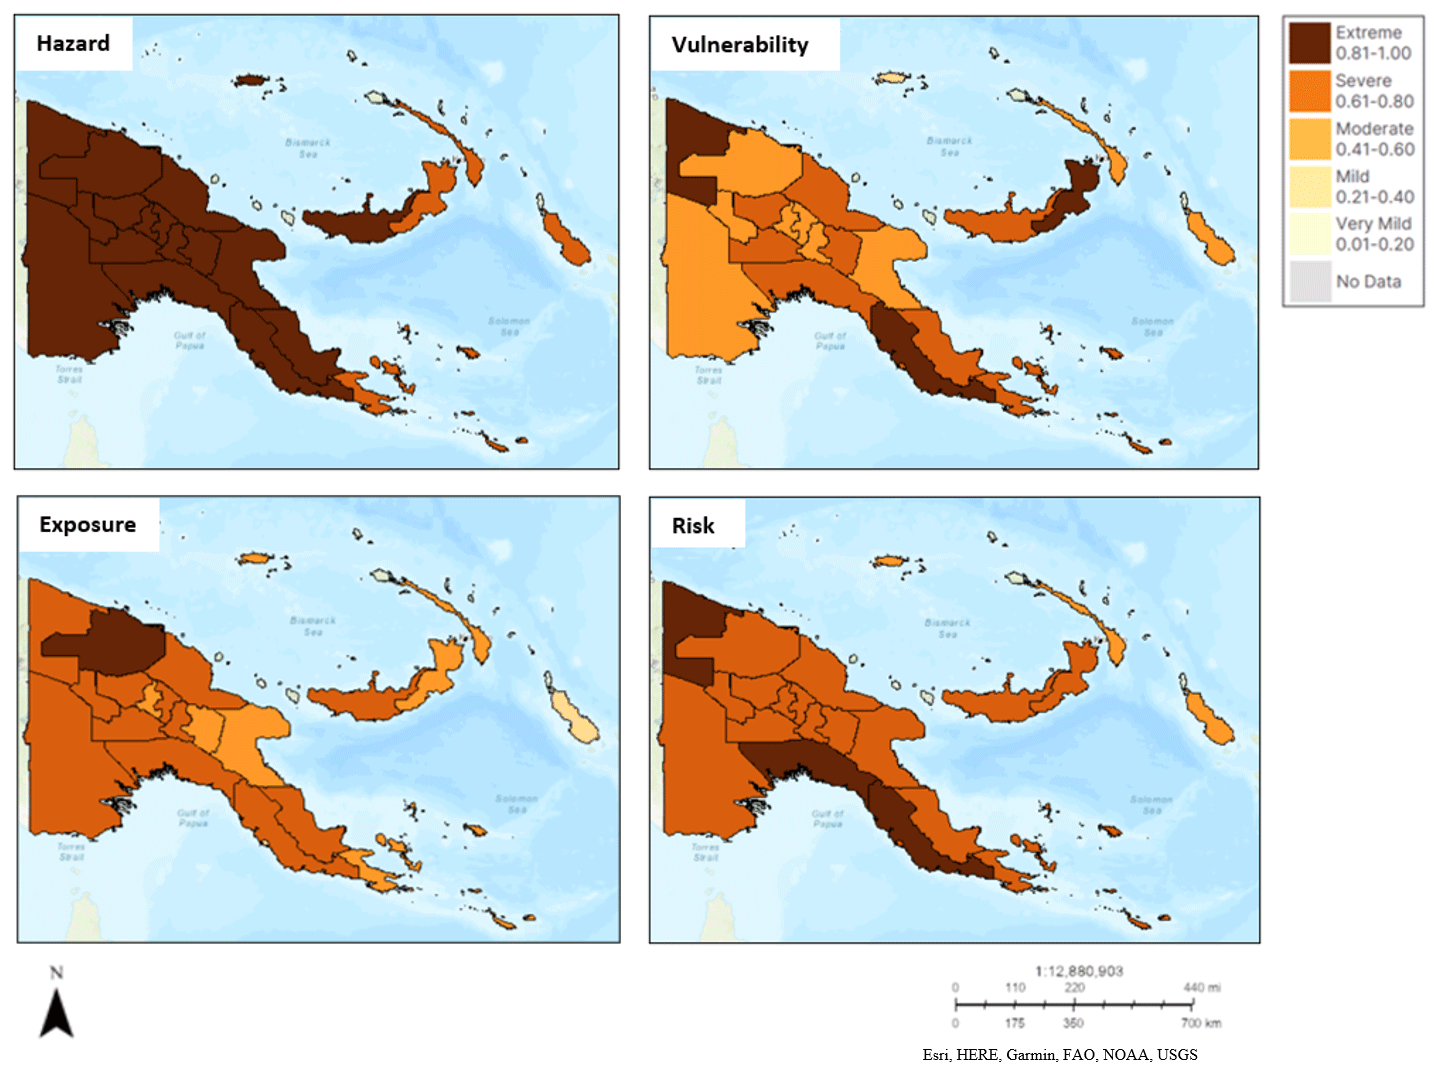
Figure 6Overall drought risk maps of PNG provinces for 2015 including a drought hazard, drought vulnerability, drought exposure, and drought risk map detailing the index level of each province. The index level is classified on a deepening orange colour scale from very mild (index values from 0.01–0.20) to extreme (index values from 0.81–1.00).
The risk assessment results displayed a suspected severe to extreme drought in the Highlands Region, Momase Region, and Southern Region in 2015. The New Guinea Islands Region was suspected of experiencing a moderate drought. Due to all regions suspected of drought, and the consistently elevated risk levels displayed across PNG (Fig. 4), 2015 was concluded as a severe to extreme drought year. These high-risk levels were a result of high hazard levels consistent throughout all PNG provinces, high exposure levels consistently throughout PNG regions, with New Guinea Islands an exception with more moderate levels, and high vulnerability levels in Southern Region and Momase Region (Figs. 4 and 6); 76 % of literature sources mentioned 2015 as a year in which a drought event occurred across PNG. All sources that mentioned drought impacts in 2015 (Annamalai et al., 2015; Whitfield et al., 2019; Bonnafous et al., 2017; Broughton, 2017; Allan et al., 2019; De Deckker, 2016; Schmidt et al., 2021; Burivalova et al., 2017; Bhardwaj et al., 2021b; Bang and Crimp, 2019) stated that impacts were severe to extreme. Impacts commonly recorded by sources for the 2015 drought event included compromised food security and famine (Annamalai et al., 2015; Broughton, 2017; Allan et al., 2019; De Deckker, 2016; Schmidt et al., 2021; Bang and Crimp, 2019), compromised freshwater supply (Annamalai et al., 2015; Broughton, 2017), affected public health and mortality (Annamalai et al., 2015; Broughton, 2017; Bang and Crimp, 2019), and negative effects on crops (Whitfield et al., 2019; De Deckker, 2016; Schmidt et al., 2021; Bang and Crimp, 2019). Food security impacts were mentioned the most among sources (Table 8).
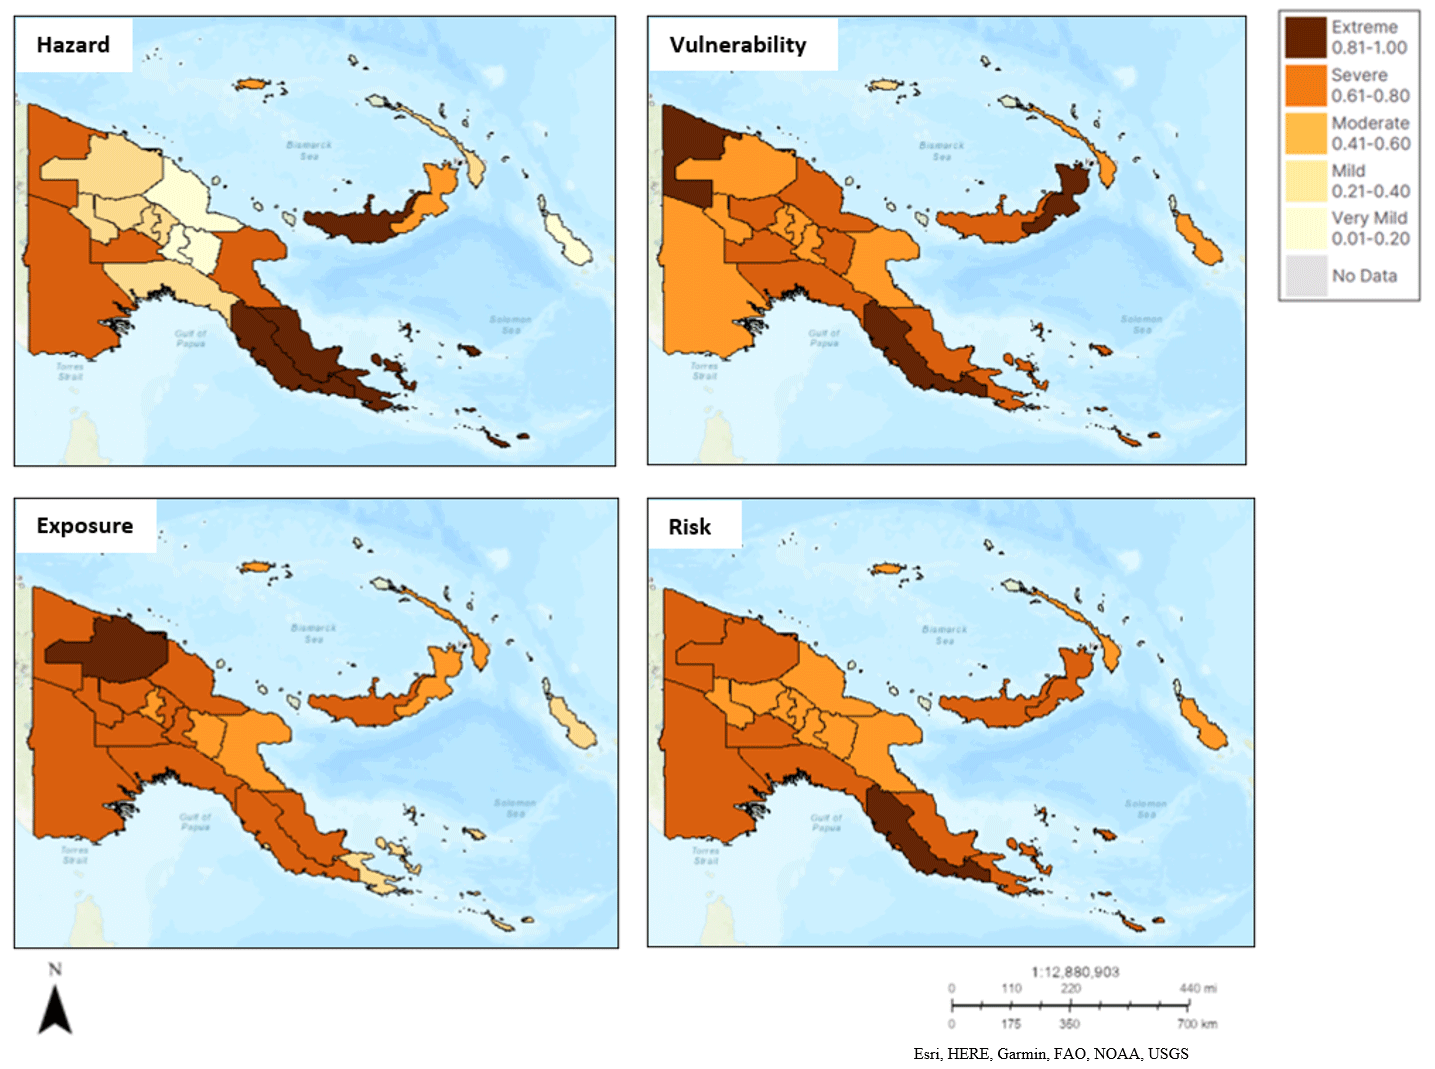
Figure 7Overall drought risk maps of PNG provinces for 2016 including a drought hazard, drought vulnerability, drought exposure, and drought risk map detailing the index level of each province. The index level is classified on a deepening orange colour scale from very mild (index values from 0.01–0.20) to extreme (index values from 0.81–1.00).
For 2016, the risk assessment displayed a suspected severe to extreme drought in the Southern Region of PNG, a mild drought in the Highlands Region, and a moderate drought event in both the New Guinea Islands Region and Momase Region (Figs. 4 and 7). All regions were suspected as experiencing drought; thus, a nationwide drought event was suspected as occurring in 2016. The risk levels displayed across PNG for 2016 expressed that this was likely a moderate drought event. Such risk levels were resultant of high hazard levels that were consistent throughout the Southern Region and scattered throughout various provinces in other regions (e.g. West New Britain in the New Guinea Islands Region), high exposure levels throughout all PNG regions except for New Guinea Islands, and high vulnerability levels primarily across both the Southern Region and Momase Region (Fig. 7). Many literature sources (61 %) also mentioned 2016 as a year in which PNG suffered severe to extreme drought impacts (Table 8) (Annamalai et al., 2015; Whitfield et al., 2019; Bonnafous et al., 2017; Broughton, 2017; Allan et al., 2019; Schmidt et al., 2021; Bhardwaj et al., 2021b; Bang and Crimp, 2019). The impacts were the same as those conveyed for the 2015 period, and most sources constituted the drought impacts seen in 2015 and 2016 as resulting from a singular drought event which lasted for a 2-year period.
No drought was suspected in 2017, with most provinces displaying mild drought risk in the risk assessment (Fig. 4). This was corroborated by the literature analysis, with no sources mentioning drought conditions or impacts in 2017 (Table 8). No nationwide drought was suspected in 2018, with the risk assessment indicating only one region (Southern Region) suspected of experiencing drought impacts (Fig. 4). The provinces throughout the other regions of PNG displayed mostly mild or moderate risk. The literature made no indication of 2018 being a drought year (Table 8).
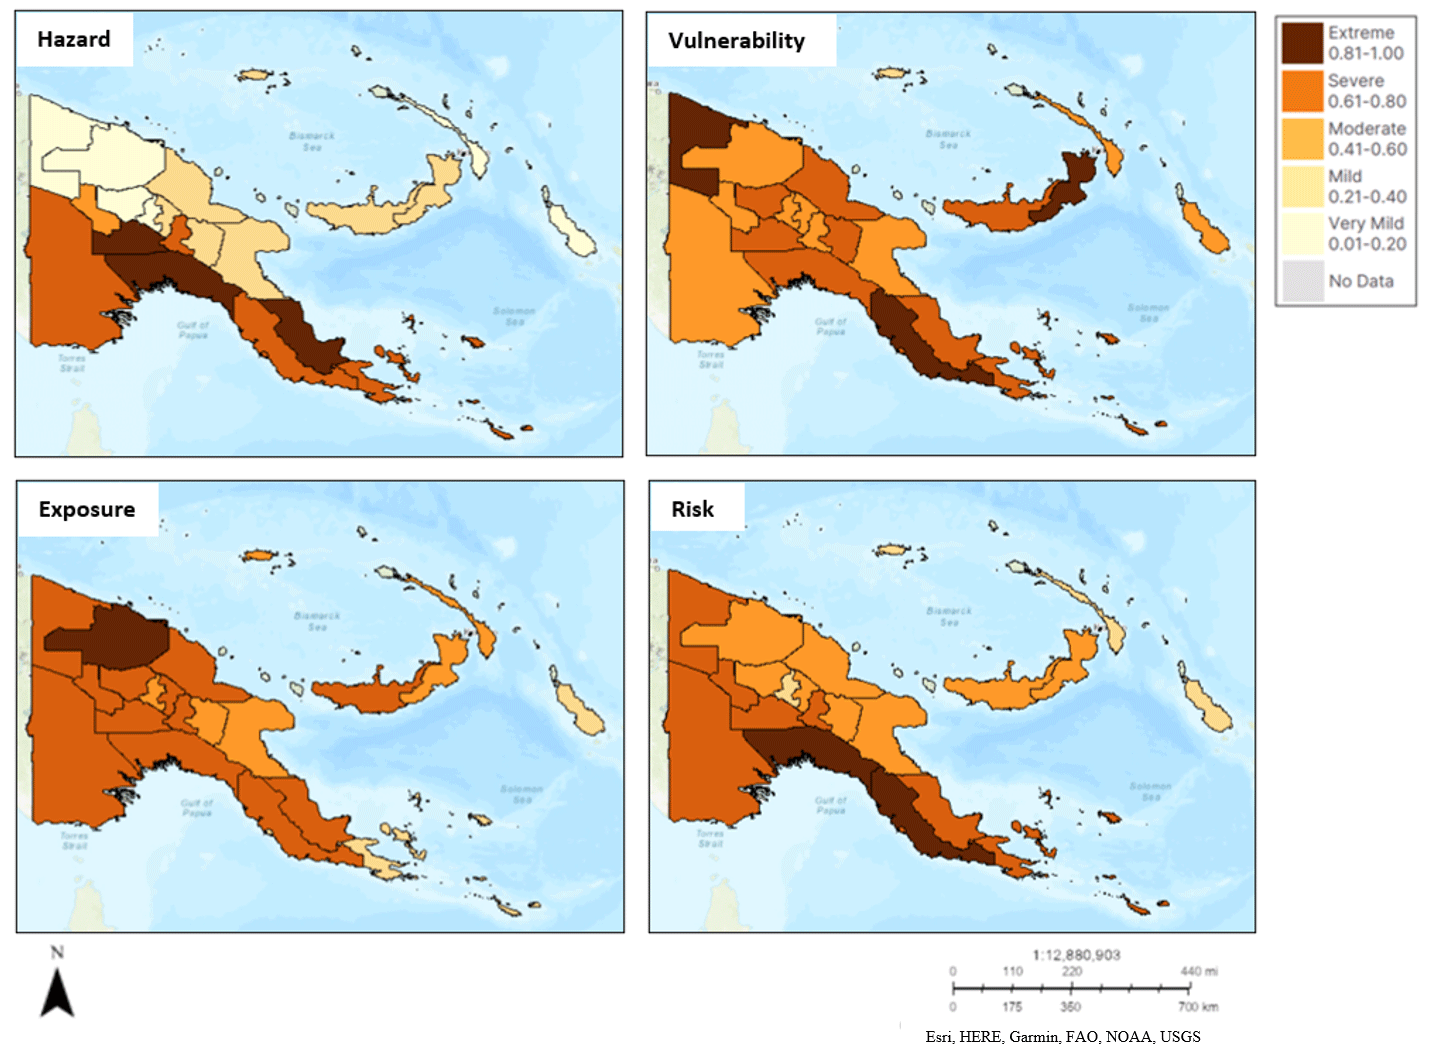
Figure 8Overall drought risk maps of PNG provinces for 2019 including a drought hazard, drought vulnerability, drought exposure, and drought risk map detailing the index level of each province. The index level is classified on a deepening orange colour scale from very mild (index values from 0.01–0.20) to extreme (index values from 0.81–1.00).
In 2019 two out of four of the PNG regions were suspected as experiencing drought. The Momase Region was suspected as experiencing mild drought, and the Southern Region was likely experiencing severe to extreme drought (Fig. 4). As half of the regions in PNG were likely experiencing drought impacts, it was concluded that a nationwide drought event was occurring throughout 2019. The risk level pattern across PNG illustrated that this was likely a moderate drought event (Fig. 8). This is attributed to high hazard levels in the Southern Region and across the Highlands Region, with all other regions displaying much milder levels; high exposure levels throughout all PNG regions except for New Guinea Islands, which displayed more moderate levels; and high vulnerability levels in the Southern Region and Momase Region, with more moderate levels evident in the other two PNG regions (Fig. 8); 30 % of the literature sources mentioned 2019 as a drought year, with half of those sources describing the drought event as mild (Bhardwaj et al., 2021b; Johnson et al., 2019) and the other half discussing it as moderate (World Food Programme, 2019; Mckenna and Yakam, 2021) (Table 8). Impacts recorded included negatively affected vegetation (World Food Programme, 2019), decreases in water storage (World Food Programme, 2019), and negative impacts on market sellers (Mckenna and Yakam, 2021).
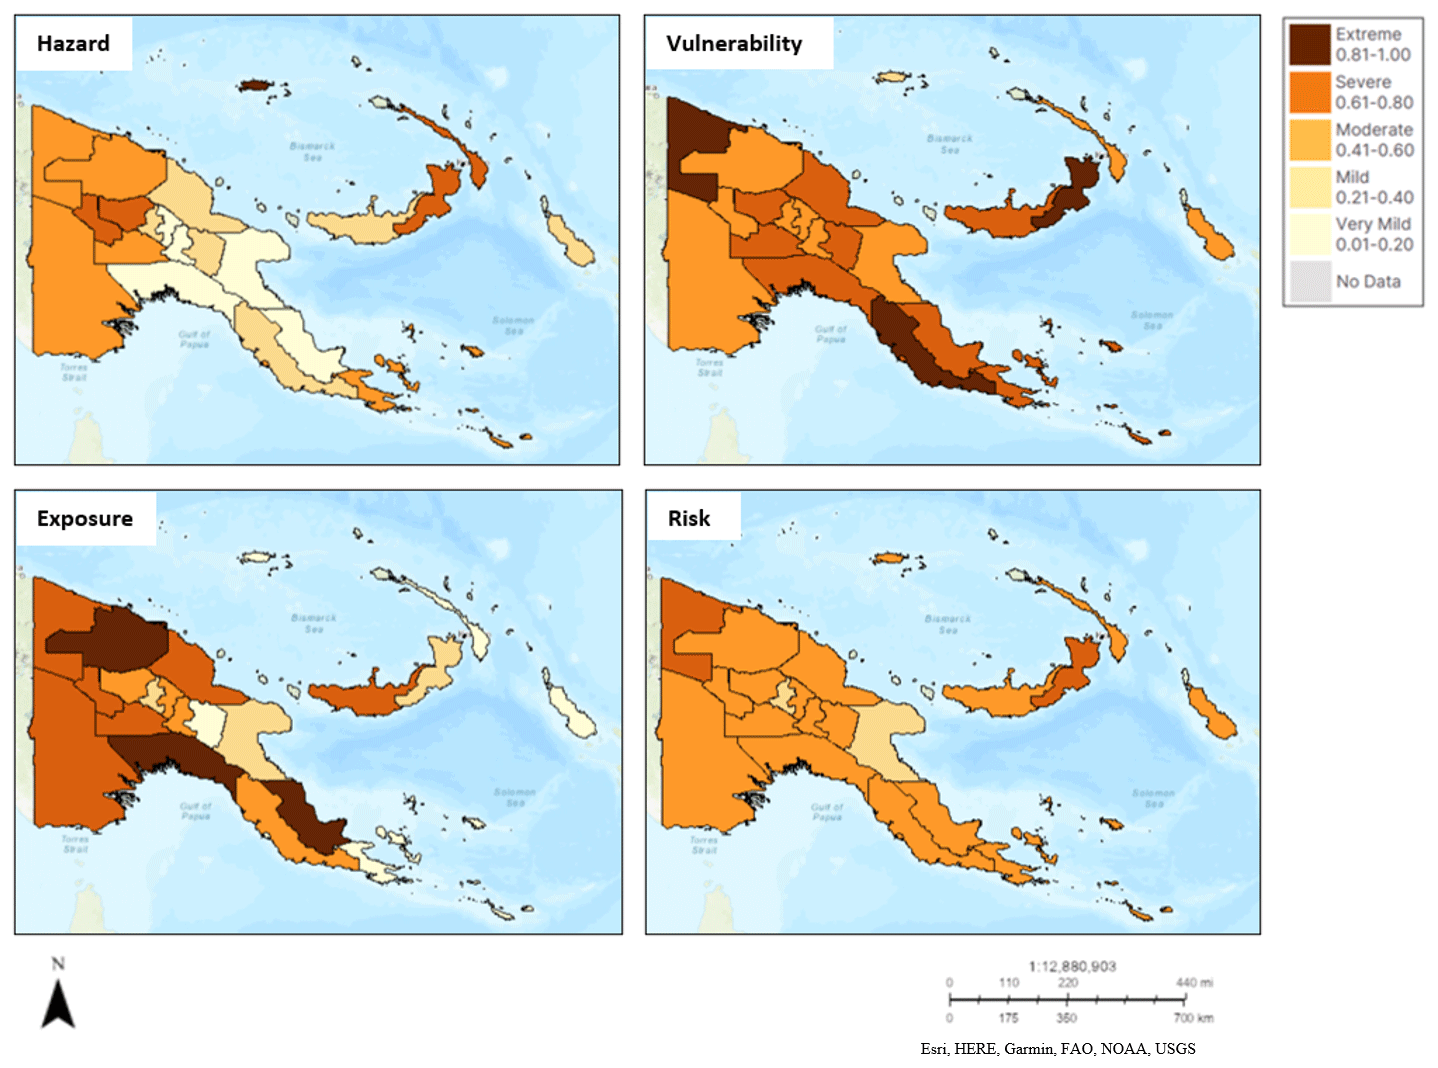
Figure 9Overall drought risk maps of PNG provinces for 2020 including a drought hazard, drought vulnerability, drought exposure, and drought risk map detailing the index level of each province. The index level is classified on a deepening orange colour scale from mild (index values from 0.01–0.25) to extreme (index values from 0.76–1.00).
Two regions were suspected as experiencing drought in 2020, as indicated by the risk assessment: Southern Region and New Guinea Islands Region displayed as likely having mild drought. Since two out of four regions were likely in drought, 2020 was determined to be a nationwide drought year for PNG. The strength of the event was determined to be only mild, based off risk levels displayed across PNG provinces (Fig. 4). Such patterns were a result of the varying hazard, vulnerability, and exposure levels indicated across PNG. High hazard levels were indicated throughout the New Guinea Islands, with high levels also indicated in provinces scattered throughout the other regions of PNG. Like the vulnerability and exposure levels indicated in 2019, the 2020 vulnerability map shows high levels in the Southern and Momase region, and the 2020 exposure map displays moderate levels in the New Guinea Islands Region, and higher levels in all other regions (Fig. 9). In the literature investigation, only 15 % of sources mentioned 2020 as a drought year in PNG. Half of the sources that did mention drought impacts throughout 2020 described such impacts to be mild (Bhardwaj et al., 2021b), and the other half described them as moderate (Mckenna and Yakam, 2021). As less than a quarter of sources mentioned 2020 as a drought year, there is insufficient evidence to corroborate the drought risk assessment results and deem 2020 as a drought year.
Overall, the comparison of risk assessment and literature investigation results suggests a drought event occurred in 2015–2016 with severe to extreme impacts, and in 2019 with moderate impacts. There was insufficient evidence in the literature to indicate 2014 and 2020 as years included in these drought events, even though they were indicated as likely drought years in the risk assessment. Accordingly, only the risk assessment results for 2015–2016 and 2019 were included to be statistically validated by the literature analysis results.
3.2 Statistical validation of risk assessment with literature analysis results
The different severity levels for each province, indicated by the risk assessment compared to the literature, in each drought event (2015–2016 and 2019) are listed in Table 9. The risk assessment reported the three most at-risk provinces during the 2015–2016 drought period as Central (average risk index value of 0.82), West Sepik (average risk index value of 0.81), and Northern (Oro) (average risk index value of 0.76) (Table 9). Similarly, during the 2019 drought period, Gulf Province (risk index value of 0.83), Central (risk index value of 0.81), and Northern (Oro) (risk index value of 0.80) were the three most at-risk provinces (Table 9). Northern (Oro) and West Sepik were mentioned in the literature among the most affected provinces during the 2015–2016 drought period; however, Central was not included among the most affected (Table 9). For the 2019 drought period, Gulf Province, Central, and Northern (Oro) were mentioned among the most affected provinces in the literature (Table 9).
No statistically significant variation was displayed between the severity levels described for each province in the risk assessment versus the literature for the 2015–2016 event (F18 = 0.86, p = 0.37) (Appendix B); thus a t test assuming equal variances could be conducted. For the 2019 event, a statically significant variation was detected (F17 = 2.67, p = 0.02) (Appendix C); thus a t test assuming unequal variances was performed on the data. T-test results found that there was no significant difference between the severity levels recorded for the 22 PNG provinces given by the risk assessment compared to the literature for both the 2015–2016 drought event (t36 = −1.70, p = 0.10) (Appendix D) and the 2019 drought event (t28 = 2.07 × 10⁻¹⁵, p = 0.50) (Appendix E), therefore suggesting a valid identification of a severe to extreme drought event in 2015–2016 and moderate drought event in 2019, as well as a valid indication of provincial drought risk levels, by the risk assessment.
3.3 Sensitivity analysis results
The validity of the risk assessment is further confirmed by sensitivity analysis results examining the robustness of the individual indices (hazard, vulnerability, and exposure) used in the assessment. All indicator SIs were below or just over 0.5, the highest being SPI with 0.56. SI values 0.5 or below are considered low, with SPIs with a 0.56 value still deemed relatively low, meaning that the hazard, vulnerability, and exposure indices are essentially robust rather than sensitive (Anand et al., 2019).
Table 10Average sensitivity index values across PNG provinces for each indicator and the index which they inform using 2015 data as a case study. Rankings are shown for SI with highest sensitivity ranked first and lowest sensitivity ranked last. The likely credibility is also ranked amongst indicators, with first being the most credible for inclusion in the index and last being the least credible.
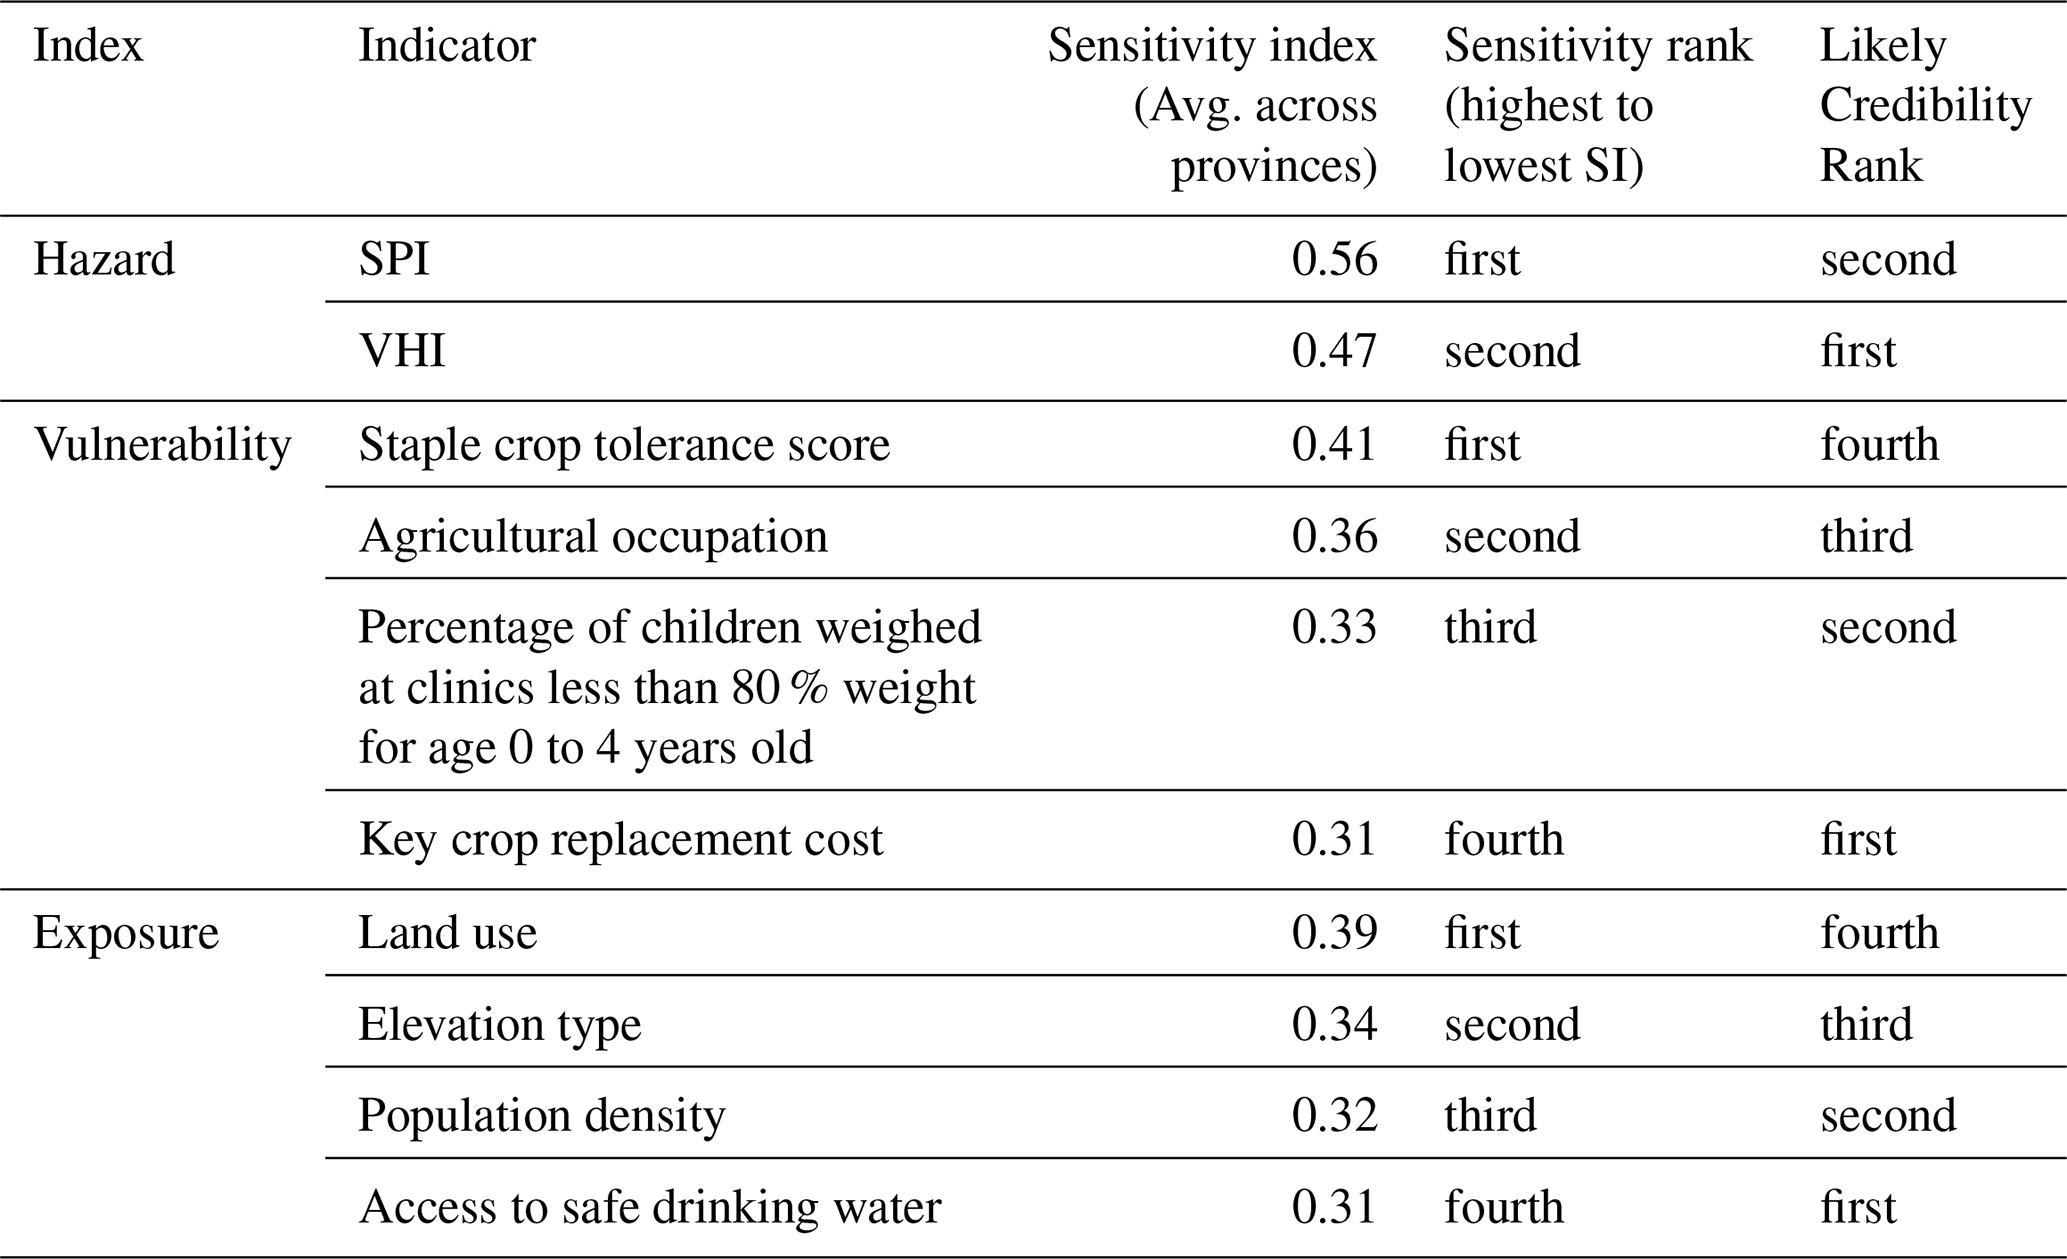
The results of the 2015 case study sensitivity analysis show that the hazard index is more sensitive to SPI compared to VHI, meaning that changes in SPI affect the hazard index more greatly than changes in VHI. Thus, SPI is the indicator ranked as first in hazard sensitivity and second in likely credibility (Table 10). The vulnerability index is seen to be most sensitive to the staple crop tolerance score indicator; thus it is ranked as first in vulnerability sensitivity and is likely the least credible vulnerability index. Agricultural occupation is ranked second with a slightly lower SI value than staple crop tolerance score. Percentage of children weighed at clinics less than 80 % weight for age 0 to 4 years old and key crop replacement cost have similar SI values, with the SI given for percentage of children weighed at clinics less than 80 % weight for age 0 to 4 years old being slightly greater than that for key crop replacement cost; therefore, they are ranked third and fourth respectively in terms of vulnerability sensitivity (Table 10). The exposure index sensitivity analysis results show that the exposure index is most sensitive to land use; thus land use is ranked first in exposure sensitivity with the greatest SI value and fourth in likely credibility. The SI values for the remaining three exposure indicators are similar, with elevation type giving an SI of 0.34, population density 0.32, and access to safe drinking water 0.31, resulting in a second, third, and fourth ranking respectively for exposure sensitivity (Table 10). Overall, the SI values of each indicator within each of the three indices did not greatly differ, the greatest being a 0.1 difference between key crop replacement cost (SI of 0.31) and staple crop tolerance score (SI of 0.41). Thus, credibility was similar for all indicators within each of the hazard, vulnerability, and exposure indices.
3.4 Demonstrating the usability of risk assessment results: 2015 monthly case study
The strong event which occurred in 2015–2016 is further detailed by monthly risk index maps indicating the transition of most provinces into extreme drought risk levels in July 2015. Figure 10 shows the heightening of drought risk from November 2014 to July 2015 for most provinces, with drought risk levels peaking in October–December 2015 and then slightly reducing at the commencement of 2016. When the drought risk levels peaked, all PNG regions except for the Highlands Region had provinces reaching extreme drought risk levels. In the Highlands Region, all provinces were at a severe risk level when the drought event reached its peak. The provinces reaching extreme levels throughout the 2015 year included Southern Highlands, West New Britain, East Sepik, Madang, West Sepik (Sandaun), Central, Gulf Province, and Northern (Oro). The transition into and out of extreme levels was different for each of these provinces.
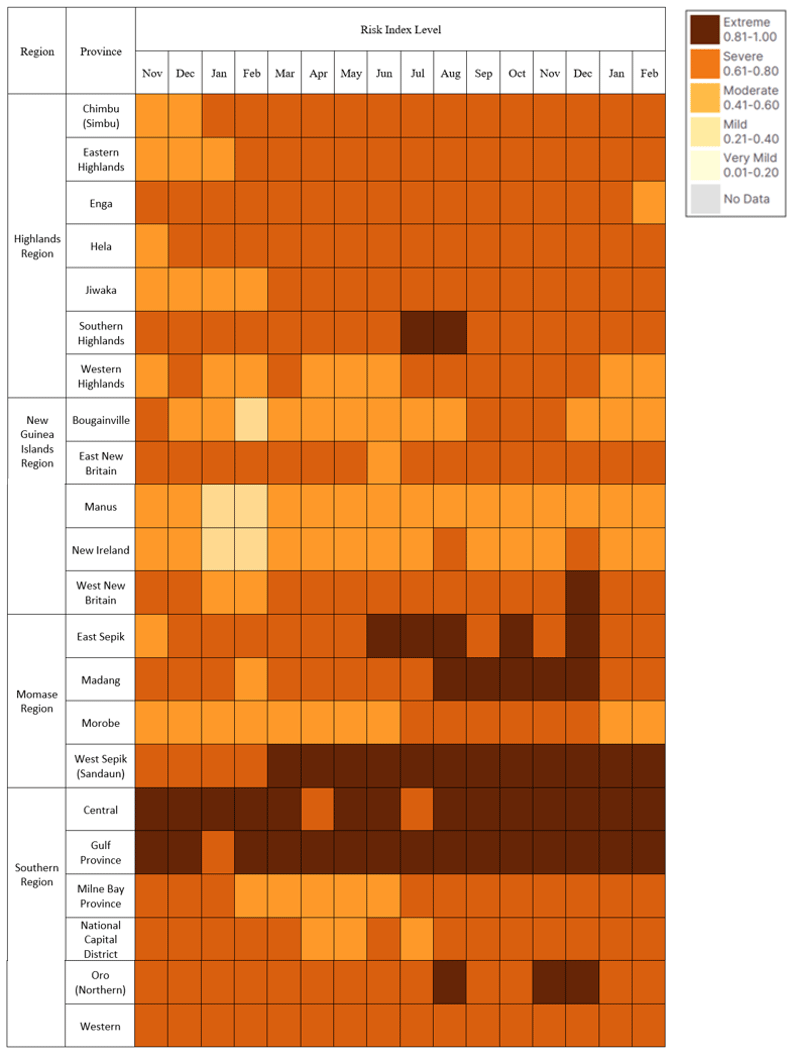
Figure 10Drought risk levels calculated from monthly risk assessments for each province during the transition into the strong 2015–2016 drought conditions. Drought risk levels are given for November and December 2014, January to December 2015, and January and February 2016. The drought risk level is classified on a deepening orange colour scale from mild (index values from 0.01–0.25) to extreme (index values from 0.76–1.00).
Drought impacts in Southern Highlands seemed to peak in July, with extreme risk levels indicated for both July and August of 2015. Afterwards, levels dropped down to severe for the remainder of 2015 and the beginning of 2016 (Fig. 10). In West New Britain, risk levels peaked in December at an extreme level; for the 9 months leading up to this, levels were severe. In January 2016 risk dropped back down to severe for West New Britain (Fig. 10). East Sepik was found to have extreme risk from June to December 2015; in the six months prior, levels were severe (Fig. 10). Following December 2015, levels returned to severe for East Sepik. Similarly, Madang displayed extreme levels from August to December 2015, with severe levels noted for the five months leading up to this peak, and severe levels recorded following the peak (Fig. 10). In West Sepik (Sandaun), levels were severe until March 2015, in which extreme risk was recorded and remained for the rest of the months investigated (Fig. 10). Northern (Oro) displayed severe risk until August 2015, in which extreme risk arose and continued occurring until December 2015 (Fig. 10). Both Central and Gulf Province were indicated to have extreme levels consistently from the end of 2014 to the beginning of 2016 (Fig. 10).
4.1 PNG drought events indicated by risk assessment and confirmed in the literature
The risk assessment results indicated a suspected severe to extreme drought event in 2015–2016 and a moderate event in 2019. When compared to literature findings, these results were corroborated. It is widely reported that a strong drought event commenced in PNG at the beginning of 2015 and reached its peak during 2016 (Kuleshov et al., 2020; Chua et al., 2020; Gwatirisa et al., 2017; Jacka, 2020; Varotsos et al., 2018; RIMES and Papua New Guinea National Weather Service, 2017). Kuleshov et al. (2020) attributed the drought of 2015–2016 to a strong El Niño which occurred during these years. This strong El Niño phase was paired with a positive IOD phase; the interacting impacts of both climate drivers resulted in devastating negative rainfall anomalies across the entirety of PNG (Bhardwaj et al., 2021b). It is explained in the literature that the 2015–2016 drought event affected approximately 40 % of PNG's population, with drought-caused food shortages impacting half a million people throughout PNG's provinces (Annamalai et al., 2015; Whitfield et al., 2019; Broughton, 2017; Schmidt et al., 2021; De Deckker, 2016; Bhardwaj et al., 2021b; Bang and Crimp, 2019). In their poverty analysis of the lowlands of PNG, Schmidt et al. (2021) further detail that the drought decimated a critical amount of PNG's local crop production, which left PNG communities in a food crisis. Such a climate shock had critical consequences for household welfare, contributing to a rise in households below the poverty line, particularly in rural and lowland areas (Schmidt et al., 2021).
A recent drought event occurring in PNG throughout 2019 has been reported by various sources (Bhardwaj et al., 2021b; Johnson et al., 2019; World Food Programme, 2019; Mckenna and Yakam, 2021). Unlike the 2015–2016 drought event, drought conditions in PNG during 2019 were due to a La Niña event. A neutral IOD phase was also evident; thus La Niña impacts were not exacerbated by the IOD. The impacts of La Niña on rainfall patterns vary across PNG. In the past, La Niña has resulted in wetter conditions over most of the country, except in the eastern islands of Milne Bay region (Food and Agriculture Organisation of the United Nations, 2021). The 2019 La Niña caused below-average rainfall in PNG, particularly in the northern parts of PNG (Food Security Cluster et al., 2021). With La Niña alone influencing the 2019 event, it was expected to be weaker than the previous drought in 2015–2016. In the literature, the impacts of the 2019 drought event are primarily discussed as mild or moderate rather than severe to extreme. However, the effects of the 2019 drought event have not been widely discussed in peer-reviewed literature as it is such a recent event. Drought investigations usually occur after the fact, sometimes years after an event occurs. This is most likely because the drought research and response space is still largely reactive, despite efforts towards proactivity (Wilhite et al., 2014). The few sources that have reported on this event described the negative effect of dry conditions on agricultural production and food security (World Food Programme, 2019; Johnson et al., 2019).
4.2 PNG non-drought years
Years 2014, 2017, 2018, and 2020 were deemed to be non-drought years due to the comparison of risk assessment results and literature analysis results. Even though 2014 and 2020 displayed high enough drought risk levels across PNG's regions to signal that a drought event may have occurred in these years, there was insufficient evidence in the literature to corroborate this. Only a small number of sources reported these years as drought years (Allan et al., 2019; Burivalova et al., 2017; Mckenna and Yakam, 2021; Bhardwaj et al., 2021b). The risk assessment may have identified high risk levels throughout these years as they lead up to (in the case of 2014) or followed (in the case of 2020) confirmed drought. Further investigation on these years is recommended to confirm the validity of the risk assessment. Year 2017 displayed mostly mild risk throughout all PNG regions, as corroborated in the literature, signalling an end to the 2015–2016 drought event.
Although 2018 was indicated as a non-drought year with most provinces displaying mild or moderate risk, there were some provinces with severe or extreme risk. These higher levels were particularly present throughout the Southern Region. This is not an entirely unexpected result, as PNG is a highly vulnerable and exposed country to drought. Therefore, the vulnerability and exposure indices are likely to be consistently high for most years across PNG provinces. With two out of the three indices likely being at higher levels, it is not radical to suggest that the final drought risk index would be higher than mild for most years. It is important to note that in this study, it is recognised that drought risk does not directly translate to the occurrence of a drought; rather it corresponds with the severity of impacts likely to be experienced by the area of investigation when a drought occurs. For example, mild drought risk levels seen in certain provinces on the drought risk maps in this study do not necessarily mean that a mild drought is occurring; instead it suggests that mild drought impacts are likely to occur in those provinces. Such mild impacts could occur because of a drought event or could occur because of the regular dry season of PNG (Bhardwaj et al., 2021b). Comparatively, moderate to extreme risk levels are most likely the result of a drought event (Kanua et al., 2016).
In non-drought years, where hazard is low but vulnerability and/or exposure remain high across PNG provinces, it is the time to be proactive and improve adaptive capacity. If management practices are put in place during non-drought years to reduce the levels of vulnerability and exposure, when a drought hazard event commences the risk of destructive impacts can be reduced (Pulwarty and Sivakumar, 2014). Management actions that could be taken in non-drought years to foster resilience in PNG include strengthening of health services, cultivating/planting drought resilient crops, and increasing water storages in highly vulnerable and exposed areas (Hagenlocher et al., 2019). The importance of risk assessment-informed resilient management is highlighted further in the monthly case study of the extreme drought year of 2015.
4.3 2015 monthly case study: transition of drought
The 2015 monthly risk assessment (including the conclusion of 2014 and commencement of 2016) accurately displayed high drought risk levels leading up to the peak of the 2015–2016 drought event in mid-2015 until November/December 2015 (Chua et al., 2020). The case study highlighted priority areas: Southern Highlands, East Sepik, Madang, West Sepik (Sandaun), Northern (Oro), Central, and Gulf Province were provinces exhibiting extreme risk for more than 1 month throughout 2015. Records of the event confirmed that these provinces experienced severe to extreme impacts during the 2015–2016 drought in PNG (Annamalai et al., 2015; Whitfield et al., 2019; Broughton, 2017; Schmidt et al., 2021; De Deckker, 2016; Bhardwaj et al., 2021b; Bang and Crimp, 2019). All priority provinces were indicated by the risk assessment to be at high risk levels (severe or extreme) for at least 3 months prior to the peak of the drought event. This suggests that if performed prior to the drought event, the risk assessment would have likely aided in notifying provincial and state decision-makers of priority areas requiring focused management and higher allocation of resources. Small-scale proactive and suitable management actions could have been implemented, including the allocation of resources to emergency and health services, implementation of water restrictions, and initiation of negotiations for food aid from surrounding countries like Australia (Broughton, 2017). As a result, local communities in PNG provinces could have been better prepared for the impacts of the drought event before it peaked, potentially saving lives (Kanua et al., 2016).
4.4 Sensitivity analysis
Sensitivity analyses are neglected in the few drought assessments performed for PNG. Without sensitivity analysis, the indicators used in past PNG drought assessment studies cannot be definitively concluded as credible. For example, SPI and VHI were investigated by Chua et al. (2020) for assessing drought in PNG, but they were only validated through a 2015–2016 case study of drought impacts. No sensitivity analysis was performed. Like Chua et al. (2020), SPI and VHI are considered in this study. A sensitivity analysis can confirm the credibility of these indicators for use in assessing drought across PNG.
In this study, it was found that no single indicator displayed a seriously high SI value, so each indicator selected for use in the risk assessment is likely credible. This suggests that the hazard, exposure, and vulnerability indices calculated in this study are robust and able of representing the complex processes that lead to drought risk (Anand et al., 2019). However, based on the different SI values expressed and differences in likely credibility of individual indicators, a review of the weighting applied to each indicator may be appropriate.
The expert weighting scheme applied to the hazard indicators gave SPI a weighting of 0.75 and VHI of 0.25. The sensitivity analysis ranked SPI as first, with an SI value greater than VHI, meaning that the hazard component is more sensitive to changes in SPI rather than VHI. Results suggest that VHI is a more credible indicator compared to SPI; therefore more weight could be distributed to VHI than what is currently. Previous drought risk assessment studies, conducted in other countries, that have employed SPI and VHI as hazard indicators commonly weight SPI highly in the hazard index calculations, and VHI usually has a mid-range weighting (Nagarajan and Ganapuram, 2015). Here, a similar approach is taken; however in PNG specifically, it may be pertinent to weight VHI slightly higher (as indicated by the sensitivity analysis).
Generally, global drought risk assessment studies adopt a range of vulnerability indicators that focus on agricultural, economic, and/or health-related vulnerability. In an assessment including economic, health, and agricultural vulnerability indicators to detect drought vulnerability in Zimbabwe, Frischen et al. (2020) used an expert weighting scheme to assign indicator weights. Agricultural indicators were commonly assigned the highest weighting, with economic indicators weighted second, and health indicators weighted third (Frischen et al., 2020). Here, the expert weighting scheme followed this trend, with staple crop tolerance score and key crop replacement cost weighted the highest, agricultural occupation weighted third, and percentage of children weighed at clinics less than 80 % weight for age 0 to 4 years old weighted the least. The sensitive analysis results reveal that a revision is needed. The vulnerability index was evidently most sensitive to changes in the staple crop tolerance score indicator; it is likely incorrect that it is weighted highest. Key crop average replacement cost was identified as the most credible indicator; it is logical that it should be weighted the highest among vulnerability indicators. Similarly, more weight should be applied to the percentage of children weighed at clinics less than 80 % weight for age 0 to 4 years old indicator as it was identified as the second most credible vulnerability indicator. The weighting of agricultural occupation is likely valid as it was found to be the second lowest indicator in terms of credibility.
In many past risk assessments, access to safe drinking water and population density are weighted highly among exposure indicators (Nagarajan and Ganapuram, 2015; Dayal et al., 2018), whereas land use is generally weighted with mid-range values and slope weighted with lower values (Dayal et al., 2018). The sensitivity analysis results of this study suggest that such weightings should be revised in the case of assessing drought exposure in PNG. Results show land use to be ranked last among exposure indicators in terms of credibility. Currently, land use is weighted the greatest among exposure indicators. This suggests that the weighting assigned to land use should be reduced. Elevation type, population density and access to safe drinking water were found to likely have similarly high credibility. However, the exposure index was seen to be slightly more sensitive to changes in elevation type over population density, and population density over access to safe drinking water. As the most credible exposure indicator, Access to safe drinking water should be weighted the greatest; it is currently weighted as the second greatest.
Whilst refinements to the weightings applied to hazard, vulnerability, and exposure indicators are recommended in the future, they would be minimal as the differences in SI values between indicators within each index were not immense. Overall, the sensitivity analysis results do not retract from the value of the risk assessment results produced in this preliminary study.
4.5 Reasonability of validation methods
The validation method adopted in this study used literature sources discussing past drought events in PNG as the ground truth for what occurred during previous droughts. A more reliable ground truth would have been the perspectives of local PNG people who personally experienced the drought conditions and ensuing impacts (Fragaszy et al., 2020). Interviews could have been conducted like those executed by Mckenna and Yakam (2021) and Fragaszy et al. (2020). However, due to the COVID-19 situation in both PNG and Australia at the time of this study, interviews were not viable. González Tánago et al. (2016) recommend the use of multiple ground-truth sources, to strengthen validation methodology. Bijaber (2018) adhered to this recommendation and used historical on-the-ground data as well as expert knowledge of what occurred, to validate the results of their drought risk monitoring in Morocco. Due to the data scarcity in PNG, and the additional limitation of not being present in the country to conduct this research, the assessment here could only include one kind of ground-truth source. Future research should consider interviewing local communities in each PNG province to add another, more robust ground-truth for the impacts of each drought event investigated.
Using statistical sensitivity analysis as a second form of validation is recommended as best practice for validating drought risk assessment methodology (Hangelocher et al., 2019). Rahmati et al. (2020) conducted a sensitivity analysis to validate the use of specific indicators for assessing drought risk in south-eastern Queensland. The sensitivity analysis outlined which indicators were highly suitable for use in the risk assessment, highlighting that plant-available water capacity, the percentage of soil comprised of sand, and mean annual precipitation were the most important predictors of drought for the study (Rahmati et al., 2020). Such best practice was adhered to in this study, with the use of sensitivity analysis as a second form of risk assessment verification. Overall, the use of both a comparison to a ground-truth source and a sensitivity analysis for validation of this study is a reasonable approach.
4.6 Study limitations and recommendations for further research
4.6.1 Indicator selection process
In the literature, it is indicated that current practice for indicator selection is to select indicators based on a review of literature (Frischen et al., 2020) and use of current expert knowledge (Dayal et al., 2018). Indicators are commonly arbitrarily selected for the country they are to be used to assess. It is common for data restrictions to be a limiting factor of indicator selection (Dayal et al., 2018). As this study seeks to select specifically suitable indicators for assessment of drought risk on a more localised scale in PNG, to achieve a tailored drought risk assessment, it would have been ideal to select indicators not only based on a literature review or current expert knowledge, but also established with local knowledge as recommended by Benzie et al. (2016). In this study it was not feasible to formally gauge the perspectives of users, but advice on relevant indicators was sought by PNG NWS. In future investigations, surveys and interviews will be conducted to formally gain the perspective of locals regarding what vulnerability and exposure indicators are most appropriate for use. This feedback will inform further refinements of the risk index for drought in PNG, given data are accurate and available.
4.6.2 Static indicators
Vulnerability and exposure indicators were semi-dynamic or static, using annually updated observed data or fixed data. Fixed data for indicators like land use and elevation type are expected; these indicators are naturally static (Safavi et al., 2014). However, the data for indicators like staple crop tolerance score, agricultural occupation, percentage of children weighed at clinics less than 80 % weight for age 0 to 4 years old, and key crop replacement cost (for vulnerability), along with population density and access to safe drinking water (for exposure), were semi-dynamic due to limited data availability. Ideally, more dynamic data (e.g. updated monthly rather than annually) would be used for these indicators, but this can only happen if consistent socio-economic statistics become available for PNG. Although regularly updated data are not available for all vulnerability and exposure indicators, a holistic drought risk index still requires these two components in addition to the hazard component. The hazard indicators used were dynamic, incorporating regularly updated monitoring data. The hazard variables used were 3-month cumulated values (3-month SPI and VHI), which potentially reduces the informative value of the hazard and risk index to give a warning of high risk early enough in advance to act proactively. However, this risk assessment is not intended to predict drought events before they happen; it is intended to be used to determine the risk of a drought event occurring and the relative impact that might be faced by specific PNG provinces during a drought. Overall, the semi-dynamic nature of this assessment is not likely a limitation that will reduce the value of this preliminary risk assessment methodology.
4.6.3 Data availability
Limited data availability constrained several aspects of the methodological process:
-
The validation method was constrained by the fact that there were limited numbers of scientifically robust literature sources reporting on the 2019 drought event, as it was a recent event. The PNG National Weather Service was consulted to ensure that the results from the 2019 literature sources were true and accurate.
-
Space-based VHI data are only available from 2014 onwards, whereas the SPI data record dates to 2001. To have a complete hazard index in the retrospective risk assessment, the retrospective period investigated had to begin from 2014; 2014–2020 is a shorter period of analysis, which limits the number of drought events and non-drought periods occurring within, resulting in lower confidence in results. A longer analysis would provide greater confidence in the risk assessment methodology. It is possible that the risk assessment could be performed for years prior to 2014 by using only SPI to inform the hazard index, or by replacing VHI with a different hazard indicator with data available for a longer period. However, it is deemed that for the risk assessment to be holistic and tailored, the hazard index should not rely only on one indicator. Additionally, different hazard indicators that could potentially replace VHI, like the Normalized Difference Vegetation Index (NDVI) (which has raw data from the 1980s onwards) are not as accurate as VHI; VHI has been proven to be efficient and accurate, specifically for across PNG (Chua et al., 2020).
Data availability was also limited for the exposure and vulnerability indicators; thus, the data available closest to the time investigated were used. This meant that the vulnerability and exposure indices were the same for both 2014 and 2015 as the data were not updated throughout those two years. However, as half the indicators in both the vulnerability and exposure are more static rather than dynamic (excluding agricultural occupation, key crop replacement cost, population density, and access to safe drinking water), it is not expected that values would largely change on a yearly basis regardless; rather it would be more likely for values to change every 2 or 3 years (Aitkenhead et al., 2021). Therefore, the limited data availability for vulnerability and exposure indicators in 2014–2015 will not likely have a large effect on the credibility of the results. Data availability is constrained throughout many SIDS like PNG; future investment in open-sourced and cloud-based data platforms would allow for collaboration between separate entities that have collected data so that all relevant data can be combined, stored, and accessed from the same place (Sun et al., 2020).
When working in such countries as Pacific SIDS and other developing nations, data availability is commonly scarce (Chua et al., 2020). Several previous studies have come across this limitation and have addressed it in similar ways. In their drought risk assessment in China, Zhao et al. (2020) faced data limitations for the more local level. They chose to use provincial data where county level data were missing. As in this study, Frischen et al. (2020) were faced with limited data availability for drought vulnerability indicators, so it was decided that static indicators would be used rather than temporally dynamic indicators. Although not dynamic, Frischen et al. (2020) deemed that there was merit in their drought vulnerability assessment, as results offered to expand the underexplored topic of drought risk in Zimbabwe. -
This research presented an effective solution to test the validation of a tailored risk assessment methodology which is conceptually applicable to the local level – with tailored explicitly meaning that indicators were selected based on rigorous criteria outlining suitability to this study's context. The developed risk assessment methodology was intended to be tailored to a highly localised level; however, due to data restraints, the provincial level was the most localised level able to be assessed in PNG. Data are severely limited at heightened local scales, e.g. for individual villages/cities. In the future, it would be useful to further validate the applicability of such a risk assessment methodology at a more localised scale through conducting a drought risk assessment for a specific local PNG village. Currently, such an investigation is beyond the scope of the research presented in the paper.
4.6.4 Weighting scheme
Although used in many similar past studies, like Frischen et al. (2020), the expert weighting scheme approach has been described by some as unreliable for the delivery of robust results, due to the presence of subjective judgements (Dayal et al., 2018). Furthermore, the sensitivity analysis results suggest that the weighting scheme applied to indicators may not have been optimal. In the future, a revised set of indicator weights should be employed, based off the sensitivity analysis results. As this study was a preliminary assessment, initially attempting to address drought risk assessment knowledge gaps in PNG, the limitations of the weighting scheme do not take away the value of results. So, it was determined that improvements were not required at this stage of the research but are set to be made in future work. Before the drought risk assessment methodology can be adopted for operational use and/or applied to additional Pacific SIDS, weighting refinements will be completed.
4.7 Research significance and conclusions
This study aimed to expand drought risk knowledge, explore effective methodological aspects of drought risk assessment, and develop a preliminary drought risk assessment methodology intended for use in PNG. Such research is minimal across Pacific SIDS and particularly underexplored in the context of PNG (Hagenlocher et al., 2019). This study made significant strides in addressing key knowledge gaps commonly missed in drought risk assessment studies in general, and drought assessment in PNG specifically, by considering specific and tailored indicator selection, consistent drought risk definitions, dynamic assessment, sufficient validation of indicators and results, and the provision of recommendations.
In this study, an unprecedented attempt at developing a tailored drought risk assessment for the provincial scale across PNG was made. The development of a tailored, meaning highly specific to the area under investigation, drought risk assessment methodology has been recognised as vital to improving risk knowledge for the development of resilient drought risk management strategies in vulnerable communities (Wilhelmi and Wilhite, 2002). Out of the disaster risk assessments that have been conducted in PNG, they have used arbitrary risk indicators (Bang et al., 2003; Allen and Bourke, 2009; Korada et al., 2018) and have been conducted on a broader (national/regional) level rather than local area (provinces) or community level (Hagenlocher et al., 2019). This research presents a methodology emphasising tailored risk assessment, with distinct criteria used to select suitable drought risk indicators. This assessment is conducted at the most local level possible at this time, the provincial level. In the future, it would be beneficial to investigate risk at the town/village level and include local user consultation in the indicator selection process; however, this is beyond the scope of the current research because of travel/resource limitations, and the remoteness of local PNG communities.
This study adopted the drought risk definitions consistent with those recommended by Hagenlocher et al. (2019). No such study has been conducted previously in PNG, where clearly defined hazard, vulnerability, and exposure components are included to assess risk for all provinces. The assessment was intended to be dynamic, but limitations saw that it was only semi-dynamic. Due to data restrictions, the vulnerability component of the risk assessment consisted of annually updated, semi-dynamic indicators. The exposure component was also semi-dynamic, with fixed data for naturally static indicators, and annually updated data for the indicators that would ideally be more dynamic, whereas the hazard component included solely dynamic factors. Thus, the overall approach is deemed a semi-dynamic drought risk assessment. For the assessment to become wholly dynamic, socio-economic data need to become more readily available. The constrained availability of relevant, reliable, and updated data is recognised as majorly detrimental to drought risk assessments across the world (González Tánago et al., 2016). The semi-dynamic assessment can still provide important results, more static assessment is useful for identifying where the origins and drivers of drought risk exist and the areas that are of priority for long-term adaptation plans (Blauhut, 2020; Hagenlocher et al., 2019; González Tánago et al., 2016).
Indicators used and results produced underwent preliminary validation; however, a more comprehensive validation method is recommended for future research. The risk assessment methodology developed in this research was overall deemed valid. It provides the foundation for conducting drought risk assessments in PNG, to increase risk knowledge and inform local drought risk management. To consolidate this methodology as reliable in an operational sense, results must undergo validation against further ground-truth sources (e.g. local accounts of past drought events). Results allowed for recommendation on disaster risk reduction in PNG, including the identification of priority areas that were detrimentally affected in previous drought, as well as recommendations for improved efficacy of the risk assessment methodology. This is a critical step commonly omitted from the risk assessment process (Blauhut, 2020; Hagenlocher et al., 2019; González Tánago et al., 2016).
Overall, this research establishes an essential foundation for tailored and valid drought risk assessments in Pacific SIDS, using drought in PNG as a case study. However, improvements to the validation methods and the indicator selection process are vital to the efficiency of the risk assessment methodology. Once refinements are made, the risk assessment methodology may be adopted on a more operational basis in PNG. The PNG NWS could conduct drought risk assessment across PNG to inform stakeholders and local users of provincial risk levels and guide preparedness plans/risk management (Pulwarty and Sivakumar, 2014). Such a methodology has the potential to not only be applied across PNG but could be tested for implementation in other vulnerable Pacific SIDS (Finucane, 2009). With the occurrence of droughts expected to be exacerbated under anthropogenic climate change, and the impacts predicted to critically affect agricultural productivity, food security, and general economic productivity, severely reducing the financial and social health of local communities in Pacific SIDS, the effective implementation of valid drought risk assessment is needed now more than ever (Pulwarty and Sivakumar, 2014).
Table A1An example of the data tables used in the sensitivity analysis. This example is for Bougainville province, analysing the sensitivity of the 2015 hazard index to 0.1 incremental changes in the SPI value. Original data tables were formatted in Excel.
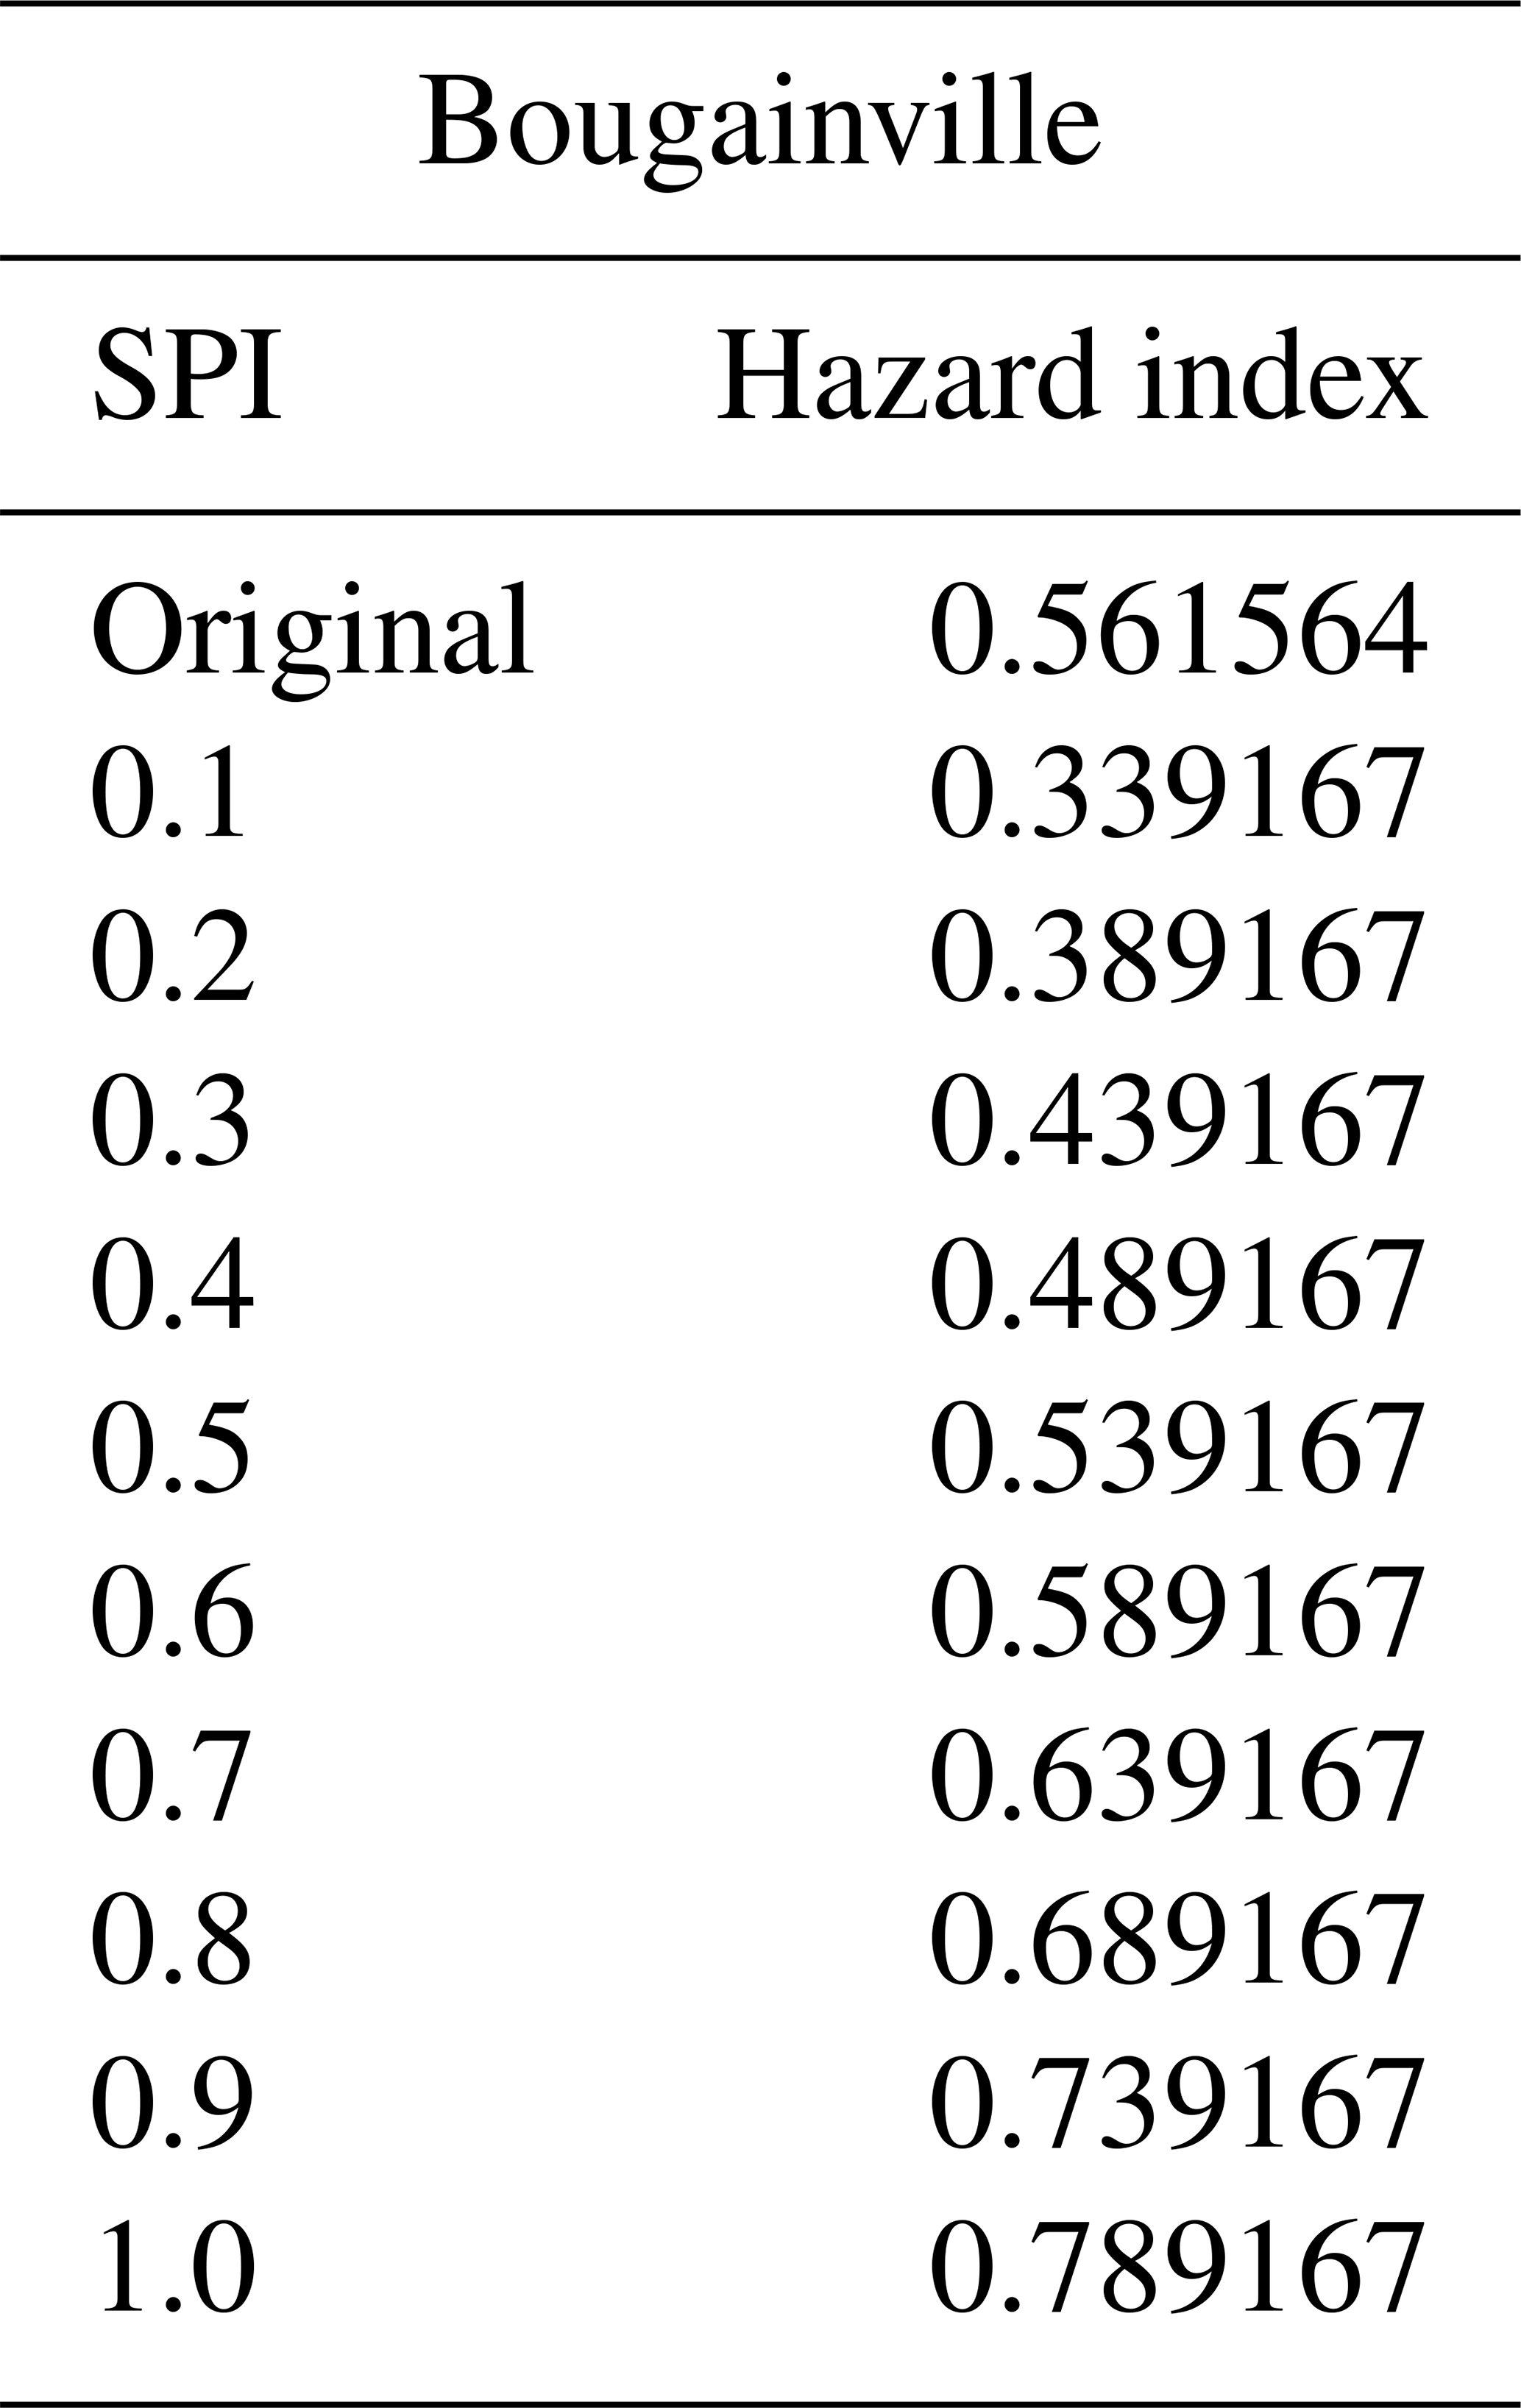
Table B1Table displaying F-test results for the 2015–2016 drought period risk assessment versus literature results.
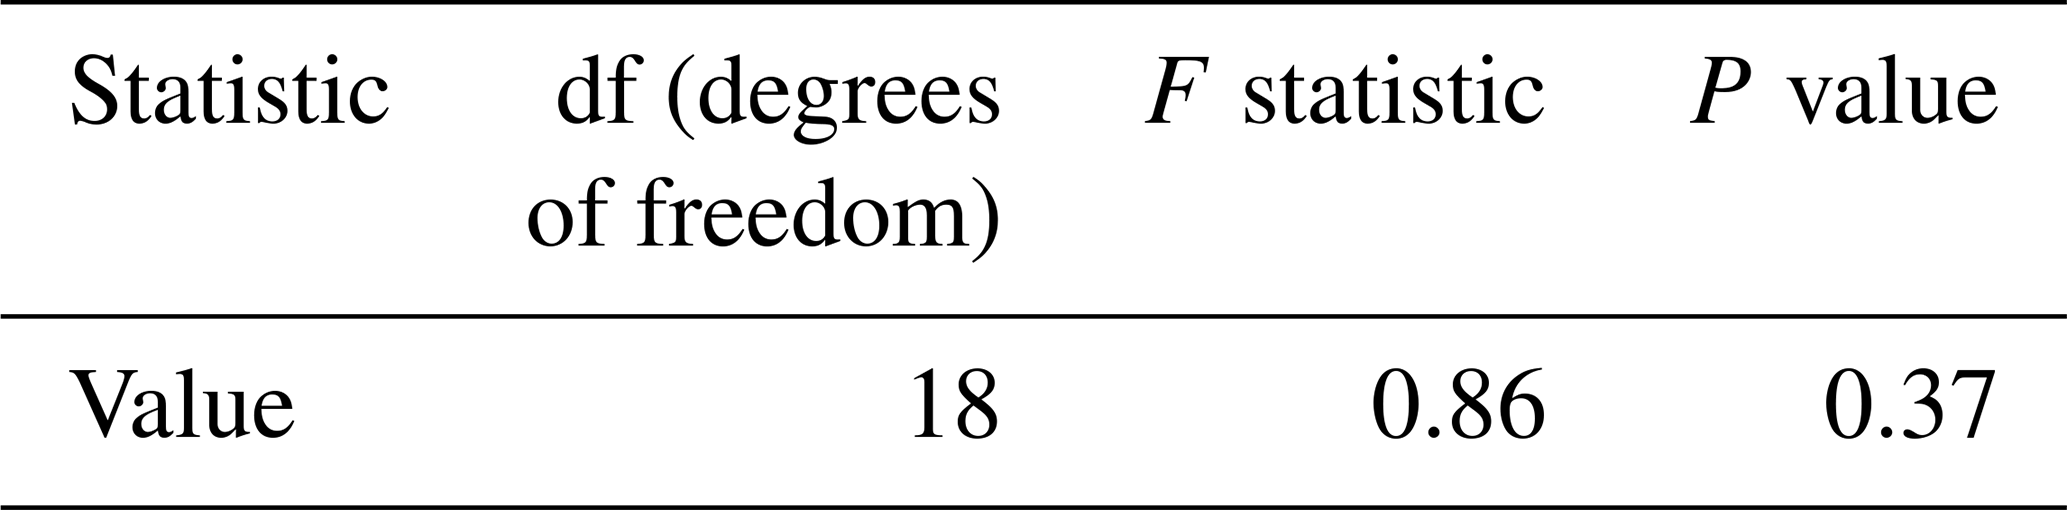
Table C1Table displaying F-test results for the 2019 drought period risk assessment versus literature results.
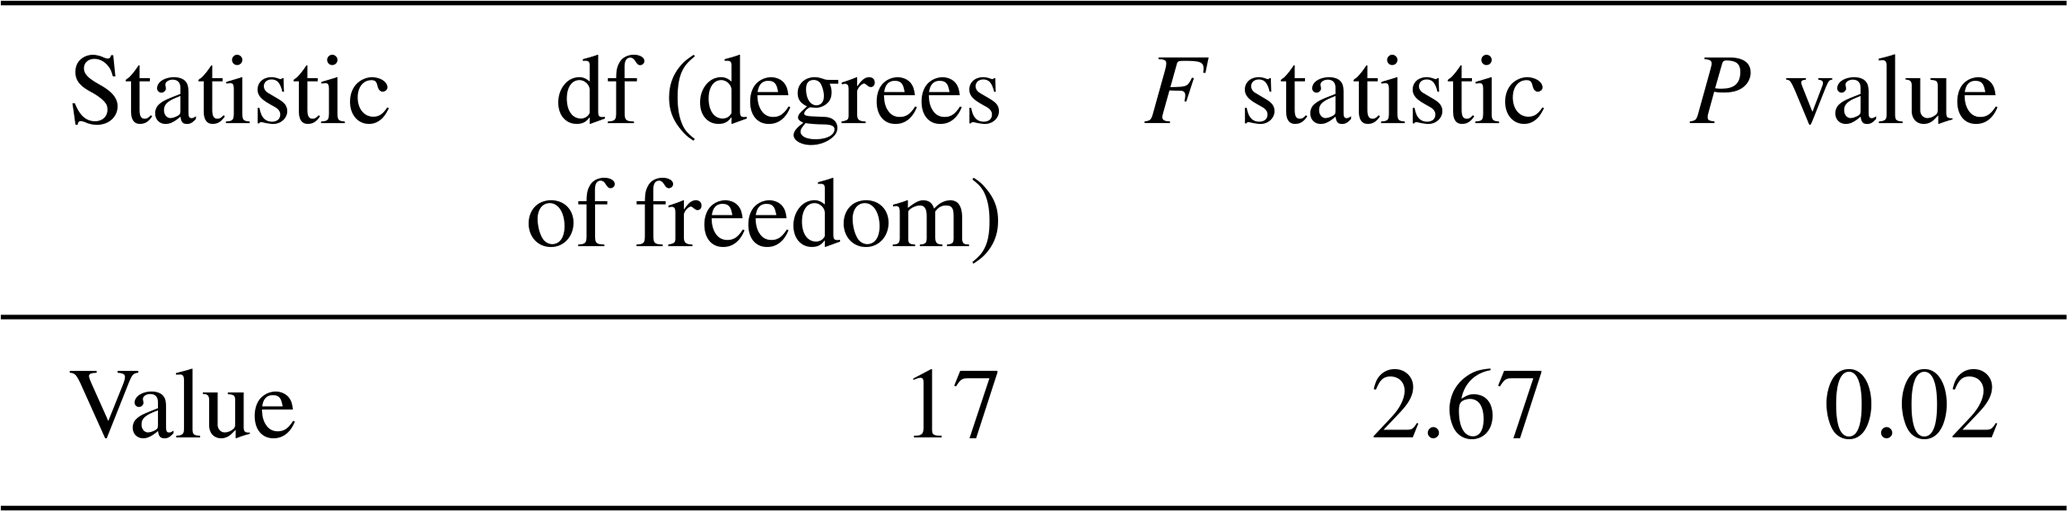
Table D1Table displaying t-test results for the 2015–2016 drought period risk assessment versus literature results.
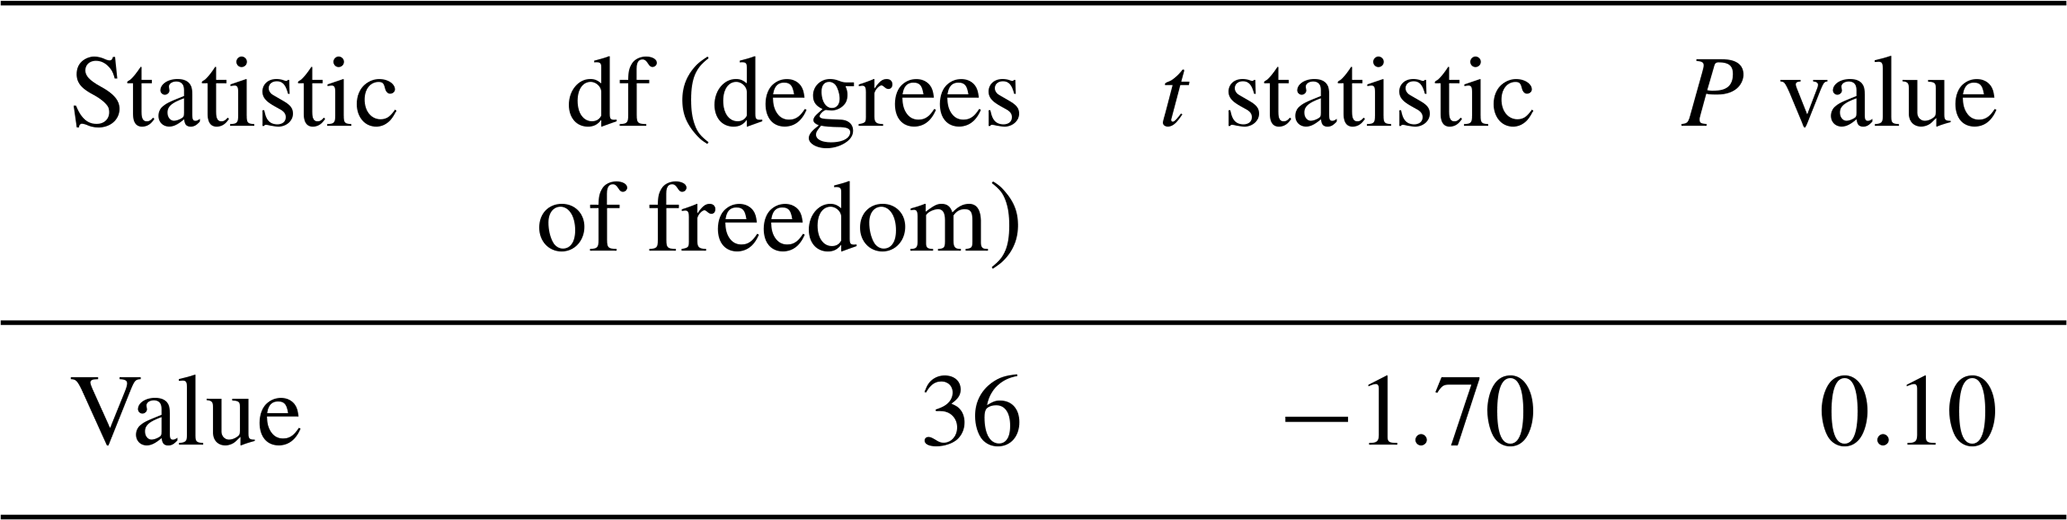
Table E1Table displaying t-test results for the 2019 drought period risk assessment versus literature results.
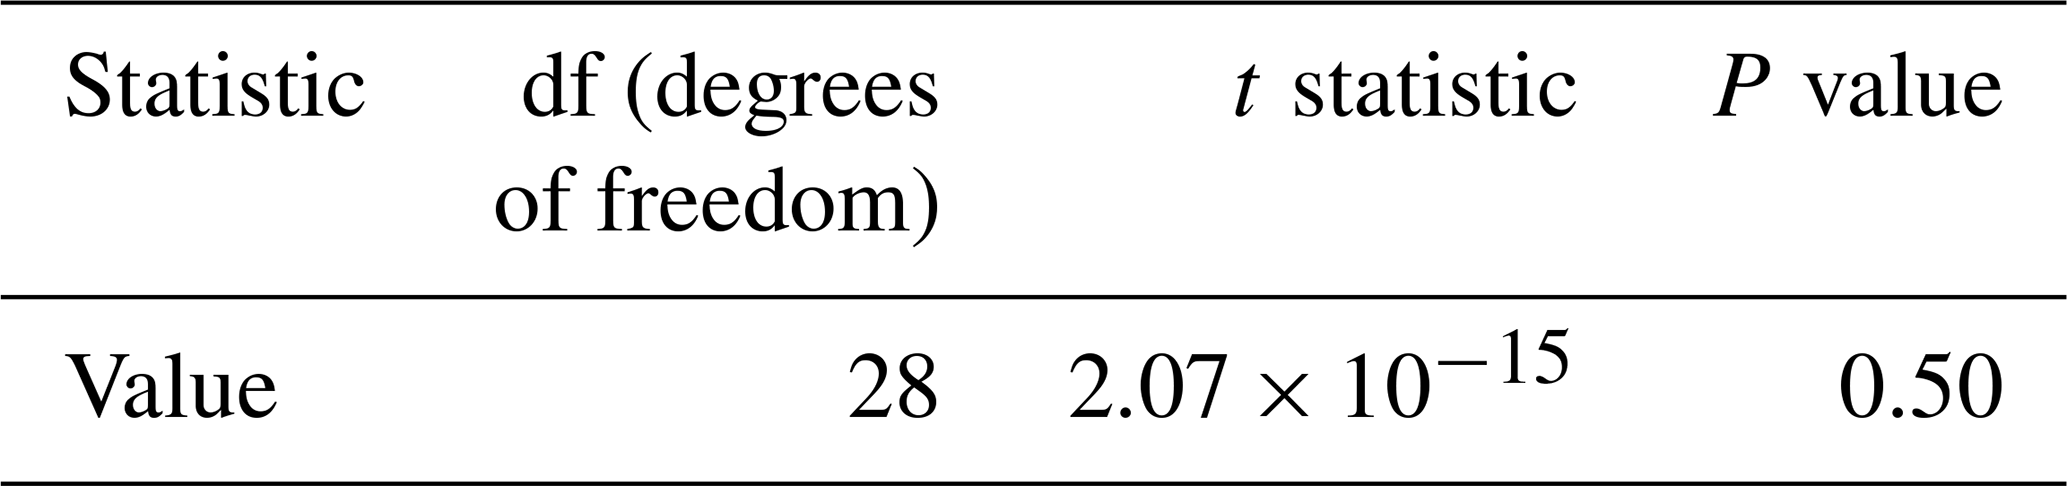
The data used in this research were open-sourced data gathered from public databases. Most vulnerability and exposure indicator data were sourced from the PNG National Statistical Office (https://dhsprogram.com/pubs/pdf/FR364/FR364.pdf, last access: 14 March 2020; National Statistical Office [Papua New Guinea] and ICF, 2019) and the United Nations Development Program (UNDP; United Nations Development Programme, 2017a, b, c), with elevation data gathered as open-sourced GIS Digital Elevation Model (DEM) data (https://png-data.sprep.org/resource/dem-2000, last access: 10 March 2020; Natera, 2016). Data for SPI and VHI data was sourced from the World Meteorological Organisation's (WMO's) Space-based Weather and Climate Extreme Monitoring (SWCEM) products (Kuleshov et al. 2019). WMO SWCEM provides access to satellite precipitation estimates and derived products from the USA National Oceanic and Atmospheric Administration's (NOAA's) Climate Prediction Center (CPC) (https://www.cpc.ncep.noaa.gov/, last access: 3 May 2021; National Aeronautics and Space Administration, 2021) and the Japan Aerospace Exploration Agency (JAXA) (SPI – https://sharaku.eorc.jaxa.jp/GSMaP_CLM/index.htm, last access: 3 May 2021; Japan Aerospace Exploration Agency and Earth Observation Research Center, 2021; VHI – https://earth.jaxa.jp/en/data/products/vegetation/index.html, last access: 3 May 2021; Japan Aerospace Exploration Agency, 2021). Additional data for SPI was gathered from the Multi-Source Weighted-Ensemble Precipitation (MSWEP) dataset (http://www.gloh2o.org/mswep/, last access: 3 May 2021; European Centre for Medium-Range Weather Forecasts et al., 2021; Beck et al. 2019). The publicly available SPI and VHI spaced-based observation data underwent transformation to suit the needs of this study. The fuzzy logic functions used in this study are explained by Environmental Systems Research Institute (Esri) Inc. (2019a, b), with example code provided (fuzzy membership function – https://pro.arcgis.com/en/pro-app/latest/tool-reference/spatial-analyst/fuzzy-membership.htm, ESRI, 2019a; fuzzy overlay function – https://pro.arcgis.com/en/pro-app/latest/tool-reference/spatial-analyst/fuzzy-overlay.htm, ESRI, 2019b).
The supplement related to this article is available online at: https://doi.org/10.5194/nhess-23-553-2023-supplement.
IA was lead for conceptualisation, methodology, software, validation, formal analysis, writing – original draft preparation and review and editing, and visualisation. YK contributed to conceptualisation, methodology, writing – review and editing, research supervision, and funding acquisition. JB and ZWC aided in formal analysis and writing – review and editing. CS and SC contributed to writing – review and editing and supervision. All authors have read and agreed to the published version of the manuscript.
The contact author has declared that none of the authors has any competing interests.
Publisher’s note: Copernicus Publications remains neutral with regard to jurisdictional claims in published maps and institutional affiliations.
This research was supported by the World Meteorological Organization's (WMO) “Weather and Climate Early Warning System for Papua New Guinea” (CREWS-PNG), as well as Van CISRDP (Climate Information Services for Resilient Development in Vanuatu)/Van-KIRAP (Vanuatu Klaemet blong Redy, Adapt mo Protekt) and COSPPac (Climate and Oceans Support Program in the Pacific) programmes.
This research has been supported by the CREWS (Climate Risk and Early Warning Systems) project 20170888.
This paper was edited by Daniela Molinari and reviewed by four anonymous referees.
Aerts, J. C. J. H., Botzen, W. J., Clarke, K. C., Cutter, S. L., Hall, J. W., Merz, B., Michel-Kerjan, E., Mysiak, J., Surminski, S., and Kunreuther, H.: Integrating human behaviour dynamics into flood disaster risk assessment, Nat. Clim. Change, 8, 193–199, https://doi.org/10.1038/s41558-018-0085-1, 2018.
Aitkenhead, I., Kuleshov, Y., Watkins, A. B., Bhardwaj, J., and Asghari, A.: Assessing agricultural drought management strategies in the Northern Murray–Darling Basin, Nat. Hazards, 109, 1425–1455, https://doi.org/10.1007/s11069-021-04884-6, 2021.
Allan, R. J., Gergis, J., and D'Arrigo, R. D.: Placing the AD 2014–2016 “protracted” El Niño episode into a long-term context, Holocene, 30, 90–105, https://doi.org/10.1177/0959683619875788, 2019.
Allen, B. and Bourke, R.: The 1997–98 Drought in Papua New Guinea: Failure of Policy or Triumph of the Citizenry?, in: Policy Making and Implementation Studies from Papua New Guinea, edited by: May, R., State, Society and Governance in Melanesia, ANU Press, Australia, 325–343, http://hdl.handle.net/1885/49463 (last access: 5 July 2021), 2009.
Anand, A., Agrawal, M., Bhatt, N., and Ram, M.: Software Patch Scheduling Policy Incorporating Functional Safety Standards, in: Advances in System Reliability Engineering, Academic Press, 267–279, https://doi.org/10.1016/B978-0-12-815906-4.00011-7, 2019.
Annamalai, H., Keener, V., Widlansky, M. J., and Hafner, J.: El Niño Strengthens in the Pacific: Preparing for the Impacts of Drought, AsiaPacific, 122, 2–10, 2015.
Asare-Kyei, D., Renaud, F. G., Kloos, J., Walz, Y., and Rhyner, J.: Development and validation of risk profiles of West African rural communities facing multiple natural hazards, PLOS ONE, 12, e0171921, https://doi.org/10.1371/journal.pone.0171921, 2017.
Bang, S. and Crimp, S.: Accessible weather forecasts, advisories key to PNG farm resilience, Partners in Research for Development, 3, 14–17, https://search.informit.org/doi/10.3316/informit.950510834174223 (last access: 2 July 2021), 2019.
Bang, S., Sitango, K., and UN.ESCAP: Indigenous Drought Coping Strategies and Risk Management against El Nino in Papua New Guinea, CGPRT Centre Working Paper, Papua New Guinea, https://hdl.handle.net/20.500.12870/4190 (last access: 2 July 2021), 2003.
Beck, H. E., Wood, E. F., Pan, M., Fisher, C. K., Miralles, D. G., Van Dijk, A. I. J. M., McVicar, T. R., and Adler, R. F.: MSWEP V2 Global 3-Hourly 0.1 Precipitation: Methodology and Quantitative Assessment, B. Am. Meteorol. Soc., 100, 473–500, https://doi.org/10.1175/BAMS-D-17-0138.1, 2019.
Benzie, M., Hedlund, J., and Carlsen, H.: Introducing the Transnational Climate Impacts Index: Indicators of country-level exposure – methodology report, Stockholm Environment Institute, 7, 3–43, https://www.weadapt.org/sites/weadapt.org/files/2017/november/sei-wp-2016-07-introducing-tci-index.pdf (last access: 2 July 2021), 2016.
Bhardwaj, J., Kuleshov, Y., Watkins, A. B., Aitkenhead, I., and Asghari, A.: Building capacity for a user-centred Integrated Early Warning System (I-EWS) for drought in the Northern Murray-Darling Basin, Nat. Hazards, 107, 97–122, https://doi.org/10.1007/s11069-021-04575-2, 2021a.
Bhardwaj, J., Kuleshov, Y., Chua, Z.-W., Watkins, A. B., Choy, S., and Sun, Q.: Building Capacity for a User-Centred Integrated Early Warning System for Drought in Papua New Guinea, Remote Sens., 13, 3307, https://doi.org/10.3390/rs13163307, 2021b.
Bijaber, N.: Developing a remotely sensed drought monitoring indicator for Morocco, Geosciences, 8, 55, https://doi.org/10.3390/geosciences8020055, 2018.
Blauhut, V.: The triple complexity of drought risk analysis and its visualisation via mapping: a review across scales and sectors, Earth-Sci. Rev., 210, 103345, https://doi.org/10.1016/j.earscirev.2020.103345, 2020.
Bonnafous, L., Lall, U., and Siegel, J.: An index for drought induced financial risk in the mining industry, Water Resour. Res., 53, 1509–1524, https://doi.org/10.1002/2016WR019866, 2017.
Broughton, B.: Evaluation of Australia’s response to El Niño Drought and Frosts in PNG 2015-17, INL847, Australian Department of Foreign Affairs and Trade, Australian Government, https://www.dfat.gov.au/sites/default/files/evaluation-of-australias-response-to-png-el-nino-drought-2015-2017.pdf (last access: 5 May 2020), 2017.
Burivalova, Z., Towsey, M., Boucher, T., Truskinger, A., Apelis, C., Roe, P., and Game, E. T.: Using soundscapes to detect variable degrees of human influence on tropical forests in Papua New Guinea, Conserv. Biol., 32, 205–215, https://doi.org/10.1111/cobi.12968, 2017.
Chand, S.: Registration and release of customary-land for private enterprise: Lessons from Papua New Guinea, Land Use Policy, 61, 413–419, https://doi.org/10.1016/j.landusepol.2016.11.039, 2017.
Chen, K., Blong, R., and Jacobson, C.: Towards an integrated approach to natural hazards risk assessment using GIS: with reference to bushfires, Environ. Manage., 31, 546–560, https://doi.org/10.1007/s00267-002-2747-y, 2003.
Chua, Z.-W., Kuleshov, Y., and Watkins, A. B.: Drought Detection over Papua New Guinea Using Satellite-Derived Products, Remote Sens., 12, 3859, https://doi.org/10.3390/rs12233859, 2020.
Dayal, K. S., Deo, R. C., and Apan, A. A.: Spatio-temporal drought risk mapping approach and its application in the drought-prone region of south-east Queensland, Australia, Nat. Hazards, 93, 823–847, https://doi.org/10.1007/s11069-018-3326-8, 2018.
De Deckker, P.: The Indo-Pacific Warm Pool: critical to world oceanography and world climate, Geoscience Letters, 3, 20, https://doi.org/10.1186/s40562-016-0054-3, 2016.
Environmental Systems Research Institute (ESRI) Inc.: Fuzzy membership, ArcGIS Pro (10.7.1), Environmental Systems Research Institute (ESRI) Inc. [code], https://pro.arcgis.com/en/pro-app/latest/tool-reference/spatial-analyst/fuzzy-membership.htm (last access: 15 December 2020), 2019a.
Environmental Systems Research Institute (ESRI) Inc.: Fuzzy overlay, ArcGIS Pro (10.7.1), Environmental Systems Research Institute (ESRI) Inc. [code], https://pro.arcgis.com/en/pro-app/latest/tool-reference/spatial-analyst/fuzzy-overlay.htm (last access: 15 December 2020), 2019b.
European Centre for Medium-Range Weather Forecasts (ECMWF), National Aeronautics and Space Administration (NASA), and National Aeronautics and Space Administration (NOAA): MSWEP (Multi-Source Weighted-Ensemble Precipitation), GloH20 [data set], http://www.gloh2o.org/mswep/, last access: 3 May 2021.
Fallon, A. L., Villholth, K. G., Conway, D., Lankford, B. A., and Ebrahim, G. Y.: Agricultural groundwater management strategies and seasonal climate forecasting: perceptions from Mogwadi (Dendron), Limpopo, South Africa, J. Water Clim. Change, 10, 142–157, https://doi.org/10.2166/wcc.2018.042, 2018.
Farok, G. and Homayouni, S.: Foundations of mathematics play the baseline for data exploring, forecasting and analyzing of risks to get an economic decision, African Journal of Engineering Research, 6, 25–31, https://doi.org/10.30918/AJER.62.18.006, 2018.
Fekete, A.: Social Vulnerability (Re-)Assessment in Context to Natural Hazards: Review of the Usefulness of the Spatial Indicator Approach and Investigations of Validation Demands, Int. J. Disast. Risk Sc., 10, 220–232, https://doi.org/10.1007/s13753-019-0213-1, 2019.
Finucane, M. L.: Why science alone won't solve the climate crisis: Managing climate risks in the Pacific, Asia Pacific Issues, 89, 1–8, http://hdl.handle.net/10125/11545 (last access: 1 July 2021), 2009.
Food and Agriculture Organisation of the United Nations: FAO 2020–2021 La Niña advisory, Food and Agriculture Organisation of the United Nations, Rome, 1–14, https://www.fao.org/3/cb2954en/cb2954en.pdf, last access: 10 June 2021.
Food Security Cluster, Secretariat of the Pacific Regional Environment Programme, and World Food Programme: Anticipatory Action Advisory for Pacific Food Security – La Niña 2021, Italy, Pacific Food Security Cluster, https://fscluster.org/pacific/document/anticipatory-action-advisory-pacific-0, last access: 10 June 2021.
Fragaszy, S. R., Jedd, T., Wall, N., Knutson, C., Fraj, M. B., Bergaoui, K., Svoboda, M., Hayes, M., and McDonnell, R.: Drought Monitoring in the Middle East and North Africa (MENA) Region: Participatory Engagement to Inform Early Warning Systems, B. Am. Meteorol. Soc., 101, E1148–E1173, https://doi.org/10.1175/BAMS-D-18-0084.1, 2020.
Frischen, J., Meza, I., Rupp, D., Wietler, K., and Hagenlocher, M.: Drought Risk to Agricultural Systems in Zimbabwe: A Spatial Analysis of Hazard, Exposure, and Vulnerability, Sustainability, 12, 752, https://doi.org/10.3390/su12030752, 2020.
González Tánago, I., Urquijo, J., Blauhut, V., Villarroya, F., and De Stefano, L.: Learning from experience: a systematic review of assessments of vulnerability to drought, Nat. Hazards, 80, 951–973, https://doi.org/10.1007/s11069-015-2006-1, 2016.
Gwatirisa, P. R., Pamphilon, B., and Mikhailovich, K.: Coping with Drought in Rural Papua New Guinea: A Western Highlands Case Study, Ecol. Food Nutr., 56, 393–410, https://doi.org/10.1080/03670244.2017.1352504, 2017.
Hagenlocher, M., Meza, I., Anderson, C. C., Min, A., Renaud, F. G., Walz, Y., Siebert, S., and Sebesvari, Z.: Drought vulnerability and risk assessments: state of the art, persistent gaps, and research agenda, Environ. Res. Lett., 14, 083002, https://doi.org/10.1088/1748-9326/ab225d, 2019.
Hagenlocher, M., Thieken, A., Schneiderbauer, S., Aguirre Ayerbe, I., Dobes, P., Donovan, A., Morsut, C., Paris, N., Pedoth, L., and Tonmoy, F.: Risk Assessment, in: Science for Disaster Risk Management 2020: acting today, protecting tomorrow, edited by: Casajus Valles, A., Marin Ferrer, M., Poljanšek, K., and Clark, I., Publications Office of the European Union, Luxembourg, 54–65, https://doi.org/10.2760/571085, 2020.
Horton, J. B., Lefale, P., and Keith, D.: Parametric Insurance for Solar Geoengineering: Insights from the Pacific Catastrophe Risk Assessment and Financing Initiative, Glob. Policy, 12, 97–107, https://doi.org/10.1111/1758-5899.12864, 2021.
Iese, V., Kiem, A. S., Mariner, A., Malsale, P., Tofaeono, T., Kirono, D. G. C., Round, V., Heady, C., Tigona, R., Veisa, F., Posanau, K., Aiono, F., Haruhiru, A., Daphne, A., Vainikolo, V., and Iona, N.: Historical and future drought impacts in the Pacific islands and atolls, Clim. Change, 166, 19, https://doi.org/10.1007/s10584-021-03112-1, 2021.
Jacka, J. K.: In the Time of Frost: El Niño and the Political Ecology of Vulnerability in Papua New Guinea, Anthropol. Forum, 30, 141–156, https://doi.org/10.1080/00664677.2019.1647832, 2020.
Japan Aerospace Exploration Agency (JAXA): Earth-graphy and Space Technology Directorate: Vegetation, Japan Aerospace Exploration Agency (JAXA) [data set], https://earth.jaxa.jp/en/data/products/vegetation/index.html, last access: 3 May 2021.
Japan Aerospace Exploration Agency (JAXA) and Earth Observation Research Center (EORC): Japan Aerospace Exploration Agency (JAXA) Climate Rainfall Watch, GSMaP (Global Satellite Mapping of Precipitation) [data set], https://sharaku.eorc.jaxa.jp/GSMaP_CLM/index.htm, last access: 3 May 2021.
Johnson, N. C., L'Heureux, M. L., Chang, C. H., and Hu, Z. Z.: On the Delayed Coupling Between Ocean and Atmosphere in Recent Weak El Niño Episodes, Geophys. Res. Lett., 46, 11416–11425, https://doi.org/10.1029/2019GL084021, 2019.
Kanua, M., Bourke, R., Jinks, B., and Lowe, M.: Assessing Village Food Needs Following a Natural Disaster in Papua New Guinea, Church Partnership Program, Port Moresby, http://hdl.handle.net/1885/109282 (last access: 8 July 2021), 2016.
Korada, N., Sekac, T., Jana, S. K., and Pal, S. K.: Delineating Drought Risk Areas Using Remote Sensing and Geographic Information Systems – A Case Study of Western Highlands Province, Papua New Guinea, European Journal of Engineering and Technology Research, 3, 103–110, https://doi.org/10.24018/ejeng.2018.3.10.937, 2018.
Kuleshov, Y., McGree, S., Jones, D., Charles, A., Cottrill, A., Prakash, B., Atalifo, T., Nihmei, S., and Seuseu, F. L. S. K.: Extreme weather and climate events and their impacts on island countries in the Western Pacific: cyclones, floods and droughts, Atmospheric and Climate Sciences, 4, 803–818, https://doi.org/10.4236/acs.2014.45071, 2014.
Kuleshov, Y., Kurino, T., Kubota, T., Tashima, T., and Xie, P.: WMO Space-based Weather and Climate Extremes Monitoring Demonstration Project (SEMDP): First Outcomes of Regional Cooperation on Drought and Heavy Precipitation Monitoring for Australia and Southeast Asia, in: Rainfall – Extremes, Distribution and Properties, edited by: Abbot, J. and Hammond, A., IntechOpen, https://doi.org/10.5772/intechopen.85824, 2019.
Kuleshov, Y., Inape, K., Watkins, A., Bear-Crozier, A., Chua, Z.-W., Xie, P., Kubota, T., Tashima, T., Stefanski, R., and Kurino, T.: Climate Risk and Early Warning Systems (CREWS) for Papua New Guinea, in: Drought – Detection and Solutions, edited by: Ondrasek, G., IntechOpen, https://doi.org/10.5772/intechopen.85962, 2020.
Le, T., Sun, C., Choy, S., and Kuleshov, Y.: Regional drought risk assessment in the Central Highlands and the South of Vietnam, Geomat. Nat. Hazards Risk, 12, 3140–3159, https://doi.org/10.1080/19475705.2021.1998232, 2021.
Mckenna, K. and Yakam, L.: Signs of “The End Times”: Perspectives on Climate Change Among Market Sellers in Madang, Papua New Guinea, in: Beyond Belief: Opportunities for Faith-engaged Approaches to Climate-change Adaptation in the Pacific Islands, edited by: Luetz, J., and Nunn, P., Springer Nature, Switzerland, 139–153, https://doi.org/10.1007/978-3-030-67602-5_8, 2021.
Mercer, J.: Disaster risk reduction or climate change adaptation: Are we reinventing the wheel?, J. Int. Dev., 22, 247–264, 2010.
Molinari, D., De Bruijn, K. M., Castillo-Rodríguez, J. T., Aronica, G. T., and Bouwer, L. M.: Validation of flood risk models: Current practice and possible improvements, Int. J. Disast. Risk Re., 33, 441–448, https://doi.org/10.1016/j.ijdrr.2018.10.022, 2019.
Mosquera-Machado, S. and Dilley, M.: A comparison of selected global disaster risk assessment results, Nat. Hazards, 48, 439–456, https://doi.org/10.1007/s11069-008-9272-0, 2009.
Nagarajan, R. and Ganapuram, S.: Micro-Level Drought Vulnerability Assessment Using Standardised Precipitation Index, Standardised Water-Level Index, Remote Sensing and GIS, The Asian Conference on Remote Sensing (ACRS): Fostering Resilient Growth in Asia, 36, https://citeseerx.ist.psu.edu/document?repid=rep1&type=pdf&doi=552d4f6380d8d45325c3d8eeb103d38d654794fa (last access: 1 July 2021), 2015.
Nasrollahi, M., Khosravi, H., Moghaddamnia, A., Malekian, A., and Shahid, S.: Assessment of drought risk index using drought hazard and vulnerability indices, Arab. J. Geosci., 11, 606, https://doi.org/10.1007/s12517-018-3971-y, 2018.
Natera, G. P.: 1 km DEM with Districts, Spatial data and systems data (GIS) branch, Environment Information & Science Division, Department of Environment & Conservation, PNG Government [data set], https://png-data.sprep.org/resource/dem-2000 (last access: 10 March 2020), 2016.
National Aeronautics and Space Administration (NOAA): Global Precipitation Monitoring, National Aeronautics and Space Administration (NOAA)/National Weather Service, Centre for Weather and Climate Prediction [data set], https://www.cpc.ncep.noaa.gov/, last access: 3 May 2021.
National Statistical Office (NSO) [Papua New Guinea] and ICF: Papua New Guinea Demographic and Health Survey 2016-18, Port Moresby, Papua New Guinea, and Rockville, Maryland, USA, NSO and ICF, FR364 [data set], https://dhsprogram.com/pubs/pdf/FR364/FR364.pdf (last access: 13 May 2021), 2019.
Nicholls, N.: Atmospheric and Climatic Hazards: Improved Monitoring and Prediction for Disaster Mitigation, Nat. Hazards, 23, 137–155, https://doi.org/10.1023/A:1011130223164, 2001.
Pacific Islands Forum Secretariat: 2015 Pacific Regional MDG Tracking Report, Fiji, 1–166, ISBN 978-982-202-041-0, 2015.
Peskun, P. H.: Two-Tailed p-Values and Coherent Measures of Evidence, Am. Stat., 74, 80–86, https://doi.org/10.1080/00031305.2018.1475304, 2020.
Pulwarty, R. S. and Sivakumar, M. V. K.: Information systems in a changing climate: Early warnings and drought risk management, Weather and Climate Extremes, 3, 14–21, https://doi.org/10.1016/j.wace.2014.03.005, 2014.
Rahmati, O., Panahi, M., Kalantari, Z., Soltani, E., Falah, F., Dayal, K. S., Mohammadi, F., Deo, R. C., Tiefenbacher, J., and Tien Bui, D.: Capability and robustness of novel hybridized models used for drought hazard modeling in southeast Queensland, Australia, Sci. Total Environ., 718, 134656, https://doi.org/10.1016/j.scitotenv.2019.134656, 2020.
RIMES and Papua New Guinea National Weather Service: ENSO Impact Outlook: Papua New Guinea 2017/2018 (La Niña), Papua New Guinea, https://reliefweb.int/report/papua-new-guinea/enso-impact-outlook-papua-new-guinea-20172018-la-ni (last access: 10 June 2021), 2017.
Safavi, H., Khoshoei Esfahani, M., and Zamani, A.: Integrated Index for Assessment of Vulnerability to Drought, Case Study: Zayandehrood River Basin, Iran, Water Resour. Manag., 28, 1671–1688, https://doi.org/10.1007/s11269-014-0576-4, 2014.
Schmidt, E., Gilbert, R., Holtemeyer, B., and Mahrt, K.: Poverty analysis in the lowlands of Papua New Guinea underscores climate vulnerability and need for income flexibility, Aust. J. Agr. Resour. Ec., 65, 171–191, https://doi.org/10.1111/1467-8489.12404, 2021.
Sharafi, L., Zarafshani, K., Keshavarz, M., Azadi, H., and Van Passel, S.: Drought risk assessment: Towards drought early warning system and sustainable environment in western Iran, Ecol. Indic., 114, 106276, https://doi.org/10.1016/j.ecolind.2020.106276, 2020.
Smith, I., Moise, A., Inape, K., Murphy, B., Colman, R., Power, S., and Chung, C.: ENSO-Related Rainfall Changes over the New Guinea Region, J. Geophys. Res.-Atmos., 118, 10665–10675, https://doi.org/10.1002/jgrd.50818, 2013.
Sun, C., Choy, S., Chua, Z., Aitkenhead, I., and Kuleshov, Y.: GEOGRAPHIC INFORMATION SYSTEM FOR DROUGHT RISK MAPPING IN AUSTRALIA – DROUGHT RISK ANALYSER WEB APP, Int. Arch. Photogramm. Remote Sens. Spatial Inf. Sci., XLIV-3/W1-2020, 139–144, https://doi.org/10.5194/isprs-archives-XLIV-3-W1-2020-139-2020, 2020.
Svoboda, M. and Fuchs, B.: Handbook of Drought Indicators and Indices, World Meteorological Organization (WMO) and Global Water Partnership (GWP), ISBN 9781315265551, 2016.
United Nations Development Programme (UNDP): Climate risk, vulnerability and risk assessment in the New Ireland province in Papua New Guinea, Antea Group, Belgium, Document ID: 2291483035, https://info.undp.org/docs/pdc/Documents/PNG/Report_Climate%20Risk%20Vulnerability%20Assessment_New%20Ireland.pdf (last access: 24 May 2021), 2017a.
United Nations Development Programme (UNDP): Climate risk, vulnerability and risk assessment in the Northern province in Papua New Guinea, Antea Group, Belgium, Document ID: 2291483031, https://info.undp.org/docs/pdc/Documents/PNG/Report_Climate%20Risk%20Vulnerability%20Assessment_Northern.pdf (last access: 24 May 2021), 2017b.
United Nations Development Programme (UNDP): Climate risk, vulnerability and risk assessment in the East Sepik province in Papua New Guinea, Antea Group, Belgium, Document ID: 2291483036, https://info.undp.org/docs/pdc/Documents/PNG/Report_Climate%20Risk%20Vulnerability%20Assessment_East%20Sepik.pdf (last access: 24 May 2021), 2017c.
Varotsos, C. A., Cracknell, A. P., and Efstathiou, M. N.: The global signature of the El Niño/La Niña Southern Oscillation, Int. J. Remote Sens., 39, 5965–5977, https://doi.org/10.1080/01431161.2018.1465617, 2018.
Whitfield, S., Beauchamp, E., Boyd, D. D., Burslem, D., Byg, A., Colledge, F., Cutler, M. E. J., Didena, M., Dougill, A., Foody, G., Goodbold, J. A., Hazenbosch, M., Hirons, M., Speranza, C. I., Jew, E., Lacambra, C., Mkwambisi, D., Moges, A., Morel, A., Morris, R., Novo, P., Rueda, M., Smith, H., Solan, M., Spencer, T., Thornton, A., Touza, J., and White, P. C. L.: Exploring temporality in socio-ecological resilience through experiences of the 2015–16 El Niño across the Tropics, Glob. Environ. Change, 55, 1-14, https://doi.org/10.1016/j.gloenvcha.2019.01.004, 2019.
Wilhelmi, O. V. and Wilhite, D. A.: Assessing Vulnerability to Agricultural Drought: A Nebraska Case Study, Nat. Hazards, 25, 37–58, https://doi.org/10.1023/A:1013388814894, 2002.
Wilhite, D. A., Sivakumar, M. V. K., and Pulwarty, R.: Managing drought risk in a changing climate: The role of national drought policy, Weather and Climate Extremes, 3, 4–13, https://doi.org/10.1016/j.wace.2014.01.002, 2014.
World Food Programme: The Impact of Drought related to El Niño, Papua New Guinea, https://reliefweb.int/report/papua-new-guinea/papua-new-guinea-impact-drought-related-el-ni-o-10-april-2019 (last access: 10 June 2021), 2019.
Wu, H. and Wilhite, D. A.: An Operational Agricultural Drought Risk Assessment Model for Nebraska, USA, Nat. Hazards, 33, 1–21, https://doi.org/10.1023/B:NHAZ.0000034994.44357.75, 2004.
Zhao, J., Zhang, Q., Zhu, X., Shen, Z., and Yu, H.: Drought risk assessment in China: Evaluation framework and influencing factors, Geography and Sustainability, 3, 220–228, https://doi.org/10.1016/j.geosus.2020.06.005, 2020.
This methodology follows the process of historical risk assessment validation, as in Wu and Wilhite (2004); however due to the limited data range available for selected indices, it is inappropriate to call this a historical risk assessment. It is therefore deemed a retrospective risk assessment.
Fuzzy small: a transformation function used when smaller input values are most likely to influence drought risk.
Fuzzy large: a transformation function used when larger input values are most likely to influence drought risk.
The base map used for all mapping in this study was gathered from the open-sourced platform, GISMap.
Statistical tests were performed in Microsoft Excel.