the Creative Commons Attribution 4.0 License.
the Creative Commons Attribution 4.0 License.
 | 14 Dec 2023
Climatological occurrences of hail and tornadoes associated with mesoscale convective systems in the United States
Hail and tornadoes are hazardous weather events responsible for significant property damage and economic loss worldwide. The most devastating occurrences of hail and tornadoes are commonly produced by supercells in the United States. However, these supercells may also grow upscale into mesoscale convective systems (MCSs) or be embedded within them. The relationship between hail and tornado occurrences with MCSs in the long-term climatology has not been thoroughly examined. In this study, radar features associated with MCSs are extracted from a 14-year MCS tracking database across the contiguous United States, and hazard reports are mapped to these MCS features. We investigate the characteristics of hail and tornadoes in relation to MCSs, considering seasonal and regional variabilities. On average, 8 %–17 % of hail events and 17 %–32 % of tornado events are associated with MCSs, depending on the criteria used to define MCSs. The highest total and MCS-associated hazard events occur from March to May, while the highest MCS-associated portion (23 % for hail and 45 % for tornadoes) is observed in winter (December–February) due to the dominance of MCSs caused by strong synoptic forcing. As hailstone size increases, the fraction associated with MCS decreases, but there is an increasing trend for tornado severity from EF0 to EF3 (Enhanced Fujita Scale). Violent tornadoes at EF4 and EF5 associated with MCSs were also observed, which are generated by supercells embedded within MCSs.
- Article
(6853 KB) - Full-text XML
-
Supplement
(4270 KB) - BibTeX
- EndNote


Severe convective storms produce a variety of hazards, including hail, tornadoes, and strong winds, which threaten human lives and cause tens of billions of dollars in economic losses globally each year (e.g., Munich Re, 2016). In the United States, the total economic losses from severe convective storms were USD 125 billion during 2007–2016, outweighing all other natural hazards including flooding, droughts, and tropical cyclones (Baggett et al., 2018). Hail and tornadoes are highly localized and short-lived in nature, which pose a significant challenge in their prediction.
Hail can be produced by a variety of convective organizations (Trapp et al., 2005; Gallus et al., 2008; Smith et al., 2012), commonly associated with supercell thunderstorms (Moller et al., 1994; Prein and Holland, 2018), but is also found in multicellular storms (Nelson, 1987; Kennedy and Detwiler, 2003), pulse storms (isolated, short-lived thunderstorms forming in a weakly forced environment; Miller and Mote, 2017), and mesoscale convective systems (MCSs; Houze, 2004). As a result, supercells are typically considered the most prolific producers of hail relative to other modes of convection, such as ordinary cells, multi-cells, MCSs, and unclassifiable types of convection (Duda and Gallus, 2010). The environments that support hail-producing storms show strong and persistent updrafts (Blair et al., 2017), large convective available potential energy (CAPE), 0–6 km bulk wind shear (Craven et al., 2004), and 0–3 km storm-relative helicity (Prein and Holland, 2018), which are also observed within MCSs. Past studies on the relationship of hail with MCSs focused on quasi-linear convective systems (QLCSs; a subset of MCSs). Derived from a 22-year (1996–2017) observational dataset, 10 % of severe hail events (with hailstone diameter greater than or equal to 1 in. (1 in. = 2.54 cm)) were attributed to QLCSs over the entire contiguous United States (CONUS) by Ashley et al. (2019). Using data from a shorter period (2003–2011), Smith et al. (2012) reported that 0.8 % of significant severe hail events (with hailstone diameter greater than or equal to 2 in. = 5.08 cm) were produced by QLCSs.
Compared to the formation of hail, tornadogenesis may have different environmental conditions including high surface moisture supply and directional wind shear in the lowest 1 km (Rasmussen and Blanchard, 1998; Rasmussen, 2003), which are strongly associated with supercells (Smith et al., 2012; Schumacher and Rasmussen, 2020). As a result, supercells are also known to be the most significant producers of tornadoes compared to other forms of convection, accounting for over 90 % of tornado deaths in the CONUS (Schoen and Ashley 2011; Brotzge et al., 2013). However, environments conducive to tornadogenesis are not exclusively limited to the isolated supercells. Some MCSs might produce tornadoes as revealed by observations (Nielsen and Schumacher, 2020) and numerical simulations (Nielsen and Schumacher, 2018). For example, a moist boundary layer with large, low-level vertical shear may induce supercell-like rotation within MCSs (Schumacher and Rasmussen, 2020). Past studies have attributed 13.8 % to 21 % of all tornadoes to QLCSs (Ashley et al., 2019; Smith et al., 2012). For significant tornadoes (with the Enhanced Fujita Scale (EF) rating of 2–5), 20 % of those events were linked to QLCSs from 2000 to 2008 (Grams et al., 2006). For the most extreme case, a QLCS has been reported for the unprecedented production of 76 tornadoes on 27 April 2011 (Knupp et al., 2014). More recently, by using the mesocyclonic updraft classification, Murphy et al. (2023) found that MCS-classified cells generated the highest number of tornadoes year-round compared to other storm patterns. This suggests that many of the cells classified as being the MCS type exhibit dynamics consistent with supercell storms rather than the usual non-mesocyclonic cells commonly found in an MCS.
MCSs are considered the largest form of convective clouds (Houze, 2004) with spatial scales of hundreds of kilometers and a lifespan of several hours to beyond a day (Houze et al., 2015; Feng et al., 2018, 2019). MCSs are commonly observed in many regions of the Earth (Wang et al., 2019a; Houze et al., 2019; Feng et al., 2021) and significantly impact precipitation, radiative forcing, and general circulation (Houze, 2018). Hazard-producing supercells, multi-cells, and pulse storms can grow upscale and merge with nearby storms into an MCS. In addition, new quasi-linear or clustered convective features can be generated near pre-existing boundaries, such as fronts, outflow convectively generated gravity waves, or mesoscale convective vortices (Schumacher, 2009) within MCSs, and subsequently produce hail and tornadoes.
Quantifying the relationship of hail and tornado occurrences with MCSs which have large spatial (over 100 km) and temporal scales (over 10 h) has important implications in understanding the predictability of weather hazards at the medium-range forecasts (i.e., subseasonal to seasonal scales). Many recent studies have empirically related the change in hazard activities and their spatial pattern over the US to large-scale disturbances, such as the Global Wind Oscillation (Gensini and Allen, 2018; Gensini and Marinaro, 2016; Moore, 2018), El Niño–Southern Oscillation (ENSO; Allen et al., 2015; Childs et al., 2018), and the Madden–Julian Oscillation (MJO; Barrett and Gensini, 2013; Barrett and Henley, 2015; Baggett et al., 2018). More recently, the environmental factors most likely contributing to the interannual variability in hail occurrence over the southern and northern Great Plains have been investigated by Jeong et al. (2020, 2021), suggesting a statistical method of hail prediction. The direct empirical linkages between hazard activities and large-scale features indeed have a practical implication for the seasonal predictability of such events (e.g., Lepore et al., 2017). However, there is an important scale gap that needs to be filled to better understand how large-scale features could regulate the hazard activities at the micro- and mesoscale. With MCSs existing at the mesoscale, we can not only gain an improved understanding of the mechanism of how the large-scale features influence the local hazard activity by establishing MCS–hazard relationships but also improve the medium-range (subseasonal) forecasts by adding mesoscale factors to their prediction. However, a long-term climatological quantification of the relationships of hail and tornadoes within MCSs is lacking.
This study aims to quantify the relationships of hazard events with associated MCSs based on the long-term (2004–2017) National Oceanic and Atmospheric Administration (NOAA) hazard reports and an MCS observational dataset over the CONUS. By mapping the instantaneous hazard reports to the MCS dataset (Feng, 2019) and linking them to the convective features embedded within the tracked MCSs based on the National Weather Service Next-Generation Radar (NEXRAD) observations, we analyzed the characteristics of hail and tornadoes associated with MCS characteristics and quantified the seasonal and regional variabilities.
This study is organized as follows: Sect. 2 provides an overview of the hazard report database and the MCS dataset, as well as the methodology used to map the two datasets spatially and temporally. Section 3 shows the results of the statistical characteristics of hail and tornado events and their relationships with MCS properties. The summary and discussion are presented in Sect. 4.
2.1 Hail and tornado data
The hail and tornado reports are obtained from the NOAA National Centers for Environmental Information (NCEI) Severe Weather Data Inventory (SWDI) Storm Events Database (available at https://www.ncdc.noaa.gov/stormevents/, last access: 20 May 2022). The SWDI integrates severe weather reports over the US from a variety of sources including local National Weather Service (NWS) services, public storm-spotter networks, and media reports, which record the individual event as a data entry point with detailed time (in minutes), point-based geographic coordinates (with 0.001∘ precision), and magnitude (hail in inches and tornadoes in Enhanced Fujita Scale (EF) rating). Both hail and tornado reports are treated as point events with the start time and location in this study. Note that the data do not account for the temporal evolution of the hail and tornado events (i.e., the location and magnitude of the event was reported at its maximum intensity; National Weather Service, 2021). An MCS could have multiple hail and tornado events, and each event is distinguished. As mentioned by many previous studies (e.g., Kelly et al., 1985; Doswell and Burgess, 1988; Doswell et al., 2005; Verbout et al., 2006; Trapp et al., 2006), the Storm Events Database is greatly influenced by population density, and there exist uncertainties in the assignment of tornado intensity. However, as noted in Jeong et al. (2020, 2021), with the guidance of NEXRAD, the hail and tornado report data have an improved accuracy through verification of severe storm occurrences in the last 2 decades (Allen and Tippett, 2015). Thus, we are focusing on the most recent decade (2004–2017) in this study.
2.2 MCS identification and tracking
There is a lack of an agreement regarding the specific observed variables and thresholds employed in the identification of MCSs. Some previous studies are solely based on the segmentation of radar imagery using thresholds of size, intensity, and spatial pattern built on extensive expert analyses (Smith et al., 2012; Parker and Johnson, 2000). Because of the intrinsic caveats of radar reflectivity data (e.g., insufficient radar overlap, excessive removal of anomalous propagation and false echoes), erroneous MCS segmentation is commonly found in previous studies, including excessive, missing, and incorrect merging of MCS candidates (Haberlie and Ashley, 2018a). Motivated by those issues, a more sophisticated MCS segmentation and tracking algorithm was developed by Haberlie and Ashley (2018a, b), where an MCS candidate is detected if the major axis length of the aggregated convective cells (composite reflectivity ≥ 40 dBZ, aggregation radius of 6, 12, 24, or 48 km) exceeds 100 km, and its boundary is defined as the contiguous stratiform precipitation (composite reflectivity ≥ 20 dBZ) within a certain search radius (48, 96, or 192 km) from the MCS candidate. After detection, “true MCSs” are selected using a machine learning technique. Finally, only the most likely object will be tracked through a spatiotemporal overlap method, and the ones that persist for more than 3 h are defined as MCSs. In this way, all the irrelevant radar echo objects (including discrete supercells, cellular and multicellular systems) are excluded from this study.
In addition to the signature on radar imagery, MCSs also feature the large-coverage, long-lasting precipitation and the associated hydrological hazards of flooding and flash floods (Hu et al., 2021, 2022). Focusing on precipitation features associated with MCSs, Feng et al. (2019) developed an MCS tracking dataset by applying the FLEXible object TRacKeR (FLEXTRKR) algorithm (Feng et al., 2018) to a long-term dataset that synthesized geostationary satellite and NEXRAD radar observations. The FLEXTRKR algorithm starts with tracking contiguous cold cloud systems (CCSs) defined by contiguous areas with satellite infrared brightness (IR) temperature (Tb) < 241 K. If a tracked CCS meets the size (exceeding 6×10⁴ km2) and duration (longer than 6 h) thresholds, its embedded convective features (using NEXRAD three-dimensional radar reflectivity) and precipitation features (using the Stage IV precipitation product) are further examined. If the largest precipitation feature with a major axis length > 100 km and embedded convective echoes exceed 45 dBZ, and these conditions persist for longer than 6 h, the tracked CCS is defined as an MCS, which includes all the radar echo objects under the anvil cloud shields.
Since FLEXTRKR uses the CCS boundary defined by IR temperature, the identified MCSs are very large in spatial scale (referred to as IR-MCSs), which might cover multiple convective systems. To be more consistent with the literature work on studying the MCS–hazard relationship which is based on radar features (Haberlie and Ashley, 2018a, b), we developed a methodology to further define MCS radar features (referred to as radar-MCSs) within tracked IR-MCSs based on radar reflectivity in the FLEXTRKR database, as detailed blow.
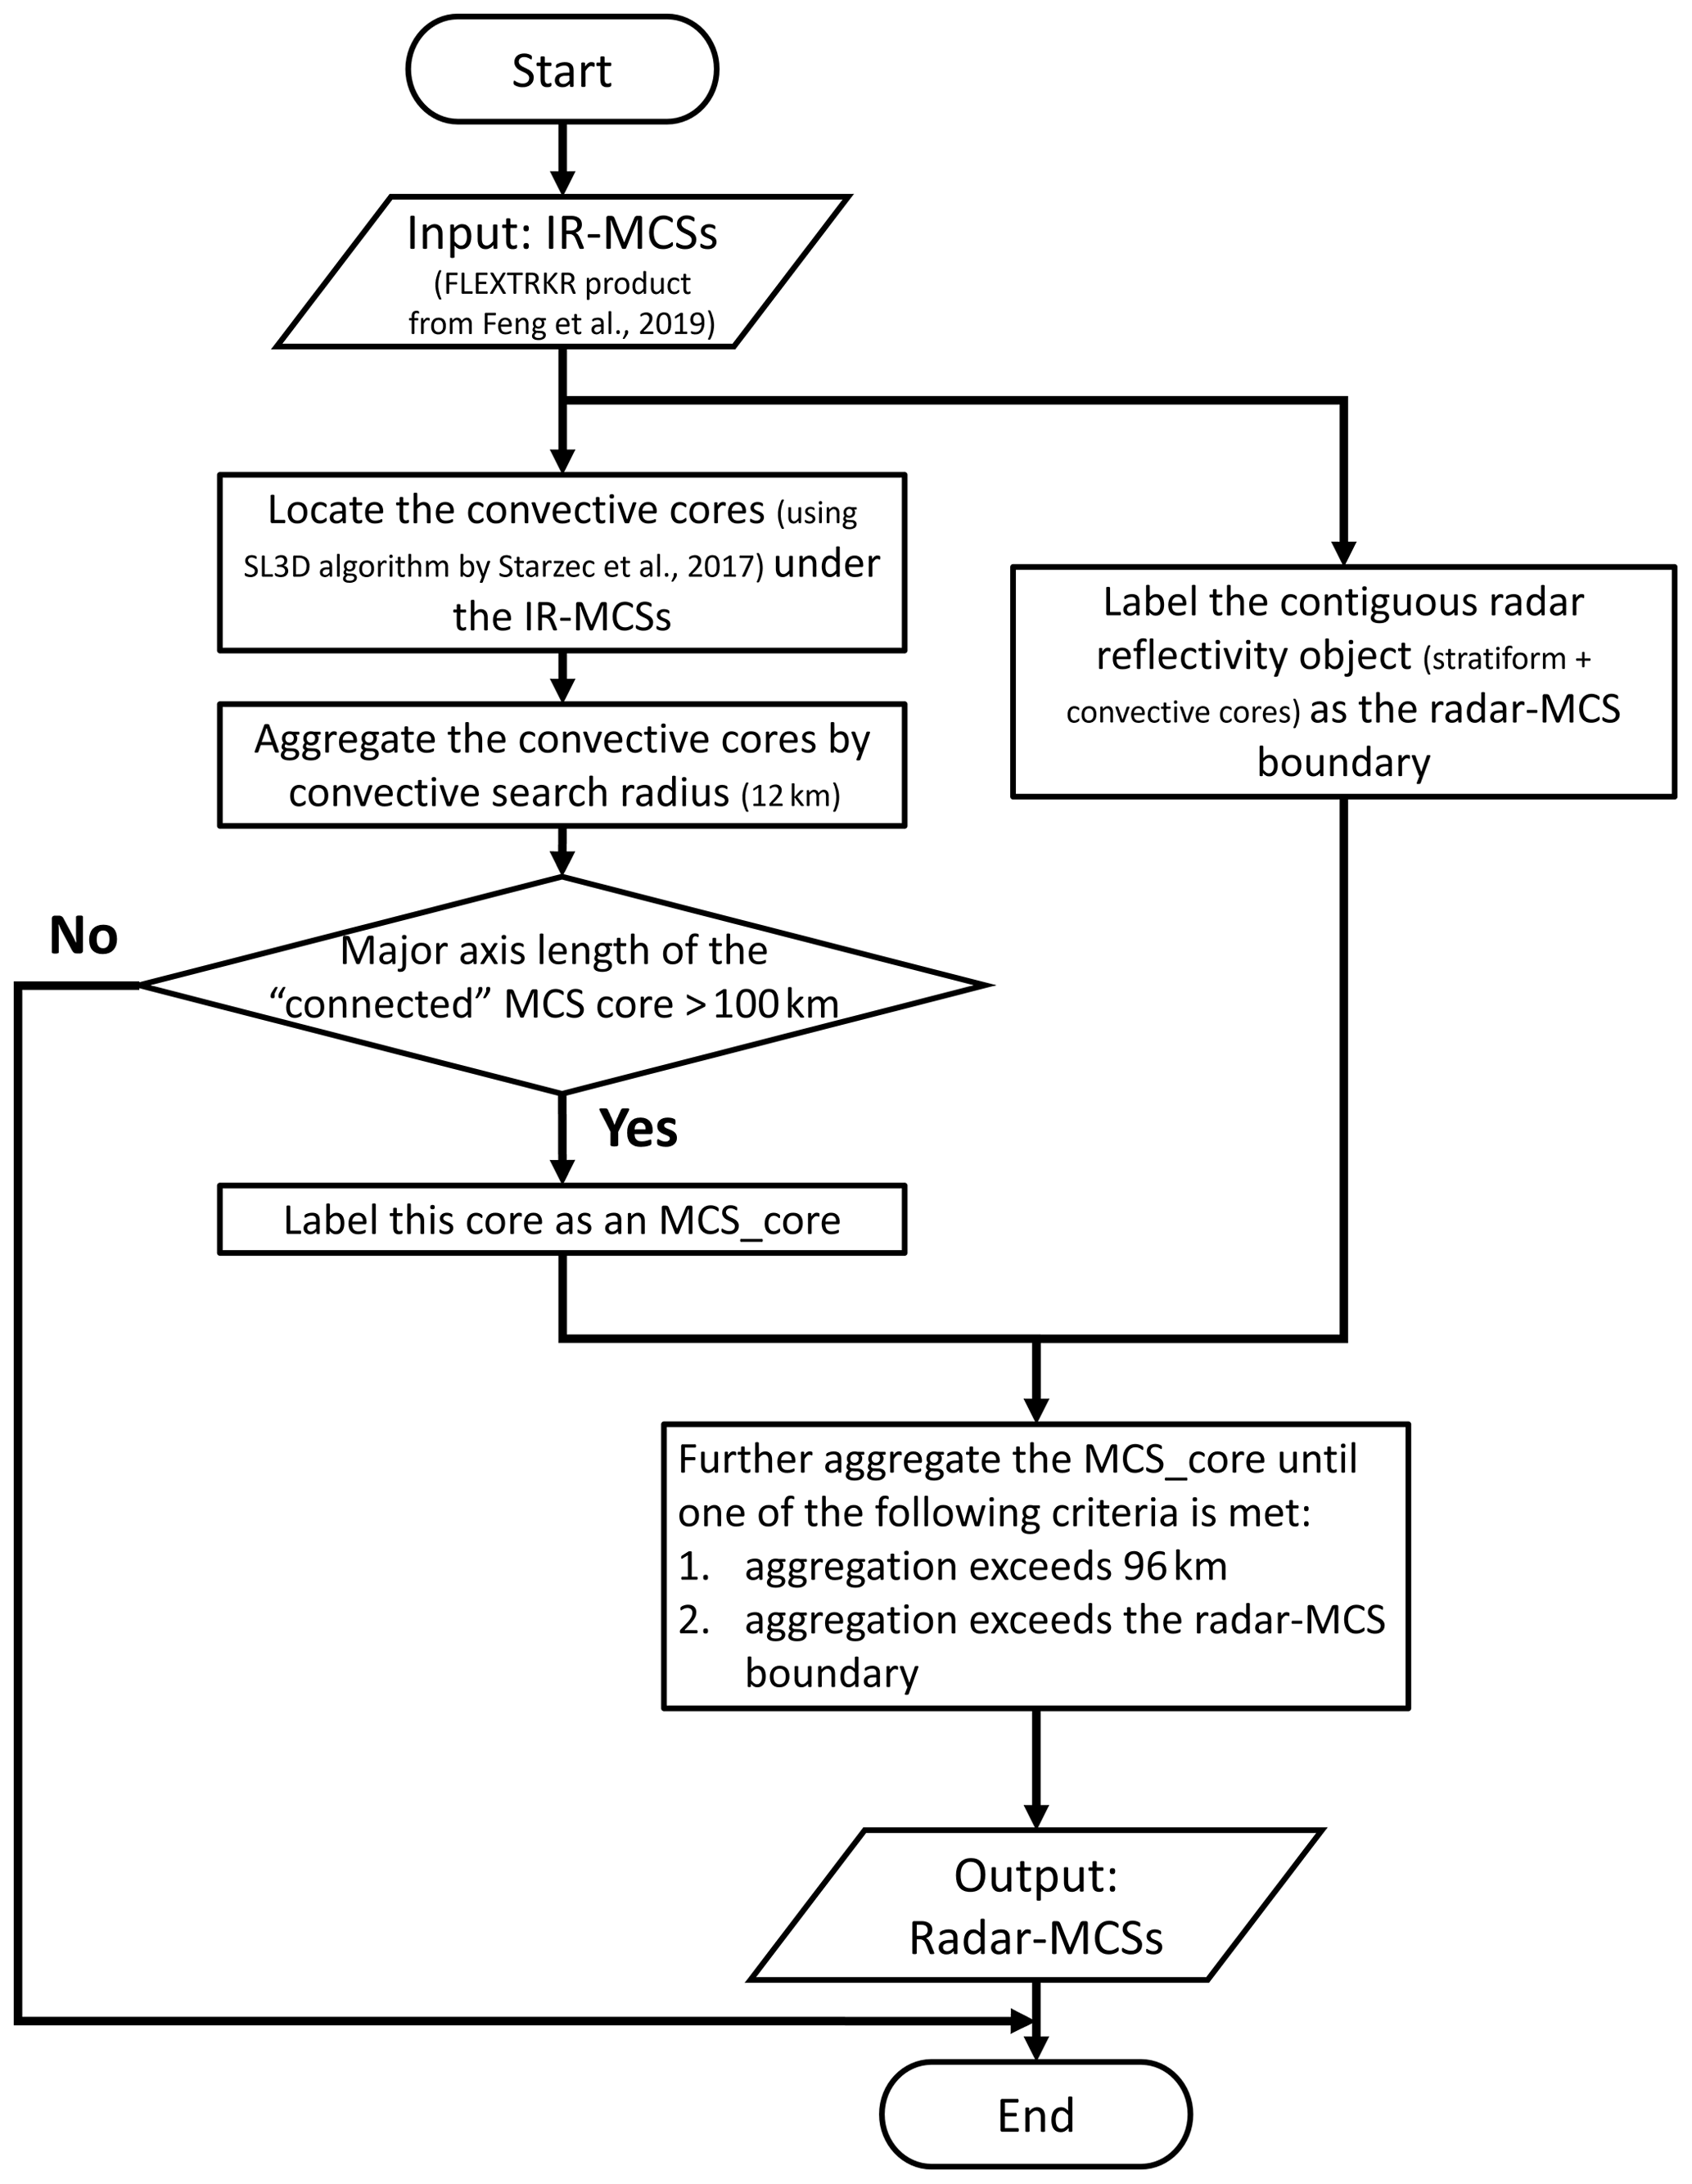
As illustrated in Fig. 1, we first examine the embedded convective cores defined by the Storm Labeling in Three Dimensions (SL3D) classification algorithm (Starzec et al., 2017) within IR-MCSs. Compared to the simple threshold-based method for identifying convective cores (e.g., Haberlie and Ashley, 2018a), the convective cores defined by SL3D fully utilize the three-dimensional volumetric radar data by considering both the vertical extent and horizontal gradient of reflectivity; thus the results better agree with convective updrafts (Starzec et al., 2017) that are more likely to produce hazardous weather. Stratiform echoes are defined as non-convective radar reflectivity at 3 km a.m.s.l. > 20 dBZ or the sum of radar reflectivity below 3 km a.m.s.l. > 0 dBZ. Meanwhile, the contiguous reflectivity objects (i.e., the combination of convective and stratiform echoes defined by SL3D) are marked as the radar-MCS boundary (i.e., the object that encloses the contiguous reflectivity objects). In the second step, the convective cores within the IR-MCS shield are aggregated into a contiguous region of convection using a convective aggregation radius of 12 km (three grid points). If the aggregated convective core has a major axis length larger than 100 km, it is labeled “MCS-core”. Finally, the MCS-core is further aggregated stepwise until the aggregation exceeds (1) 96 km (24 grid boxes; also known as stratiform search radius) or (2) the radar-MCS boundary. Then this aggregated region defines the final radar-MCS. Note the choice of convective aggregation radius (12 km) is less than that of Haberlie and Ashley (2019; 24 km) for the consideration of different convective selection criteria (SL3D vs. composite reflectivity > 40 dBZ) used in the two algorithms. Other radar echoes within the IR-MCS shield are labeled as non-MCS related.
2.3 Mapping hail and tornado events to MCSs
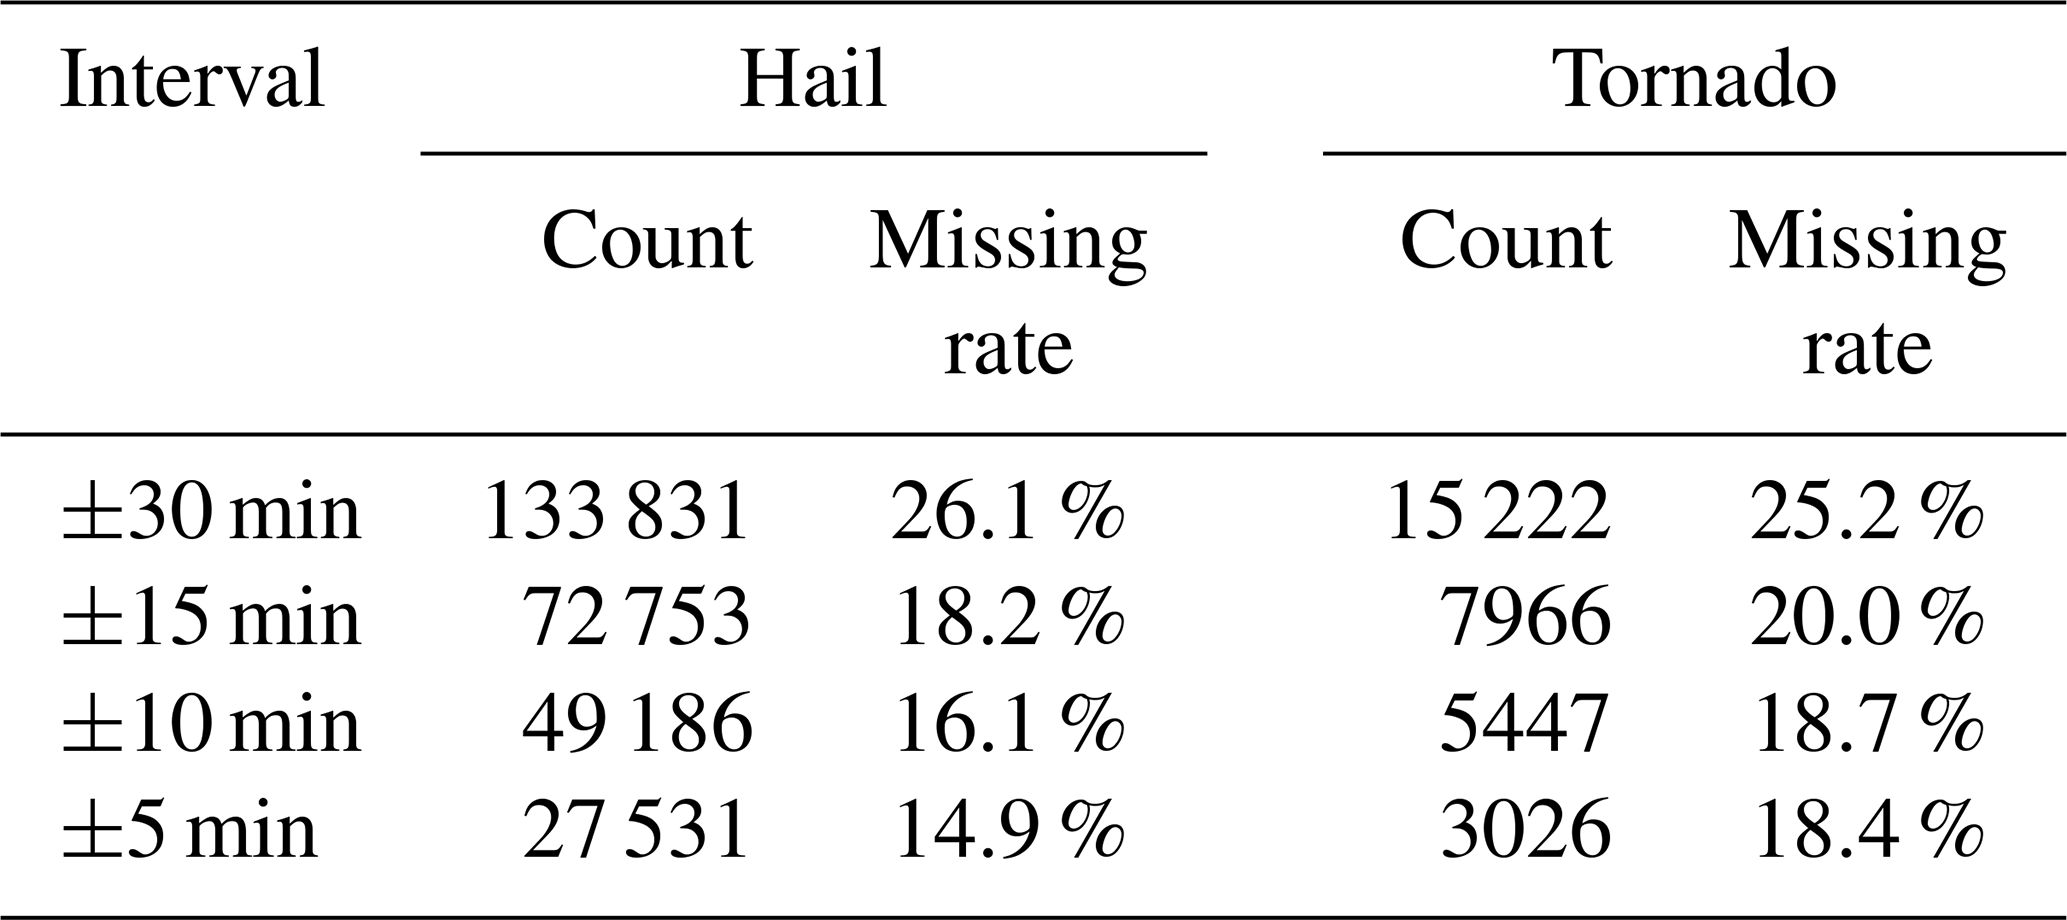
The MCS dataset is available from 2004 to 2017, and the domain covered is to the east of the Rocky Mountains (25–48∘ N, 110–70∘ W). Correspondingly the hail and tornado reports are collected for the same period over the same domain. The point-based hail and tornado reports are rasterized to the radar grid (4 km × 4 km) by summing all reports within each gridbox. Because of higher uncertainty in reports of hailstone sizes less than 1 in. (2.54 cm; Jeong et al., 2020, 2021), only severe hail events with a size greater than or equal to 1 in. are included. For tornadoes, all events at EF0 and above are considered. Since there is a significant time difference between the MCS dataset (hourly; the temporal resolution of the FLEXTRKR product that this study is based on) and the hazard reports (in minutes), it is critical to carefully examine how to match the two datasets temporally. For each hour in the MCS dataset, we tested different time intervals within which the high-resolution hazard reports are matched to the hourly MCS dataset: 1 h (±30 min), 30 min (±15 min), 20 min (±10 min), and 10 min (±5 min). Table 1 summarizes the total number of events and the missing rate (the percentage of the events occurring outside valid radar observations) for the different time intervals. For both hail and tornadoes, their total numbers decrease proportionally with the reduced time interval, indicating the events are evenly distributed across the entire hour. Meanwhile, their missing rate decreases drastically from ±30 to ±15 min, but further reducing the time intervals to ±10 and ±5 min has limited improvements in decreasing the missing rate. Thus, the ±15 min interval is chosen to map the hazard records to the radar grid in the temporal dimension, as it contains sufficient sample numbers as well as a relatively low missing rate.
Table 1The statistics of the total number of records and the missing rate using different filtering time intervals.
After mapping the hazard reports to the radar data grid (4 km grid resolution), the hail and tornado events are defined as “MCS-related” when they occur within the radar-MCS areal coverage, indicating those events are generated from the large, contiguous, and long-lived MCSs. Conversely, “non-MCS-related” hazard events are labeled when they do not overlap with the radar-MCS objects, which are hazard events possibly produced by the smaller and shorter-lived convective systems that do not meet the MCS criteria.
Figure 2 shows four examples of MCSs overlaid by their concurrent hazard reports. To eliminate the false inclusion of hazard reports that are irrelevant to the MCS-core, hail and tornadoes within the radar-MCS boundary but outside the MCS-core are not counted as MCS-related. It is important to note that the temporal offset between hazard reports and radar observations is not taken into account in this classification. Hence, instances of hail and tornadoes produced by fast-moving convective cores at sub-hourly scale are labeled as non-MCS-related or invalid records at the radar-MCS timestamp. It is also possible that spatiotemporal inaccuracies in the hazard report data (e.g., human-report errors, Trapp et al., 2006 Allen and Tippett, 2015) may affect the matching of the hazard reports and the radar features. During the 21–26 May 2011 tornado outbreak sequence, one of the largest tornado outbreaks on record, an MCS with the core length of 107 km generated an EF0 tornado to the northwest of Shawneetown, Missouri, at 20:54 UTC on 23 May 2011 (Fig. 2a). Meanwhile, severe hail events were produced by an adjacent MCS (core length of 101 km) over southwest Indiana. By applying the modified FLEXTRKR algorithm as detailed in Fig. 1, three radar-MCSs previously under the same IR-MCS shield are separated. Even with much smaller spatial coverage, their inclusion of hazard reports is evident, indicating the robustness of the algorithm in extracting radar-MCSs as well as associating them with embedded hazard reports.
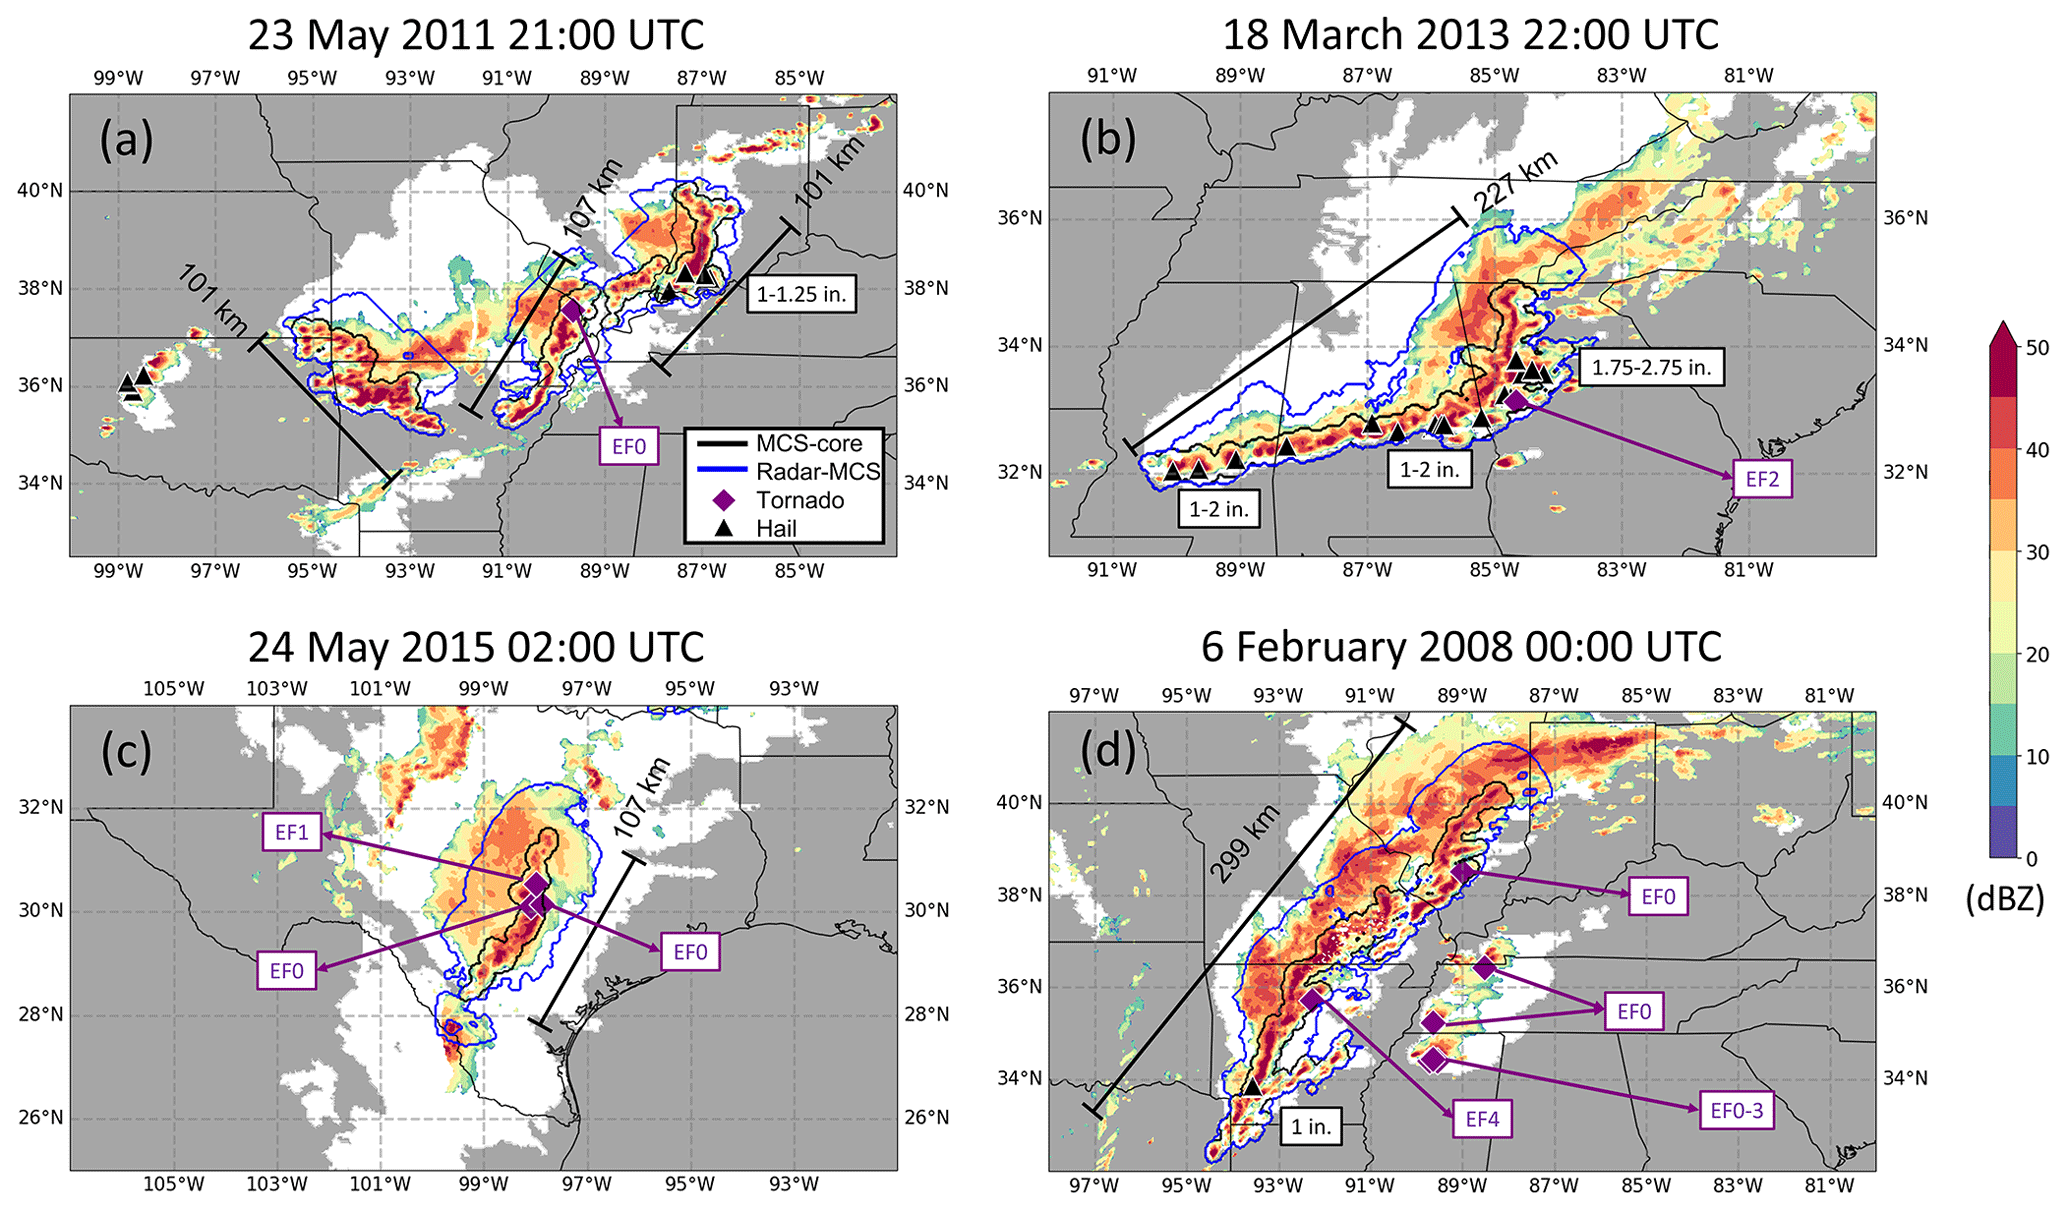
Figure 2Examples of mapping the instantaneous hail and tornado reports on the hourly MCS dataset for (a) 21:00 UTC on 23 May 2011, (b) 22:00 UTC on 18 March 2013, (c) 02:00 UTC on 24 May 2015, and (d) 00:00 UTC on 6 February 2008. The IR-MCS areal coverage is denoted by the white area. The blue outline represents the radar-MCS, and the black outline represents the MCS-cores. The 2 km altitude reflectivity is color contoured, and the reports of tornado (purple diamonds) and hail (black triangles) are overlaid.
In addition to the sporadic occurrences of hailstone with relatively weak severity, reports with a more organized spatial distribution and higher magnitude also demonstrate a strong association with MCSs. During the 18 March 2013 tornado and large-scale wind event (Fig. 2b), a very large bowing convective line (core length of 227 km) developed along a quasi-stationary frontal boundary extending northeastward from northern Louisiana into north-central Alabama, which spawned widespread hail events up to 2.75 in. (6.985 cm). The forced ascent along the southeastward propagation of a gust front associated with the convective line aided the development of a supercell embedded in the line, which subsequently produced an isolated EF2 tornado over Meriwether and Pike County, Georgia. This is an example in which a radar-MCS overlaps with an IR-MCS without further subdivision. In spite of the greatly narrowed spatial coverage, the occurrences of hazard align well with the radar-MCS enclosed in the IR-MCS, and such MCS–hazard association remains valid despite the criteria used for MCS selection.
Similar to the densely distributed MCS-related hail events, tornadogenesis associated with MCSs can also be clustered. As shown in Fig. 2c during the Memorial Day weekend tornadoes (23–25 May 2015), three tornadoes (EF0–1) were reported along a northeastward-bowing squall line (core length of 107 km) by a north-side embedded comma head vortex over Travis and Williamson, Texas. The cluster of tornadoes coincides with a clearly defined linear MCS, which fortifies the validity of the algorithm. The severity of EF2 is apparently not the worst tornadogenesis that MCSs can bring: as shown in Fig. 2d, an EF4 tornado was spawned during the “Super Tuesday outbreak” (a total of 131 tornadoes with the death toll of 57) on 6 February 2008 in Clinton, Arkansas. This long-track tornado first touched down as EF0, and then it rapidly intensified to EF4 along with a long-lived supercell embedded in the pre-frontal squall line (core length of 299 km). The association of such devastating tornadoes with the linear MCS is not a novel discovery by this study but was also confirmed by previous studies (e.g., Molthan et al., 2008). However, such associations are statistically rare (Trapp et al., 2005).
3.1 Spatial distribution of MCS-related hail and tornado events
Many previous studies have shown that the spatial distribution of severe hail events (hailstone size ≥ 1 in.) has notable regional and seasonal variation across the United States (e.g., Schaefer et al., 2004; Cintineo et al., 2012). However, those studies are commonly based on the climatology of the total number of reports without the discrimination between MCS and non-MCS. Figure 3 breaks down the total counts (left column) into the MCS-related (middle column) and non-MCS-related portions (right column) for different seasons. The hazard reports rasterized to the 4 km resolution are further aggregated to in the figure for clarity. Annually, MCS-related hail events account for only 14 % of the total, indicating MCSs contribute a limited portion of total hail occurrences, which is consistent with the findings in many previous studies, i.e., that supercells dominate the hail production (e.g., more than 90 % in Smith et al., 2012).
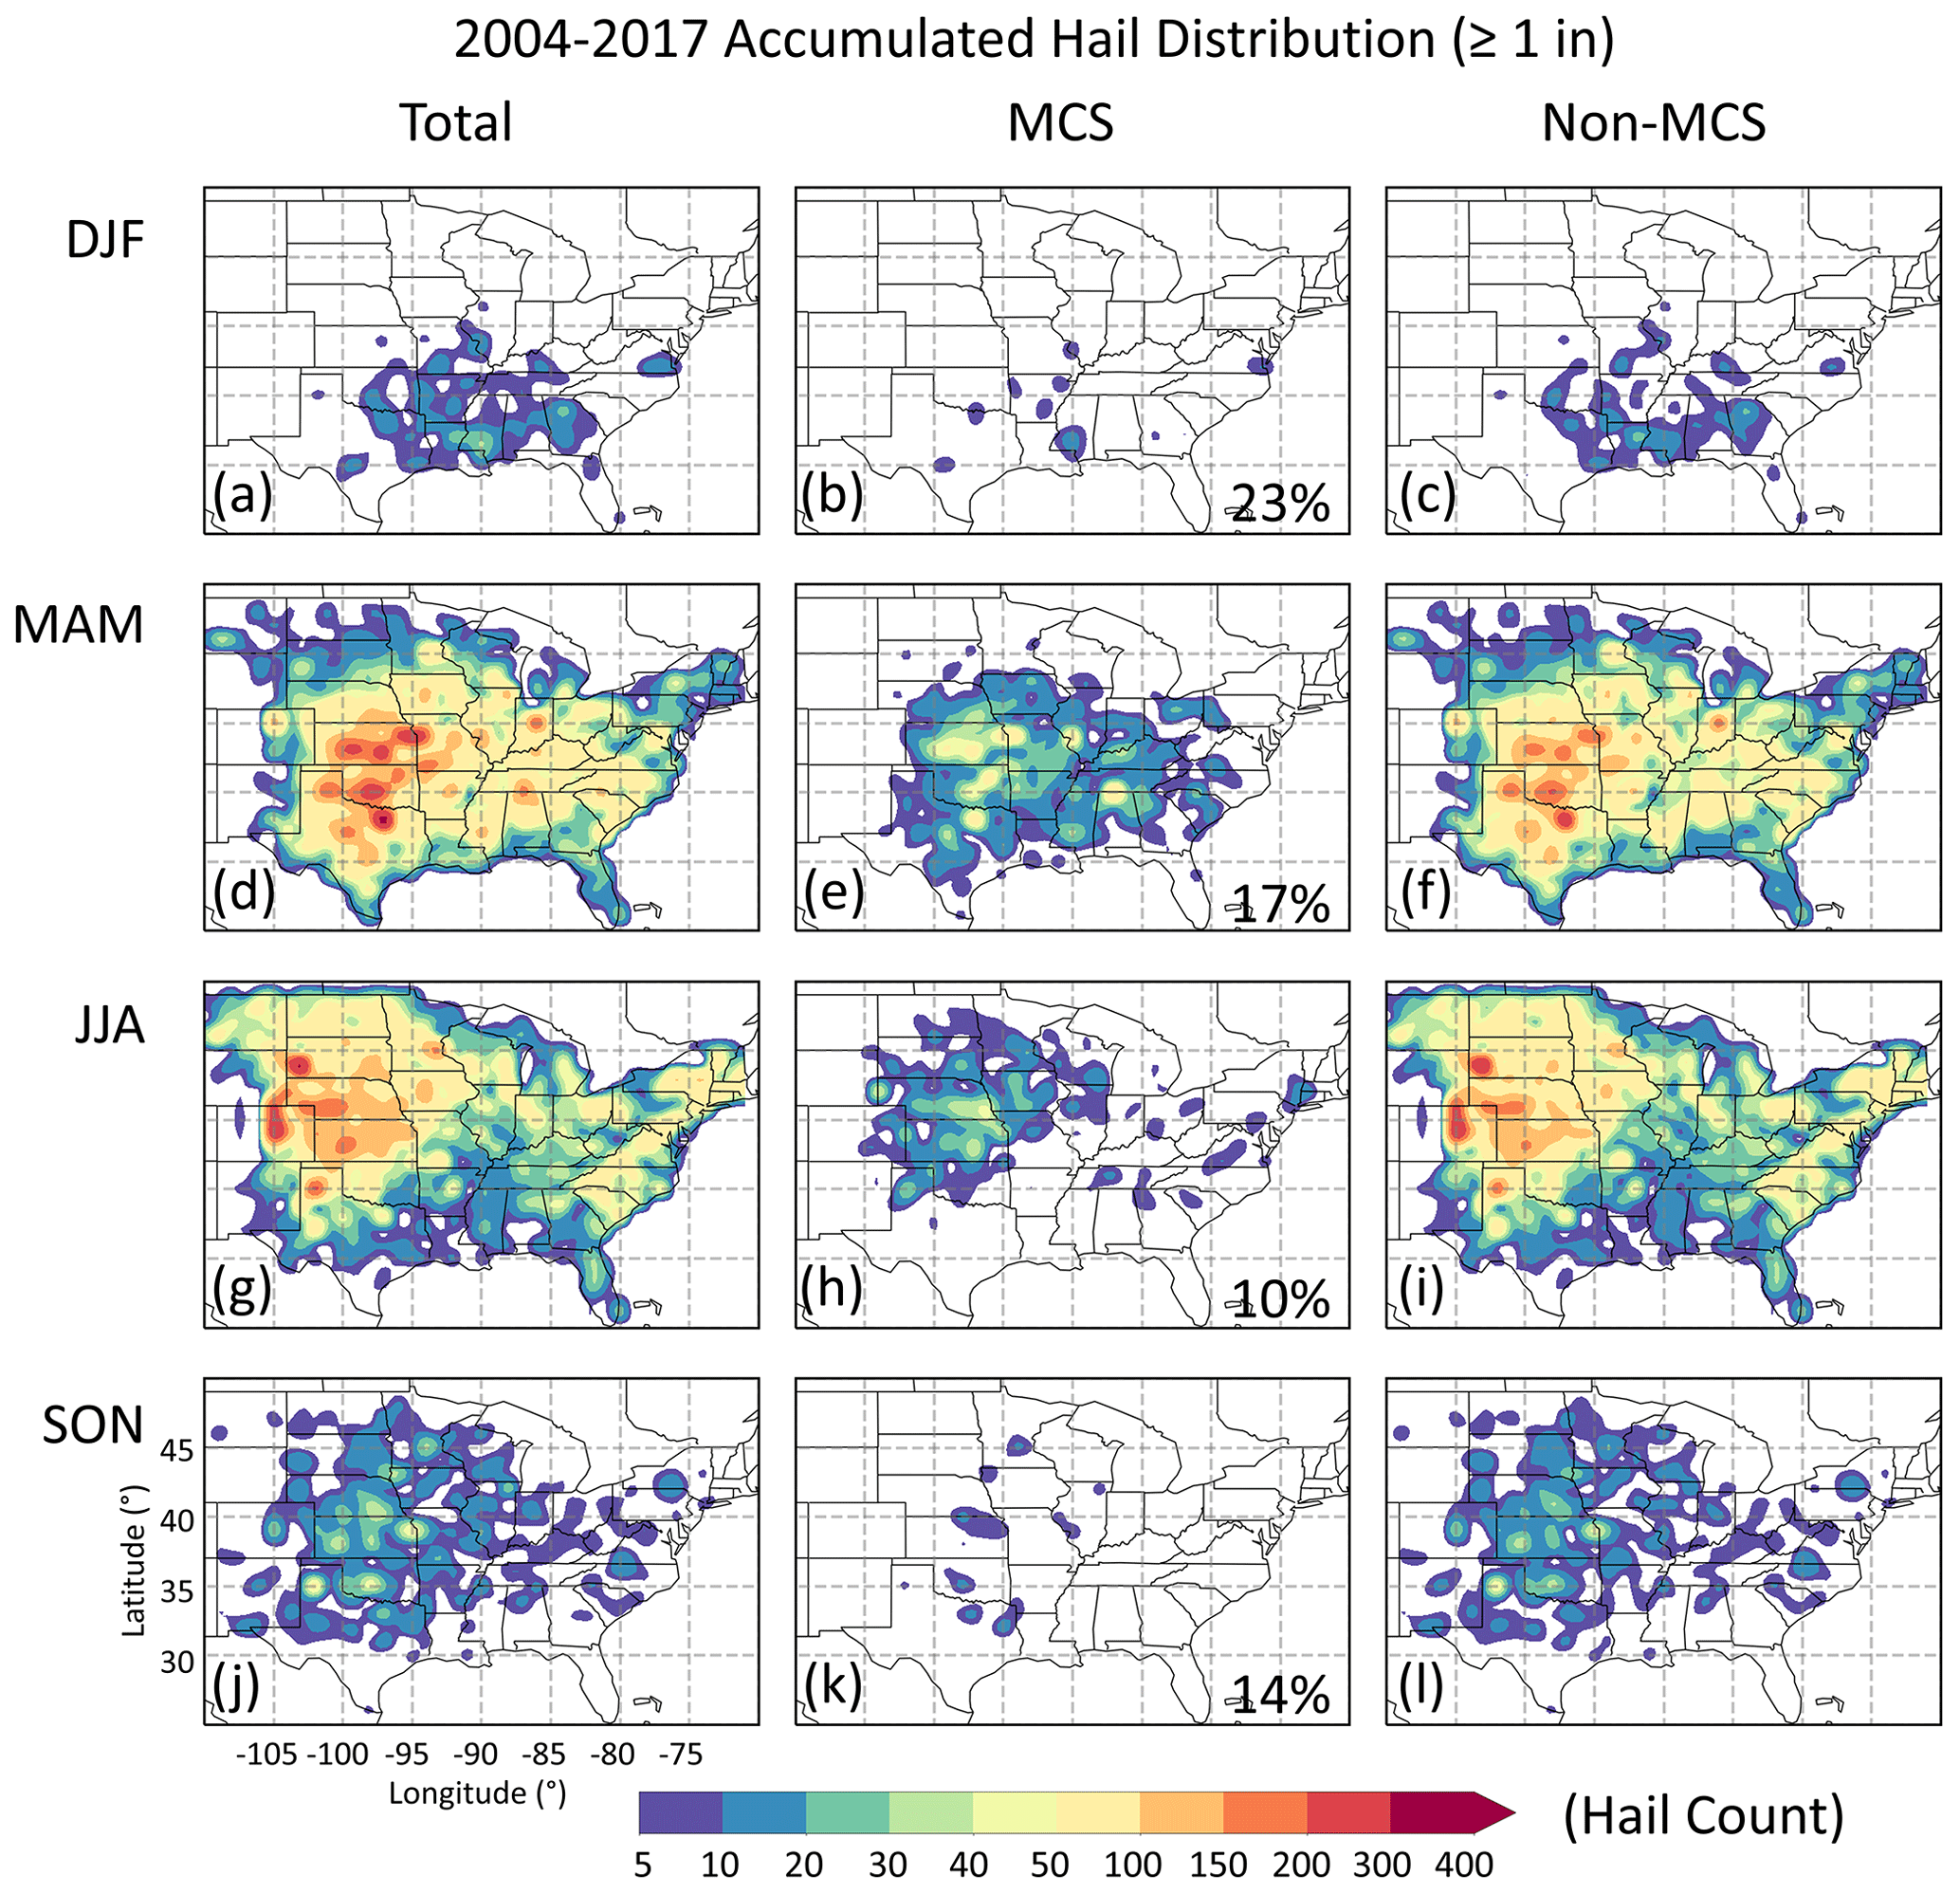
Figure 3Spatial distribution of hail occurrences per grid with reported hailstone size of 1 in. (2.54 cm) or greater. The counts of the total (a, d, g, j), MCS-related portion (b, e, h, k), and non-MCS-related portion (c, f, i, l) are separated into the seasons of December–January–February (DJF), March–April–May (MAM), June–July–August (JJA), and September–October–November (SON). The numbers in (b, e, h, k) denote the averaged percentages of MCS-related hail events relative to the total counts over the domain.
Winter (DJF) has the fewest hail occurrences among all seasons; however, it corresponds to the highest MCS-related portion (23 %). Spatially, both total and MCS-related hail events are greatly confined to the southeast in this season (Fig. 3a–c), which reflects the dominance of cold air over the interior of the continent. In addition to the high static stability that prohibits the development of hail-generating severe thunderstorms, the low-level moisture supply is mostly confined to the southeast, where the narrow hail band is observed ranging from the east of Texas to the north of Alabama.
Spring corresponds to the maximum hail occurrences (Fig. 3d) because of the strong baroclinic instability in combination with the increased solar heating and northward expansion of moisture transport by the Great Plains low-level jet (GPLLJ), providing a favorable environment for the development and maintenance of organized convective systems (Maddox et al., 1979; Wang et al., 2019b). Therefore, the maximum frequency of hail occurrence shifts to the southern Great Plains (SGP) over Oklahoma and the Arkansas–Red River basin. Although the MCS-related portion (Fig. 3e, 17 %) is less than that of winter, spring has the maximum number of MCS-related hail events among the four seasons. There are also a significant number of hail events occurring in the eastern US (EUS; 110 to 85∘ W), where the non-MCS-related fraction is much higher compared to the central US (CUS; 85 to 70∘ W) because disorganized convective modes are common with local sea-breeze circulation (Smith et al., 2012), which also applies to summer (Fig. 3i).
In the summertime, although the baroclinic instability becomes the weakest (Holton, 2004), the large solar heating and the northwestward expanded GPLLJ along the sloping terrain (Burrows et al., 2019) promote local and small-scale convection. The hail center is further pushed to the northern Great Plains (NGP) from eastern Colorado to Minnesota (Fig. 3g). In accordance with the changes in meteorological conditions, compared to spring, the hail events contributed by MCSs decrease (Fig. 3h, 10 %) and the non-MCS fraction increases (Fig. 3i, 90 %). Besides the northwest centroid of high hail occurrence, another hail center is found in the EUS, where the non-MCS fraction is much larger than the MCS-related fraction. The high fraction of non-MCS-related hail events in the east is due to the reduced frequency of MCSs and increase in non-MCS storms (Li et al., 2021), as the EUS summertime thunderstorms are mainly driven by daytime surface heating and land–sea circulation, characterized by a smaller size and shorter duration compared to their counterparts in the CUS.
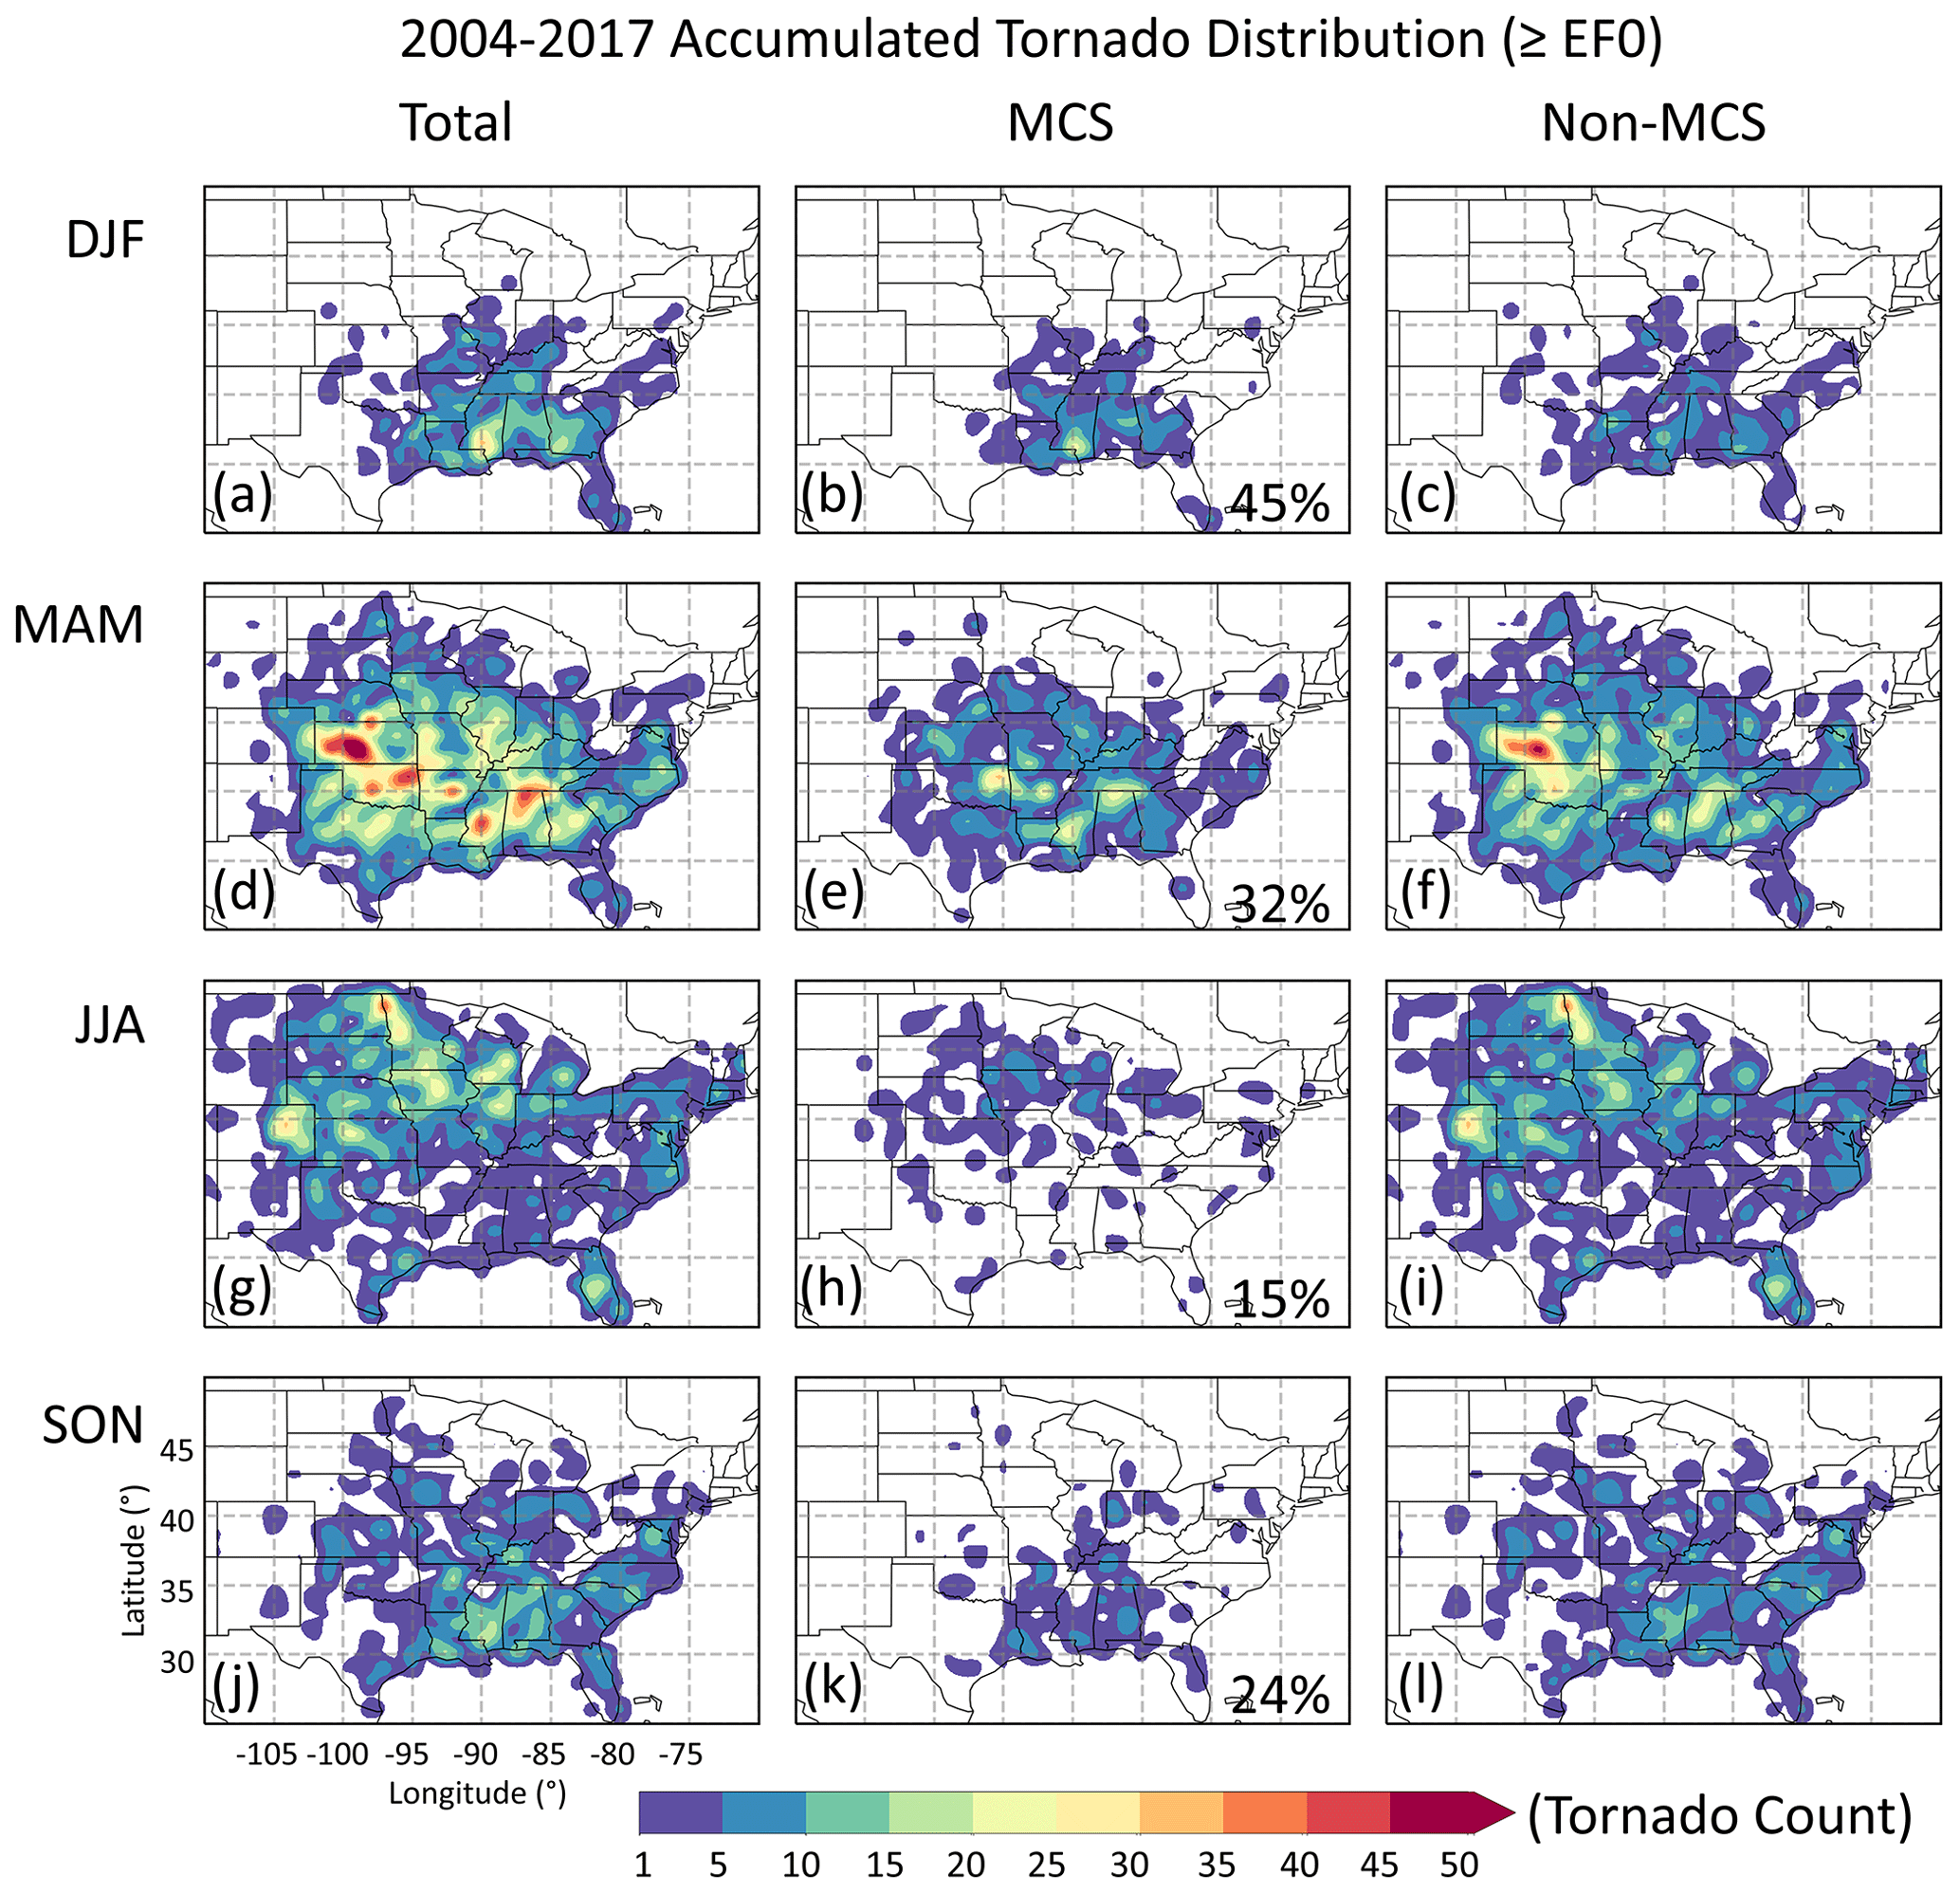
Figure 4Same as Fig. 3 except for tornadoes with Enhanced Fujita Scale greater than or equal to 0.
In the fall, the spatial pattern of hail activity is similar to spring as the large-scale environment is similar between the two seasons. However, the total occurrence number is greatly reduced by a factor of ∼10 compared to spring. In spring, the lower troposphere warms quickly, but the high levels remain rather cold from winter, whereas in fall, the lower troposphere cools quickly, while the high levels stay warm from the effects of summer. Thus, the instability is much weaker in fall compared to spring. However, the proportion of MCS-related vs. non-MCS-related events is similar between spring (17 %) and fall (14 %). Thus, MCSs have a similar contribution to hail counts during the transitional seasons despite the contrasting total counts. Overall, the hail events occur mainly in the warm seasons (spring and summer); however, the maximum MCS-related percentage is found in winter when the total hail occurrences reach the minimum.
For tornadoes, the distribution of total events shows similar spatial patterns as hail events (Fig. 4). This includes (1) winter having the fewest number of events but the highest MCS-related portion, (2) spring having the maximum occurrences and the frequency maximum being located over the SGP, and (3) the frequency maximum being shifted to NGP in summer. The finding in winter (DJF) agrees with the result in Smith et al. (2012) that MCSs are a typical mode of tornado-producing convection that is nearly as frequent as the sum of other modes. According to Thompson et al. (2012), these MCS-related tornadoes were generated in the environment with the weakest buoyancy but the largest fixed-layer vertical shear. This particular condition is less favorable for the development of other modes of convection, resulting in a reduced occurrence of their associated tornadoes. The only notable difference is that tornado spatial distribution in fall more resembles that in winter, where for hail, the spatial pattern in fall mimics its spring pattern.
Regarding the contribution from MCSs, the percentage of MCS-related tornadoes (27 %) is almost double that of hail events (14 %) on the annual basis. Since the MCSs defined in this study contain a convective-feature major axis length exceeding 100 km similar to QLCSs defined in many previous studies (e.g., Trapp et al., 2005; Ashley et al., 2019), we compare our tornado occurrence and attribution with those studies. A good agreement is found between our results and previous works. For example, based on a 3-year (1998–2000) and a 22-year (1996–2017) investigation, 18 % and 21 % of tornadoes were attributed to QLCSs, respectively, by Trapp et al. (2005) and Ashley et al. (2019). The higher MCS-related tornado occurrences in this study could result from the absent restriction of the aspect ratio (e.g., a QLCS major axis must be at least 3 times longer than its minor axis). Therefore, the inclusion of nonlinear MCSs would increase the MCS-related percentage. This would also explain the higher MCS-related hail occurrence (14 %) compared to QLCS-related results (10 %; Ashley et al., 2019).
It is important to note that the choice of the convective aggregation radius (12 km; to connect the interspersed convective cores) and the stratiform search radius (96 km; to associate stratiform precipitation regions to the MCS convective cores) could affect the detection of MCS-core and its spatial coverage, which may subsequently impact the hazard statistics when matching the hazard reports to MCSs. Therefore, to quantify the uncertainties associated with the threshold selection, the sensitivity tests using 8 km for the convective aggregation radius (Figs. S1 and S2 in the Supplement) and various stratiform search radii of 48 km (Fig. S3) and 192 km (Fig. S4) are conducted. With different combinations of the two criteria, the annual proportion varies from 8 % to 17 % for MCS-related hail events and 17 % to 32 % for tornadoes.
3.2 Temporal variations in MCS-related hail and tornado events
Over 2004–2017, the annual total hail events varied significantly from 3166 to 6624, and the MCS-related portion fluctuated between 10 % to 19 % (Fig. 5a). Note that only the reports occurring with the ±5 min time window of the integral hours are considered in this study; therefore, the total and MCS-related hazard counts are nearly half of those reported in other studies (e.g., Trapp et al., 2005; Ashley et al., 2019). The year 2011 stands out, when both the maximum total count of hail events and MCS-related portion peak. A similar large variation pattern is also found for tornado reports, where the annual count of tornadoes varies from 494 to 1089, and the MCS-related portion varies from 18 % to 45 % (Fig. 5b). Same as hail, both total count and MCS-related percentage peak in 2011. As explained by Jeong et al. (2020, 2021), the interannual variability in hail occurrence in the southern and northern Great Plains is strongly modulated by the El Niño–Southern Oscillation (ENSO) pattern, and 2011 is a strong La Niña year. Other strong La Niña years of 2008 and 2017 also correspond to a relatively higher number of tornadoes and MCS-related fraction, indicating ENSO may modulate tornado occurrence during the winter and spring by altering the large-scale environments (Allen et al., 2015). The minimum total count occurs in 2007 (transition year from El Niño to La Niña) for hail but in 2013–2014 (weak La Niña condition) for tornadoes. Such inconsistency indicates that the total counts of different hazards could be modulated by different sets of large-scale drivers, which deserves future investigation. Through the examination of the correlation coefficients (r) in the interannual variability between the two types of hazards, the value for the total counts is as weak as 0.47. In comparison, their MCS-related portions are much more synchronized (MCS-related count: r=0.88; MCS-related fraction: r=0.62), indicating MCSs generally produce both hail and tornadoes. Therefore, the study of environmental control over MCS-related hail and tornadoes could benefit from the same set of large-scale drivers.
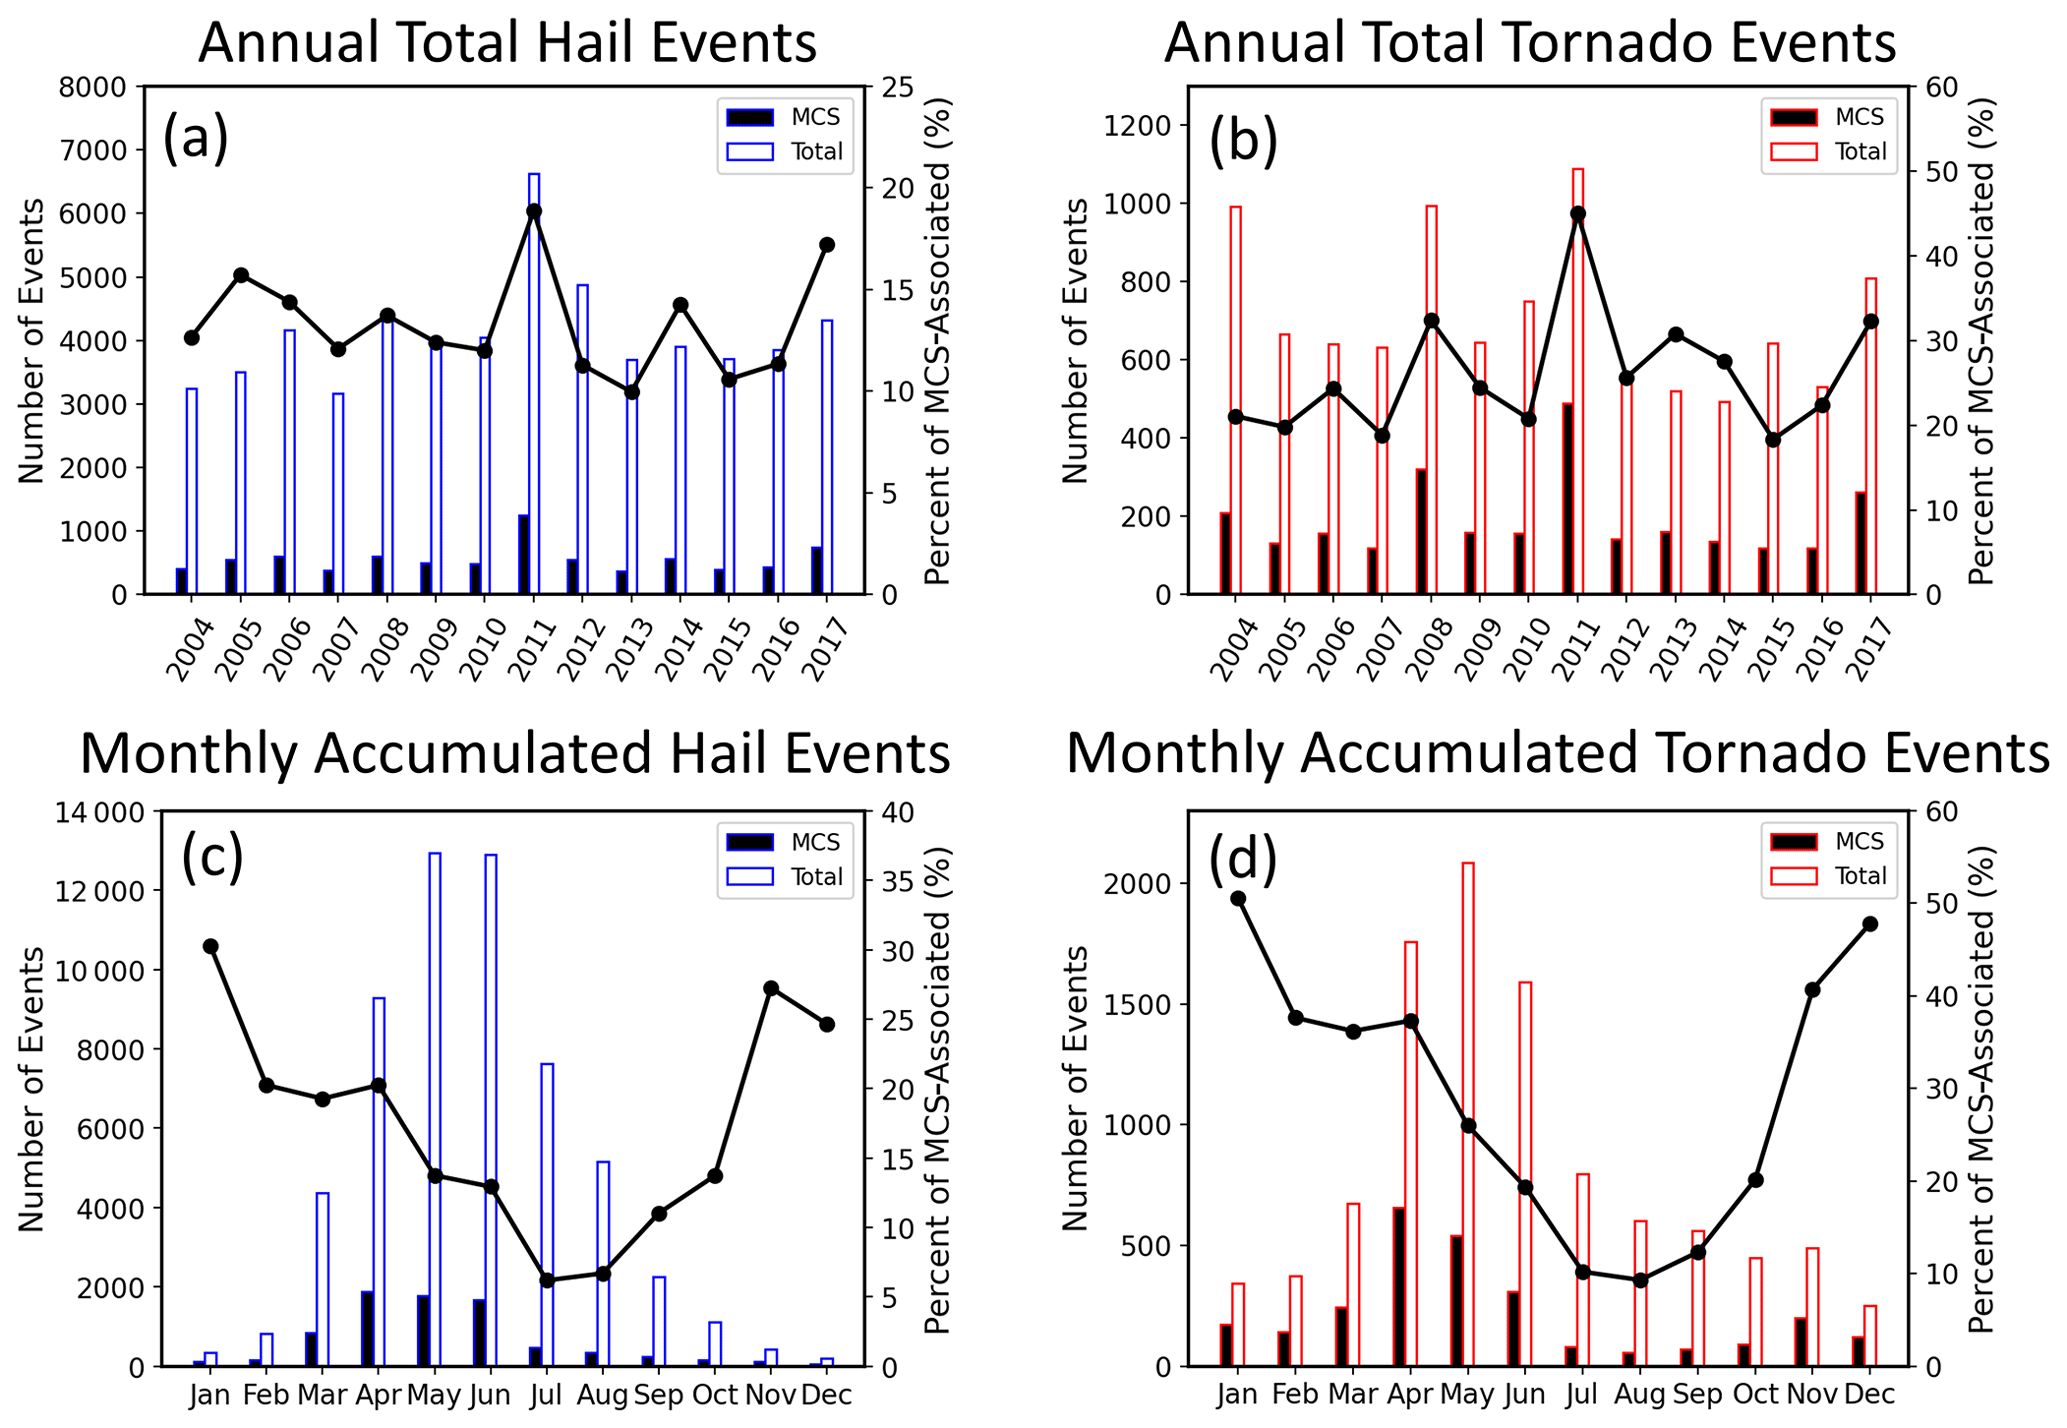
Figure 5The 2004–2017 annual variation in total (hollow bars) and MCS-related (filled bars) hazard events for (a) hail and (b) tornadoes, overlaid by MCS-related percentages in black lines. (c, d) Similar to (a, b) but for the monthly statistics.
The monthly distributions (Fig. 5c and d) show a consistent seasonal pattern with Figs. 3 and 4, where April–June (spring) has the maximum number of total and MCS-associated reports for both hazard types, and the minimum number of reports is found between November and February (winter). The MCS-related portions for hail and tornado show a similar seasonal cycle: both peak in November–January and minimize in July–August. There is an apparent phase shift between the hazard counts (both total and MCS-related) and MCS-related percentages for both hail and tornado, which was also reported by Ashely et al. (2019) for quasi-linear mesoscale convective system (QLMCS)-related hazards (a subset of MCSs). The seasonality of the hazard occurrence roughly follows the variation in atmospheric instability in combination with the latitudinal migration of large-scale synoptic features (i.e., fronts and prefrontal troughs) associated with extratropical cyclones, producing the spring-peak–winter-valley pattern. However, both the MCS-related hazard fractions show the winter-peak–summer-valley pattern, which is approximately antiphase to the hazard counts. Such a contrast may suggest that the winter environment that features the weakest buoyancy and the largest fixed-layer vertical shear is more favorable for hazard production in MCS than other modes of convection.
In summary, MCSs are most hazardous in spring (April–June) when the majority of MCS-related hail (68 %) and tornado (56 %) events occur. This consistent seasonal pattern reveals that the two types of hazards, as well as their MCS-related portions, are more likely to occur during the transition season from mid-spring to early summer, as the surface and lower troposphere warm quickly but the mid-to-upper troposphere remains rather cold from winter. The high instability, together with the migratory extratropical cyclones and their fronts and prefrontal troughs (Whittaker and Horn, 1984; Lukens et al., 2018), provide a favorable environment for severe convective storms and the formation of MCSs (Johns, 1984; Guastini and Bosart, 2016). The overall hazard occurrence is rare in winter, and a significant portion is from MCSs (up to 30 % for hail and up to 51 % for tornadoes).
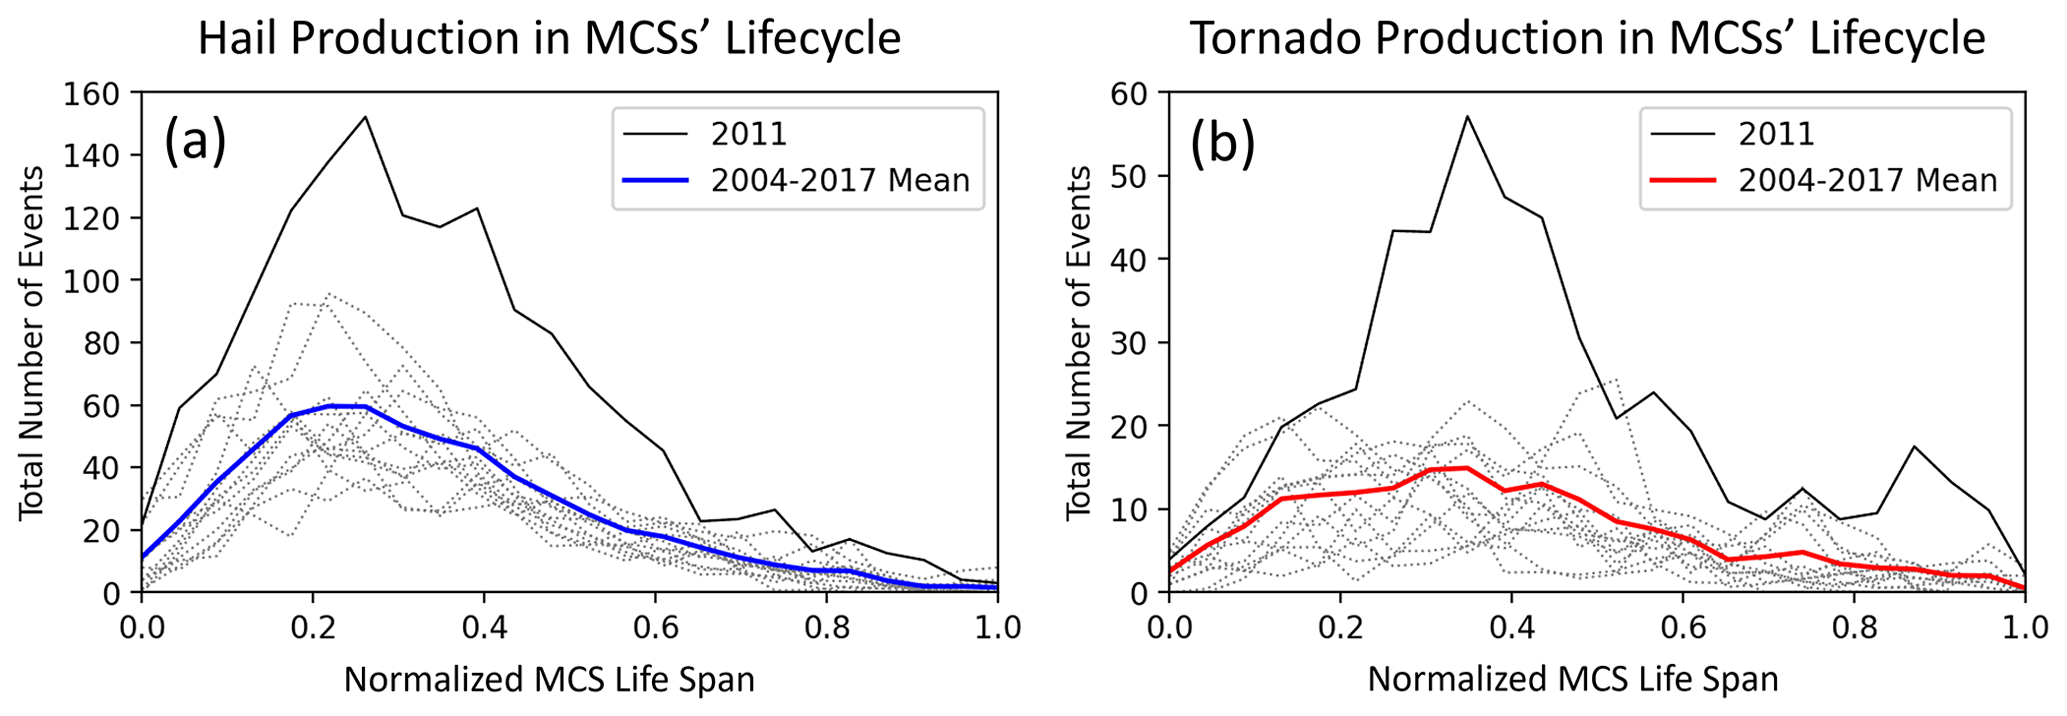
Figure 6(a) The total production of MCS-related hail events as a function of normalized MCSs' life span, where each dotted line represents a year, except that 2011 is highlighted with a solid line, and the all-year mean is marked with blue. (b) Similar to (a) but for tornadoes.
The Lagrangian tracking database allows us to delve into the hazard evolution over the MCS lifecycle as shown in Fig. 6. As defined by Feng et al. (2019), the initiation stage starts at the first hour when the MCS-related CCS is detected, followed by the genesis stage when the major axis length of the convective core exceeds 100 km. As the convective core maintains its size, the spatial expansion of the stratiform rain area defines the mature stage of the MCS. Finally, when the length of the convective core shrinks below the 100 km threshold or the stratiform rain area is lower than the mean value throughout the entire MCS lifecycle, the system is classified as in the dissipation stage (Wang et al., 2019a).
On average, there are 454 MCSs per year (a minimum of 422 cases in 2005 and a maximum of 522 cases in 2015). A total of 84 and 40 MCSs produce at least one severe hail event and one tornado, respectively, at certain stages of their lifecycle, and there are 29 MCSs with the occurrence of both hail and tornado. By normalizing the hail-producing MCS lifespan from 0 to 1, we roughly define the composite MCS lifecycle stages as follows based on the evolution of the convective and stratiform characteristics in the MCS database (Fig. 17 in Feng et al., 2019): 0–0.1 represents the initiation stage, 0.1–0.4 for genesis, 0.4–0.8 for mature, and 0.8–1 for dissipation. The spaghetti plot in Fig. 6a shows the total count of MCS-related hail events each year. All years show a consistent lifecycle variation in hail production, including the year 2011 with abnormally high hail occurrences; i.e., there is a rapid increase in the initiation stage and peak during the genesis stage and then a gradual decrease towards the rest of the MCS lifecycle (0.4–1). This pattern might be expected, as the most vigorous convective updraft commonly occurs during the early stage of the MCS, which would be the most hail-productive, whereas when the system becomes mature and starts the spatial expansion of stratiform cloud and precipitation, it would be less hail-productive, and finally there is negligible hail occurrence during the dissipation stage.
The tornado distribution along the MCS lifecycle is similar to that of hail; however, the average peak time is delayed from 0.25 to 0.35. Also, tornadoes can still occur near the end of the MCS life span (0.9–1.0). The difference in the patterns of hail and tornado occurrence along the MCS lifecycle echoes the different mechanisms for the production of the two types of hazards. Hail production is most active in the upscale growth stage of MCSs, as the strongest updrafts, CAPE, and deep wind shear which affect hail formation and growth (Allen et al., 2020) are associated with young and vigorous convection. Tornadoes occur throughout much of the MCS lifecycle with a milder variation at different stages. This might not be surprising, as tornadoes can form along the outflow boundary produced by MCSs (Knupp et al., 2014; Markowski et al., 1998; Lee and Wilhelmson, 1997), which is more related to mesoscale downdrafts, precipitation, and evaporative cooling rather than the convective portion of MCSs. In addition to the direct tornadogenesis by convective cores embedded in parent MCSs, the interactions between supercells and the pre-existing, low-level thermal boundaries generated by MCSs were shown to augment the ambient horizontal vorticity (Markowski et al., 1998), which could facilitate the formation of mesocyclones and the subsequent tornadogenesis. For example, 70 % of significant tornadoes were reported within 30 km of such boundaries during the Verifications of the Origins of Rotation in Tornadoes Experiment (VORTEX; Markowski et al., 1998).
3.3 Severity characterization of MCS-related hail and tornado
Previous research has indicated that the spatiotemporal features of hazards can exhibit significant variations across different levels of severity (e.g., Anderson-Frey et al., 2019). It would be interesting to understand how the severity of hail and tornado is associated with MCS events. Figure 7a presents the histograms of the 2004–2017 total number of hail reports as a function of hailstone size, overlaid by the MCS-related fraction. First, the number of events decreases by about an order of magnitude from severe hail (1–2 in.; 52 353 counts) to significant severe hail (≥2 in.; 5121 counts), which is expected because larger hailstones are rarer compared to smaller ones. However, the MCS-related percentages are similar (13.7 % for severe hail and 13.1 % between the two hail categories), meaning that MCSs are not selective for producing a certain size of hail. For tornadoes, interestingly, the MCS-related fraction increases nearly monotonically from 20 % at EF0 (1105 out of 5455) to 35 % at EF3 (96 out of 272). As revealed by previous studies (Maddox et al., 1979; Markowski et al., 1998; Wurman et al., 2007), a considerable number of tornadoes occurred near low-level boundaries (e.g., synoptic-scale fronts or outflow boundaries produced by existing convection), which may be associated with the interactions between outflow boundaries of MCSs and new emerging convective cells in the vicinity. Such a configuration has been reported when supercells move along or across those boundaries due to the enhanced low-level wind shear (Fan et al., 2023), and many significant tornadoes with devastating outbreaks formed near low-level boundaries not associated with the forward or rear-flank downdrafts of supercells (Markowski et al., 1998; Knupp et al., 2014). It has been hypothesized that these pre-existing boundaries promote the production of tornadic low-level mesocyclones by augmenting the ambient horizontal vorticity (Markowski et al., 1998); however, the boundary–supercell interaction and the quantification of how it would affect tornadogenesis warrant further observational and modeling studies.
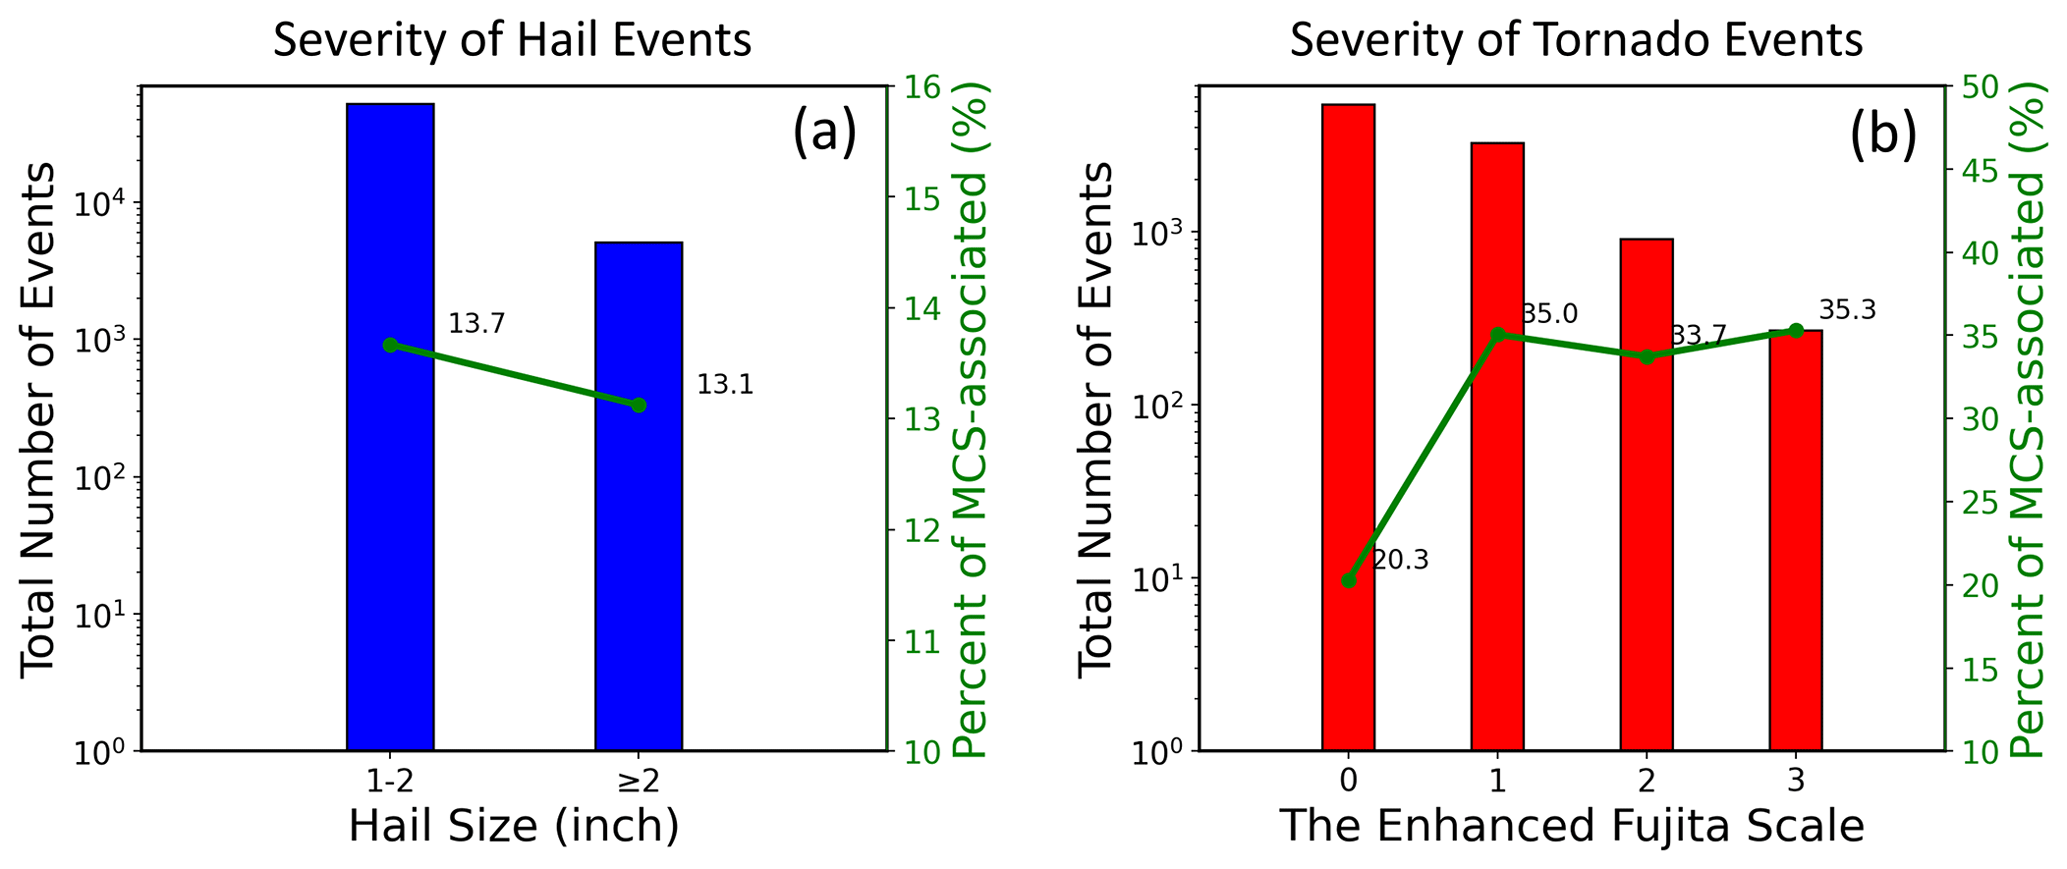
Figure 7(a) Dependence of the total number of hail events as a function of hailstone size overlaid by their fractions of MCS-related events in green lines. (b) Same as (a) except for tornadoes.
A closer examination of the EF5 tornadoes and their associated MCSs is shown in Fig. S5, which all occurred on 27 April 2011 during the catastrophic tornado outbreak. It is important to note that the systems that generated the EF5 tornadoes in the afternoon were classified as supercells (Kunupp et al., 2014; Chasteen and Koch, 2022a, b) because of their cellular signatures in the low-level radar observations. However, their reflectivity fields (>20 dBZ) were connected at the upper level because of their proximity to each other. As a result, the cores of those supercells were considered parts of an MCS-core using the aggregation radius of 12 km in this study. By applying a stricter convective aggregation radius of 8 km, the catastrophic EF5 tornadoes are no longer MCS-related. However, the choice of a more stringent convective aggregation radius does not change the increasing trend of MCS-related fraction with tornado severity (Fig. S6b).
It is noteworthy the genesis of EF4 and EF5 tornadoes has been commonly associated with supercells in prior studies (e.g., Smith et al., 2012; Knupp et al., 2014), which were excluded in studies focused on MCS/QLCS severe weather attributions (Trapp et al., 2005; Ashley et al., 2019) based on mostly manual examination of radar imagery. However, by using the automated algorithm featured in this study, considerable fractions of EF4 and EF5 tornadoes (25 out of 63) were found to be MCS-related because of the supercells embedded in MCSs. By manual examination of the 25 MCS-related tornadoes with a severity of EF4 and EF5, it is observed that their respective low-level radar reflectivity field exhibits distinct supercell structures embedded in the MCSs. These supercell structures, however, were not evident in the composite radar reflectivity data. As a result, these particular records were not considered in the analysis.
To eliminate the effect of outliers brought by the abnormally high occurrence of hazard events in 2011 (Fig. 6), the year 2011 is excluded from the statistics (Fig. S7). Compared to Fig. 7, although all the MCS-related fractions at different severity levels decrease, the trends of the two MCS-related fractions remain consistent.
Quantifying the relationships of hail and tornado events with MCSs is of great importance for understanding the potential of MCSs in hazardous weather production in addition to their roles in regulating the hydrological cycle. By carefully matching the hazard report data from NCEI to a satellite radar combined MCS tracking database spatially and temporally, we explore the characteristics of hail and tornadoes and particularly quantify their relationships with MCSs based on a recent 14-year period (2004–2017).
We find that 8 %–17 % of hail events and 17 %–32 % of tornadoes east of the US Rocky Mountains are MCS-related, which are slightly higher than the results from previous studies (e.g., 10 % of QLCS-related hail occurrence in Ashley et al., 2019; 18 % to 21 % of QLCS-related tornado occurrence in Trapp et al., 2005, and Ashley et al., 2019). The difference is possible because a broader spectrum of MCSs is considered in this study besides the QLCSs, as about 60 % of MCSs are found to be nonlinear (Cui et al., 2021). Interestingly, the MCS-related percentage for tornadoes is almost doubled relative to hail, which may be related to the strong and organized outflow boundaries produced by MCSs that enhance low-level wind shear and favor tornado formation.
Seasonally, the total count of MCS-related hail events peaks in spring over the SGP, followed by summer, when the MCS-related hot zone shifts to the NGP. Although the total occurrence of MCS-related hail events in winter and fall is low, the MCS-associated fraction reaches maximum in winter. Similar seasonality is also observed for tornadoes, and the monthly variation in the MCS-related count of events and fraction is almost identical between the two types of hazards. The majority of MCS-related hail (68 %) and tornado (56 %) events occur in spring (April–June). Although the overall hazard occurrence is rare in winter, a notable fraction is from MCSs (up to 30 % for hail and up to 51 % for tornadoes). The consistent seasonal patterns show that the production of both types of hazards is highly concentrated during the period from mid-spring to early summer, when the migratory extratropical cyclones and the associated synoptical features favor MCS formation (Song et al., 2019) and produce hazards (Johns, 1984; Guastini and Bosart, 2016) in an environment with high instability and baroclinicity (Whittaker and Horn, 1984; Lukens et al., 2018).
Hail and tornadoes demonstrate different patterns of occurrence during the MCS lifecycle. Hail production is most active during the MCS upscale growth stage, as the strongest updrafts, CAPE, and deep wind shear promote the growth of young and vigorous convection. Hail occurrence drastically decreases after MCSs enter the mature stage with the spatial expansion of the stratiform rain area. Finally, the decreasing trend persists toward the dissipation stage when both convective and stratiform rain areas shrink to minima. In contrast, the MCS-related tornado occurrence has a delayed peak time and decreases more slowly during the MCS mature stage compared to that of hail, suggesting the distinct mechanisms for the production of the two types of hazards in MCSs. MCSs have shown the production of tornadic low-level mesocyclones by augmenting the ambient horizontal vorticity. Therefore, tornadogenesis is most frequent after the strongest convective development during the early growth stage and persists through the MCS mature stage.
Regarding the severity distribution, both the total number and MCS-related number of events decrease as the severity increases for both hail and tornado events. However, the trends of MCS-related fraction with severity remarkably differ between the two types of hazards. For hail events, MCS-related fractions are similar between severe hail and significant severe hail (∼13 %). In contrast, tornadoes with a larger EF scale have a higher chance to be associated with MCSs, which may be associated with the interactions between MCS outflow boundaries and emerging new convective cells due to enhanced low-level wind shear (Schultz et al., 2014).
By collocating an MCS tracking database with the hazard reports, this study shows that MCSs play a non-negligible role in the production of hail and tornado events, in contrast to previous works focusing on a subset of MCSs such as QLCSs. More importantly, the increasing contribution of MCSs towards higher tornado severity has not been statistically revealed before. Although the EF4 and EF5 tornado-producing supercells embedded in MCSs were detected in the automated algorithm employed in this study, such a condition was rare for tornadoes at EF3 and lower intensity based on our sampling results (the complete manual screening of all tornado events is apparently infeasible). This reinforces the robustness of the observed increasing trend in the MCS's fractional contribution to tornadoes with increasing severity. Given the fact that there are numerous hazard events occurring in the vicinity of MCSs, future work should focus on the dependence and interactions between these hazard events and the outflow boundaries produced by MCSs. In addition to hail and tornadoes, MCSs are also prolific in producing wind hazards. Different from the dominance of continental convective processes in generating hail and tornadoes, wind hazards can result from other meteorological phenomena like hurricanes, microbursts, tight pressure gradients, and strong frontal systems. Their distinct characteristics, occurrence frequency, and research needs warrant separate follow-up studies.
The MCS dataset is obtained from the DOE Atmospheric Radiation Measurement (ARM) data archive (https://portal.nersc.gov/archive/home/w/wang406/www/Publication/Wang2023NHESS, Feng, 2019). The hazard reports are obtained from the National Oceanic and Atmospheric Administration (NOAA) National Centers for Environmental Information (NCEI) Storm Events Database (https://www.ncdc.noaa.gov/stormevents/ftp.jsp, NCEI, 2023).
The supplement related to this article is available online at: https://doi.org/10.5194/nhess-23-3823-2023-supplement.
JF conceived the idea and guided the work, and JW performed the formal analysis and wrote the first draft of the manuscript. JF and ZF provided comments and support during the data analysis and paper process. ZF provided technical support with the modification of the MCS tracking algorithm.
The contact author has declared that none of the authors has any competing interests.
Publisher's note: Copernicus Publications remains neutral with regard to jurisdictional claims made in the text, published maps, institutional affiliations, or any other geographical representation in this paper. While Copernicus Publications makes every effort to include appropriate place names, the final responsibility lies with the authors.
This work was supported by the US Department of Energy Office of Science Early Career Award Program (70017) and Biological and Environmental Research program as part of the Regional and Global Model Analysis and Multi-Sector Dynamics program areas (award number DE-SC0016605). PNNL is operated for the US DOE by Battelle Memorial Institute under contract DE-AC05-76RL01830. Argonne National Laboratory is operated for the DOE by UChicago Argonne, LLC, under contract DE-AC02-06CH11357. This research used resources of the National Energy Research Scientific Computing Center (NERSC), a US Department of Energy Office of Science user facility operated under contract DE-AC02-05CH11231. Jingyu Wang is supported by the National Institute of Education, Singapore, under its Academic Research Fund (RI 5/22 WJY). Any opinions, findings, and conclusions or recommendations expressed in this article are those of the authors and do not reflect the views of the National Institute of Education, Singapore. The authors are grateful to James N. Marquis at PNNL for his insightful comments and suggestions.
This study has been funded by the Nanyang Technological University Social Science and Humanities Research (SSHR) 2025 Seed Grant (NTU SSHR 4/22 WJY).
This paper was edited by Piero Lionello and reviewed by two anonymous referees.
Allen, J. T. and Tippett, M. K.: The characteristics of United States hail reports: 1955–2014. Electron, J. Severe Storms Meteorol., 10, 1–31, https://doi.org/10.55599/ejssm.v10i3.60, 2015.
Allen, J. T., Tippett, M. K., and Sobel, A. H.: Influence of the El Nino/Southern Oscillation on tornado and hail frequency in the United States, Nat. Geosci., 8, 278–283, https://doi.org/10.1038/Ngeo2385, 2015.
Allen, J. T., Giammanco, I. M., Kumjian, M. R., Punge, H. J., Zhang, Q., Groenemeijer, P., Kunz, M., and Ortega, K.: Understanding hail in the Earth system, Rev. Geophys., 58, e2019RG000665, https://doi.org/10.1029/2019RG000665, 2020.
Anderson-Frey, A. K., Richardson, Y. P., Dean, A. R., Thompson, R. L., and Smith, B. T.: Characteristics of Tornado Events and Warnings in the Southeastern United States, Weather Forecast., 34, 1017–1034, https://doi.org/10.1175/WAF-D-18-0211.1, 2019.
Ashley, W. S., Haberlie, A. M., and Strohm, J.: A Climatology of Quasi-Linear Convective Systems and Their Hazards in the United States, Weather Forecast., 34, 1605–1631, https://doi.org/10.1175/WAF-D-19-0014.1, 2019.
Baggett, C. F., Nardi, K. M., Childs, S. J., Zito, S. N., Barnes, E. A., and Maloney, E. D.: Skillful subseasonal forecasts of weekly tornado and hail activity using the Madden–Julian Oscillation, J. Geophys. Res.-Atmos., 123, 12661–12675, https://doi.org/10.1029/2018JD029059, 2018.
Barrett, B. S. and Gensini, V. A.: Variability of central United States April–May tornado day likelihood by phase of the Madden-Julian Oscillation, Geophys. Res. Lett., 40, 2790–2795, https://doi.org/10.1002/grl.50522, 2013.
Barrett, B. S. and Henley, B. N.: Intraseasonal Variability of Hail in the Contiguous United States: Relationship to the Madden–Julian Oscillation, Mon. Weather Rev., 143, 1086–1103, https://doi.org/10.1175/MWR-D-14-00257.1, 2015.
Blair, S. F., Laflin, J. M., Cavanaugh, D. E., Sanders, K. J., Currens, S. R., Pullin, J. I., Cooper, D. T., Deroche, D. R., Leighton, J. W., Fritchie, R. V., Mezeul II, M. J., Goudeau, B. T., Kreller, S. J., Bosco, J. J., Kelly, C. M., and Mallinson, H. M.: High-Resolution Hail Observations: Implications for NWS Warning Operations, Weather Forecast., 32, 1101–1119, https://doi.org/10.1175/WAF-D-16-0203.1, 2017.
Brotzge, J., Nelson, S. E., Thompson, R. L., and Smith, B. T.: Tornado probability of detection and lead time as a function of convective mode and environmental parameters, Weather Forecast., 28, 1261–1276, https://doi.org/10.1175/WAF-D-12-00119.1, 2013.
Burrows, D. A., Ferguson, C. R., Campbell, M. A., Xia, G., and Bosart, L. F.: An Objective Classification and Analysis of Upper-Level Coupling to the Great Plains Low-Level Jet over the Twentieth Century, J. Climate, 32, 7127–7152, https://doi.org/10.1175/JCLI-D-18-0891.1, 2019.
Chasteen, M. B. and Koch, S. E.: Multiscale Aspects of the 26–27 April 2011 Tornado Outbreak. Part I: Outbreak Chronology and Environmental Evolution, Mon. Weather Rev., 150, 175–201, https://doi.org/10.1175/MWR-D-21-0013.1, 2022a.
Chasteen, M. B. and Koch, S. E.: Multiscale Aspects of the 26–27 April 2011 Tornado Outbreak. Part II: Environmental Modifications and Upscale Feedbacks Arising from Latent Processes, Mon. Weather Rev., 150, 203–234, https://doi.org/10.1175/MWR-D-21-0014.1, 2022b.
Childs, S. J., Schumacher, R. S., and Allen, J. T.: Cold-Season Tornadoes: Climatological and Meteorological Insights, Weather Forecast., 33, 671–691, https://doi.org/10.1175/WAF-D-17-0120.1, 2018.
Cintineo, J. L., Smith, T. M., Lakshmanan, V., Brooks, H. E., and Ortega, K. L.: An objective high-resolution hail climatology of the contiguous United States, Weather Forecast., 27, 1235–1248, https://doi.org/10.1175/WAF-D-11-00151.1, 2012.
Craven, J. P., Brooks, H. E., and Hart, J. A.: Baseline climatology of sounding derived parameters associated with deep, moist convection, in 21st Conf. on Severe Local Storms, San Antonio, TX, Amer. Meteor. Soc., 643–646, https://www.nssl.noaa.gov/users/brooks/public_html/papers/cravenbrooksnwa.pdf (last access: 20 May 2022), 2004.
Cui, W., Dong, X., Xi, B., and Feng, Z.: Climatology of Linear Mesoscale Convective System Morphology in the United States based on Random Forests Method, J. Climate, 34, 7257–7276, https://doi.org/10.1175/JCLI-D-20-0862.1, 2021.
Doswell, C. A. and Burgess, D. W.: On Some Issues of United States Tornado Climatology, Mon. Weather Rev., 116, 495–501, https://doi.org/10.1175/1520-0493(1988)116<0495:OSIOUS>2.0.CO;2, 1988.
Doswell, C. A., Brooks, H. E., and Kay, M. P.: Climatological Estimates of Daily Local Nontornadic Severe Thunderstorm Probability for the United States, Weather Forecast., 577–595, https://doi.org/10.1175/WAF866.1, 2005.
Duda, J. D. and Gallus Jr., W. A.: Spring and Summer Midwestern Severe Weather Reports in Supercells Compared to Other Morphologies, Weather Forecast., 25, 190–206, https://doi.org/10.1175/2009WAF2222338.1, 2010.
Fan, J., Wang, J., and Lin, Y.: Urbanization Enhances Tornado Potential: A Case Study, Front. Earth Sci., 11, 1148506, https://doi.org/10.3389/feart.2023.1148506, 2023.
Feng, Z.: HPSS archive: listing of /home/w/wang406/www/Publication/Wang2023NHESS/, NERSC [data set], https://portal.nersc.gov/archive/home/w/wang406/www/Publication/Wang2023NHESS (last access: 14 December 2023), 2019.
Feng, Z., Leung, L. R., Houze Jr., R. A., Hagos, S., Hardin, J., Yang, Q., Han, B., and Fan, J.: Structure and evolution of mesoscale convective systems: Sensitivity to cloud microphysics in convection-permitting simulations over the United States, J. Adv. Model. Earth Syst., 10, 1470–1494, https://doi.org/10.1029/2018MS001305, 2018.
Feng, Z., Houze, R. A., Leung, L. R., Song, F., Hardin, J. C., Wang, J., Gustafson, W. I., and Homeyer, C. R.: Spatiotemporal Characteristics and Large-Scale Environments of Mesoscale Convective Systems East of the Rocky Mountains, J. Climate, 32, 7303–7328, https://doi.org/10.1175/JCLI-D-19-0137.1, 2019.
Feng, Z., Leung, L. R., Liu, N., Wang, J., Houze Jr., R. A., Li, J., Hardin, J. C., Chen, D., and Guo, J.: A Global High-Resolution Mesoscale Convective System Database Using Satellite-Derived Cloud Tops, Surface Precipitation, and Tracking, J. Geophys. Res.-Atmos., 126, e2020JD034202, https://doi.org/10.1029/2020JD034202, 2021.
Gallus, W. A., Snook, N. A., and Johnson, E. V.: Spring and Summer Severe Weather Reports over the Midwest as a Function of Convective Mode: A Preliminary Study, Weather Forecast., 23, 101–113, https://doi.org/10.1175/2007WAF2006120.1, 2008.
Gensini, V. A. and Allen, J. T.: U.S. hail frequency and the global wind oscillation, Geophys. Res. Lett., 45, 1611–1620, https://doi.org/10.1002/2017GL076822, 2018.
Gensini, V. A. and Marinaro, A.: Tornado frequency in the United States related to global relative angular momentum, Mon. Weather Rev., 144, 801–810, https://doi.org/10.1175/MWR-D-15-0289.1, 2016.
Grams, J. S., Gallus Jr., W. A., Wharton, L. S., Koch, S. E., Loughe, A., and Ebert E. E.: The use of a modified Ebert–McBride technique to evaluate mesoscale model QPF as a function of convective system morphology during IHOP 2002, Weather Forecast., 21, 288–306, https://doi.org/10.1175/WAF918.1, 2006.
Guastini, C. T. and Bosart, L. F.: Analysis of a progressive derecho climatology and associated formation environments, Mon. Weather Rev., 144, 1363–1382, https://doi.org/10.1175/MWR-D-15-0256.1, 2016.
Haberlie, A. M. and Ashley, W. S.: A Method for Identifying Midlatitude Mesoscale Convective Systems in Radar Mosaics. Part I: Segmentation and Classification, J. Appl. Meteorol. Clim., 57, 1575–1598, https://doi.org/10.1175/JAMC-D-17-0293.1, 2018a.
Haberlie, A. M. and Ashley, W. S.: A method for identifying midlatitude mesoscale convective systems in radar mosaics. Part II: Tracking, J. Appl. Meteorol. Clim., 57, 1599–1621, https://doi.org/10.1175/JAMC-D-17-0294.1, 2018b.
Haberlie, A. M. and Ashley, W. S.: Climatological Representation of Mesoscale Convective Systems in a Dynamically Downscaled Climate Simulation, Int. J. Climatol., 39, 1144–1153, https://doi.org/10.1002/joc.5880, 2019.
Holton, J. R.: An introduction to dynamic meteorology, Elsevier Academic Press, Burlington, MA, 535 pp., https://doi.org/10.1119/1.1987371, 2004.
Houze, R. A., Smull, B. F., and Dodge, P.: Mesoscale Organization of Springtime Rainstorms in Oklahoma, Mon. Weather Rev., 118, 613–654, https://doi.org/10.1175/1520-0493(1990)118<0613:MOOSRI>2.0.CO;2, 1990.
Houze, R. A., Rasmussen, K. L., Zuluaga, M. D., and Brodzik, S. R.: The variable nature of convection in the tropics and subtropics: A legacy of 16 years of the Tropical Rainfall Measuring Mission satellite, Rev. Geophys., 53, 994–1021, https://doi.org/10.1002/2015RG000488, 2015.
Houze Jr., R. A.: Mesoscale convective systems, Rev. Geophys., 42, RG4003, https://doi.org/10.1029/2004RG000150, 2004.
Houze Jr., R. A.: 100 Years of Research on Mesoscale Convective Systems, Meteorol. Monogr., 59, 17.1–17.54, https://doi.org/10.1175/AMSMONOGRAPHS-D-18-0001.1, 2018.
Hu, H., Feng, Z., and Leung, L. R.: Quantifying Flood Frequency Associated with Clustered Mesoscale Convective Systems in the United States, J. Hydrometeorol., 23, 1685–1703, https://doi.org/10.1175/JHM-D-22-0038.1, 2022.
Hu, H. C., Feng, Z., and Leung, L. Y. R.: Linking Flood Frequency With Mesoscale Convective Systems in the US, Geophys. Res. Lett., 48, e2021GL092546, https://doi.org/10.1029/2021GL092546, 2021.
Jeong, J., Fan, F., Homeyer, C. R., and Hou, Z.: Understanding Hailstone Temporal Variability and Contributing Factors over the U.S. Southern Great Plains, J. Climate, 33, 3947–3966, https://doi.org/10.1175/JCLI-D-19-0606.1, 2020.
Jeong, J.-H., Fan, J. W., and Homeyer, C. R.: Spatial and temporal trends and variabilities of hailstones in the United States Northern Great Plains and their possible attributions, J. Climate, 34, 6819–6840, https://doi.org/10.1175/Jcli-D-20-0245.1, 2021.
Johns, R. H.: A synoptic climatology of northwest-flow severe weather outbreaks. Part II: Meteorological parameters and synoptic patterns, Mon. Weather Rev., 112, 449–464, https://doi.org/10.1175/1520-0493(1984)112<0449:ASCONF>2.0.CO;2, 1984.
Kelly, D. L., Schaefer, J. T., and Doswell III, C. A.: Climatology of Nontornadic Severe Thunderstorm Events in the United States, Mon. Weather Rev., 113, 1997–2014, https://doi.org/10.1175/1520-0493(1985)113<1997:CONSTE>2.0.CO;2, 1985.
Kennedy, P. C. and Detwiler, A. G.: A case study of the origin of hail in a multicell thunderstorm using in situ aircraft and polarimetric radar data, J. Appl. Meteorol., 42, 1679–1690, https://doi.org/10.1175/1520-0450(2003)042<1679:ACSOTO>2.0.CO;2, 2003.
Knupp, K. R., Murphy, T. A., Coleman, T. A., Wade, R. A., Mullins, S. A., Schultz, C. J., Schultz, E. V., Carey, L., Sherrer, A., McCaul Jr., E. W., Carcione, B., Latimer, S., Kula, A., Laws, K., Marsh, P. T., and Klockow, K.: Meteorological overview of the devastating 27 April 2011 tornado outbreak, B. Am. Meteorol. Soc., 95, 1041–1062, https://doi.org/10.1175/bams-d-11-00229.1, 2014.
Lee, B. D. and Wilhelmson, R. B.: The numerical simulation of non-supercell tornadogenesis. Part II: Evolution of a family of tornadoes along a weak outflow boundary, J. Atmos. Sci., 54, 2387–2415, 1997.
Lepore, C., Tippett, M. K., and Allen, J. T.: ENSO-based probabilistic forecasts of March–May U.S. tornado and hail activity, Geophys. Res. Lett., 44, 9093–9101, https://doi.org/10.1002/2017gl074781, 2017.
Li, J., Feng, Z., Qian, Y., and Leung, L. R.: A high-resolution unified observational data product of mesoscale convective systems and isolated deep convection in the United States for 2004–2017, Earth Syst. Sci. Data, 13, 827–856, https://doi.org/10.5194/essd-13-827-2021, 2021.
Lukens, K. E., Berbery, E. H., and Hodges, K. I.: The imprint of strong-storm tracks on winter weather in North America, J. Climate, 31, 2057–2074, https://doi.org/10.1175/JCLI-D-17-0420.1, 2018.
Maddox, R. A., Chappell, C. F., and Hoxit, L. R.: Synoptic and Meso-α Scale Aspects of Flash Flood Events, B. Am. Meteorol. Soc., 60, 115–123, https://doi.org/10.1175/1520-0477-60.2.115, 1979.
Markowski, P. M., Rasmussen, E. N., and Straka, J. M.: The occurrence of tornadoes in supercells interacting with boundaries during VORTEX-95, Weather Forecast., 13, 852–859, https://doi.org/10.1175/1520-0434(1998)013<0852:TOOTIS>2.0.CO;2, 1998.
Molthan, A. L., Case, J. L., Dembek, S. R., Jedlovec, G. J., and Lapenta, W. M.: The Super Tuesday outbreak: Forecast sensitivities to single-moment microphysics schemes. Preprints, in: 24th Conf. on Severe Local Storms, Savannah, GA, Amer. Meteor. Soc., https://ams.confex.com/ams/pdfpapers/141747.pdf (last access: 20 May 2022), 2008.
Moore, T. W.: Annual and seasonal tornado activity in the United States and the global wind oscillation, Clim. Dynam., 50, 4323–4334, https://doi.org/10.1007/s00382-017-3877-5, 2018.
Miller, P. W. and Mote, T. L.: Standardizing the Definition of a “Pulse” Thunderstorm, B. Am. Meteorol. Soc., 98, 905–913, https://doi.org/10.1175/BAMS-D-16-0064.1, 2017.
Moller, A. R., Doswell, C. A., Foster, M. P., and Woodall G. R.: The Operational Recognition of Supercell Thunderstorm Environments and Storm Structures, Weather Forecast., 9, 327–347, https://doi.org/10.1175/1520-0434(1994)009<0327:TOROST>2.0.CO;2, 1994.
Munich Re: Natural Catastrophes 2015 Analyses, Assessments, Positions, https://reliefweb.int/report/world/natural-catastrophes-2013-analyses-assessments-positions (last access: 20 May 2022), 2016.
Murphy, A. M., Homeyer, C. R., and Allen, K. Q.: Development and investigation of gridrad-severe, a multi-year severe event radar dataset, Mon. Weather Rev., 151, 2257–2277, https://doi.org/10.1175/MWR-D-23-0017.1, 2023.
National Weather Service: National Weather Service Instruction 10-1605, https://www.nws.noaa.gov/directives/sym/pd01016005curr.pdf (last access: 1 June 2023), 2021.
NCEI: Storm events database, https://www.ncdc.noaa.gov/stormevents/ftp.jsp (last access: 20 May 2022), 2023.
Nelson, S. P.: The hybrid multicellular–supercellular storm – an efficient hail producer. Part II. General characteristics and implications for hail growth, J. Atmos. Sci., 44, 2060–2073, https://doi.org/10.1175/1520-0469(1987)044<2060:THMSEH>2.0.CO;2, 1987.
Nielsen, E. R. and Schumacher, R. S.: Dynamical insights into extreme short-term precipitation associated with supercells and mesovortices, J. Atmos. Sci., 75, 2983–3009, https://doi.org/10.1175/JAS-D-17-0385.1, 2018.
Nielsen, E. R. and Schumacher, R. S.: Dynamical mechanisms supporting extreme rainfall accumulations in the Houston “Tax Day” 2016 flood, Mon. Weather Rev., 148, 83–109, https://doi.org/10.1175/MWR-D-19-0206.1, 2020.
Parker, M. D. and Johnson, R. H.: Organizational modes of midlatitude mesoscale convective systems, Mon. Weather Rev., 128, 3413–3436, https://doi.org/10.1175/1520-0493(2001)129<3413:OMOMMC>2.0.CO;2, 2000.
Prein, A. F. and Holland, G. J.: Global estimates of damaging hail hazard, Weather Clim. Extrem., 22, 10–23, https://doi.org/10.1016/j.wace.2018.10.004, 2018.
Rasmussen, E. N.: Refined Supercell and Tornado Forecast Parameters, Weather Forecast., 18, 530–535, https://doi.org/10.1175/1520-0434(2003)18<530:RSATFP>2.0.CO;2, 2003.
Rasmussen, E. N. and Blanchard, D. O.: A Baseline Climatology of Sounding-Derived Supercell andTornado Forecast Parameters, Weather Forecast., 13, 1148–1164, https://doi.org/10.1175/1520-0434(1998)013<1148:ABCOSD>2.0.CO;2, 1998.
Schaefer, J. T., Levit, J. J., Weiss, S. J., and McCarthy, D. W.: The frequency of large hail over the contiguous United States, in: 14th Conf. on Applied Meteorology, Seattle, WA, Amer. Meteor. Soc., https://ams.confex.com/ams/pdfpapers/69834.pdf (last access: 20 May 2022), 2004.
Schoen, J. and Ashley, W. S.: A climatology of fatal convective wind events by storm type, Weather Forecast., 26, 109–121, https://doi.org/10.1175/2010WAF2222428.1, 2011.
Schumacher, R. S.: Mechanisms for quasi-stationary behavior in simulated heavy-rain-producing convective systems, J. Atmos. Sci., 66, 1543–1568, https://doi.org/10.1175/2008JAS2856.1, 2009.
Schumacher, R. S. and Rasmussen, K. L.: The formation, character and changing nature of mesoscale convective systems, Nat. Rev. Earth Environ., 1, 300–314, https://doi.org/10.1038/s43017-020-0057-7, 2020.
Smith, B. T., Thompson, R. L., Grams, J. S., Broyles, C., and Brooks, H. E.: Convective Modes for Significant Severe Thunderstorms in the Contiguous United States. Part I: Storm Classification and Climatology, Weather Forecast., 27, 1114–1135, https://doi.org/10.1175/WAF-D-11-00115.1, 2012. '
Song, F., Feng, Z., Leung, L. R., Houze Jr, R. A., Wang, J., Hardin, J., and Homeyer, C. R.: Contrasting Spring and Summer Large-Scale Environments Associated with Mesoscale Convective Systems over the U.S. Great Plains, J. Climate, 32, 6749–6767, https://doi.org/10.1175/JCLI-D-18-0839.1, 2019.
Starzec, M., Homeyer, C. R., and Mullendore, G. L.: Storm Labeling in Three Dimensions (SL3D): A Volumetric Radar Echo and Dual-Polarization Updraft Classification Algorithm, Mon. Weather Rev., 145, 1127–1145, https://doi.org/10.1175/MWR-D-16-0089.1, 2017.
Thompson, R. L., Smith, B. T., Grams, J. S., Dean, A. R., and Broyles, C.: Convective modes for significant severe thunderstorms in the contiguous United States. Part II: Supercell and QLCS tornado environments, Weather Forecast., 27, 1136–1154, https://doi.org/10.1175/WAF-D-11-00116.1, 2012.
Trapp, R. J., Tessendorf, S. A., Godfrey, E. S., and Brooks, H. E.: Tornadoes from Squall Lines and Bow Echoes. Part I: Climatological Distribution, Weather Forecast., 20, 23–34, https://doi.org/10.1175/WAF-835.1, 2005.
Trapp, R. J., Wheatley, D. M., Atkins, N. T., Przybylinski, R. W., and Wolf, R.: Buyer Beware: Some Words of Caution on the Use of Severe Wind Reports in Postevent Assessment and Research, Weather Forecast., 21, 408–415, https://doi.org/10.1175/WAF938.1, 2006.
Verbout, S. M., Brooks, H. E., Leslie, L. M., and Schultz, D. M.: Evolution of the U.S. Tornado Database: 1954–2003, Weather Forecast., 21, 86–93, https://doi.org/10.1175/WAF910.1, 2006.
Wang, J., Houze Jr., R. A., Fan, J., Brodzik, S. R., Feng, Z., and Hardin, J. C.: The detection of mesoscale convective systems by the GPM Ku-band spaceborne radar, J. Meteorol. Soc. Jpn., 97, 1059–1073, https://doi.org/10.2151/jmsj.2019-058, 2019a.
Wang, J., Dong, X., Kennedy, A., Hagenhoff, B., and Xi, B.: A Regime-Based Evaluation of Southern and Northern Great Plains Warm-Season Precipitation Events in WRF, Weather Forecast., 34, 805–831, https://doi.org/10.1175/WAF-D-19-0025.1, 2019b.
Whittaker, L. M. and Horn, L. H.: Northern Hemisphere extratropical cyclone activity for four mid-season months, J. Climatol., 4, 297–310, https://doi.org/10.1002/joc.3370040307, 1984.
Wurman, J., Alexander, C., Robinson, P., and Richardson, Y.: Low-Level Winds in Tornadoes and Potential Catastrophic Tornado Impacts in Urban Areas, B. Am. Meteorol. Soc., 88, 31–46, https://doi.org/10.1175/BAMS-88-1-31, 2007.