the Creative Commons Attribution 4.0 License.
the Creative Commons Attribution 4.0 License.
 | 14 Nov 2023
Human displacements from Tropical Cyclone Idai attributable to climate change
Benedikt Mester
Thomas Vogt
Seth Bryant
Christian Otto
Katja Frieler
Jacob Schewe
Extreme weather events, such as tropical cyclones, often trigger population displacement. The frequency and intensity of tropical cyclones are affected by anthropogenic climate change. However, the effect of historical climate change on displacement risk has so far not been quantified. Here, we show how displacement can be partially attributed to climate change using the example of the 2019 Tropical Cyclone Idai in Mozambique. We estimate the population exposed to high water levels following Idai's landfall using a combination of a 2D hydrodynamical storm surge model and a flood depth estimation algorithm to determine inland flood depths from remote sensing images, factual (climate change) and counterfactual (no climate change) mean sea level, and maximum wind speed conditions. Our main estimates indicate that climate change has increased displacement risk from this event by approximately 12 600–14 900 additional displaced persons, corresponding to about 2.7 % to 3.2 % of the observed displacements. The isolated effect of wind speed intensification is double that of sea level rise. These results are subject to important uncertainties related to both data and modeling assumptions, and we perform multiple sensitivity experiments to assess the range of uncertainty where possible. Besides highlighting the significant effects on humanitarian conditions already imparted by climate change, our study provides a blueprint for event-based displacement attribution.
- Article
(3947 KB) - Full-text XML
-
Supplement
(1107 KB) - BibTeX
- EndNote


Between 1980 and 2021, an average of 45 tropical cyclones (TCs) globally have been recorded per year (Guha-Sapir et al., 2022). TCs pose a set of societal risks to coastal communities around the world. While related monetary losses are high, with an average of USD 57.2 billion every year since 2008 (Guha-Sapir et al., 2022), TCs also displace an average of 9.3 million people every year, with this hazard being responsible for 43 % of all weather-related displacements (IDMC, 2022). Such forced displacements are associated with human suffering, as well as substantial financial costs (e.g., for providing shelter or from loss of economic production), and often require international assistance for disaster relief funds and humanitarian response (Desai et al., 2021).
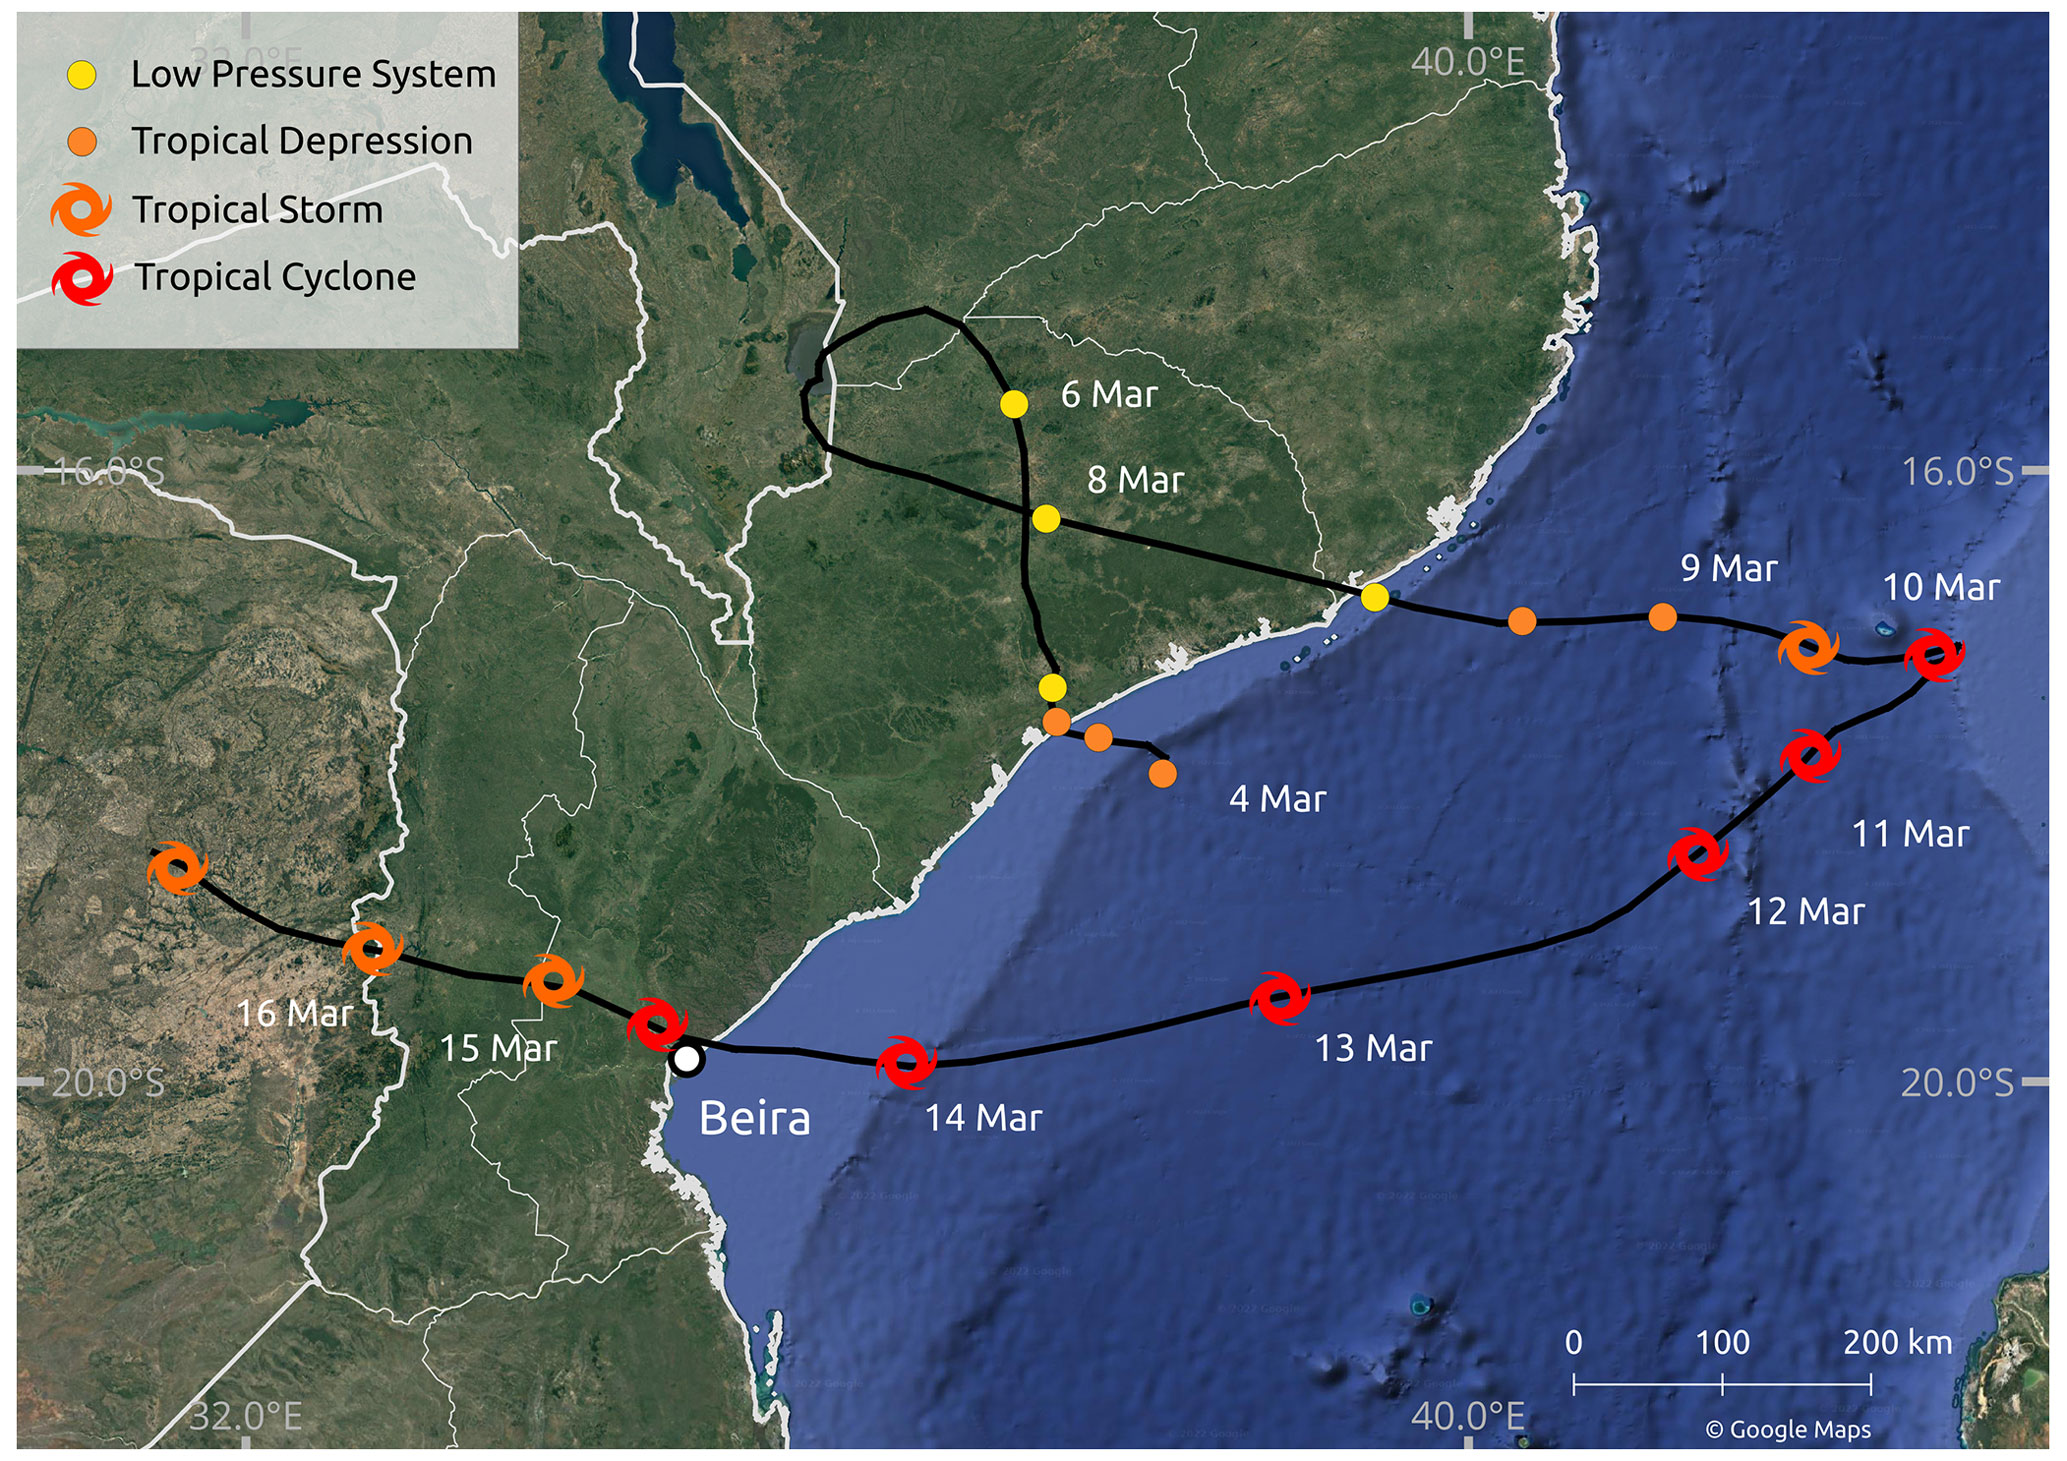
Figure 1Trajectory of Tropical Cyclone Idai over the southern Indian Ocean. Trajectory data are based on the IBTrACS database (Knapp et al., 2010). Mozambican administrative boundaries (GADM, 2018) in white; satellite image background by © Google Maps (Google Maps, 2022a). Dates and tropical cyclone status adopted from ReliefWeb (ReliefWeb, 2019a).
At the same time, global climate change is expected to alter TC characteristics, resulting in an increase in overall TC intensity (maximum wind speed and precipitation) and hence in the frequency of very intense TCs (category 4–5 on the Saffir–Simpson scale) (Knutson et al., 2020). Primarily, this is the result of an increase in potential intensity due to warmer sea surface temperatures (SSTs) (Emanuel, 1987, 2005, 2013). Sea level rise (SLR), also driven by global warming, additionally compounds coastal flood risk associated with TCs (e.g., Garner et al., 2017; Lin et al., 2012; Resio and Irish, 2016). Historic TC data records are short and partially inconsistent, making it difficult to determine the degree of intensification over time despite observed changes in some basins, such as the southern Indian Ocean (Knutson et al., 2019; Kossin et al., 2007, 2013; Webster et al., 2005). Moreover, existing TC datasets often focus on maximum wind speed, neglecting coastal and inland flooding which may be the dominant hazards, e.g., as for Hurricane Katrina or Hurricane Harvey (Bloemendaal et al., 2021). Paleo-climate records (Lin et al., 2014; Nott and Hayne, 2001) and synthetic TC tracks (Bloemendaal et al., 2020, 2022; Emanuel et al., 2006) can be used to extend TC records. However, sediment availability is limited to a few coastal stretches, and the statistical resampling process incorporates only the average observed climatic conditions, hampering the assessment of global climate change impacts over longer time periods (Bloemendaal et al., 2020). Nonetheless, given that global mean surface air temperature and sea level have already risen above pre-industrial conditions by about 1.1 ∘C and 0.20 m, respectively (Gulev et al., 2021), it is likely that recent TC landfalls have caused more severe societal impacts than would be expected without climate change. A probabilistic attribution addressing this topic is limited by the shortness of TC records (Trenberth et al., 2015) and may be additionally affected by multidecadal variability (e.g., the Atlantic Multidecadal Oscillation) or interannual climate variability (e.g., the El Niño–Southern Oscillation) (Patricola and Wehner, 2018). As a consequence, the portion of TC-induced human displacements attributable to climate change has so far not been quantified.
In this study, we address this research gap for the particular case of displacement triggered by TC Idai in 2019. We examine the floods in central Mozambique associated with TC Idai, considered to be “one of the Southern Hemisphere's most devastating storms on record” (Warren, 2019). On the 14th of March, Idai made landfall near the densely populated port city of Beira, inhabited by more than 530 000 people (Fig. 1). Alongside strong winds (maximum 1 min sustained winds of 180 km h−1) and extensive inland flooding caused by heavy rainfall, the cyclone also created a storm surge of up to 4.4 m, leading to coastal flooding centered at the port city of Beira (Probst and Annunziato, 2019). In Mozambique alone, TC Idai claimed the lives of more than 600 people and caused 478 000 internal displacements, as well as widespread structural damage totaling more than USD 2.1 billion (Guha-Sapir et al., 2022; IDMC, 2022).
Here, we investigate how the coastal flooding would have manifested in a counterfactual world without climate change and, consequently, how many of the observed human displacements from TC Idai could be linked to climate change. For the attribution of the impacts we follow the storyline approach introduced by Shepherd (2016). To this end, we account for two known mechanisms through which global climate change could have affected coastal flood hazard: SLR and amplification of storm intensity. Storm track and size are not changed, even though both parameters are subject to the effects of climate change (Knutson et al., 2019, 2020). We first estimate the influence of climate change on sea level and TC intensity in the southern Indian Ocean. We employ a high-resolution hydrodynamic flood model to simulate TC Idai's peak coastal flood extent and depth, both under historical conditions and under counterfactual conditions with lower sea levels and lower maximum wind speed, corresponding to a world without climate change. We additionally use satellite imagery to account for inland (fluvial and pluvial) flooding and estimate the total number of people affected by flooding. We then model the number of displacements based on flood-depth-specific vulnerability factors and estimate the fraction of displacements that can be attributed to climate change by comparing results under factual vs. counterfactual conditions.
We use an estimate of SLR that attempts to separate natural variability in ice sheet and glacier mass balance and retain only the long-term trend induced by global warming (Strauss et al., 2021). Beyond this, however, our analysis is indifferent to whether the trends in sea level and TC intensity are anthropogenic or not. This is in line with the definition of impact attribution put forward by the Intergovernmental Panel on Climate Change (IPCC), where “changes in natural, human, or managed systems are attributed to [a] change in [a] climate-related system” (O'Neill et al., 2022). Such a question can be separated from the climate attribution question of whether the change in the climate-related system – here, sea level and TCs – is due to anthropogenic forcing. This separation allows us to focus on the link between climate change and displacement despite remaining uncertainty about the exact anthropogenic contribution. We will return to this issue in the discussion.
This study aims to attribute coastal-flood-induced human displacements from TC Idai to historic climate change using a quantitative modeling approach. It addresses the need for insights into the human impacts of climate change globally and in particular in countries like Mozambique that suffer from a combination of high exposure to climate-related hazards – in this case, TCs – and high socioeconomic vulnerability. Moreover, Mozambique, like many other countries, is characterized by the limited availability of in situ observational data and a lack of calibrated, local-scale inundation models. We use remote sensing data and a globally applicable modeling framework to characterize flood exposure during TC Idai; reported displacement data are retrieved from the Global Internal Displacement Database (GIDD). Our approach is thus transferable to other cases in virtually all relevant countries.
2.1 Counterfactuals
Constructing counterfactuals for sea level and TC intensity requires estimating the effect of historical climate change on these quantities. Total global mean sea level has risen by approximately 230 mm since the turn of the 20th century (Church and White, 2011) and at a rate that has increased over time (Dangendorf et al., 2017). According to the IPCC, it is very likely that the rate of global mean SLR was 1.5 (1.1 to 1.9) mm yr−1 between 1902 and 2010 and 3.6 (3.1 to 4.1) mm yr−1 between 2006 and 2015 (Gulev et al., 2021). Nonetheless, regional changes in sea level may differ substantially from the global average due to shifting surface winds, the differential expansion of warming ocean water, and the addition of melting ice, which can alter the ocean circulation (Fox-Kemper et al., 2021). Additionally, increases in the amount of water stored on land (due to construction of dams and reservoirs), as well as land subsidence, have also affected total sea level, with their relative effects varying geographically (Church et al., 2004; Strauss et al., 2021).
Long-term in situ observational records of SLR are scarce in the Indian Ocean (Han et al., 2010), hampering a precise detection of changes in sea level. For example, no active tide gauge stations can be found on the coast of Beira (Beal et al., 2019), with the nearest station located in Inhambane, Mozambique, 448 km south of Beira. However, regional historical SLR rates for Mozambique, derived from satellite imagery or models, are close to global mean estimates. IPCC rates of change in sea surface height (geocentric sea level) derived from satellite altimetry show regional SLR off the coast of Mozambique at around 4.0 mm yr−1 for the period 1993–2012 (Church et al., 2013). Climate-induced SLR on the southeastern African coastline (1993–2015) is estimated at ∼3.5 mm yr−1 using a coastal-length weighted approach (Nicholls et al., 2021). Han et al. (2010) estimate regional Mozambican SLR at approximately 1.2 mm yr−1 between 1961–2008.
Given that these regional estimates are close to the global mean estimate by the IPCC, we assume that total SLR near Beira is the same as the global mean, a comparable approach as by Irish et al. (2014). In order to exclude trends induced by natural variability, particularly in sea level contributions from glaciers and ice sheets, we use estimates of global mean sea level rise attributable to anthropogenic climate change for 1900–2012 from Strauss et al. (2021). Their ensemble estimate is 6.6 to 17.1 cm, which we use to define counterfactual sea level parameters for the coastal flood model. This also implies assuming no substantial local effects of land subsidence and human-induced changes in land water storage through reservoir construction and groundwater extraction that would confound comparison with the global estimates. This is hard to verify but can be motivated by findings that city subsidence occurs only in a small fraction of the world's coasts (Nicholls et al., 2021).
Tropical cyclones are projected to become more intense with rising temperatures (Knutson et al., 2015), which is in line with the theoretical understanding of the potential intensity theory (Emanuel, 1987). Observed TC wind speed data in the southern Indian Ocean basin show that the maximum 10 min sustained wind speed has been increasing by about 0.3 kn (0.15 m s−1) per year on average, over the period 1973–2019 (Fig. 2). Prior to 1973, the rate of increase was likely smaller, though observational data are lacking. We make a conservative assumption corresponding to 50 years of increase at a rate of 0.2 kn (0.1 m s−1) per year, resulting in a total difference in maximum wind speed of approximately 10 kn (5.1 m s−1). For the case of TC Idai with maximum observed 10 min sustained wind speeds of 105 kn (54 m s−1), this corresponds to a 10 % reduction in maximum wind speed by removing climate change, which we adopt as a plausible assumption for counterfactual TC intensity.
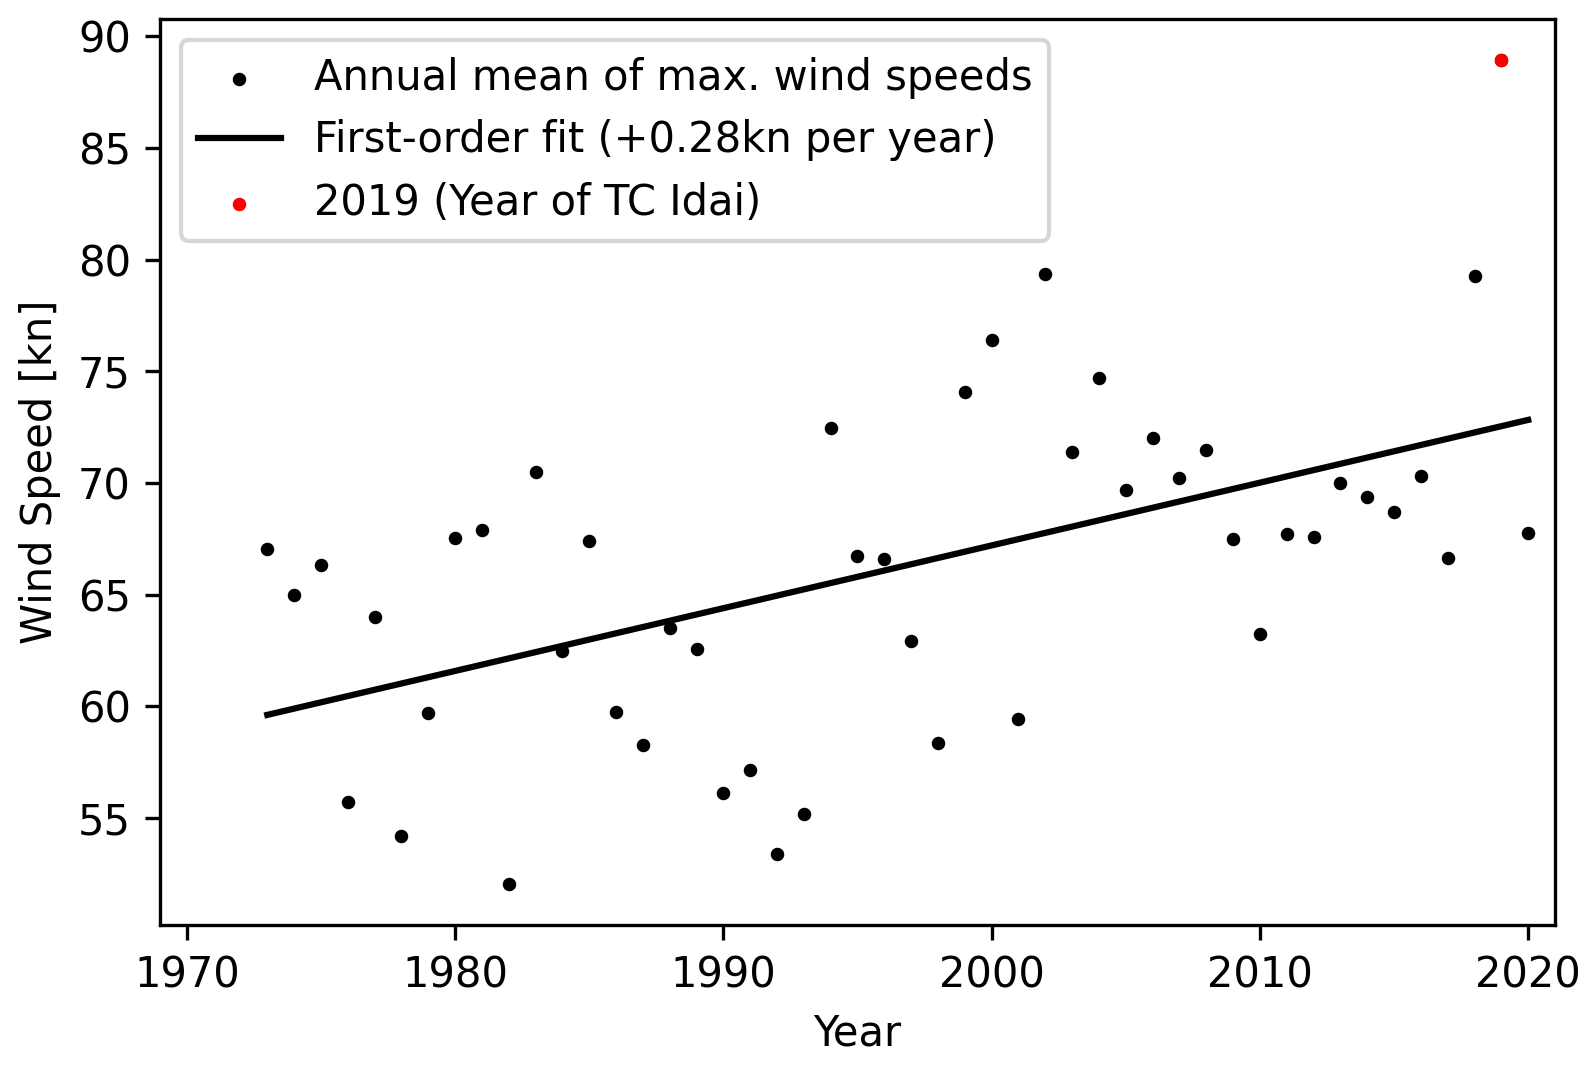
Figure 2Annual means of maximum TC wind speeds in the southern Indian Ocean (maximum 10 min sustained wind speeds). Linear trend over the period 1973–2020; data from the IBTrACS database (Knapp et al., 2010).
This value is in line with the remote-sensing-based estimates provided in Kossin et al. (2013), who find that lifetime maximum TC intensities in the southern Indian Ocean have increased by about 4.6 m s−1 over the period 1982–2009 (1.7 m s−1 per decade), which corresponds to 8.5 % of TC Idai's maximum intensity. If this rate of increase is linearly extrapolated to 2019, it results in an increase of about 6.3 m s−1 (11.6 %). Since the rate of increase has likely risen along with surface warming and since our period of reference extends back to 1973 rather than 1982, a value of 12 % might be a safer assumption for comparing the results of Kossin et al. (2013) with our own estimate. To quantify the effect of uncertainty in the estimate of TC intensity change, we conduct two sensitivity experiments, with counterfactual intensity lower than factual by 8.5 % and 12 %, respectively, reflecting the southern Indian Ocean estimate of Kossin et al. (2013) both directly and when extrapolated for comparability with our own estimate.
We note that lower rates of change have been found in climate-model-based studies. Knutson et al. (2020) find a 6 % increase in maximum intensity of southern Indian Ocean TCs per 2 ∘C global mean surface warming. When applied to the historical increase in global mean surface temperatures of 1.1 ∘C, this would yield an increase of 3.3 %. While these climate model estimates are important both for assessing future changes and for understanding the underlying mechanisms of observed trends, the remote-sensing-based trend estimates are more relevant for informing the construction of the counterfactual in our study.
2.2 Coastal flood modeling
The storm surge flood simulations are generated using the open-source geophysical flow solver GeoClaw (Mandli and Dawson, 2014). GeoClaw uses an efficient adaptive mesh refinement to model wind- and pressure-induced wave dynamics in the 2D depth-averaged shallow water equations. The input data include TC tracks, astronomical tides, and topographical raster data (see below), and GeoClaw provides outputs in the form of gridded maps of maximum flood heights as well as the temporal dynamics of storm surge at virtual tide gauge locations. We configure GeoClaw to limit the automatic mesh refinement to a spatial resolution of between 1 and 8 arcsec (approximately 30 and 240 m) inside of Idai's landfall area and to between 100 and 900 arcsec (approximately 3 and 27 km) in the open ocean.
As the factual input for GeoClaw, the TC track data from IBTrACS (Knapp et al., 2010) provided by the WMO Regional Specialized Meteorological Center at La Reunion (operated by Météo-France) are used. For the counterfactual scenarios with modified TC intensity, we multiply all wind speed values along the track by a scalar factor of 0.9 (for a decrease of 10 % in intensity). The central pressure at each track position is increased by 0.1 times the difference between central pressure and environmental pressure.
From the wind speed, pressure, and radius information provided along the TC track, GeoClaw derives surface wind speeds and air pressure at arbitrary locations in space and time using a radially symmetric wind profile (Holland, 1980) combined with the influence from the storm's translational speed.
GeoClaw does not incorporate any tidal dynamics or meteorological forcings apart from the TC wind and pressure fields mentioned above. To account for the influence of astronomical tides, we configure GeoClaw to use an initial sea level according to gridded satellite altimetry for 2019 (CMEMS, 2021), optionally enhanced by the minimum, mean, or maximum simulated astronomical tides in the region of landfall according to the FES2014 global ocean tide atlas (Lyard et al., 2021). For the counterfactual sea level scenarios, the amount of sea level rise specified in the scenario description (between 6.5 and 17.0 cm) is subtracted from the initial sea level.
The topographical input for GeoClaw is taken from digital elevation models (DEMs). We use a combination of CoastalDEM 2.1 (Kulp and Strauss, 2018, 2021) in coastal areas, SRTM 15+ V2.3 (Tozer et al., 2019) over the open ocean, and a Multi-Error-Removed Improved-Terrain (MERIT) DEM (Yamazaki et al., 2019) everywhere else. All datasets are converted to the same geoidal vertical datum (EGM96) at a spatial resolution of 9 arcsec (approximately 300 m). This resolution is the highest resolution where we were able to obtain numerically stable results from GeoClaw. We note that no harmonization has been applied to make up for disagreements between the different DEM products so that the transition from CoastalDEM topography to SRTM 15+ bathymetry can be steep.
Due to a lack of tide gauges or suitable observed flood extent in Mozambique, it is not possible to validate the performance of GeoClaw for TC Idai in the factual model runs. However, we compare the water levels at a virtual tide gauge station off the coast of Beira, where the highest impacts from TC Idai have been reported, with simulated water levels from the Global Tide and Surge Model (GTSM) (Dullaart et al., 2021; Muis et al., 2020), and find the best agreement of maximum surge heights for the GeoClaw run with the maximum astronomical tide assumption, closely followed by the run assuming the monthly mean sea level (no tidal adjustment) (Fig. S1 in the Supplement).
2.3 Inland flood depth estimation
Gridded depth maximums for the flood event (Fig. S2) is calculated using the Rolling HAND Inundation Corrected Depth Estimator (RICorDE) tool (Bryant et al., 2022) supplied with terrain data from the MERIT DEM project, permanent surface water data from the Joint Research Centre (JRC) Global Surface Water project (Pekel et al., 2016), and flood extents from the FloodScan product (Atmospheric and Environmental Research & African Risk Capacity, 2022). MERIT DEM provides a roughly 90 m resolution global layer derived from multiple space-based sensors to minimize elevation errors. The maximum water extent layer from JRC's Global Surface Water project provides a roughly 30 m resolution global layer of locations detected as being inundated in Landsat imagery (Wulder et al., 2016) from 1984–2019 (Pekel et al., 2016). Observed flood extents for TC Idai are obtained from the Atmospheric and Environmental Research and African Risk Capacity's accumulated two-tier standard flood extent depiction FloodScan product from 1 to 31 March 2019 using the MERIT DEM resolution. Originally developed for applications in Africa, this FloodScan algorithm relies on satellite-based low-resolution passive microwave data and was designed to capture national-scale events. To accomplish this, the algorithm minimizes false positives, making the algorithm more prone to false negatives and less sensitive to events with smaller spatial extent and urban floods (Galantowicz and Picton, 2021). All data layers are re-projected to 90 m resolution geodetic coordinates prior to the RICorDE computation.
RICorDE is a tool developed in pyQGIS for post-event analysis of fluvial flood events using inundation masks derived from space-based observations. RICorDE first generates a height above nearest drainage (HAND) grid followed by an inundation correction phase and a water surface level (WSL) calculation phase. As part of preprocessing, the HAND grid is obtained using WhiteboxTools' ElevationAboveStream (Lindsay, 2014) from the permanent surface water layer and the DEM. In the first phase of RICorDE, the observed flood extents are hydraulically corrected to account for under-predictions using the permanent surface water layer and over-predictions using a HAND-derived inundation representing the upper quartile of possible flooding extents. In the second phase, HAND values sampled from the inundation shoreline are used to produce an interpolated WSL grid using WhiteboxTools' CostAllocation algorithm (Lindsay, 2014). Finally, gridded water depths are obtained from this WSL grid through subtraction with the DEM. RICorDE is explained in detail in the tool publication (Bryant et al., 2022), and the source code can be accessed online (https://github.com/NRCan/RICorDE/tree/main, last access: 31 March 2022).
The slower, more complex RICorDE algorithm has been shown to produce more accurate depth maps for two fluvial flood events in Canada when compared to faster, more disaster-response-focused solutions like the Floodwater Depth Estimation Tool (FwDET) (Bryant et al., 2022; Cohen et al., 2018). While no data are available to validate the performance of the depth estimate for TC Idai, visual inspection suggests results are less accurate in areas with higher elevation (>20 m), especially where drainageways are of comparable width to the resolution of the JRC water extent layer. These false negatives in the JRC layer propagate as positive bias in the HAND routine, which leads to higher water surface elevation predictions and similar positive bias in the depth values (see white arrow in Fig. S3a).
2.4 Combined flood depth product
The inland flood depth estimates from RICorDE are resampled from 3 to 9 arcsec, using the average resampling method (Rasterio library for Python), to match the resolution of the GeoClaw output. All flood depths are rounded to the nearest decimeter, their outline is cropped to the area of interest, and the final factual flood depth in each grid cell (shown in Fig. 3a) is determined as the maximum of both products. This accounts for both potentially partly obscured satellite imagery by clouds and potential underestimation by the numerical model.
with d0 referring to the factual flood depth, and indices “c” and “r” referring to the coastal flood model (GeoClaw) and to the remote sensing data translated into flood depth using RICorDE, respectively. To derive the counterfactual flood depth dcf, we subtract the difference between modeled factual and counterfactual coastal flood depths from the combined factual flood depth:
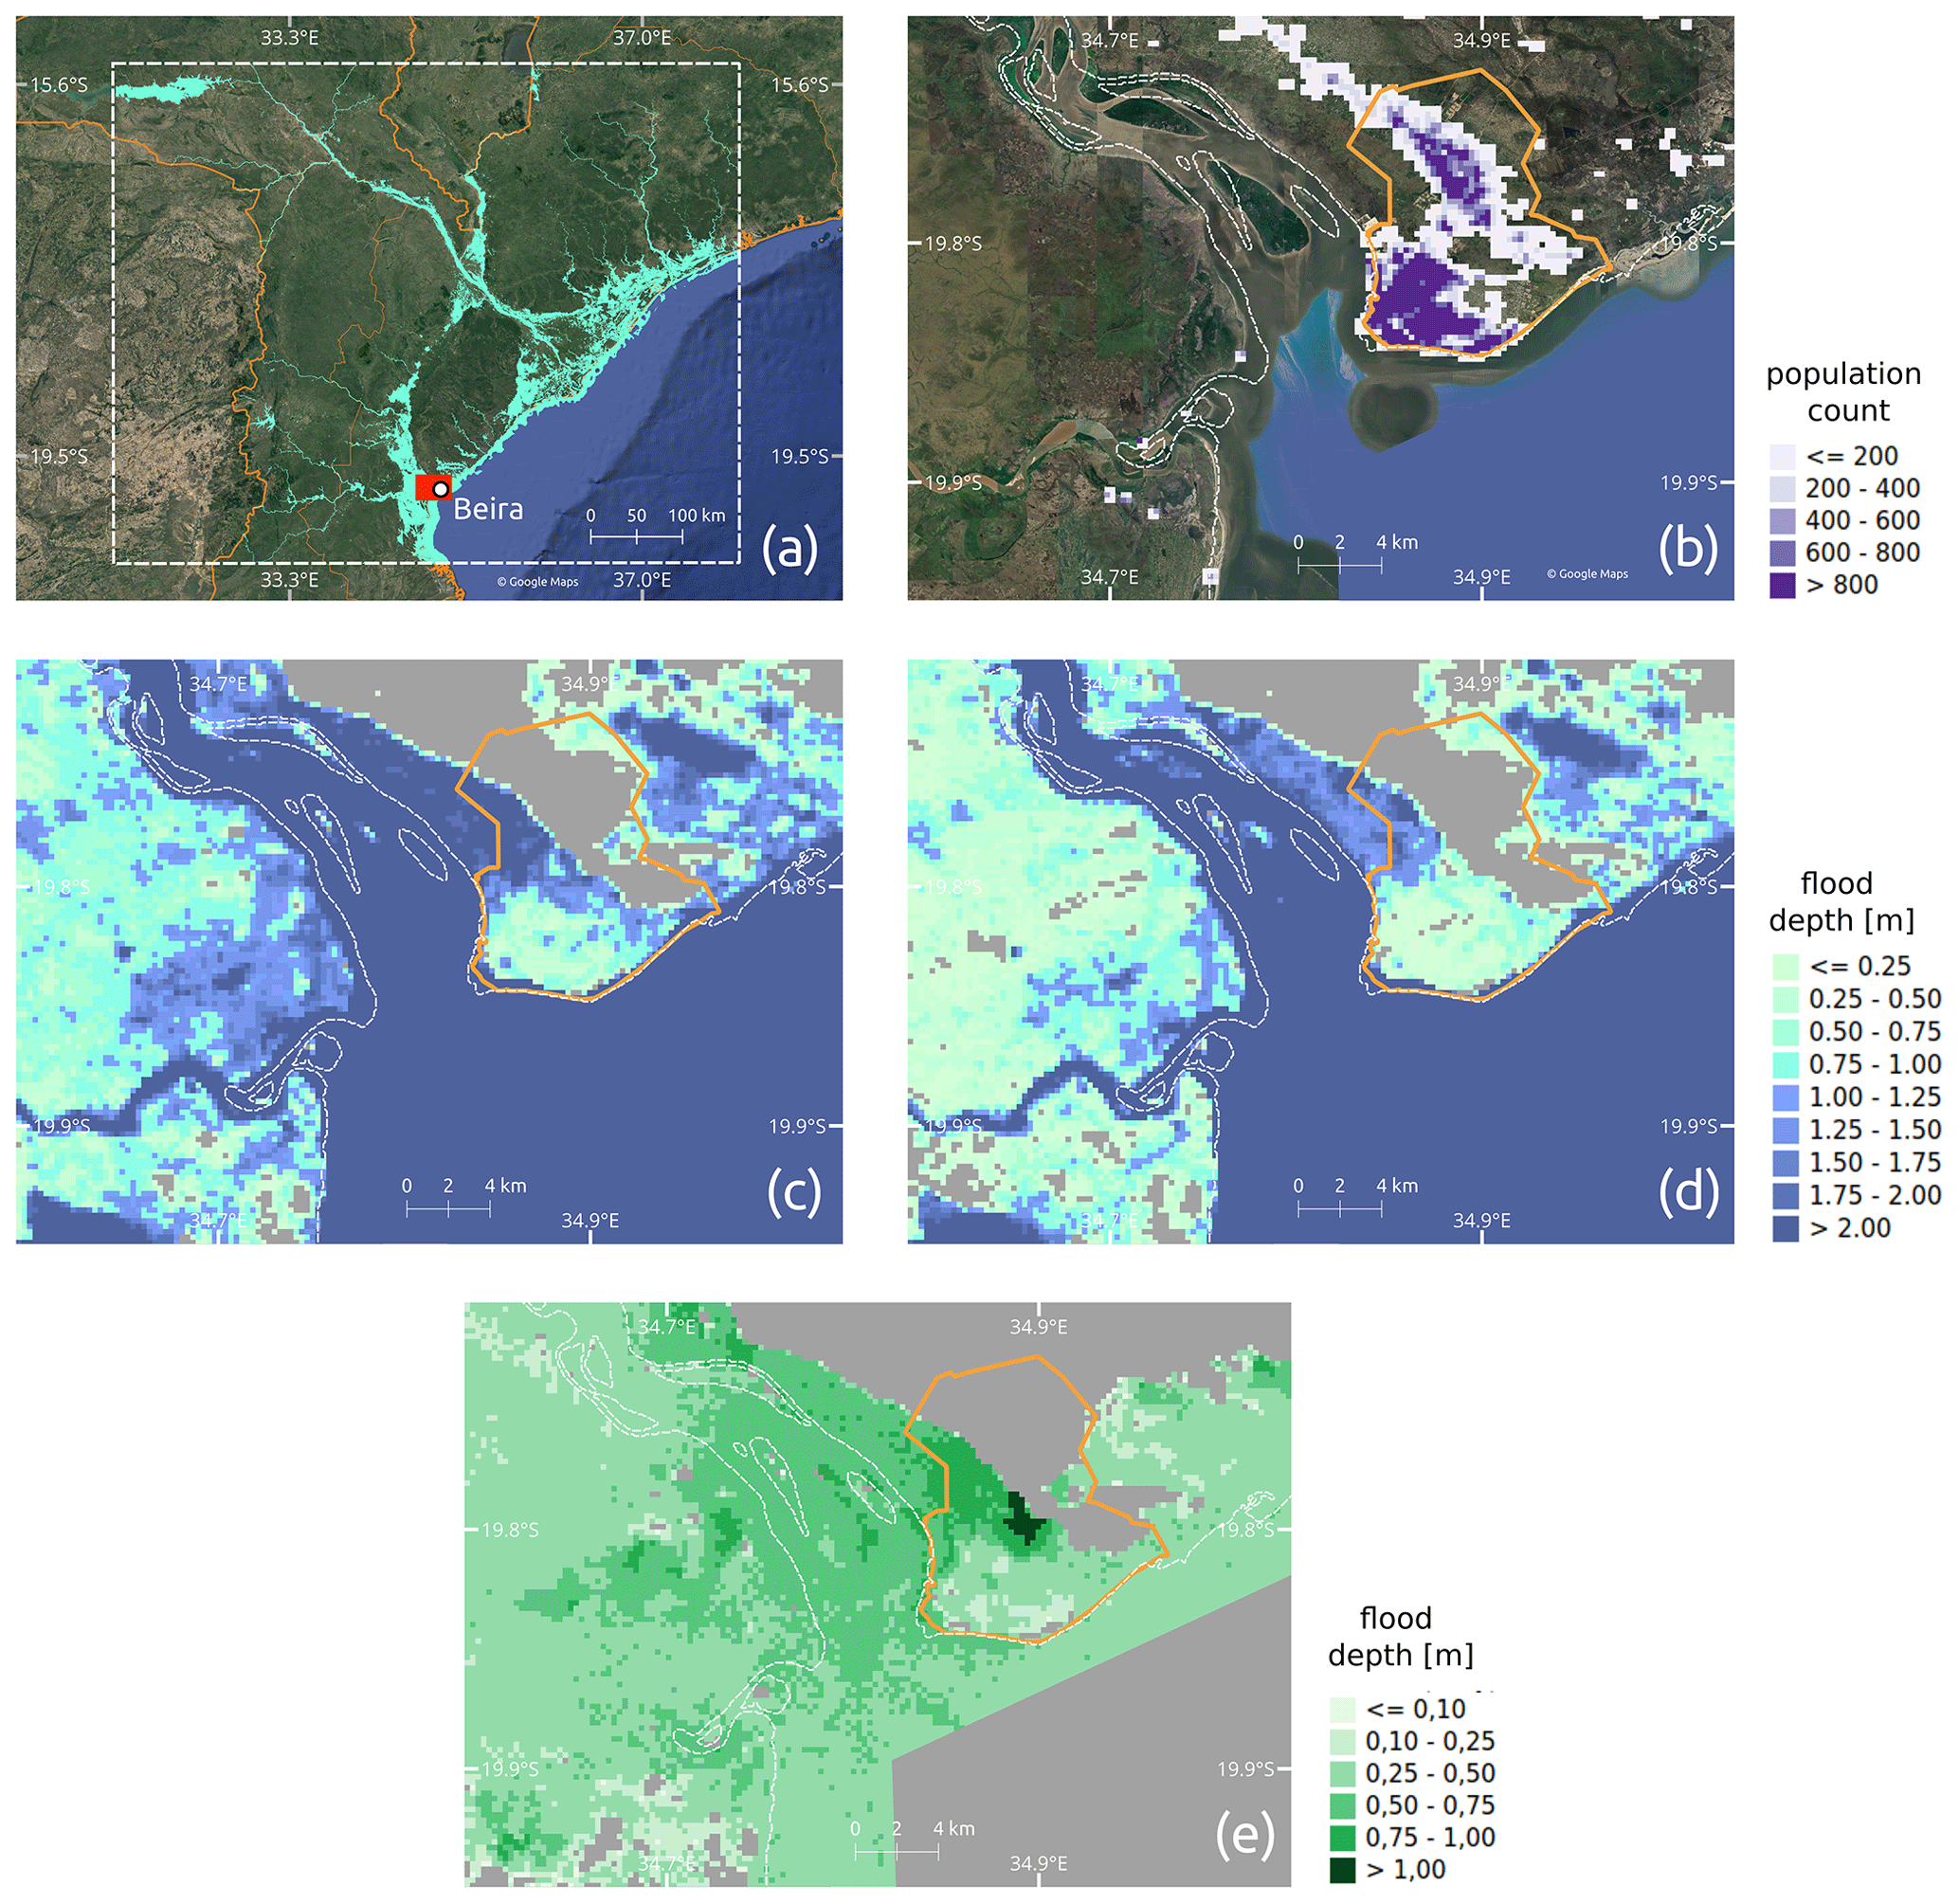
Figure 3Simulated flood extent for Mozambique; population distribution and inundation levels for the greater area of Beira. (a) Combined factual estimate of inland and coastal flooding (binary; flood/no-flood). White dashed box shows the area of interest in which flood exposure is computed. The red rectangle shows the extent of the section displayed in panels (b)–(e). (b) Population distribution for the greater area of Beira. Flood extent and levels for (c) the factual scenario (max tide) and (d) the “counterfactual TC intensity + sea level rise (10.5 cm) − max tide” scenario. Flood depth difference between (c) and (d) is displayed in (e). City neighborhoods of Beira (HDX, 2019) are indicated by orange lines, and the shoreline (Wessel and Smith, 1996) is represented by dashed white lines in (b)–(e); satellite image background by © Google Maps (Google Maps, 2022b) in (a) and (b).
2.5 Displacement
We use displacement data from the publicly accessible GIDD, maintained by the Internal Displacement Monitoring Centre (IDMC, 2022). IDMC follows the definition of displacement provided in the Guiding Principles on Internal Displacement (OCHA, 2004), which states that “[i]nternally displaced persons are persons or groups of persons who have been forced or obliged to flee or to leave their homes or places of habitual residence, … and who have not crossed an internationally recognized State border”. This definition covers permanent displacement, temporary displacement, and preemptive evacuations (Gemenne, 2011). No granular information is available in GIDD on the type of displacement. Displacement numbers are based on multiple secondary sources, such as the International Organization for Migration (IOM), Office for the Coordination of Humanitarian Affairs (OCHA), or – in the case of TC Idai – the Mozambique National Institute of Disaster Management. The TC Idai event is categorized as a “storm” event; however, no information is given on how many of the displacements were caused by flooding, strong winds, or a combination of both. Because of the extensive flooding observed in the wake of Idai's landfall and humanitarian reports often focusing on flooding (ReliefWeb, 2019a), we assume in our main analysis that all displacements are caused by flooding (either coastal or inland). We assume that people exposed to flood levels greater than or equal to 100 cm are affected by the flooding and thus prone to displacement, following previous studies (Custer and Nishijima, 2015; Kam et al., 2021). However, we also test the sensitivity of our results to this threshold choice by evaluating alternative water level thresholds of 10 and 50 cm. Our modeling approach assumes an artificially deterministic link between the TC hazard and displacement, which is adequate in the context of the factual–counterfactual approach where only one parameter – storm surge hazard – is modified, while everything else, including vulnerability, is held constant. In general, the relationship between climatic events, pre-existing socioeconomic conditions, and displacement is complex and only partially understood (Cattaneo et al., 2019; Foresight, 2023). In other words, our study addresses the question of how many displacements might have occurred in a different climate but with the same vulnerability as observed; it does not address the question of how this vulnerability came about.
We first determine the flood extent with depths greater than the selected water level threshold and overlay it with population data to estimate the number of people affected. We use gridded population data from GHS-POP (Schiavina et al., 2019) for the year 2015 at 9 arcsec resolution. Population growth in Mozambique was 1.12 % between 2015 and 2019 (The World Bank, 2022); we hence multiply all population grid cells by this factor, assuming a spatially equal population growth.
We then calculate the ratio between the number of observed displacements and the number of affected people from the factual flood estimate. This ratio, which may be thought of as an event-specific displacement vulnerability factor, is different for every tide assumption, reflecting the uncertainty about the actual flood extent and depth. We compute for every impact level threshold i and tide assumption h a displacement vulnerability factor vi,h by dividing the number of observed displacements D0 by the total number of affected people of the factual scenario :
Multiplying the specific displacement vulnerabilities by the counterfactual numbers of affected people, we derive the number of people at risk of displacement in a world without climate change. This means that the difference between factual and counterfactual displacement estimates comes only from differences in the flood hazard, while exposure and vulnerability factors are held fixed. We achieve this by multiplying vi,t by the number of affected people of the counterfactuals and estimating the expected number of displacements for each counterfactual scenario :
We point out that the use of predefined flood thresholds implies the assumption that at a given flood depth, the risk of severe damage to, or even destruction of, residential buildings and other infrastructure typically becomes so large that people may be forced to flee. The number of people that actually become displaced then depends on additional physical, political, and socioeconomic factors, which may vary between local contexts and are not generally known. Their aggregate effect is reflected in the specific vulnerability factor vi,h. In other words, the link between flood hazard and displacement is “soft” in the sense that it is mediated by the local vulnerability. An alternative assumption would be that there is an (event-specific) flood depth threshold below which there is no displacement and above which people become displaced regardless; that is, a “hard” link between flood hazard and displacement. In this case, the flood depth threshold could be derived directly from the data as the depth level at which the calculated number of affected people equals the reported number of displacements. When we sum up the affected people per 10 cm flood depth increment for TC Idai, we obtain a threshold of about 400 cm (similar for all tide assumptions; Table S1 in the Supplement), for which the modeled number of affected people approximately equals the number of observed displacements. This value is very high in comparison to the thresholds cited further above, and we believe it is implausible for displacement to occur only in locations inundated by 4 m or more. This exercise therefore lends further justification for the “soft link” approach.
Even though disaster reports for TC Idai suggest flooding to be the main driver of displacement, high wind speeds may have locally intensified the impact of TC Idai (Fig. S4) and be partially responsible for the observed displacements. We conduct an additional analysis where we assume that people affected by either flooding or wind (or both) were at risk of displacement with an equal vulnerability factor. We use a wind speed threshold of 96 kn (50 m s−1) for population exposure (Geiger et al., 2018), corresponding to Saffir–Simpson-scale classification 3 (major hurricane). The resulting wind field is overlaid with gridded population data to compute the number of affected people, excluding those who are already affected by flooding.
3.1 Simulated flooding
We calculate storm surge flood extent and depth for the factual (driven with observed wind speeds and sea levels) and counterfactual (reduced wind speeds and sea level) scenarios.
The difference between factual and counterfactual flooding (maximum tide, 10.5 cm SLR, 10 % TC intensification) is illustrated in the densely populated area of Beira (Fig. 3b), the city where TC Idai made landfall and destroyed 90 % of all houses according to some disaster reports (ReliefWeb, 2019b). Beira consists of two major population centers, of which the southern one is close to the seaside and exhibits a higher population count.
Both factual and counterfactual flood extent covers the southern, highly populated part of Beira (Fig. 3c and d). The northern parts of the city are only marginally affected. Flood extents are also similar between factual and counterfactual simulations in the areas east of Beira and around the inflow of the Buzi River, located on the opposite side of the bay. Only a few isolated locations no longer experience flooding after removing the effects of climate change.
In contrast, differences in simulated flood depth are more pronounced (Fig. 3e). Counterfactual flood depths are up to 80 cm lower than factual flood depth in some parts of the southern city center. The highest difference in flood depth, of up to 140 cm, is found between the northern and southern population centers of Beira. Flood depth differences outside of Beira are rather low; however, Fig. 3c and d show that absolute flood depths drop below the critical flood depth of 100 cm over great parts around the west bank of the Pungwe River inflow. Overall, it is observable that depth differences (between factual and counterfactual simulations) are higher in less populated parts, especially in Beira. This could partly result from the fact that digital elevation models tend to overestimate elevation in dense urban settings (Shen et al., 2019), thereby underestimating flood depth and potentially also differences in flood depth between different scenarios; however, this is hard to ascertain given the available data. Nonetheless, local variations in simulated flood depth should be interpreted with care.
3.2 Displacement
In the next step, we investigate how the factual and counterfactual flood estimates translate into population at risk of displacement for the whole of Mozambique. We compare factual and counterfactual affected people and/or displacements and compute the absolute relative change based on the counterfactual results, representing the increase in impact due to climate change. Our analysis shows that the intensification of TC wind speeds leads to an increase in flood-affected people and, consequently, in displacements by up to 2.7 %, while counterfactuals regarding the sea level lead to only small changes by up to 1.3 % (Fig. 4, Tables 1 and S2). A combination of both counterfactuals only slightly exceeds the range (increase by up to 3.2 % for the maximum tide assumption), in contrast to when considering the TC intensification alone. Despite the large uncertainty regarding SLR since 1900, the difference in the number of people affected (or displaced) is rather marginal, being less than a 1 % increase between the largest and the smallest SLR estimate for the “cf SLR” simulations. Our results highlight that the tide assumption plays a major role. The minimum and mean tide lead to marginal changes in affected and displaced people, in contrast to the maximum astronomical tide and monthly mean sea level from satellite altimetry (no tide), which show for the “cf SLR + wind” simulations a median change of 3.0 % (maximum change of 3.2 %) and 2.7 % (3.2 %), respectively. Given the high number of affected people, already small changes in the counterfactual scenarios lead to high changes in absolute numbers. The coupled effect of higher wind speeds and higher sea level increases the number of affected people and displacements by up to 39 300 and 14 900 (maximum tide) and 38 100 and 14 600 (monthly mean), respectively. Results regarding impact flood levels of 10 and 50 cm are displayed in Table 1 and the Supplement (Figs. S5 and S6), showing even higher changes for the counterfactual scenarios of up to 56 500 displacements (13.4 % increase).
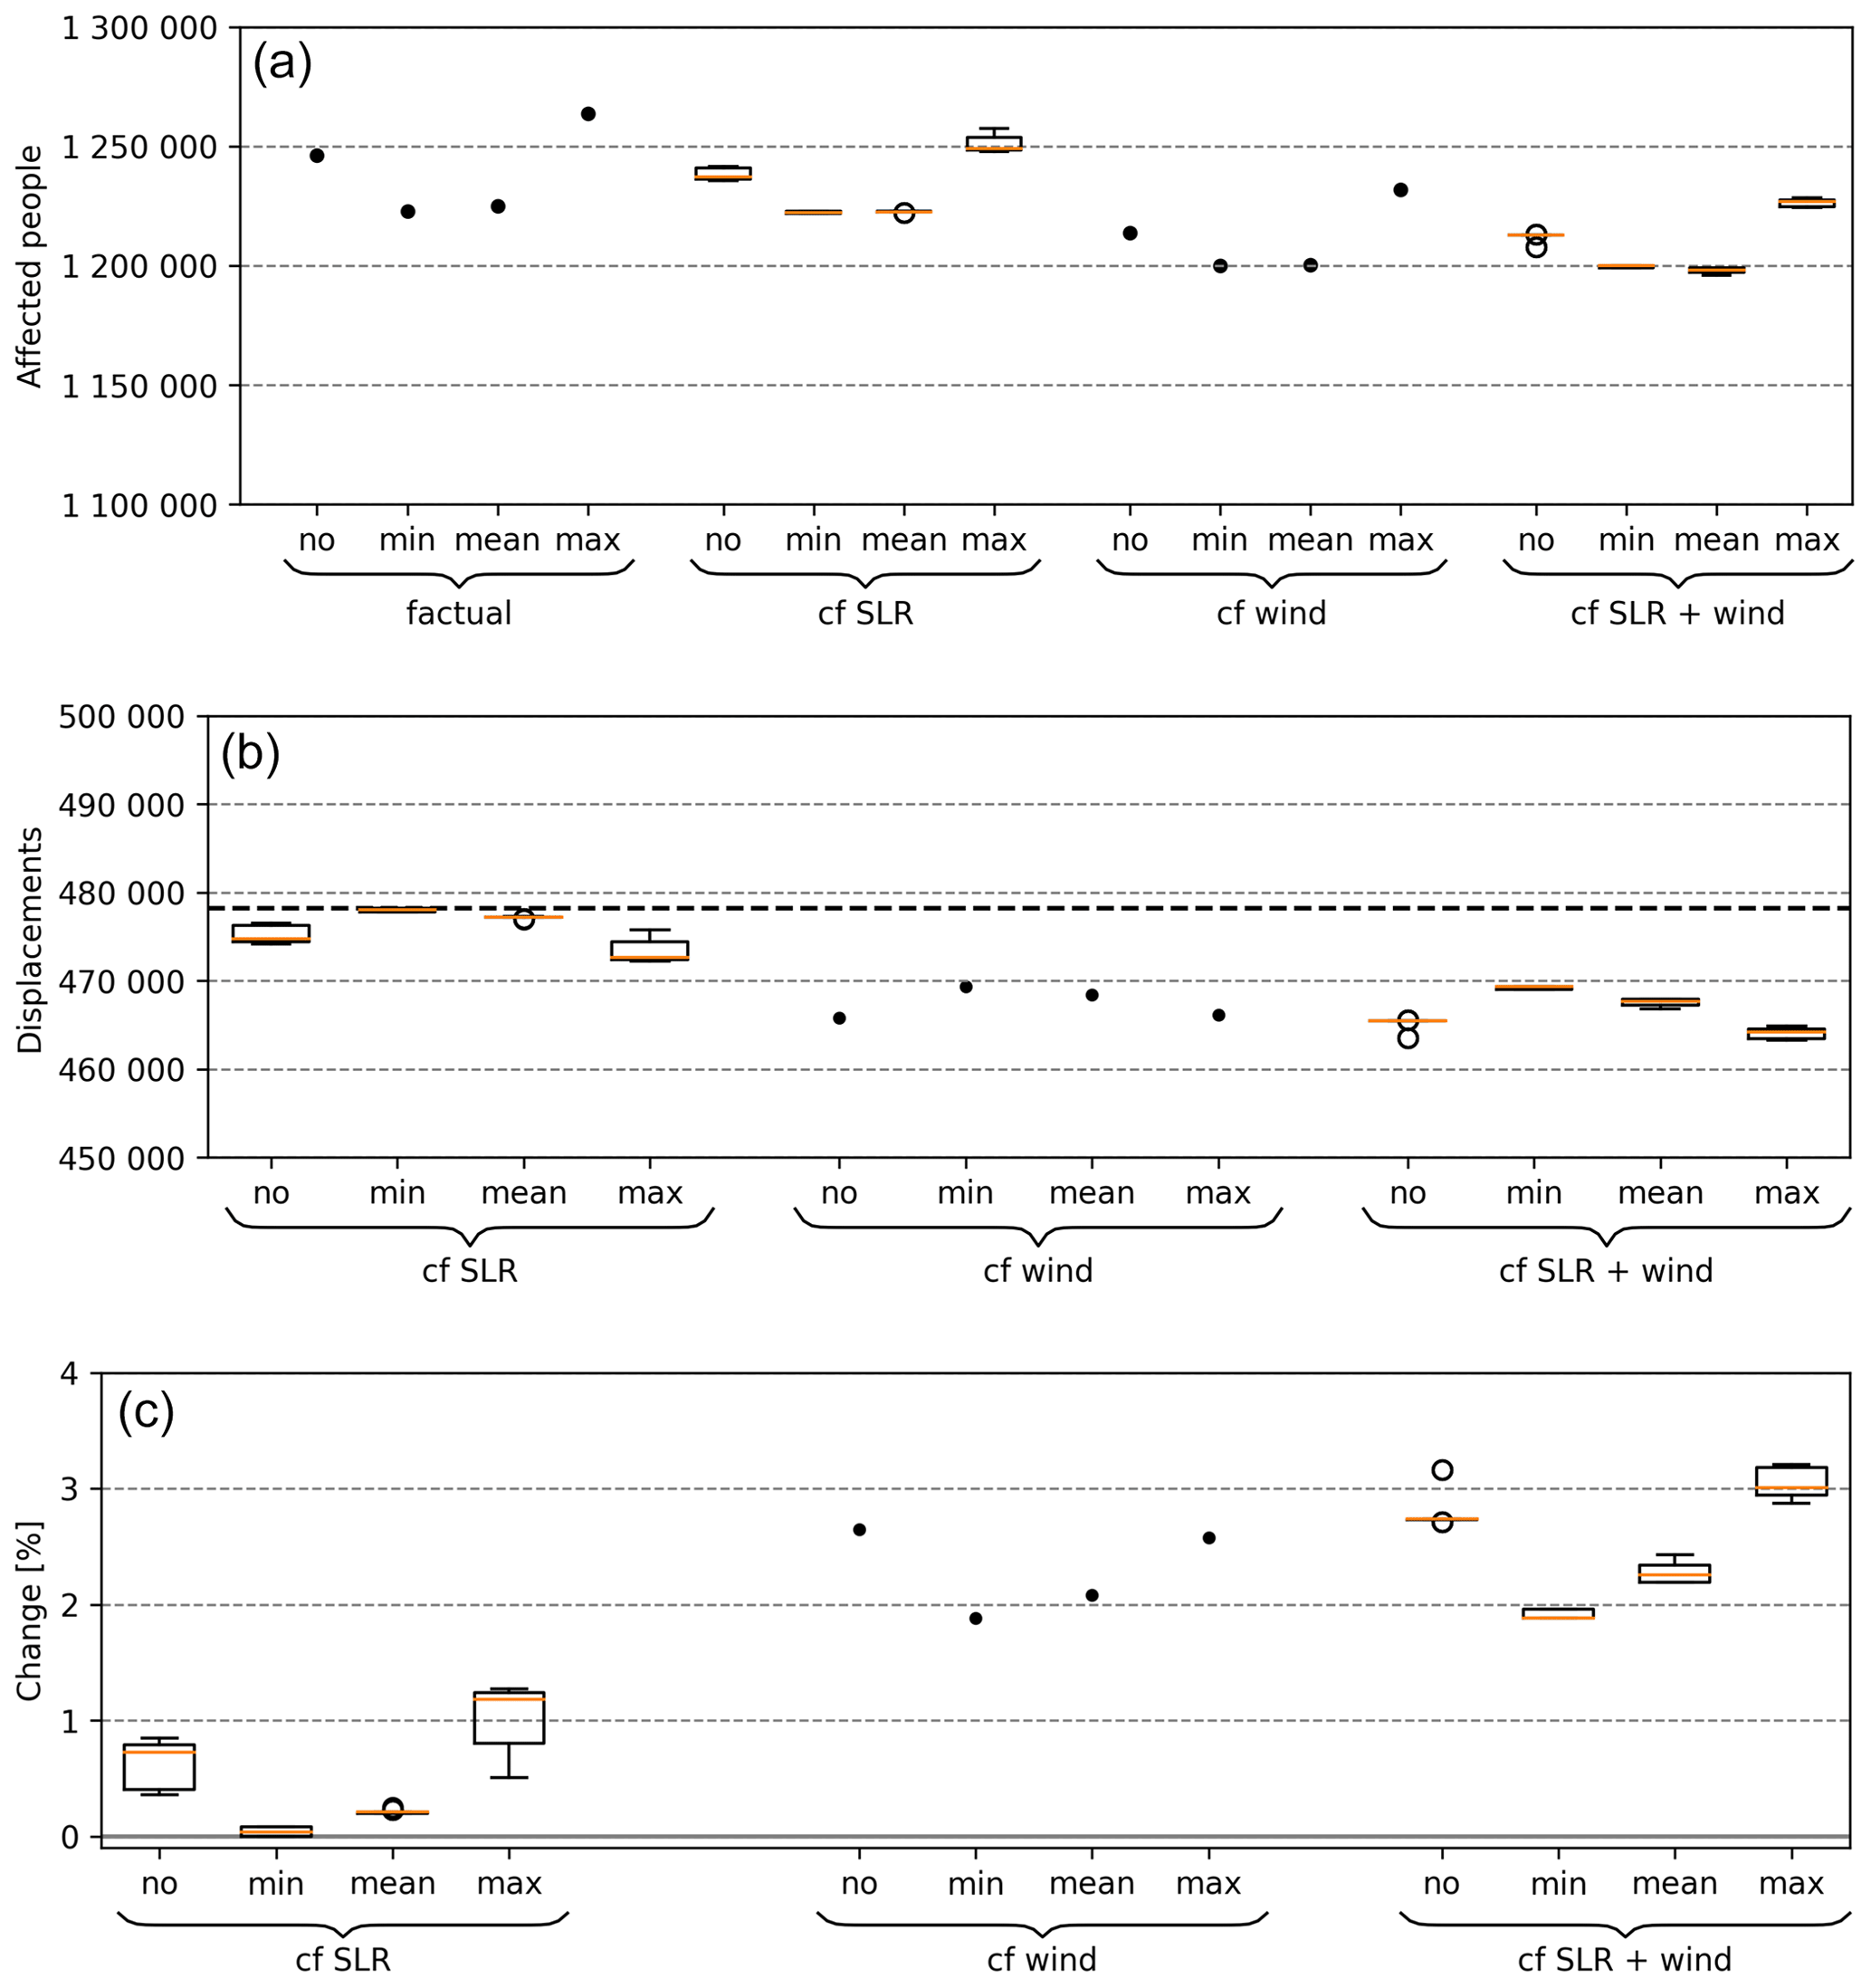
Figure 4Simulated affected people (a), displacements (b), and percentage change (c) for the 100 cm impact threshold. The percentage change compares factual and counterfactual displacements and represents the absolute relative change based on the counterfactual results. Three counterfactual scenarios are shown: lower sea level (“cf SLR”), intensification (“cf wind”), and a combination of both (“cf SLR + wind”). Additionally, a variety of counterfactual sea levels, as well as a set of astronomical tides, is presented, covering minimum (“min”), mean (“mean”), and maximum (“max”), as well as monthly mean, sea level from satellite altimetry (“no”). The bold dashed line in the middle panel shows the number of observed displacements. Percentile changes in affected people and displacements are the same. The second quartile Q2 (median) of the box plot is shown in orange, and “whiskers” are placed at ±1.5 times the interquartile range (Q3–Q1).
Table 1Overview main results for modeled displacement impact. Min, median, and max are related to the SLR scenarios. Bold font of the first results row indicates the primary parameter estimate. Cells with a “*” indicate the altered parameter in comparison to the primary estimate.
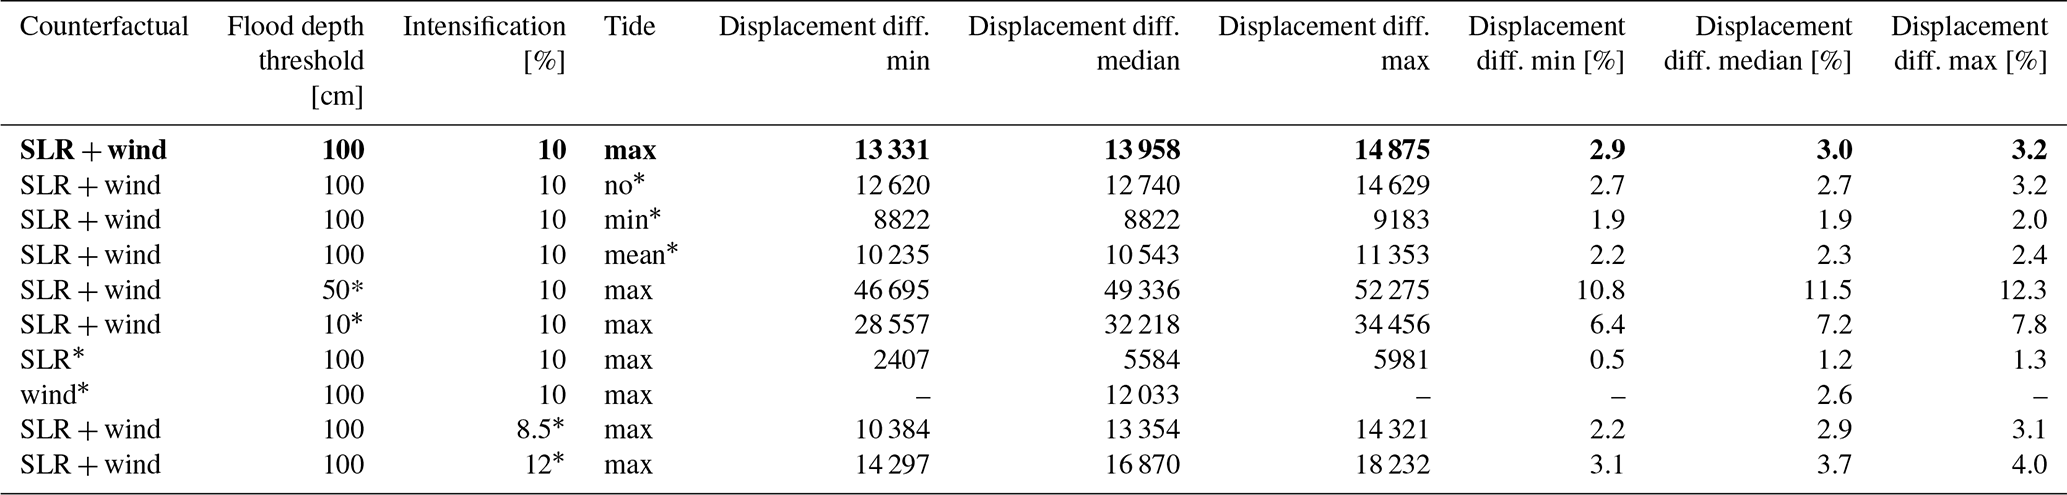
Besides our central TC intensification assumption of 10 %, we also examine two alternative assumptions of 8.5 % and 12 % intensification, respectively, for the “max” tide (Fig. 5). The spread among the intensification scenarios is rather small, with median relative changes varying between 2.9 % and 3.7 %. This translates to median estimates of 35 300 and 44 600 affected people or 13 400 and 16 900 displacements, respectively (Tables 1 and S2). In contrast, the difference between the highest (4.0 %) and lowest values (2.2 %) is larger. In absolute terms, this means a range of between approximately 27 400 and 48 200 affected people or 10 400 and 18 200 displacements.
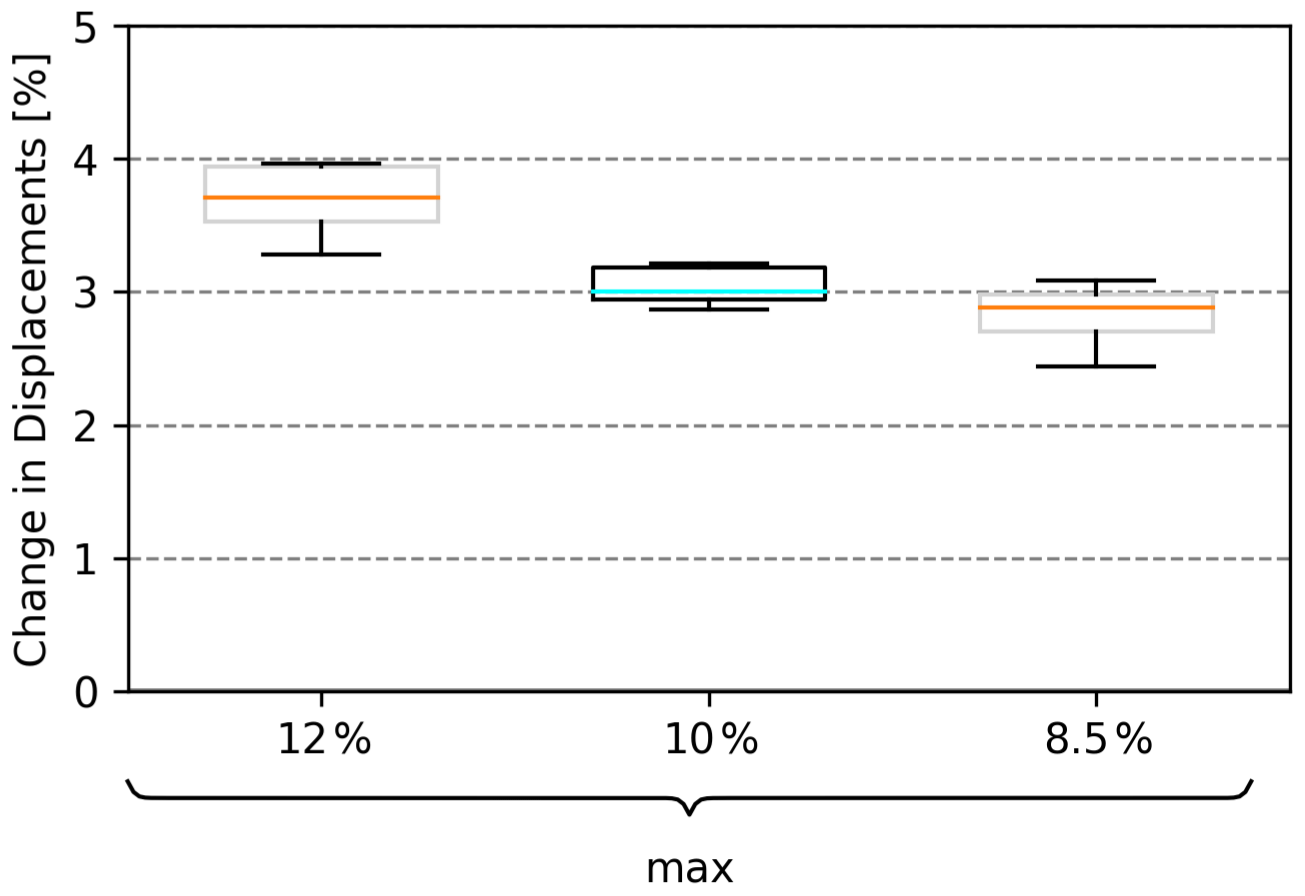
Figure 5Percentage change in displacements between factual and counterfactual, for three different TC intensification assumptions. The percentage change compares factual and counterfactual displacements and represents the absolute relative change based on the counterfactual results. The combined counterfactual scenario (“cf SLR + wind”) with 100 cm impact threshold and the maximum astronomical tide (“max”) are displayed. The central assumption of 10 % intensification is highlighted with a cyan-colored median in the box plots. The second quartile Q2 (median) of the box plot is shown in orange/cyan, and whiskers are placed at ±1.5 times the interquartile range (Q3–Q1).
We assume that high wind speed caused only a marginal fraction of displacements, following disaster reports, media coverage, and experience from other events; as an extreme example, wind from Hurricane Sandy caused less than 0.01 % of the overall damage (Strauss et al., 2021). Nonetheless, in an additional sensitivity analysis, we also account for the number of people affected by high TC wind speeds of 50 m s−1 or above (Sect. 2). Our analysis reveals that the number of people affected not by flooding (maximum tide assumption, 100 cm impact threshold) but by high wind speeds ranges between 40 900 and 360 600 in the factual simulation. In the counterfactual, even the maximum wind speed attained in any grid cell outside the flooded area drops from 51.5 to 46.3 m s−1, i.e., below the above-mentioned threshold; thus, no people are counted as affected. Assuming the same vulnerability factor for displacement due to high wind speed as due to flooding yields 103 700 to 112 100 displacements, or 21.7 % to 23.4 % of the total displacement, attributable to climate change.
With more than 1 ∘C of global warming, most, if not all, extreme weather events now can be assumed to bear some imprint of climate change. By extension, this is also true for the humanitarian crises induced by catastrophic storms, floods, or droughts. However, while economic damages from climate change have been attributed in both case studies and global studies (Frame et al., 2020a, b; Sauer et al., 2021; Strauss et al., 2021), little is known about the extent to which climate change has already exacerbated human displacement. Our modeling study of TC Idai suggests that climate change may have induced between 12 600 (2.7 %; lowest estimate under the no tide assumption) and 14 900 (3.2 %; highest estimate under the maximum tide assumption) additional displacements from this one event. This is primarily due to the intensification of TC wind speed inducing a more powerful storm surge and to a lesser extent due to sea level rise providing a higher baseline for the storm surge. We also show that the sensitivity of the results to the choice of TC intensification is approximately in the same range as for the tide assumption. We note that our attribution statements are, as is common in the climate (impacts) attribution literature, purely statistical; that is, we do not make any claims about whether or to what extent any individual person may have been displaced because of climate change. Our methodology and results are subject to a variety of limitations and uncertainties, primarily related to the models (coastal, fluvial, DEM) and underlying datasets (population, displacement). Additional sources of uncertainty are the counterfactual input quantities (SLR, wind speed intensification), impact flood levels, and tide assumption, for which we perform sensitivity analyses.
Our results likely underestimate the full contribution of climate change to displacement associated with TC Idai because we solely addressed the effect of climate change on coastal flooding, neglecting changes in inland flooding. Between 3 and 17 March, heavy precipitation between 200–400 mm was registered for Beira City and the region, with upstream sections of the Pungwe River basin exposed to more than 600 mm (Probst and Annunziato, 2019). With growing evidence that climate change affects not only precipitation intensity (Fowler et al., 2021; Guerreiro et al., 2018; Scherrer et al., 2016) but also continental-scale changes in fluvial flood discharge (Blöschl et al., 2019; Gudmundsson et al., 2021), it is likely that in a world without climate change, the river flood magnitude would have been smaller, and even fewer people would have been exposed than in our coastal-only counterfactual. Quantifying this additional effect would require a river flood model capable of reproducing the observed flood extent and associated inundation depths and be ideally coupled with a coastal flood model to capture the interaction between river flood and storm surge. Even though globally applicable frameworks for compound flood hazard modeling are under construction and have recently been tested for TC Idai (Eilander et al., 2023), evaluations of fluvial flood models reveal important shortcomings in data-scarce regions such as Mozambique (Bernhofen et al., 2018; Mester et al., 2021). Quantifying the role of river flooding in TC-induced displacement is thus a timely challenge.
The inland river flood estimates based on satellite imagery exhibit several limitations and uncertainties. In the absence of validation data, it is difficult to quantify the uncertainty arising from the inland flood depth estimation. These gridded values are highly sensitive to the input layers, namely the DEM (MERIT), permanent surface water (JRC), and the satellite-based observation of inundation extents (FloodScan) (Atmospheric and Environmental Research & African Risk Capacity, 2022). Especially uncertainties regarding the choice of DEM, used for both the inland flood depth estimation and the coastal flood model, should not be neglected (Hawker et al., 2018). Qualitatively, the performance seems poor in areas with higher elevations (>20 m). This could be attributable to challenges in representing the topography at 90 m resolution and dense obstructions that scatter returning signals (Shen et al., 2019).
Similarly, no suitable validation data for the coastal flood simulations are available. According to the FloodScan description (Atmospheric and Environmental Research & African Risk Capacity, 2022), the products used “depict large scale, inland river flooding well but are less likely to depict flooding in smaller floodplains and near coastlines”. We have hence opted to not choose the FloodScan product as the sole coastal flood hazard estimate or as validation dataset for the flood extent from our coastal flood model. A flood risk screening for Beira (van Berchum et al., 2020) showed that simulated flood extent for a 10-year rainfall event plus a 10-year coastal surge event covers most parts of the central and Munhava city districts of Beira (southeastern city districts). In contrast, the FloodScan product shows only little flooding in this area, while it is assumed that flooding by TC Idai exceeded an average recurrence interval of 10 years. For example, Emerton et al. (2020) show that GloFAS flood forecasts indicated a 100 % probability of exceeding the severe flood alert threshold (20-year return period) for TC Idai at the Pungwe River (Emerton et al., 2020). Furthermore, newspaper photographs (Bergensia, 2019) show flooding in the Area de Baixa part of Beira (western district of Beira), which was only partially flooded according to the satellite imagery. The AER product thus likely underestimates flood extent, which may be explained by cloud obscurement or failure in automatic flood detection due to, for example, flooding in densely populated areas or the satellite passing over some time after the peak flooding when water levels had already receded.
Furthermore, the coastal flood modeling framework does not incorporate any astronomical tidal dynamics. Because there are no tide gauge records available in the region, we were only able to compare the model's surge heights to the state-of-the-art Global Tide and Surge Model (GTSM). For the derived flood maps, there were no observational benchmarks available for validation. Moreover, the model is not able to take the interaction of the coastal surge with increased river discharge at the estuaries into account. In some cases, this interaction has been shown to influence water levels in a nonlinear way, for example for the 2016 Louisiana flood (Bilskie and Hagen, 2018). Another source of uncertainty is again the DEM, in particular the transition from topographic to bathymetric data on the coastlines.
Additionally, our analysis may be sensitive to the choice of population dataset (Archila Bustos et al., 2020; Leyk et al., 2019), which may lead to uncertainties regarding our estimated exposure. One of the main error sources for population datasets is related to the areal interpolation methods to disaggregate the population data (Archila Bustos et al., 2020). GHS-POP distributes population only within built-up areas, which has the downside that non-residential areas are simulated as being populated as well (Freire et al., 2016). In fact, a comparison with satellite imagery reveals that some areas in Beira are populated which are most likely only commercial or industrial sites. On the other hand, not all settlements are captured by GHS-POP, most likely due to their building type. Nonetheless, GHS-POP is still one of most accurate datasets in estimating and modeling the known population (Archila Bustos et al., 2020), especially in urban contexts (Leyk et al., 2019) as in the case for Beira.
No information is available regarding the spatial distribution of displacements within GIDD; we assume that vulnerability to displacement is uniform across the affected area. The total number of displacements is furthermore not specifically categorized by hazard type, which reflects the multivariate (wind, rain, and flood) compound characteristics of TC hazards (Zscheischler et al., 2020). However, this impedes the attribution of coastal-flood-induced displacements. Furthermore, the GIDD estimates include different forms of displacement, such as forced displacement or preemptive evacuations, with the latter potentially accounting for a substantial proportion (McAdam, 2022). This poses far-reaching implications for displacement risk modeling, as evacuations may already be triggered by lower flood depths or by early warnings of an impending hazard, which may not materialize in the expected manner or may not cause the level of destruction that would lead to a corresponding magnitude of forced displacement.
Our main analysis also assumed no direct effect of high wind speeds on displacement, lacking clear evidence for substantial displacement due to high winds alone. Our additional sensitivity analysis suggests that changing this assumption could increase the number of displacements attributable to climate change considerably. Given this potentially large effect and our limited understanding of the relative roles of different drivers of displacement in general, the specific vulnerability to displacement from different types of hazard should be the subject of future studies. Moreover, assuming that displacement can occur already at inundation depths of less than 100 cm also leads to higher estimates of climate-change-attributable displacement, according to our sensitivity analysis. We also tested if the flood depth threshold can be estimated from the data by summing up the affected people per 10 cm flood depth increment until equaling the number of observed displacements. This analysis yields an alternative flood depth threshold of 400 cm, which we assess to be physically not reasonable in the context of building structures in Mozambique. Again, a better understanding of vulnerability beyond hard physical flood depth thresholds and empirically derived vulnerability factors will be critical to refine risk assessments. Future work may produce a functional relationship between displacement risk, contextual drivers, and physical flood properties, covering, for example, depth, velocity, and duration.
We did not change storm track or size in our counterfactual simulations. While storm tracks may be affected by climate change (Knutson et al., 2019), we assume that Beira has not become more or less likely as a landfall site. Mean storm size is found to increase systematically with the relative sea surface temperature (Chavas et al., 2016), although numerical simulations suggest that projected median sizes remain nearly constant globally (Knutson et al., 2015). Assuming increases in storm size due to climate change would again result in higher estimates of attributable displacements in our analysis. By design, in our attribution study, we assumed a fixed population distribution in both factual and counterfactual simulations, as well as a fixed, empirically determined displacement vulnerability factor, and only investigated changes in displacement risk following from changes in the physical characteristics of TC Idai and its impacts. Assessments of future risks – or of past impacts – should take into account not only the intensification of physical hazards, but also changes in exposure (Kam et al., 2021), as well as potential changes in vulnerability due to social, economic, or technological developments. For instance, TC-related displacements depend not only on the damage to housing, but also on other factors such as government responsiveness or poverty levels (Cissé et al., 2022). Here, we have chosen a storyline approach for the impact attribution instead of a more traditional probabilistic attribution approach (Philip et al., 2020; Titley et al., 2016), as for instance previously employed to attribute the heavy precipitation of Hurricane Harvey (van Oldenborgh et al., 2017) to climate change. One reason is that for Mozambique neither the complete time series of rainfall nor the high station density required by a probabilistic approach (van Oldenborgh et al., 2021) is available. Reanalysis products for precipitation could be used as an alternative; however, their quality depends on geographic location, so the use of multiple reanalysis and/or observation products is recommended (Angélil et al., 2016). Nonetheless, a climate attribution approach focusing on changes in the probability or intensity of TCs in the southern Indian Ocean due to anthropogenic forcing (O'Neill et al., 2022) could guide the construction of counterfactual scenarios of the storyline approach. Further, in contrast to the probabilistic approach, the storyline approach allows us to investigate the driving factors involved, as well as their plausibility (Shepherd et al., 2018).
Framing the risk of tropical cyclones in the context of climate change in an event-specific rather than a probabilistic manner also allows us to assign absolute numbers of attributable displacements, which raises risk awareness in a more tangible way. Even though these numbers include substantial and important uncertainties related to the models, datasets, and counterfactual assumptions, as discussed above, they provide an informative quantitative indication of the additional risk posed by climate change to communities affected by one of the worst natural disasters in recent history. The responsibility for managing and reducing displacement risk lies primarily at the national and provincial level, but often local authorities, organizations, and communities respond to displacement disasters (Hollinger and Sienkevych, 2019). Demonstrating quantitatively how climate change affects the societal risks associated with natural hazards may play an important role in raising awareness, with different types of stakeholders, to the changing nature of such risks. It may also incentivize governments to step up their efforts in terms of both planning and investing in adaptation measures and rapidly mitigating greenhouse gas emissions. The storyline approach is particularly suited for highlighting the risk-amplifying effects of climate change in a tangible and accessible way, based on a well-known event in the recent past (van den Hurk et al., 2023). Estimates of the costs of displacement additionally highlight the adverse economic aspects of climate change (Desai et al., 2021); average costs have been put at USD 310 per displaced person per year, though actual costs are heavily dependent on the country and duration (days and weeks to years) (IDMC, 2019). Only 50.7 % of the required Mozambique Humanitarian Response Plan 2019 of USD 620.5 million was funded, demonstrating that climate change poses an additional burden on insufficiently equipped financial aid resources. Anticipating the intensification of tropical cyclones under future global warming (Knutson et al., 2020) calls for enhancing adaptation measures, as well as disaster relief and humanitarian aid. The IPCC Sixth Assessment Report (AR6) projects an additional global increase in mean sea level and surface temperature of 0.44 m and 1.2 ∘C (SSP1–2.6) and 0.77 m and 4.0 ∘C (SSP5–8.5), relative to a baseline of 1995–2014, by the end of the 21st century (Fox-Kemper et al., 2021; Lee et al., 2021). Even though these increases may vary between basins, an enhanced displacement risk due to Idai-like TCs needs to be accounted for in the next decades, especially if future changes in exposure due to population growth and urbanization are considered. Under both SSPs 1 and 5, the population of Mozambique is projected to increase by approximately 8 million and its urbanization level from about 40 % to over 70 % just over the next 30 years (Riahi et al., 2017).
Our study expands the scope of extreme event impact attribution to include displacement as a societal impact dimension. In general, due to the lack of calibrated regional models and gauge stations, only a few attribution studies (Luu et al., 2021; Takayabu et al., 2015) focus on storms – or any extreme weather event, for that matter – in low-income countries. This not only limits our understanding of climate change effects on extreme events from a global perspective, but also biases geographically the amount of knowledge and information available to inform risk management and adaptation strategies (Otto et al., 2020). Our impact attribution is built on global-scale datasets and models, which could be employed in other relevant locations. Despite the discussed limitations and uncertainties inherent to this approach, displacements could be similarly attributed to climate change for other major TCs that occurred in data- and model-scarce regions, such as Typhoon Haiyan (Philippines; 4.1 million displacements) or Cyclone Amphan (India and Bangladesh; combined 4.95 million displacements) (IDMC, 2022). The continuing increase in spatial resolution of global-scale products will eventually allow for more granular displacement risk assessments, which regional authorities could incorporate in urban development plans, zoning regulations, or required building codes (IDMC, 2019). Mozambique, like many countries, is exposed not only to TCs but also to other climate-related hazards, such as droughts, and at the same time faces socioeconomic challenges, making it all the more important to understand and anticipate risks in a changing climate. Our approach may hence be extended to large-impact attribution, using, for example, global counterfactual climate datasets (Mengel et al., 2021).
The source code for this study is available from https://doi.org/10.5281/zenodo.10027136 (Mester et al., 2023a).
Satellite imagery is used with the permission of Atmospheric and Environmental Research and African Risk Capacity. Output of the flood depth algorithm, GeoClaw results, and TC Idai wind speed files can be accessed at https://doi.org/10.5281/zenodo.10038190 (Mester et al., 2023b). GHS gridded population data are available at https://doi.org/10.2905/42E8BE89-54FF-464E-BE7B-BF9E64DA5218 (Schiavina et al., 2019).
National borders of Mozambique were obtained from https://gadm.org/data.html (GADM, 2018). For the trendline analysis of annual means of maximum wind speeds we use the IBTrACS Version 4 database, accessible at Knapp et al. (2010).
All data used for the figures are publicly available. Maps were generated with QGIS, which can be downloaded at https://www.qgis.org/ (QGIS.org, 2023). Satellite imagery background by © Google Maps can be accessed via https://www.google.com/maps/place/Mozambique/\@-18.3359987,25.1264933,2875812m/data=!3m1!1e3!4m6!3m5!1s0x18d4aceae6fd4ac5:0x12bbbfb9ae16a115!8m2!3d-18.665695!4d35.529562!16zL20vMDR3bGg?entry=ttu (Google Maps, 2022a) and https://www.google.com/maps/place/Beira,+Mozambique/\@-19.7768616,34.7865512,22273m/data=!3m2!1e3!4b1!4m6!3m5!1s0x1f2a6a5f5da047c1:0xa1d3dd2e50b3b6e6!8m2!3d-19.8315949!4d34.8370183!16zL20vMDNtajFk?entry=ttu (Google Maps, 2022b). We used IBTrACS Version 4 to extract the trajectory data of Tropical Cyclone Idai, available at Knapp et al. (2010).
Mozambique admin level 4 shapefiles for Beira are available at https://data.humdata.org/dataset/mozambique-admin-level-4-beira-and-dondo-neighbourhood (INGC, 2019). GSHHG shoreline data can be accessed via Wessel and Smith (1996).
The supplement related to this article is available online at: https://doi.org/10.5194/nhess-23-3467-2023-supplement.
BM and JS designed the study, with contributions from TV, CO, and KF. TV designed and performed coastal flood model calculations. SB estimated flood depths from satellite imagery. BM computed the number of affected people and displacements. BM and JS analyzed the results, and CO and KF contributed to the interpretation. BM and JS jointly wrote the paper, with contributions from TV, SB, and CO.
The contact author has declared that none of the authors has any competing interests.
Publisher's note: Copernicus Publications remains neutral with regard to jurisdictional claims made in the text, published maps, institutional affiliations, or any other geographical representation in this paper. While Copernicus Publications makes every effort to include appropriate place names, the final responsibility lies with the authors.
This research received funding from the European Union's Horizon 2020 Research and Innovation program under grant agreement no. 820712 (RECEIPT). Thomas Vogt received funding from the German Federal Ministry of Education and Research (BMBF) under the research project QUIDIC (01LP1907A) and through the CHIPS project, part of AXIS, an ERA-NET initiated by JPI Climate and funded by FORMAS (SE), DLR/BMBF (DE, grant no. 01LS1904A), AEI (ES), and ANR (FR) with co-funding from the European Union (grant no. 776608).
This research has been supported by the European Union's Horizon 2020 Research and Innovation program (grant no. 820712 (RECEIPT)); by the German Federal Ministry of Education and Research (BMBF) (grant no. 01LP1907A (QUIDIC)); and through the CHIPS project, part of AXIS, an ERA-NET initiated by JPI Climate and funded by FORMAS (SE), DLR/BMBF (DE, grant no. 01LS1904A), AEI (ES), and ANR (FR) with co-funding from the European Union (grant no. 776608). The publication of this article was funded by the Open Access Fund of the Leibniz Association.
This paper was edited by Philip Ward and reviewed by Lena Reimann and Roland Smith.
Angélil, O., Perkins-Kirkpatrick, S., Alexander, L. V., Stone, D., Donat, M. G., Wehner, M., Shiogama, H., Ciavarella, A., and Christidis, N.: Comparing regional precipitation and temperature extremes in climate model and reanalysis products, Weather Clim. Extrem., 13, 35–43, https://doi.org/10.1016/j.wace.2016.07.001, 2016.
Archila Bustos, M. F., Hall, O., Niedomysl, T., and Ernstson, U.: A pixel level evaluation of five multitemporal global gridded population datasets: a case study in Sweden, 1990–2015, Popul. Environ., 42, 255–277, https://doi.org/10.1007/s11111-020-00360-8, 2020.
Atmospheric and Environmental Research & African Risk Capacity: Flood depictions: AER AFED v05r01, https://www.aer.com/weather-risk-management/floodscan-near-real-time-and-historical-flood-mapping/ (last access: 15 July 2022), March 2022.
Beal, L. M., Vialard, J., Roxy, M. K., Ravichandran, M, McPhaden, M. J., Feng, M., Lumpkin, R., Unnikrishnan, A. S., Lee, T., Sloyan, B., Andres, M., Subramanian, A. C., Yu, L., Lengaigne, M., Shinoda,T., Annamalai, H., Ummenhofer., C. C., Strutton, P., Masumoto, Y., Tozuka, T., Wiggert, J., Han, W., and Hood, R.: IndOOS-2: A roadmap to sustained observations of the Indian Ocean for 2020-203, CLIVAR-4/2019, GOOS-237, CLIVAR/IOC-GOOS Indian Ocean Region Panel (IORP), 206 pp., https://doi.org/10.36071/clivar.rp.4.2019, 2019.
Bergensia: Red Cross: 90 Percent of Beira in Mozambique Destroyed by Cyclone Idai, https://bergensia.com/red-cross-90-percent-of-beira-in-mozambique-destroyed-by (last access: 14 May 2023), 2019.
Bernhofen, M. V., Whyman, C., Trigg, M. A., Sleigh, P. A., Smith, A. M., Sampson, C. C., Yamazaki, D., Ward, P. J., Rudari, R., Pappenberger, F., Dottori, F., Salamon, P., and Winsemius, H. C.: A first collective validation of global fluvial flood models for major floods in Nigeria and Mozambique, Environ. Res. Lett., 13, 104007, https://doi.org/10.1088/1748-9326/aae014, 2018.
Bilskie, M. V. and Hagen, S. C.: Defining Flood Zone Transitions in Low-Gradient Coastal Regions, Geophys. Res. Lett., 45, 2761–2770, https://doi.org/10.1002/2018GL077524, 2018.
Bloemendaal, N., Haigh, I. D., de Moel, H., Muis, S., Haarsma, R. J., and Aerts, J. C. J. H.: Generation of a global synthetic tropical cyclone hazard dataset using STORM, Sci. Data, 7, 40, https://doi.org/10.1038/s41597-020-0381-2, 2020.
Bloemendaal, N., de Moel, H., Mol, J. M., Bosma, P. R. M., Polen, A. N., and Collins, J. M.: Adequately reflecting the severity of tropical cyclones using the new Tropical Cyclone Severity Scale, Environ. Res. Lett., 16, 014048, https://doi.org/10.1088/1748-9326/abd131, 2021.
Bloemendaal, N., de Moel, H., Martinez, A. B., Muis, S., Haigh, I. D., van der Wiel, K., Haarsma, R. J., Ward, P. J., Roberts, M. J., Dullaart, J. C. M., and Aerts, J. C. J. H.: A globally consistent local-scale assessment of future tropical cyclone risk, Sci. Adv., 8, eabm8438, https://doi.org/10.1126/sciadv.abm8438, 2022.
Blöschl, G., Hall, J., Viglione, A., Perdigão, R. A. P., Parajka, J., Merz, B., Lun, D., Arheimer, B., Aronica, G. T., Bilibashi, A., Boháč, M., Bonacci, O., Borga, M., Čanjevac, I., Castellarin, A., Chirico, G. B., Claps, P., Frolova, N., Ganora, D., Gorbachova, L., Gül, A., Hannaford, J., Harrigan, S., Kireeva, M., Kiss, A., Kjeldsen, T. R., Kohnová, S., Koskela, J. J., Ledvinka, O., Macdonald, N., Mavrova-Guirguinova, M., Mediero, L., Merz, R., Molnar, P., Montanari, A., Murphy, C., Osuch, M., Ovcharuk, V., Radevski, I., Salinas, J. L., Sauquet, E., Šraj, M., Szolgay, J., Volpi, E., Wilson, D., Zaimi, K., and Živković, N.: Changing climate both increases and decreases European river floods, Nature, 573, 108–111, https://doi.org/10.1038/s41586-019-1495-6, 2019.
Bryant, S., McGrath, H., and Boudreault, M.: Gridded flood depth estimates from satellite-derived inundations, Nat. Hazards Earth Syst. Sci., 22, 1437–1450, https://doi.org/10.5194/nhess-22-1437-2022, 2022.
Cattaneo, C., Beine, M., Fröhlich, C. J., Kniveton, D., Martinez-Zarzoso, I., Mastrorillo, M., Millock, K., Piguet, E., and Schraven, B.: Human Migration in the Era of Climate Change, Rev. Environ. Econ. Policy, 13, 189–206, https://doi.org/10.1093/reep/rez008, 2019.
Chavas, D. R., Lin, N., Dong, W., and Lin, Y.: Observed Tropical Cyclone Size Revisited, J. Climate, 29, 2923–2939, https://doi.org/10.1175/JCLI-D-15-0731.1, 2016.
Church, J. A. and White, N. J.: Sea-Level Rise from the Late 19th to the Early 21st Century, Surv. Geophys., 32, 585–602, https://doi.org/10.1007/s10712-011-9119-1, 2011.
Church, J. A., White, N. J., Coleman, R., Lambeck, K., and Mitrovica, J. X.: Estimates of the Regional Distribution of Sea Level Rise over the 1950–2000 Period, J. Climate, 17, 2609–2625, https://doi.org/10.1175/1520-0442(2004)017<2609:EOTRDO>2.0.CO;2, 2004.
Church, J. A., Clark, P. U., Cazenave, A., Gregory, J. M., Jevrejeva, S., Levermann, A., Merrifield, M. A., Milne, G. A., Nerem, R. S., Nunn, P. D., Payne, A. J., Pfeffer, W. T., Stammer, D., and Unnikrishnan, A. S.: Sea Level Change, in: Climate Change 2013: The Physical Science Basis, Contribution of Working Group I to the Fifth Assessment Report of the Intergovernmental Panel on Climate Change, edited by: Stocker, T. F., Qin, D., Plattner, G.-K., Tignor, M., Allen, S. K., Boschung, J., Nauels, A., Xia, Y., Bex, V., and Midgley, P. M., Cambridge University Press, Cambridge, UK and New York, NY, USA, 1137–1216, https://www.ipcc.ch/site/assets/uploads/2018/02/WG1AR5_Chapter13_FINAL.pdf (last access: 27 October 2023), 2013.
Cissé, G., McLeman, R., Adams, H., Aldunce, P., Bowen, K., Campbell-Lendrum, D., Clayton, S., Ebi, K. L., Hess, J., Huang, C., Liu, Q., McGregor, G., Semenza, J., and Tirado, M. C.: Health, Wellbeing, and the Changing Structure of Communities, in: Climate Change 2022: Impacts, Adaptation, and Vulnerability, Contribution of Working Group II to the Sixth Assessment Report of the Intergovernmental Panel on Climate Change, edited by: Pörtner, H.-O., Roberts, D. C., Tignor, M., Poloczanska, E. S., Mintenbeck, K., Alegría, A., Craig, M., Langsdorf, S., Löschke, S., Möller, V., Okem, A., and Rama, B., Cambridge University Press, Cambridge, UK and New York, NY, USA, 1041–1170, https://doi.org/10.1017/9781009325844.009, 2022.
CMEMS: Global ocean gridded L4 sea surface heights and derived variables reprocessed (1993–ongoing), EU Copernicus Marine Service, CMEMS, https://www.copernicus.eu/en/access-data/copernicus-services-catalogue/global-ocean-griddedl4-sea-surface-heights-and-derived (last access: 2 August 2021), 2021.
Cohen, S., Brakenridge, G. R., Kettner, A., Bates, B., Nelson, J., McDonald, R., Huang, Y.-F., Munasinghe, D., and Zhang, J.: Estimating Floodwater Depths from Flood Inundation Maps and Topography, J. Am. Water Resour. Assoc., 54, 847–858, https://doi.org/10.1111/1752-1688.12609, 2018.
Custer, R. and Nishijima, K.: Flood vulnerability assessment of residential buildings by explicit damage process modelling, Nat. Hazards, 78, 461–496, https://doi.org/10.1007/s11069-015-1725-7, 2015.
Dangendorf, S., Marcos, M., Wöppelmann, G., Conrad, C. P., Frederikse, T., and Riva, R.: Reassessment of 20th century global mean sea level rise, P. Natl. Acad. Sci. USA, 114, 5946–5951, https://doi.org/10.1073/pnas.1616007114, 2017.
Desai, B., Bresch, D. N., Cazabat, C., Hochrainer-Stigler, S., Mechler, R., Ponserre, S., and Schewe, J.: Addressing the human cost in a changing climate, Science, 372, 1284–1287, https://doi.org/10.1126/science.abh4283, 2021.
Dullaart, J. C. M., Muis, S., Bloemendaal, N., Chertova, M. V., Couasnon, A., and Aerts, J. C. J. H.: Accounting for tropical cyclones more than doubles the global population exposed to low-probability coastal flooding, Commun. Earth Environ., 2, 135, https://doi.org/10.1038/s43247-021-00204-9, 2021.
Eilander, D., Couasnon, A., Leijnse, T., Ikeuchi, H., Yamazaki, D., Muis, S., Dullaart, J., Haag, A., Winsemius, H. C., and Ward, P. J.: A globally applicable framework for compound flood hazard modeling, Nat. Hazards Earth Syst. Sci., 23, 823–846, https://doi.org/10.5194/nhess-23-823-2023, 2023.
Emanuel, K.: Increasing destructiveness of tropical cyclones over the past 30 years, Nature, 436, 686–688, https://doi.org/10.1038/nature03906, 2005.
Emanuel, K., Ravela, S., Vivant, E., and Risi, C.: A Statistical Deterministic Approach to Hurricane Risk Assessment, B. Am. Meteorol. Soc., 87, 299–314, https://doi.org/10.1175/BAMS-87-3-299, 2006.
Emanuel, K. A.: The dependence of hurricane intensity on climate, Nature, 326, 483–485, https://doi.org/10.1038/326483a0, 1987.
Emanuel, K. A.: Downscaling CMIP5 climate models shows increased tropical cyclone activity over the 21st century, P. Natl. Acad. Sci. USA, 110, 12219–12224, https://doi.org/10.1073/pnas.1301293110, 2013.
Emerton, R., Cloke, H., Ficchi, A., Hawker, L., de Wit, S., Speight, L., Prudhomme, C., Rundell, P., West, R., Neal, J., Cuna, J., Harrigan, S., Titley, H., Magnusson, L., Pappenberger, F., Klingaman, N., and Stephens, E.: Emergency flood bulletins for Cyclones Idai and Kenneth: A critical evaluation of the use of global flood forecasts for international humanitarian preparedness and response, Int. J. Disast. Risk Reduct., 50, 101811, https://doi.org/10.1016/j.ijdrr.2020.101811, 2020.
Foresight: Migration and Global Environmental Change, Final Project Report, https://www.gov.uk/government/publications/migration-and-global-environmental-change-future-challenges (last access: 4 January 2023), 2011.
Fowler, H. J., Lenderink, G., Prein, A. F., Westra, S., Allan, R. P., Ban, N., Barbero, R., Berg, P., Blenkinsop, S., Do, H. X., Guerreiro, S., Haerter, J. O., Kendon, E. J., Lewis, E., Schaer, C., Sharma, A., Villarini, G., Wasko, C., and Zhang, X.: Anthropogenic intensification of short-duration rainfall extremes, Nat. Rev. Earth Environ., 2, 107–122, https://doi.org/10.1038/s43017-020-00128-6, 2021.
Fox-Kemper, B., Hewitt, H. T., Xiao, C., Aðalgeirsdóttir, G., Drijfhout, S. S., Edwards, T. L., Golledge, N. R., Hemer, M., Kopp, R. E., Krinner, G., Mix, A., Notz, D., Nowicki, S., Nurhati, I. S., Ruiz, L., Sallée, J.-B., Slangen, A. B. A., and Yu, Y.: Ocean, Cryosphere and Sea Level Change, in Climate Change 2021: The Physical Science Basis, Contribution of Working Group I to the Sixth Assessment Report of the Intergovernmental Panel on Climate Change, edited by: Masson-Delmotte, V., Zhai, P., Pirani, A., Connors, S. L., Péan, C., Berger, S., Caud, N., Chen, Y., Goldfarb, L., Gomis, M. I., Huang, M., Leitzell, K., Lonnoy, E., Matthews, J. B. R., Maycock, T. K., Waterfield, T., Yelekçi, O., Yu, R., and Zhou, B., Cambridge University Press, Cambridge, UK and New York, NY, USA, 1211–1362, 2021.
Frame, D. J., Rosier, S. M., Noy, I., Harrington, L. J., Carey-Smith, T., Sparrow, S. N., Stone, D. A., and Dean, S. M.: Climate change attribution and the economic costs of extreme weather events: a study on damages from extreme rainfall and drought, Climatic Change, 162, 781–797, https://doi.org/10.1007/s10584-020-02729-y, 2020a.
Frame, D. J., Wehner, M. F., Noy, I., and Rosier, S. M.: The economic costs of Hurricane Harvey attributable to climate change, Climatic Change, 160, 271–281, https://doi.org/10.1007/s10584-020-02692-8, 2020b.
Freire, S., MacManus, K., Pesaresi, M., Doxsey-Whitfield, E., and Mills, J.: Development of new open and free multi-temporal global population grids at 250 m resolution, in: 19th AGILE Conference on Geographic Information Science, 14–17 June 2016, Helsinki, Finland, https://publications.jrc.ec.europa.eu/repository/handle/JRC100523 (last access: 27 October 2023), 2016.
GADM: Database of Global Administrative Areas, https://gadm.org/data.html (last access: 5 August 2020), 2018.
Galantowicz, J. F. and Picton, J.: Flood Mapping with Passive Microwave Remote Sensing: Current Capabilities and Directions for Future Development, in: Earth Observation for Flood Applications, Elsevier, 39–60, https://doi.org/10.1016/B978-0-12-819412-6.00003-1, 2021.
Garner, A.J., Mann, M. E., Emanuel, K. A., Kopp, R. E., Lin, N., Alley, R. B., Horton, B. P., DeConto, R. M., Donnelly, J. P., and Pollard, D.: Impact of climate change on New York City's coastal flood hazard: Increasing flood heights from the preindustrial to 2300 CE, P. Natl. Acad. Sci. USA, 114, 11861–11866, https://doi.org/10.1073/pnas.1703568114, 2017.
Geiger, T., Frieler, K., and Bresch, D. N.: A global historical data set of tropical cyclone exposure (TCE-DAT), Earth Syst. Sci. Data, 10, 185–194, https://doi.org/10.5194/essd-10-185-2018, 2018.
Gemenne, F.: Why the numbers don't add up: A review of estimates and predictions of people displaced by environmental changes, Global Environ. Change, 21, S41–S49, https://doi.org/10.1016/j.gloenvcha.2011.09.005, 2011.
Google Maps: Mozambique, Satellite image, Google Maps [data set], https://www.google.com/maps/place/Mozambique/@-18.3359987,25.1264933,2875812m/data=!3m1!1e3!4m6!3m5!1s0x18d4aceae6fd4ac5:0x12bbbfb9ae16a115!8m2!3d-18.665695!4d35.529562!16zL20vMDR3bGg?entry=ttu (last access: 27 April 2022), 2022a.
Google Maps: Greater Area of Beira, Mozambique, Satellite image, Google Maps [data set], https://www.google.com/maps/place/Beira,+Mozambique/@-19.7768616,34.7865512,22273m/data=!3m2!1e3!4b1!4m6!3m5!1s0x1f2a6a5f5da047c1:0xa1d3dd2e50b3b6e6!8m2!3d-19.8315949!4d34.8370183!16zL20vMDNtajFk?entry=ttu (last access: 27 April 2022), 2022b.
Gudmundsson, L., Boulange, J., Do, H. X., Gosling, S. N., Grillakis, M. G., Koutroulis, A. G., Leonard, M., Liu, J., Müller Schmied, H., Papadimitriou, L., Pokhrel, Y., Seneviratne, S. I., Satoh, Y., Thiery, W., Westra, S., Zhang, X., and Zhao, F.: Globally observed trends in mean and extreme river flow attributed to climate change, Science, 371, 1159–1162, https://doi.org/10.1126/science.aba3996, 2021.
Guerreiro, S. B., Fowler, H. J., Barbero, R., Westra, S., Lenderink, G., Blenkinsop, S., Lewis, E., and Li, X.-F.: Detection of continental-scale intensification of hourly rainfall extremes, Nat. Clim. Change, 8, 803–807, https://doi.org/10.1038/s41558-018-0245-3, 2018.
Guha-Sapir, D., Below, R., and Hoyois, P.: EM-DAT: The CRED/OFDA International Disaster Database, Université Catholique de Louvain-Brussels, Belgium, https://www.emdat.be/ (last access: 21 April 2022), 2022.
Gulev, S. K., Thorne, P. W., Ahn, J., Dentener, F. J., Domingues, C. M., Gerland, S., Gong, D., Kaufman, D. S., Nnamchi, H. C., Quaas, J., Rivera, J. A., Sathyendranath, S., Smith, S. L., Trewin, B., von Schuckmann, K., and Vose, R. S.: Changing State of the Climate System., in Climate Change 2021: The Physical Science Basis, Contribution of Working Group I to the Sixth Assessment Report of the Intergovernmental Panel on Climate Change, edited by: Masson-Delmotte, V., Zhai, P., Pirani, A., Connors, S. L., Péan, C., Berger, S., Caud, N., Chen, Y., Goldfarb, L., Gomis, M. I., Huang, M., Leitzell, K., Lonnoy, E., Matthews, J. B. R., Maycock, T. K., Waterfield, T., Yelekçi, O., Yu, R., and Zhou, B., Cambridge University Press, 287–422, https://doi.org/10.1017/9781009157896.004, 2021.
Han, W., Meehl, G. A., Rajagopalan, B., Fasullo, J. T., Hu, A., Lin, J., Large, W. G., Wang, J., Quan, X.-W., Trenary, L. L., Wallcraft, A., Shinoda, T., and Yeager, S.: Patterns of Indian Ocean sea-level change in a warming climate, Nat. Geosci., 3, 546–550, https://doi.org/10.1038/ngeo901, 2010.
Hawker, L., Rougier, J., Neal, J., Bates, P., Archer, L., and Yamazaki, D.: Implications of Simulating Global Digital Elevation Models for Flood Inundation Studies, Water Resour. Res., 54, 7910–7928, https://doi.org/10.1029/2018WR023279, 2018.
HDX: Mozambique admin level 4 – Beira and Dondo neighbourhood boundaries, https://data.humdata.org/dataset/mozambique-admin-level-4-beira-and-dondo-neighbourhood (last access: 3 May 2022), 2019.
Holland, G. J.: An Analytic Model of the Wind and Pressure Profiles in Hurricanes, Mon. Weather Rev., 108, 1212–1218, https://doi.org/10.1175/1520-0493(1980)108<1212:AAMOTW>2.0.CO;2, 1980.
Hollinger, M. and Sienkevych, O.: The role of local and regional governments in protecting internally displaced persons (IDPs), https://rm.coe.int/the-role-of-local-and-regional-governments-in-protecting, (last access: 25 April 2023), 2019.
IDMC: Unveiling the cost of internal displacement, URL:https://www.internal-displacement.org/sites/default/files/publications/documents/201902-economic-impact-cost-estimates.pdf (last access: 25 April 2023), 2019.
INGC: REACH Initiative, Mozambique admin level 4 – Beira and Dondo neighbourhood boundaries, INGC [data set], https://data.humdata.org/dataset/mozambique-admin-level-4-beira-and-dondo-neighbourhood, (last access: 3 May 2022), 2019.
IDMC: IDMC Global Report on Internal Displacement 2022 Displacement Dataset, https://www.internal-displacement.org/database/displacement-data (last access: 12 February 2023), 2022.
Irish, J. L., Sleath, A., Cialone, M. A., Knutson, T. R., and Jensen, R. E.: Simulations of Hurricane Katrina (2005) under sea level and climate conditions for 1900, Climatic Change, 122, 635–649, https://doi.org/10.1007/s10584-013-1011-1, 2014.
Kam, P. M., Aznar-Siguan, G., Schewe, J., Milano, L., Ginnetti, J., Willner, S., McCaughey, J. W., and Bresch, D. N.: Global warming and population change both heighten future risk of human displacement due to river floods, Environ. Res. Lett., 16, 044026, https://doi.org/10.1088/1748-9326/abd26c, 2021.
Knapp, K. R., Kruk, M. C., Levinson, D. H., Diamond, H. J., and Neumann, C. J.: The International Best Track Archive for Climate Stewardship (IBTrACS): Unifying Tropical Cyclone Data, B. Am. Meteorol. Soc., 91, 363–376, 2010.
Knutson, T., Camargo, S. J., Chan, J. C. L., Emanuel, K., Ho, C.-H., Kossin, J., Mohapatra, M., Satoh, M., Sugi, M., Walsh, K., and Wu, L.: Tropical Cyclones and Climate Change Assessment: Part I: Detection and Attribution, B. Am. Meteorol. Soc., 100, 1987–2007, https://doi.org/10.1175/BAMS-D-18-0189.1, 2019.
Knutson, T., Camargo, S. J., Chan, J. C. L., Emanuel, K., Ho, C.-H., Kossin, J., Mohapatra, M., Satoh, M., Sugi, M., Walsh, K., and Wu, L.: Tropical Cyclones and Climate Change Assessment: Part II: Projected Response to Anthropogenic Warming, B. Am. Meteorol. Soc., 101, E303–E322, https://doi.org/10.1175/BAMS-D-18-0194.1, 2020.
Knutson, T. R., Sirutis, J. J., Zhao, M., Tuleya, R. E., Bender, M., Vecchi, G. A., Villarini, G., and Chavas, D.: Global Projections of Intense Tropical Cyclone Activity for the Late Twenty-First Century from Dynamical Downscaling of CMIP5/RCP4.5 Scenarios, J. Climate, 28, 7203–7224, https://doi.org/10.1175/JCLI-D-15-0129.1, 2015.
Kossin, J. P., Knapp, K. R., Vimont, D. J., Murnane, R. J., and Harper, B. A.: A globally consistent reanalysis of hurricane variability and trends, Geophys. Res. Lett., 34, L04815, https://doi.org/10.1029/2006GL028836, 2007.
Kossin, J. P., Olander, T. L., and Knapp, K. R.: Trend Analysis with a New Global Record of Tropical Cyclone Intensity, J. Climate, 26, 9960–9976, https://doi.org/10.1175/JCLI-D-13-00262.1, 2013.
Kulp, S. A. and Strauss, B. H.: CoastalDEM: A global coastal digital elevation model improved from SRTM using a neural network, Remote Sens. Environ., 206, 231–239, https://doi.org/10.1016/j.rse.2017.12.026, 2018.
Kulp, S. A. and Strauss, B. H.: CoastalDEM v2.1: A high-accuracy and high-resolution global coastal elevation model trained on ICESat-2 satellite lidar, Climate Central Scientific Report, 17 pp., https://assets.ctfassets.net/cxgxgstp8r5d/3f1LzJSnp7ZjFD4loDYnrA/71eaba2b8f8d642dd9a7e6581dce0c66/CoastalDEM_2.1_Scientific_Report_.pdf (last access: 10 May 2022), 2021.
Lee, J.-Y., Marotzke, J., Bala, G., Cao, L., Corti, S., Dunne, J. P., Engelbrecht, F., Fischer, E., Fyfe, J. C., Jones, C., Maycock, A., Mutemi, J., Ndiaye, O., Panickal, S., and Zhou, T.: Future Global Climate: Scenario-Based Projections and Near-Term Information, in Climate Change 2021: The Physical Science Basis, Contribution of Working Group I to the Sixth Assessment Report of the Intergovernmental Panel on Climate Change, edited by: Masson-Delmotte, V., Zhai, P., Pirani, A., Connors, S. L., Péan, C., Berger, S., Caud, N., Chen, Y., Goldfarb, L., Gomis, M. I., Huang, M., Leitzell, K., Lonnoy, E., Matthews, J. B. R., Maycock, T. K., Waterfield, T., Yelekçi, O., Yu, R., and Zhou, B., Cambridge University Press, Cambridge, UK and New York, NY, USA, 553–672, 2021.
Leyk, S., Gaughan, A. E., Adamo, S. B., de Sherbinin, A., Balk, D., Freire, S., Rose, A., Stevens, F. R., Blankespoor, B., Frye, C., Comenetz, J., Sorichetta, A., MacManus, K., Pistolesi, L., Levy, M., Tatem, A. J., and Pesaresi, M.: The spatial allocation of population: a review of large-scale gridded population data products and their fitness for use, Earth Syst. Sci. Data, 11, 1385–1409, https://doi.org/10.5194/essd-11-1385-2019, 2019.
Lin, N., Emanuel, K., Oppenheimer, M., and Vanmarcke, E.: Physically based assessment of hurricane surge threat under climate change, Nat. Clim. Change, 2, 462–467, https://doi.org/10.1038/nclimate1389, 2012.
Lin, N., Lane, P., Emanuel, K. A., Sullivan, R. M., and Donnelly, J. P.: Heightened hurricane surge risk in northwest Florida revealed from climatological-hydrodynamic modeling and paleorecord reconstruction, J. Geophys. Res.-Atmos., 119, 8606–8623, https://doi.org/10.1002/2014JD021584, 2014.
Lindsay, J. B.: The Whitebox Geospatial Analysis Tools Project and Open-Access GIS, in: Proc. GIS Res. UK 22nd Annu. Conf. Univ. Glasg., 16–18 April 2014, Glasgow, UK, 2014.
Luu, L. N., Scussolini, P., Kew, S., Philip, S., Hariadi, M. H., Vautard, R., Van Mai, K., Van Vu, T., Truong, K. B., Otto, F., van der Schrier, G., van Aalst, M. K., and van Oldenborgh, G. J.: Attribution of typhoon-induced torrential precipitation in Central Vietnam, October 2020, Climatic Change, 169, 24, https://doi.org/10.1007/s10584-021-03261-3, 2021.
Lyard, F. H., Allain, D. J., Cancet, M., Carrère, L., and Picot, N.: FES2014 global ocean tide atlas: design and performance, Ocean Sci., 17, 615–649, https://doi.org/10.5194/os-17-615-2021, 2021.
Mandli, K. T. and Dawson, C. N.: Adaptive mesh refinement for storm surge, Ocean Model., 75, 36–50, https://doi.org/10.1016/j.ocemod.2014.01.002, 2014.
McAdam, J.: Evacuations: a form of disaster displacement?, Forced Migr. Rev., 56–57, https://www.fmreview.org/sites/fmr/files/FMRdownloads/en/climate-crisis/mcadam.pdf (last access: 19 April 2023), 2022.
Mengel, M., Treu, S., Lange, S., and Frieler, K.: ATTRICI v1.1 – counterfactual climate for impact attribution, Geosci. Model Dev., 14, 5269–5284, https://doi.org/10.5194/gmd-14-5269-2021, 2021.
Mester, B., Willner, S. N., Frieler, K., and Schewe, J.: Evaluation of river flood extent simulated with multiple global hydrological models and climate forcings, Environ. Res. Lett., 16, 094010, https://doi.org/10.1088/1748-9326/ac188d, 2021.
Mester, B., Vogt, T., Bryant, S., Otto, C., Frieler, K., and Schewe, J.: Source code for the study “Human displacements from Tropical Cyclone Idai attributable to climate change”, Zenodo [code], https://doi.org/10.5281/zenodo.10027136, 2023a.
Mester, B., Vogt, T., Bryant, S., Otto, C., Frieler, K., and Schewe, J.: Data collection for the study “Human displacements from Tropical Cyclone Idai attributable to climate change”, Zenodo [data set]. https://doi.org/10.5281/zenodo.10038190, 2023b.
Muis, S., Apecechea, M. I., Dullaart, J., de Lima Rego, J., Madsen, K. S., Su, J., Yan, K., and Verlaan, M.: A High-Resolution Global Dataset of Extreme Sea Levels, Tides, and Storm Surges, Including Future Projections, Front. Mar. Sci., 7, https://doi.org/10.3389/fmars.2020.00263, 2020.
Nicholls, R. J., Lincke, D., Hinkel, J., Brown, S., Vafeidis, A. T., Meyssignac, B., Hanson, S. E., Merkens, J.-L., and Fang, J.: A global analysis of subsidence, relative sea-level change and coastal flood exposure, Nat. Clim. Change, 11, 338–342, https://doi.org/10.1038/s41558-021-00993-z, 2021.
Nott, J. and Hayne, M.: High frequency of `super-cyclones' along the Great Barrier Reef over the past 5,000 years, Nature, 413, 508–512, https://doi.org/10.1038/35097055, 2001.
OCHA: Guiding Principles on Internal Displacement, https://reliefweb.int/report/world/guiding-principles-internal-displacement-2004 (last access: 14 February 2023), 2004.
O'Neill, B., van Aalst, M., Zaiton Ibrahim, Z., Berrang Ford, L., Bhadwal, S., Buhaug, H., Diaz, D., Frieler, K., Garschagen, M., Magnan, A., Midgley, G., Mirzabaev, A., Thomas, A., and Warren, R.: Key Risks Across Sectors and Regions, in: Climate Change 2022: Impacts, Adaptation, and Vulnerability, Contribution of Working Group II to the Sixth Assessment Report of the Intergovernmental Panel on Climate Change, edited by: Pörtner, H.-O., Roberts, D. C., Tignor, M., Poloczanska, E. S., Mintenbeck, K., Alegría, A., Craig, M., Langsdorf, S., Löschke, S., Möller, V., Okem, A., and Rama, B., Cambridge University Press, 2022.
Otto, F. E. L., Harrington, L., Schmitt, K., Philip, S., Kew, S., van Oldenborgh, G. J., Singh, R., Kimutai, J., and Wolski, P.: Challenges to Understanding Extreme Weather Changes in Lower Income Countries, B. Am. Meteorol. Soc., 101, E1851–E1860, https://doi.org/10.1175/BAMS-D-19-0317.1, 2020.
Patricola, C. M. and Wehner, M. F.: Anthropogenic influences on major tropical cyclone events, Nature, 563, 339–346, https://doi.org/10.1038/s41586-018-0673-2, 2018.
Pekel, J.-F., Cottam, A., Gorelick, N., and Belward, A. S.: High-resolution mapping of global surface water and its long-term changes, Nature, 540, 418–422, https://doi.org/10.1038/nature20584, 2016.
Philip, S., Kew, S., van Oldenborgh, G. J., Otto, F., Vautard, R., van der Wiel, K., King, A., Lott, F., Arrighi, J., Singh, R., and van Aalst, M.: A protocol for probabilistic extreme event attribution analyses, Adv. Stat. Climatol. Meteorol. Oceanogr., 6, 177–203, https://doi.org/10.5194/ascmo-6-177-2020, 2020.
Probst, P. and Annunziato, A.: Tropical Cyclone IDAI: analysis of the wind, rainfall and storm surge impact, Join Research Centre, European Commission, https://www.humanitarianresponse.info/sites/www.humanitarianresponse.info/files/documents/files/joint_research_centre_analysis_of_wind_rainfall_and_storm_surge_impact_09_april_2019.pdf (last access: 7 November 2022), 2019.
QGIS.org: %Y. QGIS Geographic Information System, QGIS Association, http://www.qgis.org (last access: 20 August 2023), 2023.
ReliefWeb: Mozambique: Cyclone Idai & Floods Flash Update No. 10, 26 March 2019, https://reliefweb.int/report/mozambique/mozambique-cyclone-idai-floods-flash-update-no-10-26 (last access: 15 May 2023), 2019a.
ReliefWeb: `The First City Completely Devastated by Climate Change' Tries to Rebuild after Cyclone Idai, https://reliefweb.int/report/mozambique/first-city-completely-devastated-climate-change-tries-rebuild (last access: 7 November 2022), 2019b.
Resio, D. T. and Irish, J. L.: Tropical Cyclone Storm Surge Risk, in: Handbook of Coastal and Ocean Engineering, World Scientific, 1405–1422, https://doi.org/10.1142/9789813204027_0049, 2016.
Riahi, K., van Vuuren, D. P., Kriegler, E., Edmonds, J., O'Neill, B. C., Fujimori, S., Bauer, N., Calvin, K., Dellink, R., Fricko, O., Lutz, W., Popp, A., Cuaresma, J. C., Kc, S., Leimbach, M., Jiang, L., Kram, T., Rao, S., Emmerling, J., Ebi, K., Hasegawa, T., Havlik, P., Humpenöder, F., Da Silva, L. A., Smith, S., Stehfest, E., Bosetti, V., Eom, J., Gernaat, D., Masui, T., Rogelj, J., Strefler, J., Drouet, L., Krey, V., Luderer, G., Harmsen, M., Takahashi, K., Baumstark, L., Doelman, J. C., Kainuma, M., Klimont, Z., Marangoni, G., Lotze-Campen, H., Obersteiner, M., Tabeau, A., and Tavoni, M.: The Shared Socioeconomic Pathways and their energy, land use, and greenhouse gas emissions implications: An overview, Global Environ. Change, 42, 153–168, https://doi.org/10.1016/j.gloenvcha.2016.05.009, 2017.
Sauer, I. J., Reese, R., Otto, C., Geiger, T., Willner, S. N., Guillod, B. P., Bresch, D. N., and Frieler, K.: Climate signals in river flood damages emerge under sound regional disaggregation, Nat. Commun., 12, 2128, https://doi.org/10.1038/s41467-021-22153-9, 2021.
Scherrer, S. C., Fischer, E. M., Posselt, R., Liniger, M. A., Croci-Maspoli, M., and Knutti, R.: Emerging trends in heavy precipitation and hot temperature extremes in Switzerland, J. Geophys. Res.-Atmos., 121, 2626–2637, https://doi.org/10.1002/2015JD024634, 2016.
Schiavina, M., Freire, S., and MacManus, K.: GHS population grid multitemporal (1975, 1990, 2000, 2015) R2019A, European Commission, JRC – Joint Research Centre [data set], https://doi.org/10.2905/42E8BE89-54FF-464E-BE7B-BF9E64DA5218, 2019.
Shen, X., Wang, D., Mao, K., Anagnostou, E., and Hong, Y.: Inundation Extent Mapping by Synthetic Aperture Radar: A Review, Remote Sens., 11, 879, https://doi.org/10.3390/rs11070879, 2019.
Shepherd, T. G.: A Common Framework for Approaches to Extreme Event Attribution, Curr. Clim. Change Rep., 2, 28–38, https://doi.org/10.1007/s40641-016-0033-y, 2016.
Shepherd, T. G., Boyd, E., Calel, R. A., Chapman, S. C., Dessai, S., Dima-West, I. M., Fowler, H. J., James, R., Maraun, D., Martius, O., Senior, C. A., Sobel, A. H., Stainforth, D. A., Tett, S. F. B., Trenberth, K. E., van den Hurk, B. J. J. M., Watkins, N. W., Wilby, R. L., and Zenghelis, D. A.: Storylines: an alternative approach to representing uncertainty in physical aspects of climate change, Climatic Change, 151, 555–571, https://doi.org/10.1007/s10584-018-2317-9, 2018.
Strauss, B. H., Orton, P. M., Bittermann, K., Buchanan, M. K., Gilford, D. M., Kopp, R. E., Kulp, S., Massey, C., de Moel, H., and Vinogradov, S.: Economic damages from Hurricane Sandy attributable to sea level rise caused by anthropogenic climate change, Nat. Commun., 12, 2720, https://doi.org/10.1038/s41467-021-22838-1, 2021.
Takayabu, I., Hibino, K., Sasaki, H., Shiogama, H., Mori, N., Shibutani, Y., and Takemi, T.: Climate change effects on the worst-case storm surge: a case study of Typhoon Haiyan, Environ. Res. Lett., 10, 064011, https://doi.org/10.1088/1748-9326/10/6/064011, 2015.
The World Bank: World Development Indicators. Population, total – Mozambique, https://data.worldbank.org/indicator/SP.POP.TOTL?end=2019&locations=MZ&start=2015 (last access: 29 April 2022), 2022.
Titley, D., Hegerl, G., Jacobs, K., Mote, P. W., Paciorek, C. J., Shepherd, J. M., Shepherd, T. G., Sobel, A. H., Walsh, J., and Zwiers, F. W.: Attribution of Extreme Weather Events in the Context of Climate Change, The National Academies Press, Washington, DC, https://doi.org/10.17226/21852, 2016.
Tozer, B., Sandwell, D. T., Smith, W. H. F., Olson, C., Beale, J. R., and Wessel, P.: Global Bathymetry and Topography at 15 Arc Sec: SRTM15+, Earth Space Sci., 6, 1847–1864, https://doi.org/10.1029/2019EA000658, 2019.
Trenberth, K. E., Fasullo, J. T., and Shepherd, T. G.: Attribution of climate extreme events, Nat. Clim. Change, 5, 725–730, https://doi.org/10.1038/nclimate2657, 2015.
van Berchum, E. C., van Ledden, M., Timmermans, J. S., Kwakkel, J. H., and Jonkman, S. N.: Rapid flood risk screening model for compound flood events in Beira, Mozambique, Nat. Hazards Earth Syst. Sci., 20, 2633–2646, https://doi.org/10.5194/nhess-20-2633-2020, 2020.
van den Hurk, B. J. J. M., Baldissera Pacchetti, M., Boere, E., Ciullo, A., Coulter, L., Dessai, S., Ercin, E., Goulart, H., Hamed, R., Hochrainer-Stigler, S., Koks, E., Kubiczek, P., Levermann, A., Mechler, R., van Meersbergen, M., Mester, B., Middelanis, R., Minderhoud, K., Mysiak, J., Nirandjan, S., van den Oord, G., Otto, C., Sayers, P., Schewe, J., Shepherd, T. G., Sillmann, J., Stuparu, D., Vogt, T., and Witpas, K.: Climate impact storylines for assessing socio-economic responses to remote events, Clim. Risk Manage., 40, 100500, https://doi.org/10.1016/j.crm.2023.100500, 2023.
van Oldenborgh, G. J., van der Wiel, K., Sebastian, A., Singh, R., Arrighi, J., Otto, F., Haustein, K., Li, S., Vecchi, G., and Cullen, H.: Attribution of extreme rainfall from Hurricane Harvey, August 2017, Environ. Res. Lett., 12, 124009, https://doi.org/10.1088/1748-9326/aa9ef2, 2017.
van Oldenborgh, G. J., van der Wiel, K., Kew, S., Philip, S., Otto, F., Vautard, R., King, A., Lott, F., Arrighi, J., Singh, R., and van Aalst, M.: Pathways and pitfalls in extreme event attribution, Climatic Change, 166, 13, https://doi.org/10.1007/s10584-021-03071-7, 2021.
Warren, M.: Why Cyclone Idai is one of the Southern Hemisphere's most devastating storms, Nature, https://doi.org/10.1038/d41586-019-00981-6, in press, 2019.
Webster, P. J., Holland, G. J., Curry, J. A., and Chang, H.-R.: Changes in Tropical Cyclone Number, Duration, and Intensity in a Warming Environment, Science, 309, 1844–1846, https://doi.org/10.1126/science.1116448, 2005.
Wessel, P. and Smith, W.: A global, self-consistent, hierarchical, high-resolution shoreline database, J. Geophys. Res., 101, 8741–8743, https://doi.org/10.1029/96JB00104, 1996.
Wulder, M. A., White, J. C., Loveland, T. R., Woodcock, C. E., Belward, A. S., Cohen, W. B., Fosnight, E. A., Shaw, J., Masek, J. G., and Roy, D. P.: The global Landsat archive: Status, consolidation, and direction, Remote Sens. Environ., 185, 271–283, 2016.
Yamazaki, D., Ikeshima, D., Sosa, J., Bates, P. D., Allen, G. H., and Pavelsky, T. M.: MERIT Hydro: A High-Resolution Global Hydrography Map Based on Latest Topography Dataset, Water Resour. Res., 55, 5053–5073, https://doi.org/10.1029/2019WR024873, 2019.
Zscheischler, J., Martius, O., Westra, S., Bevacqua, E., Raymond, C., Horton, R. M., van den Hurk, B., AghaKouchak, A., Jézéquel, A., Mahecha, M. D., Maraun, D., Ramos, A. M., Ridder, N. N., Thiery, W., and Vignotto, E.: A typology of compound weather and climate events, Nat. Rev. Earth Environ., 1, 333–347, https://doi.org/10.1038/s43017-020-0060-z, 2020.