the Creative Commons Attribution 4.0 License.
the Creative Commons Attribution 4.0 License.
 | 26 Jan 2023
Quantifying unequal urban resilience to rainfall across China from location-aware big data
Jiale Qian
Yunyan Du
Jiawei Yi
Fuyuan Liang
Nan Wang
Ting Ma
Tao Pei
Disaster-relevant authorities could make uninformed decisions due to the lack of a clear picture of urban resilience to adverse natural events. Previous studies have seldom examined the near-real-time human dynamics, which are critical to disaster emergency response and mitigation, in response to the development and evolution of mild and frequent rainfall events. In this study, we used the aggregated Tencent location request (TLR) data to examine the variations in collective human activities in response to rainfall in 346 cities in China. Then two resilience metrics, rainfall threshold and response sensitivity, were introduced to report a comprehensive study of the urban resilience to rainfall across mainland China. Our results show that, on average, a 1 mm increase in rainfall intensity is associated with a 0.49 % increase in human activity anomalies. In the cities of northwestern and southeastern China, human activity anomalies are affected more by rainfall intensity and rainfall duration, respectively. Our results highlight the unequal urban resilience to rainfall across China, showing current heavy-rain-warning standards underestimate the impacts of heavy rains on residents in the northwestern arid region and the central underdeveloped areas and overestimate impacts on residents in the southeastern coastal area. An overhaul of current heavy-rain-alert standards is therefore needed to better serve the residents in our study area.
- Article
(6785 KB) - Full-text XML
-
Supplement
(1116 KB) - BibTeX
- EndNote


Heavy rains with intense precipitation have become more frequent in the context of global climate changes (Myhre et al., 2019; Ogie et al., 2018) and pose significant threats to urban residents, mainly due to uncoordinated watershed management and undersized infrastructures (Chan et al., 2018; Dewan, 2015; Nahiduzzaman et al., 2015; Song et al., 2019). China is frequently affected by urban flooding, particularly in summer when the Asian monsoon brings heavy rains to inland China. It is estimated that 55.15 million people were affected by floods in China in 2017 alone and the direct economic loss was approximately CNY 214 billion, which significantly exceeds the impacts of the 2017 typhoon disasters (5.879 million people, CNY 34.62 billion). In addition to threatening human daily activities and cities' normal operation (Aerts et al., 2014; Grinberger and Felsenstein, 2016; Kasmalkar et al., 2020; Owrangi et al., 2014), the ever-increasing rainstorms endlessly challenge cities' flood resistance capacity and relevant authorities' real-time decisions in response to such adverse events. Urban decision-makers have learned that city management and planning would significantly benefit from a better understanding of urban resilience (O'Sullivan et al., 2012; Bertilsson et al., 2019; de Bruijn, 2004).
Urban resilience refers to the ability of an urban system to prepare for, respond to, and recover from adverse events (Ambelu et al., 2017; Hong et al., 2021; Liao, 2012; Meerow et al., 2016). Biologists, psychologists, engineers, and geographers have all made their own contributions to urban resilience studies (Adger et al., 2005; Brusberg and Shively, 2015; Olsson et al., 2015; Ouyang et al., 2012; Poulin and Kane, 2021; Shiferaw et al., 2014). Over the past 20 years, geographers have heavily relied on satellite imagery to assess disaster-related resilience as satellites have been providing ever-increasing information about the Earth at a relatively low cost (Mpandeli et al., 2019; Stefan et al., 2016; Tellman et al., 2021). For example, satellite-based emergency mapping systems have been developed to monitor the inundation and recovery processes of the 2005 Switzerland flood (Buehler et al., 2006); assess the damage, restoration, and reconstruction induced by the 2010 Haiti earthquake (Honey et al., 2010); and evaluate the changes in power supply before and after Hurricane Maria in 2017 (Román et al., 2019). Emergency rescuers can use high-resolution images to closely monitor ongoing natural disasters and coordinate disaster relief. However, it is almost impossible to extract near-real-time human dynamics over the evolution of a disaster from satellite images, and such information is very important in disaster mitigation and reduction (Liu et al., 2015; Ghaffarian et al., 2018).
Location-aware big data, such as smartphone call records, signalling data, and social media posts, have been widely used to infer real-time human activities (Yi et al., 2019; Wang et al., 2020, 2019; Yue et al., 2017), estimate disaster-induced losses (Kryvasheyeu et al., 2016; Liu et al., 2019b), monitor resettlement and restoration (Martín et al., 2020a, b; Wang and Taylor, 2018; Yabe et al., 2020), and study disaster-related resilience (Hong et al., 2021; Huang and Ling, 2018; Kasmalkar et al., 2020; Zou et al., 2018). Urban residents adjust their activities when their living environments are socially and physically impacted by an adverse event, and such adjustment can be inferred from location-aware big data (Qian et al., 2021b). In other words, the changes in human activities extracted from location-aware big data could be used to study the resilience capacity of an urban system in response to an adverse event. For example, Hong et al. (2021) quantified changes in mobility behaviour before, during, and after the Hurricane Harvey using smartphone geolocation data, and they analysed the spatial variable of community resilience capacity, which was defined as the function of the magnitude of impact and time to recovery.
Human activities may also change in response to mild yet frequent adverse natural events, such as urban rainstorms. Unlike in the case of hurricanes, dwellers are usually not mobilized by relevant authorities to prepare for and resettle after such events. Instead, nearly 90 % of flood-related tweets in a city are released during heavy rains (Wang et al., 2020). Consequently, human activities mainly show how an urban system responds to but not how it prepares for and recovers from such adverse natural events (Qian et al., 2022; Zhang et al., 2022). As a result, urban resilience to mild and frequent adverse events refers to the ability of an urban system to respond to adverse events. Furthermore, urban resilience could significantly differ from that of destructive disasters and may show significant spatiotemporal variations due to the areal difference in local natural settings, socioeconomic status, and infrastructure completeness (Adger et al., 2005; Guan and Chen, 2014; Östh et al., 2015; Zou et al., 2019, 2018). Study of such regional inequality is therefore of great value to disaster relief and mitigation.
However, previous resilience metrics, which have mainly focused on unique disaster events, were not suitable for making assessments at a large scale. Two resilience metrics were introduced into this study from other fields. Sensitivity is a widely used tool for understanding resilience in different regions in many other weather events, such as heat waves and air pollution (Hong et al., 2021; Wang et al., 2021). For example, Zheng et al. (2019) defined the links between a city-level happiness index calculated from social media data and a daily local air quality metric as the perception sensitivity and explored its spatial variation. However, response sensitivity has not yet been studied for rainstorm events through analysing the relation between a city-scale human activity response metric and a rainstorm event index. Another index, the rainfall threshold, is commonly used to study rainfall events that have resulted in landslides (Marra et al., 2016; Naidu et al., 2018). In this study, the rainfall threshold, which is defined as the minimum rainfall index that corresponds to a significant urban human activity response anomaly, is introduced into the study of urban resilience. These two metrics can effectively depict urban resilience at different levels of focus.
In this study, we propose a method for measuring and evaluating how urban systems respond to heavy rains as reflected in location-aware big data. We extracted human activities from the Tencent location request (TLR) data in 346 cities across mainland China from May to August 2017 and used two indicators – rainfall threshold and response sensitivity – to quantify the urban resilience across our study area. We found significant regional inequality of urban resilience in mainland China, and the inequality could be explained by variations in the regional natural, socioeconomic, and infrastructure variables. The findings from this study provide a new perspective and method to quantify urban resilience to frequent yet not so destructive adverse events across a large geographic scale. Practically, our findings suggest an urgent need to revise current unified rainstorm warning standards to better serve residents.
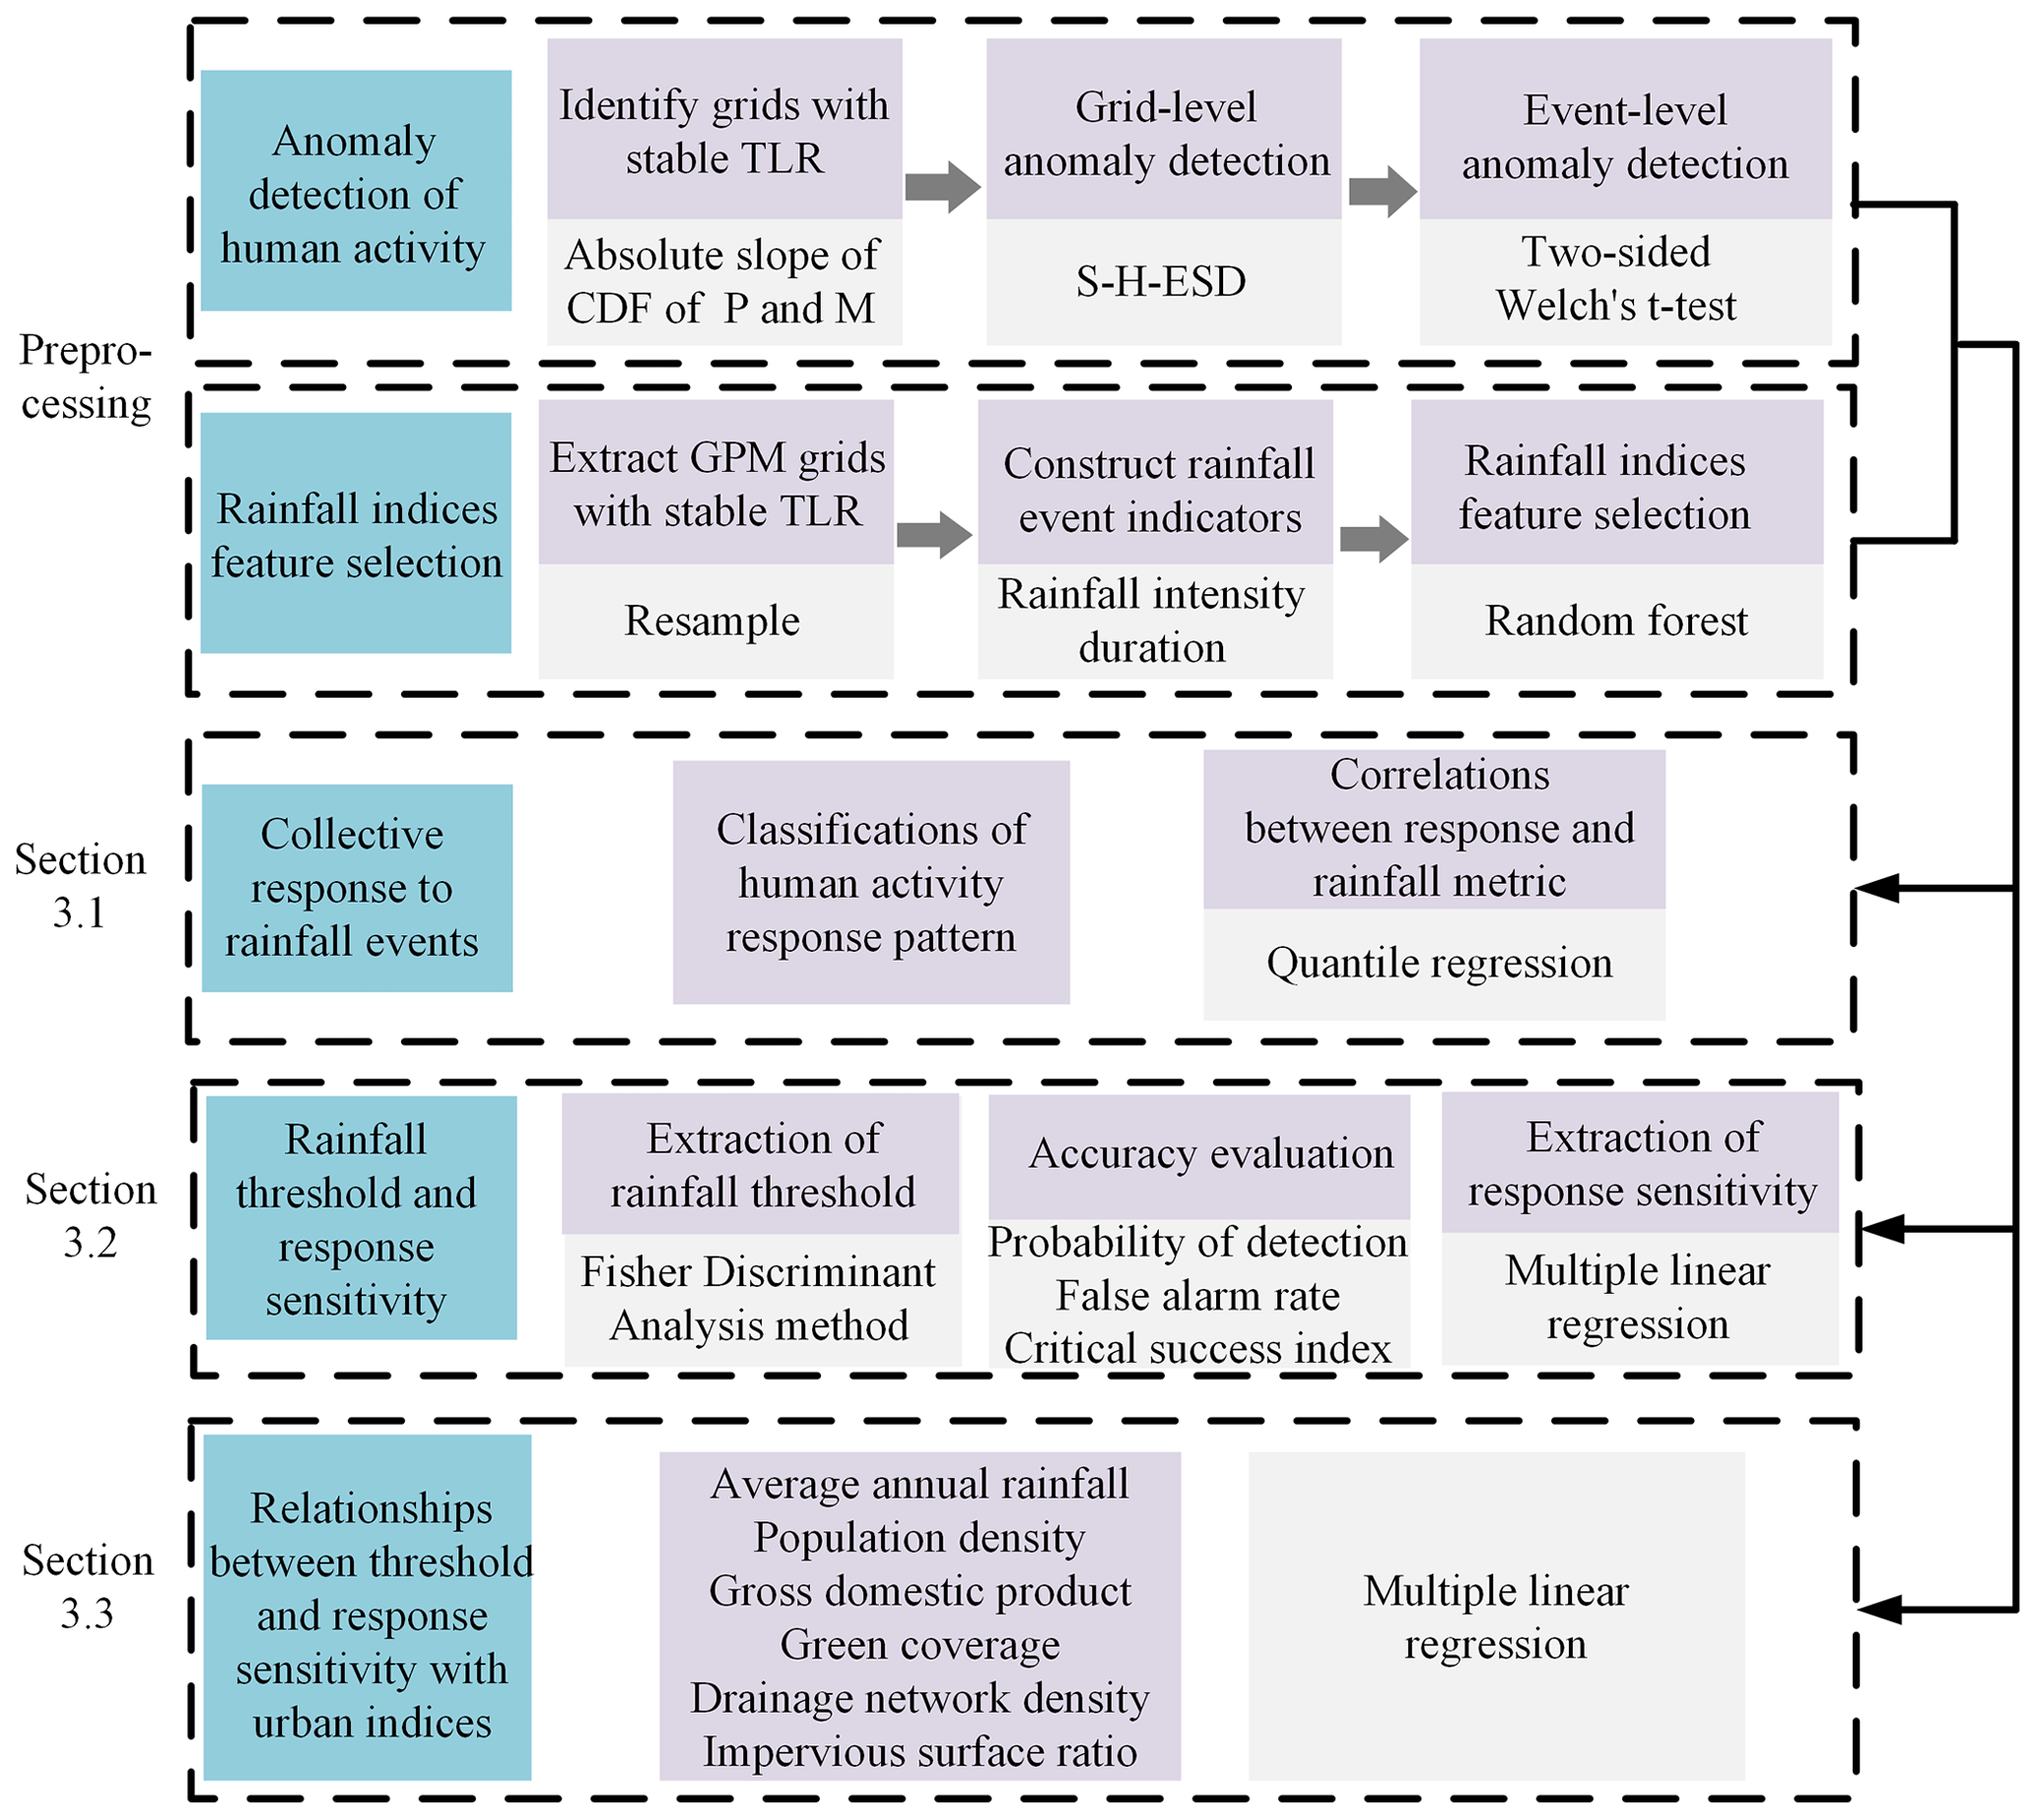
Figure 1A flow chart showing the data analysis process in this study. S-H-ESD denotes seasonal hybrid extreme Studentized deviate.
2.1 Data
We collected Tencent location request (TLR) data from 1 May to 31 August 2017 from Tencent's big data portal. Tencent, with over 700 million users, is the largest social media platform in China. A Tencent user may check in the platform for a variety of purposes such as location-based searching, navigation, or location sharing. The dataset we downloaded has an hourly temporal resolution and a 1 km × 1 km spatial resolution. The data have been proven as a reliable proxy for collective human activities in many studies from multiple dimensions of time and space (Liu et al., 2019b; Qian et al., 2021a; Ma, 2018).
We used the Integrated Multi-satellitE Retrievals for GPM (IMERG; GPM denotes Global Precipitation Measurement v6) 30 min precipitation dataset (Levizzani et al., 2020, p.1). This dataset has a spatial resolution of 0.1∘ × 0.1∘ and has been evaluated and widely used in related studies (Yi et al., 2019; Liu et al., 2019a). We used this dataset to extract the characteristics of rainfall events of interest.
We collected six natural, socioeconomic, or infrastructure indicators to help explain the variations in urban resilience, including the annual precipitation in China calculated by aggregating GPM data in 2017, population density, gross domestic product, green coverage rate, drainage network density, and per capita area of paved roads.
2.2 Methods
Figure 1 shows the data process and analysis flow chart of this study. We first proposed a multilevel human activity anomaly detection (MHAAD) methodological framework to detect and characterize the TLR anomalies in response to rainfall events. The framework has two major parts. In the first part, we identified the grids with a stable TLR number and then the anomalies from the time series TLR data of each grid. We then used the two-sided Welch's t test and probability density function (PDF) method to detect whether human activity anomalies are triggered by a rainfall event or not. Rainfall indices were extracted for the grids with a stable TLR number and selected by their importance as shown in the random forest model. We then explored the multilevel relationship between rainfall characteristics and human activity anomalies. We proposed two indicators – rainfall threshold and response sensitivity – to describe urban resilience. Lastly, we assessed the association between urban resilience and natural, socioeconomic, and infrastructure explanatory variables.
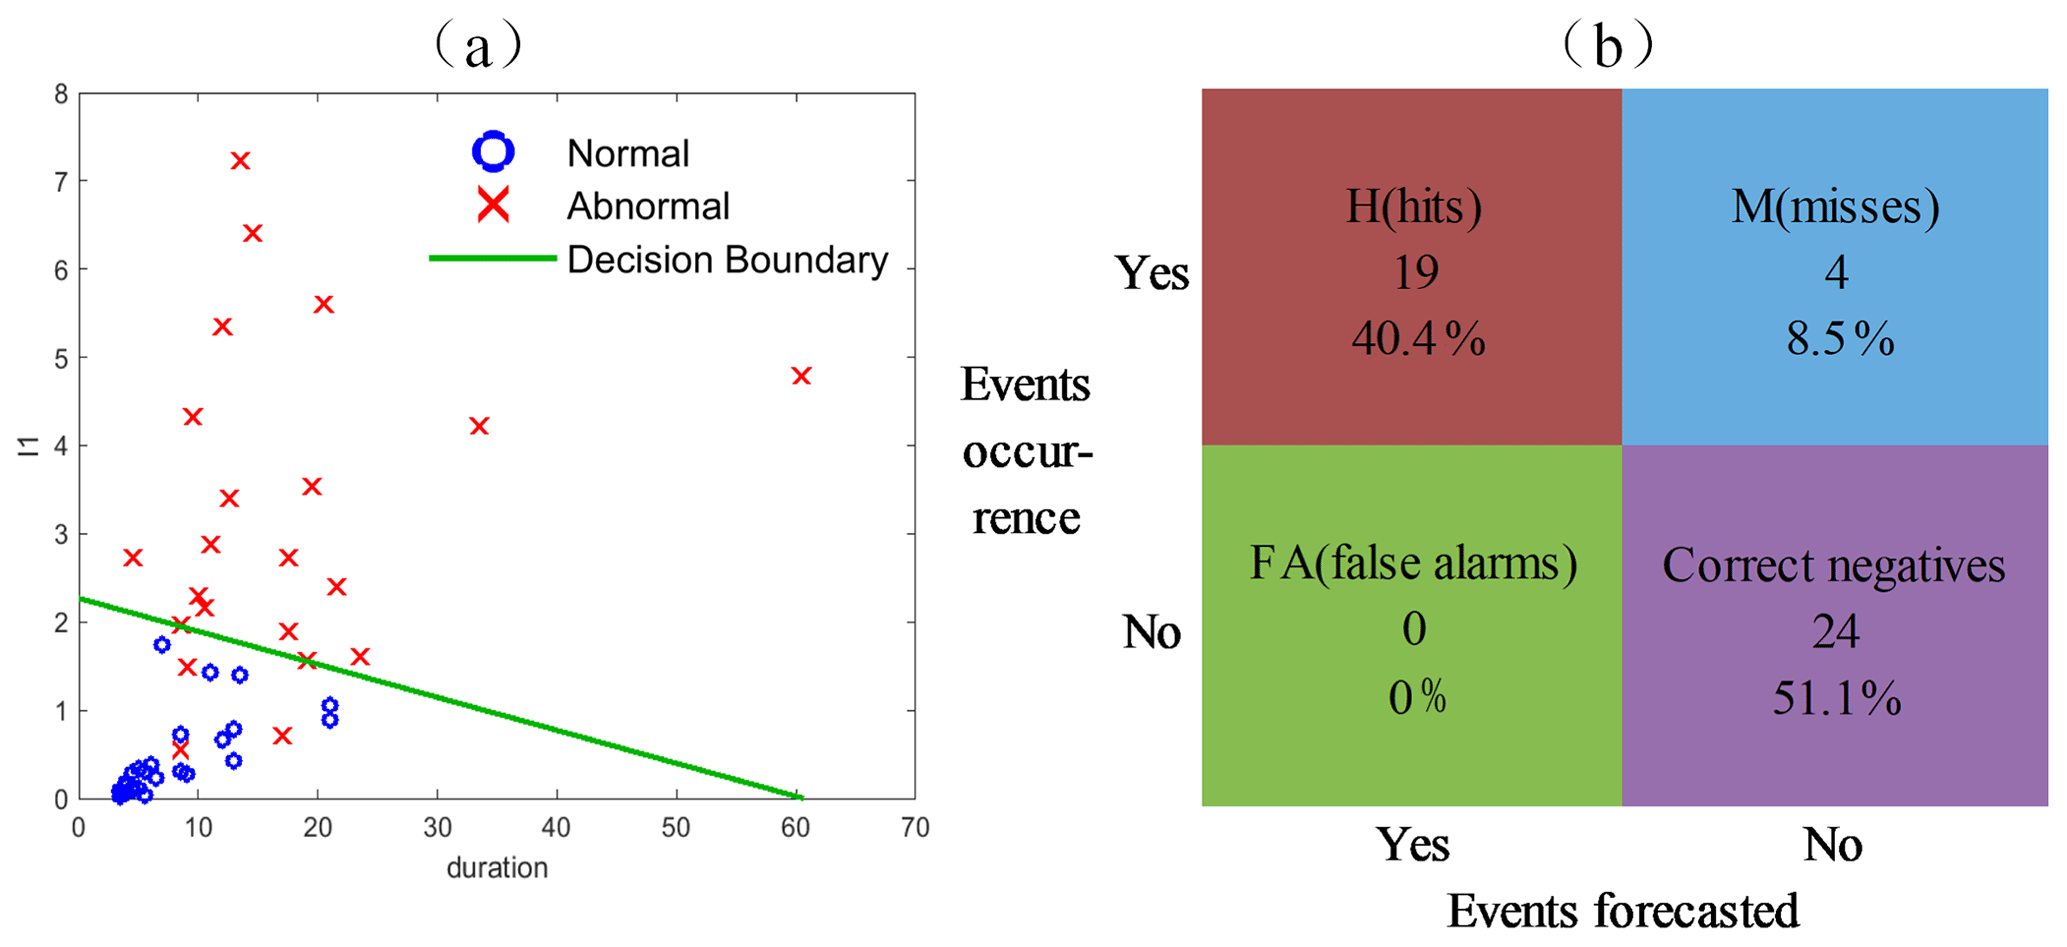
Figure 2The schematic diagram (a) and contingency table (b) of the binary classifier for Beijing.
2.2.1 TLR anomaly detection
We first identified all grids with a stable TLR number (hereafter referred to as stable grids unless stated otherwise) using the method Qian et al. (2021b) proposed. Based on the empirical cumulative distribution function (CDF) of parameters P and M, we can get all of the stable grids which are the regions with stable human activity and rhythm in an urban area. In total, 832 630 out of the 9 600 903 grids across our study area are identified as stable grids. The numbers of smartphone users and TLRs vary significantly by grid. We therefore normalized the TLRs using the median interquartile normalization method (Geller et al., 2003) to make the TLRs in the stable grids comparable. We then employed the seasonal hybrid extreme Studentized deviate (S-H-ESD) method (Vallis et al., 2014) to detect anomalies from the gridded TLR time series. The S-H-ESD method can be denoted by the following additive model:
where TC, SC, and RC represent the trend, seasonality, and residual components, respectively.
The S-H-ESD method has two major steps. First, the piecewise median method is used to fit and remove the long-term trend. Then the seasonal-trend decomposition using locally weighted regression (LOESS) method is employed to remove seasonality (Cleveland et al., 1990). We then used the generalized extreme Studentized deviate (G-ESD) statistic (Rosner, 1975) to identify significant anomalies in the residuals. In this study, we used a piecewise combination of the biweekly medians to model the underlying trend, which shows little change in the TLR time series. The significance level a is set to 0.05, and the number of anomalies is set to no more than 25 % of the total observations.
We then extracted the total numbers of the grids with positive anomalies (PTLR) and negative anomalies (NTLR) by city, respectively, and then examined the variations in the PTLR and NTLR time series over the periods with rains and without rains to identify whether a rainfall event triggers collective human activity anomalies. The two-sided Welch's t test was used for the significance test. Human activity anomalies usually happen shortly before or after the peak rainfall intensity and last as a spell instead of the entire rainfall event. We therefore employed a moving-time-window method to find the period with the largest accumulative rainfall and used the period to detect the statistical significance of the change in relation to the PTLR/NTLR time series in a raining and non-raining period. In this study, we used a 6 h moving window, which is half of the average duration of all rainfall events of interest in this study (see Fig. S3 in the Supplement).
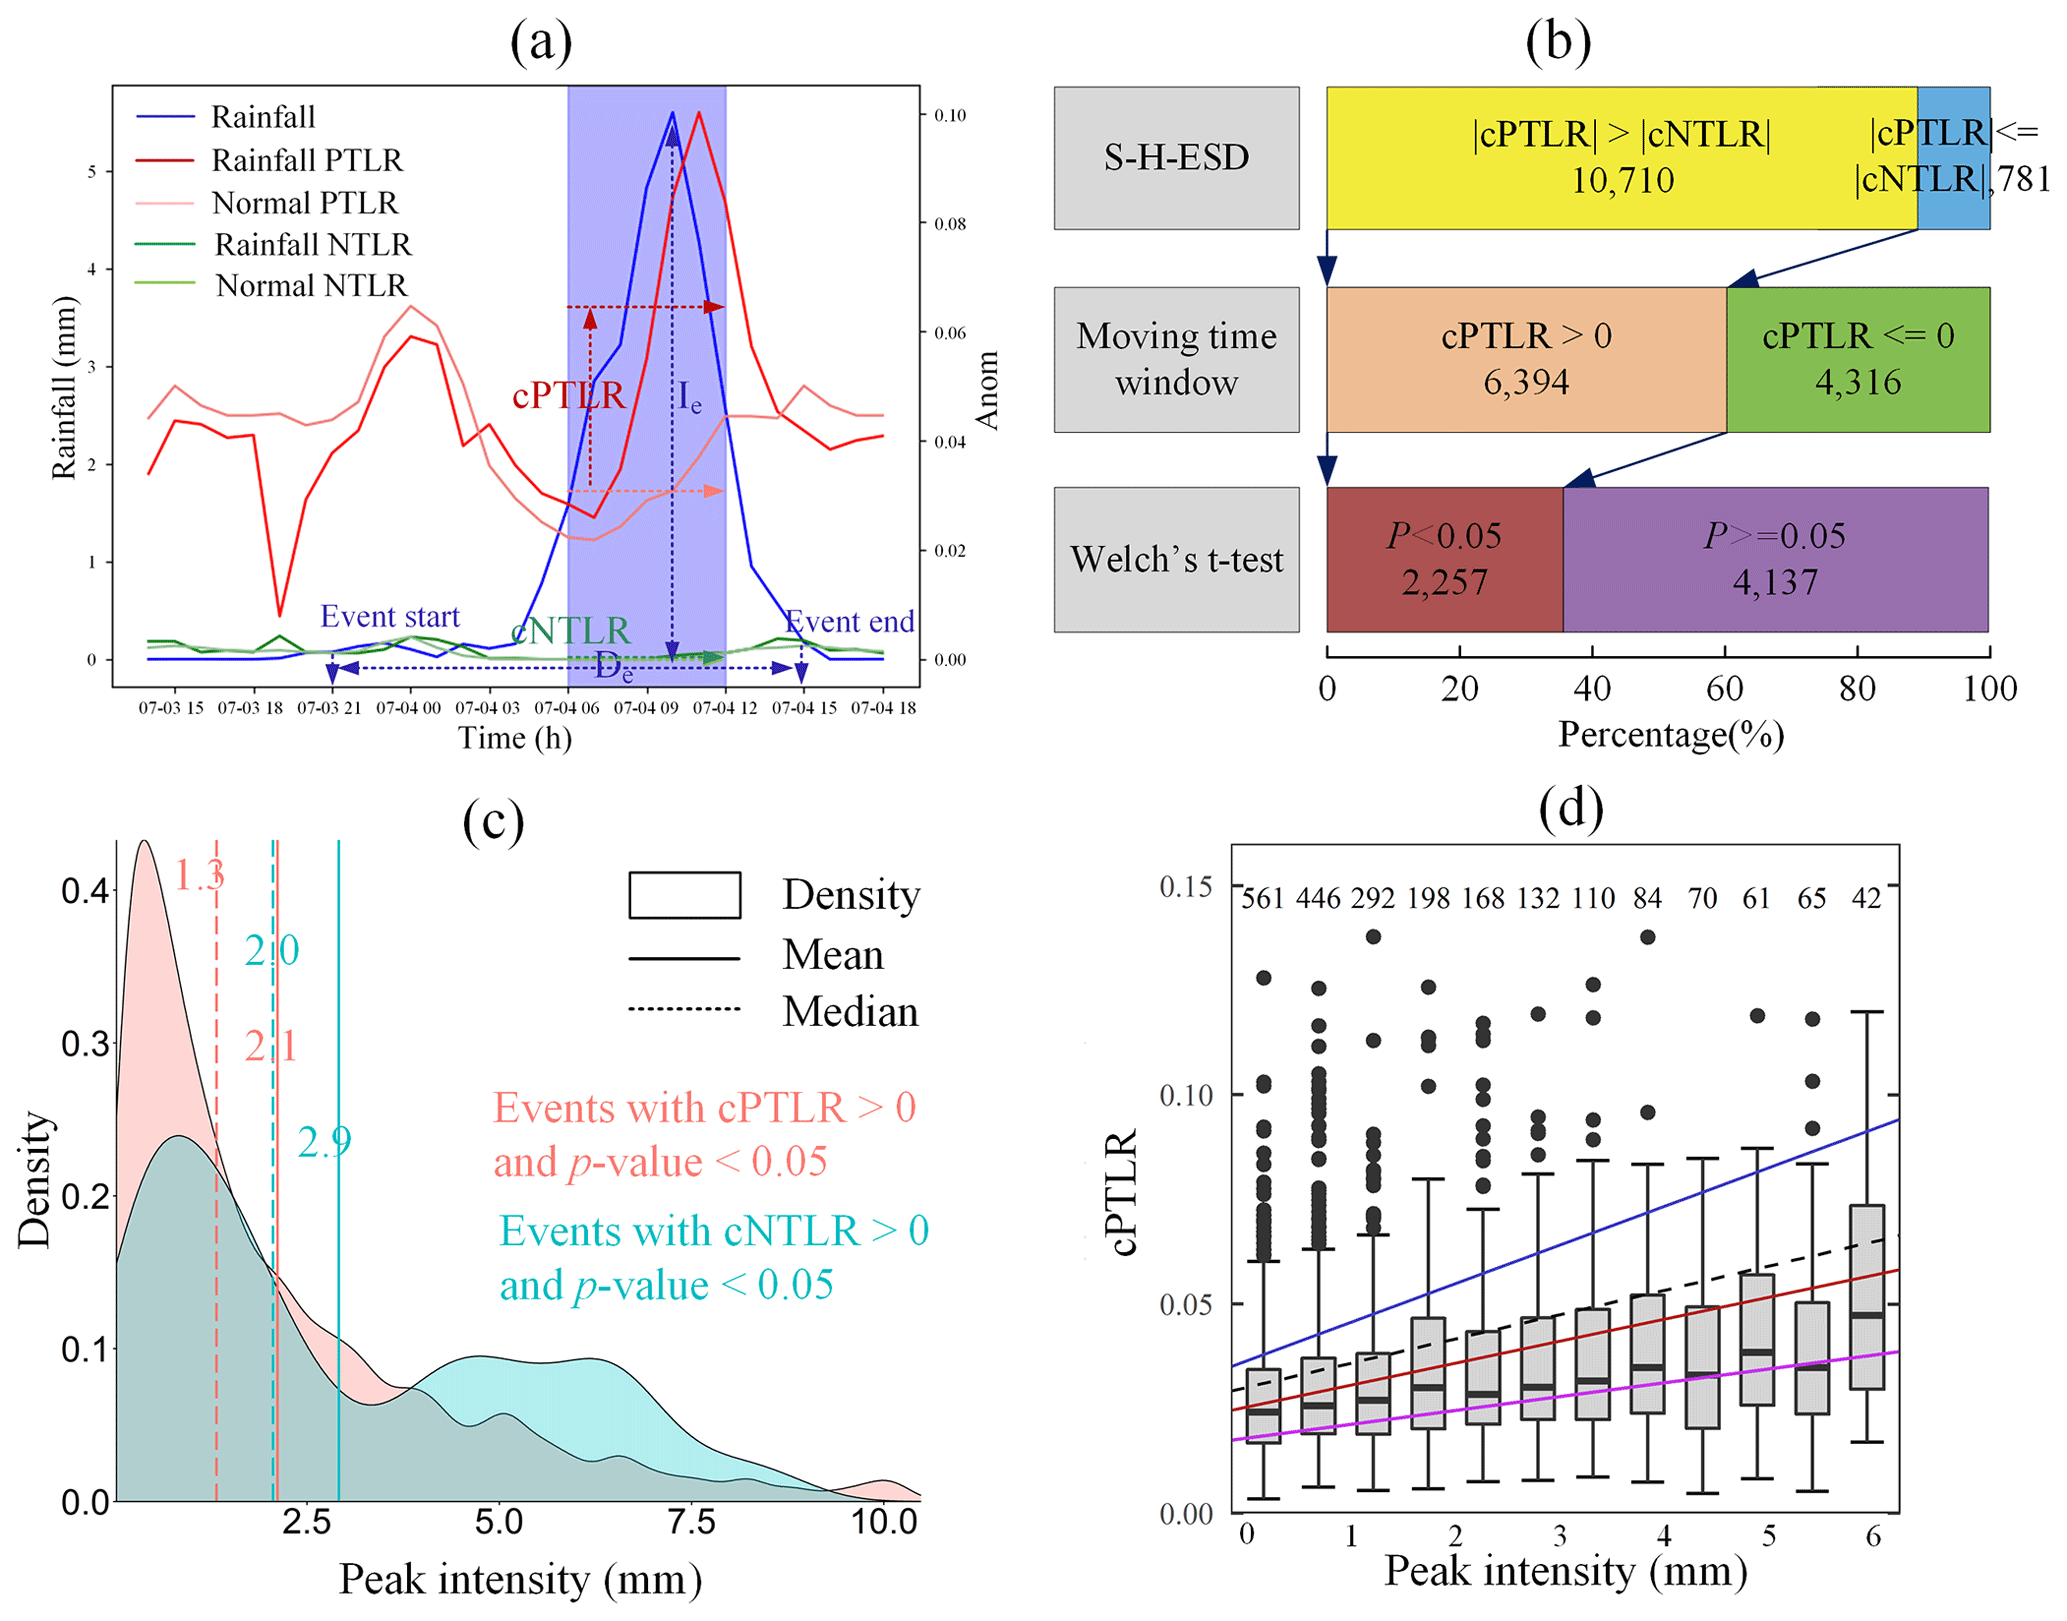
Figure 3(a) The schematic definitions of the human activity anomaly associated with a specific rainfall event used in this study, where the x axis presents the “month–day hour”. (b) The relative proportions and numbers of the rainfall events with various cPTLR and cNTLR values (see the main text for definitions of cPTLR and cNTLR). (c) The probability density distribution curves of the events with significantly increased cPTLR/cNTLR. (d) Box plots by peak rainfall intensity groups per 0.5 mm. Trend lines are shown for the ordinary least squares (OLS) regression (dashed black), 0.25 quantile (purple), median (red), and 0.75 quantile (blue) range. The numbers in Fig. 3d show the numbers of rainfall events with specific peak intensity as shown along the x axis.
2.2.2 Feature selection of rainfall indices
The GPM data were first resampled to the same spatiotemporal resolutions as those of the TLR data using the nearest-neighbour interpolation method. We then extracted the rainfall intensity for each city per hour, i.e. the average hourly GPM precipitation within the stable grids of the city.
In this study, a rainfall event is defined as a precipitation process that lasts for at least 3 h and with no rains preceding for at least 1 h. The number of rainfall events in each city is normally distributed. We selected the 346 cities with at least 40 (the top 5 % quantile) rainfall events for this study (Figs. S1 and S2).
Every rainfall event is described with three rainfall indices (the 1 h peak intensity, 6 h peak intensity, and cumulative rainfall) and two temporal indices (the duration and peak hour) (Table S1). From these indices, we used a random forest model (RF) to calculate the importance score (mean decrease accuracy) for each indicator. The importance score shows the global importance over all the out-of-bag cross-validated predictions. The random forest model is robust and less susceptible to multicollinearity as it averages all predictions for a given feature variable and is more efficient in terms of feature selection than multi-linear regression (Strobl et al., 2007; Pal, 2005). We then identified the most important indicator that triggers human activity anomalies (Liaw and Wiener, 2001).
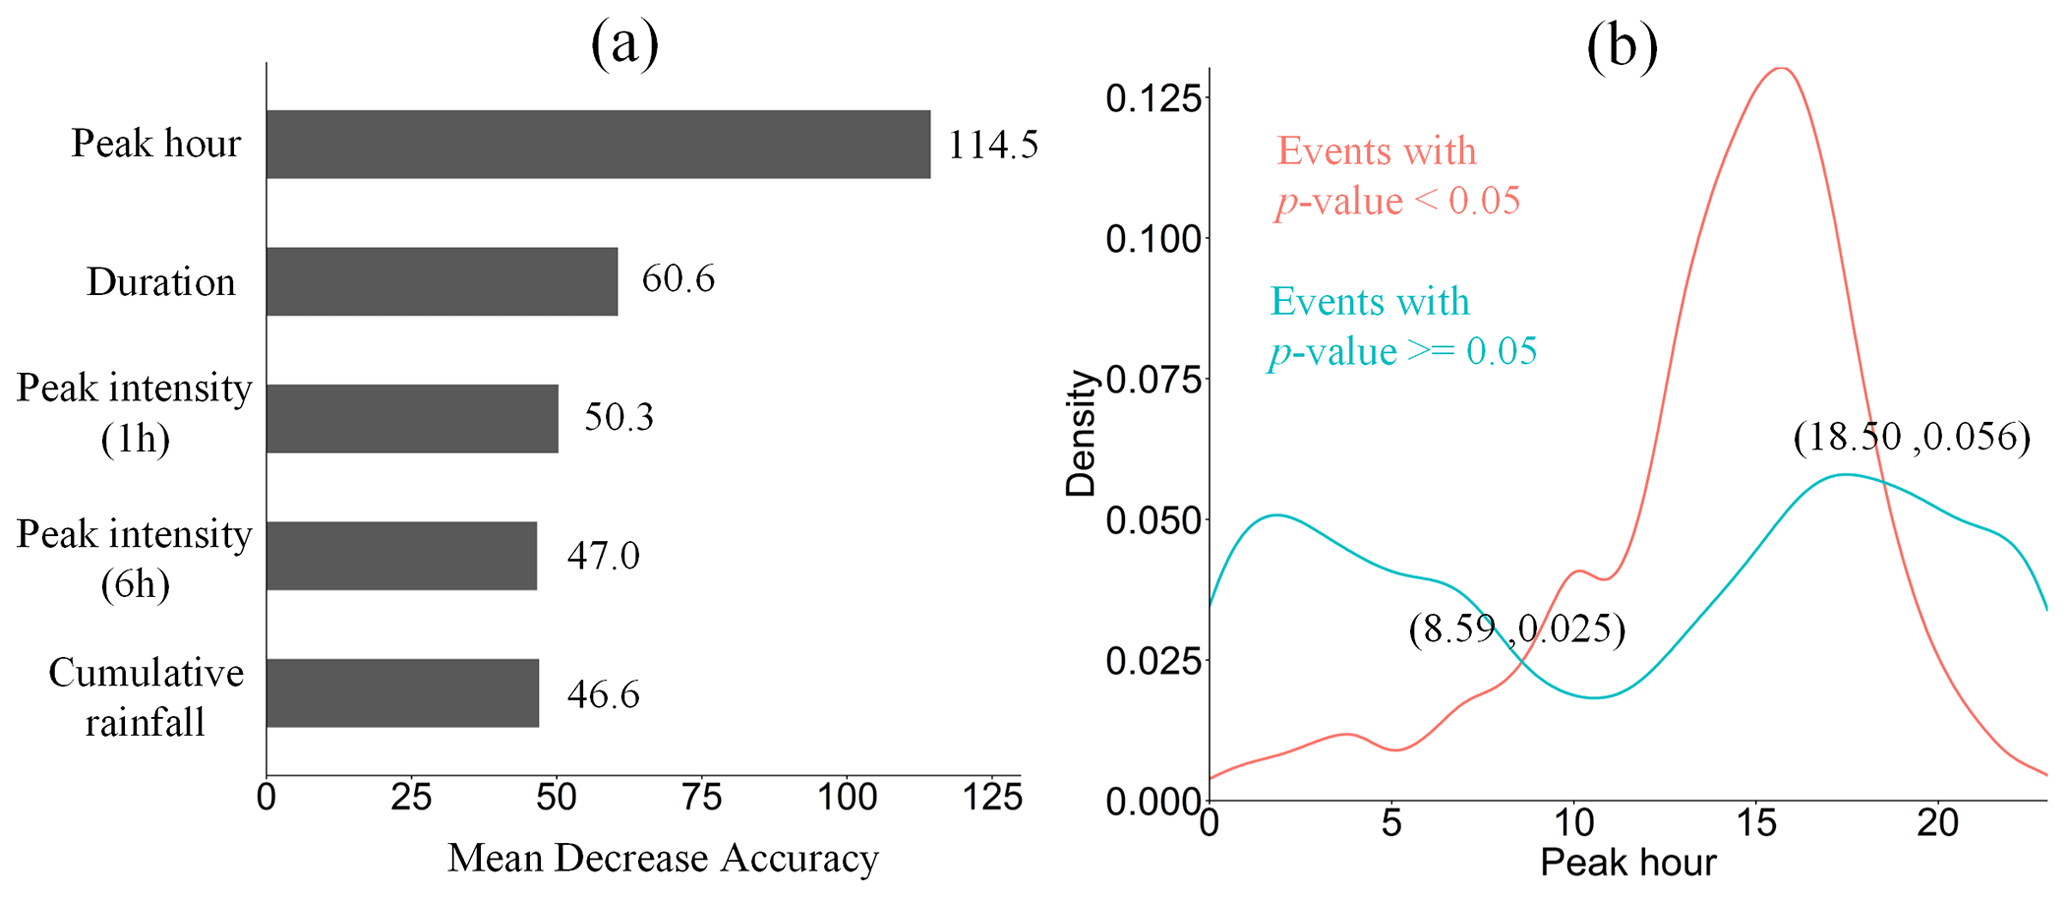
Figure 4(a) The importance of the five rainfall indicators obtained by the random forest model. The peak hour is the most important covariate that triggers human activity anomalies and has the highest decrease accuracy value of 114.5. (b) The peak hour thresholds identified from the differences in the peak hour PDF values between the rainfall events with and without significant collective human activity anomalies. When the peak hours are between 08:59 and 18:50 UTC+8, the PDF values of the events with human activity anomalies are higher than those without. In other words, daytime rains are more likely to trigger human activity anomalies. There are 11 491 daytime rains (i.e. from 08:59 to 18:50 UTC+8) out of the total 20 860 rainfall events (ratio: 55.11 %).

Figure 5Spatial distribution of the rainfall threshold that triggers human activity anomalies for rainfall events lasting 3 (a), 6 (b), and 12 h (c) and slope (d) of the decision boundary. The isohyets show the 2017 annual rainfall.
2.2.3 Quantifying the rainfall threshold and response sensitivity
In this study, we used two indices, rainfall threshold and response sensitivity, to quantitatively characterize urban resilience. The rainfall threshold is the peak intensity of the rainfall event which triggers collective human activity anomalies. We first used a linear binary classifier to examine the paired values of the peak intensity and duration to determine whether a rainfall event brings more or less rain than the threshold to trigger collective human activity anomalies (Fig. 2a). The Fisher discriminant analysis method was then applied to identify the discriminant function to minimize the classification errors (Mika et al., 1999). The rainfall thresholds associated with different rainfall durations are directly extracted from Fig. 2a.
Three quantitative indices, the probability of detection (POD), false alarm rate (FAR), and critical success index (CSI), are used to evaluate the performance of the threshold identification method based on the contingency table (Fig. 2b):
where H, FA, and M represent the percent of hits, false alarms, and misses, respectively. All three indices range from 0 to 1. A value of 1 for the POD and FAR indicates a perfect hit and a 100 % false-positive rate. A higher CSI is associated with a higher POD and a lower FAR value.
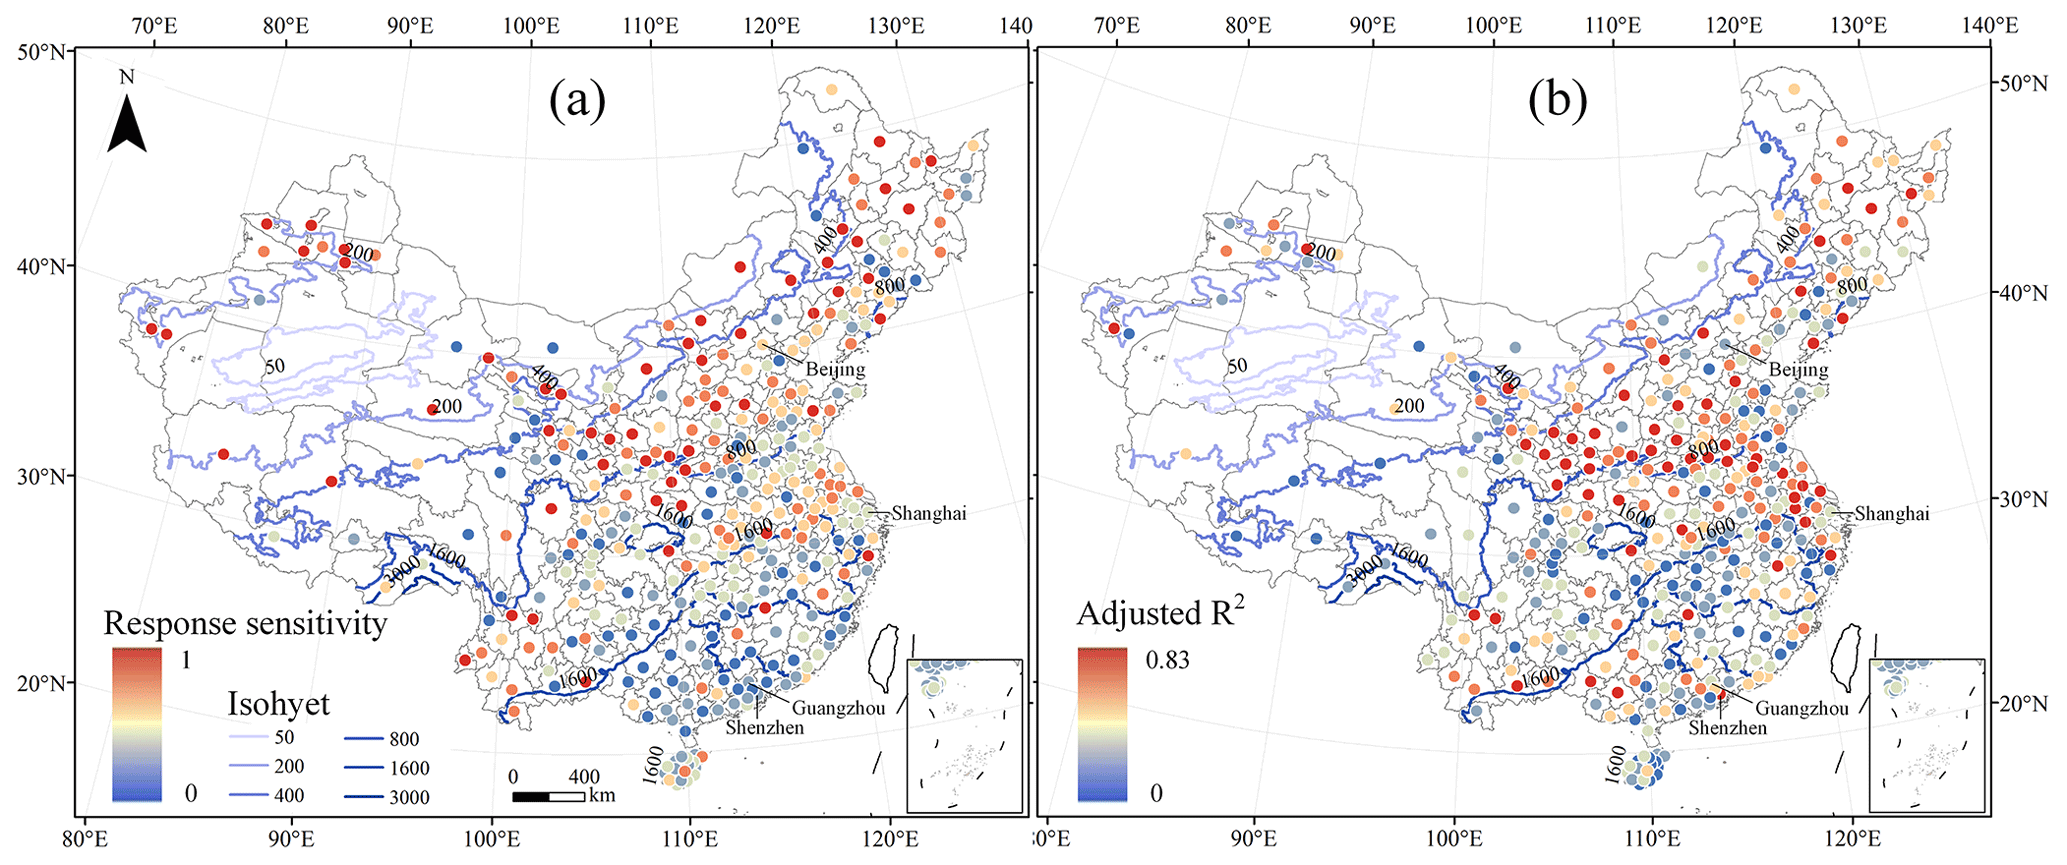
Figure 6Spatial distribution of the response sensitivity (a) and adjusted R2 (b) in multiple linear regression. The isohyets show the 2017 annual rainfall.
The second index, the response sensitivity, is defined as the rate of abnormal change in collective human activities triggered by a rainfall event. We first selected the rainfall events with precipitation above the threshold and that trigger human activity anomalies, i.e. those represented with red crosses and above the decision boundary in Fig. 2a. Then we defined two indicators, cPTLR and cNTLR, to describe the rate of abnormal change in collective human activities (Fig. S4). The cPTLR and cNTLR were calculated as the difference between the mean of the two time series, i.e. the PTLR and NTLR in the 6 h raining time window and non-raining time window. A multiple linear regression model was then constructed between the cPTLR and the rainfall intensity/duration for each city. In the end, we calculated the marginal city-specific partial derivatives of cPTLR with respect to the peak intensity and the duration. The response sensitivity index is calculated as the average of the regression coefficients of the peak intensity and the duration. The adjusted R2 was also calculated to assess the model accuracy.
Finally, we separately classified the rainfall threshold and response sensitivity indices of the 346 cities into three classes using the Jenks natural breaks classification method, which clusters data into different groups by seeking minimum variance within a class and maximum variance between classes (McDougall and Temple-Watts, 2012). In this study, we used the 6 h rainfall threshold index in line with the time window in Fig. S4. In total, there are nine different combinations between the threshold and response sensitivity indices.
2.2.4 Quantifying the relationships between resilience and urban characteristics
We then examined the relationships between the two urban resilience indices and the annual rainfall, population density, gross domestic product, green coverage rate, drainage network density, and per capita area of paved roads. The Kendall, Pearson, and Spearman correlation coefficients and multi-linear regression were used to measure the correlation between rainfall threshold, response sensitivity, and city characteristics at the city level.
3.1 Collective human activities in response to rainfall events
The gridded TLR numbers could increase (positive anomaly) or decrease (negative anomaly) in response to rains (Fig. S5). Counting the overall TLR changes by city would not show how rains impact collective human activities (Yi et al., 2019). In this study, instead, we calculated the changes in the total numbers of the grids showing positive (cPTLR) and negative anomalies (cNTLR) by city during a raining period in relation to those over the non-raining period (Fig. 3a) to illustrate how collective human activities change in response to rains.
The city-level collective human activities jump to an excited state (Fig. 3b) with a significantly increased number of grids exhibiting positive anomalies in response to 55.11 % of the daytime rains (Fig. 4), whereas nighttime rains show no significant impact on collective human activities. About 93.2 % (i.e. 10 710) of the rainfall events in this study are associated with a greater change in the number of grids with positive anomalies than that of the grids with negative anomalies (i.e. ). Around 59.7 % of the 10 710 (i.e. 6394) rains show an increased number of grids with positive anomalies by city. Furthermore, 35.3 % of the 6394 (i.e. 2257) rainfall events associated with excited-state human activities show a significantly increased number of grids with positive anomalies, which we believed could be attributed to heavy rains. We noticed that a small number (103, 13.19 % ) of heavy rains brought by typhoons trigger city-level collective human activities to be in a dispirited state, with a significantly increased number of grids exhibiting NTLR (Fig. 3c) as compared to the non-typhoon rains. Accordingly, we excluded all typhoon-related rainfall events from this study.
The higher rainfall intensity could trigger more excited-state collective human activities (Fig. 3d). The 1 h peak intensity values of the rainfall events associated with excited-state human activities are positively correlated with the corresponding cPTLR values (fitting slope = 0.49 %, p value < 0.001). However, the cPTLR slope against rainfall is affected by the divergence of the peak intensity anomaly. Quantile regression results show that the cPTLR slope coefficient estimates gradually increase from 0.17 % for the lower 25 % quantile to 0.84 % for the higher 75 % quantile (p value < 0.01). In other words, the cPTLR growth rate generally increases from the lower-anomaly to the sensitive-anomaly rainfall events with respect to the increasing magnitude of the rainfall peak intensity.
3.2 Regional inequality of urban resilience
We derived two indicators – rainfall threshold and response sensitivity – from the perspective of the public's social response to rains to evaluate urban resilience. The threshold is defined as the intensity of an event that triggers a city to reach an undesirable state (Liao, 2012). In this study, we defined the threshold of a rainfall event with a specific duration as the minimum rainfall intensity that corresponds to significant urban TLR anomalies. As shown in Fig. 4a, the peak rain intensity and rain duration are the second and third most important characteristics, respectively, that trigger human activity anomalies. We extracted the rainfall thresholds for each city using binary classification models (Fig. S6), and the results show that the rainfall thresholds drop with increased rainfall duration across all 346 cities in China (Fig. 5a–c). The 3, 6, and 12 h rainfall thresholds all show significant spatial autocorrelation and a pattern of gradual decrease from the southeastern coast to the northwestern inland. However, with increased rainfall durations, the average rainfall thresholds of all 346 cities decrease from 4.24 to 2.75, whereas their standard deviations decrease from 3.55 to 2.45. Such results indicate the public's response to the short rainfall events varies greatly in different cities and tends to be more consistent with increased rainfall durations.
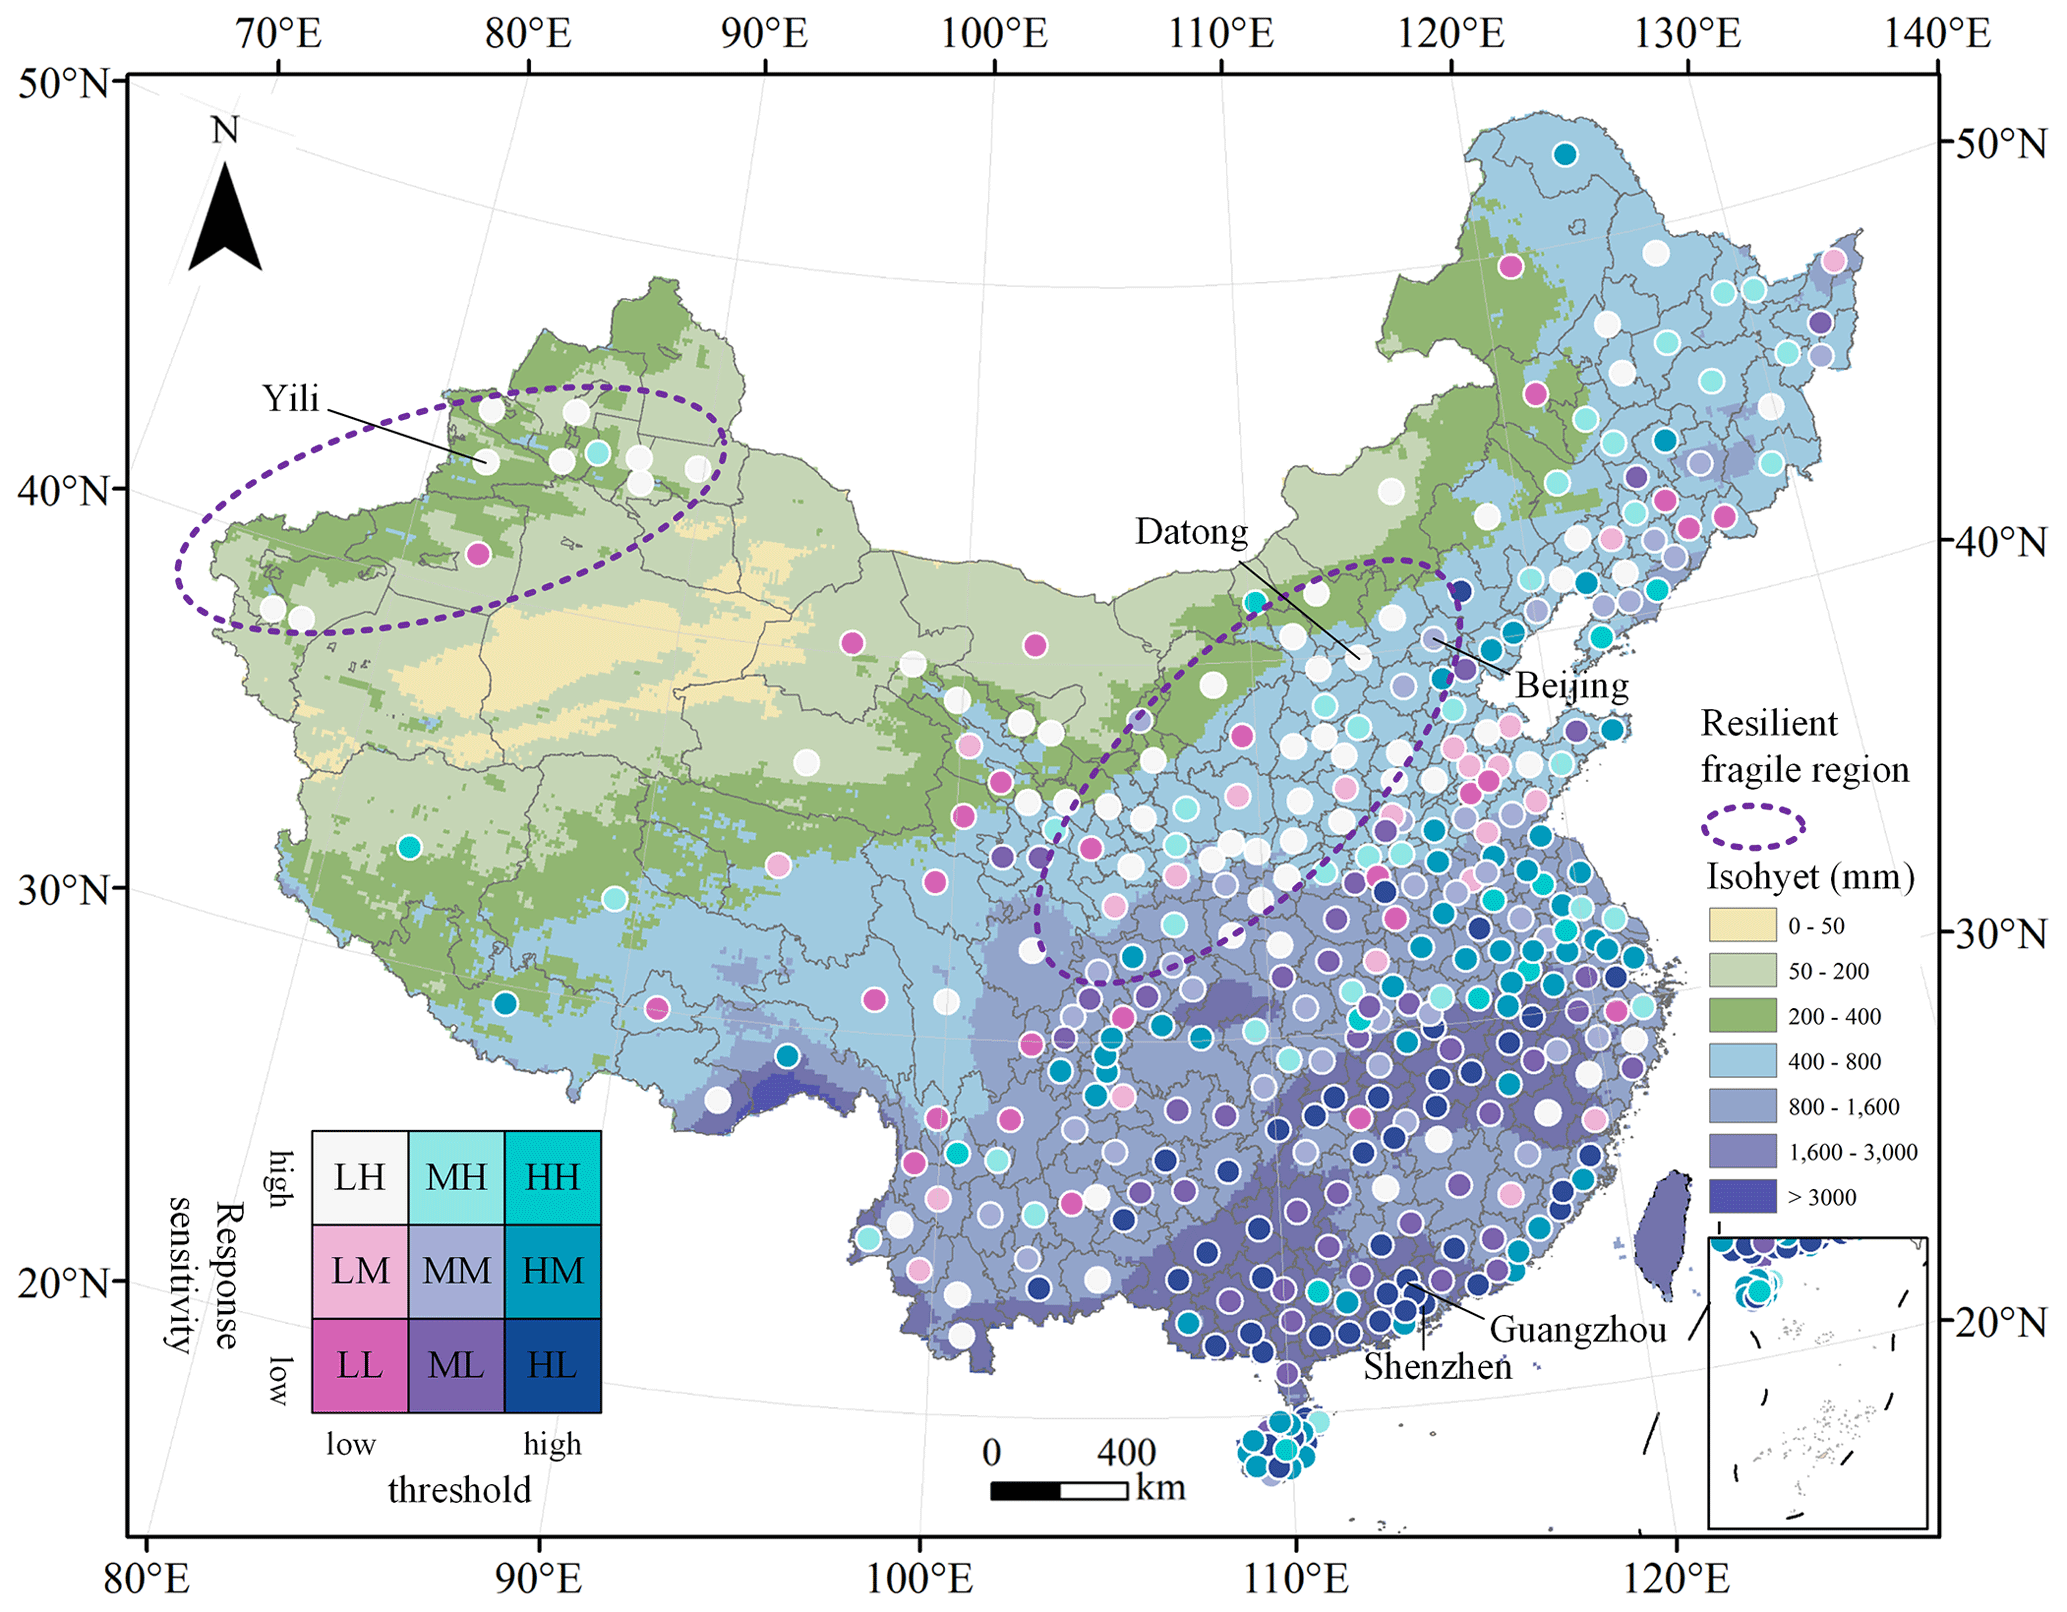
Figure 7Spatial distribution of urban resilience. The basemap colours indicate the 2017 annual rainfall.
The impacts of the peak rain intensity and duration on human activity vary across our study area as shown by the slopes of the decision boundary of different cities (Fig. 5d). In arid and semi-arid northwestern China, the slope is close to zero, showing the public response is mainly affected by peak intensity. Residents in northwestern China may adjust their activities in response to the rain peak intensity as rains in this area seldom last long. By contrast, the slope is high for the southeastern region, indicating the public's response is more affected by rainfall duration. The wet southeastern China usually receives frequent and heavy rains and residents have already adapted to it. Consequently, residents in this area may change their activities in response to rainfall duration more than to the peak intensity.
Results of the binary classification are solid as shown by the anomaly detection POD, FAR, and CSI values for different rainfall durations based on rainfall thresholds (Fig. S7). More specifically, the POD values for different rainfall durations in the 346 cities range from 0.71 to 1.00, the FAR values from 0 to 0.46, and the CSI values from 0.48 to 1.
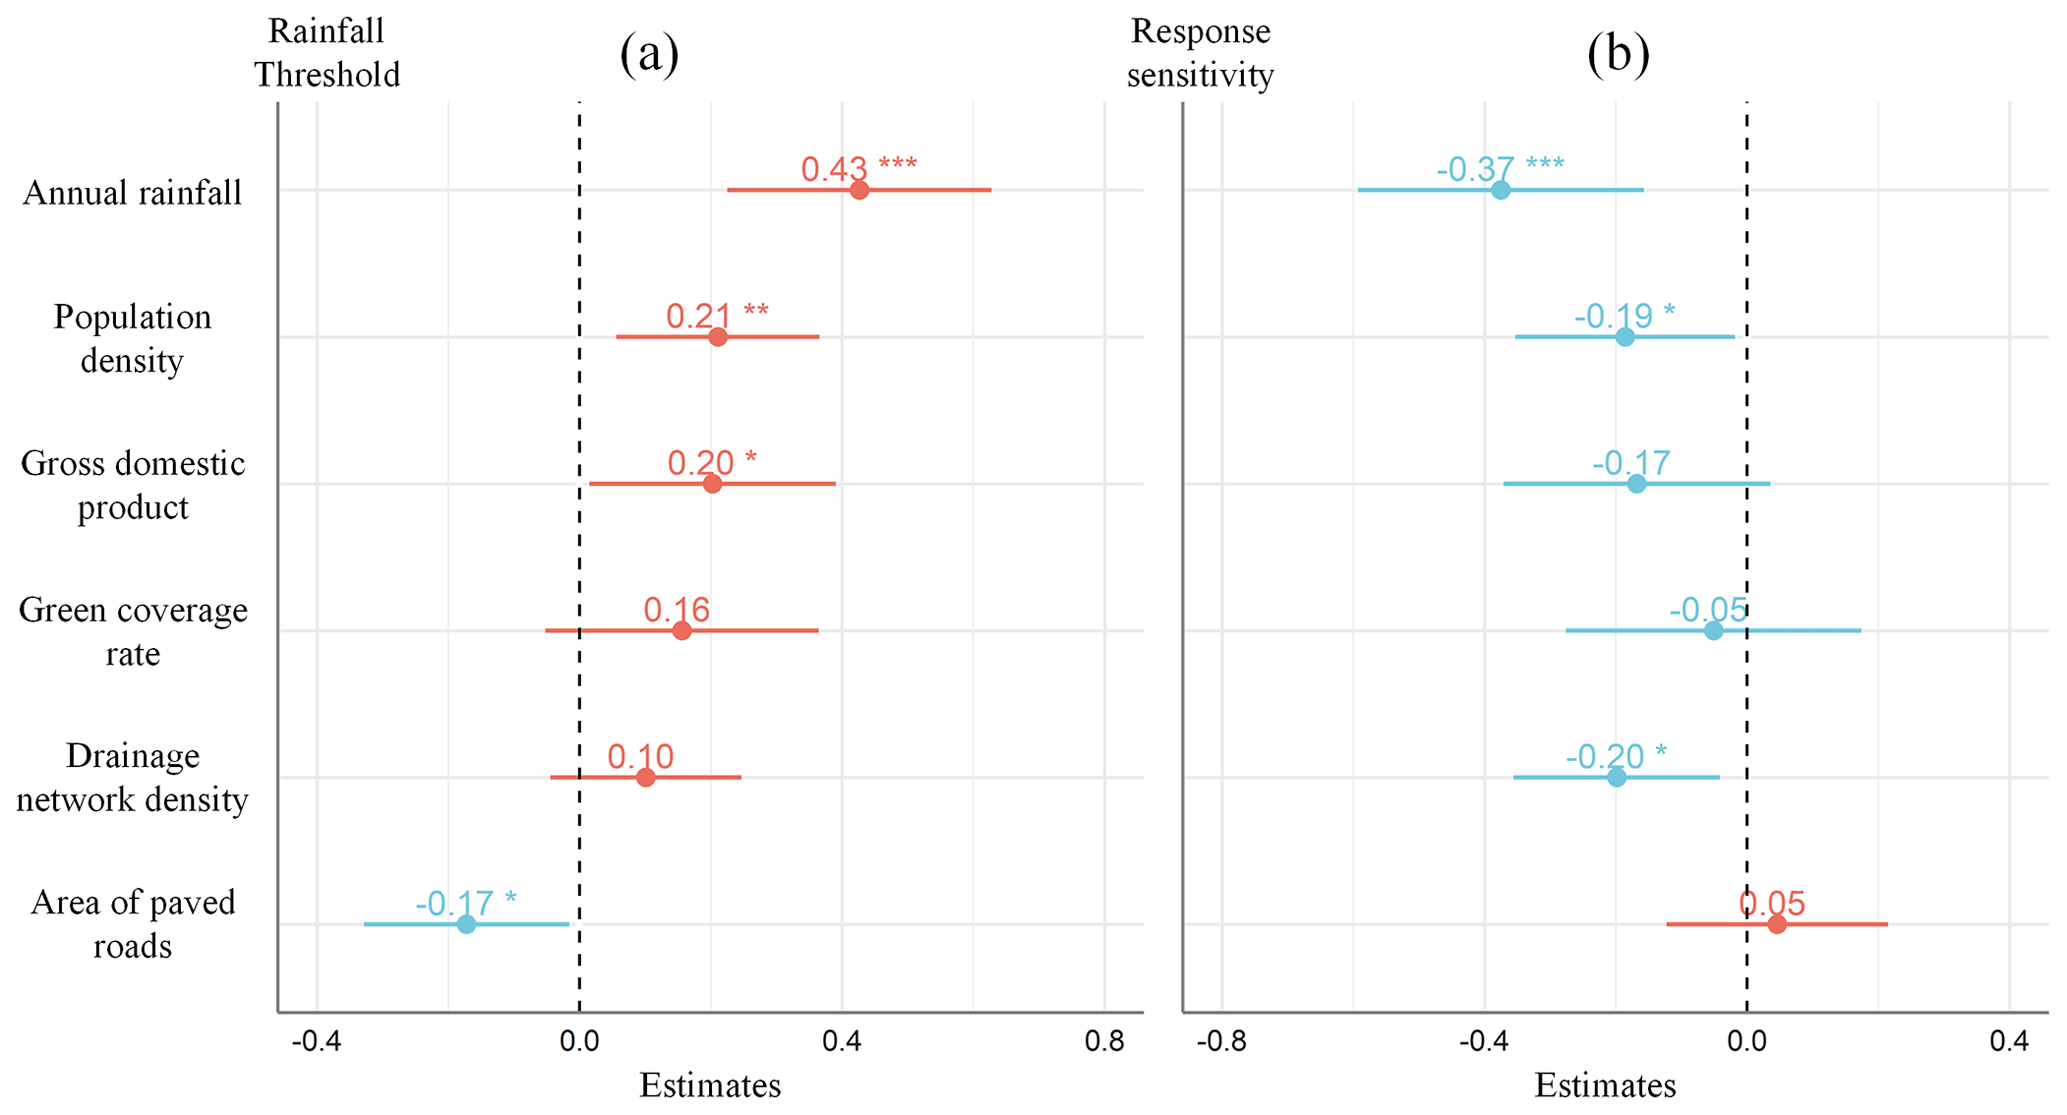
Figure 8Regression coefficients between the six explanatory variables and the 6 h rainfall threshold (a) and response sensitivity (b). The horizontal lines mean the 95 % confidence interval.
The other urban resilience indicator, the response sensitivity, is defined as the rate of the collective human activity anomalies triggered by a rainfall event and was extracted from multiple regression analysis. The response sensitivity is low on the southeastern coast and high in the northwestern inland, showing a trend opposite to that of the rainfall threshold (Fig. 6a). The higher response sensitivity in the northwest suggests that the residents in this area tend to change their activities more significantly in response to rains. By contrast, activities of the residents in the southeast are not significantly impacted by rains. Such findings are consistent with those derived from the rain threshold indicator. The accuracy of the regression model (the adjusted R2) also shows a similar trend to that of the response sensitivity (Fig. 6b), which indicates that the response mode of collective human activities to rainfall in the southeastern coastal area is more complex.
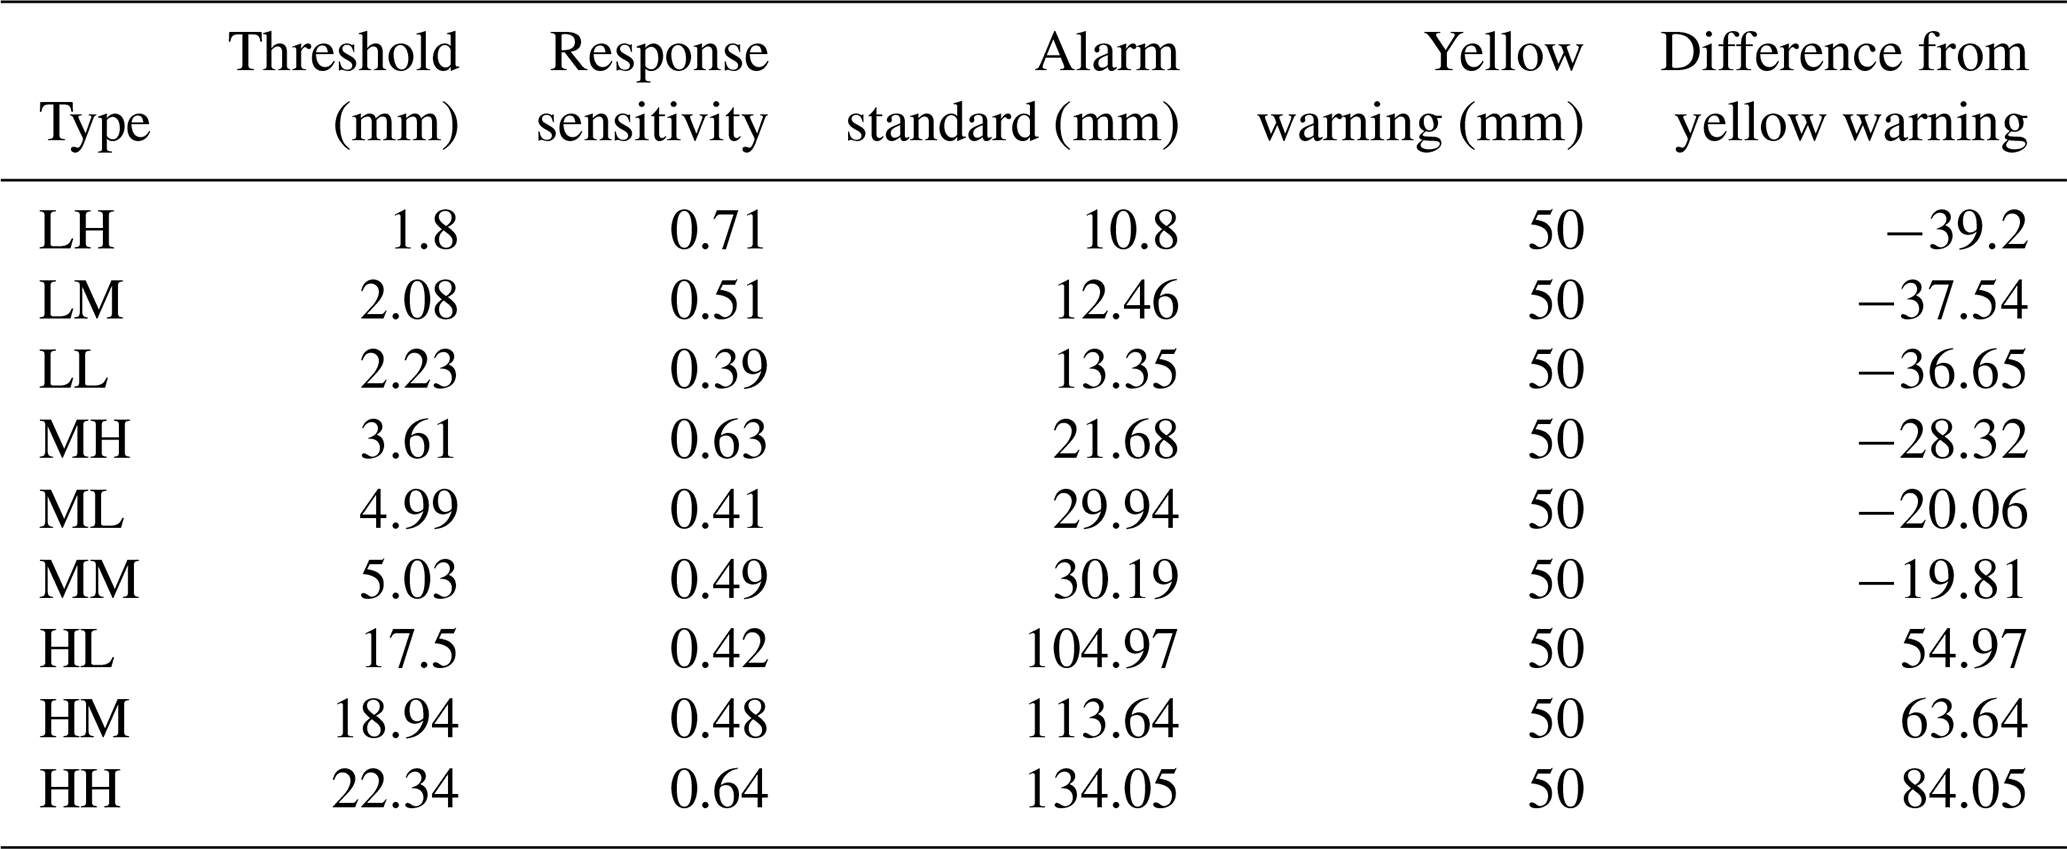
Table 1Urban resilience indices from this study for different city groups and the difference from the current yellow Chinese heavy-rain-alert standard. Note that the different types of urban resilience are defined in Fig. 7.
The associations between the two urban resilience indices also exhibit a significant pattern across our study area (Fig. 7). Cities located in the area with over 1600 mm annual precipitation are mainly categorized into type HL (threshold > 10.29 mm and response sensitivity < 0.003) and are surrounded by the ML and HM city types. The cities located in the areas with less than 400 mm annual precipitation are mainly classified into LH, MH, and LL types, indicating the annual precipitation has a significant impact on human activities in different cities.
The LH type cities have a low rainfall threshold (< 3.25 mm) and high response sensitivity (> 0.025). These cities are mainly found in the northwestern fragile region (mainly including the Yili prefecture in Xinjiang) and the central underdeveloped China (including Shaanxi, Shanxi, and Hebei provinces). Such cities may have underdeveloped infrastructure, and weaker rains could trigger human activity anomalies.
3.3 Associations between the urban resilience with the urban indicators
Results of multiple regression analysis show that variations in urban resilience by city could be explained by the variations in a variety of natural, socioeconomic, and urban infrastructure indicators. Figure 8a shows the relationship between rainfall thresholds and explanatory indicators. The 3, 6, and 12 h rainfall thresholds all show similar correlations with the indictors (Tables S2, S3, S4), and we only show the correlations between the 6 h rainfall and the indicators in this section.
All six explanatory variables are significantly correlated with the rainfall threshold (p<0.05). About 42 % of the variations in the rainfall threshold could be explained by the variations in the explanatory variables as shown by the R2 (Table 3). Among all explanatory variables, the annual rainfall has the highest coefficient value of 0.43, indicating the variations in the threshold are most affected by the annual rainfall. In other words, residents living in regions with different annual precipitation amounts are more likely to accordingly adjust their daily activities once the rainfall is over a specific threshold.
Other explanatory variables are also positively correlated with the threshold variable, as shown by the positive regression coefficients ranging from 0.21 to 0.10, except the per capita area of paved road, which is negatively correlated with the threshold. In fact, the per capita area of paved roads is the only indicator showing a negative correlation. Increased per capita area of paved road weakens rainwater infiltration capacity and increases surface runoff, which is more likely to cause traffic congestion and trigger human activity anomalies even when the rainfall amount is below a lower threshold.
Multi-regression analysis shows that the response sensitivity is negatively correlated with all explanatory variables, except for the per capita area of paved roads, which shows a positive regression coefficient (Fig. 8b). All correlations are statistically significant (p<0.05) (Table S5). About 31 % of the variations in the response sensitivity could be explained by the variations in the explanatory variables as shown by an R2 value of 0.31.
Residents in different cities may adjust and change their activities in different ways in response to rainfall. Such activity changes and adjustment, also known as urban resilience, could be characterized and studied from location-aware big data. In this study, we used Tencent aggregated location request data to examine the changes in collective human activities in major cities in China in response to rainfall over summer 2017. Our results show that the rainfall time, peak intensity, and duration are the three most important indicators that determine whether a rain event would trigger human activity anomalies or not. We also proposed two indices, the rainfall threshold and response sensitivity, to describe urban resilience; they show significant spatial variations across our study area. Furthermore, the unequal urban resilience could be explained by a series of explanatory variables.
We believe this paper provides a new perspective for studying urban resilience and that the results bridge the knowledge gap between heavy rains, collective human activities, and urban resilience. Such knowledge is of great significance to urban planning, traffic management, and emergency response.
We also believe this study has three other contributions regarding urban resilience research. First, this study expanded the research framework of urban resilience in response to high-frequency yet mild adverse events, and such a framework could be used to study the variations in urban resilience across a large area. Previous studies have mainly focused on urban resilience to a specific adverse event such as a typhoon or a hurricane. For example, Zou et al. (2018) used a normalized ratio index to assess the regional variations in urban resilience to Hurricane Sandy. In this study, we examined urban resilience to rains over a relatively long period and across a large area. Such a study can better show how residents in different regions change their activities in different ways in response to rains with different durations, peak intensities, and accumulative rainfall levels.
Secondly, our research analysed the impacts of different features of the rainfall events on human activities. Previous studies have often simply characterized a disaster using its threat levels. For example, Zou et al. (2018) used the average hurricane track kernel density and its wind speed to define the threat levels. In this study, instead, we extracted five major elements of a rainfall event and employed the random forest model to study the impacts of different elements on collective human activities.
Thirdly, we used the rainfall threshold to quantify urban resilience, and the threshold is valuable for authorities to revise heavy-rain alerts. Conventionally, heavy-rain alerts are usually based on rainfall intensity and precipitation only and seldom consider the areal difference in infrastructures. According to current Chinese standards, Chinese authorities issue a blue, yellow, and orange alert when precipitation is or will be over 50 mm in 12, 6, and 3 h and the rain might not stop (Mendiondo, 2005). A red alert is issued when precipitation is or will be over 100 mm in 3 h and the rain might not stop. Results from this study show that it is not appropriate to apply such a unified alert standard to different groups of cities across China. In the less resilient, fragile areas (Fig. 7), for instance, a rainfall event with 3.25 mm of precipitation per hour (i.e. 19.5 mm in 6 h) already triggers significant human activity anomalies. As a result, the national heavy-rain-alert standard significantly underestimates the impacts of rainfall on the residents in northwestern and central China.
Table 1 shows the precipitation thresholds of different city groups that trigger human activity anomalies and the 6 h accumulative precipitation based on which a heavy-rain warning should be issued. For example, for the LH cities, a rainfall intensity of 1.8 mm and 6 h accumulative precipitation of 10.8 mm should trigger a yellow heavy-rain warning. Such a value of the 6 h accumulative precipitation is much lower than the current yellow Chinese heavy-rain-warning standard (50 mm in 6 h). By contrast, for the HH cities, the rainfall threshold and 6 h accumulative precipitation that trigger human activity anomalies are 22.34 and 134.05 mm, respectively. The accumulative precipitation is much higher than the yellow heavy-rain-warning standard. In other words, it is amateurish to issue a heavy-rain warning when the 6 h accumulative precipitation is 50 mm for the HH cities. Results from this study therefore are of great value for the authorities who revise heavy-rain alerts across China to help local residents be better prepared for such adverse events.
The study could be expanded. Rather than representing all the residents of a city, the Tencent location request dataset is generated by over 1 billion monthly active users. The Tencent dataset's aggregate geotagged human activities may underestimate the effects of rainstorms on infrequent users, particularly the elderly and children. To address this limitation and further investigate human responses to various weather events, our future studies will aim to integrate multisource geospatial datasets. Furthermore, identifying disaster types such as rainstorm, waterlogging, and flood from social media data and then analysing the regional response variation in large-scale human activity in different disasters can improve deep understanding of urban resilience.
All codes can be provided by the corresponding authors upon request.
The information can be made available upon request to the corresponding author.
The supplement related to this article is available online at: https://doi.org/10.5194/nhess-23-317-2023-supplement.
JQ, YD, JY, and FL conceived and designed the study and methods; JQ, JY, YD, NW, TM, and TP analysed the data; JQ, FL, YD, and JY wrote the paper, and all co-authors contributed to the interpretation of the results and to the text. All authors read the manuscript and approved its submission.
The contact author has declared that none of the authors has any competing interests.
Publisher’s note: Copernicus Publications remains neutral with regard to jurisdictional claims in published maps and institutional affiliations.
This research was jointly supported by the Strategic Priority Research Program of the Chinese Academy of Sciences (grant no. XDA19040501), the National Key Research and Development Program of China (grant no. 2017YFC1503003), and the National Science Foundation of China (grant nos. 42176205 and 41901395).
This paper was edited by Paola Reichenbach and reviewed by three anonymous referees.
Adger, W. N., Hughes, T. P., Folke, C., Carpenter, S. R., and Rockström, J.: Social-Ecological Resilience to Coastal Disasters, Science, 309, 1036–1039, https://doi.org/10.1126/science.1112122, 2005.
Aerts, J. C. J. H., Botzen, W. J. W., Emanuel, K., Lin, N., de Moel, H., and Michel-Kerjan, E. O.: Evaluating Flood Resilience Strategies for Coastal Megacities, Science, 344, 473–475, https://doi.org/10.1126/science.1248222, 2014.
Ambelu, A., Birhanu, Z., Tesfaye, A., Berhanu, N., Muhumuza, C., Kassahun, W., Daba, T., and Woldemichael, K.: Intervention pathways towards improving the resilience of pastoralists: A study from Borana communities, southern Ethiopia, Weather Clim. Extrem., 17, 7–16, https://doi.org/10.1016/j.wace.2017.06.001, 2017.
Bertilsson, L., Wiklund, K., de Moura Tebaldi, I., Rezende, O. M., Veról, A. P., and Miguez, M. G.: Urban flood resilience – A multi-criteria index to integrate flood resilience into urban planning, J. Hydrol., 573, 970–982, https://doi.org/10.1016/j.jhydrol.2018.06.052, 2019.
Brusberg, M. D. and Shively, R.: Building drought resilience in agriculture: Partnerships and public outreach, Weather Clim. Extrem., 10, 40–49, https://doi.org/10.1016/j.wace.2015.10.003, 2015.
Buehler, Y. A., Kellenberger, T. W., Small, D., and Itten, K. I.: Rapid mapping with remote sensing data during flooding 2005 in Switzerland by object-based methods: a case study, in: Geo-Environment and Landscape Evolution II: Monitoring, Simulation, Management and Remediation, GEO-ENVIRONMENT 2006, Rhodes, Greece, 391–400, https://doi.org/10.2495/GEO060391, 2006.
Chan, F. K. S., Griffiths, J. A., Higgitt, D., Xu, S., Zhu, F., Tang, Y.-T., Xu, Y., and Thorne, C. R.: “Sponge City” in China – A breakthrough of planning and flood risk management in the urban context, Land Use Pol., 76, 772–778, https://doi.org/10.1016/j.landusepol.2018.03.005, 2018.
Cleveland, R., Cleveland, W., McRae, J. E., and Terpenning, I. J.: STL: A seasonal-trend decomposition procedure based on loess (with discussion), undefined, J. Off. Stat., 1990, 6, 3–73, 1990.
de Bruijn, K. M.: Resilience and flood risk management, Water Pol., 6, 53–66, https://doi.org/10.2166/wp.2004.0004, 2004.
Dewan, T. H.: Societal impacts and vulnerability to floods in Bangladesh and Nepal, Weather Clim. Extrem., 7, 36–42, https://doi.org/10.1016/j.wace.2014.11.001, 2015.
Geller, S. C., Gregg, J. P., Hagerman, P., and Rocke, D. M.: Transformation and normalization of oligonucleotide microarray data, Bioinformatics, 19, 1817–1823, https://doi.org/10.1093/bioinformatics/btg245, 2003.
Ghaffarian, S., Kerle, N., and Filatova, T.: Remote Sensing-Based Proxies for Urban Disaster Risk Management and Resilience: A Review, Remote Sens., 10, 1760, https://doi.org/10.3390/rs10111760, 2018.
Grinberger, A. Y. and Felsenstein, D.: Dynamic agent based simulation of welfare effects of urban disasters, Computers, Environ. Urban Syst., 59, 129–141, https://doi.org/10.1016/j.compenvurbsys.2016.06.005, 2016.
Guan, X. and Chen, C.: Using social media data to understand and assess disasters, Nat. Hazards, 74, 837–850, https://doi.org/10.1007/s11069-014-1217-1, 2014.
Honey, M., Brink, S., Chang, S., Davidson, R., Amyx, P., Pyatt, S., Mills, R., Eguchi, R., Bevington, J., Panjwani, D., Hill, A., and Adams, B.: Uncovering Community Disruption Using Remote Sensing: An Assessment of Early Recovery in Post-earthquake Haiti, Disaster Research Center, Miscellaneous Report #69; University of Delaware, Disaster Research Center: Newark, DE, USA, 2010.
Hong, B., Bonczak, B. J., Gupta, A., and Kontokosta, C. E.: Measuring inequality in community resilience to natural disasters using large-scale mobility data, Nat. Commun., 12, 1870, https://doi.org/10.1038/s41467-021-22160-w, 2021.
Huang, W. and Ling, M.: System resilience assessment method of urban lifeline system for GIS, Computers, Environ. Urban Syst., 71, 67–80, https://doi.org/10.1016/j.compenvurbsys.2018.04.003, 2018.
Kasmalkar, I. G., Serafin, K. A., Miao, Y., Bick, I. A., Ortolano, L., Ouyang, D., and Suckale, J.: When floods hit the road: Resilience to flood-related traffic disruption in the San Francisco Bay Area and beyond, Sci. Adv., 6, eaba2423, https://doi.org/10.1126/sciadv.aba2423, 2020.
Kryvasheyeu, Y., Chen, H., Obradovich, N., Moro, E., and Hentenryck, P. V.: Rapid assessment of disaster damage using social media activity, Sci. Adv., 2, e1500779, https://doi.org/10.1126/sciadv.1500779, 2016.
Levizzani, V., Kidd, C., Kirschbaum, D. B., Kummerow, C. D., Nakamura, K., and Turk, F. J.: Satellite Precipitation Measurement, Springer Nature, 500 pp., Springer Nature: Dordrecht, The Netherlands, 2020.
Liao, K.-H.: A Theory on Urban Resilience to Floods–A Basis for Alternative Planning Practices, E&S, 17, art48, https://doi.org/10.5751/ES-05231-170448, 2012.
Liaw, A. and Wiener, M.: Classification and Regression by RandomForest, Forest, 23, https://doi.org/10.1021/ci034160g, 2001.
Liu, Y., Liu, X., Gao, S., Gong, L., Kang, C., Zhi, Y., Chi, G., and Shi, L.: Social Sensing: A New Approach to Understanding Our Socioeconomic Environments, Ann. Assoc. Am. Geogr., 105, 512–530, 2015.
Liu, Z., Du, Y., Yi, J., Liang, F., Ma, T., and Pei, T.: Quantitative Association between Nighttime Lights and Geo-Tagged Human Activity Dynamics during Typhoon Mangkhut, Remote Sens., 11, 2091, https://doi.org/10.3390/rs11182091, 2019a.
Liu, Z., Du, Y., Yi, J., Liang, F., and Pei, T.: Quantitative estimates of collective geo-tagged human activities in response to typhoon Hato using location-aware big data, Int. J. Dig. Earth, 1–21, https://doi.org/10.1080/17538947.2019.1645894, 2019b.
Ma, T.: Multi-Level Relationships between Satellite-Derived Nighttime Lighting Signals and Social Media–Derived Human Population Dynamics, Remote Sens., 10, 1128, https://doi.org/10.3390/rs10071128, 2018.
Marra, F., Nikolopoulos, E. I., Creutin, J. D., and Borga, M.: Space–time organization of debris flows-triggering rainfall and its effect on the identification of the rainfall threshold relationship, J. Hydrol., 541, 246–255, https://doi.org/10.1016/j.jhydrol.2015.10.010, 2016.
Martín, Y., Cutter, S. L., and Li, Z.: Bridging Twitter and Survey Data for Evacuation Assessment of Hurricane Matthew and Hurricane Irma, Nat. Hazards Rev., 21, 04020003, https://doi.org/10.1061/(ASCE)NH.1527-6996.0000354, 2020a.
Martín, Y., Cutter, S. L., Li, Z., Emrich, C. T., and Mitchell, J. T.: Using geotagged tweets to track population movements to and from Puerto Rico after Hurricane Maria, Popul. Environ., 42, 4–27, https://doi.org/10.1007/s11111-020-00338-6, 2020b.
McDougall, K. and Temple-Watts, P.: THE USE OF LIDAR AND VOLUNTEERED GEOGRAPHIC INFORMATION TO MAP FLOOD EXTENTS AND INUNDATION, ISPRS Ann. Photogramm. Remote Sens. Spatial Inf. Sci., I–4, 251–256, https://doi.org/10.5194/isprsannals-I-4-251-2012, 2012.
Meerow, S., Newell, J. P., and Stults, M.: Defining urban resilience: A review, Landsc. Urban Plan., 147, 38–49, https://doi.org/10.1016/j.landurbplan.2015.11.011, 2016.
Mendiondo, E. M.: FLOOD RISK MANAGEMENT OF URBAN WATERS IN HUMID TROPICS: EARLY WARNING, PROTECTION AND REHABILITATION, 14, in: Proceedings of the Workshop on Integrated Urban Water Managmt in Humid Tropics, Foz de Iguaçu, Brazil, 2–3 April 2005, 2–3 pp., 2005.
Mika, S., Ratsch, G., Weston, J., Scholkopf, B., and Mullers, K. R.: Fisher discriminant analysis with kernels, in: Neural Networks for Signal Processing IX: Proceedings of the 1999 IEEE Signal Processing Society Workshop (Cat. No.98TH8468), 41–48, https://doi.org/10.1109/NNSP.1999.788121, 1999.
Mpandeli, S., Nhamo, L., Moeletsi, M., Masupha, T., Magidi, J., Tshikolomo, K., Liphadzi, S., Naidoo, D., and Mabhaudhi, T.: Assessing climate change and adaptive capacity at local scale using observed and remotely sensed data, Weather Clim. Extrem., 26, 100240, https://doi.org/10.1016/j.wace.2019.100240, 2019.
Myhre, G., Alterskjær, K., Stjern, C. W., Hodnebrog, Ø., Marelle, L., Samset, B. H., Sillmann, J., Schaller, N., Fischer, E., Schulz, M., and Stohl, A.: Frequency of extreme precipitation increases extensively with event rareness under global warming, Sci. Rep., 9, 16063, https://doi.org/10.1038/s41598-019-52277-4, 2019.
Nahiduzzaman, K. M., Aldosary, A. S., and Rahman, M. T.: Flood induced vulnerability in strategic plan making process of Riyadh city, Hab. Int., 49, 375–385, https://doi.org/10.1016/j.habitatint.2015.05.034, 2015.
Naidu, S., Sajinkumar, K. S., Oommen, T., Anuja, V. J., Samuel, R. A., and Muraleedharan, C.: Early warning system for shallow landslides using rainfall threshold and slope stability analysis, Geosci. Front., 9, 1871–1882, https://doi.org/10.1016/j.gsf.2017.10.008, 2018.
Ogie, R. I., Holderness, T., Dunn, S., and Turpin, E.: Assessing the vulnerability of hydrological infrastructure to flood damage in coastal cities of developing nations, Comput., Environ. Urban Syst., 68, 97–109, https://doi.org/10.1016/j.compenvurbsys.2017.11.004, 2018.
Olsson, L., Jerneck, A., Thoren, H., Persson, J., and O'Byrne, D.: Why resilience is unappealing to social science: Theoretical and empirical investigations of the scientific use of resilience, Sci. Adv., 1, e1400217, https://doi.org/10.1126/sciadv.1400217, 2015.
Östh, J., Reggiani, A., and Galiazzo, G.: Spatial economic resilience and accessibility: A joint perspective, Computers, Environ. Urban Syst., 49, 148–159, https://doi.org/10.1016/j.compenvurbsys.2014.07.007, 2015.
O'Sullivan, J. J., Bradford, R. A., Bonaiuto, M., De Dominicis, S., Rotko, P., Aaltonen, J., Waylen, K., and Langan, S. J.: Enhancing flood resilience through improved risk communications, Nat. Hazards Earth Syst. Sci., 12, 2271–2282, https://doi.org/10.5194/nhess-12-2271-2012, 2012.
Ouyang, M., Dueñas-Osorio, L., and Min, X.: A three-stage resilience analysis framework for urban infrastructure systems, Struct. Safe., 36–37, 23–31, https://doi.org/10.1016/j.strusafe.2011.12.004, 2012.
Owrangi, A. M., Lannigan, R., and Simonovic, S. P.: Interaction between land-use change, flooding and human health in Metro Vancouver, Canada, Nat. Hazards, 72, 1219–1230, https://doi.org/10.1007/s11069-014-1064-0, 2014.
Pal, M.: Random forest classifier for remote sensing classification, Int. J. Remote Sens., 26, 217–222, https://doi.org/10.1080/01431160412331269698, 2005.
Poulin, C. and Kane, M. B.: Infrastructure resilience curves: Performance measures and summary metrics, Reliab. Eng. Syst. Safet., 216, 107926, https://doi.org/10.1016/j.ress.2021.107926, 2021.
Qian, J., Liu, Z., Du, Y., Wang, N., Yi, J., Sun, Y., Ma, T., Pei, T., and Zhou, C.: Multi-level Inter-regional Migrant Population Estimation Using Multi-source Spatiotemporal Big Data: A Case Study of Migrants in Hubei Province During the Outbreak of COVID-19 in Wuhan, in: Mapping COVID-19 in Space and Time: Understanding the Spatial and Temporal Dynamics of a Global Pandemic, edited by: Shaw, S.-L. and Sui, D., Springer International Publishing, Cham, 169–188, https://doi.org/10.1007/978-3-030-72808-3_9, 2021a.
Qian, J., Liu, Z., Du, Y., Liang, F., Yi, J., Ma, T., and Pei, T.: Quantify city-level dynamic functions across China using social media and POIs data, Comput. Environ. Urban Syst., 85, 101552, https://doi.org/10.1016/j.compenvurbsys.2020.101552, 2021b.
Qian, J., Du, Y., Yi, J., Liang, F., Huang, S., Wang, X., Wang, N., Tu, W., Pei, T., and Ma, T.: Regional geographical and climatic environments affect urban rainstorm perception sensitivity across China, Sustain. Cities Soc., 87, 104213, https://doi.org/10.1016/j.scs.2022.104213, 2022.
Román, M., Stokes, E., Shrestha, R., Wang, Z., Schultz, L., Carlo, E., Sun, Q., Bell, J., Molthan, A., Kalb, V., ji, C., Seto, K., Mcclain, S., and Enenkel, M.: Satellite-based assessment of electricity restoration efforts in Puerto Rico after Hurricane Maria, PLOS ONE, 14, e0218883, https://doi.org/10.1371/journal.pone.0218883, 2019.
Rosner, B.: On the Detection of Many Outliers, null, Technometrics, 17, 221–227, https://doi.org/10.2307/1268354, 1975.
Shiferaw, B., Tesfaye, K., Kassie, M., Abate, T., Prasanna, B. M., and Menkir, A.: Managing vulnerability to drought and enhancing livelihood resilience in sub-Saharan Africa: Technological, institutional and policy options, Weather Clim. Extrem., 3, 67–79, https://doi.org/10.1016/j.wace.2014.04.004, 2014.
Song, J., Chang, Z., Li, W., Feng, Z., Wu, J., Cao, Q., and Liu, J.: Resilience-vulnerability balance to urban flooding: A case study in a densely populated coastal city in China, Cities, 95, 102381, https://doi.org/10.1016/j.cities.2019.06.012, 2019.
Stefan, V., Fabio, G.-T., Josh, L., Jan, K., and Brenda, J.: Global Trends in Satellite-based Emergency Mapping, Science, 353, 247–252, 2016.
Strobl, C., Boulesteix, A.-L., Zeileis, A., and Hothorn, T.: Bias in random forest variable importance measures: Illustrations, sources and a solution, BMC Bioinfo., 8, 25, https://doi.org/10.1186/1471-2105-8-25, 2007.
Tellman, B., Sullivan, J. A., Kuhn, C., Kettner, A. J., Doyle, C. S., Brakenridge, G. R., Erickson, T. A., and Slayback, D. A.: Satellite imaging reveals increased proportion of population exposed to floods, Nature, 596, 80–86, https://doi.org/10.1038/s41586-021-03695-w, 2021.
Vallis, O., Hochenbaum, J., and Kejariwal, A.: A Novel Technique for Long-Term Anomaly Detection in the Cloud, 6th { USENIX} Workshop on Hot Topics in Cloud Computing (HotCloud 14), 15 pp., https://doi.org/10.5555/2696535.2696550, 2014.
Wang, B., Loo, B. P. Y., Zhen, F., and Xi, G.: Urban resilience from the lens of social media data: Responses to urban flooding in Nanjing, China, Cities, 106, 102884, https://doi.org/10.1016/j.cities.2020.102884, 2020.
Wang, J., Meng, B., Pei, T., Du, Y., Zhang, J., Chen, S., Tian, B., and Zhi, G.: Mapping the exposure and sensitivity to heat wave events in China's megacities, Sci. Total Environ., 755, 142734, https://doi.org/10.1016/j.scitotenv.2020.142734, 2021.
Wang, N., Du, Y., Liang, F., Yi, J., and Wang, H.: Spatiotemporal Changes of Urban Rainstorm-Related Micro-Blogging Activities in Response to Rainstorms: A Case Study in Beijing, China, Appl. Sci., 9, 4629, https://doi.org/10.3390/app9214629, 2019.
Wang, Y. and Taylor, J. E.: Coupling sentiment and human mobility in natural disasters: a Twitter-based study of the 2014 South Napa Earthquake, Nat. Hazards, 92, 907–925, https://doi.org/10.1007/s11069-018-3231-1, 2018.
Yabe, T., Tsubouchi, K., Fujiwara, N., Sekimoto, Y., and Ukkusuri, S. V.: Understanding post-disaster population recovery patterns, J. Roy. Soc. Inter., 17, 20190532, https://doi.org/10.1098/rsif.2019.0532, 2020.
Yi, J., Du, Y., Liang, F., Pei, T., Ma, T., and Zhou, C.: Anomalies of dwellers' collective geotagged behaviors in response to rainstorms: a case study of eight cities in China using smartphone location data, Nat. Hazards Earth Syst. Sci., 19, 2169–2182, https://doi.org/10.5194/nhess-19-2169-2019, 2019.
Yue, Y., Zhuang, Y., Yeh, A. G. O., Xie, J.-Y., Ma, C.-L., and Li, Q.-Q.: Measurements of POI-based mixed use and their relationships with neighbourhood vibrancy, Int. J. Geogr. Info. Sci., 31, 658–675, https://doi.org/10.1080/13658816.2016.1220561, 2017.
Zhang, R., Chen, Y., Zhang, X., Ma, Q., and Ren, L.: Mapping homogeneous regions for flash floods using machine learning: A case study in Jiangxi province, China, Int. J. Appl. Earth Observ. Geoinfo., 108, 102717, https://doi.org/10.1016/j.jag.2022.102717, 2022.
Zheng, S., Wang, J., Sun, C., Zhang, X., and Kahn, M. E.: Air pollution lowers Chinese urbanites' expressed happiness on social media, Na. Human Behav., 3, 237–243, https://doi.org/10.1038/s41562-018-0521-2, 2019.
Zou, L., Lam, N., Cai, H., and Qiang, Y.: Mining Twitter Data for Improved Understanding of Disaster Resilience, Ann. Assoc. Am. Geogr., 108, 1422–1441, https://doi.org/10.1080/24694452.2017.1421897, 2018.
Zou, L., Lam, N. S. N., Shams, S., Cai, H., Meyer, M. A., Yang, S., Lee, K., Park, S.-J., and Reams, M. A.: Social and geographical disparities in Twitter use during Hurricane Harvey, Int. J. Dig. Earth, 12, 1300–1318, https://doi.org/10.1080/17538947.2018.1545878, 2019.