the Creative Commons Attribution 4.0 License.
the Creative Commons Attribution 4.0 License.
 | 06 Sep 2023
Fire risk modeling: an integrated and data-driven approach applied to Sicily
Alba Marquez Torres
Giovanni Signorello
Sudeshna Kumar
Greta Adamo
Ferdinando Villa
Stefano Balbi
Wildfires are key not only to landscape transformation and vegetation succession, but also to socio-ecological values loss. Fire risk mapping can help to manage the most vulnerable and relevant ecosystems impacted by wildfires. However, few studies provide accessible daily dynamic results at different spatio-temporal scales. We develop a fire risk model for Sicily (Italy), an iconic case of the Mediterranean Basin, integrating a fire hazard model with an exposure and vulnerability analysis under present and future conditions. The integrated model is data-driven but can run dynamically at a daily time step, providing spatially and temporally explicit results through the k.LAB (Knowledge Laboratory) software. This software provides an environment for input data integration, combining methods and data such as geographic information systems, remote sensing and Bayesian network algorithms. All data and models are semantically annotated, open and downloadable in agreement with the FAIR principles (findable, accessible, interoperable and reusable). The fire risk analysis reveals that 45 % of vulnerable areas of Sicily have a high probability of fire occurrence in 2050. The risk model outputs also include qualitative risk indexes, which can make the results more understandable for non-technical stakeholders. We argue that this approach is well suited to aiding in landscape and fire risk management, under both current and climate change conditions.
- Article
(3153 KB) - Full-text XML
-
Supplement
(1336 KB) - BibTeX
- EndNote


Fire, as a natural disturbance, has played an important role in shaping forest structure, increasing biodiversity and leading species' evolution (Bond and Keeley, 2005; Pausas et al., 2004; Kelly and Brotons, 2017). However, the balance between the natural fire regime and the ecosystem is often disrupted when humans modify the environment to their needs. In recent years, the rural depopulation and simultaneous spread of urban areas in the form of residential buildings into the countryside have increased fire frequency and burned areas (Faivre et al., 2014; Robinne et al., 2016). Although this is a worldwide problem, the Mediterranean climatic area has experienced a particularly great impact (Kocher and Butsic, 2017; Leone et al., 2009; Pausas and Fernández-Muñoz, 2012).
Sicily (Italy), the largest island of the Mediterranean Sea with 25 711 km2, has been the cradle of several civilizations and their traditions, with continuous and intense human exploitation of natural resources (forestry, grazing, agriculture) (Antrop, 2005; Sereni, 1961), encompassing multiple agricultural and agroforestry landscapes (Baiamonte et al., 2015; Di Maida, 2020). Due to its great variability in topography, lithology, pedology (Catalano et al., 1996) and climate (Bazan et al., 2015), Sicily is rich in biodiversity and ecosystems (Cullotta and Marchetti, 2007; Peruzzi et al., 2014). Therefore, the island can be viewed as representative of the Mediterranean Basin as a whole.
Moreover, Sicily is the most populated island in the Mediterranean Sea with nearly 5 million inhabitants, similar to Denmark or Finland (Planistat Europe and Bradley Dunbar Association, 2003). As a consequence, year after year the environment has undergone degradation due to an increase in intensive farming practices, urbanization growth in the most populated and tourist areas, and the loss of traditional agricultural and forest management because of rural population abandonment (Bazan et al., 2019; Falcucci et al., 2007; Prestia and Scavone, 2018). In the last 50 years, the increase in forest and scrub mass due to the abandonment of traditional land management (Bonanno, 2013; Ragusa and Rapicavoli, 2017) and the increase in the frequency of long droughts created optimal conditions for the occurrence of wildfires (Mouillot et al., 2005; Ruffault et al., 2020). The population living in the wildland–urban interface zone is particularly at risk due to exposure to fire and difficulty in evacuation.
Uncontrolled wildfires in Sicily have increased in recent years, making Sicily the Italian region with the highest number of fire events and the largest burned area between 2009 and May 2016 (Fig. 1). The probability of fire occurrence is mainly linked to ignition sources, forest fuels and environmental conditions (Ganteaume et al., 2013; Hantson et al., 2015; Ricotta and Di Vito, 2014). The ignition sources are usually divided into natural causes (mainly lightning but geological causes too) and human (accidental or intentional) (Aldersley et al., 2011; Ganteaume et al., 2013; Rodrigues and de la Riva, 2014). The main causes of wildfires in Sicily are human-driven (Corrao, 1992; Ferrara et al., 2019). Arson and accidental wildfires, set up to create new pasture resources or to burn stubble, are the primary causes of wildfires, especially in areas where vegetation interfaces with urban structures.
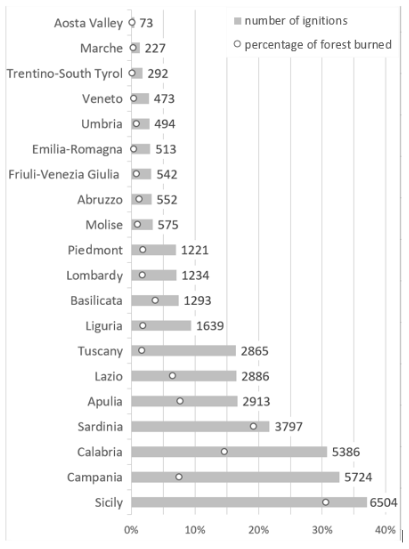
Figure 1Total number of fire ignitions and percentage of area burned (over 30 ha) in Italy by region between 2009 and May 2016. Source: fire activity statistics, Servizi Antincendio Boschivo (Italian fire services).
The consequences of wildfires exceed the loss of forest cover, vary over time and can be long-lasting. Some ecosystem properties and functions that deliver benefits to humans (Daily, 1997; Roces-Díaz et al., 2022), including biodiversity, may be lost. This diminishment might happen when natural fire regimes and forest ecosystems are strongly altered by human intervention (Tedim et al., 2020; Arno and Brown, 1991), leading to an increase in fire extent, intensity and severity (Pausas et al., 2008; Regos et al., 2014; Castellnou et al., 2019). For example, after the wildfires in summer, with the arrival of the first heavy rains, there can be extensive erosion in burned areas, loss of organic matter or pollution of adjacent waterbodies (Bisson et al., 2005; Certini, 2005). In general, burned areas lose their carbon sequestration capacity and desirability for outdoor recreation (Moreira and Russo, 2007).
The literature on fire modeling at different spatio-temporal scales is vast (Ganteaume et al., 2013; Jain et al., 2020; Tymstra et al., 2020). Due to its drought sensitivity, most studies focus on the Mediterranean climatic region (Oliveira et al., 2012; Satir et al., 2016; Wittenberg and Malkinson, 2009). Among the different methods applied, machine learning models are gaining traction due to increased computing power and data access. Many algorithms have been tested, including artificial neural networks, support vector machines, maximum entropy and random forest (Jain et al., 2020).
Risk fire mapping has been one of the most widely studied approaches in the forest fire literature. Even so, many models have become obsolete and have not been renewed (Ager and Finney, 2010; Mohajane et al., 2021). Their spatio-temporal resolutions are too coarse (Lozano et al., 2017), or they do not take into account the distribution of forest fuel types (Bacciu et al., 2021; Michael et al., 2021), which is essential for risk reduction (Castellnou et al., 2019). Moreover, risk conditions for society are induced by progressive changes in environmental conditions. For this reason, it is indispensable to create open models that can incorporate new transdisciplinary data and knowledge (Nikolakis and Roberts, 2022; Wunder et al., 2021) that have arisen since 2016 (Artés et al., 2019; Duane et al., 2021).
On the society side, knowledge plays a key role in risk reduction, decision-making, coordinated policy action and re-learning with regard to fire. Vulnerability is associated with a lack of risk communication, especially a lack of sufficient information that can lead to a misunderstanding of risk (Birkmann et al., 2010). This has important implications for motivation and the perceptual capacity to act and adapt to climate change (Grothmann and Patt, 2005). Moreover, understanding the fire risk processes can help society to comprehend the landscape transformation needed for a lower-risk environment (Otero et al., 2018). Although efforts are being made, few resources are allocated to the accessibility, sharing and integration of knowledge at multiple scales across different stakeholders (Weichselgartner and Pigeon, 2015). Therefore, it is crucial to develop accessible tools and methods for fire risk assessment, where managers and stakeholders can consider social and environmental consequences.
Similarly, on the scientific side, lack of transparency has been one of the traditional characteristics of modeling (i.e., black-box model), even within the decision support system, leading to several scientific, organizational and ethical issues (Guidotti et al., 2018). Moreover, most of the models and resources developed by scientific research are not transferable or shared between different programming languages or modeling infrastructures. To connect scientific knowledge, we applied the integrated modeling approach of ARtificial Intelligence for Environment & Sustainability (ARIES; https://aries.integratedmodelling.org/, last access: 29 August 2023), which integrates a network of web-accessible data, models and other resources, implementing the FAIR principles (Wilkinson et al., 2016) through the k.LAB (Knowledge Laboratory) software, a semantic web-based modeling platform. The FAIR principles apply to the generated data and models, which must be
-
findable – simple to identify by humans and computers;
-
accessible – with easy access to metadata and resources stored;
-
interoperable – ready to be exchanged, interpreted and combined in a (semi-)automated way with other datasets;
-
reusable – sufficiently well described to be reused in future research and integrated with other data sources.
This study analyses wildfire activity for the years 2007–2020 to model fire risk in Sicily. We have adopted the definition of fire risk provided by the Sixth Assessment Report (AR6) of the IPCC (Intergovernmental Panel on Climate Change), i.e., the dynamic interaction between the components of “climate-related hazards with the exposure and vulnerability of the affected human or ecological system to the hazards” (IPCC, 2012). Thus, in this article, we focus on answering three questions: where are wildfires likely to occur? What ecosystem services might be affected? And what is the impact on the environment and society?
To this end, we have developed a set of models in the k.LAB software, and we integrated them into the ARIES network. These models are modular, interconnected and semantically explicit under k.LAB, where we simulated the current wildfires and their interaction with key human and biophysical drivers, using a machine learning algorithm. Furthermore, as proof of the advantages of using FAIR data and resources, it has been possible to analyze future fire risk under climate change and consider the consequences for different ecosystem services using models included in ARIES and developed by other experts.
2.1 Study area
A case study was carried out on the island of Sicily, the largest and most populated island in the Mediterranean. Within its 2571 ha, the altitudinal range reaches 3357 m at the peak of one of the most active volcanoes in the world (Thomaidis et al., 2021). The island has a Mediterranean climate with mild and wet winters and dry and hot summers, highlighting the southwest coast, where the climate is affected by the African currents and summers. Rainfall is scarce, leading to water deficits in some provinces. Moreover, the change in land use has gradually modified the climate, with less rainfall and drier rivers (Drago, 2005; Ragusa and Rapicavoli, 2017).
The land use change caused mainly by intense deforestation throughout Sicily's history has favored intense agricultural practices, especially in the center and southwest. Thus, agricultural areas cover 57 % of the island, of which 35 % are arable lands and 22 % permanent crops. Roughly a third of Sicily is forest, shrublands and open areas. Woodlands and semi-natural areas are sparse in the agricultural area and denser in areas with special protection, the most important being the Mount Etna surroundings, the Nebrodi Park and the nature reserve of Bosco della Ficuzza (Sicilia Assessorato beni culturali ed ambientali e pubblica istruzione, 1996). Due to its long-lasting socio-ecological history, location in the Mediterranean Sea, its fragility under climate change and increasing fire regime, Sicily represents an ideal study area representative of the Mediterranean socio-ecological context.
2.2 Fire risk analysis
The interaction of environmental and social processes drives the fire risk (Table 1), determined by the combination of a physical hazard and the vulnerability of the socio-ecological elements exposed (IPCC, 2012).
Table 1Fire risk is defined by vulnerability and hazard components (IPCC, 2012).
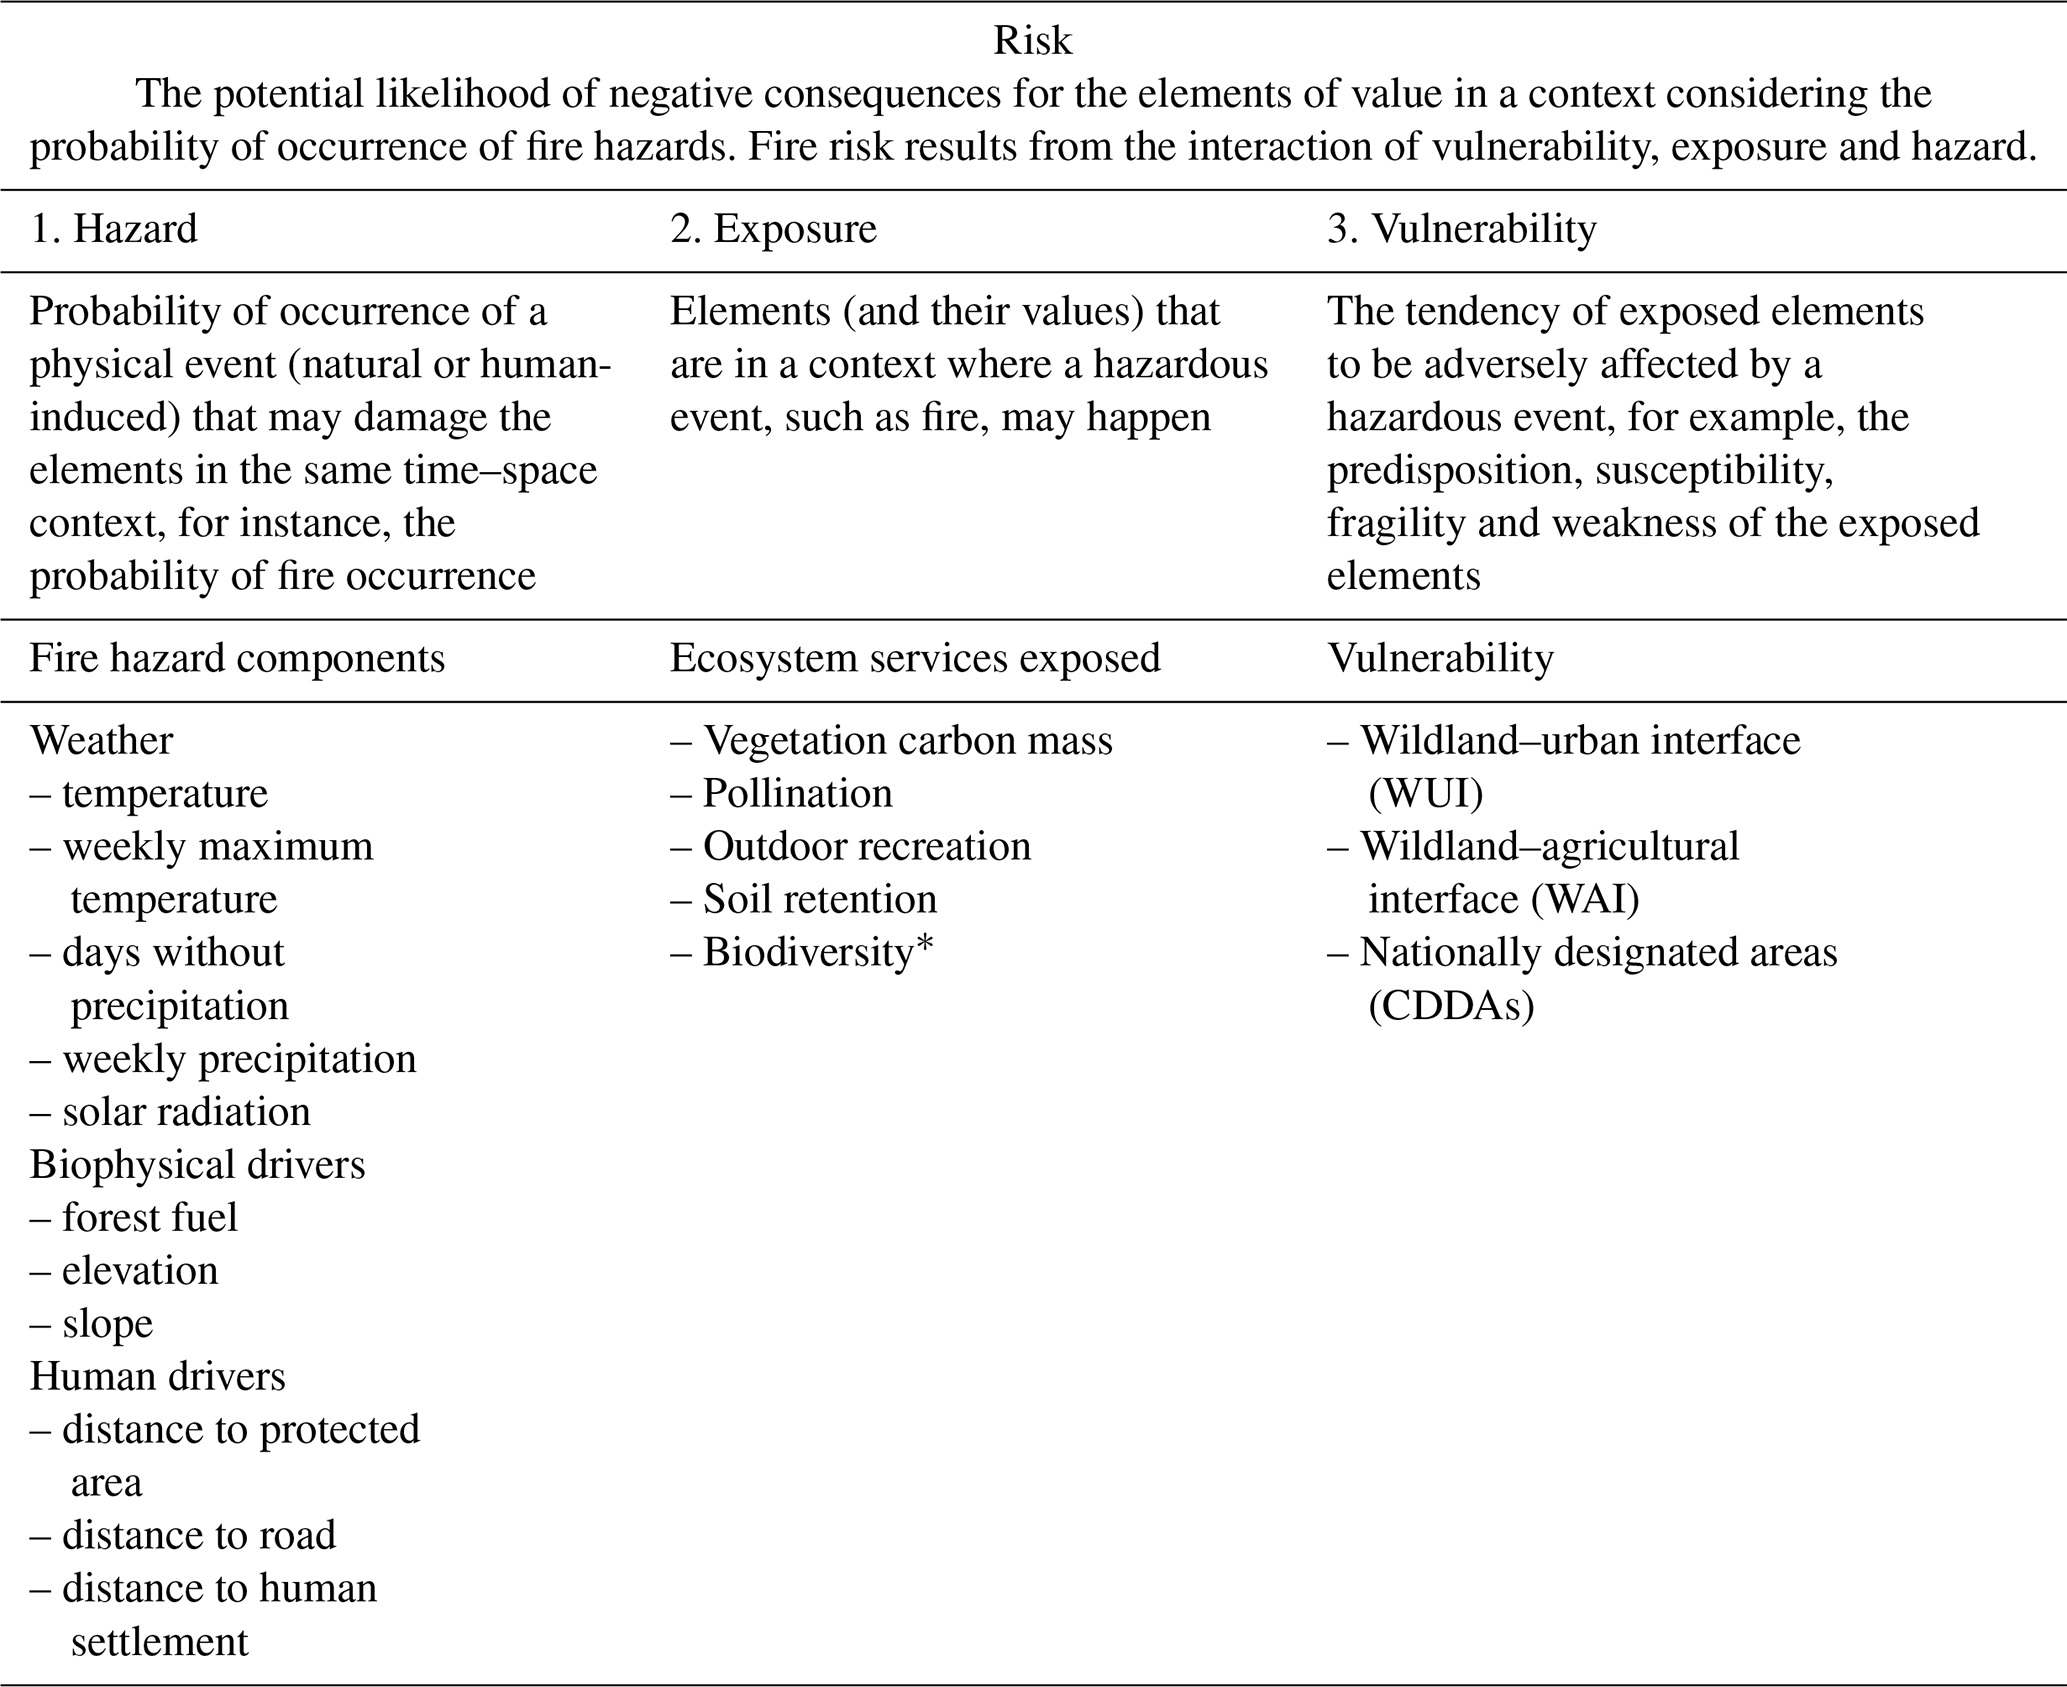
* Technically not an ecosystem service but added here as an associated element of exposure.
Fire hazard captures the probability of fire occurrence, based on historical wildfires and drivers such as biophysical factors and human-modified areas. The fire hazard interacts with the elements exposed; we highlight exposed ecological values and ecosystem services such as biodiversity, pollination, carbon mass, soil retention and outdoor recreation that may be affected by fire occurrence.
Vulnerability refers to exposed elements that are more susceptible to being highly or irreparably damaged due to their intrinsic or contextual characteristics. The wildland–urban interface (WUI) is particularly fire-prone because it is a forested area less than 200 m from an urban area (Ganteaume et al., 2021; Intini et al., 2020) due to the relationship between the ignition points and populated areas (Chappaz and Ganteaume, 2022). It also represents a high weakness of human settlements, as they are extremely close to the forest and becoming a problem in fire management (Cohen, 2008). The wildland–agricultural interface (WAI) is a forest area in close proximity to an agricultural area (within 200 m) and highly predisposed to burning due to the fire used for clearing forest and pasture or crop establishment (Leone et al., 2009; Ortega et al., 2012). Moreover, fire impacts agricultural land, making food safety susceptible to hazards (Baas et al., 2018). Natural areas with special protection (UNEP-WCMC and IUCN, 2022) are particularly fragile, with species with different endemism ranges and that are sensitive to social, climate and environmental changes (Baiamonte et al., 2015).
Fire risk is considered the cumulative consequence of the interplay of context-specific elements. Those elements capture vulnerability, exposure and hazard components emerging from the probability of fire occurrence. In this study we quantify fire risk by measuring the potential area affected, the hot spots of biodiversity, and ecosystem services potentially exposed and their vulnerability. We also assess fire risk in both current and future conditions (Sect. S1, Fig. S1 in the Supplement) to consider the impact of climate change.
2.2.1 Fire hazard model
The model presented in this study is developed using the k.LAB software to achieve interoperability from the data sources to the generated modeling results (Villa et al., 2017). Within k.LAB, an ontology-driven language called Knowledge-Integrated Modeling (k.IM) provides the basis for the semantic annotations (i.e., explicit definitions) of resources, such as external datasets, and individual modeling tasks (Sect. S1, Fig. S2). Once the resources are assembled in the resulting computational workflow, k.LAB returns as output contextualized models' results visualized on a map. To ensure transparency, textual documentation of the process followed to achieve the results with annexed references and details about the workflow is also provided to the users.
Accurate spatio-temporal detection of fire hazard is essential for the modeling and analysis of fire risk; thus, a system that transparently keeps track of the origin and reliability of input data is crucial. The input data used in this study were collected from different sources and can be classified into two categories: (i) historical wildfires and (ii) explanatory variables, which include weather, human and biophysical drivers. The data collection and processing are discussed in the following sections. All the data and resources are semantically annotated, openly accessible and interoperable within k.LAB.
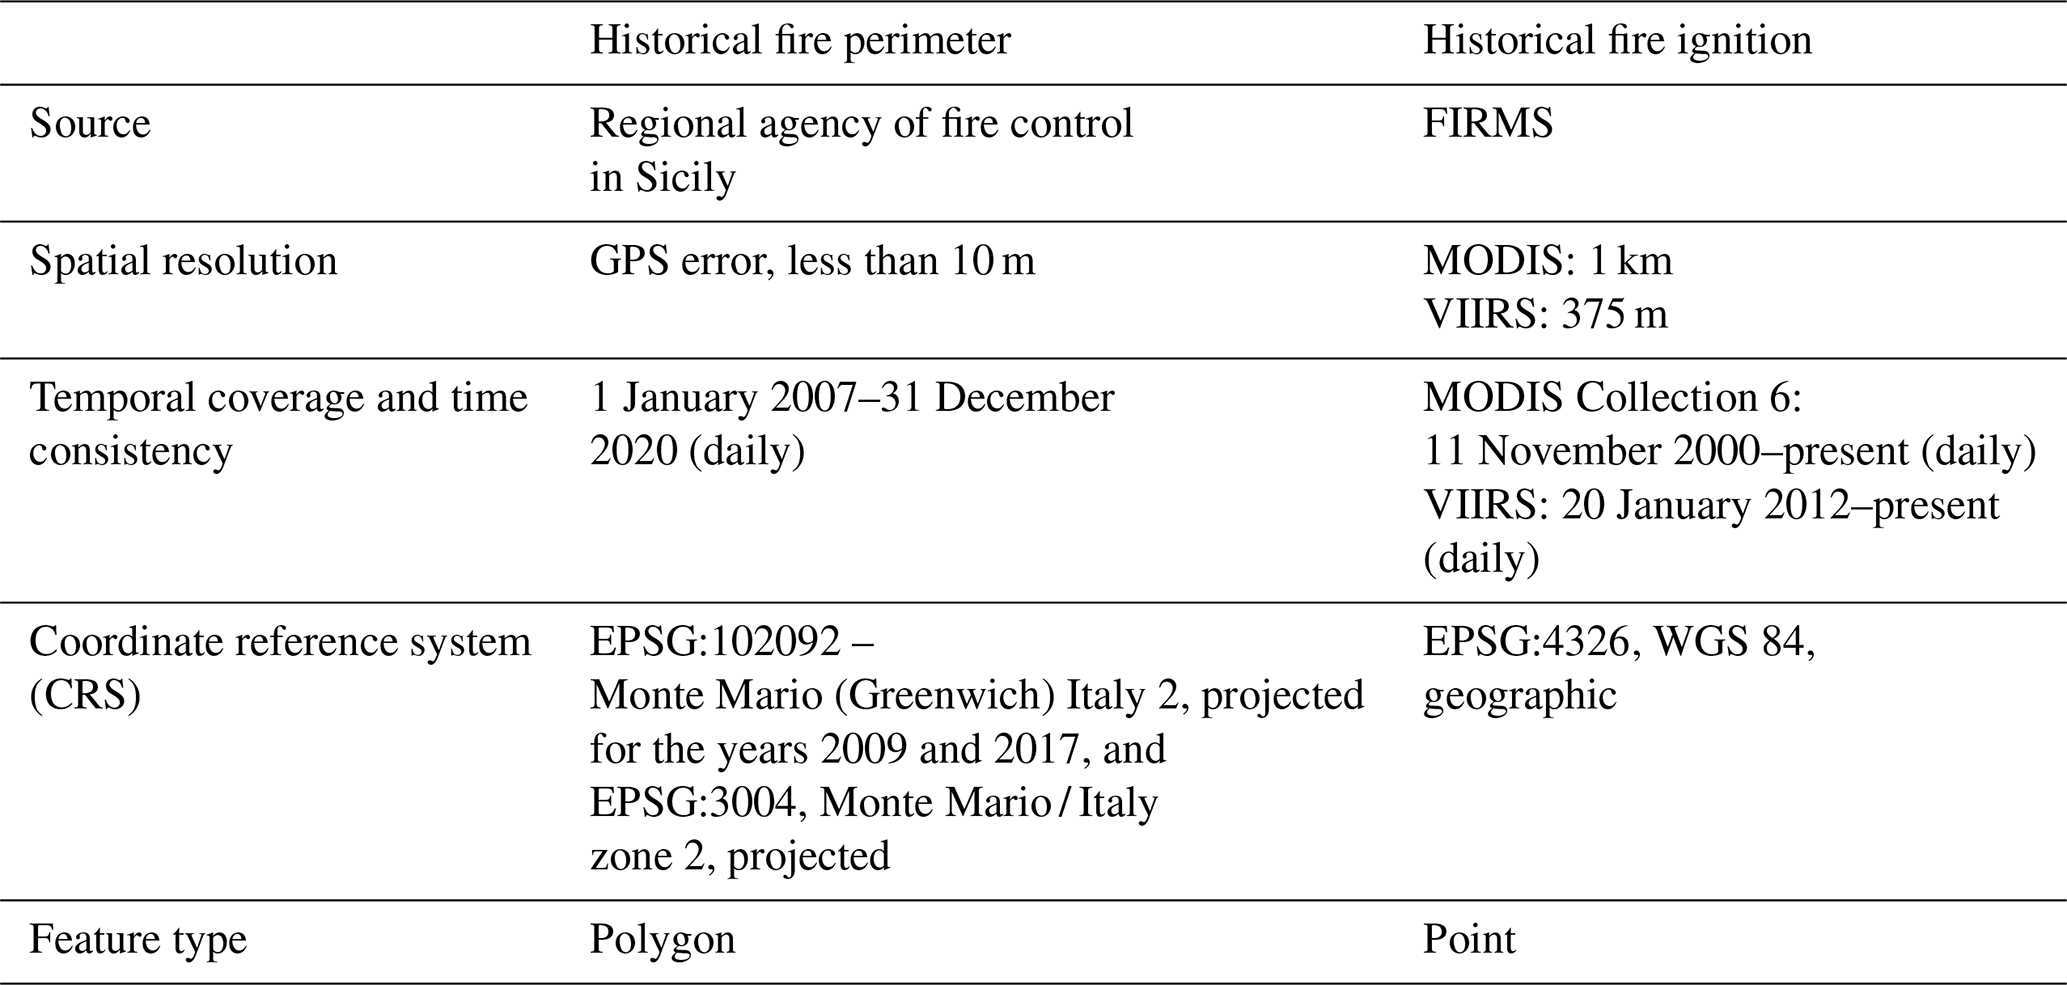
Historical fire data from 2007 to 2020 were collected from two different sources: the regional agency of fire control in Sicily was used to identify the fire perimeter, and the Fire Information for Resource Management System (FIRMS) satellite data were used to locate the ignition point (Table 2).
The regional agency collects the perimeter data of historical fires and provides the fire start and end dates collected by the Forestry Information System (SIF – Sistema Informativo Forestale) and the forestry command corps of the Sicilian region (Comando del Corpo Forestale della Regione Siciliana). FIRMS was developed by the University of Maryland to locate active fires in near real time by data from MODIS (Moderate Resolution Imaging Spectroradiometer) and VIIRS (Visible Infrared Imaging Radiometer Suite) (Giglio et al., 2016; Schroeder et al., 2014). MODIS is an instrument aboard Terra and Aqua satellites that provides global coverage every 1–2 d, and the VIIRS sensor is on board the Suomi and JPSS satellites and provides full global coverage every 12 h. When there was information from both satellites for the same fire perimeter, VIIRS was prioritized. Due to its spectral and spatial resolution, the VIIRS sensor is more accurate in fire detection (omission and commission of errors) thanks to the detection of the radiative power of the fire, especially in low-biomass areas (Fu et al., 2020).
Satellite data were used to locate the fire ignition point inside the perimeter provided by the regional agency. The centroid was considered the ignition point for the perimeters when it was not identifiable using satellite data. To prevent double counting from the data sources, each fire perimeter was double-checked to verify that there was only one ignition point per fire perimeter. We obtained a total of 7492 points linked with their ignition date (day, month and year).
In addition to the ignition data, we prepared an equal number of locations without fire events. This is needed to preserve a balanced dataset of observations that considers the explanatory-variable values in both the case of ignition and the absence of ignition. The result of an imbalanced training dataset is a “skewed data bias” and a model not capable of discriminating relevant patterns in data (Rennie et al., 2003). The weights for the class with fewer training data will be lower when the training data are skewed. Consequently, classification will be unfairly biased in favor of one class over another. The learning algorithm becomes too specific, leading to overfitting (Li et al., 2021).
The points without ignition were randomly generated with seeds within the study area between 1 January 2007 and 31 December 2020. It was verified that none of these points overlap with historically burned perimeters in date and location. The “ign” attribute differentiates ignition points (1) from non-ignition points (0) (Fig. 2).
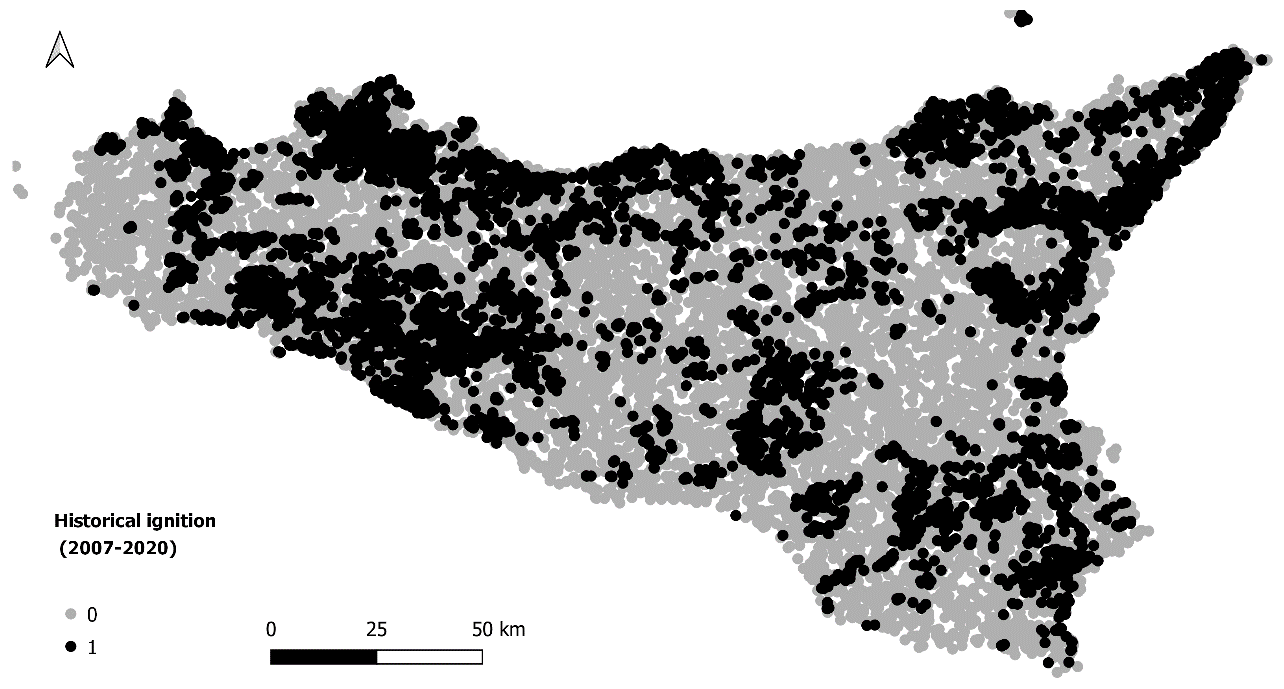
Figure 2Distribution of historical wildfires (category 1, black color) and no wildfires (category 0, grey color) in the Sicily region from 2007 to 2020.
The data feeding the machine learning model come from open resources on the cloud provided by well-known and reliable institutions. Those input data are incorporated automatically, depending on the spatio-temporal needs of the model. In the Sicily model, the data come from the regional government of Sicily and the University of Catania or the E-OBS (ensemble observation) project, among others (Table 3).
Table 3Variables in the Bayesian network (BN) model.
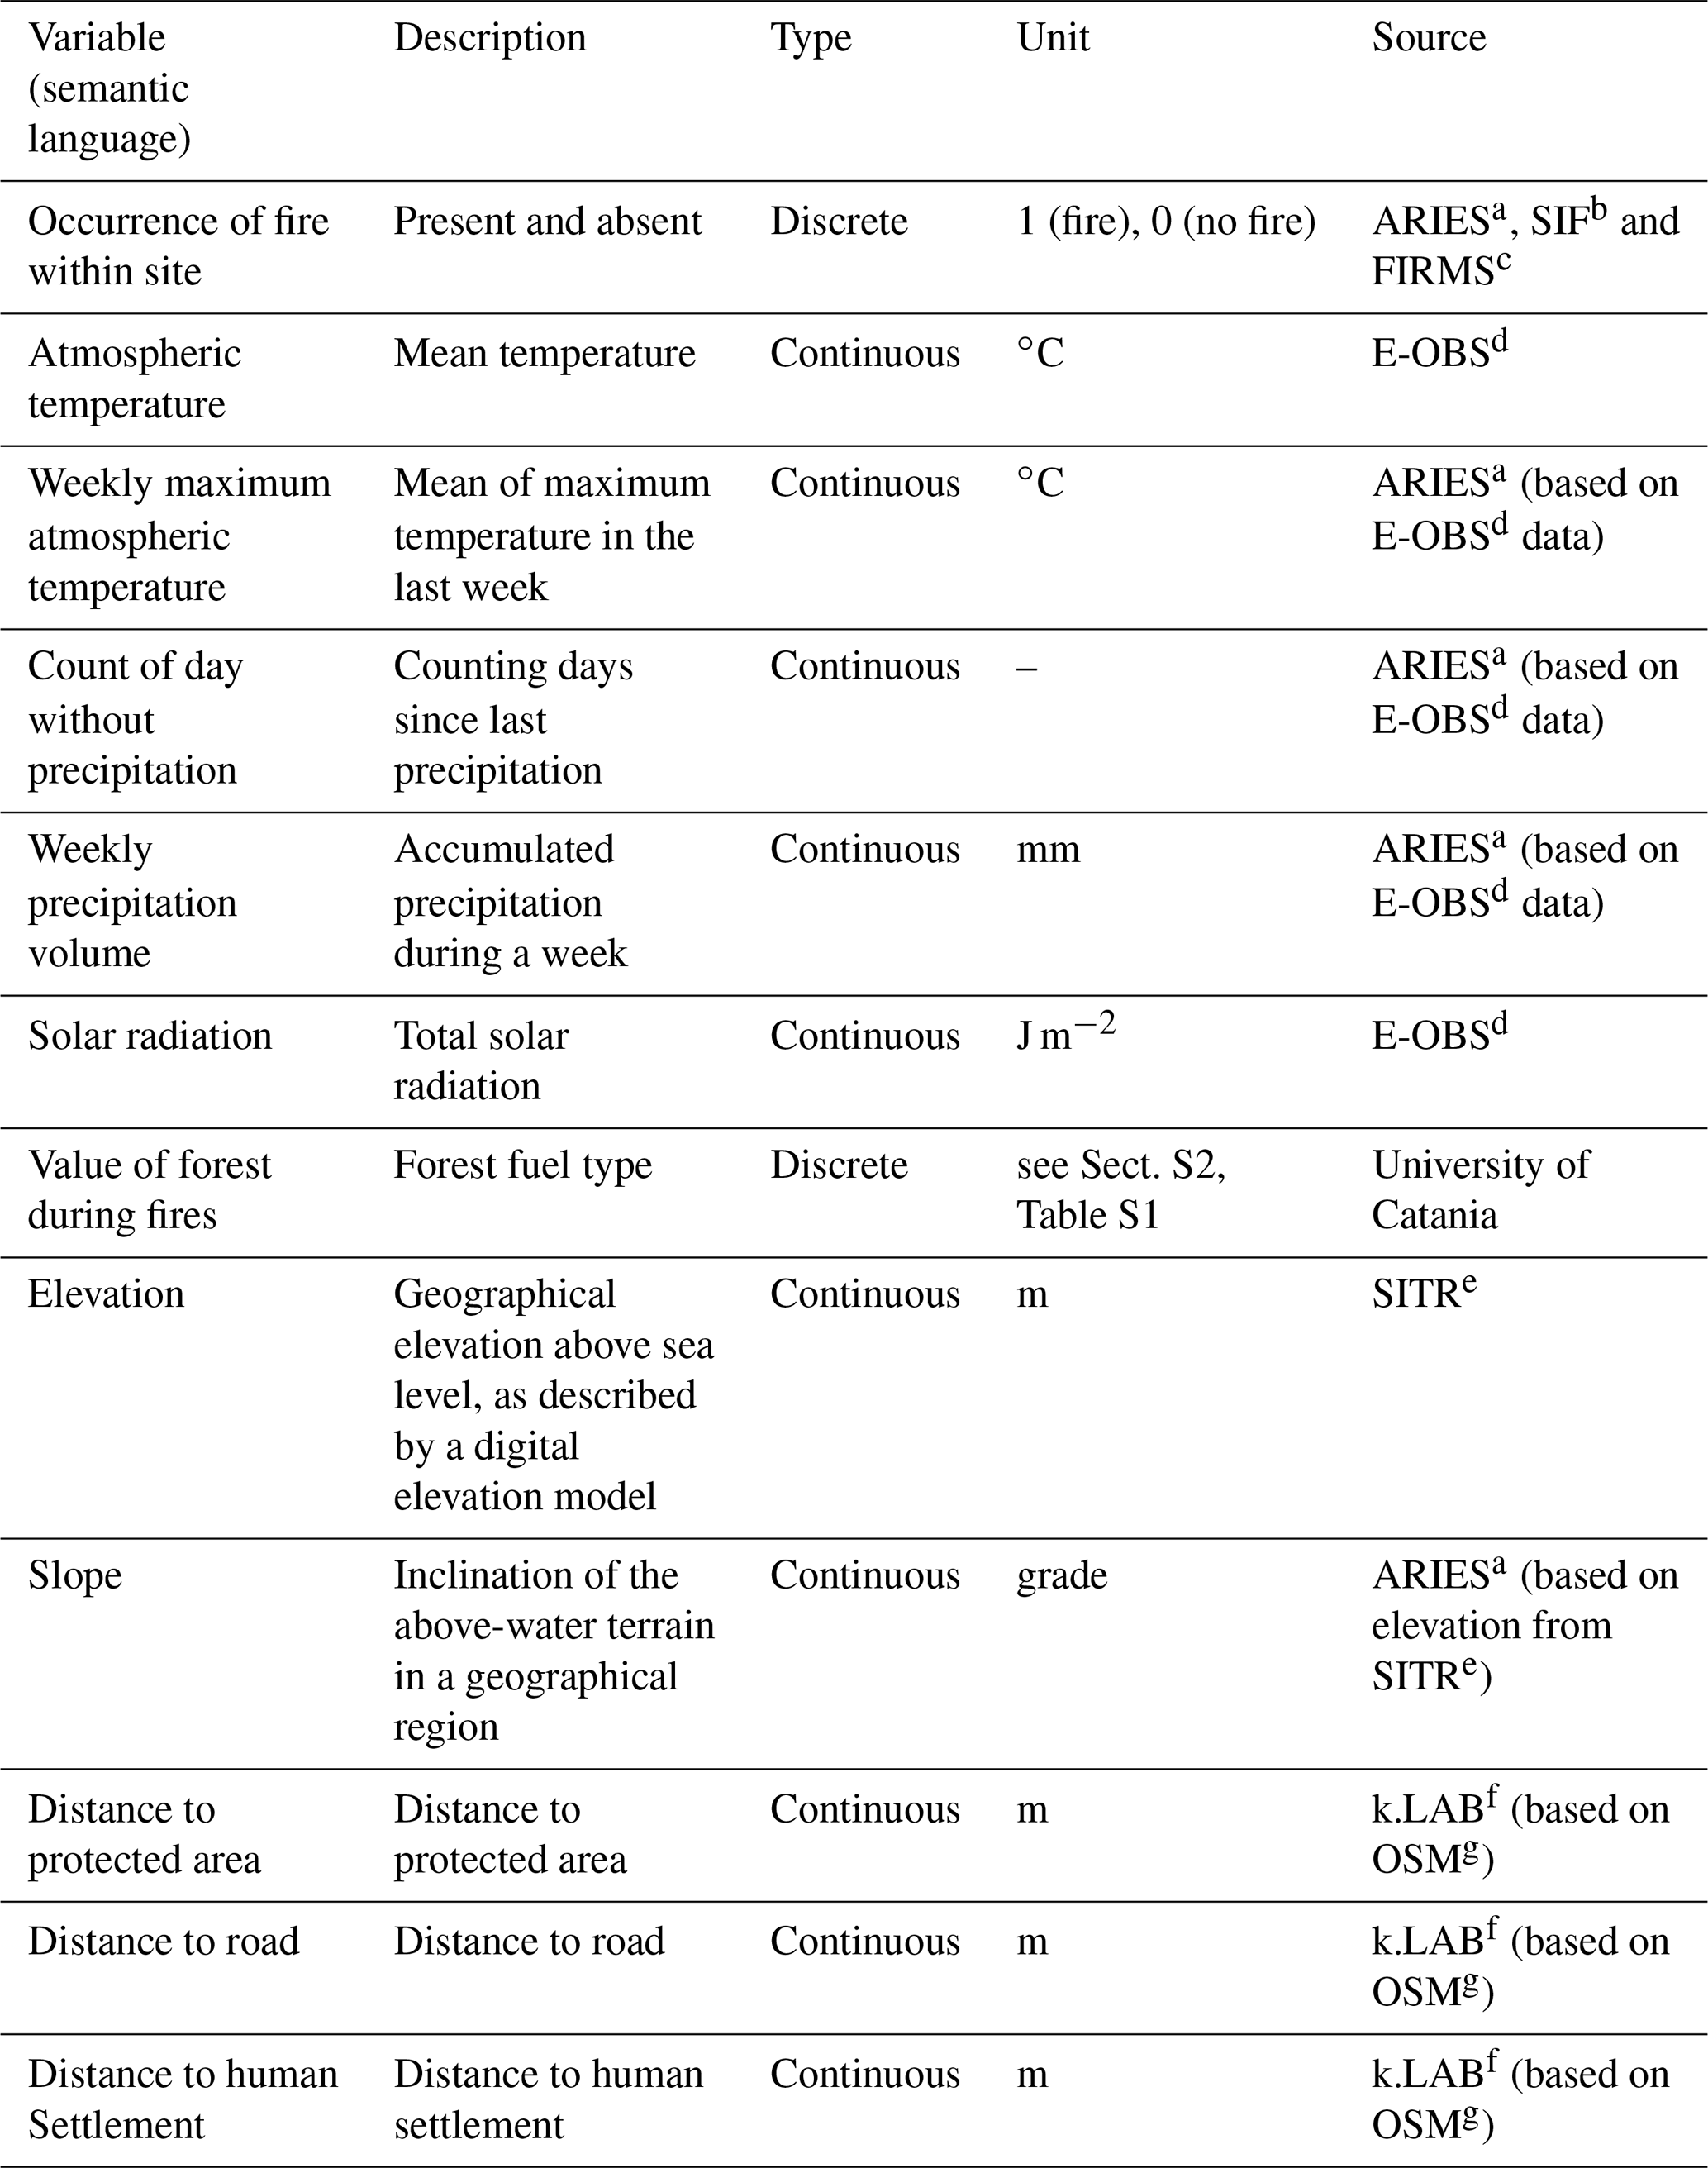
a ARIES: ARtificial Intelligence for Environment & Sustainability. b SIF: Sistema Informativo Forestale (Forestry Information System). c FIRMS: Fire Information for Resources Management System. d E-OBS: ensemble observation. e SITR: Sistema Informativo Territoriale Regionale (Regional Spatial Information System). f k.LAB: Knowledge Laboratory. g OSM: OpenStreetMap (OpenStreetMap contributors, 2020).
In the case of Sicilian wildfires, the human factor is one of the main triggers that lead to the depopulation of country areas by land managers and an increasing number of tourists and visitors. The human drivers used as explanatory variables in the model are distance to protected areas, distance to road and distance to human settlement. Those variables are calculated using semantics in the k.LAB software. This software is able to compute geographical distances (Euclidean distance) between spatial objects. Additionally to human drivers, the fire hazard also depends on (i) weather (especially due to long dry seasons); (ii) topography; and (iii) environment, characterized by the high flammability of the Mediterranean forests (Corrao, 1992). Some of the weather variables, based on E-OBS data, were integrated into the ARIES network. Those drivers influence fuel type, moisture levels and fire behavior.
Meteorological data were obtained from the E-OBS Copernicus project (Cornes et al., 2018). We used the last version released in March 2021 to obtain data from 1 January 2007 to 31 December 2020. The data were processed with R software to obtain the meteorological data needed on each specific day such as daily temperature and daily solar radiation (Table 3).
In addition, heatwaves and long periods of drought are great drivers for the majority of extreme wildfires (Narcizo et al., 2022; Nojarov and Nikolova, 2022; Parente et al., 2018). Moreover, with climate change, these episodes will increase in number, frequency and intensity, especially for the projections for Representative Concentration Pathway 8.5 (RCP8.5; Molina et al., 2020). We have taken into account variables such as the mean of maximum temperatures, the number of days without rain and the precipitation accumulated during the previous week.
The topographic factors used (slope and elevation) are constant components of the fire risk model. They have a strong influence on other parameters such as fuel conditions and weather. Slope and elevation were generated from a digital elevation model (DEM) at a 10 m resolution.
Fuel type and land cover composition have a significant effect on fire ignition. Deep knowledge of the fuel bed is key to fire management, as it is one of the main components of fire risk. Fuel bed has been reformulated into fuel models for easier use in models and systems. The characteristics and properties of fuel types used categorical ranges between 1 and 7 (Sect. S2, Table S1 in the Supplement) according to the Prometheus project (Lasaponara et al., 2006). The latter defines fuel type as a recognizable combination of fuel components with distinct species, shapes, dimensions, structures and continuity that will display a particular fire behavior under specific burning conditions (Merrill and Alexander, 1987). The land cover map source is based on the Italian “Map of Nature” (Angelini et al., 2009). Land cover is mainly composed of extensive crops and complex farming systems (46 %), so the main fuel type is ground fuels such as grass (50 % of land in Sicily). Of the land cover on the island, 29 % is non-combustible.
Among the models that were tested, one of them had the fire frequency as input, calculated with the historical wildfires from 2007–2020. This model had an accuracy above 95 %. After several literature searches and discussions with experts, it was decided not to incorporate fire frequency into the model. Although the accuracy was much better than the model finally chosen (83.6 %), the main disadvantage was the possibility of overfitting. In addition, it may lower the likelihood of detecting wildfires in unusual areas due to changes in land use or phenomena such as climate change. Finally, the difficulty of accessing new wildfires to incorporate into the frequency variable was another important reason for this choice.
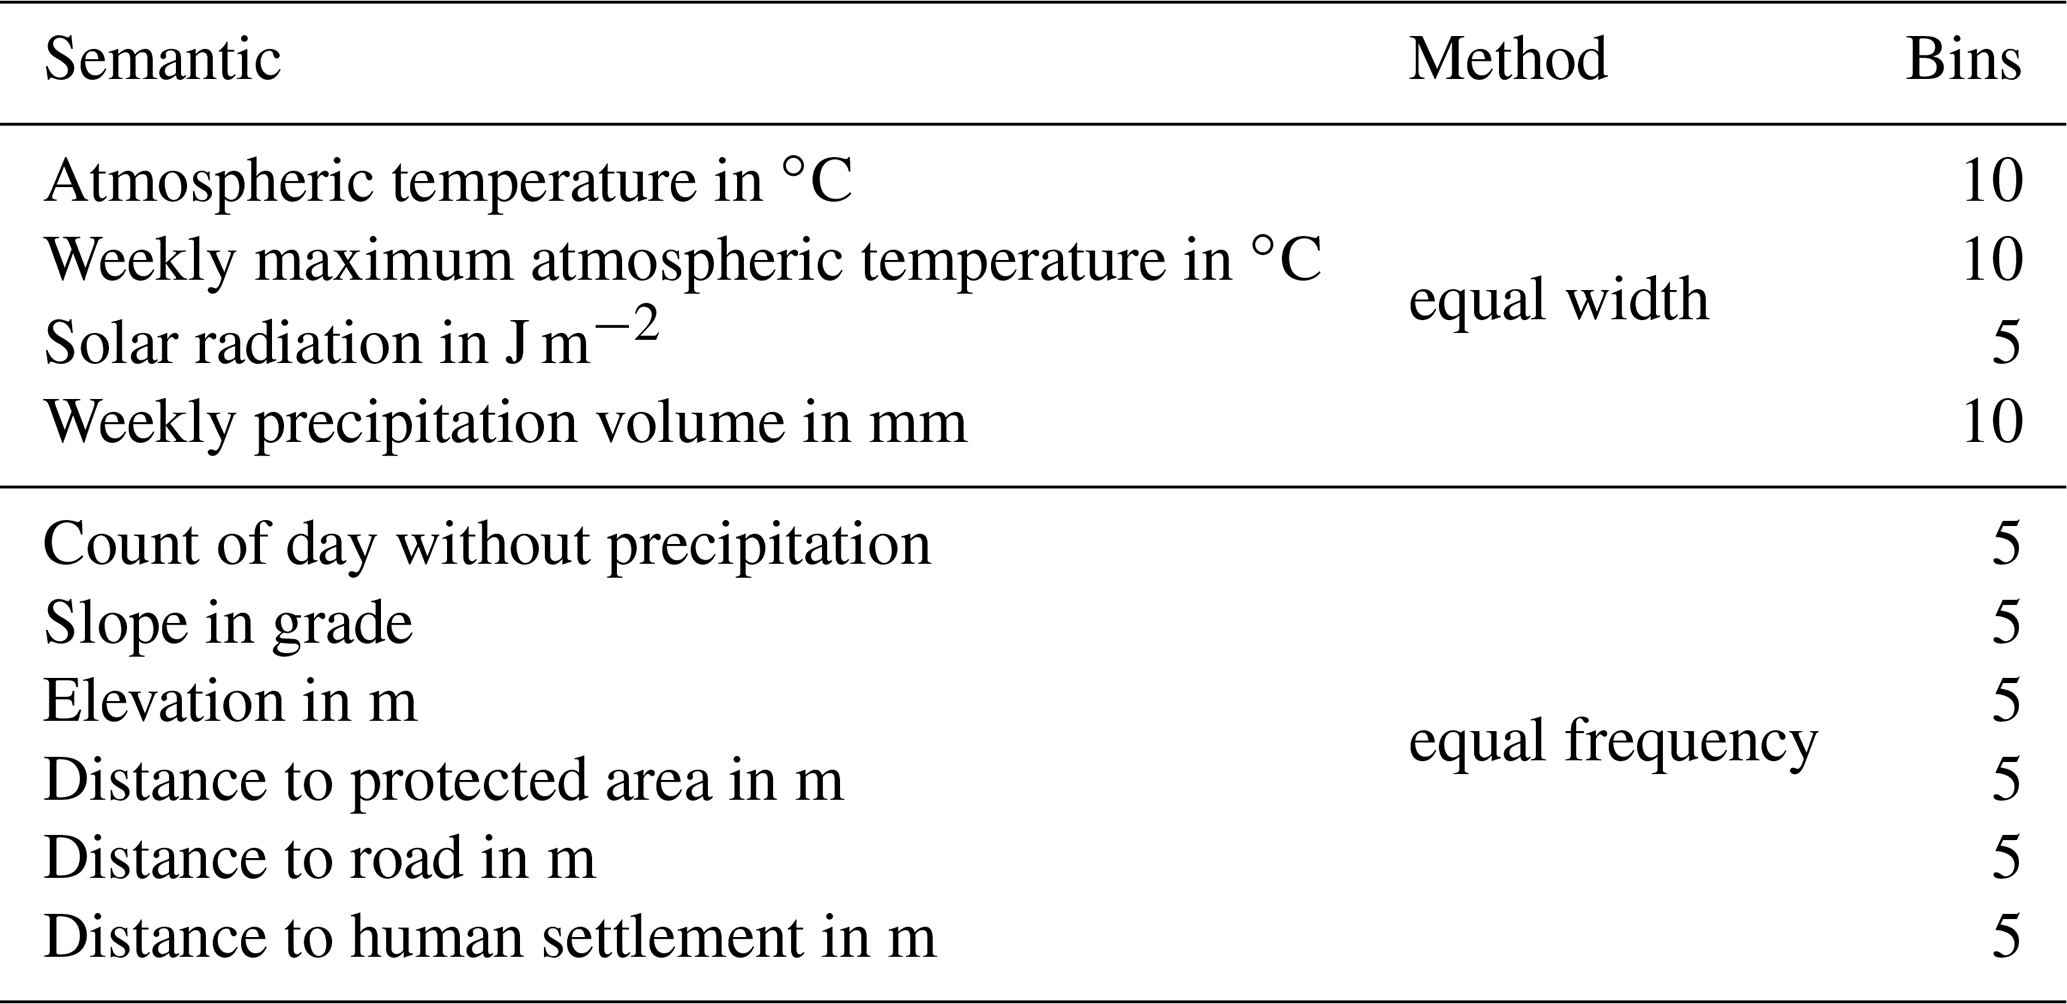
Table 4Discretization applied to the variables used in the fire occurrence modeling.
2.2.2 A Bayesian network model of fire hazard
Bayesian networks (BNs) (Pearl, 1988) have been widely used in recent years and have been highlighted as a powerful tool for modeling complex problems, representing uncertainty and assisting stakeholders when the data are highly interlinked (Henriksen et al., 2007; Kangas and Kangas, 2004; Penman et al., 2011). Thus, the BN model is especially useful in environmental modeling of factors such as wildfire risk because it (i) involves a high level of uncertainty, (ii) has limited or incomplete data on key system variables, (iii) contains both qualitative and quantitative information or data in different forms, and (vi) integrates multidisciplinary systems (Chen and Pollino, 2012). In addition, the system is transparent in its process, as its nodes' table shows the dependency's strength between nodes and their parents in terms of conditional probability distribution and the relationships between variables are made explicit.
A BN is a model that graphically represents causal assertions between variables as patterns of probabilistic dependencies. A directed acyclic graph (DAG) of a BN is built with nodes (variables) and edges between the nodes (dependencies and mutual relationships between variables). Each successor node (children) is only determined by the values of its immediate predecessors (parents) known as the parental Markov property (Pearl, 2009). Roots are the nodes without any parent and with marginal distribution (Borsuk, 2008).
The BN has been learned using the WEKA (Waikato Environment for Knowledge Analysis) library integrated into the k.LAB software (Bouckaert, 2004; Frank et al., 2016; Willcock et al., 2018). WEKA is an open-source Java library that provides a collection of machine learning algorithms. The WEKA interface provides graphical and text components to inspect some BN's properties as basic algorithm information, the BN structure, the probability distribution table or the accuracy by class.
The model has been written in a semantically explicit way using the aforementioned k.IM language (Sect. S1, Fig. S2), which compiles in Web Ontology Language (OWL) (Bao et al., 2012) and allows us to ontologically define and model natural-language-like logical expressions. In addition, a model written in k.IM is able to interoperate with other models available in the k.LAB environment. When modeling in k.IM, concepts that have been previously defined in a knowledge base are invoked; examples are earth:Site and chemistry:Fire as depicted in Sect. S1 (Fig. S2). Those concepts contain meanings that facilitate a semantic integration within the system (Villa et al., 2017).
Since the BN is built with categorical values, continuous data need to be discretized. Discretization allows the establishment of non-linear values between variables and more complex distributions (Friedman and Goldszmidt, 1996). Discretizing the data helps to interpret the results more easily when it comes to decision-making processes by facilitating communication between modelers and end users. However, the interval selection interferes with the final results. We have been taking into account that the higher the number of intervals, the more data are needed to find significant dependencies (Aguilera et al., 2011); the nodes become weak when there are many intervals because there are fewer data for each distribution.
Among the methods to use for discretization (Beuzen et al., 2018), in this study we use both the equal-width and equal-frequency binning unsupervised methods, according to the input data distribution (see the data histograms in Sect. S3). In the first case, the algorithm divides the data into k intervals of equal size, and in the case of equal frequency, the user specifies the sub-ranges that result in k intervals (bins) with approximately the same number of values. After modeling with different discretization ranges and obtaining similar accuracy results, we have chosen, for each of the variables, the minimum number of intervals in order to make ecological sense, maintain statistical significance and minimize information loss (Sect. S4, Table S2). The discretization applied is shown in Table 4.
To learn the BN, 80 % of the dataset was used to actually learn the model
and 20 % to test the relationship between historical wildfires (observations) and explanatory variables. On the learning side, we selected
the K2 algorithm (Cooper and Herskovits, 1992). This type of score-based algorithm searches for the most probable belief-network structure through a heuristic search. The K2 algorithm processes each node in turn and greedily considers adding edges from previously processed nodes to the current one, adding the edges that maximize the network's score. It turns to the next node when any of the following requirements are met: (i) it has reached the maximum number of parents, (ii) there are no more parents to add and (iii) the score has not improved (Chen et al., 2008). The number of parents for each node can be restricted to a predefined maximum (e.g., maxparents = 1) to mitigate overfitting.
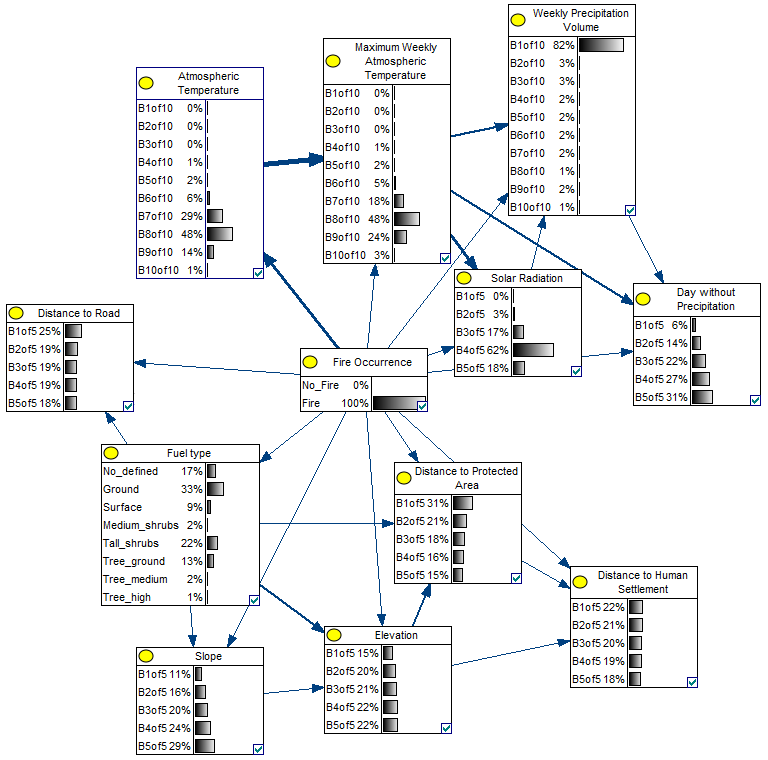
Figure 3Directed acyclic graph (DAG) of the fire hazard Bayesian network model where the arc width shows the strength of influence between nodes. Nodes show the relative probability of each interval of the variable, described in the Supplement (Sect. S4, Table S2).
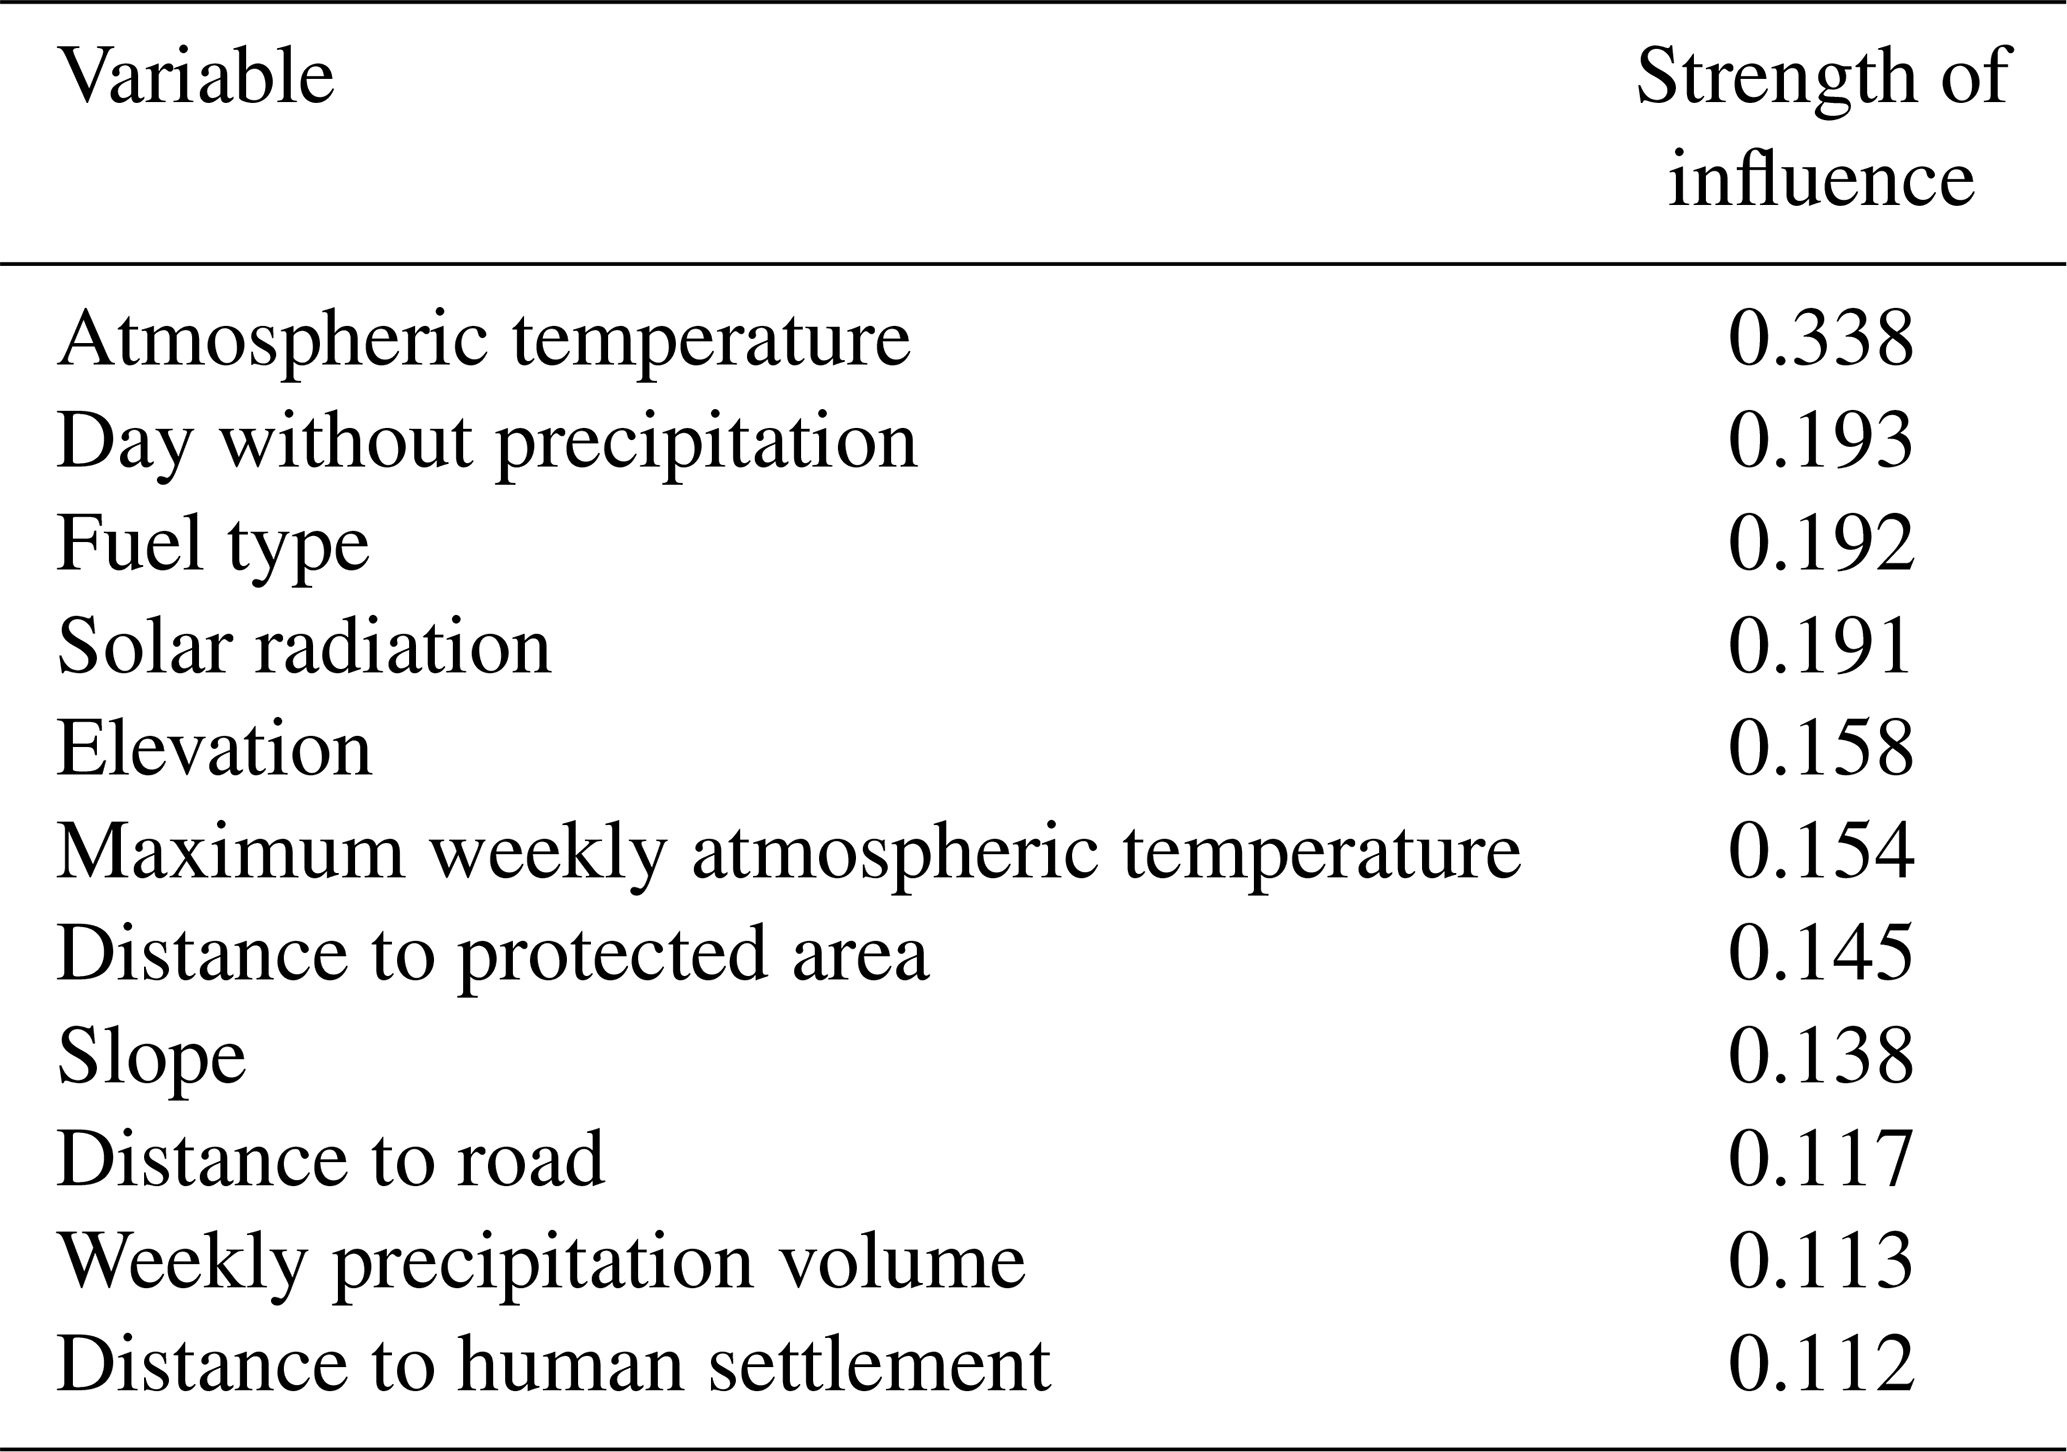
The BN predictors have been distributed in a directed acyclic graph (DAG) as shown in Fig. 3. The DAG assigns probabilities to each variable's predictor: anthropogenic and biophysical factors such as meteorology, topography and environment. The most influential variable of a BN results from the following characteristics: (i) the strength of influence of each edge connecting the nodes (Balbi et al., 2019) and (ii) how “far”, in terms of number of edges, an input node is from the final output (Marcot et al., 2006). The strength of influence is calculated from the conditional probability tables and expresses the difference between the probability distributions of two nodes by looking at the posterior probability distribution of a node, for each possible state of the parent or child node. To summarize this difference, we report normalized Euclidean distance, although other types of distances (e.g., Hellinger) are also used (Balbi et al., 2019). Table 5 quantifies numerically the strength of influence as the thickness of the edges between the fire hazard node and its children. The predictors with the highest strength of influence are (i) atmospheric temperature, (ii) days without precipitation, (iii) fuel type and (iv) solar radiation (Table 5), all of which are directly linked to the final output (fire occurrence). While atmospheric temperature, number of days without precipitation and solar radiation are expected to increase in variability and increase fire hazard with limited options for human mitigation, fuel type can be managed with timely landscape interventions, reducing its combustibility level where it is more necessary.
Table 5Strength of influence of fire occurrence on its child nodes.
Finally, to be more understandable for end users and stakeholders, the results of the model were divided into three equal intervals related to the level of fire occurrence (high: more than 66 % chance; medium: between 33 % and 66 % chance; low: less than 33 % chance).
2.2.3 Drivers of vulnerability and exposed elements
Social vulnerability and environmental vulnerability have been assessed as the tendency of exposed elements to be potentially damaged by a fire hazard due to their intrinsic or contextual conditions (IPCC, 2012). First, we used models developed in previous projects in k.LAB to determine the socio-ecological exposed elements. The ecosystem service models and biodiversity considered are those included in the ARIES global model set (Martínez-López et al., 2019). Once the fire hazard model is in k.LAB, all the data and models can interoperate through the explicit semantics (Villa et al., 2017). Thus, we can reuse previous ecosystem service models developed (Martínez-López et al., 2019; Willcock et al., 2018), applying them to a different context and creating new knowledge. In this case, due to the specificities of Sicily and the relevance of ecosystem services affected by wildfires, we choose to consider the following models: (i) vegetation carbon mass, (ii) pollination, (iii) outdoor recreation, (iv) biodiversity and (v) soil retention. These models, published in Martínez-López et al. (2019) and Willcock et al. (2018), are briefly described below:
-
Vegetation carbon mass. This is a calculation of the above- and belowground carbon storage in vegetation (t ha−1), in accordance with Tier 1 IPCC methodology (Gibbs and Ruesch, 2008; IPCC, 2006).
-
Pollination. Based on land use, cropland and weather patterns, the pollination model generates spatially explicit data of the supply and demand for insect pollination services.
-
Outdoor recreation. This is a calculation of the accessibility of recreational features of the natural landscape, as well as the demand for them, based on the methods by Paracchini et al. (2014).
-
Biodiversity. This employs a Bayesian network approach used to learn from site-based expert estimations of “biodiversity value” to create a map of the entire Sicilian region (Willcock et al., 2018).
-
Soil retention. The model provides biophysical estimates of soil loss and retention by plants (in metric tons of sediment per hectare per year) using the widely employed Revised Universal Soil Loss Equation (RUSLE; Renard et al., 1997).
To create a comprehensive indicator of ecosystem services and biodiversity, we converted the above-mentioned modeling output to a common scale, using quantitative and qualitative criteria. In order to calculate the potentially reduced social and ecological services, we used the normalization method, instead of others such as qualitative categorization and probabilistic approaches (normal, Poisson, binary) (Chuvieco et al., 2003). We transformed each modeling output rescaling it from 0 to 1 and using the minimum and maximum value within the Sicily context. The quantitative scale was classified into three categories (1 – low; 2 – medium; 3 – high) using equidistant intervals, thus integrating all modeling outputs into a single value. In this quantitative cross-assessment, the most valuable component was prioritized. The final map was overlaid with wildland areas.
Once exposure was identified, we located the most vulnerable elements that were exposed to fire. Spatial data were generated for WUI, WAI and protected areas. In order to create the WUI area, we generated a 200 m buffer map from the human settlements and then overlaid it with the forest areas. The WAI map followed the same procedure but with the buffer map from the agricultural areas. Finally, we use the FAO map (UNEP-WCMC and IUCN, 2022) for the protected areas. Vulnerable areas were overlapped with the exposure map.
Finally, the fire hazard model was used to predict how the most vulnerable exposed elements could be affected in current and future climatic conditions. The future climate data were drawn from the Coupled Model Intercomparison Project Phase 5 (CMIP5) for RCP8.5 from the Coordinated Regional Climate Downscaling Experiment (CORDEX) (Giorgi et al., 2009). The data are bias-corrected and simulated by state-of-the-art global and regional climate model pairs. To generate the climatic variables, we used the same process as for the current variables. We kept the other variables (solar radiation, fuel, slope, elevation, distance to road, protected area and human settlement) with the current conditions.
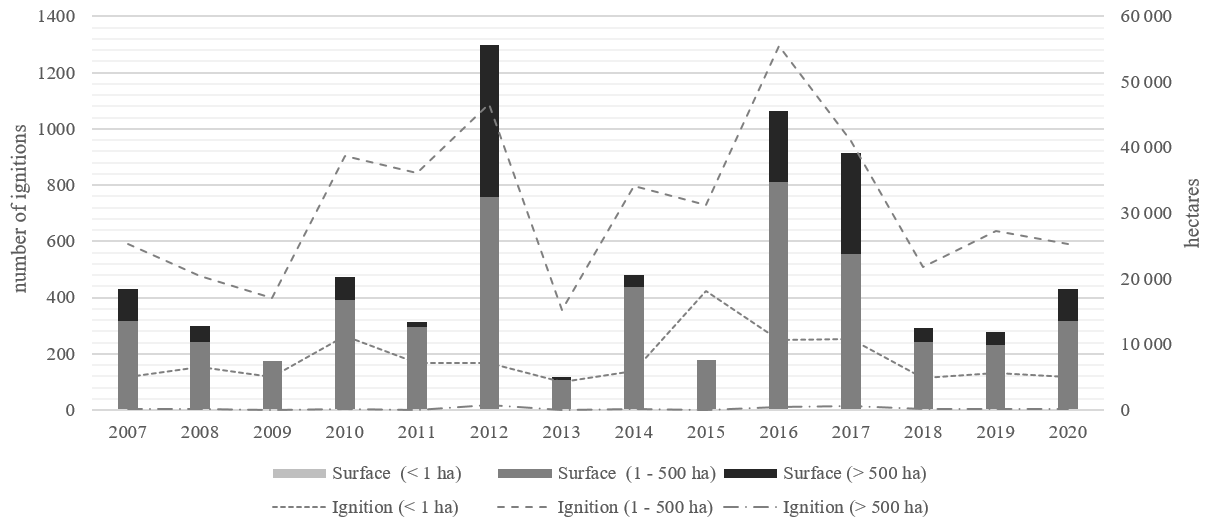
Figure 4Number of ignitions vs. burned area by year from 2007 to 2020. Source: regional agency of fire control in Sicily and FIRMS.
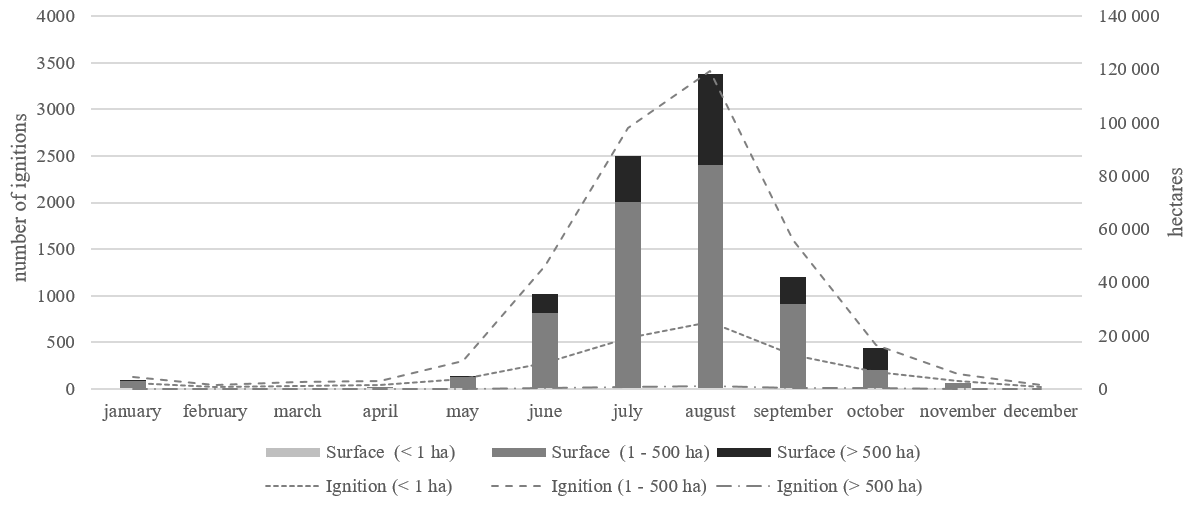
Figure 5Number of ignitions vs. burned area by month from 2007 to 2020. Source: regional agency of fire control in Sicily and FIRMS.
3.1 Historical data analysis
During the analysis period (2007–2020) 28 814.698 ha was burned in 12 749 fire perimeters, and the data show significant variability between years (Fig. 4). The average area burned is equivalent to 20 630 ha with 910 ignitions per year, 2012 being the worst year with 1274 ignitions and 55 699 ha burned. However, the monthly distribution over this period is skewed toward July and August (Fig. 5) due to the weather's favorable fire conditions in this period. August is clearly the month with more wildfires in all the years analyzed, with 4166 ignitions and 118 481 ha burned in total (26 % more area than July, the second-worst month).
Fire frequency analysis (Fig. 6) showed that a quarter of the area affected during 13 years (from 2007 to 2020) has burned once and 34.8 % twice, 23.1 % has burned three times or more, and nearly 6 % has burned more than five times. Burned areas are spread throughout Sicily; however, areas close to cities, such as Palermo, have been burned more than others.
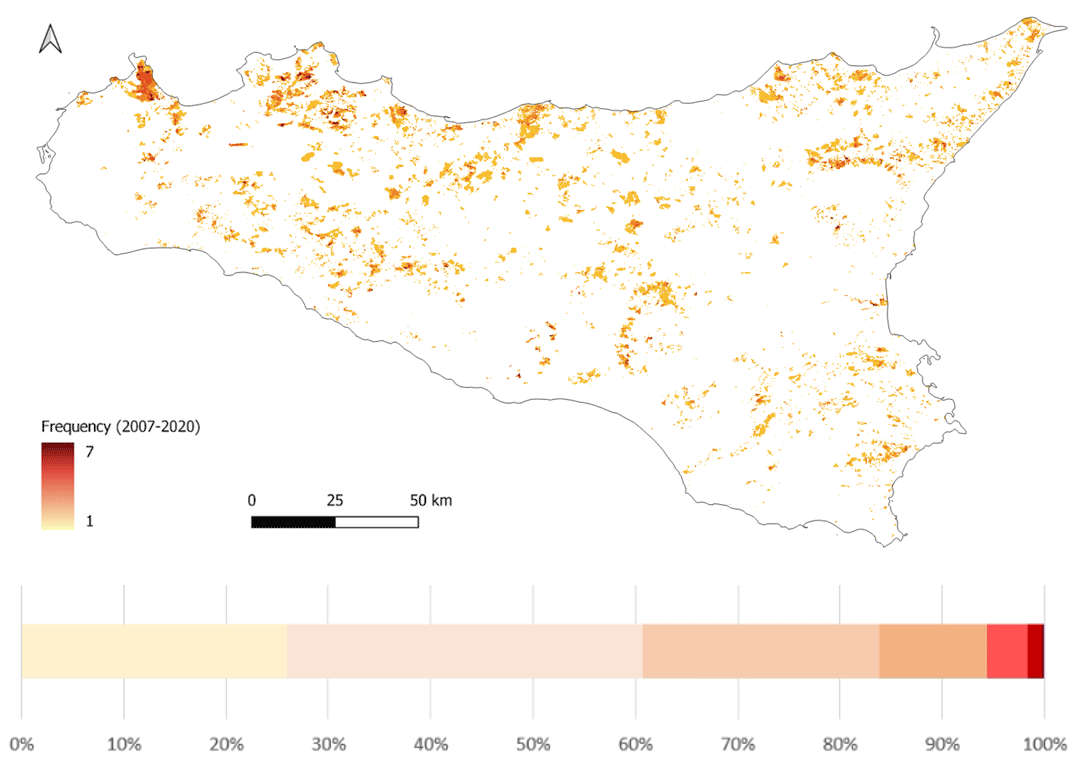
Figure 6Fire frequency aggregated by year. The legend shows how many times the same area has been burned during the period of 2007–2020.
Fire ignition causes have been recorded since 2010. Figure 7 shows that, every year, more than 70 % of wildfires are caused by arson, with 2010, 2011 and 2012 being particularly relevant. The percentage of wildfires caused by negligence or natural effects is of little relevance. In general, it seems that the trend of arson has decreased significantly over the years, from 91.54 % to 67.06 %. A large part of the percentage that has decreased due to arson has been replaced by wildfires of unknown origin, so we cannot be confident that this trend is real.
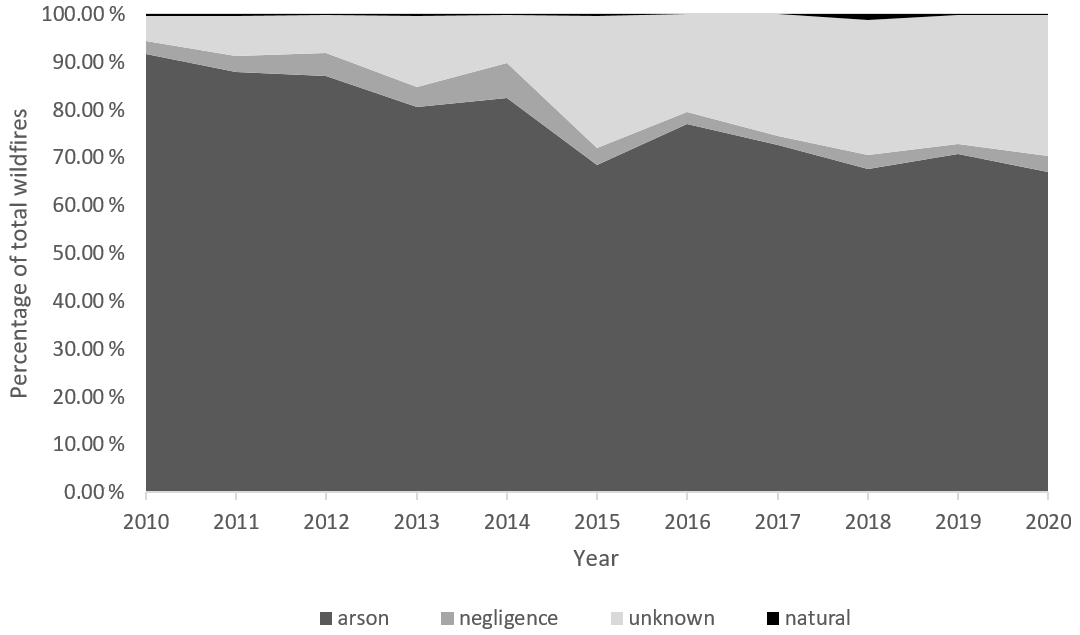
Figure 7Relative frequency of fires by main fire causes in Sicily for 2010–October 2020 as a proportion of the total wildfires.
3.2 The Bayesian data-driven approach
The Bayesian network model shows the probability of each child node under the probability of fire occurrence (where fire hazard is the parent node). For this purpose, in Fig. 3, the state of the parent node based on historical fire is set to 100 %, indicating that wildfire is certain. The posterior probability of each state of the explanatory variables is then obtained given the conditional probability table (CPT) of each node (Fig. 3).
Accordingly, the fire occurrence probability at “atmospheric temperature” is highest between 24.71 and 28.65 ∘C (Sect. S4, Table S2) and the weekly maximum temperature is between 27.93 and 31.69 ∘C. In over 80 % of the cases, the weekly precipitation accumulated is below 0.05 mm for fire occurrence. Moreover, the more days without precipitation and the higher the solar radiation, the higher the probability of fire occurrence. As for the topographic variables, the most important is the slope, since the probability of fire is directly proportional to the slope. The same is observed in the case of elevation but with a less obvious pattern. The probability of fire is higher in locations that are closer to human activities such as roads or buildings and protected areas. Finally, in the case of the environmental variables, the highest fire probability by fuel forest type (Sect. S2, Table S1) is when ground fuel is grass (type 1), followed by high shrubs (between 2.0 and 4.0 m) and young trees resulting from natural regeneration or forestation (type 4). The third-riskiest fuel type is type 5, which occurs when the ground fuel is removed either by prescribed burning or by mechanical means. This situation may also occur in closed canopies in which the lack of sunlight inhibits the growth of surface vegetation.
The most influential variables (in terms of connection strength) according to our BN algorithm are atmospheric temperature, days without precipitation and fuel type (Table 5). While atmospheric temperature and the number of days without precipitation are expected to increase in variability and increase fire hazard with limited options for human mitigation, fuel type can be managed with timely landscape interventions, reducing its combustibility level where it is more necessary.
The k-fold cross-validation algorithm has been used to estimate the model's accuracy. This algorithm uses the training and testing process k times and averages the results. The results for k=10 showed that 83.997 % of the instances were correctly classified into two categories: occurrence and non-occurrence of wildfires.
We use the confusion matrix to measure the performance of the classification (Table 6). The results show not only 12 172 correctly classified instances, but also 1426 false positives and 893 false negatives. The type-I error (false positive), i.e., detecting a fire where it, in reality, has not occurred, could lead to allocating efforts to unnecessary areas. The type-II error (false negative) could not identify the probability of fire in risk situations, and, therefore, the risk would not be managed properly. A false negative rate (0.11) is calculated as the number of incorrect positive predictions divided by the total number of negatives; the best false positive rate is 0.0.
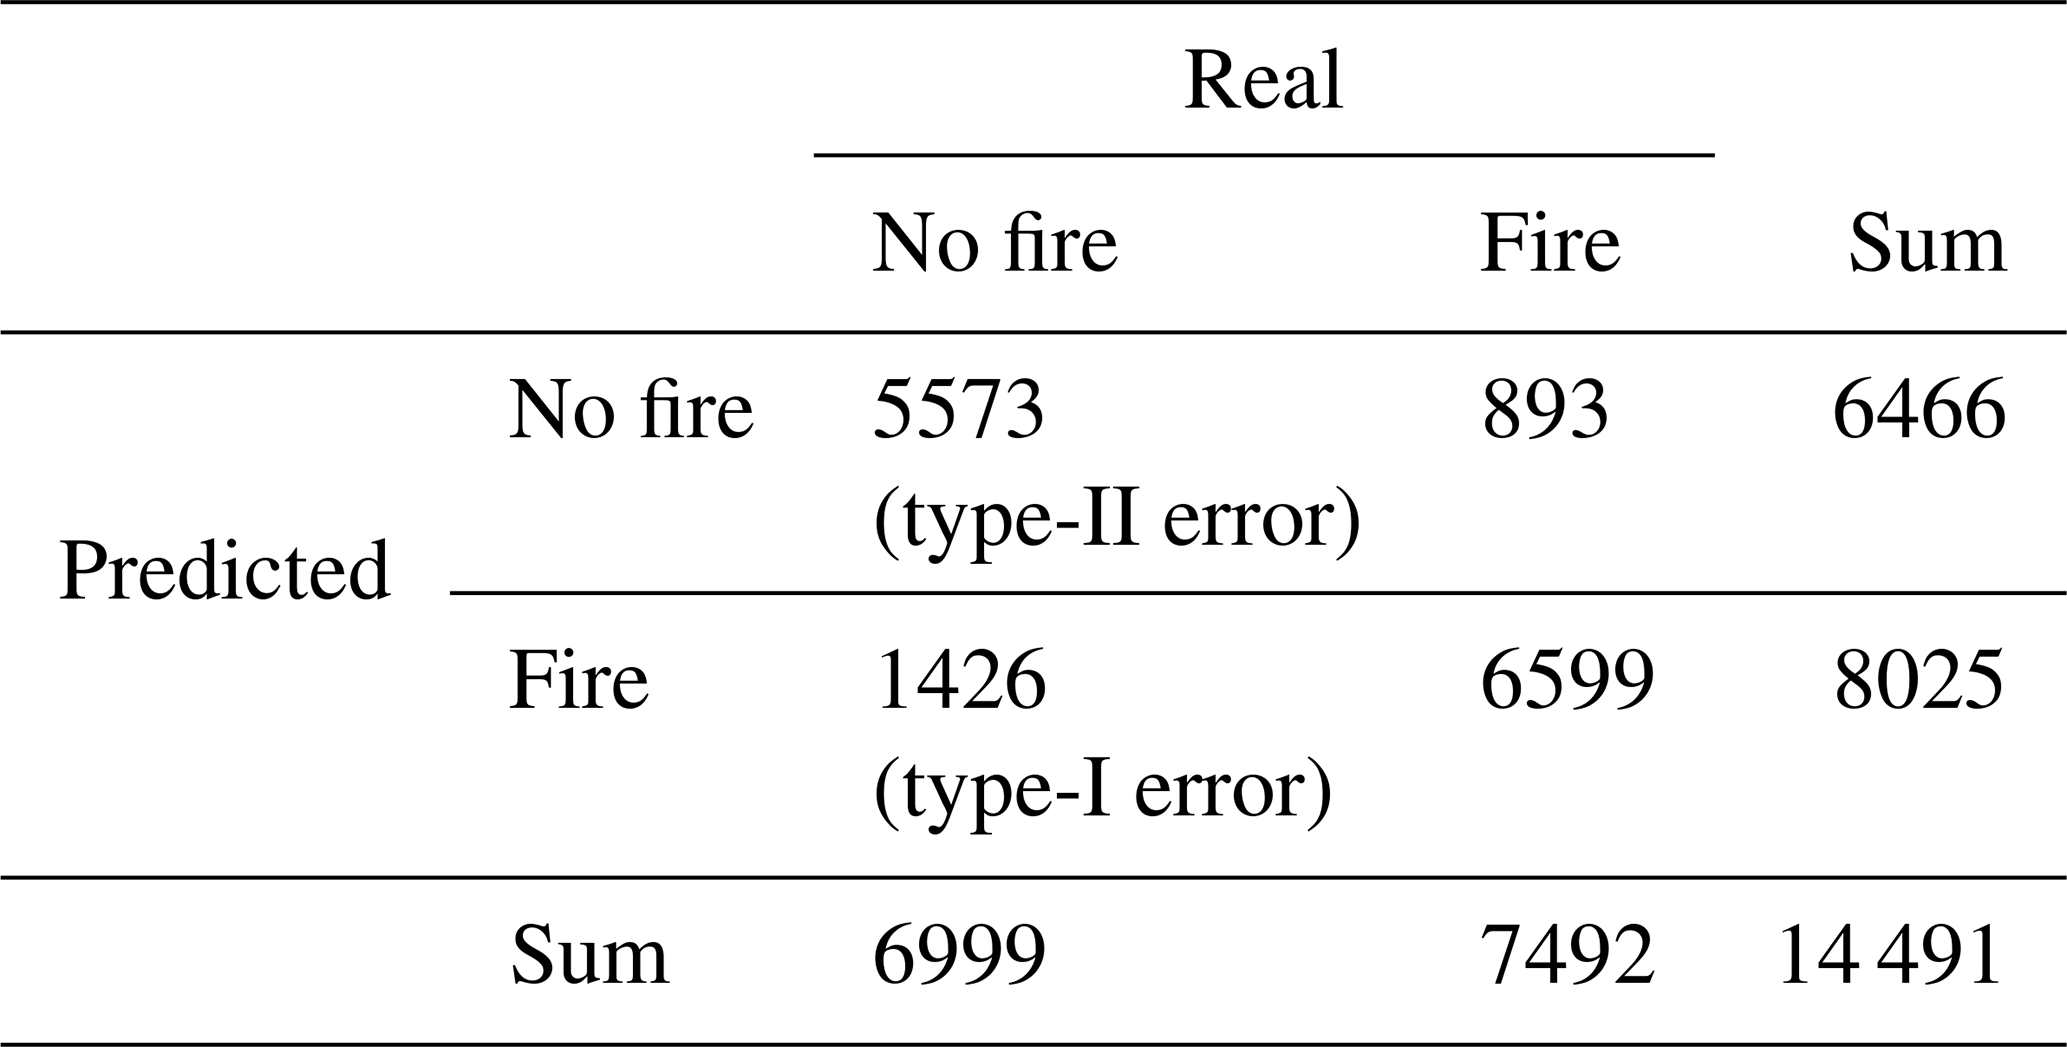
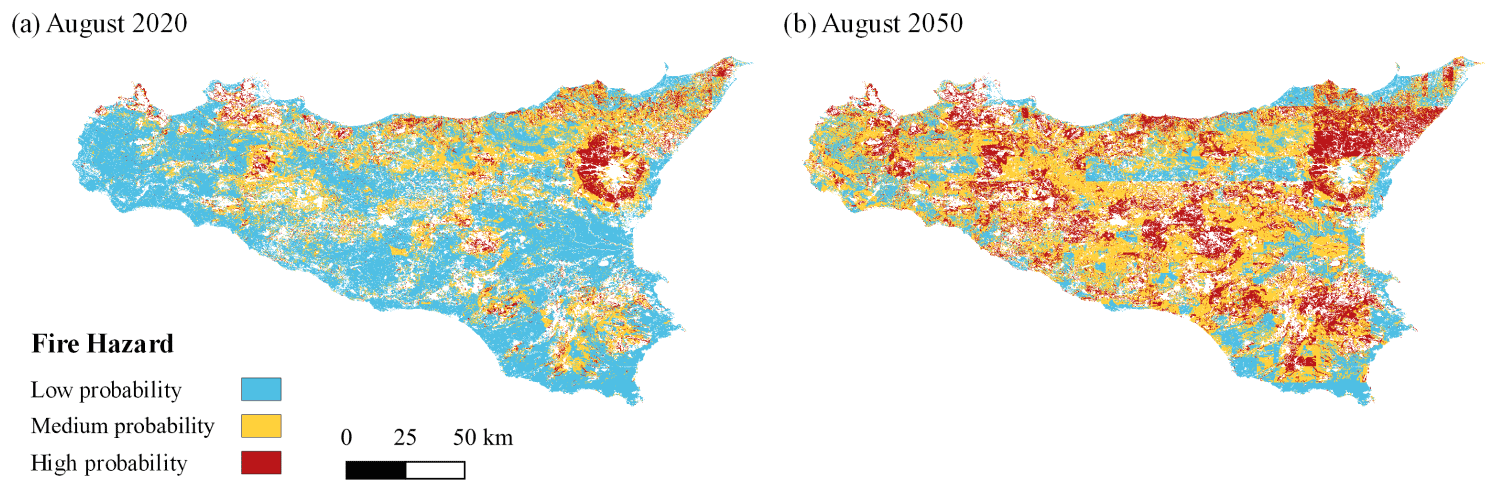
Figure 8Example of fire hazard in (a) August 2020 and (b) August 2050 classified by low, medium or high probability of fire occurrence.
Bayes' theorem is key to interpreting the output of binary classification problems using the calculated confusion matrix. Precision is the confusion matrix probability P (fire total predicted fire) = = 0.822. It is the probability that the fire predicted as fire is true. Recall P (fire total actual fire) = = 0.881 is the proportion of the actual fires that were correctly predicted by our classification algorithm. Table 7 also shows that the precision for the negative class (no fire) is 0.822. Moreover, the overall accuracy (weighted average between fire and no fire) is 0.841 and 0.840 for precision and recall, respectively, and gives an overall picture of our model. These weighted results are close to our precision and recall values for fire variables because our model is balanced (7492 wildfires (51.70 %) vs. 6999 no wildfires (48.29 %)). Hence, the overall accuracy (0.84) is a good metric in this situation.
Table 7Sensitivity analysis of fire hazard model. TP rate: true positive rate; FP rate: false positive rate; F measure: F measure or F score; MCC: Matthews correlation coefficient; ROC: receiver operating characteristic; PRC: principal response curve.
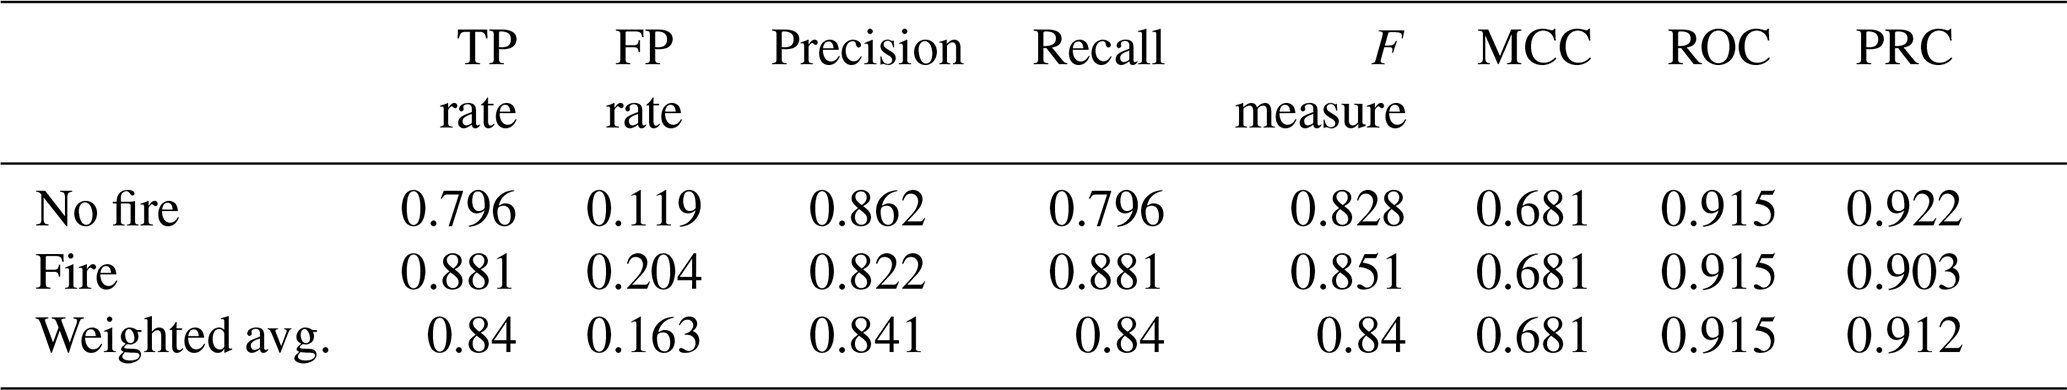
The confusion matrix is also useful for measuring other significant metrics such as the ROC (receiver operating characteristic) curve that summarizes the performance of the Bayesian classifier over all possible thresholds (Bradley, 1997; Fawcett, 2006). It measures accuracy in a weighted sort and is appropriate when the observations are balanced between each class, as in this case. For example, we used a sorting-based method called area under the ROC curve (AUC) that measures the two-dimensional region below the ROC curve from (0, 0) to (1, 1). Not only does the model present a strong AUC result of 0.915 for fire hazard, because the result is close to 1, but also it shows a significant F measure (a harmonic mean of the precision and recall) with 0.847. The model also performs well in terms of uncertainty in the results. In the Supplement (Sect. S4, Fig. S6) we display the uncertainty map associated with the standard deviation of the probability distribution of fire hazard.
As an example, we present the fire hazard model results (i.e., the mean values of the simulated probability distributions) for August 2050 because August is the month with the most critical historical wildfires in Sicily (Fig. 5), assuming no changes in ecosystem management. Given the ease of access and reuse of models and data in k.LAB and as the input data are on the platform and openly available, any user of the modeling platform can run the fire hazard model at any time in the future until 2055.
As anticipated, the results of the model were divided into three equal intervals, related to the level of fire hazard (low: probability of fire less than 33 %; medium: probability of fire between 33 % and 66 %; high: probability of fire more than 66 %). Figure 8 shows the comparison between the average results for August in 2020 and 2050 at 50 m resolution.
When comparing simulated outcomes for 2020 and 2050, the increase in areas with high fire probability and decrease in those with low fire probability become evident. The area with low fire probability changed from 12 300 to 4887 km2, representing a reduction of almost 40 %. The area with medium probability of fire occurrence increased from 29 % of the total wildland area to 48 %. Finally, the wildland area with a high probability of fire occurrence changed from 8 % (1675.26 km2) to 27 % (5357.62 km2), an increase of 319.8 % between the two scenarios. We here highlight the most significant change: from low to medium probability of fire occurrence, which has increased by 7112.58 km2. Conversely 4504.34 km2 of wildland areas with a low probability of fire occurrence remains unchanged between 2020 and 2050.
3.3 Wildfire risk levels
The wildfire risk map at 50 m resolution integrates a set of variables related to exposure and vulnerability (Table 1). In this study, we analyze the areas with important ecological values and ecosystem services for both humans and nature, which would be potentially affected in the case of fire due to their exposure.
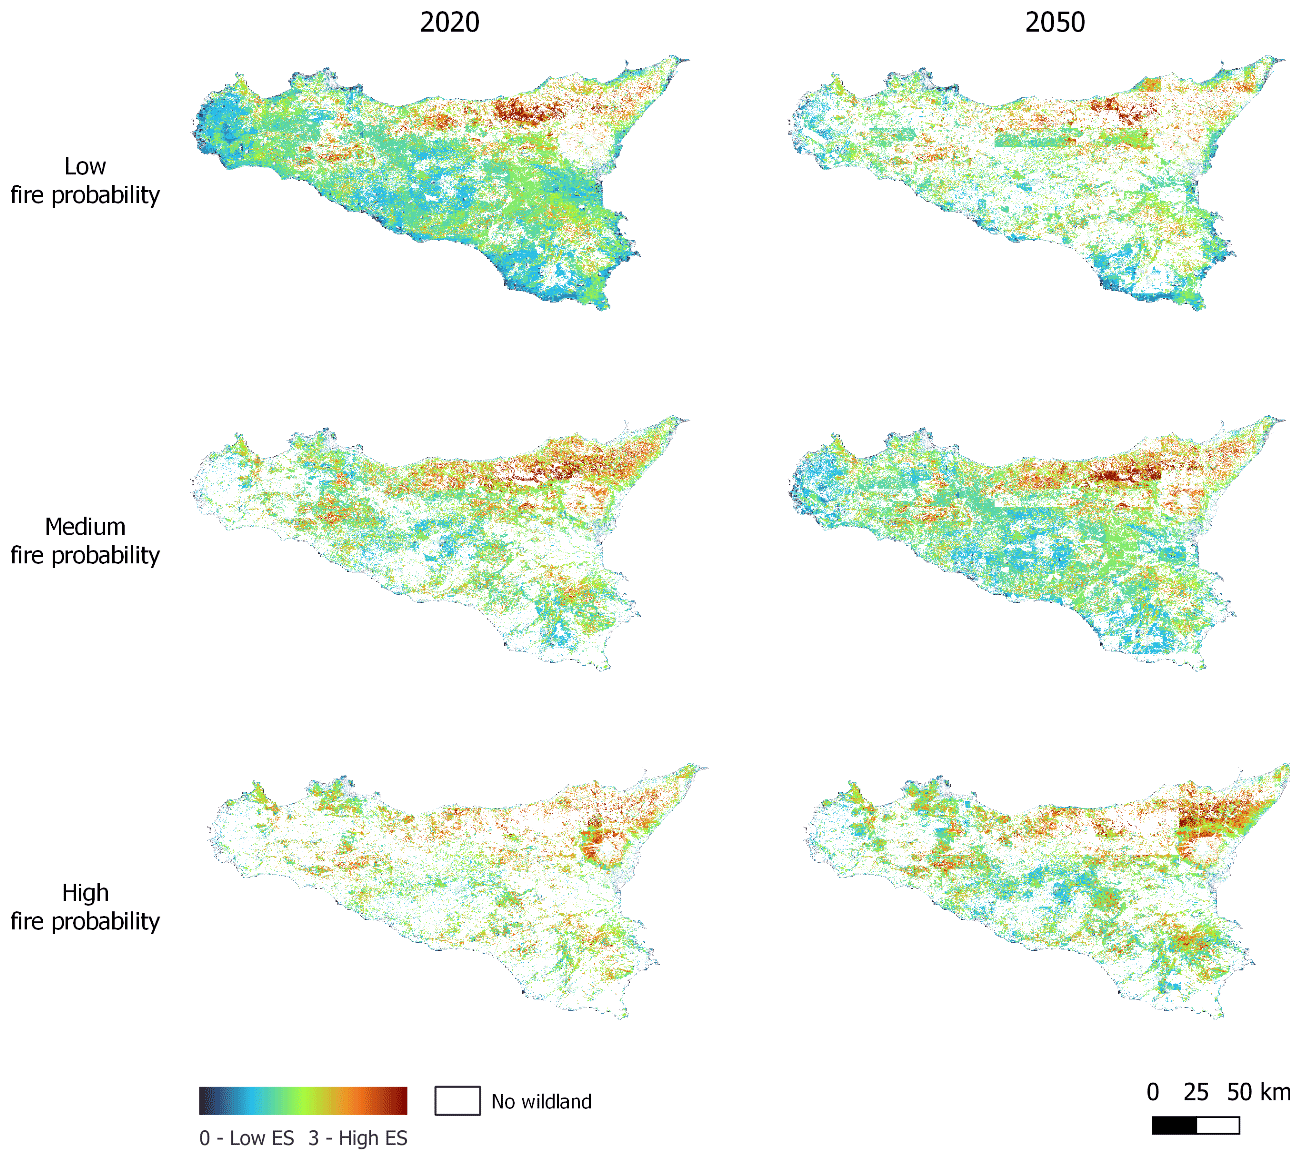
Figure 9Exposure map of ecological values and ES (ecosystem services) that may interact with levels of forest fire probability (low, medium and high) in 2020 and 2050.
Figure 9 compares the average spatial variability in the ecosystem services and ecological values exposed in August 2020 and August 2050. The panels are distributed by levels of fire occurrence probability (first row, low; second row, medium; third row, high), according to the fire hazard model. The 2020 column shows that the most exposed area corresponds to the low fire hazard level. As the level of fire hazard increases, the exposed area decreases. In contrast, the 2050 column shows that the most exposed area corresponds to the medium fire hazard level, followed by high and low probabilities of fire occurrence.
Linked to Fig. 9, Fig. 10 shows the changes (in km2) broken down by ES (ecosystem services). As we observed in the exposure maps (Fig. 9), the fire hazard increases in all ES. For example, the exposure to the carbon mass ecosystem service and biodiversity will increase by more than 150 % in the exposed areas with a high fire probability (Sect. S5, Table S3). Outdoor recreation, soil retention and pollination ecosystem services will increase by 117 %, 100 % and 56 %, respectively. In contrast, the exposure with a low fire probability will decrease by between 50 % and 65 % each.
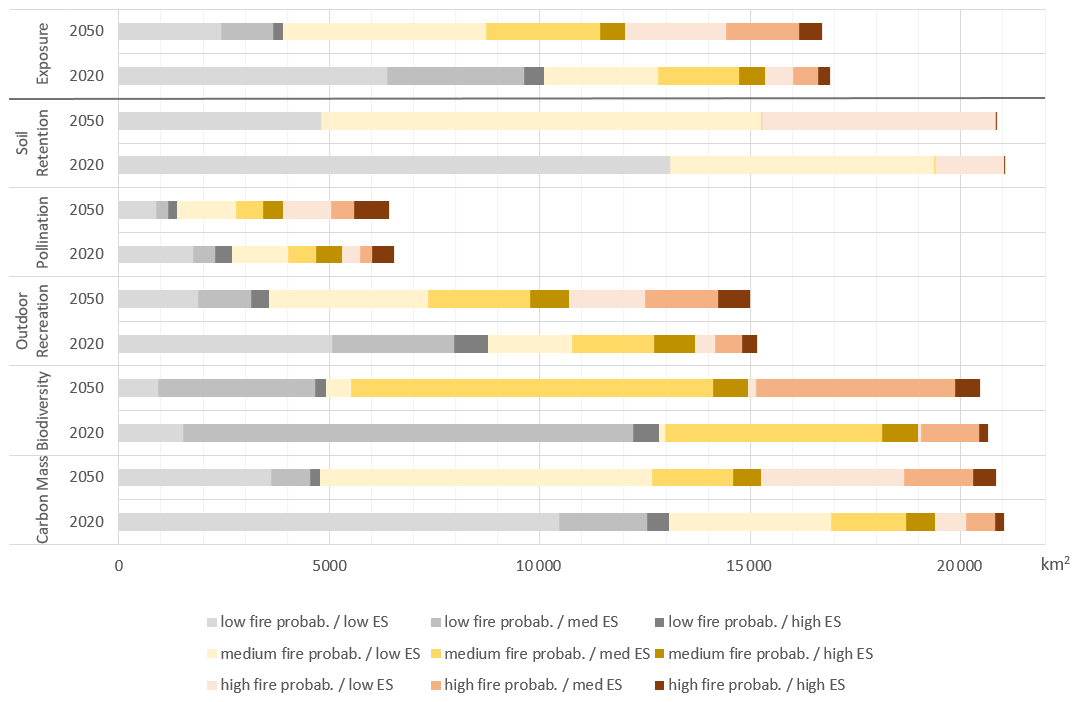
Figure 10Comparison of the fire hazard level – low (grey), medium (yellow), high (red) – by the importance of the socio-ecological elements exposed in different color tones (low, medium or high). Values show the surface average (km2) in August 2020 and 2050.
Figure 11 shows how the percentage of vulnerable areas is distributed in each of the variables analyzed as a function of the fire probability. Therefore, following the same trend as exposed areas, ecosystem services and ecological values increase fire risk with the influence of climate change. The WUI (wildland–urban interface) case increases by 19 % for high fire probabilities in 2050, and almost half of the wildfires will be at medium risk. In both WAI (wildland–agriculture interface) and protected areas, half of their areas could face a high fire risk in the future, doubling the 2020 data.
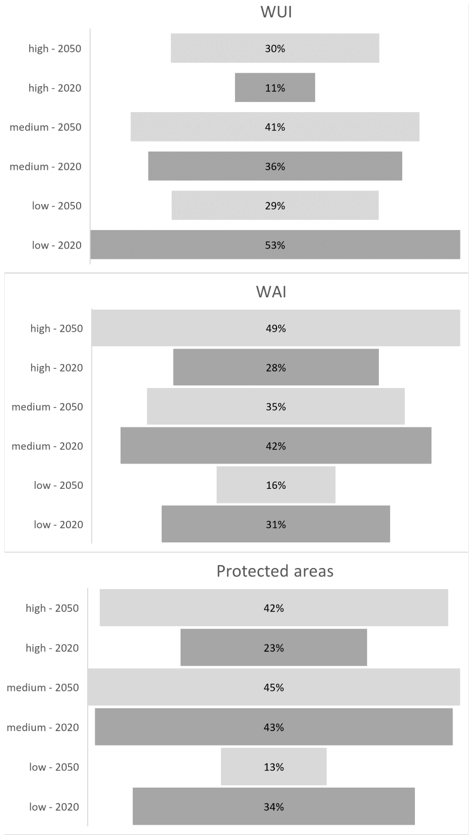
Figure 11Percentage of the vulnerable areas distributed in each of the variables analyzed (WUI, WAI, protected areas) as a function of the fire probability.
Most of the vulnerable locations close to agricultural areas have a high probability of fire. However, one of the areas with high vulnerability in the protected area overlaps with sites that are difficult to access for the population, such as the Nebrodi Park or the Madonie Regional Natural Park (Fig. 12).
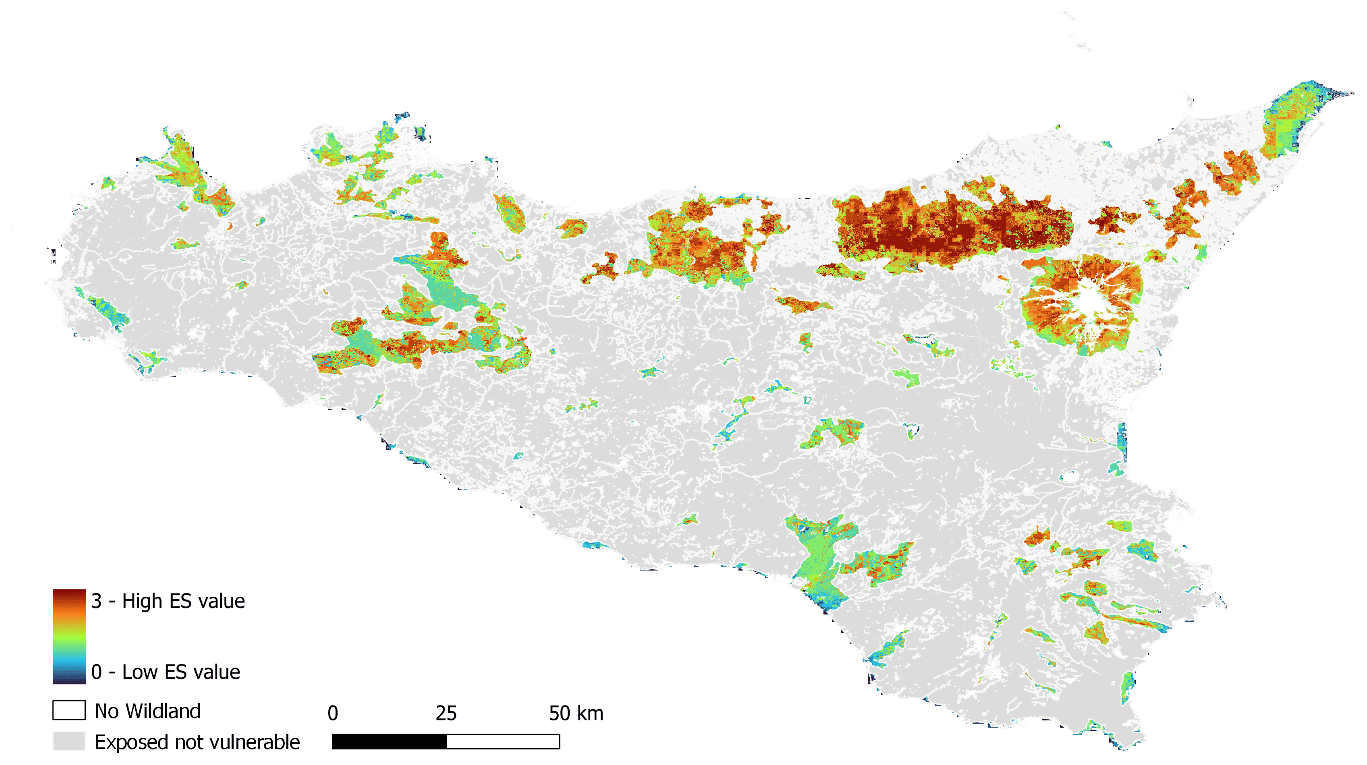
Figure 12Risk map of hot spots of biodiversity and ecosystem services exposed in protected areas, at the wildland–urban interface and at the wildland–agricultural interface in August 2020, colored from blue with a value of 0 (low socio-environmental value) to red with a value of 3 (high socio-environmental value). Areas that are exposed but not vulnerable are shaded in grey. Areas with no wildland and areas that are not exposed are in white.
Overall, the area with the highest socio-ecological value is in the northeastern quadrant of the island, coinciding with the areas of highest fire risk. In contrast, regions with low protection are primarily agricultural areas, urban surroundings or areas that have been affected by fire in the recent past. These non-vulnerable areas dominate most of the Sicilian territory.
Although historical fire data are becoming more accessible and findable, there is still much to be done to enhance their full use (e.g., their interoperability and reusability). The most reliable data are those collected in the field by authorized public or private institutions, but in many cases, it is extremely difficult to access and download field data for the general public. In contrast, satellite data are becoming increasingly accessible. However, fires cannot always be properly detected by satellites for the following reasons: (i) they need a minimum fire size or intensity (linked to the resolution), (ii) there can be false alarms (commission errors), (iii) the information can be obscured by clouds or overstory vegetation, or (iv) the time of satellite overpass may not coincide with the fire (Hantson et al., 2013; Schroeder et al., 2008).
In this study, we use both satellite data and field data to verify and complement the fire-related information. Overall, common problems for satellite and field data are the scarce harmonization among data formats and the lack or bad quality of metadata. In this study, the main difficulties were the differences in parameters such as the coordinate reference system and lack of metadata information and fire attributes between the yearly perimeters of fire. By integrating the data in k.LAB, all the data resources were harmonized, properly classified and made available online with complete metadata.
Concerning the model quality, model errors are related to data location, spatio-temporal resolution or logical consistency (Guptill and Morrison, 2013; Kraak and Ormeling, 2020). Utilizing multiple data sources adds strength to the model and has been especially useful for detecting small wildfires related to land management: the vast majority of wildfires in Sicily. These kinds of wildfires may be too short-lived for administration technicians to record or not intense enough to be captured by satellites. Moreover, we find this strategy avoids a bias in the estimation of predictors' probabilities (Roy et al., 2005).
The historical fire set was analyzed, filtered, cleaned and processed prior to fire hazard modeling. The frequency of wildfires from 2007 to 2020 was analyzed; some areas have burned more than once in the same year or in more than 5 years during the 13-year period. We suggest that future studies would have to study why this phenomenon can happen and how it could be avoided, as such a high frequency of wildfires disrupts the cycle of natural processes of plants and animals, vegetation structure and composition, and associated ecosystem services.
Once the perimeters of each of the wildfires were identified, the associated information from the administration's wildfire records was combined with the active fire points from the satellites to find the fire ignition area. Some differences were observed in the satellite and the government data. This may be due to reasons mentioned above: wildfires not detectable by satellites or agricultural burnings detected as wildfires when the administration does not consider them as such. A great deal of effort was devoted to data collection, cleaning, validation, pre-processing and storage that complies with FAIR principles, leading to a reliable and open dataset on the basis of the occurrence of the fire model.
The model strength has been improved by extracting information from the predictors' data with dynamic and static variables such as meteorological or topographic data, respectively. Thus, the predictors have informed the model with values specific to each fire event. In addition, the predictors come from reliable and tested sources such as Copernicus or the Italian government as well as expert researchers and technicians. Some of the resources already existed within k.LAB, such as protected areas or human settlement distribution, and others were added, such as fuel types or the high-resolution digital elevation model. The new information has been annotated in the semantic language k.IM and, like the historical fire data, is now open to any user and can interact with other k.LAB models in line with the FAIR principles.
It should be noted that this model has taken into account not only some of the explanatory variables at the time of ignition but also some variables describing the ex ante situation. Variables such as the average maximum temperature of the previous week, the accumulated precipitation or the number of days without rain were prior to the fire. The influence of climatic factors can help to predict the occurrence of wildfires related to climate change and the stress to which the forest was exposed (Halofsky et al., 2020; Trumbore et al., 2015).
The machine learning algorithm used, BN (Bayesian network), provides a flexible and adaptable approach to structuring the peculiarities of fire hazard modeling: different data sources, changes in spatio-temporal resolution and dynamic versus static input data. BNs are useful in conducting probabilistic risk assessments, since they are capable of directly modeling all the probability distributions for stable conditions and trade-offs, which is crucial for risk assessments such as fire risk of complex ecological systems. They also provide insights into or quantification of the influence of a particular node on others (Kumar and Banerji, 2022). In addition, the evaluation of BNs presents much lower costs and efforts than other options, even when the dataset is partly incomplete, which is quite common for environment-related data (Bielza and Larrañaga, 2014). Most of the remaining issues are related to meteorological conditions and environmental data, due to either the timely failure of nearby stations or problems in post-processing. However, these problems can be solved by integrating data with higher spatial resolution, which, once semantically annotated, will automatically substitute lower-quality resources.
Another advantage of BNs is that they are not black-box models: the direct interpretation of the results, based on the probabilities of the predicting variables, is given in each node probability distribution. With traditional modeling it is often difficult to access the details of the model accuracy for the end user, leading to a lack of reliability. Thanks to k.LAB and its web browser k.Explorer, the accuracy of the model is accessible and interpretable for non-expert end users as stakeholders or land managers as we showed in the results. In line with FAIR principles, the final output and all the variables needed to compute the fire occurrence are supported by a narrative report produced at runtime to facilitate its interpretation. All these outputs are open and downloadable.
The algorithm used has provided significant values to detect areas with a high probability of fire occurrence. Thus, BNs provide a fast, reliable and accessible tool for land managers through k.LAB and semantics. The metrics related to type-I and type-II errors can have great implications in practice; their acceptable values give credibility to the application and use of the model in real situations.
The integrated model has been able to simplify a problem as complex as the occurrence of wildfires by combining very disparate datasets. Given the results, we successfully identified the different degrees of fire hazard. The model results change according to the most influential variables that can change over time and space, such as meteorological data, biophysical data and human pressure on the landscape.
By using k.LAB, a modeler can reutilize the model at any point in time, including calculating the fire hazard in real time or in future scenarios. For example, we have run the model with future data for 2050 assuming forest management does not change. It has been analyzed how, due to extreme temperatures and the stress that they will place on vegetation, the probability of wildfires will be higher in a large part of Sicily and, therefore, new areas will be affected. The easy adaptation of the BN models together with k.Explorer visualization facilities by the stakeholders simplifies the incorporation of new data in the future to test different land management alternatives.
As the fire hazard model was incorporated into the k.LAB modeling environment, this new model was able to interact and connect with existing models (Villa et al., 2017). Thus, we overlapped the future fire hazard with ecosystem services that had already been developed and published by scientific researchers. We chose the ecosystems that are directly affected by fire such as pollination, soil retention, outdoor recreation, biodiversity and carbon mass.
Models informing environmental decisions are usually developed in isolation, are self-contained, and have results mostly accessible only to code owners and their collaborators. However, in a globalized world with increasingly complex and intertwined problems, it is key to connect knowledge and develop methods that can identify integrated solutions (Balbi et al., 2022). The application of appropriate and reliable risk assessment techniques is key to understanding and potentially preventing future damage, but so is making this knowledge accessible to stakeholders. This study combines the power of artificial intelligence and, in particular, machine learning, knowledge representation and machine reasoning to model the risk of fire to ecosystem services in Sicily, the largest island in the Mediterranean Sea. We used the k.LAB technology, which provides a common platform to make data and models interoperable and accessible to non-technical users (Balbi et al., 2022).
In this study, we integrated historical fire data from 2007 to 2020 and other explanatory variables to identify the areas at the highest risk of fire in present and future scenarios. We developed a data-driven model using a Bayesian network (BN) classifier. Model analysis demonstrates that the BN algorithm applied to the historical wildfire data and their real-time variables achieves a high range of predictive accuracy. Despite the limitations identified such as the resolution of meteorological data or the ability to detect small wildfires, the findings reveal the usefulness of the method, including the possibility of rerunning the model at different time steps and spatial scales statically or dynamically.
The fire risk spatial results are easily accessible through a web browser and can be used freely by land managers and stakeholders. This can help to create new prevention guidelines or focus on the risky areas. Moreover, the model gives scientists and land managers indications about the variables that mostly affect fire probability and how this environmental risk can be mitigated.
Code and data used in this research are openly accessible and available via Marquez Torres (2023) (https://doi.org/10.5281/zenodo.7616451).
The supplement related to this article is available online at: https://doi.org/10.5194/nhess-23-2937-2023-supplement.
AMT, FV and SB conceptualized the project. AMT and GS provided the data. AMT developed and calibrated the model and ran the simulations. AMT analyzed the data and carried out the investigation. AMT visualized the data. AMT drafted the paper. GS, SB, SK and GA reviewed and edited the paper.
The contact author has declared that none of the authors has any competing interests.
Publisher's note: Copernicus Publications remains neutral with regard to jurisdictional claims in published maps and institutional affiliations.
This article is part of the special issue “The role of fire in the Earth system: understanding interactions with the land, atmosphere, and society (ESD/ACP/BG/GMD/NHESS inter-journal SI)”. It is a result of the EGU General Assembly 2020, 4–8 May 2020.
We would like to thank the University of Catania for data access, expertise and support. We acknowledge the use of the E-OBS dataset from the EU FP6 project UERRA (https://www.uerra.eu, last access: 25 August 2023) and the Copernicus Climate Change Service, as well as the data providers in the ECA&D project (https://www.ecad.eu, last access: 25 August 2023). We acknowledge the use of data and imagery from NASA's Fire Information for Resource Management System (FIRMS) (https://earthdata.nasa.gov/firms, last access: 25 August 2023), part of NASA's Earth Observing System Data and Information System (EOSDIS). Map data are under the copyright of OpenStreetMap contributors and are available from https://www.openstreetmap.org (last access: 25 August 2023).
This research has been supported by the Ministerio de Asuntos Económicos y Transformación Digital, Gobierno de España (grant no. MDM-2017-0714/PRE2018-085196). OR This research is part of FPI MDM-2017-0714-18-2 funded by MCIN/AEI/10.13039/501100011033 and partially supported by the University of Catania, as well as by the Basque Government through the BERC 2022–2025 program.
This paper was edited by Fang Li and reviewed by Marj Tonini and one anonymous referee.
Ager, A. and Finney, M. A.: Climate change impact on fire probability and severity in Mediterranean areas, in: Proceedings of the VI International Conference on Forest Fire Research, 15–18 November 2010, University of Coimbra Viegas, Coimbra, Portugal, p. 9, https://www.fs.usda.gov/research/treesearch/39345, last access: 30 August 2023), U.S. Department of Agriculture, 2010.
Aguilera, P. A., Fernández, A., Fernández, R., Rumí, R., and Salmerón, A.: Bayesian networks in environmental modelling, Environ. Model. Softw., 26, 1376–1388, https://doi.org/10.1016/j.envsoft.2011.06.004, 2011.
Aldersley, A., Murray, S. J., and Cornell, S. E.: Global and regional analysis of climate and human drivers of wildfire, Sci. Total Environ., 409, 3472–3481, https://doi.org/10.1016/j.scitotenv.2011.05.032, 2011.
Angelini, P., Bianco, P., Cardillo, A., Francescato, C., and Oriolo, G.: Gli habitat in Carta della Natura – schede descrittive degli habitat per la cartografia alla scala 1:50.000, ISPRA – Istituto Superiore per la Protezione e la Ricerca Ambientale, ISBN 978-88-448-0382-7, 2009.
Antrop, M.: Why landscapes of the past are important for the future, Landsc. Urban Plan., 70, 21–34, https://doi.org/10.1016/j.landurbplan.2003.10.002, 2005.
Arno, S. F. and Brown, J. K.: Overcoming the paradox in managing wildland fire, Western Wildlands, 17, 40–46, 1991.
Artés, T., Oom, D., de Rigo, D., Durrant, T. H., Maianti, P., Libertà, G., and San-Miguel-Ayanz, J.: A global wildfire dataset for the analysis of fire regimes and fire behaviour, Sci. Data, 6, 296, https://doi.org/10.1038/s41597-019-0312-2, 2019.
Baas, S., Conforti, P., Ahmed, S., and Markova, G.: The impact of disasters and crises on agriculture and food security, FAO, https://doi.org/10.4060/cb3673en (last access: 30 August 2023), 2018.
Bacciu, V., Hatzaki, M., Karali, A., Cauchy, A., Giannakopoulos, C., Spano, D., and Briche, E.: Investigating the Climate-Related Risk of Forest Fires for Mediterranean Islands' Blue Economy, Sustainability, 13, 10004, https://doi.org/10.3390/su131810004, 2021.
Baiamonte, G., Domina, G., Raimondo, F. M., and Bazan, G.: Agricultural landscapes and biodiversity conservation: a case study in Sicily (Italy), Biodivers. Conserv., 24, 3201–3216, https://doi.org/10.1007/s10531-015-0950-4, 2015.
Balbi, S., Selomane, O., Sitas, N., Blanchard, R., Kotzee, I., O'Farrell, P., and Villa, F.: Human dependence on natural resources in rapidly urbanising South African regions, Environ. Res. Lett., 14, 044008, https://doi.org/10.1088/1748-9326/aafe43, 2019.
Balbi, S., Bagstad, K. J., Magrach, A., Sanz, M. J., Aguilar-Amuchastegui, N., Giupponi, C., and Villa, F.: The global environmental agenda urgently needs a semantic web of knowledge, Environ. Evidence, 11, 1–6, https://doi.org/10.1186/s13750-022-00258-y, 2022.
Bao, J., Kendall, E. F., McGuinness, D. L., and Patel-Schneider, P. F.: OWL 2 Web Ontology Language Quick Reference Guide, in: 2nd Edn., W3C (World Wide Web Consortium), https://doi.org/10.1007/978-3-642-15970-1_5, 2012.
Bazan, G., Marino, P., Guarino, R., Domina, G., and Schicchi, R.: Bioclimatology and Vegetation Series in Sicily: A Geostatistical Approach, Ann. Bot. Fenn., 52, 1–18, https://doi.org/10.5735/085.052.0202, 2015.
Bazan, G., Castrorao Barba, A., Rotolo, A., and Marino, P.: Geobotanical approach to detect land-use change of a Mediterranean landscape: a case study in Central-Western Sicily, Geo J., 84, 795–811, https://doi.org/10.1007/s10708-018-9892-1, 2019.
Beuzen, T., Marshall, L., and Splinter, K. D.: A comparison of methods for discretizing continuous variables in Bayesian Networks, Environ. Model. Softw., 108, 61–66, https://doi.org/10.1016/j.envsoft.2018.07.007, 2018.
Bielza, C. and Larrañaga, P.: Discrete Bayesian Network Classifiers: A Survey, ACM Comput. Surv., 47, 5-1–5-43, https://doi.org/10.1145/2576868, 2014.
Birkmann, J., Buckle, P., Jaeger, J., Pelling, M., Setiadi, N., Garschagen, M., Fernando, N., and Kropp, J.: Extreme events and disasters: a window of opportunity for change? Analysis of organizational, institutional and political changes, formal and informal responses after mega-disasters, Nat. Hazards, 55, 637–655, https://doi.org/10.1007/s11069-008-9319-2, 2010.
Bisson, M., Favalli, M., Fornaciai, A., Mazzarini, F., Isola, I., Zanchetta, G., and Pareschi, M. T.: A rapid method to assess fire-related debris flow hazard in the Mediterranean region: An example from Sicily (southern Italy), Int. J. Appl. Earth Obs. Geoinf., 7, 217–231, https://doi.org/10.1016/j.jag.2005.04.003, 2005.
Bonanno, G.: Adaptive management as a tool to improve the conservation of endemic floras: the case of Sicily, Malta and their satellite islands, Biodivers. Conserv., 22, 1317–1354, https://doi.org/10.1007/s10531-013-0473-9, 2013.
Bond, W. J. and Keeley, J. E.: Fire as a global `herbivore': the ecology and evolution of flammable ecosystems, Trends Ecol. Evol., 20, 387–394, https://doi.org/10.1016/j.tree.2005.04.025, 2005.
Borsuk, M. E.: Bayesian Networks, in: Encyclopedia of Ecology, edited by: Jørgensen, S. E. and Fath, B. D., Academic Press, Oxford, 307–317, https://doi.org/10.1016/B978-008045405-4.00144-0, 2008.
Bouckaert, R. R.: Bayesian network classifiers in Weka, Department of Computer Science, Waikato University, Hamilton, https://hdl.handle.net/10289/85 (last access: 29 August 2023), 2004.
Bradley, A. P.: The use of the area under the ROC curve in the evaluation of machine learning algorithms, Pattern Recog., 30, 1145–1159, https://doi.org/10.1016/S0031-3203(96)00142-2, 1997.
Castellnou, M., Prat-Guitart, N., Arilla, E., Larrañaga, A., Nebot, E., Castellarnau, X., Vendrell, J., Pallàs, J., Herrera, J., Monturiol, M., Cespedes, J., Pagès, J., Gallardo, C., and Miralles, M.: Empowering strategic decision-making for wildfire management: avoiding the fear trap and creating a resilient landscape, Fire Ecol., 15, 1–17, https://doi.org/10.1186/s42408-019-0048-6, 2019.
Catalano, R., Di Stefano, P., Sulli, A., and Vitale, F. P.: Paleogeography and structure of the central Mediterranean: Sicily and its offshore area, Tectonophysics, 260, 291–323, https://doi.org/10.1016/0040-1951(95)00196-4, 1996.
Certini, G.: Effects of fire on properties of forest soils: a review, Oecologia, 143, 1–10, https://doi.org/10.1007/s00442-004-1788-8, 2005.
Chappaz, F. and Ganteaume, A.: Role of land-cover and WUI types on spatio-temporal dynamics of fires in the French Mediterranean area, Risk Analysis, 43, 1032–1057, https://doi.org/10.1111/risa.13979, 2022.
Chen, S. H. and Pollino, C. A.: Good practice in Bayesian network modelling, Environ. Model. Softw., 37, 134–145, https://doi.org/10.1016/j.envsoft.2012.03.012, 2012.
Chen, X.-W., Anantha, G., and Lin, X.: Improving Bayesian Network Structure Learning with Mutual Information-Based Node Ordering in the K2 Algorithm, IEEE T. Knowl. Data Eng., 20, 628–640, https://doi.org/10.1109/TKDE.2007.190732, 2008.
Chuvieco, E., Allgöwer, B., and Salas, J.: Integration of Physical and Human Factors in Fire Danger Assessment, in: Wildland Fire Danger Estimation and Mapping, Vol. 4, World Scientific, 197–218, https://doi.org/10.1142/9789812791177_0007, 2003.
Cohen, J.: The wildland-urban interface fire problem: A consequence of the fire exclusion paradigm, Forest History Today, https://www.fs.usda.gov/research/treesearch/33787 (last access: 30 August 2023), 20–26, 2008.
Cooper, G. F. and Herskovits, E.: A Bayesian method for the induction of probabilistic networks from data, Mach. Learn., 9, 309–347, 1992.
Cornes, R. C., van der Schrier, G., van den Besselaar, E. J. M., and Jones, P. D.: An Ensemble Version of the E-OBS Temperature and Precipitation Data Sets, J. Geophys. Res.-Atmos., 123, 9391–9409, https://doi.org/10.1029/2017JD028200, 2018.
Corrao, C.: Forest fires in Sicily, in: The Management of Mass Burn Casualties and Fire Disasters: Proceedings of the First International Conference on Burns and Fire Disasters, edited by: Masellis, M. and Gunn, S. W. A., Springer Netherlands, Dordrecht, 60–63, https://doi.org/10.1007/978-0-585-33973-3_9, 1992.
Cullotta, S. and Marchetti, M.: Forest types for biodiversity assessment at regional level: the case study of Sicily (Italy), Eur. J. Forest Res., 126, 431–447, https://doi.org/10.1007/s10342-006-0166-y, 2007.
Daily, G. C.: Nature's Services: Societal Dependence on Natural Ecosystems, in: The Future of Nature: Documents of Global Change, Yale University Press, 454–464, https://doi.org/10.12987/9780300188479-039, 1997.
Di Maida, G.: The earliest human occupation of Sicily: A review, The Journal of Island and Coastal Archaeology, 17, 402–419, https://doi.org/10.1080/15564894.2020.1803460, 2020.
Drago, A.: Desertification processes and possible mitigation actions [Sicily], Tecnica Agricola (Italy), http://www.sias.regione.sicilia.it/pdf/Desertificazione_mitigazione_SIAS.pdf (last access: 31 August 2023), 2005.
Duane, A., Castellnou, M., and Brotons, L.: Towards a comprehensive look at global drivers of novel extreme wildfire events, Climatic Change, 165, 1–21, https://doi.org/10.1007/s10584-021-03066-4, 2021.
Faivre, N., Jin, Y., Goulden, M. L., Randerson, J. T., Faivre, N., Jin, Y., Goulden, M. L., and Randerson, J. T.: Controls on the spatial pattern of wildfire ignitions in Southern California, Int. J. Wildland Fire, 23, 799–811, https://doi.org/10.1071/WF13136, 2014.
Falcucci, A., Maiorano, L., and Boitani, L.: Changes in land-use/land-cover patterns in Italy and their implications for biodiversity conservation, Landscape Ecol., 22, 617–631, https://doi.org/10.1007/s10980-006-9056-4, 2007.
Fawcett, T.: An introduction to ROC analysis, Pattern Recog. Lett., 27, 861–874, https://doi.org/10.1016/j.patrec.2005.10.010, 2006.
Ferrara, C., Salvati, L., Corona, P., Romano, R., and Marchi, M.: The background context matters: Local-scale socioeconomic conditions and the spatial distribution of wildfires in Italy, Sci. Total Environ., 654, 43–52, https://doi.org/10.1016/j.scitotenv.2018.11.049, 2019.
Frank, E., Hall, M. A., and Witten, I. H.: The WEKA Workbench, in: Online Appendix for “Data Mining: Practical Machine Learning Tools and Techniques”, 4th Edn., Morgan Kaufmann, https://www.cs.waikato.ac.nz/ml/weka/Witten_et_al_2016_appendix.pdf (last access: 31 August 2023), 2016.
Friedman, N. and Goldszmidt, M.: Discretizing Continuous Attributes While Learning Bayesian Networks, in: Proceedings of the 13th International Conference on Machine Learning, 1996, San Francico, Ca, USA, 157–165, ISBN 1558604197, 1996.
Fu, Y., Li, R., Wang, X., Bergeron, Y., Valeria, O., Chavardès, R. D., Wang, Y., and Hu, J.: Fire Detection and Fire Radiative Power in Forests and Low-Biomass Lands in Northeast Asia: MODIS versus VIIRS Fire Products, Remote Sens., 12, 2870, https://doi.org/10.3390/rs12182870, 2020.
Ganteaume, A., Camia, A., Jappiot, M., San-Miguel-Ayanz, J., Long-Fournel, M., and Lampin, C.: A review of the main driving factors of forest fire ignition over Europe, Environ. Manage., 51, 651–662, https://doi.org/10.1007/s00267-012-9961-z, 2013.
Ganteaume, A., Barbero, R., Jappiot, M., and Maillé, E.: Understanding future changes to fires in southern Europe and their impacts on the wildland-urban interface, J. Safe. Sci. Resil., 2, 20–29, https://doi.org/10.1016/j.jnlssr.2021.01.001, 2021.
Gibbs, H. K. and Ruesch, A.: New IPCC Tier-1 Global Biomass Carbon Map for the Year 2000, Environmental System Science Data Infrastructure for a Virtual Ecosystem (ESS-DIVE) (United States), https://doi.org/10.15485/1463800, 2008.
Giglio, L., Schroeder, W., and Justice, C. O.: The collection 6 MODIS active fire detection algorithm and fire products, Remote Sens. Environ., 178, 31–41, https://doi.org/10.1016/j.rse.2016.02.054, 2016.
Giorgi, F., Jones, C., and Asrar, G.: Addressing Climate Information Needs at the Regional Level: the CORDEX Framework, World Meteorological Organization, https://public.wmo.int/en/bulletin/addressing-climate-information-needs-regional-level-cordex-framework (last access: 31 August 2023), 175–183, 2009.
Grothmann, T. and Patt, A.: Adaptive capacity and human cognition: The process of individual adaptation to climate change, Global Environ. Change, 15, 199–213, https://doi.org/10.1016/j.gloenvcha.2005.01.002, 2005.
Guidotti, R., Monreale, A., Ruggieri, S., Turini, F., Giannotti, F., and Pedreschi, D.: A Survey of Methods for Explaining Black Box Models, ACM Comput. Surv., 51, 93-1–93-42, https://doi.org/10.1145/3236009, 2018.
Guptill, S. C. and Morrison, J. L.: Elements of Spatial Data Quality, Elsevier, 219 pp., ISBN 9781483287942, 2013.
Halofsky, J. E., Peterson, D. L., and Harvey, B. J.: Changing wildfire, changing forests: the effects of climate change on fire regimes and vegetation in the Pacific Northwest, USA, Fire Ecol., 16, 1–26, https://doi.org/10.1186/s42408-019-0062-8, 2020.
Hantson, S., Padilla, M., Corti, D., and Chuvieco, E.: Strengths and weaknesses of MODIS hotspots to characterize global fire occurrence, Remote Sens. Environ., 131, 152–159, https://doi.org/10.1016/j.rse.2012.12.004, 2013.
Hantson, S., Pueyo, S., and Chuvieco, E.: Global fire size distribution is driven by human impact and climate, Global Ecol. Biogeogr., 24, 77–86, https://doi.org/10.1111/geb.12246, 2015.
Henriksen, H. J., Rasmussen, P., Brandt, G., von Bülow, D., and Jensen, F. V.: Public participation modelling using Bayesian networks in management of groundwater contamination, Environ. Model. Softw., 22, 1101–1113, https://doi.org/10.1016/j.envsoft.2006.01.008, 2007.
Intini, P., Ronchi, E., Gwynne, S., and Bénichou, N.: Guidance on Design and Construction of the Built Environment Against Wildland Urban Interface Fire Hazard: A Review, Fire Technol., 56, 1853–1883, https://doi.org/10.1007/s10694-019-00902-z, 2020.
IPCC: 2006 IPCC Guidelines for National Greenhouse Gas Inventories, Prepared by the National Greenhouse Gas Inventories Programm, IGES, Japan, https://www.ipcc-nggip.iges.or.jp/public/2006gl/index.html (last access: 2 August 2023), 2006.
IPCC: Managing the Risks of Extreme Events and Disasters to Advance Climate Change Adaptation – IPCC, IPCC, Cambridge University Press, Cambridge, UK and New York, NY, USA, ISBN 9781107607804, 2012.
Jain, P., Coogan, S. C. P., Subramanian, S. G., Crowley, M., Taylor, S., and Flannigan, M. D.: A review of machine learning applications in wildfire science and management, Environ. Rev., 28, 478–505, https://doi.org/10.1139/er-2020-0019, 2020.
Kangas, A. S. and Kangas, J.: Probability, possibility and evidence: approaches to consider risk and uncertainty in forestry decision analysis, Forest Policy Econ., 6, 169–188, https://doi.org/10.1016/S1389-9341(02)00083-7, 2004.
Kelly, L. T. and Brotons, L.: Using fire to promote biodiversity, Science, 355, 1264–1265, https://doi.org/10.1126/science.aam7672, 2017.
Kocher, S. D. and Butsic, V.: Governance of Land Use Planning to Reduce Fire Risk to Homes Mediterranean France and California, Land, 6, 24, https://doi.org/10.3390/land6020024, 2017.
Kraak, M.-J. and Ormeling, F.: Cartography: Visualization of Geospatial Data, in: 4th Edn., CRC Press, Boca Raton, 261 pp., https://doi.org/10.1201/9780429464195, 2020.
Kumar, S. and Banerji, H.: Bayesian network modeling for economic-socio-cultural sustainability of neighborhood-level urban communities: Reflections from Kolkata, an Indian megacity, Sustain. Cities Soc., 78, 103632, https://doi.org/10.1016/j.scs.2021.103632, 2022.
Lasaponara, R., Lanorte, A., and Pignatti, S.: Characterization and Mapping of Fuel Types for the Mediterranean Ecosystems of Pollino National Park in Southern Italy by Using Hyperspectral MIVIS Data, Earth Interact., 10, 1–11, https://doi.org/10.1175/EI165.1, 2006.
Leone, V., Lovreglio, R., Martín, M. P., Martínez, J., and Vilar, L.: Human Factors of Fire Occurrence in the Mediterranean, Earth Observation of Wildland Fires in Mediterranean Ecosystems, Springer, 149–170, https://doi.org/10.1007/978-3-642-01754-4_11, 2009.
Li, Z., Kamnitsas, K., and Glocker, B.: Analyzing Overfitting Under Class Imbalance in Neural Networks for Image Segmentation, IEEE T. Medic. Imag., 40, 1065–1077, https://doi.org/10.1109/TMI.2020.3046692, 2021.
Lozano, O. M., Salis, M., Ager, A. A., Arca, B., Alcasena, F. J., Monteiro, A. T., Finney, M. A., Del Giudice, L., Scoccimarro, E., and Spano, D.: Assessing Climate Change Impacts on Wildfire Exposure in Mediterranean Areas, Risk Anal., 37, 1898–1916, https://doi.org/10.1111/risa.12739, 2017.
Marcot, B. G., Steventon, J. D., Sutherland, G. D., and McCann, R. K.: Guidelines for developing and updating Bayesian belief networks applied to ecological modeling and conservation, Can. J. Forest Res., 36, 3063–3074, https://doi.org/10.1139/x06-135, 2006.
Marquez Torres, A.: amarqueztorres/fire_risk_sicily: Fire Sicily, Zenodo [code and data set], https://doi.org/10.5281/zenodo.7616451, 2023.
Martínez-López, J., Bagstad, K. J., Balbi, S., Magrach, A., Voigt, B., Athanasiadis, I., Pascual, M., Willcock, S., and Villa, F.: Towards globally customizable ecosystem service models, Sci. Total Environ., 650, 2325–2336, https://doi.org/10.1016/j.scitotenv.2018.09.371, 2019.
Merrill, D. F. and Alexander, M. E.: Glossary of forest fire management terms, National Research Council of Canada, Canadian Committee on Forest Fire Management, 91 pp., https://cfs.nrcan.gc.ca/publications?id=35337 (last access: 31 August 2023), 1987.
Michael, Y., Helman, D., Glickman, O., Gabay, D., Brenner, S., and Lensky, I. M.: Forecasting fire risk with machine learning and dynamic information derived from satellite vegetation index time-series, Sci. Total Environ., 764, 142844, https://doi.org/10.1016/j.scitotenv.2020.142844, 2021.
Mohajane, M., Costache, R., Karimi, F., Bao Pham, Q., Essahlaoui, A., Nguyen, H., Laneve, G., and Oudija, F.: Application of remote sensing and machine learning algorithms for forest fire mapping in a Mediterranean area, Ecol. Indicat., 129, 107869, https://doi.org/10.1016/j.ecolind.2021.107869, 2021.
Molina, M. O., Sánchez, E., and Gutiérrez, C.: Future heat waves over the Mediterranean from an Euro-CORDEX regional climate model ensemble, Sci. Rep., 10, 8801, https://doi.org/10.1038/s41598-020-65663-0, 2020.
Moreira, F. and Russo, D.: Modelling the impact of agricultural abandonment and wildfires on vertebrate diversity in Mediterranean Europe, Landscape Ecol., 22, 1461–1476, https://doi.org/10.1007/s10980-007-9125-3, 2007.
Mouillot, F., Ratte, J.-P., Joffre, R., Mouillot, D., and Rambal, S.: Long-term forest dynamic after land abandonment in a fire prone Mediterranean landscape (central Corsica, France), Landscape Ecol., 20, 101–112, https://doi.org/10.1007/s10980-004-1297-5, 2005.
Narcizo, L., Santos, F. L., Peres, L. F., Trigo, R., and Libonati, R.: The impact of heat waves in forest fires over the Amazon rainforest, in: EGU General Assembly 2022, EGU22-10772, https://doi.org/10.5194/egusphere-egu22-10772, 2022.
Nikolakis, W. and Roberts, E.: Wildfire governance in a changing world: Insights for policy learning and policy transfer, Risk Hazards Crisis Publ. Policy, 13, 144–164, https://doi.org/10.1002/rhc3.12235, 2022.
Nojarov, P. and Nikolova, M.: Heat waves and forest fires in Bulgaria, Nat. Hazards, https://doi.org/10.1007/s11069-022-05451-3, in press, 2022.
Oliveira, S., Oehler, F., San-Miguel-Ayanz, J., Camia, A., and Pereira, J. M. C.: Modeling spatial patterns of fire occurrence in Mediterranean Europe using Multiple Regression and Random Forest, Forest Ecol. Manage., 275, 117–129, https://doi.org/10.1016/j.foreco.2012.03.003, 2012.
OpenStreetMap contributors: Planet dump, https://planet.osm.org (last access: 1 August 2023), 2020.
Ortega, M., Saura, S., González-Avila, S., Gómez-Sanz, V., and Elena-Rosselló, R.: Landscape vulnerability to wildfires at the forest-agriculture interface: half-century patterns in Spain assessed through the SISPARES monitoring framework, Agroforest Syst., 85, 331–349, https://doi.org/10.1007/s10457-011-9423-2, 2012.
Otero, I., Castellnou, M., González, I., Arilla, E., Castell, L., Castellví, J., Sánchez, F., and Nielsen, J. Ø.: Democratizing wildfire strategies. Do you realize what it means? Insights from a participatory process in the Montseny region (Catalonia, Spain), PLOS ONE, 13, e0204806, https://doi.org/10.1371/journal.pone.0204806, 2018.
Paracchini, M. L., Zulian, G., Kopperoinen, L., Maes, J., Schägner, J. P., Termansen, M., Zandersen, M., Perez-Soba, M., Scholefield, P. A., and Bidoglio, G.: Mapping cultural ecosystem services: A framework to assess the potential for outdoor recreation across the EU, Ecol. Indicat., 45, 371–385, https://doi.org/10.1016/j.ecolind.2014.04.018, 2014.
Parente, J., Pereira, M. G., Amraoui, M., and Fischer, E. M.: Heat waves in Portugal: Current regime, changes in future climate and impacts on extreme wildfires, Sci. Total Environ., 631–632, 534–549, https://doi.org/10.1016/j.scitotenv.2018.03.044, 2018.
Pausas, J. G. and Fernández-Muñoz, S.: Fire regime changes in the Western Mediterranean Basin: from fuel-limited to drought-driven fire regime, Climatic Change, 110, 215–226, https://doi.org/10.1007/s10584-011-0060-6, 2012.
Pausas, J. G., Bradstock, R. A., Keith, D. A., and Keeley, J. E.: Plant Functional Traits in Relation to Fire in Crown-Fire Ecosystems, Ecology, 85, 1085–1100, https://doi.org/10.1890/02-4094, 2004.
Pausas, J. G., Llovet, J., Rodrigo, A., Vallejo, R., Pausas, J. G., Llovet, J., Rodrigo, A., and Vallejo, R.: Are wildfires a disaster in the Mediterranean basin? – A review, Int. J. Wildland Fire, 17, 713–723, https://doi.org/10.1071/WF07151, 2008.
Pearl, J.: Probabilistic Reasoning in Intelligent Systems: Networks of Plausible Inference, Morgan Kaufmann, 576 pp., https://doi.org/10.1016/C2009-0-27609-4, 1988.
Pearl, J.: Causality, Cambridge University Press, 486 pp., https://doi.org/10.1017/CBO9780511803161, 2009.
Penman, T. D., Price, O., Bradstock, R. A., Penman, T. D., Price, O., and Bradstock, R. A.: Bayes Nets as a method for analysing the influence of management actions in fire planning, Int. J. Wildland Fire, 20, 909–920, https://doi.org/10.1071/WF10076, 2011.
Peruzzi, L., Conti, F., and Bartolucci, F.: An inventory of vascular plants endemic to Italy, Phytotaxa, 168, 1–75, 2014.
Planistat Europe and Bradley Dunbar Association: Analysis of the island regions and outermost regions of the European Union: Part I The island regions and territories, European Commission, https://ec.europa.eu/regional_policy/sources/docgener/studies/pdf/ilesrup/islands_part1_summary_en.pdf (last access: 6 August 2020), 2003.
Prestia, G. and Scavone, V.: Enhancing the Endogenous Potential of Agricultural Landscapes: Strategies and Projects for a Inland Rural Region of Sicily, in: Smart and Sustainable Planning for Cities and Regions, Sspcr 2017, April 2018, New York, 635–648, https://doi.org/10.1007/978-3-319-75774-2_43, 2018.
Ragusa, M. A. and Rapicavoli, V.: Levels of desertification risk in the Sicilian forests according to MEDALUS-ESPI protocol, AIP Conf. Proc., 1863, 530004, https://doi.org/10.1063/1.4992674, 2017.
Regos, A., Aquilué, N., Retana, J., Cáceres, M. D., and Brotons, L.: Using Unplanned Fires to Help Suppressing Future Large Fires in Mediterranean Forests, PLOS ONE, 9, e94906, https://doi.org/10.1371/journal.pone.0094906, 2014.
Renard, K. G., Foster, G. R., Weesies, G. A., McCool, D. K., and Yoder: Predicting soil erosion by water: a guide to conservation planning with the revised universal soil loss equation (RUSLE), US Department of Agriculture, Agricultural Research Service, Tucson, 404 pp., 1997.
Rennie, J. D. M., Shih, L., Teevan, J., and Karger, D. R.: Tackling the poor assumptions of naive bayes text classifiers, in: Proceedings of the Twentieth International Conference on International Conference on Machine Learning, August 2003, Washington, DC, USA, 616–623, https://doi.org/10.5555/3041838.3041916, 2003.
Ricotta, C. and Di Vito, S.: Modeling the Landscape Drivers of Fire Recurrence in Sardinia (Italy), Environ. Manage., 53, 1077–1084, https://doi.org/10.1007/s00267-014-0269-z, 2014.
Robinne, F.-N., Parisien, M.-A., Flannigan, M., Robinne, F.-N., Parisien, M.-A., and Flannigan, M.: Anthropogenic influence on wildfire activity in Alberta, Canada, Int. J. Wildland Fire, 25, 1131–1143, https://doi.org/10.1071/WF16058, 2016.
Roces-Díaz, J. V., Santín, C., Martínez-Vilalta, J., and Doerr, S. H.: A global synthesis of fire effects on ecosystem services of forests and woodlands, Front. Ecol. Environ., 20, 170–178, https://doi.org/10.1002/fee.2349, 2022.
Rodrigues, M. and de la Riva, J.: An insight into machine-learning algorithms to model human-caused wildfire occurrence, Environ. Model. Softw., 57, 192–201, https://doi.org/10.1016/j.envsoft.2014.03.003, 2014.
Roy, D. P., Jin, Y., Lewis, P. E., and Justice, C. O.: Prototyping a global algorithm for systematic fire-affected area mapping using MODIS time series data, Remote Sens. Environ., 97, 137–162, https://doi.org/10.1016/j.rse.2005.04.007, 2005.
Ruffault, J., Curt, T., Moron, V., Trigo, R. M., Mouillot, F., Koutsias, N., Pimont, F., Martin-StPaul, N., Barbero, R., Dupuy, J.-L., Russo, A., and Belhadj-Khedher, C.: Increased likelihood of heat-induced large wildfires in the Mediterranean Basin, Sci. Rep., 10, 13790, https://doi.org/10.1038/s41598-020-70069-z, 2020.
Satir, O., Berberoglu, S., and Donmez, C.: Mapping regional forest fire probability using artificial neural network model in a Mediterranean forest ecosystem, Geomat. Nat. Hazards Risk, 7, 1645–1658, https://doi.org/10.1080/19475705.2015.1084541, 2016.
Schroeder, W., Csiszar, I., and Morisette, J.: Quantifying the impact of cloud obscuration on remote sensing of active fires in the Brazilian Amazon, Remote Sens. Environ., 112, 456–470, https://doi.org/10.1016/j.rse.2007.05.004, 2008.
Schroeder, W., Oliva, P., Giglio, L., and Csiszar, I. A.: The New VIIRS 375 m active fire detection data product: Algorithm description and initial assessment, Remote Sens. Environ., 143, 85–96, https://doi.org/10.1016/j.rse.2013.12.008, 2014.
Sereni, E.: Storia del paesaggio agrario italiano, 20th edn., Laterza, 499 pp., ISBN 978-88-420-2094-3, 1961.
Sicilia Assessorato beni culturali ed ambientali e pubblica istruzione: Linee guida del piano territoriale paesistico regionale/Regione siciliana, Assessorato dei beni culturali ambientali e della pubblica istruzione, Regione siciliana, Assessorato regionale dei beni culturali ed ambientali e della pubblica istruzione, \Palermo!, vii + 472 pp., https://www2.regione.sicilia.it/beniculturali/dirbenicult/bca/ptpr/LineeGuida.pdf (last access: 31 August 2023), 1996.
Tedim, F., McCaffrey, S., Leone, V., Delogu, G. M., Castelnou, M., McGee, T. K., and Aranha, J.: 13 – What can we do differently about the extreme wildfire problem: An overview, in: Extreme Wildfire Events and Disasters, edited by: Tedim, F., Leone, V., and McGee, T. K., Elsevier, 233–263, https://doi.org/10.1016/B978-0-12-815721-3.00013-8, 2020.
Thomaidis, K., Troll, V. R., Deegan, F. M., Freda, C., Corsaro, R. A., Behncke, B., and Rafailidis, S.: A message from the `underground forge of the gods': history and current eruptions at Mt Etna, Geol. Today, 37, 141–149, https://doi.org/10.1111/gto.12362, 2021.
Trumbore, S., Brando, P., and Hartmann, H.: Forest health and global change, Science, 349, 814–818, https://doi.org/10.1126/science.aac6759, 2015.
Tymstra, C., Stocks, B. J., Cai, X., and Flannigan, M. D.: Wildfire management in Canada: Review, challenges and opportunities, Progr. Disast. Sci., 5, 100045, https://doi.org/10.1016/j.pdisas.2019.100045, 2020.
UNEP-WCMC and IUCN: Protected Planet: The World Database on Protected Areas (WDPA) [Online], UNEP-WCMC and IUCN, Cambridge, UK, https://www.protectedplanet.net/en/search-areas?filters%5Bdb_type%5D%5B%5D=wdpa&geo_type=region (last access: 31 August 2023), 2022.
Villa, F., Balbi, S., Athanasiadis, I. N., and Caracciolo, C.: Semantics for interoperability of distributed data and models: Foundations for better-connected information, F1000 Res., 6, 686, https://doi.org/10.12688/f1000research.11638.1, 2017.
Weichselgartner, J. and Pigeon, P.: The Role of Knowledge in Disaster Risk Reduction, Int. J. Disast. Risk Sci., 6, 107–116, https://doi.org/10.1007/s13753-015-0052-7, 2015.
Wilkinson, M. D., Dumontier, M., Aalbersberg, I. J., Appleton, G., Axton, M., Baak, A., Blomberg, N., Boiten, J.-W., da Santos, L. B. S., Bourne, P. E., Bouwman, J., Brookes, A. J., Clark, T., Crosas, M., Dillo, I., Dumon, O., Edmunds, S., Evelo, C. T., Finkers, R., Gonzalez-Beltran, A., Gray, A. J. G., Groth, P., Goble, C., Grethe, J. S., Heringa, J., t'Hoen, P. A. C., Hooft, R., Kuhn, T., Kok, R., Kok, J., Lusher, S. J., Martone, M. E., Mons, A., Packer, A. L., Persson, B., Rocca-Serra, P., Roos, M., van Schaik, R., Sansone, S.-A., Schultes, E., Sengstag, T., Slater, T., Strawn, G., Swertz, M. A., Thompson, M., van der Lei, J., van Mulligen, E., Velterop, J., Waagmeester, A., Wittenburg, P., Wolstencroft, K., Zhao, J., and Mons, B.: The FAIR Guiding Principles for scientific data management and stewardship, Sci. Data, 3, 1–9, https://doi.org/10.1038/sdata.2016.18, 2016.
Willcock, S., Martínez-López, J., Hooftman, D. A. P., Bagstad, K. J., Balbi, S., Marzo, A., Prato, C., Sciandrello, S., Signorello, G., Voigt, B., Villa, F., Bullock, J. M., and Athanasiadis, I. N.: Machine learning for ecosystem services, Ecosyst. Serv., 33, 165–174, https://doi.org/10.1016/j.ecoser.2018.04.004, 2018.
Wittenberg, L. and Malkinson, D.: Spatio-temporal perspectives of forest fires regimes in a maturing Mediterranean mixed pine landscape, Eur. J. Forest Res., 128, 297–304, https://doi.org/10.1007/s10342-009-0265-7, 2009.
Wunder, S., Calkin, D. E., Charlton, V., Feder, S., Martínez de Arano, I., Moore, P., Rodríguez y Silva, F., Tacconi, L., and Vega-García, C.: Resilient landscapes to prevent catastrophic forest fires: Socioeconomic insights towards a new paradigm, Forest Policy Econ., 128, 102458, https://doi.org/10.1016/j.forpol.2021.102458, 2021.