the Creative Commons Attribution 4.0 License.
the Creative Commons Attribution 4.0 License.
 | 20 Jan 2023
Invited perspectives: An insurer's perspective on the knowns and unknowns in natural hazard risk modelling
Madeleine-Sophie Déroche
This paper analyses how the current loss modelling framework that was developed in the 1990s to respond to Hurricane Andrew market crisis falls short in dealing with today's complexity. In effect, beyond reflecting and supporting the current understanding and knowledge of risks, data and models are used in the assessment of situations that have not been experienced yet. To address this question, we considered the (re)insurance market's current body of knowledge on natural hazard loss modelling, the fruit of over 30 years of research conducted by (re)insurers, brokers, modelling firms, and other private companies and academics in the atmospheric sciences, geosciences, civil engineering studies, and data sciences among others. Our study shows that to successfully manage the complexity of the interactions between natural elements and the customer ecosystem, it is essential that both private companies in the insurance sector and academia continue working together to co-build and share common data collection and modelling. This paper (i) proves the need to conduct an in-depth review of the existing loss modelling framework and (ii) makes it clear that only a transdisciplinary effort will be up to the challenge of building global loss models. These two factors are essential to capture the interactions and increasing complexity of the three risk drivers – exposure, hazard, and vulnerability – thus enabling insurers to anticipate and be equipped to face the far-ranging impacts of climate change and other natural events.


The mission of property and casualty (P&C) insurers is to effectively protect clients' property and activities while ensuring the solvency of the company. Though insurers develop ever-increasing products to respond to clients' specific needs, P&C insurance in essence consists of two segments, the (i) retail business for homeowners and car owners and (ii) commercial business for corporate clients. Insurance protection goes beyond risk transfer (i.e. the payment of a premium against future claims); it also encompasses prevention actions such as reinforcing customers' risk awareness and proposing adapted protective solutions. For example, in commercial business, technical risk experts perform on-site visits to evaluate the state of buildings and identify potential vulnerabilities to natural hazards. The objective is to assess how natural hazards could generate damage either to the buildings themselves (e.g. storage warehouses, data centres, shopping centres) or to their contents (e.g. machinery, production chains, stock) and if such damage could cause business interruption (e.g. employees/clients/suppliers being unable to access the building for N days resulting in a loss of turnover or profits). Prevention measures like elevating goods or machinery in the event of flooding are then suggested or imposed post-assessment to reduce the risk and adjust the premium.
In the retail business with its mass of clients, protection actions have to be taken globally instead of individually. For example, after the Great Fire of London in 1666 that destroyed most of the city's buildings, made of wood at that time, insurance premium rates were lowered for buildings made of brick to encourage brick constructions instead of wood, thus reducing the fire risk in London.
To achieve their mission of protection, it is essential for insurers to identify and quantify the risks associated with the underwritten policies. All along the P&C insurance value chain, a vast range of data feed an equally vast range of models to estimate the losses for the varying probabilities and magnitudes of all the underwritten risks, be they natural hazards, financial, or cyber. These models serve to support decision-making from the actual underwriting and pricing of an individual or corporate policy to the setting and optimization of the reinsurance programmes at the insurance company level.
The regulatory environment also plays a significant role in validating the models (re)insurers use to assess risks and, ultimately, better protect the end customer. Regulations require (re)insurers to notably assess the extreme losses of all their risks to determine their minimum level of economic capital to ensure the (re)insurance companies' solvency in the event of intensely severe years. The European Solvency II regulation is a case in point. (Re)insurers with Europe-based headquarters are required to annually project their losses for a 200-year-return-period shock along with the associated risk management actions such as the purchasing of reinsurance coverage. This estimated amount of loss determines the level of capital (re)insurers have to bear in their owned funds to resist such a shock if it were to occur in the following year. The models used to assess this loss require approval, and any change is thoroughly monitored by regulatory authorities.
Sound and adaptive risk assessment and management are built over time through a continuous reassessment of insurers' understanding of the “known knowns”, what we know we know; the “known unknowns”, what we know we do not know; and the “unknown unknowns”, what we do not even know we do not know (Girard, 2009). This reassessment process induces a knowledge cycle: data continuously support the current understanding and knowledge of a risk, that is, what we know we know. On the basis of this understanding, models are also built to support assessing situations that have yet to be experienced such as extreme events, that is, what we know we do not know. However, the occurrence of unknown unknowns triggered by natural and organizational issues that insurers either ignore or have yet to understand points to a pressing need to upgrade data collection, modelling methods, and tools to perpetually enhance the view of risk and further insights for the decision-making process.
Prior to focusing on the scientific and technical advances made to keep refining what we know about the risk drivers, exposure, hazard, and vulnerability and how to increase insurers' preparedness for the unknown, it is important to recall how the reassessment process engendered the natural hazard loss modelling framework from the outset.
2.1 The co-influence of the (re)insurance market and natural hazard modelling
The actual assessment of natural-event-related costs has greatly evolved over the past 30 years. At first, so-called catastrophe models focused on the modelling of extreme losses to assess the risk of a portfolio (i.e. large ensembles of insured buildings). Before the 1990s, catastrophe modelling consisted in extrapolating the loss experience to estimate extreme losses. This loss experience was usually limited and recorded as a total amount of loss per event and per insurer or per event and for the whole (re)insurance market. The data were thus too coarse to capture the three risk drivers' individual impact on the losses: the exposure (e.g. if the exposure is located in a more/less risky area), the hazard itself (e.g. what portion of the losses are generated by a storm surge versus wind in the case of a tropical cyclone), and the vulnerability (e.g. how effective the flood defences or building codes are). As a result, while the data and the resulting modelling failed to take into account individual effects when assessing extreme losses, it did reflect the state of what was known by insurers and public authorities at that time.
Hurricane Andrew in 1992 and its unexpected impact constituted a game changer for modelling natural-hazard-generated losses (Grossi et al., 2005; Mitchell-Wallace, 2017). According to McChristian (2012), before Hurricane Andrew, the loss assessment for an event of that strength was USD 4 to USD 5 billion. This is 3 times lower than Hurricane Andrew's actual loss at USD 15 billion. Insurers underestimated their exposure as well as their exposure's vulnerability to such an event. McChristian (2012) also indicates that though past experienced losses were adjusted to reflect current macro-economic trends, they failed to capture the increasing population over coastal areas. In the aftermath of Hurricane Andrew, a collective realization grew for the need to both separately characterize the three drivers of the risk – exposure, hazard, and vulnerability – and model their interconnections. Catastrophe modelling therefore evolved from a statistical extrapolation to a framework divided into four components as shown in Fig. 1: one component per risk driver (exposure, hazard, and vulnerability) and one component that contains the insurance policies' financial conditions and their modelling.
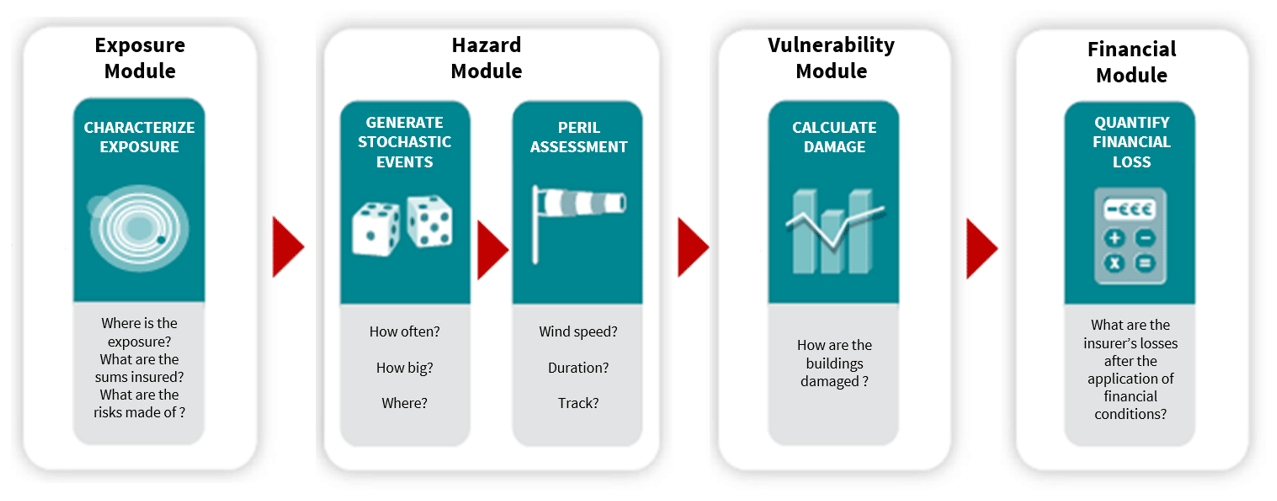
Figure 1Loss modelling framework composed of four components. A simulation engine is used to intersect the exposure information with the catalogue of hazard events and apply the damage ratio characterized with the vulnerability curve, function of hazard, and building characteristics. This operation leads to a loss, gross of any financial insurance conditions. The application of the financial conditions is performed in the financial module.
The occurrence of natural disasters, in particular those with a strong impact on the (re)insurance market, continues to feed research insofar as the research is in turn integrated into the hazard and vulnerability components of the loss modelling framework every 2 to 5 years. This is how the successive 1999 occurrence of the two extreme European winter windstorms Lothar and Martin triggered the introduction of the serial clustering effect into modelling the frequency of European winter windstorms (Mitchell-Wallace, 2017). The serial clustering effect refers to the higher probability that two extreme winter windstorms occur in a short period of time, under particular atmospheric conditions (Vitolo et al., 2009; Pinto et al., 2013; Priestley et al., 2017). Prior to these windstorms, the assumption used to calculate the occurrence probability of European winter windstorms followed the Poisson distribution and thus failed to allow for the increased probability of successive events. As shown by Priestley et al. (2018), the clustering effect has a significant impact on the estimation of yearly aggregated losses and therefore on the sizing and the wording of reinsurance cover policies.
Within the reinsurance market, the use of catastrophe models – developed internally or licensed through third-party vendors – has grown in the aftermath of Hurricane Andrew. For insurers to cede their risk, they must provide their exposure information to reinsurers so that they can conduct a loss assessment prior to estimating the reinsurance premium corresponding to the accepted risk. Today, catastrophe models continue to be used primarily to set reinsurance programmes (i.e. total capacity and pricing).
The implementation of regulation has prompted insurers to use catastrophe models, mainly licensed by third-party vendors, as tools to assess the risk, define the risk appetite, and set the solvency capital requirement. For example, the Solvency II regulation implemented in Europe in 2016 requires (re)insurers with Europe-based headquarters to annually assess their loss for a 200-year-return-period shock. (Re)insurers conduct this assessment for all the risks they are exposed to. They then aggregate these estimated losses to determine the total potential loss and the economic capital they have to bear in their owned funds. To achieve this assessment, (re)insurers have two options: either to use the so-called standard formula, calibrated on market exposure and at a relatively coarse granularity, or to develop an internal view of their risk that requires regulator approval. Most (re)insurers choosing to develop their own view of natural hazard risk use one or several models licensed to third-party vendors; others develop their own suite of models. Model evaluation becomes a necessary activity for assessing the model's strengths and limitations and leads to gaining in understanding and in taking ownership of the model. When (re)insurers opt for using third-party models, adjustments may be defined and applied to the models' loss estimation to address identified limitations (e.g. a non-modelled peril such as storm surge induced by windstorms). (Re)insurance companies also invest in the development of in-house models either on scopes where no third-party vendors model is available or to gain in flexibility and transparency.
In the past few years, both the scope and the use of catastrophe models have evolved. Indeed, to estimate the insurance premium of an average risk, insurers are now as interested in capturing small frequent events as they are in capturing large rare ones. In the hazard module, the full spectrum of events (i.e. moderate–intense, frequent–rare events) is considered. In the vulnerability module, vulnerability curves cover the entire range of hazard intensity. As for the modelling scope, catastrophe models also exist for human-made perils such as cyber threats and terrorism. To reflect this evolution, we will use the terms “natural hazard models” and “natural hazard modelling” as this allows for greater precision regarding the model's targeted scope and reaffirms the use of these models for purposes other than the analysis of extreme events.
2.2 Natural hazard modelling framework
The loss modelling framework is composed of four components, namely exposure, hazard, vulnerability, and financial components (Fig. 1). The description below provides a brief introduction. Greater detail on the different components can be found in Mitchell-Wallace (2017).
The exposure component contains the insurance portfolio's information: the buildings' locations and their key physical properties (e.g. structure, occupancy, year of construction). The hazard component contains a synthetic catalogue of several tens of thousands of events that represent the range of possible and plausible events for a given natural hazard (e.g. Asia typhoon, US ground shaking, European severe convective storms), ranging from small frequent events to extreme rare events. Each event is characterized by a footprint (i.e. the maximum intensity over event duration) and an annual occurrence probability. The vulnerability component is composed of vulnerability curves that translate the hazard's intensity into a building damage ratio. Ideally, there is one vulnerability curve for every combination of a building's physical properties. Finally, the financial component contains the insurance contract's financial data: the sum insured corresponding to the coverage (building, content, business interruption) and the deductibles and limits, as well as the coinsurance programmes or reinsurance treaties, if any.
For every event of the hazard component and for every building in the insurance portfolio, the three-step loss modelling process consists in the following:
-
intersecting the building's location with the event footprint to obtain the location's hazard intensity value;
-
factoring in the hazard intensity value and the building's physical properties and using the vulnerability curve reflecting the building's characteristics to derive the corresponding damage ratio;
-
applying the damage ratio to the insured value of the building, as specified in the financial module, to provide a loss amount prior to applying the financial conditions to the loss amount to obtain the ultimate loss borne by the insurance company.
The primary outputs of natural hazard models are exceedance probability distributions representing the probability of exceeding a certain amount of loss. Two distributions are commonly used: the one for the annual maximum loss – occurrence exceedance probability (OEP) – and the one for the annual aggregated loss – aggregate exceedance probability (AEP). The annual average loss (AAL) is also frequently used for budget planning for instance. Analyses of building losses are aggregated at granularities going from the building level to the portfolio level to characterize the probability of exceeding an amount of loss. This granularity is set as a function of an analysis objective, i.e. policy underwriting or portfolio management.
The loss modelling process is supported by a platform that contains (i) the data of each component stored in a specific format (e.g. CSV or netCDF file, digital precision) and (ii) the code functions that process data and estimate the losses. Until the early 2010s, the loss modelling process could only be performed on proprietary platforms. Launched in 2010, the Oasis1 initiative's ambition is to provide an open-source loss modelling platform to further transparency and to expand the use of natural hazard modelling beyond the (re)insurance market.
From a business perspective, integrating such a process into daily operational activities requires the runtime to take no more than a few hours. As an example of volumes at stake, assuming we have a catalogue of around 30 000 events and a portfolio of 5 million buildings, there will be 150 billion computations to run and as many data to temporarily store in a constrained information technology (IT) environment with limited storage space and a memory limit. To keep to the expected runtime and given the volumes considered, the loss modelling platform is to be rationalized and optimized, even if it results in a drop of formatting flexibility and data precision within the four components.
Today's IT computational constraints make it necessary to downgrade the quality and sophistication of the researchers' modelling to obtain results within an acceptable period. This compromises the assessment that could be attained and engenders a precision gap between what research produces and the derivative data ultimately integrated into the loss modelling framework. For example, the severity of natural events is captured in the hazard component through the use of hazard footprints defined as the maximum hazard value (e.g. wind speed, flood depth, peak ground acceleration) at each grid cell of the considered area over the duration of the event. The information relative to the event's duration and to the hazard value's evolution over time however is lost, even though both of these parameters affect the damage assessment of a building.
The four-component loss modelling framework makes it easier to identify the areas where, component by component, a more in-depth investigation is needed to refine data collection and modelling. The next section focuses on three of the loss modelling framework's components, highlighting where (i) thorough and systematic data collection needs to be put in place and (ii) the loss modelling framework requires investment to upgrade it and tailor it to respond to insurers' business needs.
The (re)insurance market's current body of knowledge on natural hazard loss modelling results from over 30 years of research involving private companies like (re)insurers, brokers, and modelling firms and academic researchers in atmospheric sciences, geosciences, civil engineering studies, and data sciences, to name but a few disciplines (Ward et al., 2020). The learning curve has been steep, closely linked to the increase in computer power (e.g. enabling the development and implementation of millions of possible climatic or seismic scenarios) and the collection of increasingly granular observational data (e.g. hazard, claims, geocoded exposure).
3.1 Exposure component
Through an increasing use of natural hazard models, insurers have realized that both data quality and data completeness reduce uncertainty in modelling. Over the past 5 to 10 years, insurers have significantly improved the collection process of information characterizing their exposure, namely the coordinates of the location of the buildings as well as the buildings' physical properties. As mentioned previously, exposure data in the loss modelling process are used (i) to estimate the hazard's severity at the location of the building and (ii) to select the suitable damage curve. The more precise the exposure data, the more accurate the loss evaluation will be. However, as some elements are particularly difficult to obtain at the time of underwriting individual insurance, the systematic extraction and completion of the data remain a challenge, and any missing information needs to be completed once the policy is underwritten either in the exposure database or at a later stage in the modelling.
The increasing volume and precision of geographical information captured by satellites have allowed for the development of performant geocoding tools supporting the completion of exposure databases. With an address, it is possible to obtain the geolocation, the structure of the building, the number of floors, and even the roof type, all critical drivers of damage for different perils (Ehrlich and Tenerelli, 2013; Castagno and Atkins, 2018; Kang et al., 2018; Schorlemmer et al., 2020). This progress in characterizing buildings' properties along with geolocations has been a major advancement, enabling insurers to visualize and analyse their accumulation with regards to natural hazard risk.
When critical information is missing in an exposure database, assumptions are made by using either other data sources to complete the exposure database (e.g. exposure disaggregation to fill in buildings' geolocation) or generic vulnerability curves defined as the weighted average of specific vulnerability curves in the loss modelling process. Any omission regarding the properties of a building's construction induces an uncertainty in that given building's exposure that can be quantified through sensitivity tests that assess varying combinations of a building's construction properties and the resulting impact on losses. The impact of inferring the geolocation might however be greater, depending on the peril in question, for example flood and severe convective storms. Testing the impact on losses of a disaggregation scheme requires running the model using several versions of disaggregated portfolios, which is inconceivable today notably because of runtime constraints. The disaggregation technique could also provide a solution to modelling the impact of natural hazard on movable exposure. Today, motor and marine exposures are modelled like building exposure. The geolocation used is the car owner's address or the vessel's home port as specified in the policy contract. Disaggregating the motor or marine exposure multiple times would give different vehicle locations and hence capture a range of potential losses.
3.2 Hazard component
An ever-growing number of data on the hazard component have been made accessible, refined, and maintained. A multitude of types of data, from observations to model simulations or a mixture of both, substantially support the development of hazard catalogues and their validation. Hazard modelling sets out to characterize, via a hazard event catalogue, the full spectrum of severity and frequency of hazards in a specific geographical area. A review of hazard modelling approaches by peril can be found in Ward et al. (2020). Beyond the perpetual enhancement necessary to complete and refine the view of the risk and to adapt to an ever-evolving environment, uncertainties persist in being only partially quantified due to (i) IT constraints and (ii) the information loss perpetuated by simplifying assumptions to derive data compiled in the loss modelling framework. Resolving these two sources of uncertainties would enable insurers to heighten their understanding of risk and make sounder business decisions.
Uncertainties in the hazard component come from the input data and the modelling parameters used to generate the stochastic event catalogue. For example, Kaczmarska et al. (2018) quantify how in changing flooding parameters the loss estimates are impacted. Winter et al. (2018) go a step further, notably in identifying and quantifying uncertainties present in the production of the hazard event catalogue. Such an analysis requires first running the production of the hazard catalogue several times to test different sets of parameters and secondly running the loss simulation engine multiple times. Including the quantification of uncertainties is costly in terms of both computer power and runtime but should be systematized as a modelling best practice.
As mentioned in Sect. 2.2, however, the information relative to an event's duration and to the hazard value's evolution is lost when generating the event's footprint, i.e. the maximum value of hazard intensity over the duration of the event. In (re)insurance policies, an event's duration is a metric used, within the hours clause, to specify that the (re)insurer will cover all the financial losses accumulated in a defined number of hours, varying depending on the peril. If financial losses are still recorded surpassing the defined number of hours, this will be counted as a second and separate event and activate a double reimbursement from the reinsurer. According to how the reinsurance programme is defined, the insurer may have to pay additional fees to obtain cover for the second event. Analysing the impact of the hours clause on the final loss would therefore be beneficial for the (re)insurance market. The loss modelling framework must evolve to allow for more flexibility and more completeness.
3.3 Vulnerability component
When a natural event occurs, damage results from the rupture of one or several of the building's components, the level of the rupture depending on the hazard's severity and the components' vulnerability. In the aftermath of the event, reconstruction costs are assessed based on the current material prices and labour costs. However, in post-disaster situations, reconstruction costs may be significantly higher due to a post-event demand surge and inflation. This effect is called post-loss amplification (PLA) and is modelled using a sigmoid function whose calibration remains difficult as (i) it has been observed subsequent to very extreme events and (ii) reconstruction costs or claims available in the historical record include the PLA effect. As the PLA may have a substantial impact on the ultimate amount of loss paid by insurers, further research is needed to analyse and model this effect.
Systematic data collection of damage information and its associated hazard magnitude is therefore vital to characterize the impact of natural hazards on buildings and to improve the calibrations not only of the buildings' destruction rate but also of the reconstruction costs in the vulnerability component. New technologies such as drones and satellites provide alternative ways to access impacted areas to collect detailed and granular measurements within a few hours or days of an event's occurrence (Chesnel et al., 2007; Kakooei and Baleghi, 2017). While there has been a substantial increase in the availability of observational data over the past 2 decades (Yu et al., 2018), further investments should be made to systematically collect (i) the event's level of hazard severity at the building's location (i.e. values of the relevant hazards' variables leading to the building's damage), (ii) the building's level of damage and the prevention measures if any (concurrently recording all relevant information on the building itself), and (iii) the level of associated repair costs (including information on loss adjustments and economic metrics such as post-event inflation). This data collection effort should be a joint public- and private-sector undertaking to build up core common knowledge.
A point of attention is the need for data collectors to coordinate and use the same damage scale to avoid duplicating and overlapping datasets that are incomparable. Research initiatives dedicated to gathering various data sources already exist at the country level. One such example is the HOWAS database for flood damage in Germany (Kreibich et al., 2017; Kellermann et al., 2020). Could this type of work be extended to the whole of Europe or even more globally? The PERILS2 initiative is worth mentioning as it is an example of the (re)insurance market's claims data collection initiative. When an event's loss estimation exceeds a defined threshold, the PERILS organization collects claims from the (re)insurers taking part in the consortium. While these data are aggregated at the CRESTA3 level, the initial estimates of the loss ratios are fundamental to establish the market's loss benchmarks and derive market vulnerability curves for instance.
While the challenges set out in this section indicate how to improve what we know we do not know, they also highlight the potential limitations of the current loss modelling framework and its simulation platform. The shortcomings of the current loss modelling framework herein described point to the need for an in-depth review of the framework to improve and increase insurers' understanding of natural hazard risk, particularly in an ever more connected environment that is described in the next section. From an insurer's perspective, in a context of growing focus on natural hazard impacts, data collection, modelling flexibility, and transparency have become core strategic elements to enhance and gain confidence in natural hazard risk assessment. To achieve modelling flexibility and transparency, the loss modelling framework will require in-depth changes to absorb the high number of data and to incorporate uncertainty quantifications. If tackled collectively, data collection, especially relating to damages and claims, could contribute to better city planning and more effective prevention measures that would in turn increase society resilience.
Since the building of the loss modelling framework in the 1990s, clients have become more interconnected (Gereffi et al., 2001), and the correlations between natural hazards and regions have also become better understood and quantified (Steptoe et al., 2018; Zscheischler et al., 2020; Tilloy et al., 2020). This section explores three elements that would advance natural risk assessment and would support insurers in their ambition to more accurately project and plan out their business activities insofar as natural hazards are concerned.
4.1 Introducing a fifth component to quantify uncertainty
As stated in previous sections, the assessment of uncertainty all along the modelling chain constitutes the loss modelling framework's notable shortcoming and the one that requires further investigation. To a certain extent, uncertainty is inherent to modelling and is partly captured in the loss modelling framework today through (i) the primary uncertainty, that is the assumptions and the simulation of the hazard catalogue, and (ii) the secondary uncertainty, that is the damage and loss assessment.
A prerequisite in understanding the uncertainties embedded in the modelling process is comparing and evaluating the models themselves. To date, models are however insufficiently transparent to perform such a comparison. This points to a need for more transparency. In parallel, to move forward, it is fundamental to systematically quantify these uncertainties to change both how we communicate them and how we manage them. This will enable insurers to take ownership of uncertainties' management and provide insurers with a tool to ensure ongoing model enhancements (Thompson and Warmink, 2016; Doyle et al., 2019).
Incorporating the quantification of uncertainties in the loss modelling framework does make it more costly in terms of computer power and runtime. In light of the rapid evolution of IT, computer power and runtime should nonetheless not be an issue for long. The question will then be how to implement a comprehensive uncertainty quantification scheme. While Beven et al. (2018) suggest a framework to deal with epistemic uncertainty in natural hazard modelling, recent work like that of Noacco et al. (2019) and KC et al. (2020) has been carried out to address quantifying uncertainty with appropriate methods and tools. Could we not introduce a specific “uncertainty component” that, combining the multiple datasets from the different components, would deal with an ensemble of models and propagate the quantification all along the loss modelling process?
4.2 Supply chain modelling
With globalization, clients around the world have become increasingly interconnected and dependent on each other within so-called global value chains (Gereffi et al., 2001; Baldwin and Lopez-Gonzalez, 2015; Phillips, 2018). This dependency became apparent with the 2011 floods in Thailand when Thailand's brutal interruption of microprocessor production led to a halt in global production; a global shortage of microprocessors; and consequently, a loss in benefits for companies producing chips, hard disc drives, and other electronic devices (Chopra and Sodhi, 2014; Haraguchi and Lall, 2015).
From an insurer's perspective, suppliers defaulting in their deliveries due to the occurrence of a natural hazard is not insurable, as it is not quantifiable with the current modelling that fails to capture this connection between suppliers and their client producers. Supply chain data have improved (Tiwari et al., 2018; Beorchia and Crook, 2020) and need to be analysed further and incorporated into natural hazard loss modelling. This could provide a source of opportunities for insurers to deliver new services to customers while continuing to contribute to advancing research in visualizing and measuring the levels of complexity (volume, direction, and intensity of interconnections).
The interconnections between hazards or between clients have yet to be captured even in the latest loss modelling framework. It remains siloed by hazard and region and omits supply chain information. Failing to integrate these interactions may result in instilling a bias in our understanding of the underlying risk. A deeper review of the loss modelling framework is to be conducted to reflect on this new and complex reality.
4.3 Forward-looking scenario: modelling the future of natural hazard risks
Natural hazard models have been primarily developed to overcome the limited historical loss record and to assess extreme losses driven by exposure, hazard, and vulnerability in the present. They are now envisaged as tools to assess the future of natural hazard risks, in particular in the context of climate change.
To perform this analysis, insurers need not only to project the plausible future scenarios of hazard events (e.g. in the case of climate change impact studies, information provided by climate model simulations) but also to project the evolution of exposure and vulnerability. In this context, the two most pressing questions global insurers need to respond to are (i) how to gather future projections of population growth or decline and/or wealth worldwide and (ii) how will building codes evolve.
Cremen et al. (2022) perform a thorough review of the available literature and provide initial answers to these questions. Such a review is particularly enlightening to enhance the simple initial assumptions that were made, especially for exposure growth and vulnerability. Furthermore, as vulnerability is a crucial element in adapting to climate change impacts, further investigations on the implementation of prevention measures and the quantification of the resulting risk reduction are needed.
Finally, while this forward-looking analysis is necessary, its outcomes should be taken with great caution. As Fiedler et al. (2021) highlight, uncertainty around future exposure, hazard, or vulnerability projections is significant and compounds the uncertainty already present in the loss modelling framework.
To date, models have evolved through the incorporation of new information, without ever undergoing an in-depth transformation. Modifications have stemmed from the observation of the growing number of interconnections – and mutual impacts – at multiple levels: between insured customers and their suppliers and interactions and cross-impacts between the disasters causing natural phenomena. Though this make-do approach has served in the past, it no longer suffices. In today's world where complex intrinsic interconnections exist between natural hazards, exposure, and vulnerability, models fail to fully reflect this reality. They are in want of an in-depth transformation. Only after such a transformation will they convey and advance the new level of understanding insurers need to cultivate and enable the design and testing of new products and protection mechanisms.
As said in Baum (2015), “threats are rarely completely unknown or unquantifiable”. Sometimes what we do not know is already present in the data or the model, but it has yet to be understood or analysed. We propose reflecting on how to bring together a transdisciplinary research team composed not only of IT, data sciences, and geosciences but also of civil engineering, urban planning sciences, and socio-economic sciences to investigate the opportunities to build global loss models for natural hazards that would deal with the complexity of the interactions of both natural elements and the customer ecosystem. This would enable insurers to better anticipate the needs of their customers while being better equipped to cope with not only uncertainty but also the unknown.
No data sets were used in this article.
The author has declared that there are no competing interests.
Publisher’s note: Copernicus Publications remains neutral with regard to jurisdictional claims in published maps and institutional affiliations.
I greatly acknowledge the three anonymous reviewers and the editor (David Peres) for their insightful revisions and editing. My sincere thanks go to AXA colleagues and research partners for all the fruitful discussions about natural hazard modelling. I would also like to thank Beatrice Wing for her thorough proofreading of the paper.
This paper was edited by David J. Peres and reviewed by three anonymous referees.
Baldwin, R. and Lopez-Gonzalez, J.: Supply-chain Trade: A Portrait of Global Patterns and Several Testable Hypotheses, World Econ., 38, 1682–1721, https://doi.org/10.1111/twec.12189, 2015.
Baum, S. D.: Risk and resilience for unknown, unquantifiable, systemic, and unlikely/catastrophic threats, Environ. Syst. Decis., 35, 229–236, https://doi.org/10.1007/s10669-015-9551-8, 2015.
Beorchia, A. and Crook, T. R.: Bloomberg Supply Chain Analysis: A Data Source for Investigating the Nature, Size, and Structure of Interorganizational Relationships, in: Research Methodology in Strategy and Management, edited by: Crook, T. R., Lê, J., and Smith, A. D., Emerald Publishing Limited, 73–100, https://doi.org/10.1108/S1479-838720200000012017, 2020.
Beven, K. J., Aspinall, W. P., Bates, P. D., Borgomeo, E., Goda, K., Hall, J. W., Page, T., Phillips, J. C., Simpson, M., Smith, P. J., Wagener, T., and Watson, M.: Epistemic uncertainties and natural hazard risk assessment – Part 2: What should constitute good practice?, Nat. Hazards Earth Syst. Sci., 18, 2769–2783, https://doi.org/10.5194/nhess-18-2769-2018, 2018.
Castagno, J. and Atkins, E.: Roof Shape Classification from LiDAR and Satellite Image Data Fusion Using Supervised Learning, Sensors, 18, 3960, https://doi.org/10.3390/s18113960, 2018.
Chesnel, A.-L., Binet, R., and Wald, L.: Object oriented assessment of damage due to natural disaster using very high resolution images, in: 2007 IEEE International Geoscience and Remote Sensing Symposium, Barcelona, Spain, 23–28 July 2007, IEEE, 3736–3739, https://doi.org/10.1109/IGARSS.2007.4423655, 2007.
Chopra, S. and Sodhi, M. S.: Reducing the risk of supply chain disruptions, MIT Sloan Management Review, 55, 73–80, 2014.
Cremen, G., Galasso, C., and McCloskey, J.: Modelling and quantifying tomorrow's risks from natural hazards, Sci. Total Environ., 817, 152552, https://doi.org/10.1016/j.scitotenv.2021.152552, 2022.
Doyle, E. E. H., Johnston, D. M., Smith, R., and Paton, D.: Communicating model uncertainty for natural hazards: A qualitative systematic thematic review, Int. J. Disast. Risk Re., 33, 449–476, https://doi.org/10.1016/j.ijdrr.2018.10.023, 2019.
Ehrlich, D. and Tenerelli, P.: Optical satellite imagery for quantifying spatio-temporal dimension of physical exposure in disaster risk assessments, Nat. Hazards, 68, 1271–1289, https://doi.org/10.1007/s11069-012-0372-5, 2013.
Fiedler, T., Pitman, A. J., Mackenzie, K., Wood, N., Jakob, C., and Perkins-Kirkpatrick, S. E.: Business risk and the emergence of climate analytics, Nat. Clim. Change, 11, 87–94, https://doi.org/10.1038/s41558-020-00984-6, 2021.
Gereffi, G., Humphrey, J., Kaplinsky, R., and Sturgeon, T. J.: Introduction: Globalisation, Value Chains and Development, IDS Bulletin, 32, 1–8, https://doi.org/10.1111/j.1759-5436.2001.mp32003001.x, 2001.
Girard, J.: A Leader's Guide to Knowledge Management: Drawing on the Past to Enhance Future Performance, 1st edn., Business Expert Press, ISBN: 9781606490181, 2009.
Grossi, P., Kunreuther, H., and Windeler, D.: An Introduction to Catastrophe Models and Insurance, in: Catastrophe Modeling: A New Approach to Managing Risk, edited by: Grossi, P. and Kunreuther, H., Kluwer Academic Publishers, Boston, 25, 23–42, https://doi.org/10.1007/0-387-23129-3_2, 2005.
Haraguchi, M. and Lall, U.: Flood risks and impacts: A case study of Thailand's floods in 2011 and research questions for supply chain decision making, Int. J. Disast. Risk Re., 14, 256–272, https://doi.org/10.1016/j.ijdrr.2014.09.005, 2015.
Kaczmarska, J., Jewson, S., and Bellone, E.: Quantifying the sources of simulation uncertainty in natural catastrophe models, Stoch. Env. Res. Risk A., 32, 591–605, https://doi.org/10.1007/s00477-017-1393-0, 2018.
Kakooei, M. and Baleghi, Y.: Fusion of satellite, aircraft, and UAV data for automatic disaster damage assessment, Int. J. Remote Sens., 38, 2511–2534, https://doi.org/10.1080/01431161.2017.1294780, 2017.
Kang, J., Körner, M., Wang, Y., Taubenböck, H., and Zhu, X. X.: Building instance classification using street view images, ISPRS J. Photogramm., 145, 44–59, https://doi.org/10.1016/j.isprsjprs.2018.02.006, 2018.
KC, U., Garg, S., Hilton, J., and Aryal, J.: A cloud-based framework for sensitivity analysis of natural hazard models, Environ. Modell. Softw., 134, 104800, https://doi.org/10.1016/j.envsoft.2020.104800, 2020.
Kellermann, P., Schröter, K., Thieken, A. H., Haubrock, S.-N., and Kreibich, H.: The object-specific flood damage database HOWAS 21, Nat. Hazards Earth Syst. Sci., 20, 2503–2519, https://doi.org/10.5194/nhess-20-2503-2020, 2020.
Kreibich, H., Thieken, A., Haubrock, S.-N., and Schröter, K.: HOWAS21, the German Flood Damage Database, in: Geophysical Monograph Series, edited by: Molinari, D., Menoni, S., and Ballio, F., John Wiley & Sons, Inc., Hoboken, NJ, USA, 65–75, https://doi.org/10.1002/9781119217930.ch5, 2017.
McChristian, L.: Hurricane Andrew and Insurance: The Enduring Impact of an Historic Storm, Insurance Information Institute, New York, 19 pp., 2012.
Mitchell-Wallace, K. (Ed.): Natural catastrophe risk management and modelling: a practitioner's guide, John Wiley and Sons, Inc, Hoboken, NJ, ISBN: 9781118906040, 2017.
Noacco, V., Sarrazin, F., Pianosi, F., and Wagener, T.: Matlab/R workflows to assess critical choices in Global Sensitivity Analysis using the SAFE toolbox, MethodsX, 6, 2258–2280, https://doi.org/10.1016/j.mex.2019.09.033, 2019.
Phillips, N.: Global value chains, in: Dictionnaire d'économie politique, edited by: Hay, C., Presses de Sciences Po, 247–250, https://doi.org/10.3917/scpo.smith.2018.01.0247, 2018.
Pinto, J. G., Bellenbaum, N., Karremann, M. K., and Della-Marta, P. M.: Serial clustering of extratropical cyclones over the North Atlantic and Europe under recent and future climate conditions, J. Geophys. Res.-Atmos., 118, 12476–12485, https://doi.org/10.1002/2013JD020564, 2013.
Priestley, M. D. K., Pinto, J. G., Dacre, H. F., and Shaffrey, L. C.: Rossby wave breaking, the upper level jet, and serial clustering of extratropical cyclones in western Europe, Geophys. Res. Lett., 44, 514–521, https://doi.org/10.1002/2016GL071277, 2017.
Priestley, M. D. K., Dacre, H. F., Shaffrey, L. C., Hodges, K. I., and Pinto, J. G.: The role of serial European windstorm clustering for extreme seasonal losses as determined from multi-centennial simulations of high-resolution global climate model data, Nat. Hazards Earth Syst. Sci., 18, 2991–3006, https://doi.org/10.5194/nhess-18-2991-2018, 2018.
Schorlemmer, D., Beutin, T., Cotton, F., Garcia Ospina, N., Hirata, N., Ma, K.-F., Nievas, C., Prehn, K., and Wyss, M.: Global Dynamic Exposure and the OpenBuildingMap – A Big-Data and Crowd-Sourcing Approach to Exposure Modeling, EGU General Assembly 2020, Online, 4–8 May 2020, EGU2020-18920, https://doi.org/10.5194/egusphere-egu2020-18920, 2020.
Steptoe, H., Jones, S. E. O., and Fox, H.: Correlations Between Extreme Atmospheric Hazards and Global Teleconnections: Implications for Multihazard Resilience, Rev. Geophys., 56, 50–78, https://doi.org/10.1002/2017RG000567, 2018.
Thompson, M. and Warmink, J. J.: Natural Hazard Modeling and Uncertainty Analysis, in: Geophysical Monograph Series, edited by: Riley, K., Webley, P., and Thompson, M., John Wiley & Sons, Inc., Hoboken, NJ, USA, 9–19, https://doi.org/10.1002/9781119028116.ch2, 2016.
Tilloy, A., Malamud, B. D., Winter, H., and Joly-Laugel, A.: Evaluating the efficacy of bivariate extreme modelling approaches for multi-hazard scenarios, Nat. Hazards Earth Syst. Sci., 20, 2091–2117, https://doi.org/10.5194/nhess-20-2091-2020, 2020.
Tiwari, S., Wee, H. M., and Daryanto, Y.: Big data analytics in supply chain management between 2010 and 2016: Insights to industries, Comput. Ind. Eng., 115, 319–330, https://doi.org/10.1016/j.cie.2017.11.017, 2018.
Vitolo, R., Stephenson, D. B., Cook, I. M., and Mitchell-Wallace, K.: Serial clustering of intense European storms, Meteorol. Z., 18, 411–424, https://doi.org/10.1127/0941-2948/2009/0393, 2009.
Ward, P. J., Blauhut, V., Bloemendaal, N., Daniell, J. E., de Ruiter, M. C., Duncan, M. J., Emberson, R., Jenkins, S. F., Kirschbaum, D., Kunz, M., Mohr, S., Muis, S., Riddell, G. A., Schäfer, A., Stanley, T., Veldkamp, T. I. E., and Winsemius, H. C.: Review article: Natural hazard risk assessments at the global scale, Nat. Hazards Earth Syst. Sci., 20, 1069–1096, https://doi.org/10.5194/nhess-20-1069-2020, 2020.
Winter, B., Schneeberger, K., Huttenlau, M., and Stötter, J.: Sources of uncertainty in a probabilistic flood risk model, Nat. Hazards, 91, 431–446, https://doi.org/10.1007/s11069-017-3135-5, 2018.
Yu, M., Yang, C., and Li, Y.: Big Data in Natural Disaster Management: A Review, Geosciences, 8, 165, https://doi.org/10.3390/geosciences8050165, 2018.
Zscheischler, J., Martius, O., Westra, S., Bevacqua, E., Raymond, C., Horton, R. M., van den Hurk, B., AghaKouchak, A., Jézéquel, A., Mahecha, M. D., Maraun, D., Ramos, A. M., Ridder, N. N., Thiery, W., and Vignotto, E.: A typology of compound weather and climate events, Nature Reviews Earth & Environment, 1, 333–347, https://doi.org/10.1038/s43017-020-0060-z, 2020.
https://oasislmf.org/our-modelling-platform (last access: 12 January 2023)
https://www.perils.org/ (last access: 12 January 2023)
https://www.cresta.org/ (last access: 12 January 2023).