the Creative Commons Attribution 4.0 License.
the Creative Commons Attribution 4.0 License.
 | 12 Jul 2023
Assessing Typhoon Soulik-induced morphodynamics over the Mokpo coastal region in South Korea based on a geospatial approach
Sang-Guk Yum
Moon-Soo Song
The inner shelf and coastal region of the Yellow Sea along the Korean Peninsula are frequently impacted by typhoons. The Mokpo coastal region in South Korea was significantly affected by Typhoon Soulik in 2018, the deadliest typhoon strike to the southwestern coast since Typhoon Maemi in 2003. Typhoon Soulik overran the region, causing extensive damage to the coast, shoreline, vegetation, and coastal geomorphology. Therefore, it is important to investigate its impact on the coastal ecology, landform, erosion/accretion, suspended-sediment concentration (SSC), and associated coastal changes along the Mokpo region.
In this study, the net shoreline movement (NSM), normalized difference vegetation index (NDVI), fractional vegetation coverage (FVC), coastal-landform change model, normalized difference suspended-sediment index (NDSSI), and SSC–reflectance relation have been used to analyze the coastal morphodynamics over the typhoon periods. We used pre- and post-typhoon Sentinel-2 MultiSpectral Instrument (MSI) images for mapping and monitoring the typhoon effect and recovery status of the Mokpo coast through short- and medium-term coastal-change analysis. The findings highlighted the significant impacts of typhoons on coastal dynamics, wetland vegetation, and sediment resuspension along the Mokpo coast. It has been observed that typhoon-induced SSC influences shoreline and coastal morphology. The outcome of this research may provide databases to manage coastal environments and a long-term plan to restore valuable coastal habitats. In addition, the findings may be useful for post-typhoon emergency response, coastal planners, and administrators involved in the long-term development of human life.
- Article
(23300 KB) - Full-text XML
- BibTeX
- EndNote


Typhoons are one of the most destructive natural calamities. Strong winds that accompany typhoons damage the environment, coastline, wildlife, people, and public and private properties in coastal and inland areas during landfall (Shamsuzzoha et al., 2021; Xu et al., 2021; Mishra et al., 2021a; Nandi et al., 2020; Sadik et al., 2020; Sahoo and Bhaskaran, 2018; Hoque et al., 2016). Many coastal and near-coastal countries are plagued by typhoon-induced storms, flooding, deforestation, and increased soil salinity (Rodgers et al., 2009). Typhoons (tropical cyclones) have caused 1942 disasters in the past 50 years, resulting in 779 324 fatalities and USD 1407.6 billion in economic losses worldwide (WMO, 2020), demonstrating their effects on both the global and regional economies (Bhuiyan and Dutta, 2012; Mallick et al., 2017). The effects of typhoons include saltwater intrusion, soil fertility depletion, reduced agricultural productivity, loss of life, coastline erosion, vegetation damage, and massive economic disasters (Mishra et al., 2021b).
According to instrumental data collected since 1904, typhoon intensity on the Korean Peninsula has grown during the previous 100 years (Yu et al., 2018; Cha et al., 2021). A total of 188 typhoons, about 3 annually, have affected the coastal region from 1959 to 2018 (KMA, 2018). Past typhoons, including Rusa (2002), Maemi (2003), Nari (2007), and Soulik (2018), heavily affected the southwestern coast, causing extensive damage to property and affecting human life (KMA, 2011, 2018). Furthermore, people living in these regions have faced serious coastal floods caused by these events for more than a half-century (Moon et al., 2003). The Mokpo coastal region, located on the southwestern coast of South Korea, has been hit by 58 typhoons since 1980, with most occurring in the July–October period (Kang et al., 2020; Lee et al., 2022). The rapid growth of coastal economies and populations in recent years has made these areas more susceptible to typhoon disasters. Therefore, the increasing frequency of typhoons on the southwestern coast is a significant issue for disaster management.
Several studies (Halder and Bandyopadhyay, 2022; Wang et al., 2021; Shamsuzzoha et al., 2021; Kumar et al., 2021; Sadik et al., 2020; Konda et al., 2018; Parida et al., 2018; Zhang et al., 2013; Yin et al., 2013; Li and Li, 2013; Rodgers et al., 2009) have been carried out in South and East Asia using various techniques to map the hazard, vulnerability, risk, and effects of typhoon disasters. Remote sensing and geospatial technology play a crucial role in monitoring a variety of natural disasters (Wang and Xu, 2018; Mishra et al., 2021b; Charrua et al., 2021). The majority of studies on typhoon-induced coastal dynamics rely on passive optical remote sensing and identify natural-disaster damage using changes in land use data, vegetation indices, and geospatial techniques (Mishra et al., 2021a; Xu et al., 2021; Nandi et al., 2020). The post-typhoon damage assessment research in South Korea mostly focused on property loss, economic losses, and casualties (Yum et al., 2021; Kim et al., 2021; Hwang et al., 2020). However, the coastal morphodynamics along the Mokpo coast over the typhoon period (such as in the short and medium term) have not been investigated in detail. Thus, this study's primary focus is to determine the effects of Typhoon Soulik on coastal ecology, landforms, erosion/accretion, suspended-sediment movement, and associated coastal changes along the Mokpo coast.
The normalized difference vegetation index (NDVI) and variations in NDVI (ΔNDVI) have been used to map the extent of vegetation destruction and detail the degree of damage after the typhoon (Wang et al., 2010; Datta and Deb, 2012; Zhang et al., 2013; Kumar et al., 2021; Xu et al., 2021). Vegetation damage can be seen by the negative change in NDVI values between the pre- and post-typhoon periods (Mishra et al., 2021a; Hu and Smith, 2018). On the other hand, fractional vegetation coverage (FVC) is a crucial quantitative indicator of the vegetation cover of the land surface (Zhang et al., 2021; Wang and Xu, 2018; Song et al., 2017). Therefore, FVC has also been used to assess the extent of vegetation damage caused by Typhoon Soulik and to analyze its impact on vegetation cover. The coastline movement over the typhoon periods has been analyzed using the Digital Shoreline Analysis System (DSAS) program (Tsai, 2022; Adhikari et al., 2021; Bishop-Taylor et al., 2021; Santos et al., 2021). In order to monitor and protect coastal habitats, we need to understand the distribution and movement of the suspended-sediment concentration (SSC) between rivers and coastal waters. Thus, the normalized difference suspended-sediment index (NDSSI) (Kavan et al., 2022; Shahzad et al., 2018; Hossain et al., 2010) and the SSC–reflectance algorithm developed by Choi et al. (2014) for the Mokpo coastal region have been used to monitor the SSC distribution. Furthermore, to understand the short- and medium-term morphodynamics of the coastal landform due to the typhoon, a GIS-based (geographic information system) coastal-change model has been developed. Four coastal-landform classes, i.e., tidally influenced land (wetland land and wetland vegetation) and non-tidally influenced land (land and water), have been used for the coastal morphodynamic analysis (Maiti and Bhattacharya, 2011). The change detection technique has been employed to quantify the short- and medium-term coastal changes. This approach focuses on details of morphological changes within the coast and highlights the minor changes caused by the typhoon.
This study uses Sentinel-2 MultiSpectral Instrument (MSI) images as a primary data source to examine the morphodynamics and effects of Typhoon Soulik on coastal ecology. Accordingly, the objectives of this study are to (i) quantify and map coastal-landform dynamics prior to and after the typhoon, (ii) examine shoreline movement and assess coastal erosion and accretion, (iii) assess the degree of typhoon damage to vegetated land, and (iv) analyze changes in the SSC and the response of sediment dynamics over the typhoon period. Coastal managers can use this study to develop and implement appropriate strategies and practices to protect natural ecosystems and post-disaster rehabilitation.
The Mokpo coast is located in the southwestern part of South Korea and is characterized by muddy flats with wide tidal ranges (Choi et al., 2007; Kang et al., 2007), as depicted in Fig. 1. The inner part of the coast includes harbor and industrial complexes, a large residential area, and a wastewater treatment plant. The Mokpo coast is most frequently hit by typhoons, which cause the most significant amount of property damage and loss of human life (Kang et al., 2020; Lee, 2014). According to storm surge records, the Mokpo coastal region has experienced the highest number of typhoons (58) since 1980 due to its geographical location (Lee et al., 2022; Kang et al., 2020). The tidal range has been observed to be broader, with the extreme high tide 60 cm higher and the extreme low tide 43 cm lower in the Mokpo coast (Lee et al., 2022; Kwon et al., 2018). This fluctuation resulted in significant flooding during the typhoon period. High water and waves severely damage the coastal structures and environment, especially during surges (Tsai et al., 2006). The Mokpo coastal region is characterized by a strong ebb-dominant pattern because of its complex bathymetry, scattered islands, and extensive tidal flats (Byun et al., 2004; Kang and Jun, 2003; Kang, 1999).
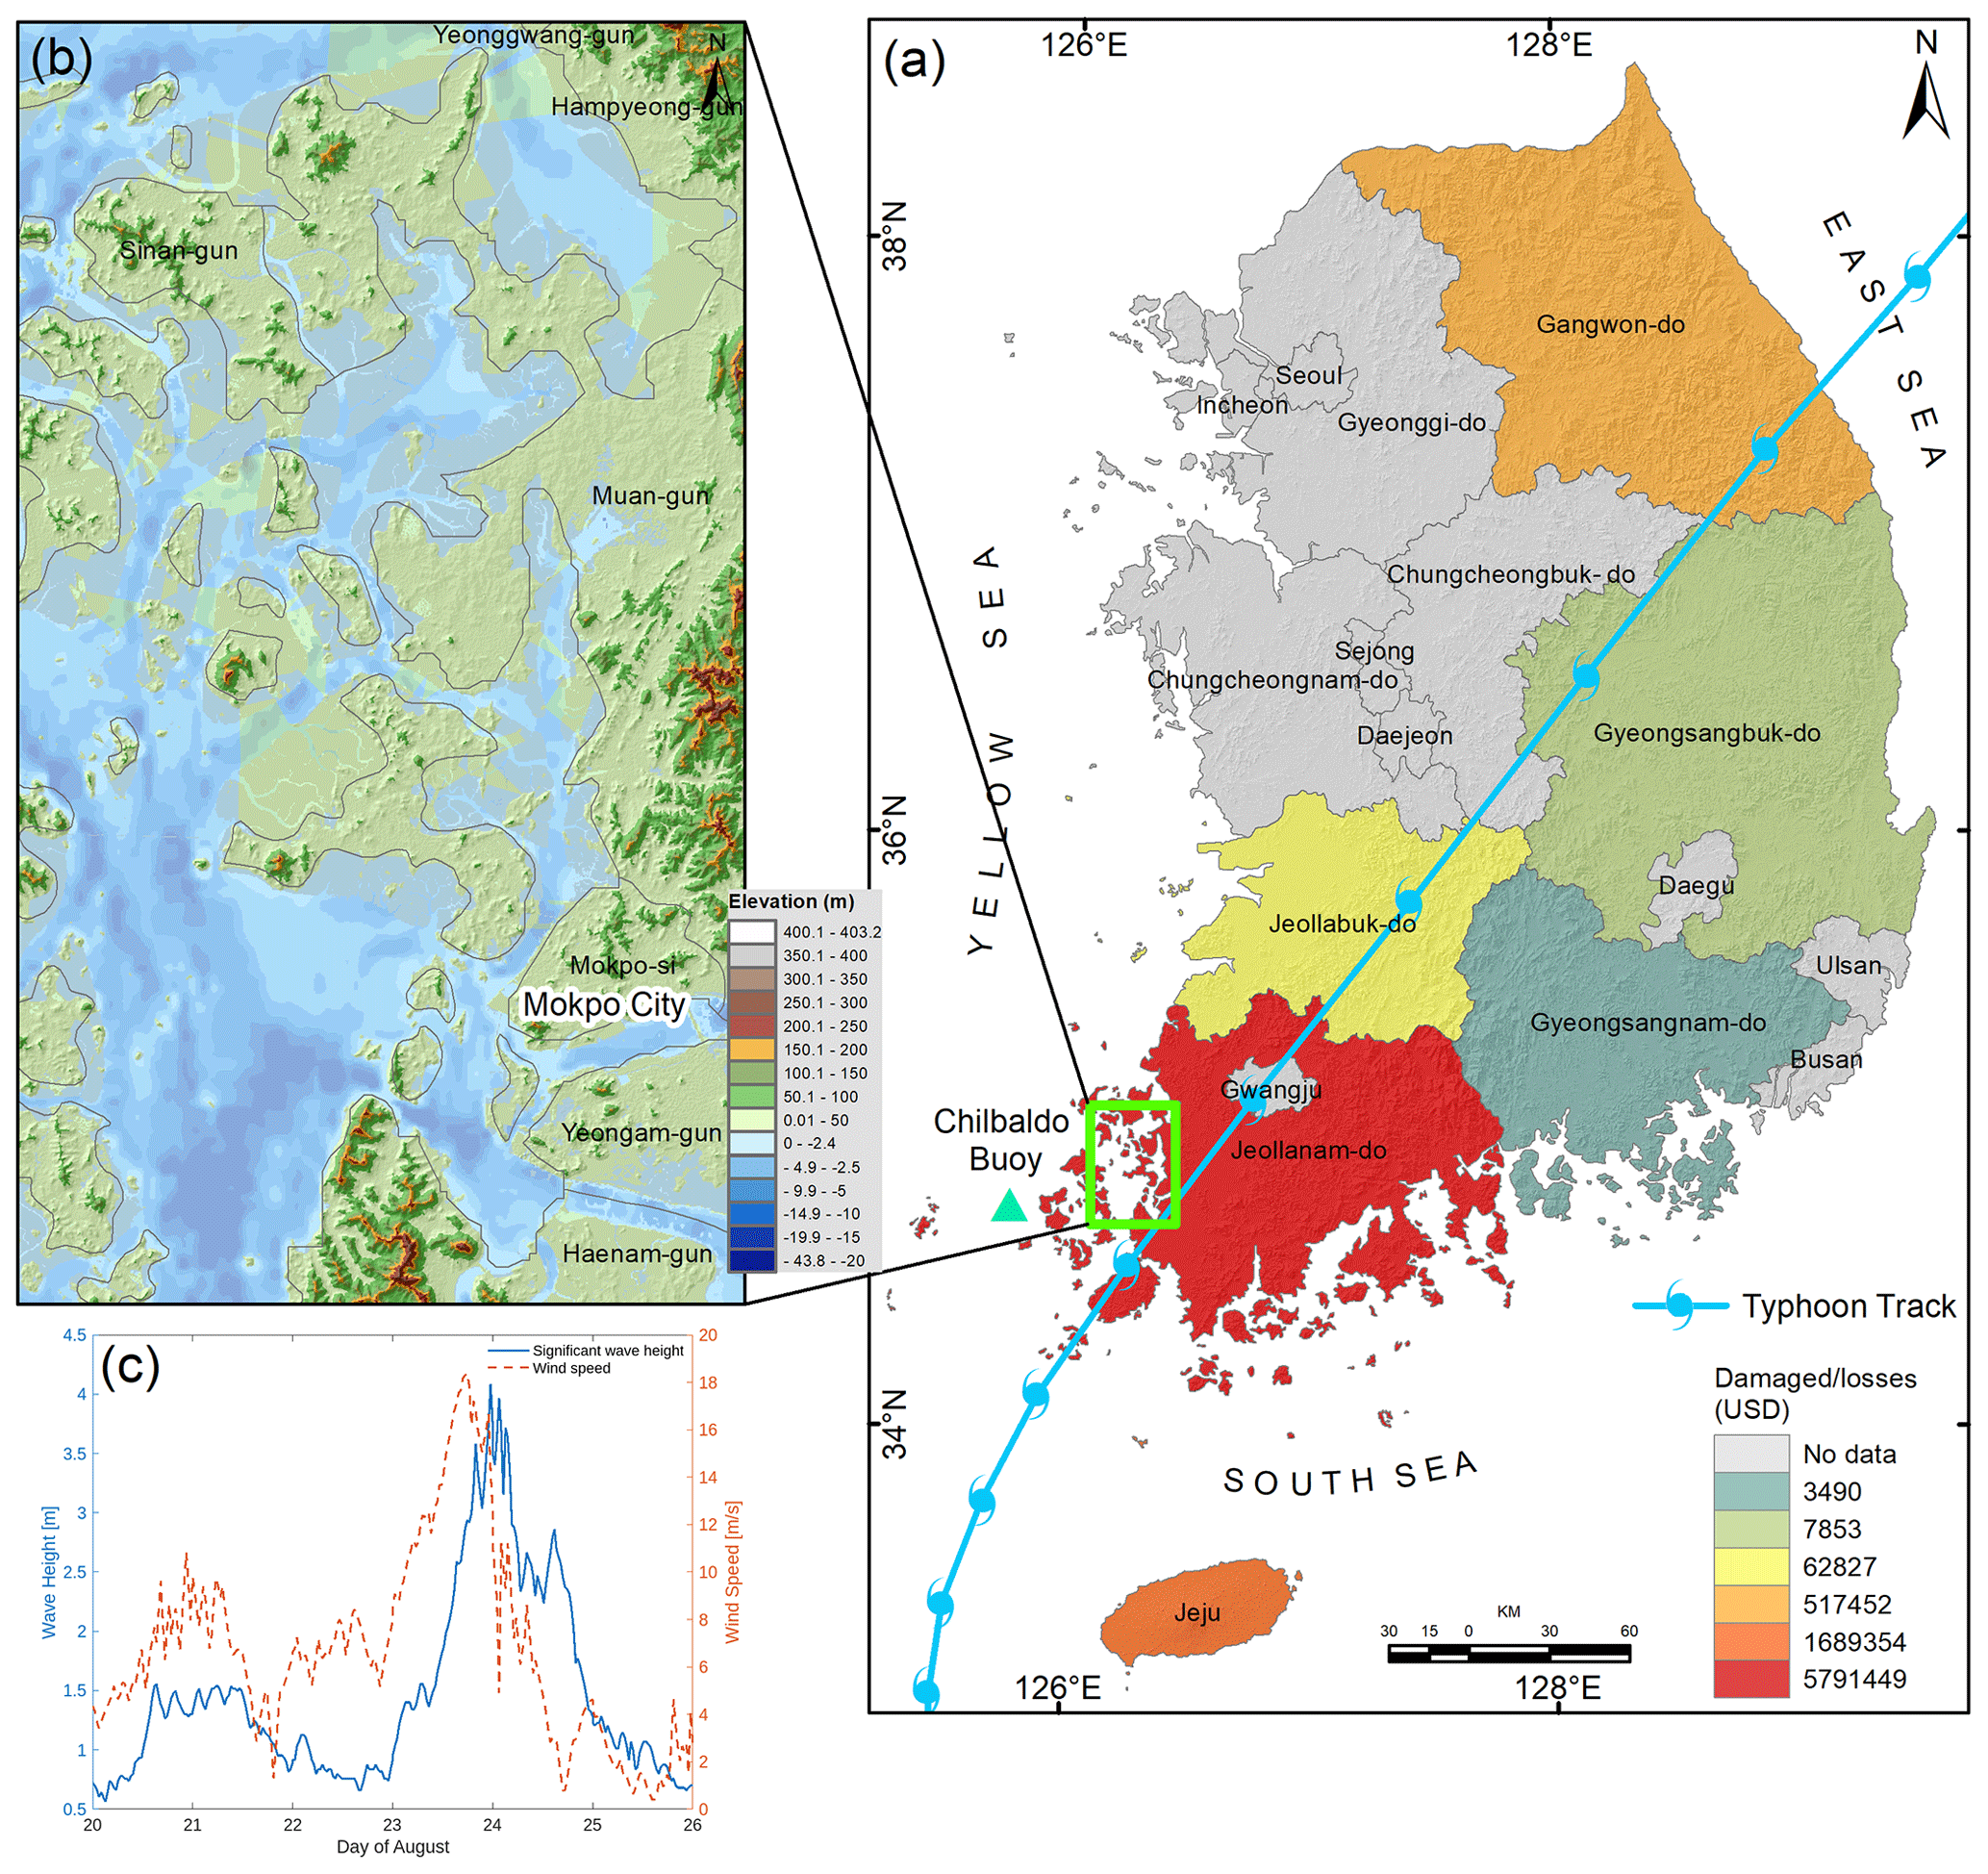
Figure 1(a) Typhoon Soulik passage through the Mokpo coastal region on 23 August 2018 (typhoon track data were downloaded from https://www.ncdc.noaa.gov/ibtracs/, last access: 5 August 2022), with the background shades representing province-wise recorded damage/loss distribution reported by ESCAP/WMO Typhoon Committee (2018). (b) Topography variation in the Mokpo coastal region (elevation data acquired from NGII, 2018, https://www.ngii.go.kr/, last access: 12 July 2022; bathymetry data downloaded from GMRT, https://www.gmrt.org, last access: 18 March 2023). (c) Variation in significant wave height and wind speed from 20 to 25 August 2018 recorded by at the Chilbaldo buoy station (located near the landfall area) during Typhoon Soulik (data source: http://wink.kiost.ac.kr/map/map.do#, last access: 20 June 2022; http://www.kma.go.kr/, last access: 20 June 2022).
The vast tidal flat of the Mokpo coast serves as a habitat for many different species, has a large production capacity, and is highly regarded for its role in cleaning up pollution and controlling floods and typhoons (Lee et al., 2021; Na, 2004). Furthermore, the powerful storm has affected the coastal wetlands (mudflats) that serve as the primary spawning and nursery grounds for fish and other marine life. However, Choi (2014) observed that tidal-flat systems in the Korean Peninsula are actively responding to various phenomena, such as tides, waves, and typhoons. The wetland, coastal vegetation, and coastline along the Mokpo coastal region have been disturbed due to the extreme climatic events. It has been observed that most typhoon passages severely impacted the tidal-flat environment and caused morphodynamics along the Mokpo coast.
Typhoon Soulik
The southwestern coast of the Korean Peninsula was ravaged by the strong-intensity Typhoon Soulik, which hit the Mokpo coast on 23 August 2018 (Ryang et al., 2021). On 16 August, it developed near Palau as a tropical depression. Subsequently, it strengthened into a tropical storm before intensifying into a typhoon (Lee et al., 2022). It moved into the East China Sea (South Sea) on 20 August with a maximum intensity of 950 hPa (44 m s−1) and lasted until 22 August. The Korea Meteorological Administration (KMA) issued typhoon warnings, and national and local authorities took preventative measures to limit potential damage. On 23 August, around 14:00 UTC, Typhoon Soulik made landfall close to the city of Mokpo, located on South Korea's southwestern coast. The typhoon remained on the mainland for an additional 12 h before moving to the East Sea, where it underwent a transformation and became an extra-tropical cyclone (Park et al., 2019). A peak sustained wind speed of 30.2 m s−1 was recorded at Gageodo in South Jeolla Province (Jeollanam-do), while the central pressure of the typhoon was measured at 975 hPa (ESCAP/WMO Typhoon Committee, 2018). Meanwhile, the strongest gust was observed at Mt. Halla, with a peak gust of 62 m s−1. It also dumped tremendous amounts of rain (Kang and Moon, 2022; Kang et al., 2020; Yu et al., 2018; Cha et al., 2021). The buoy station near Jeju Island has recorded extreme sea surface conditions, including a maximum wave height of 15 m, gusts of 35 m s−1, and a drop in water temperature of 10 ∘C (Kang et al., 2020; Yoon et al., 2021). Figure 1c illustrates the variations in sea surface parameters between 20 and 25 August 2018, in the vicinity of the landfall region (Chilbaldo buoy), including wind speed and significant wave height. It was observed that a significant wave height, i.e., 4–6 m, was recorded at Chilbaldo buoy station. According to the Ministry of the Interior and Safety (MOIS), Typhoon Soulik caused various amounts of damage and disruptions across various regions in the country. One woman was reported missing in the coastal region of Jeju, and three people sustained injuries. A total of 362 facilities were damaged. In addition, the typhoon resulted in power outages for 26 830 houses and flooding that affected over 3063 ha of farmland (ESCAP/WMO Typhoon Committee, 2018). Furthermore, the typhoon destroyed extensive vegetation with strong gusts and damaged non-residential structures along the Mokpo coast. A province-wise breakdown of the damage and losses caused by the typhoon is depicted in Fig. 1a. The total damage caused by Typhoon Soulik in South Korea was USD 45 million (KMA, 2018).
3.1 Data sources and pre-processing
Typhoon-induced coastal dynamics along the Mokpo coast have been studied using the pre- and post-event Sentinel-2 MSI images. The Sentinel-2 MultiSpectral Instrument (MSI) consists of two polar-orbiting satellites, Sentinel-2A and Sentinel-2B, launched in June 2015 and March 2017, respectively (ESA, 2020). The Sentinel-2 MSI has a 290 km wide field of view, a minimum revisit period of 5 d; 13 spectral bands ranging from visible to shortwave infrared (SWIR); and spatial resolution of 10 m (four bands), 20 m (six bands), and 60 m (three bands) (ESA, 2020). The Sentinel-2 Technical Guide describes the MSI's radiometric, spectral, and spatial characteristics (ESA, 2020).
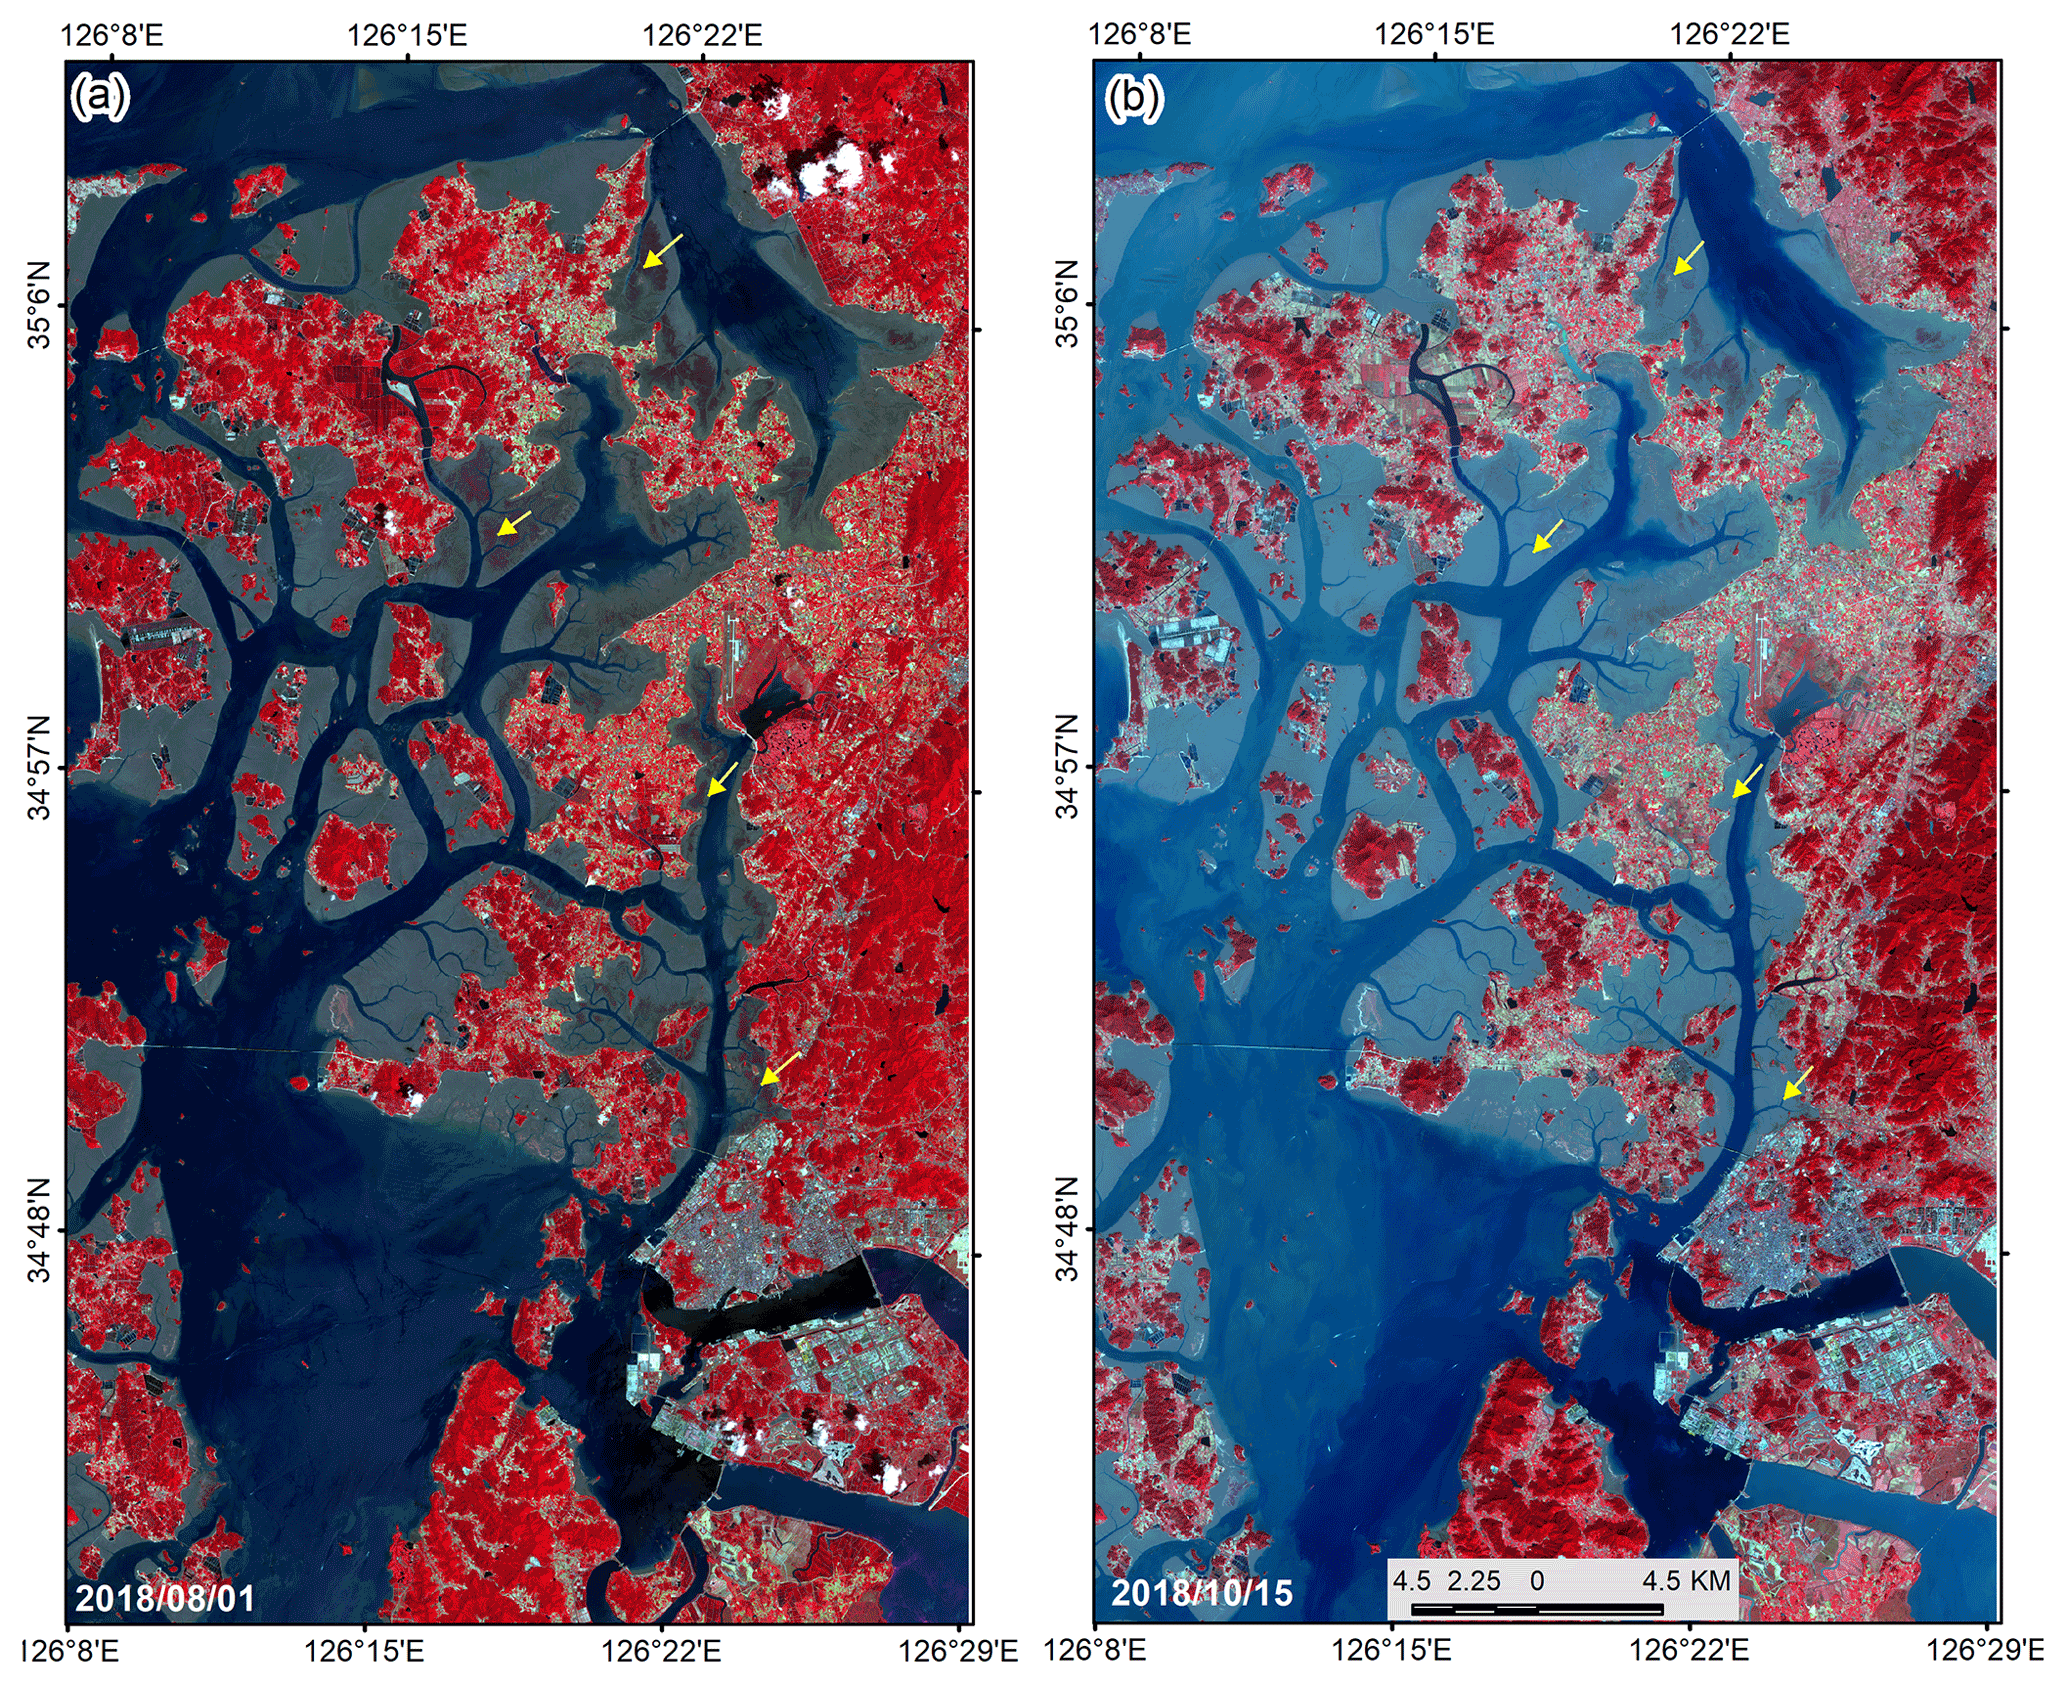
Figure 2(a) Pre- and (b) post-typhoon standard false-color composite-of-reflectance image of the Mokpo coastal region (Sentinel-2 MSI images were downloaded from https://scihub.copernicus.eu/dhus/). The arrows indicate extensive vegetation damage due to Typhoon Soulik. Please note that the date format in this and following figures is year/month/day.
The cloud-free Sentinel-2 MSI Level-1C satellite images with a relatively fine spatial resolution (10 m) for the pre- and post-typhoon periods have been downloaded from the Copernicus Open Access Hub (https://scihub.copernicus.eu/dhus/, last access: 25 April 2023) as depicted in Fig. 2. The Level-1C product is a 12-bit radiometric product that presented the top-of-atmosphere reflectance value (Phiri et al., 2021). The open-source software SNAP (Sentinel Application Platform) has been used to process the Sentinel-2 MSI images such as masking, band visualization, and atmospheric correction. We used SNAP's iCOR tool (image correction for atmospheric effect) for atmospheric correction of the Sentinel-2 MSI data over the land and water (Tian et al., 2020; Keukelaere et al., 2018). After that, satellite remote sensing reflectance (Rr) images were used to monitor short- and medium-term coastal dynamics in the Mokpo coastal region.
Table 1The details of Sentinel-2 MSI data used for coastal-dynamics modeling.
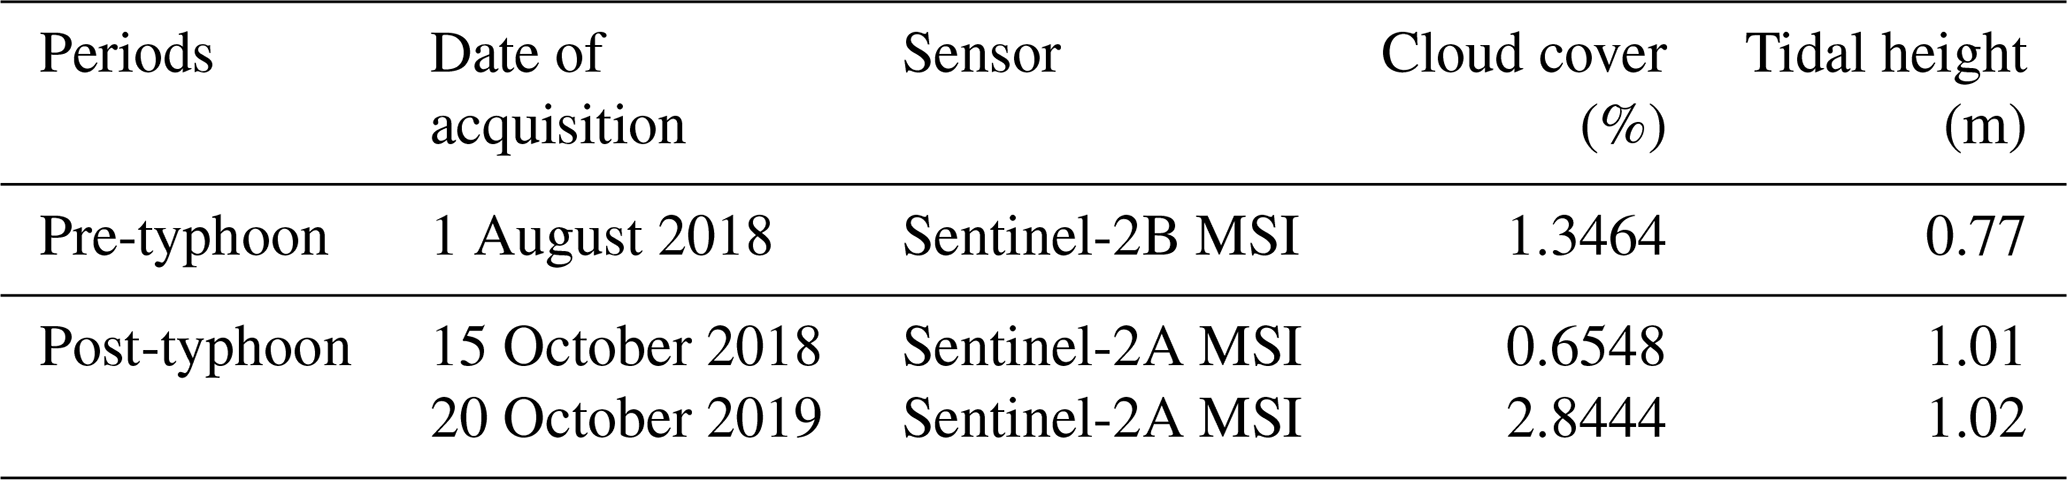
On the other hand, to exclude the impact of tidal changes, satellite images have been chosen during low-tide conditions (Maiti and Bhattacharya, 2009). The tide height has been computed using the WXTide32 program (Hopper, 2004). Several researchers have discussed the significance of low-tide satellite data for coastal mapping and dynamics modeling (Nayak, 2002). The details of pre- and post-typhoon satellite data used in the study are listed in Table 1. In addition, the coastal morphology was also investigated using high-resolution (5 m × 5 m) topography data (i.e., lidar DEM; digital elevation model) provided by the Korean National Geographic Information Institute (NGII) and bathymetry data obtained from GMRT (Global Multi-Resolution Topography; https://www.gmrt.org, last access: 18 March 2023; Fig. 1b).
3.2 Typhoon-induced coastal-dynamics modeling
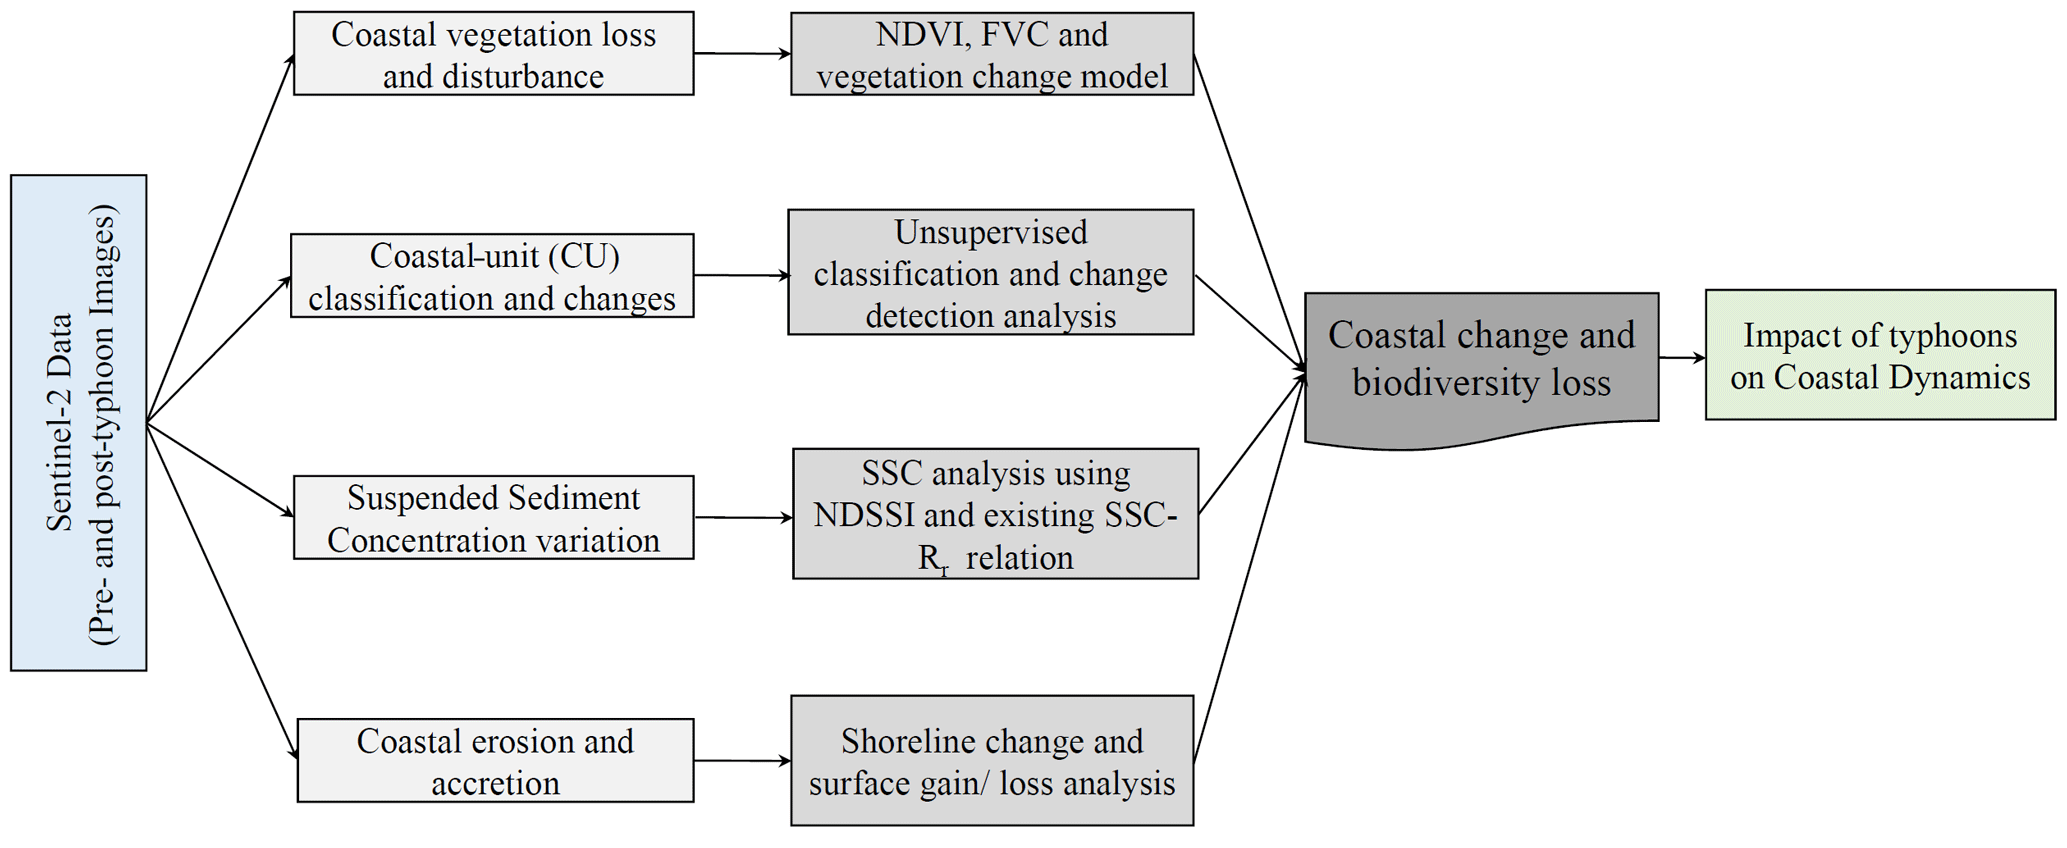
The present study addresses the Typhoon Soulik-induced morphodynamics over the Mokpo coastal region, specifically examining short- and medium-term coastal changes. Short-term coastal erosion refers to the rapid erosion processes and coastal alterations that occur immediately after typhoons or over short durations, typically within days, weeks, or months. Contrarily, medium-term coastal change refers to erosion processes and coastal changes that take place over a period of time ranging from a few months to a few years. It involves the restoration and stabilization of coastal land surfaces after the typhoon. Figure 3 depicts an integrated flowchart of the impact of a typhoon on a coastal system. The outline of the study is divided into four sections: (a) coastal-vegetation disturbance mapping, (b) coastal-landform mapping and change analysis, (c) suspended-sediment concentration variation modeling, and (d) analysis of coastal erosion and accretion. The details of the methodology of each objective are discussed in the subsequent section.
3.2.1 Analyses of coastal-vegetation loss and disturbance
Vegetation damage severity mapping (VDSM) has been performed using pre- and post-event satellite images. NDVI and FVC are widely used techniques for measuring the vegetation density, health status, and regional vegetation condition and detecting vegetation disturbances (Xu et al., 2021; Mishra et al., 2021b; Wang et al., 2010; Yang et al., 2018; Wang and Xu, 2018; Carlson and Ripley, 1997). Subsequently, numerous studies (Xu et al., 2021; Mishra et al., 2021a; Charrua et al., 2021; Shamsuzzoha et al., 2021; Kumar et al., 2021; Nandi et al., 2020; Wang and Xu, 2018; Konda et al., 2018; Zhang et al., 2013; Rodgers et al., 2009) have shown that NDVI and FVC are reliable indicators of post-typhoon damage detection. Therefore, in this study, the vegetation damage due to Typhoon Soulik has been determined using the NDVI and FVC approach. The NDVI value has been calculated as follows (Rouse et al., 1974; Filgueiras et al., 2019):
where ρNIR and ρRed are the spectral reflectances corresponding to the eighth (832.8–832.9 nm) and fourth (664.6–664.9 nm) Sentinel-2 MSI bands, respectively (Xu et al., 2021). In general, NDVI values range from −1.0 to 1.0. The higher the NDVI value, the better the conditions for vegetation development, and extremely low values indicate the presence of water. Furthermore, an NDVI value above 0.4 indicates vegetated surfaces, and those between 0.25 and 0.40 signify soils with the presence of vegetation (Charrua et al., 2021). The vigor of the vegetation increases as the NDVI values come closer to 1.00 (Rouse et al., 1974). Numerous studies have established the NDVI threshold for vegetated land (e.g., Xu et al., 2021; Wong et al., 2019; Liu et al., 2015; Eastman et al., 2013; Yang et al., 2012; Sobrino et al., 2004). Most researchers noted that the NDVI threshold value for vegetation cover typically ranges from 0.15–2.0 (Xu et al., 2021; Eastman et al., 2013; Sobrino et al., 2004). Therefore, the vegetated pixels (e.g., NDVI threshold of > 0.20) present in pre- and post-typhoon NDVI images have been used for vegetation severity analysis. The NDVI threshold is considered to reduce the effect of land cover change from the pre- (1 August 2018) to post-typhoon (15 October 2018) periods.
The degree of vegetation damage has been determined by comparing the NDVI values of the pre- and post-typhoon periods. Various researchers have frequently used the direct difference in NDVI to determine the damage severity caused by typhoons to naturally vegetated land (Wang and Xu, 2018; Konda et al., 2018). It has been calculated on a cell-by-cell basis by subtracting the pre-typhoon NDVI image from the post-typhoon image in ArcGIS using Map Algebra (Zhang et al., 2013; Cakir et al., 2006). The following equation is used to calculate the ΔNDVI (Wang and Xu, 2018):
The difference in NDVI (i.e., ΔNDVI) illustrates the change in natural vegetation, while a negative ΔNDVI value indicates the damage inflicted by a typhoon to the vegetation cover (Xu et al., 2021).
The relative change in NDVI value has been used to investigate the geoecological impact on the forest area (Mishra et al., 2021b). The relative vegetation changes (NDVIr) after Typhoon Soulik have been determined by using the following equation (Kumar et al., 2021):
where the negative NDVIr value indicates vegetation loss caused by typhoons and the positive NDVIr value shows vegetation gain. The NDVIr value has been classified into three categories corresponding to pixels with vegetation cover that has decreased, had no change, or has increased.
On the other hand, we analyze FVC in conjunction with NDVI, which provides additional insights into vegetation conditions and damage severity. Numerous researchers (Wang and Xu, 2018; Song et al., 2017; Bao et al., 2017; Chu et al., 2016; Amiri et al., 2009) used FVC to analyze vegetation damage, restoration, recovery, and inter-annual variability. In the present study, FVC was calculated before and after the typhoon using the derived NDVI data (Wang and Xu, 2018). It is expressed as a percentage and can range from 0 % to 100 %. The formula of FVC is as follows (Wang and Xu, 2018; Amiri et al., 2009; Carlson and Ripley, 1997):
where NDVIm and NDVImax represent the NDVImin and NDVImax values calculated using Eq. (1) (Zhang et al., 2021; Ge et al., 2018). The calculated FVC values vary between 0 and 1. After that, the FVC values were converted to percentages to fit the actual FVC classification scheme (Wang and Xu, 2018), which consists of five classes: high (80 %–100 %), medium-high (60 %–80 %), medium (40 %–60 %), medium-low (20 %–40 %), and low (0 %–20 %). Further, the difference in FVC values between the pre- and post-typhoon images was used to calculate the extent of vegetation damage using the following equation:
where ΔFVC denotes the difference between the pre- and post-typhoon FVC. The ΔFVC value represents alterations in vegetation conditions and damage intensity, while a negative value of ΔFVC indicates the extent of damage caused by a typhoon to vegetation cover (Wang and Xu, 2018).
3.2.2 Coastal-landform classification and change analysis
Typhoons have adversely affected the coastal landform and ecology of the southern and western coasts of the Korean Peninsula every year. Therefore, a GIS-based coastal-change model has been developed to understand the morphodynamics of coastal landforms during typhoons. In the present study, we considered four coastal-landform classes, i.e., wetland, wetland vegetation, land, and water, for the coastal morphodynamic analysis (Maiti and Bhattacharya, 2011). The method consists of two algorithms, i.e., (a) the ISODATA (Iterative Self-Organizing Data Analysis Technique) algorithm used to classify the coastal landform with four main classes, i.e., water, wetland, wetland vegetation, and land, and (b) the change detection technique used to quantify the short- and medium-term coastal changes. In this approach, we accentuate in-depth morphological changes and emphasize minor changes along the Mokpo coast caused by Typhoon Soulik.
The pre- and post-typhoon Sentinel-2 MSI images have been classified using the unsupervised classification technique to distinguish between different coastal landforms of the study region. This approach is used to determine which types of coastal landforms were adversely affected by Typhoon Soulik and which of them have recovered more quickly than others. ERDAS IMAGINE has been used to run the unsupervised classification algorithm (ERDAS, 1997). Based on the k-means algorithm, this technique reduces variability within pixel clusters (Charrua et al., 2021; Aswatha et al., 2020; Bhowmik and Cabral, 2013). Finally, pre- and post-typhoon Sentinel-2 MSI images have been classified into four coastal-landform classes: land, water, wetland, and wetland vegetation.
The accuracy assessment is a commonly used method to determine how closely the classified map matches the reference data (Congalton, 1991). In the present study, the classified data (i.e., coastal-landforms maps) have been derived through an unsupervised classification technique, while 550 random samples collected from different parts of the Sentinel-2 MSI standard false-color image are considered reference data. Thereafter, a confusion matrix was developed based on the reference and classified data to evaluate accuracy statistics (Story and Congalton, 1986). The κ coefficient (k) has been used to determine the quantitative accuracy of the classified map (Landis and Koch, 1977). The assessment is quantified using three different statistics: overall accuracy, producer accuracy, and user accuracy (Story and Congalton, 1986). The model's precision is classified into five categories based on the k values: near perfect (k > 0.8), substantial (0.6 < k < 0.8), moderate (0.4 < k < 0.6), fair (0.2 < k < 0.4), and poor (k < 0.2) (Landis and Koch, 1977).
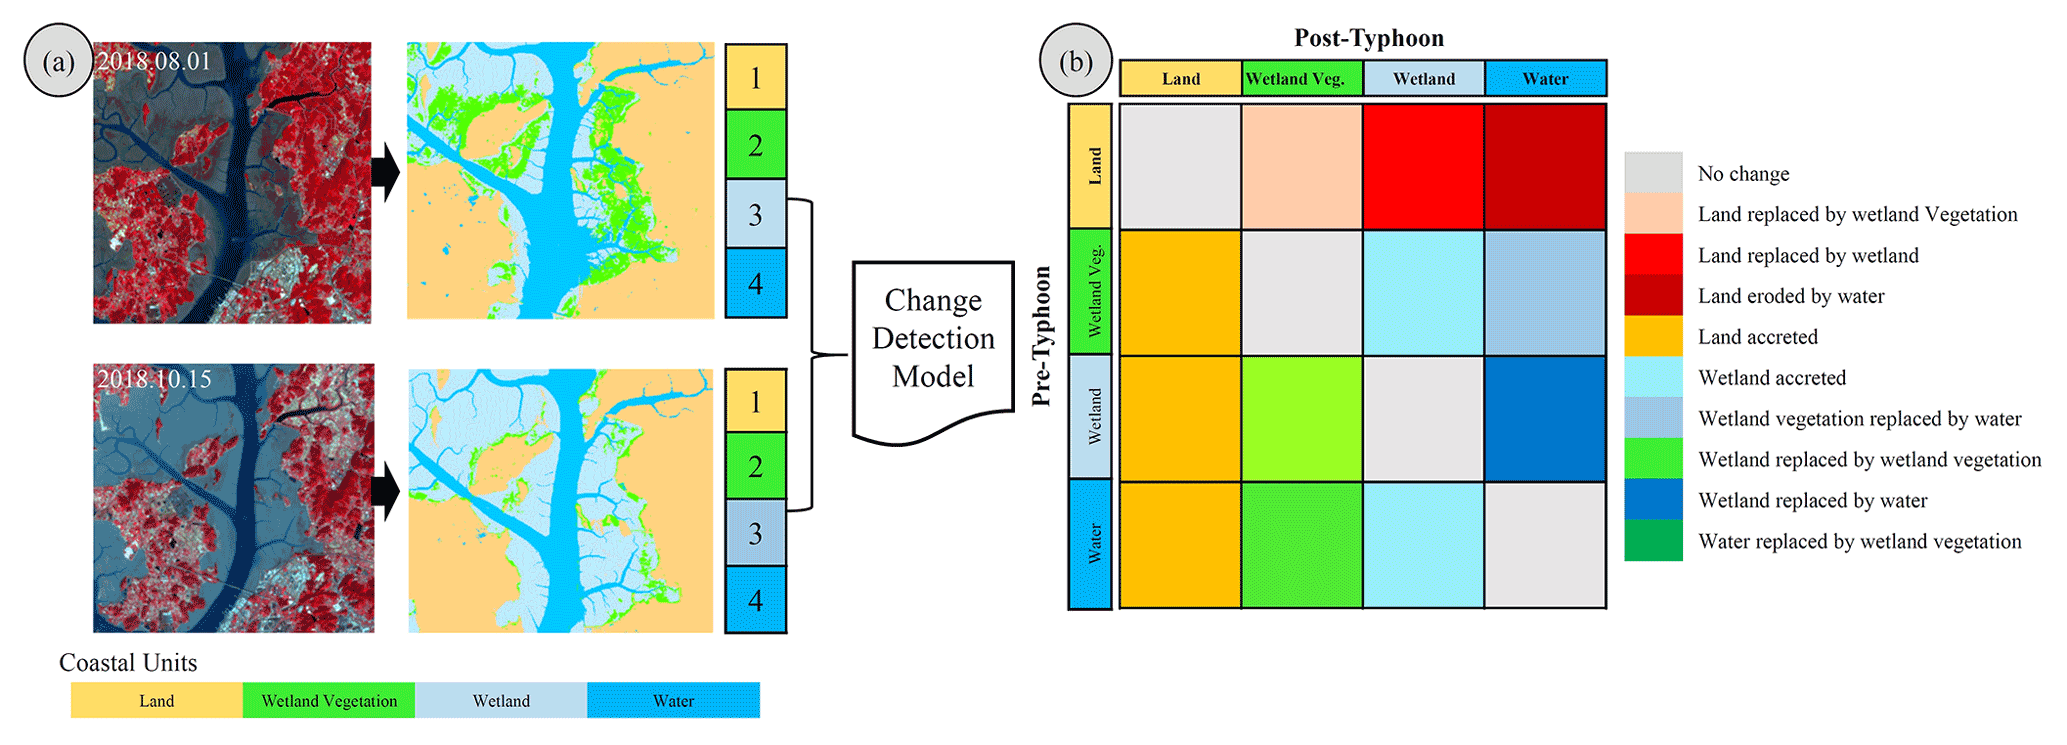
Figure 4The coastal-change model exhibits spatial replacements among coastal-landform classes (pre- and post-typhoon Sentinel-2 MSI images were downloaded from https://scihub.copernicus.eu/dhus/).
The land transformation model based on mutual spatial replacements has been applied during the post-classification stage, as shown in Fig. 4. The classified coastal-landform classes, such as land, wetland, wetland vegetation, and water, have been spatially replaced in order to create coastal-change units. For example, the coastal-landform class of wetland vegetation in the pre-typhoon period replaced by water in the post-typhoon period indicates the change class of wetland vegetation replaced by water. A total of nine coastal-change classes have been derived, as illustrated in Fig. 4b.
3.2.3 Suspended-sediment concentration modeling
The suspended-sediment concentration (SSC) distribution in coastal regions is a significant indicator of changes in the marine environment caused by typhoon-induced storm surges, strong waves, and subsequent coastal flooding (Min et al., 2012; Gong and Shen, 2009). In a short period, a typhoon may drastically influence the water column structures (Souza et al., 2001), change the transport and deposition of sediment (Li et al., 2015), and affect the distribution of nutrients and biological production in the affected seas (Wang et al., 2016). Extreme storms or typhoons can modify suspended-sediment distribution in coastal regions, which can significantly change marine habitats (Chau et al., 2021; Lu et al., 2018; Li and Li, 2016). Due to strong typhoon wind stress, the concentration of suspended particles in the seawater column and sediment resuspension may increase dozens of times before and after the event (Lu et al., 2018; Bian et al., 2017). Thus, typhoons significantly affect suspended-sediment movement in the coastal region (Zhang et al., 2022; Li and Li, 2016; Goff et al., 2010). The spatiotemporal distribution of the SSC can be impacted by variations in tidal phase, runoff, and wind speed (Tang et al., 2021). Furthermore, the resuspension of sediment can cause numerous problems in ocean engineering and change the region's ecology (Kim, 2010). The amount of material delivered to and adverted across the shelf by typhoons is considerably larger than that of winter storm systems (Dail et al., 2007). The southern and western part of the Korean Peninsula is affected by an average of three typhoons annually passing through the Yellow Sea (KMA, 2018; Altman et al., 2013). Some studies on the SSC distribution impacted by artificial construction along the coastal region of the Yellow Sea have been undertaken by several researchers (i.e., Lee et al., 2020; Eom et al., 2017; Min et al., 2012, 2014; Choi et al., 2014). However, the effects of typhoons on the sedimentary environment in the Mokpo coastal region have not yet been investigated. Therefore, it is imperative to carry out regional-scale SSC mapping and coastal modifications to reveal changes in the marine environment and sediment transport mechanisms over the typhoon period.
Remote sensing has long contributed to the advancement of water quality studies (Hossain et al., 2021). In the present study, we attempted to calculate both the qualitative and quantitative SSC in the inner-shelf region of the Mokpo coast using Sentinel-2 MSI data. The relative suspended-sediment concentration has been calculated from pre- and post-typhoon Sentinel-2 MSI images using NDSSI, which has been used in various water quality research (Kavan et al., 2022; Hossain et al., 2010). Further, many studies (Shahzad et al., 2018; Arisanty and Saputra, 2017) have successfully used Landsat and Sentinel-2 data to calculate NDSSI. This index determines the relative concentration of suspended sediment, with values ranging from −1 to 1, where −1 indicates the highest concentration and +1 indicates the lowest (Hossain et al., 2010). The NDSSI value has been calculated by using the following equation:
where ρBlue and ρNIR represent the surface reflectances of band 2 (492.1–492.4 nm) and band 8 (832.8–833.0 nm) of Sentinel-2 MSI data, respectively. The NDSSI value is based on the observation that turbid waters reflect more in the NIR band but less in the visible band. The negative NDSSI value represents the reflectance of water in the NIR band being greater than that in the blue band (Shahzad et al., 2018; Hossain et al., 2010). Therefore, the positive values of NDSSI represent a lower SSC or more transparent water, while a negative value indicates a higher SSC. The spatial patterns of the relative SSC during the typhoon period have been determined using NDSSI.
Table 2Relationship between the remote sensing reflectance (Rr) and suspended-sediment concentration (SSC, g m−3).
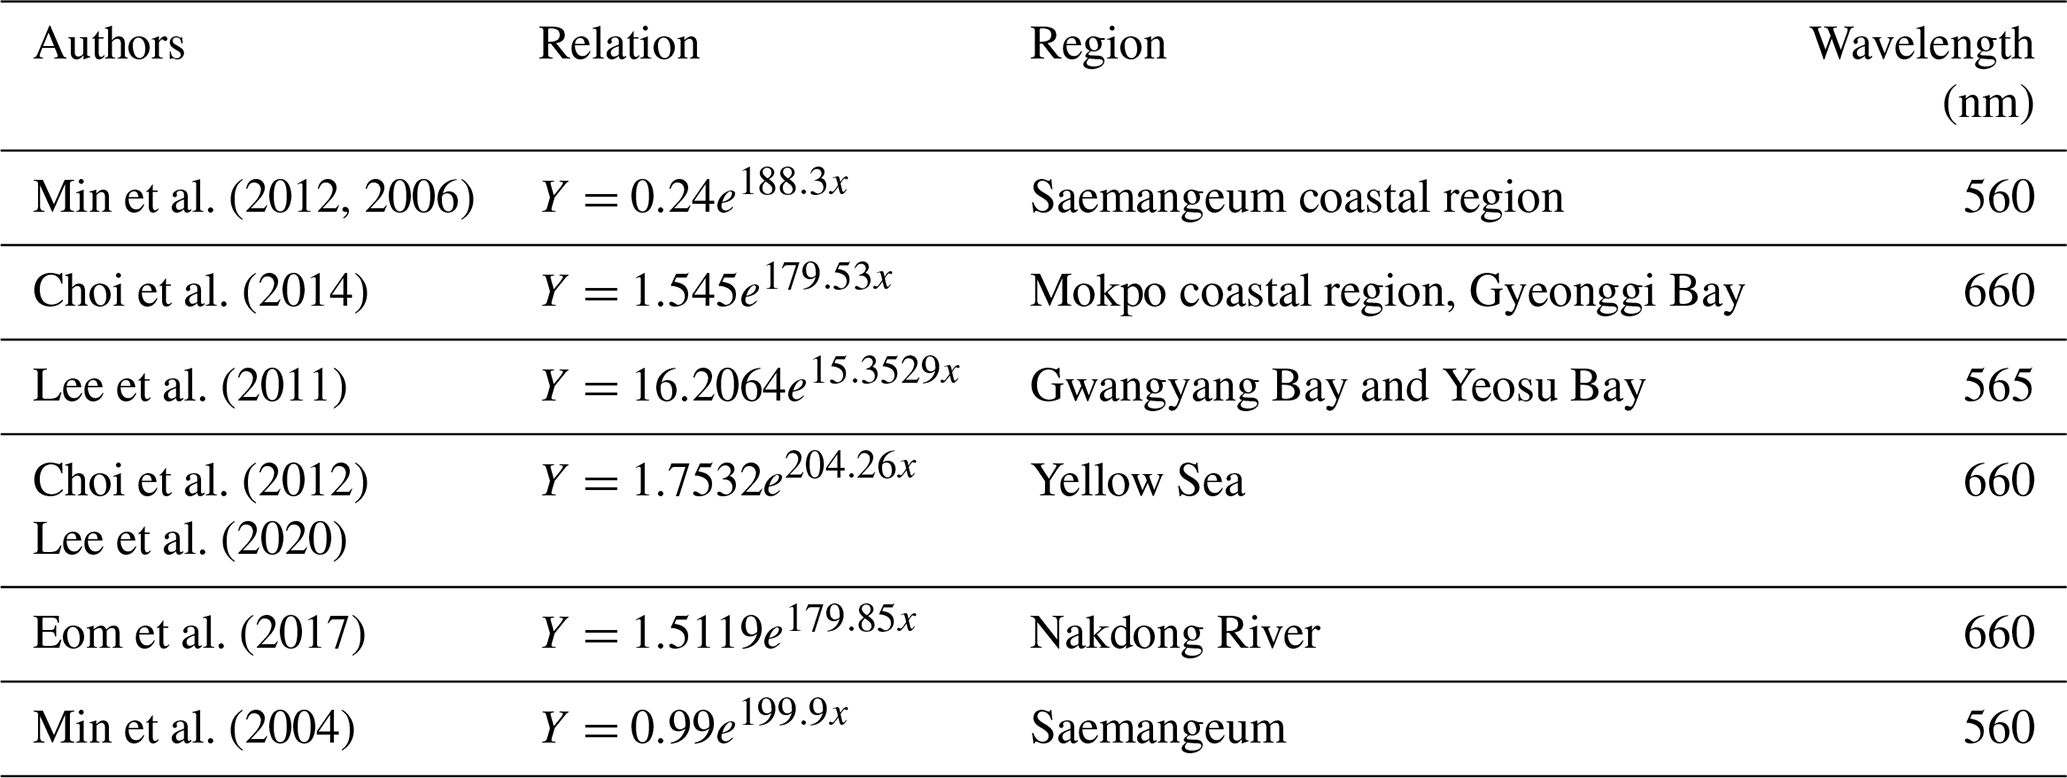
On the other hand, the empirical model has also been used to quantify the suspended-sediment concentration before and after Typhoon Soulik. This method is widely used for SSC mapping and monitoring around the world (Eom et al., 2017; Hwang et al., 2016; Son et al., 2014; Min et al., 2012; Lee et al., 2011; Choi et al., 2014). For this purpose, we reviewed the existing relations between the in situ SSC (SSC, g m−3) and remote sensing reflectance (Rr) developed by various researchers for the southern and western coasts of South Korea, as illustrated in Table 2. In the present study, the SSC algorithm developed by Choi et al. (2014) for the Mokpo coastal region based on the in situ SSC and a spectral ratio of water reflectance around 660 nm has been used to quantify the SSC distribution. The atmospherically corrected Sentinel-2 MSI image (red band) has been used to calculate the SSC.
3.2.4 Analysis of coastal erosion and accretion
The shorelines (i.e., land and water boundary) of the Mokpo coast for short and medium periods have been extracted using a semi-automatic technique (Maiti and Bhattacharya, 2009). Here, we used the normalized difference water index (NDWI) and manual digitization approach to separate the land and water boundary. The technique is widely used for dividing the land and water boundary (Santos et al., 2021; Dai et al., 2019). By using Sentinel-2 MSI imagery, NDWI can be achieved with the following formula (McFeeters, 1996):
where ρGreen is the green band and ρNIR is the near-infrared band of Sentinel-2 MSI data.
The extracted land and water boundary of the Mokpo region are then converted into polygons, and the shoreline has been determined using ArcGIS software. The shoreline change statistics have been calculated using the DSAS program (Thieler et al., 2009). The extracted shoreline for pre- and post-typhoon periods has been merged, and a 10 m interval transect perpendicular to a baseline has been created (Santos et al., 2021). After that, the net shoreline movement (NSM) method was used to calculate the total shoreline movement (in meters) between the pre- and post-typhoon shoreline positions of each transect (Kermani et al., 2016):
where shpost and shpre represent the post- and pre-typhoon shoreline positions, respectively.
On the other hand, the backshore surface area changes due to shoreline movement (retreat/advance) over the typhoon period has also been calculated using the Geostatistical Analyst toolbox. Several researchers (Awad and El-Sayed, 2021; Deabes, 2017; Kermani et al., 2016) have also previously mapped the surface changes in the backshore region. To create the surface area change map, we first generated two polygon layers based on the extracted shoreline, one for the pre- and one for the post-typhoon periods. Next, we utilized the Symmetrical Difference tool in ArcGIS to compute the difference between these polygon layers during the period affected by the typhoon. Finally, two feature classes have been derived, one for erosion and another for accretion. In addition, the attribute table contained in each zone illustrates the magnitude of spatial changes (amount of erosion and accretion) during the typhoon period.
4.1 Vegetation damage severity mapping (VDSM) before and after the typhoon
4.1.1 VDSM based on the NDVI and FVC analysis
The VDSM shows the degree of vegetation damage due to typhoons. The comparison of pre- and post-typhoon NDVI and FVC distribution shows a significant loss of vegetated land as the number of no-productivity and low-productivity pixels increases in the post-typhoon NDVI and FVC image.
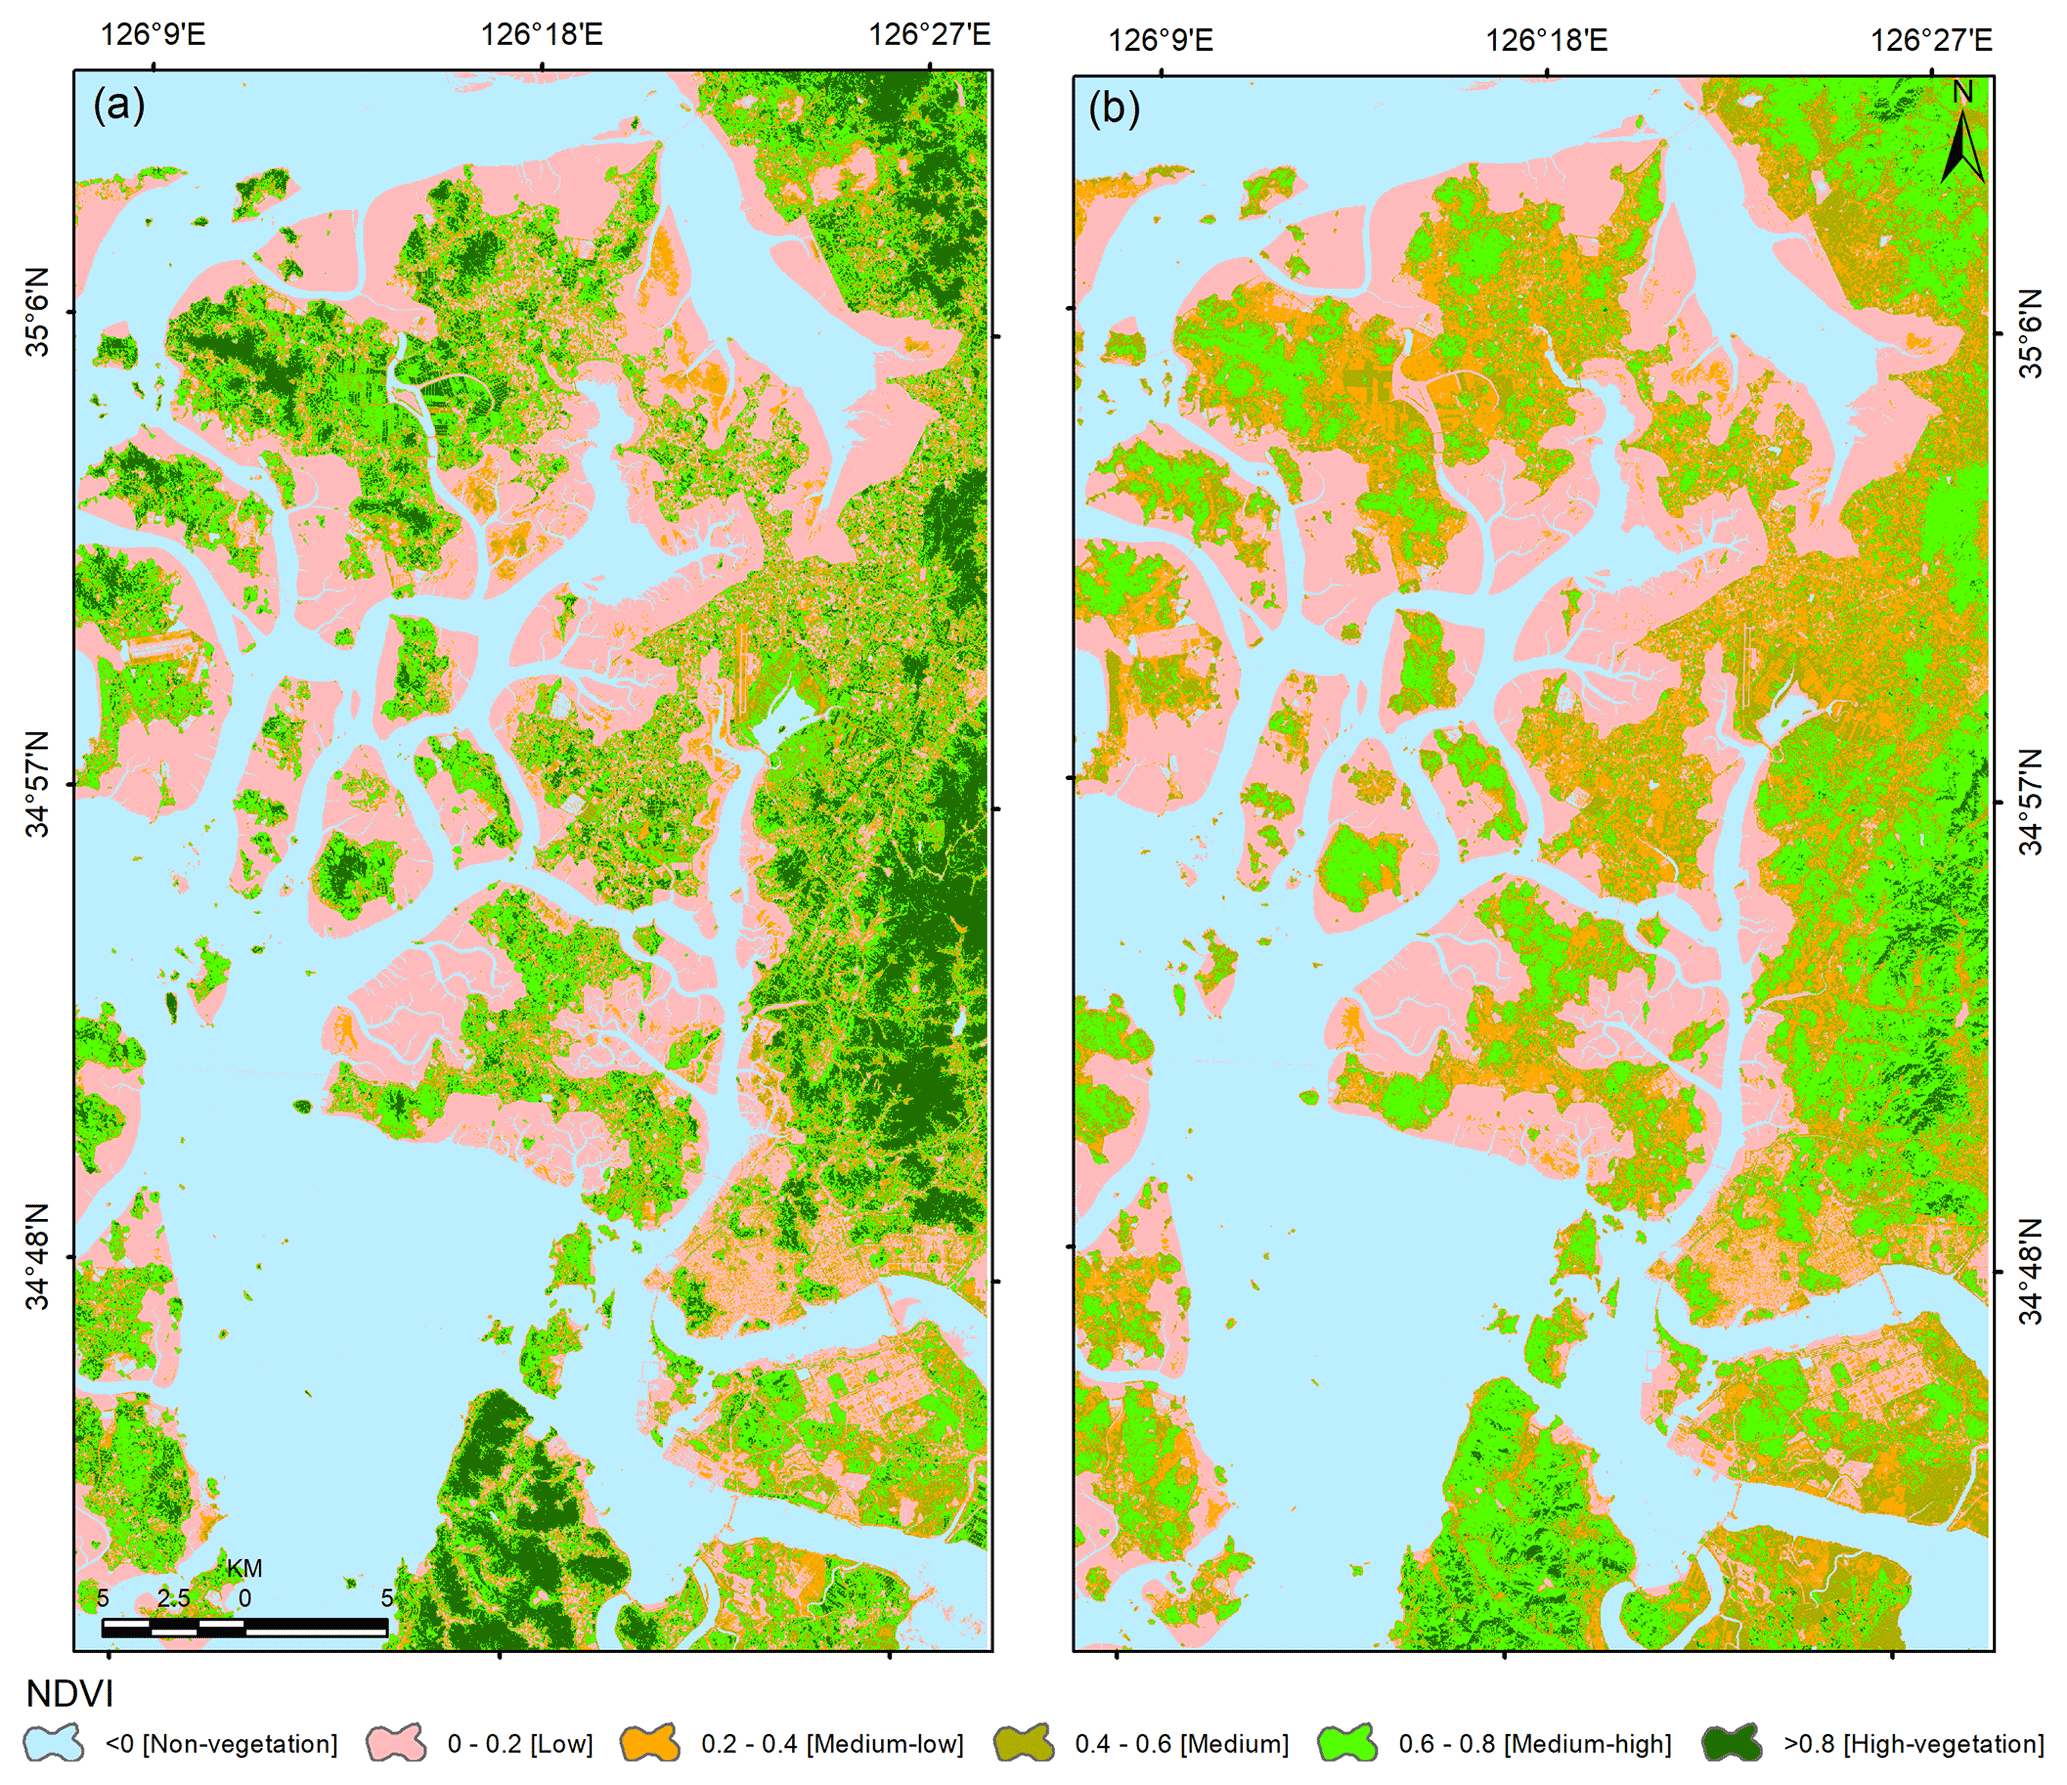
Figure 5Status of vegetation greenness based on the NDVI data for the (a) pre- (1 August 2018) and (b) post-typhoon (15 October 2018) periods.
Figure 5 depicts the spatial distribution of pre- and post-typhoon NDVI images. Further, to determine the severity of vegetation damage, the pre- and post-typhoon NDVI images have been classified into six categories, namely non-vegetation (−1.0–0.0), low vegetation (0.0–0.2), medium-low vegetation (0.2–0.4), medium vegetation (0.4–0.6), medium-high vegetation (0.6–0.8), and high vegetation (0.8–1.0). The pre- and post-typhoon mean NDVI values were observed to be 0.159 and 0.143, respectively, indicating a mean NDVI value decline of 0.016 after the typhoon.
Table 3 depicts the area changes for each NDVI category over the typhoon period. It has been observed that the high NDVI values (> 0.8) have changed drastically after Typhoon Soulik. The area changes in the low- and non-vegetation categories along the Mokpo coastal region revealed that the wetland (mudflat) had accreted after the typhoon. On the other hand, the post-typhoon image was acquired 2 months after Typhoon Soulik, which suggests that the grasses and crops have recovered well. This recovery is reflected in Table 3 from medium-low to medium-high NDVI levels.
Table 3NDVI distribution over the study area before and after the typhoon.
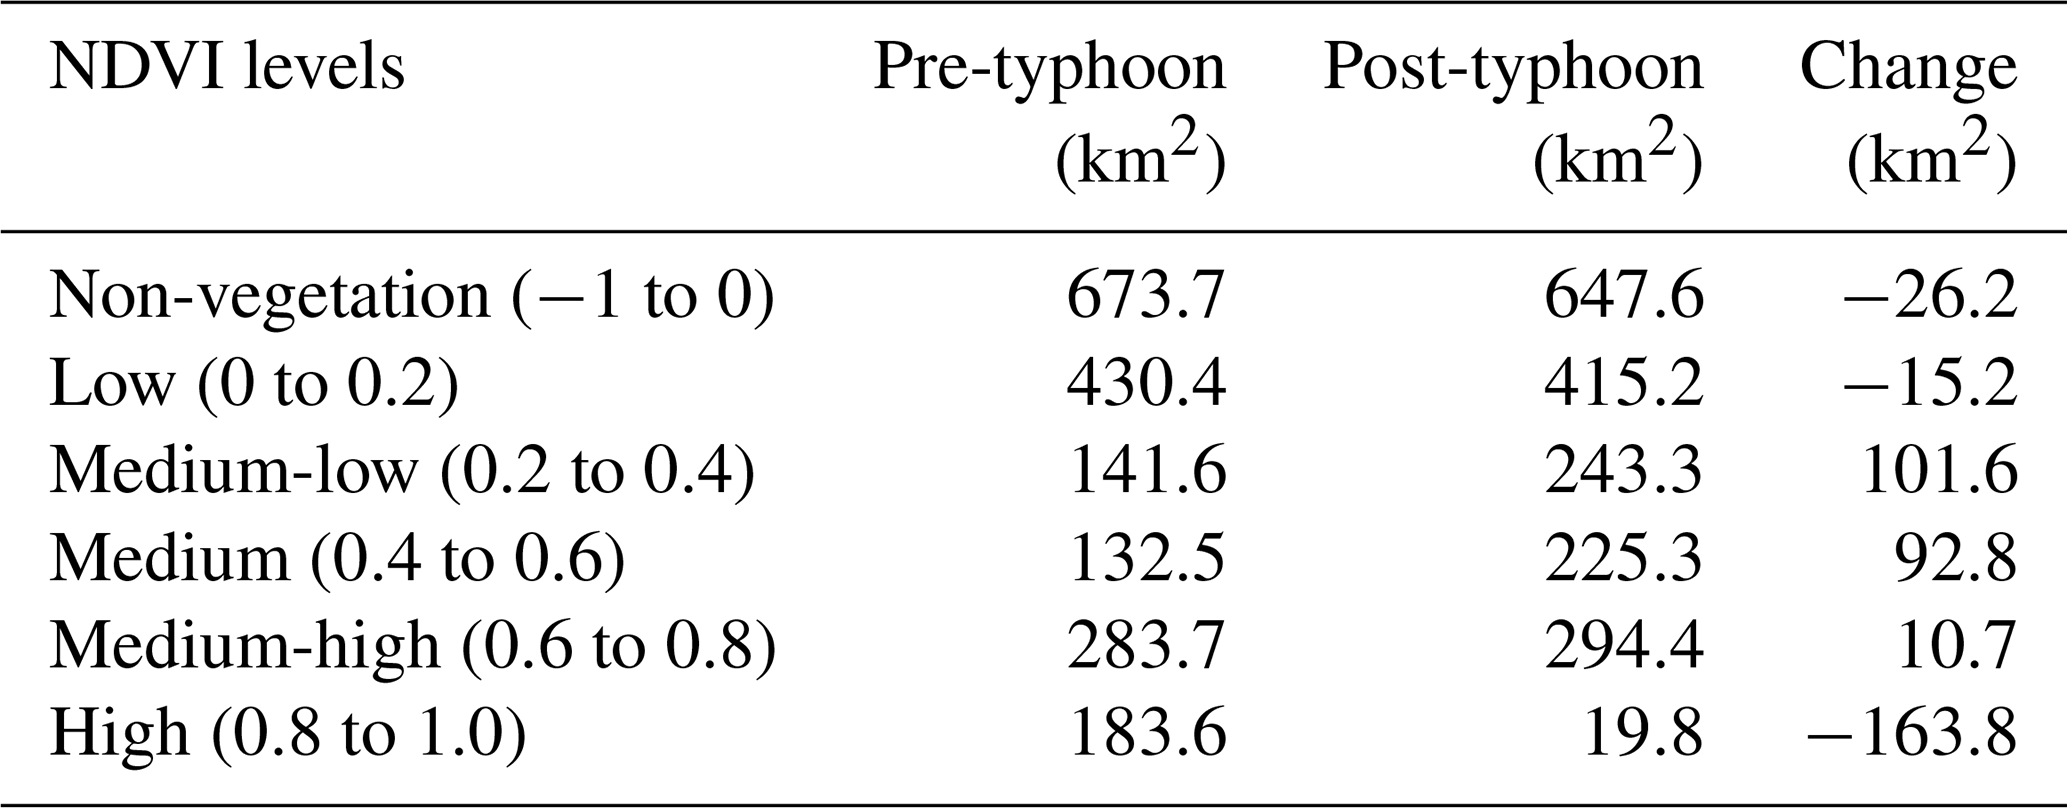
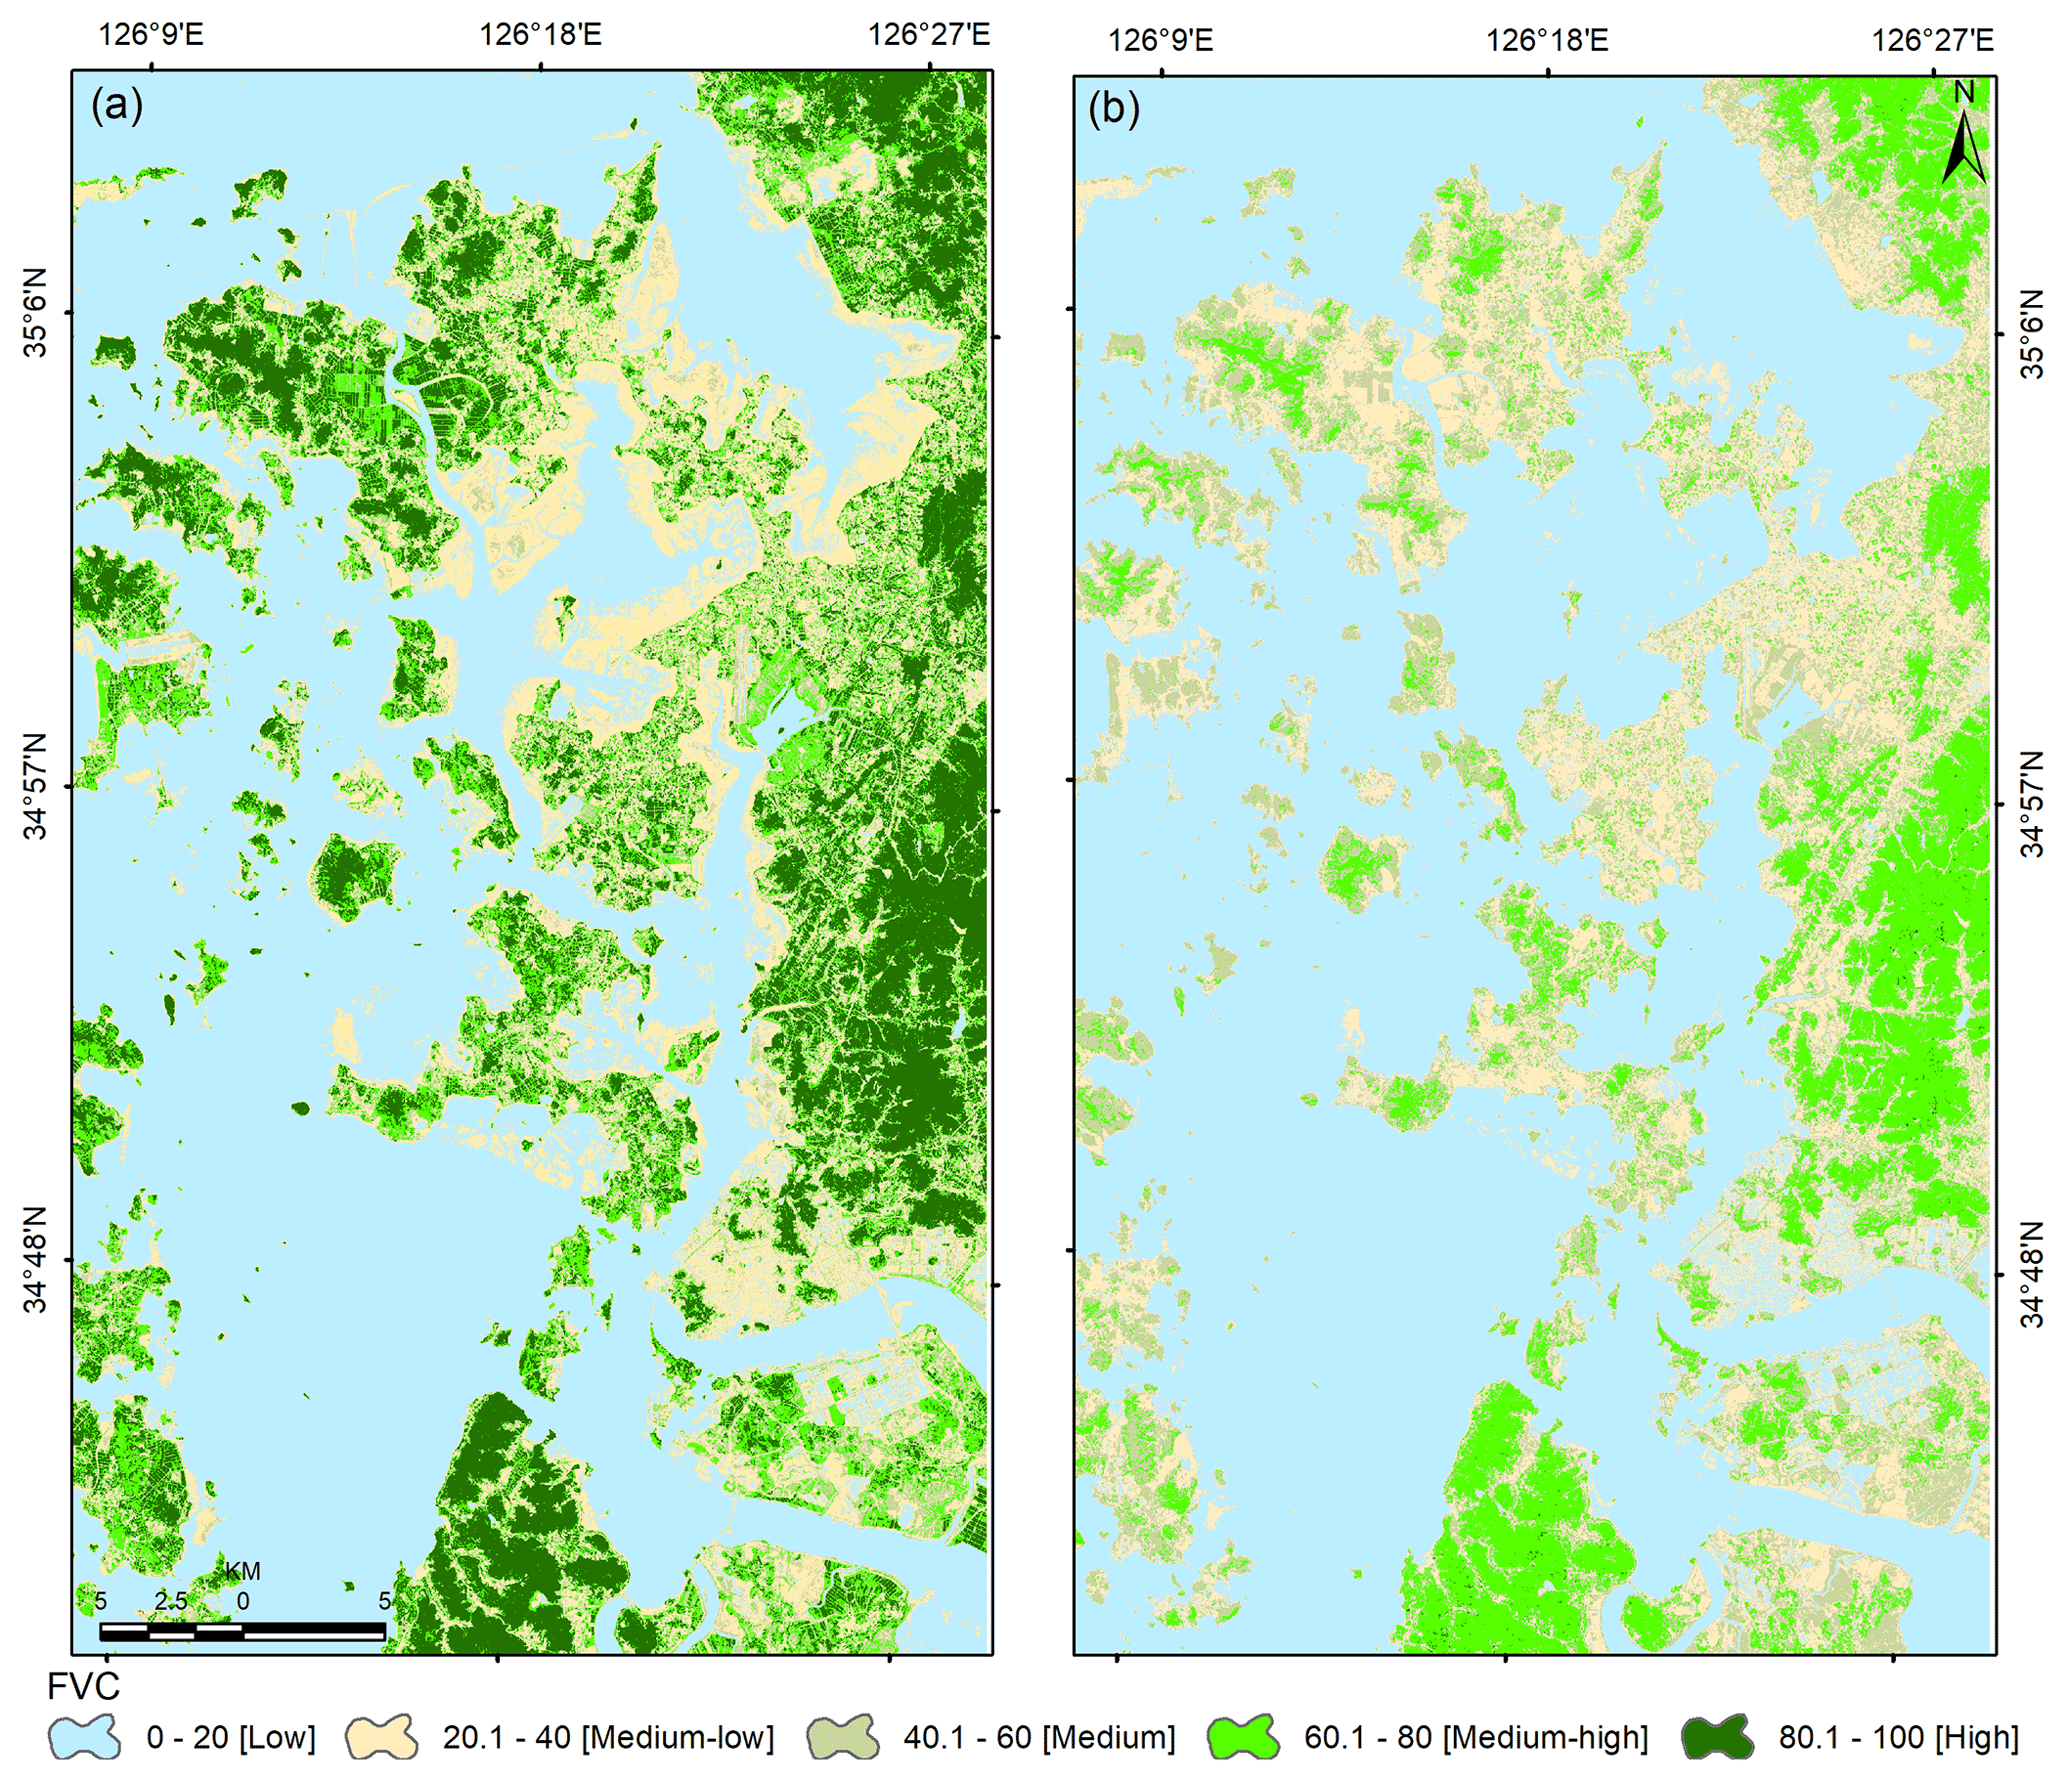
Figure 6Status of vegetation based on the FVC analysis for the (a) pre- (1 August 2018) and (b) post-typhoon (15 October 2018) periods.
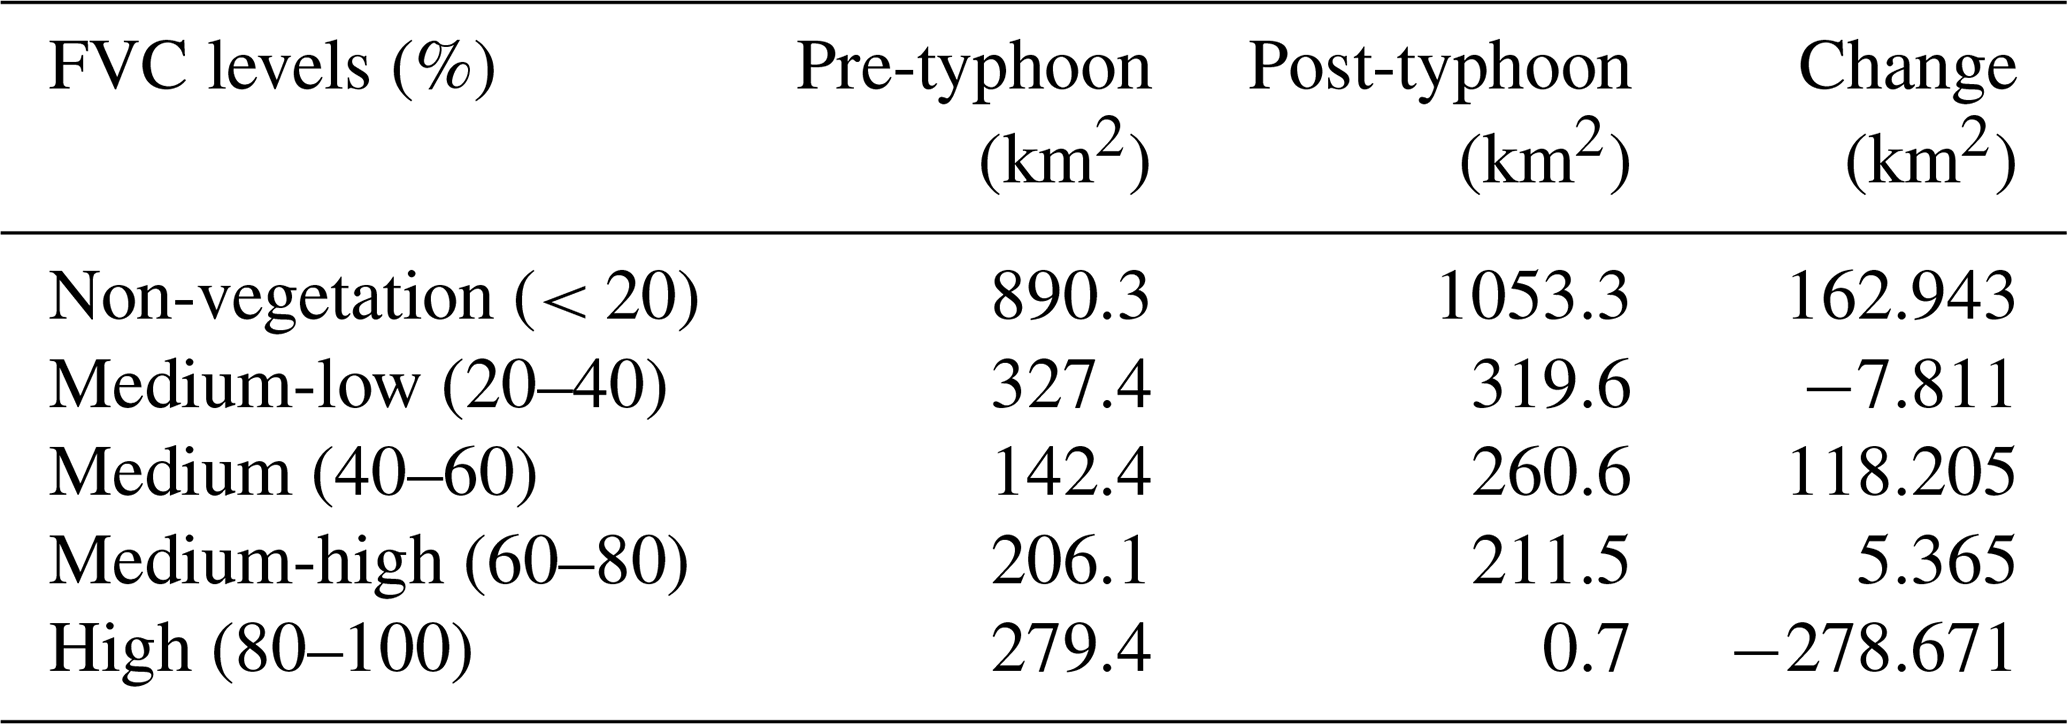
On the other hand, the physical presence of vegetation has also been measured using FVC analysis. In general, NDVI provides information on the health and productivity of vegetation, while FVC provides information on the physical presence and distribution of vegetation. Figure 6 depicts the pre- and post-typhoon FVC map of the Mokpo coast. The area of each FVC category is illustrated in Table 4. The results reveal that the typhoon caused a substantial decrease in FVC in the area, with the average FVC reducing significantly from 33.43 % to 23.64 % after the typhoon. It was observed that the area of medium-high to high FVC decreased from 485.5 to 212.2 km2, while the area of medium to low FVC increased from 1360.1 to 1633.5 km2. The vegetation category of high FVC was more severely affected and decreased considerably after the typhoon. These results indicate that the typhoon significantly impacted the wetland vegetation in the region.
In order to determine the damaged vegetation areas along the Mokpo coast, we compared pre- and post-typhoon NDVI images. A decrease in ΔNDVI is one of the most distinctive features of abrupt canopy modifications detectable by optical remote sensing (Xu et al., 2021). Thus, we can only determine vegetation deterioration from the two NDVI images. Subsequently, an NDVI threshold of 0.2 has been used to extract only vegetation features from the pre- and post-typhoon NDVI images. The threshold value has been manually adjusted to achieve the highest accuracy of vegetation pixels. The extracted vegetated pixels have been compared with reference samples randomly collected from the original high-spatial-resolution images to determine the accuracy (Schneider, 2012; Xu et al., 2021). The two extracted vegetation images obtained within 6 or 7 weeks of Typhoon Soulik (i.e., before the damaged vegetation had recovered) exhibits an overall accuracy of 95.7 % for the pre- and 94.5 % for the post-typhoon periods.
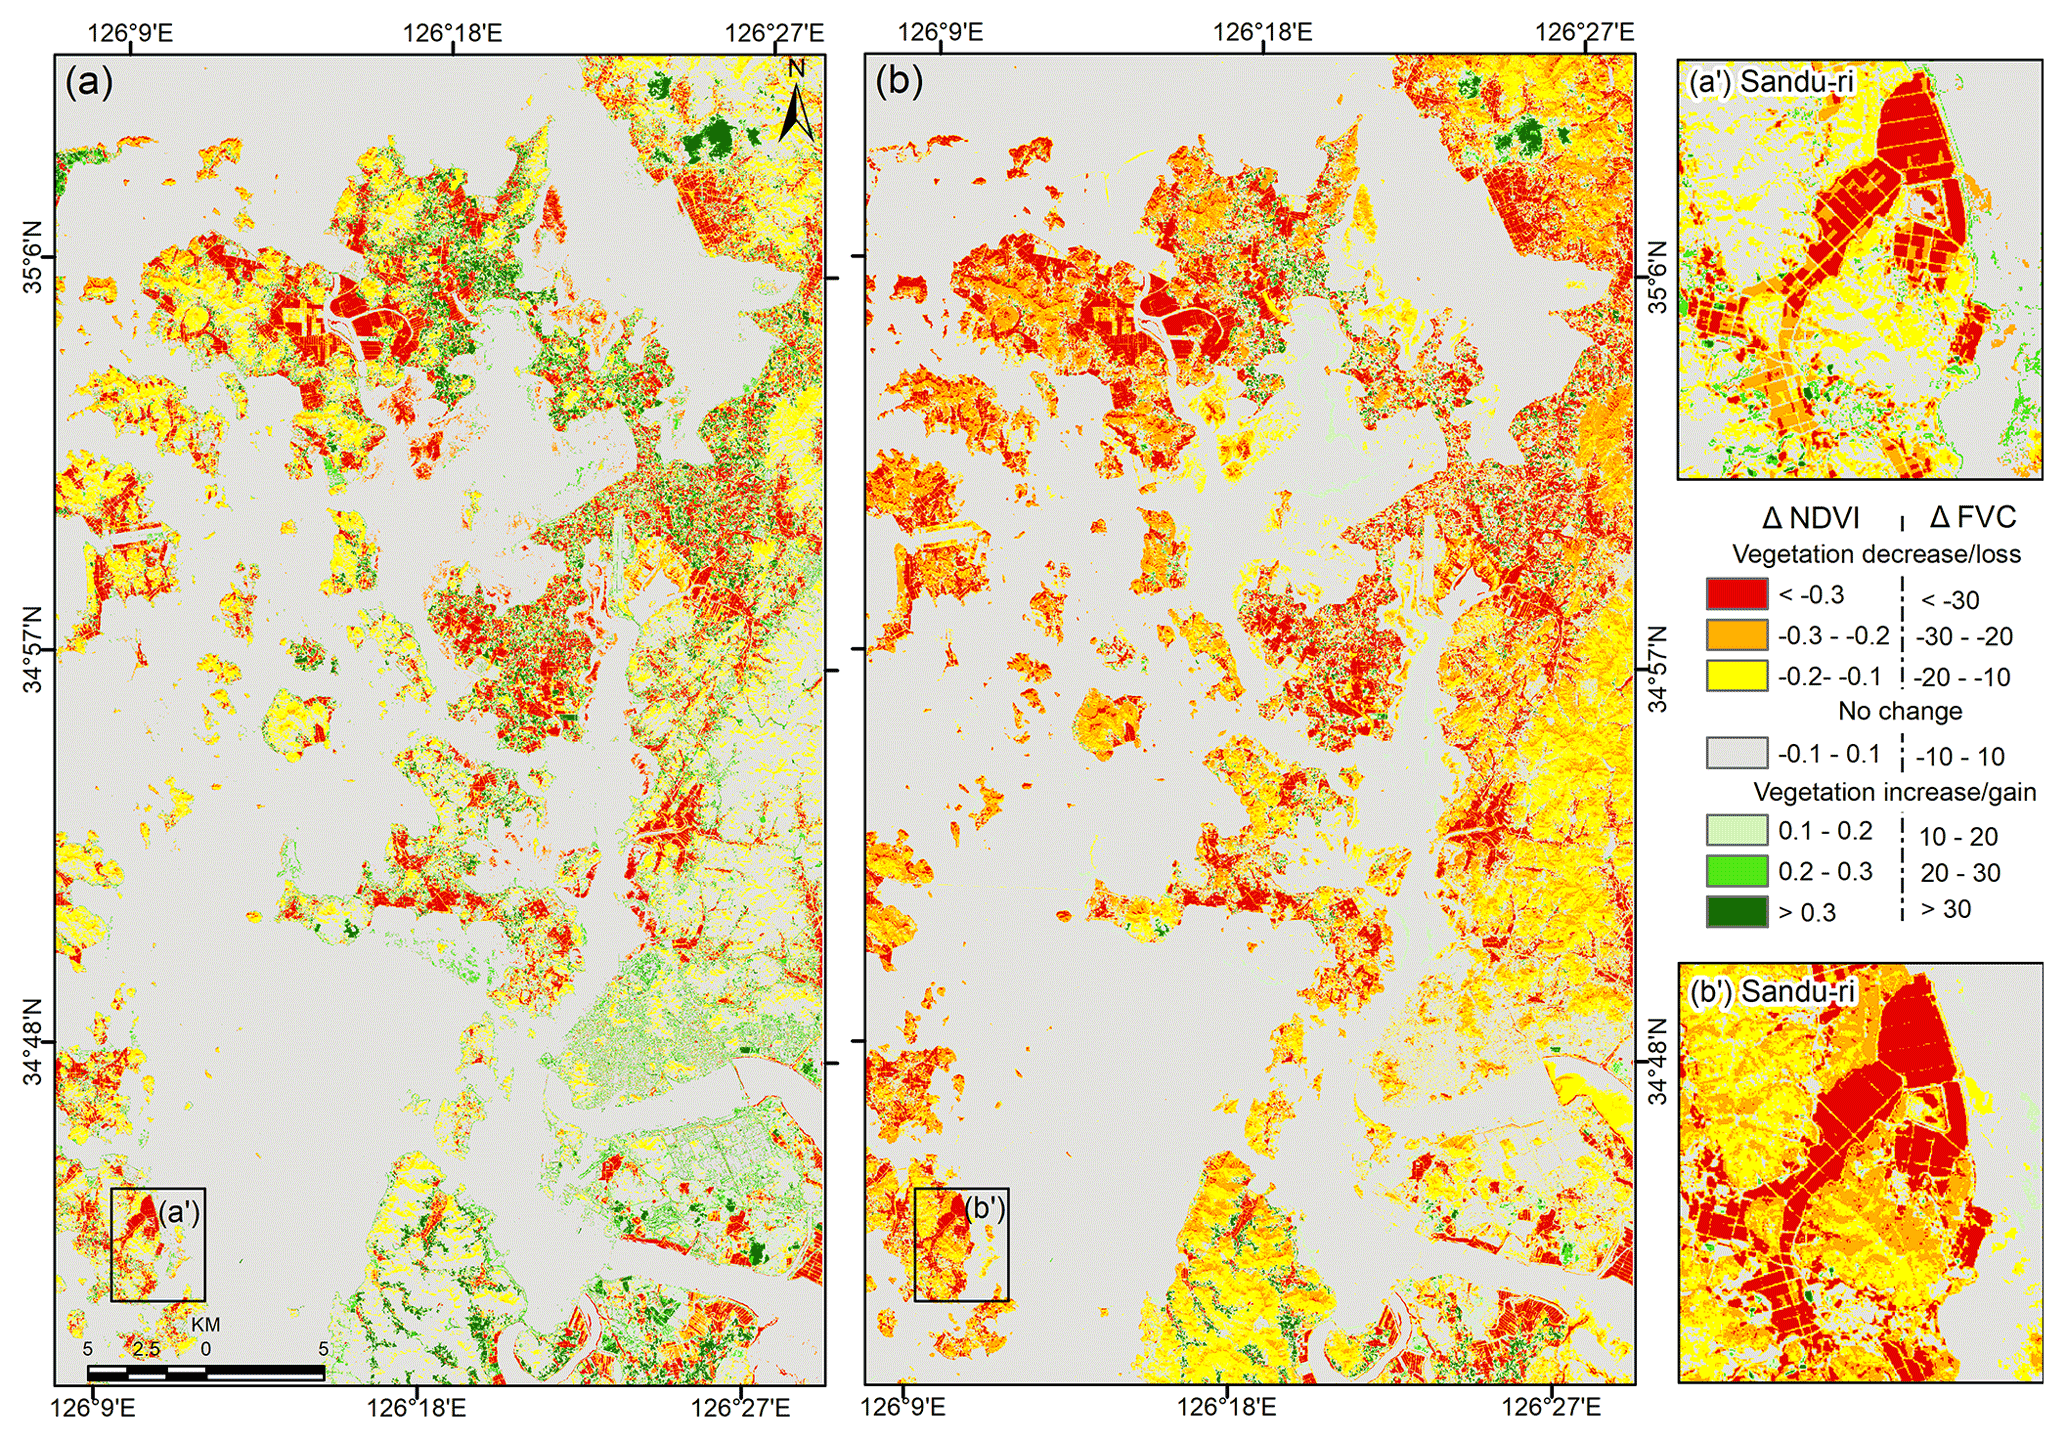
Figure 7Vegetation change map of the Mokpo coastal region derived through two different methods: (a) ΔNDVI and (b) ΔFVC. Zoomed-in boxes show the vegetation damage of Sandu-ri areas.
Figure 7a depicts the spatial distribution of ΔNDVI, where the negative ΔNDVI indicates a region with highly impacted vegetation areas. The negative ΔNDVI is attributed to about 26.7 % of the total area (1845.60 km2), which suggests that Typhoon Soulik affected approximately 493.98 km2 of vegetated land. The lowest ΔNDVI value is −0.89, which indicates either tree wind throws or a change in land surface cover from vegetation to built-up land or other non-vegetation covers (Zhang et al., 2013). The results showed that wetland vegetation and agricultural land experienced the most significant NDVI changes, with ΔNDVI values below −0.3. This suggests that these two types of land cover were severely affected by Typhoon Soulik.
On the other hand, Fig. 7b displays the change map obtained from the difference in FVC (ΔFVC), which reveals areas of altered vegetation after the typhoon. The negative ΔFVC is attributed to about 32.07 % of the total area, which suggests that Typhoon Soulik affected approximately 591.89 km2 of vegetated land. It has also been observed that the pure vegetation pixels (i.e., NDVI > 0.6 and FVC > 60 %) were drastically changed over the typhoon period. The changed area determined for NDVI and FVC is −153.43 and −273.40 km2, respectively (Tables 3 and 4). The results obtained from both techniques indicate a significant decrease in vegetation cover after the typhoon. The probable reason for the change is that Typhoon Soulik made landfall close to the Mokpo coastal region.
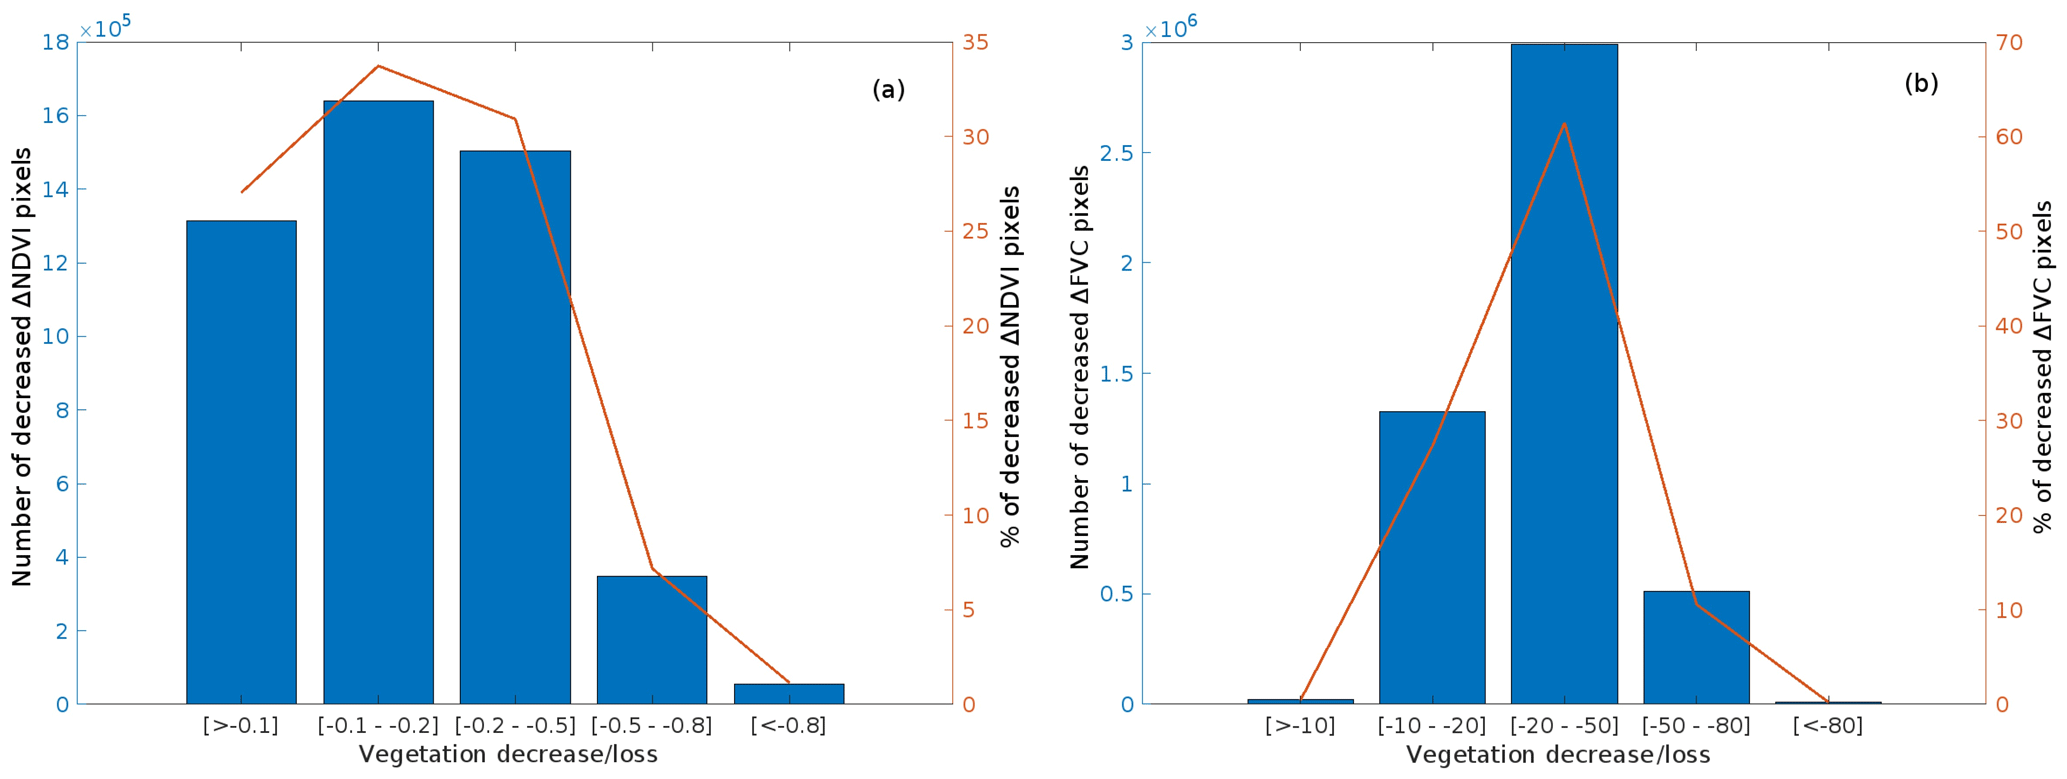
Figure 8Comparison of vegetation damaged represented based on the number and percentage of decreased pixels of (a) ΔNDVI and (b) ΔFVC.
Figure 8 compares vegetation damage based on the number and percentage of the decreased pixels for ΔNDVI and ΔFVC. It exhibits decreased pixels in different categories of vegetation damage, ranging from low damage to extensive damage. The pixels showing the most significant vegetation damage (i.e., ΔNDVI of −0.2 to −0.5 and ΔFVC of −20 % to −50 %) account for about 30.9 % and 61.5 % of the total pixels, respectively. On the other hand, the pixels showing extensive vegetation damage (i.e., ΔNDVI < −0.5 and ΔFVC < −50 %) account for only 8.31 % and 10.76 % of the total pixels. It was observed that the dominant vegetation in the region is wetland vegetation, which is mainly due to the prevalence of wetlands or mudflats in the area. Therefore, the significant vegetation damage implies that wetland vegetation was most severely impacted during typhoons.
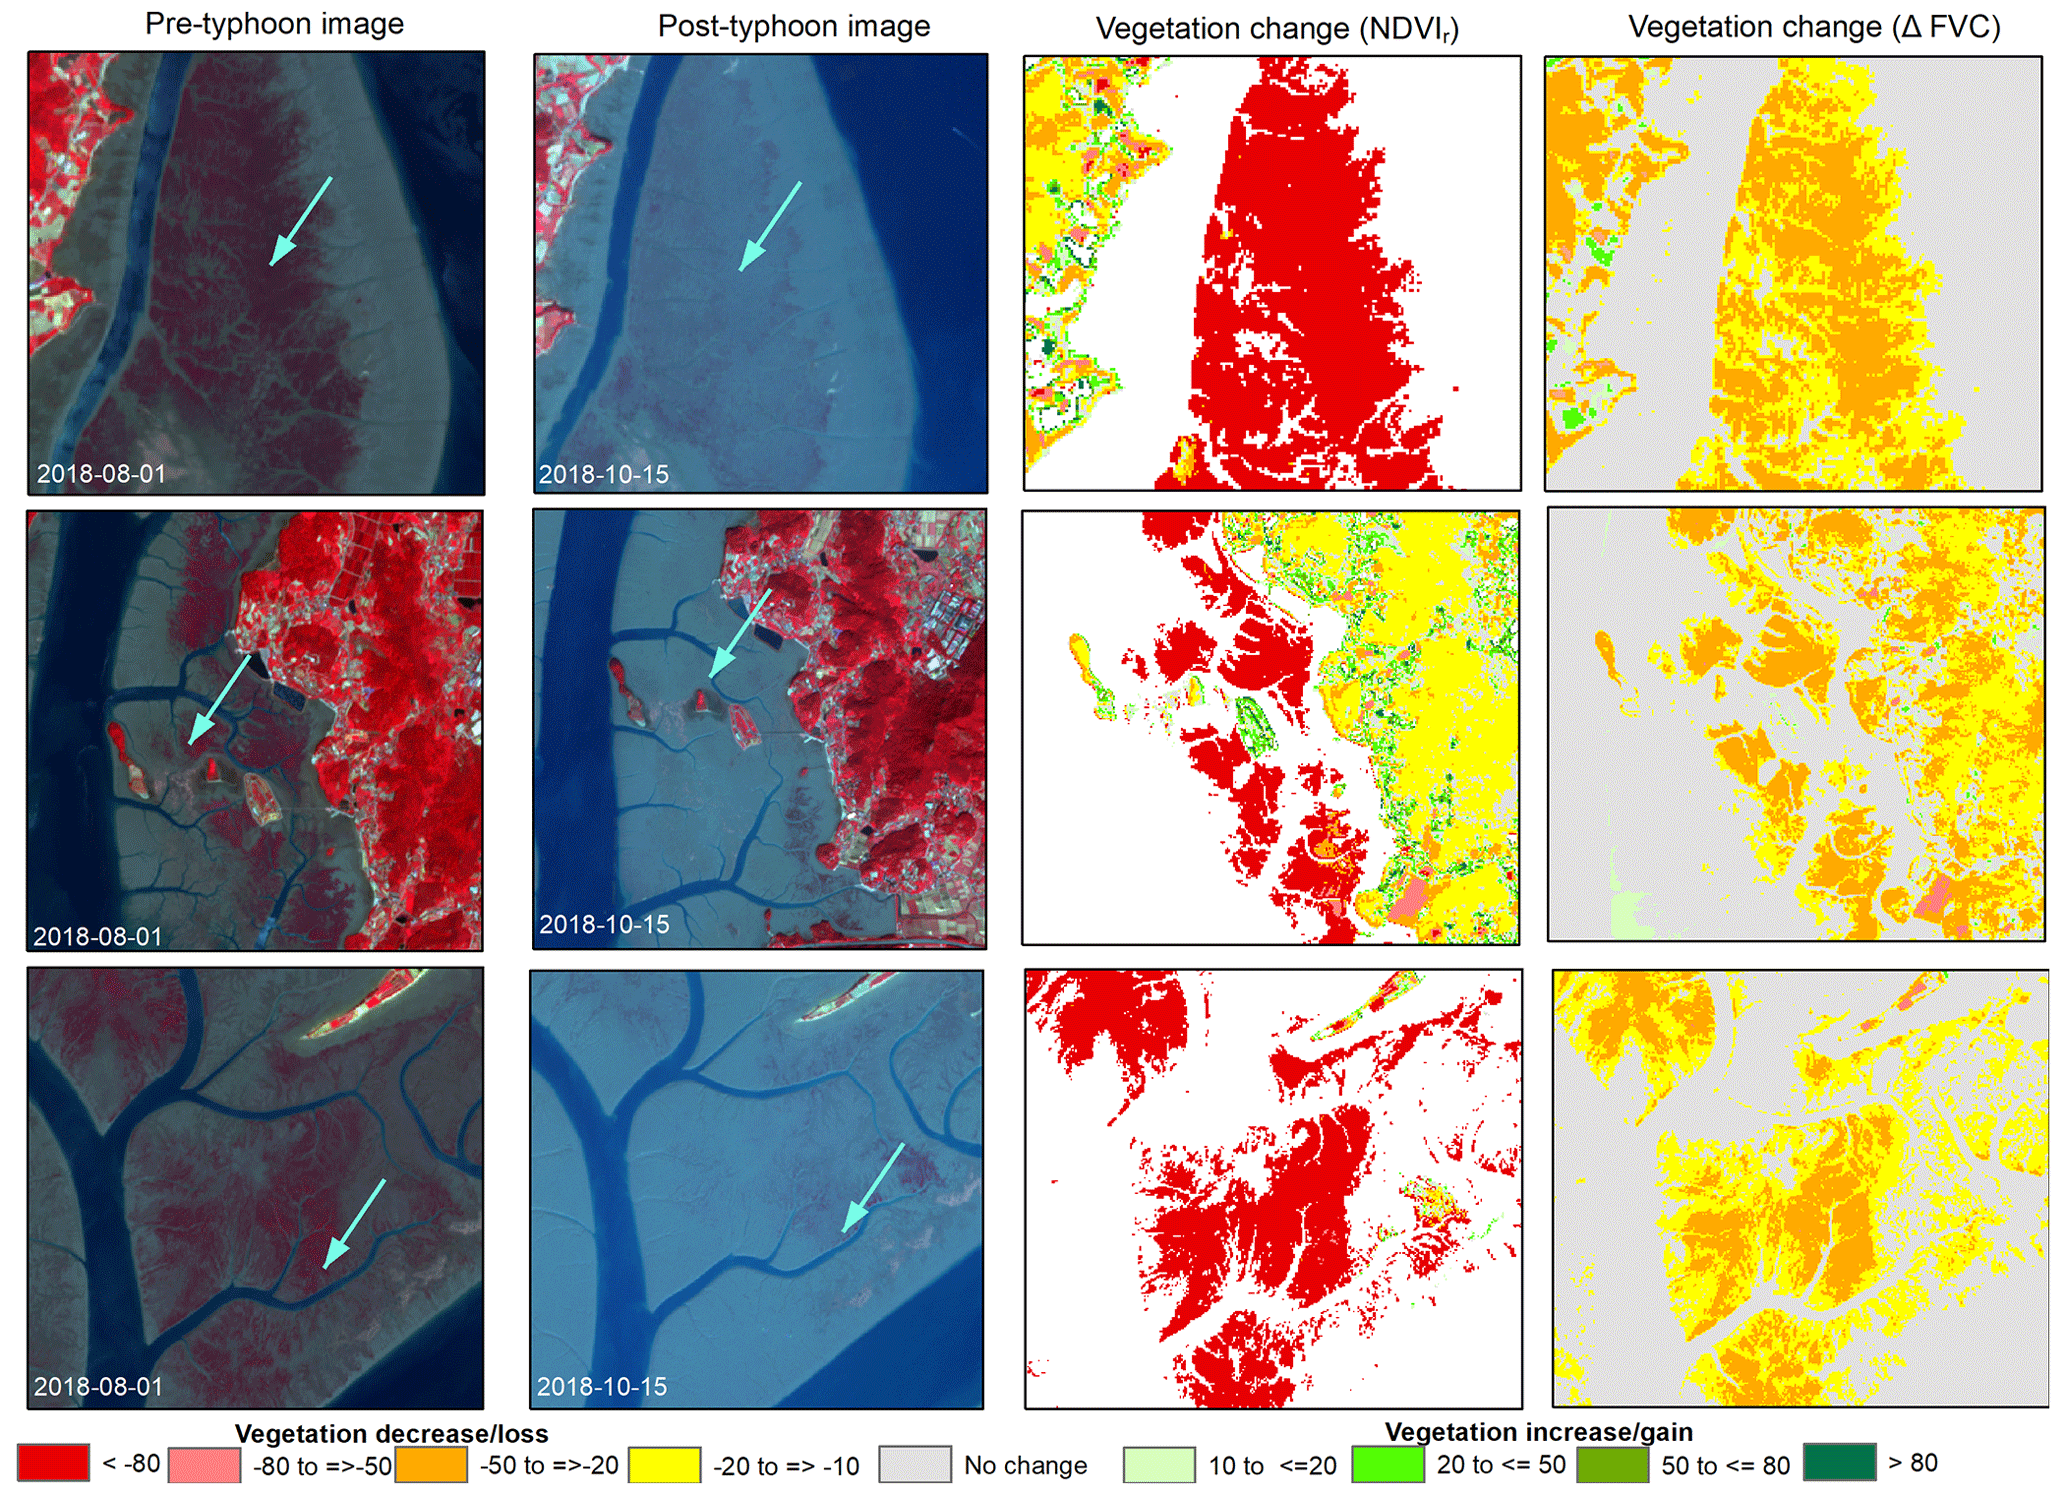
Figure 9Sentinel-2 MSI standard false-color composite images before and after Typhoon Soulik exhibit vegetation damage and the corresponding NDVIr and ΔFVC (pre- and post-typhoon Sentinel-2 MSI images were downloaded from https://scihub.copernicus.eu/dhus/).
The pre- and post-typhoon Sentinel-2 false-color images and the corresponding relative change in NDVIr and ΔFVC values are presented in Fig. 9. The standard false-color composite (FCC) imagery (left panel of Fig. 9) for pre- and post-typhoon shows that NDVIr is more effective in detecting areas of damaged vegetation compared to ΔFVC (right panel, Fig. 9). It was observed that the typhoon-induced damaged vegetation area (i.e., pixels with NDVIr and ΔFVC of < −50 %) detected by NDVIr (106.5 km2) was greater than that detected by ΔFVC (51.3 km2). The dissimilarity in the ability of NDVIr and ΔFVC to detect the destruction of vegetation caused by the typhoon can be ascribed to the alteration in the color of the post-typhoon vegetation. This change can be detected more accurately by NDVI compared to FVC because the vegetation in the affected areas still existed, and there was not a significant reduction in vegetation coverage after the event (Wang and Xu, 2018). Thus, NDVI is highly sensitive to the health status of vegetation and a more appropriate approach for assessing the damage to vegetation induced by the typhoon, while FVC is more representative of vegetation coverage status (Wang and Xu, 2018; Jing et al., 2011). Consequently, the dramatic vegetation loss (< −80 %) that occurred in mostly wetland vegetation is detected mainly in NDVIr. In addition, moderate greenness loss has been identified in natural forests. Furthermore, the decrease in NDVIr values from higher classes to lower classes indicates that the typhoon has severely damaged the low-lying coastal regions and the wetland vegetation.
4.1.2 Influence of topography on vegetation damage caused by Typhoon Soulik
The affected area's topography can influence typhoons' impact on vegetation. The interaction between topography and typhoon-generated wind and rain can result in complex and varied patterns of damage across different landscapes (Abbas et al., 2020; Lu et al., 2020; Zhang et al., 2013). This can affect the severity and spatial patterns of vegetation damage. Therefore, the relationship between topography and damaged vegetation has also been established in the present study. For this purpose, high-resolution (5 m × 5 m) DEM data provided by the NGII are used to calculate the region's topographic slope and explore the relationship between topography and typhoon-induced vegetation damage.
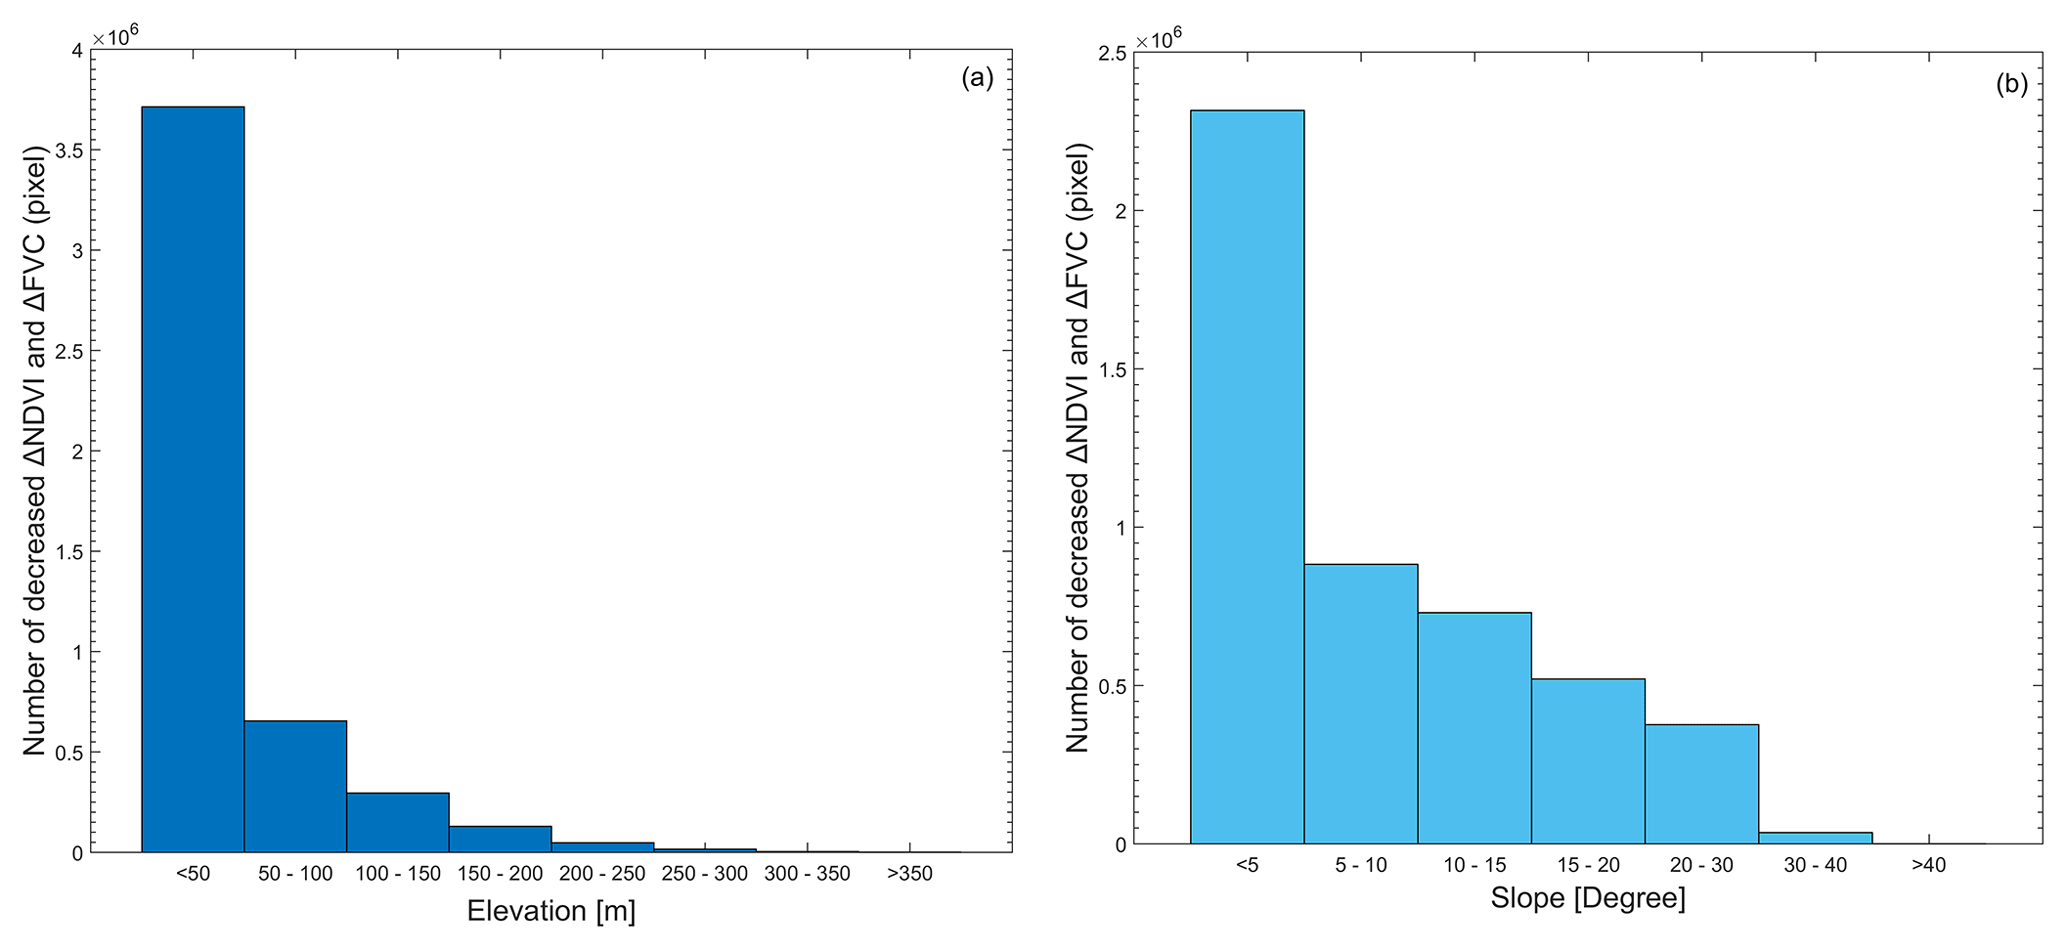
Figure 10The relationship between topography and vegetation damaged due to Typhoon Soulik: (a) amount of damaged vegetation at different elevation ranges and (b) amount of damaged vegetation at different slope ranges.
The Mokpo coastal region showed an elevation range between 0 and 403 m, as shown in Fig. 1b. It was observed that the number of trees damaged by Typhoon Soulik decreased as the elevation increased, as illustrated in Fig. 10a. The highest number of damaged trees was observed in areas with an elevation of 50 m or less. This is likely due to the fact that these areas are predominantly covered by wetlands, which can be more vulnerable to strong winds associated with Typhoon Soulik. In general, low-lying areas may not have the same natural windbreaks and barriers as higher elevations, which can exacerbate the impact of the wind. In addition, lowly elevated vegetation may have shallower root systems due to the less stable soil conditions, making them more vulnerable to uprooting during heavy rainfall or strong winds (Zhang et al., 2013; Lugo et al., 1983). A significant difference in the number of decreased ΔNDVI and ΔFVC pixels was observed among different elevation ranges, and a correlation analysis between the number of damaged pixels and elevations showed a negative correlation (i.e., damaged pixels decreased with increasing elevation). The majority of damaged pixels (76.37 %) were observed at elevations between 0 and 50 m, with a decrease to 13.5 % between 51 and 100 m. The vegetation exhibited a sharp decline at higher elevations, as shown in Fig. 10a, with the proportion of pixels displaying negative ΔNDVI and ΔFVC, decreasing to 6.1 % between 100 and 150 m and decreasing to 0.02 % between 350 and 403 m.
On the other hand, Fig. 10b illustrates the extent of damaged vegetation across different slope ranges. It has been noted that there is a negative correlation between the slope and the percentage of damaged vegetation pixels, indicating that the amount of vegetation damage decreases with a higher slope. For instance, when the slope was between 0–5∘, approximately 47.63 % of vegetation pixels were damaged. As the slope increased, the percentage of damaged vegetation pixels decreased accordingly, with values of 18.15 %, 15.01 %, 10.71 %, 7.74 %, 0.73 %, and 0.009 % observed for slope ranges of 5–10, 10–15, 15–20, 20–30, 30–40, and greater than 40∘, respectively.
4.2 Coastal morphodynamics over the typhoon period
To understand the coastal morphodynamics over the typhoon period (i.e., short-term), we classified the entire coastal region into four major coastal-landform classes: land, wetland vegetation, wetland, and water (Fig. 11a–b). The accuracy and κ coefficient of the classified maps exhibited a reasonable degree of consistency with the reference data, as illustrated in Table 5. The overall accuracy of the pre- and post-typhoon coastal-landform maps was 86.5 % and 84.3 %, and κ coefficients were 0.82 and 0.79, respectively. The results of the coastal-landform classification showed a reduction in wetland vegetation over the typhoon period. Table 6 illustrates that before the typhoon, the area of the wetland vegetation class was 4.21 % (77.63 km2) of the total area of all categories (1845.60 km2). However, after the typhoon hit, the wetland vegetation area reduced to 1.08 % (19.90 km2), recording a degradation of 57.73 km2 (−74.37 %).
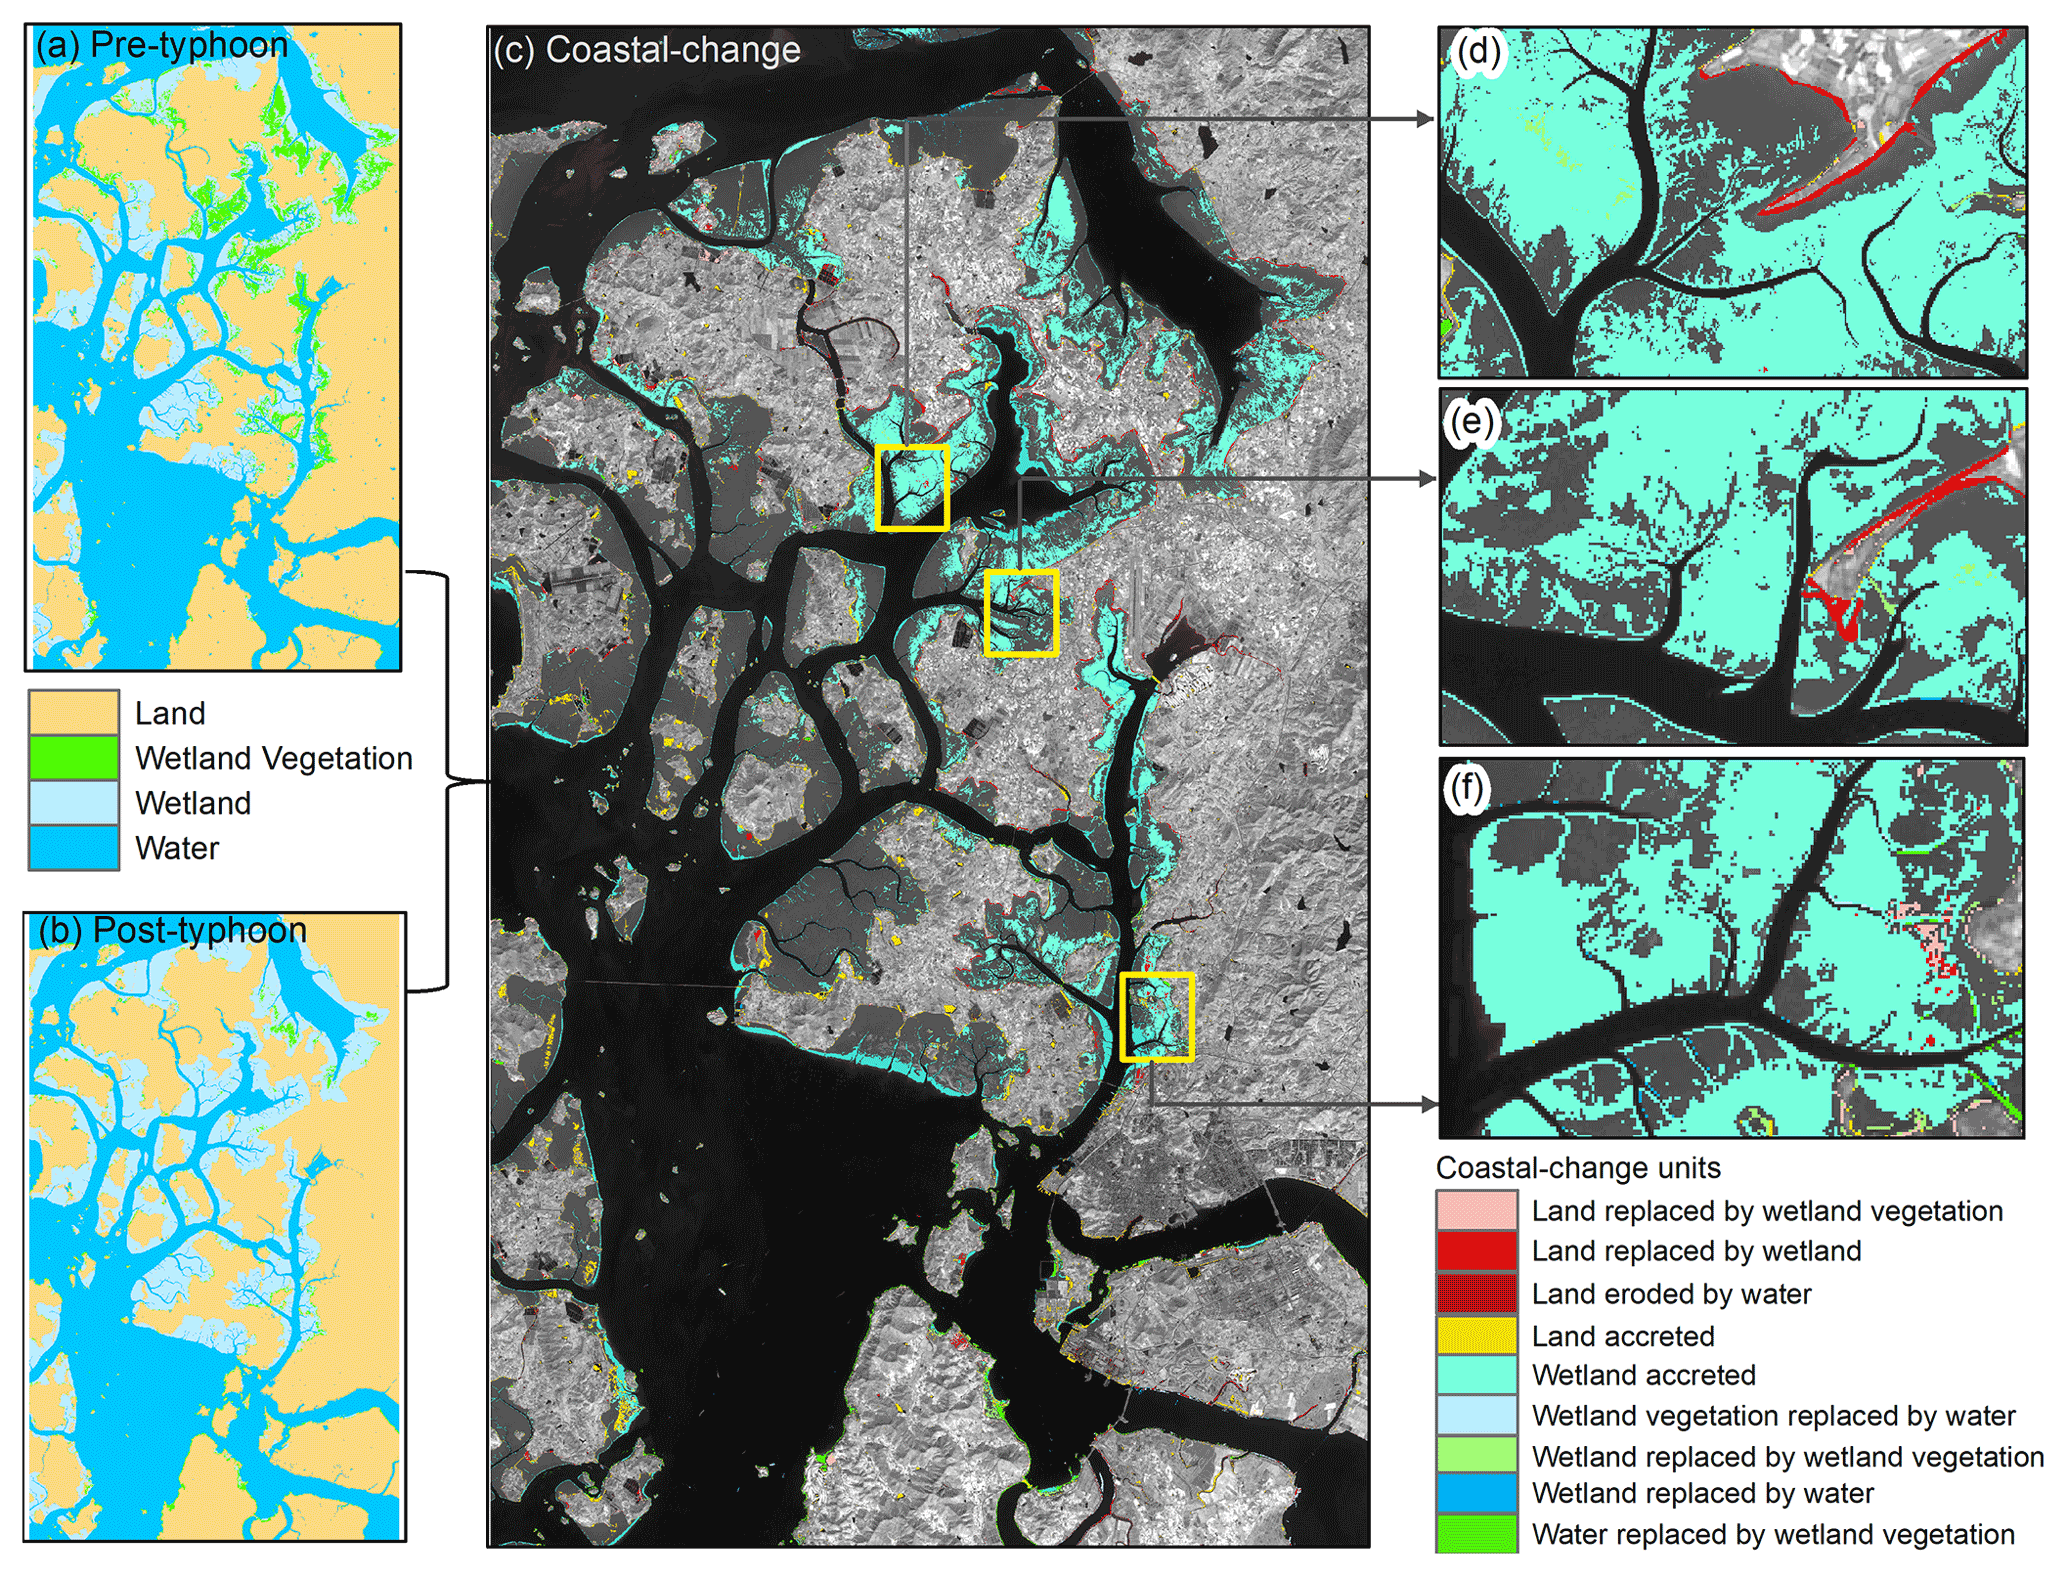
Figure 11Spatial distribution of coastal-change units along the Mokpo coast due to Typhoon Soulik: (a) pre-typhoon classified map, (b) post-typhoon classified map, and (c) coastal-landform transformation map. (d, e, f) Detailed coastal-landform transformation. The background grayscale image represents the NIR band of Sentinel-2 MSI data (15 October 2018), downloaded from https://scihub.copernicus.eu/dhus/.
Table 5Accuracy assessment of pre- and post-typhoon classified coastal units.
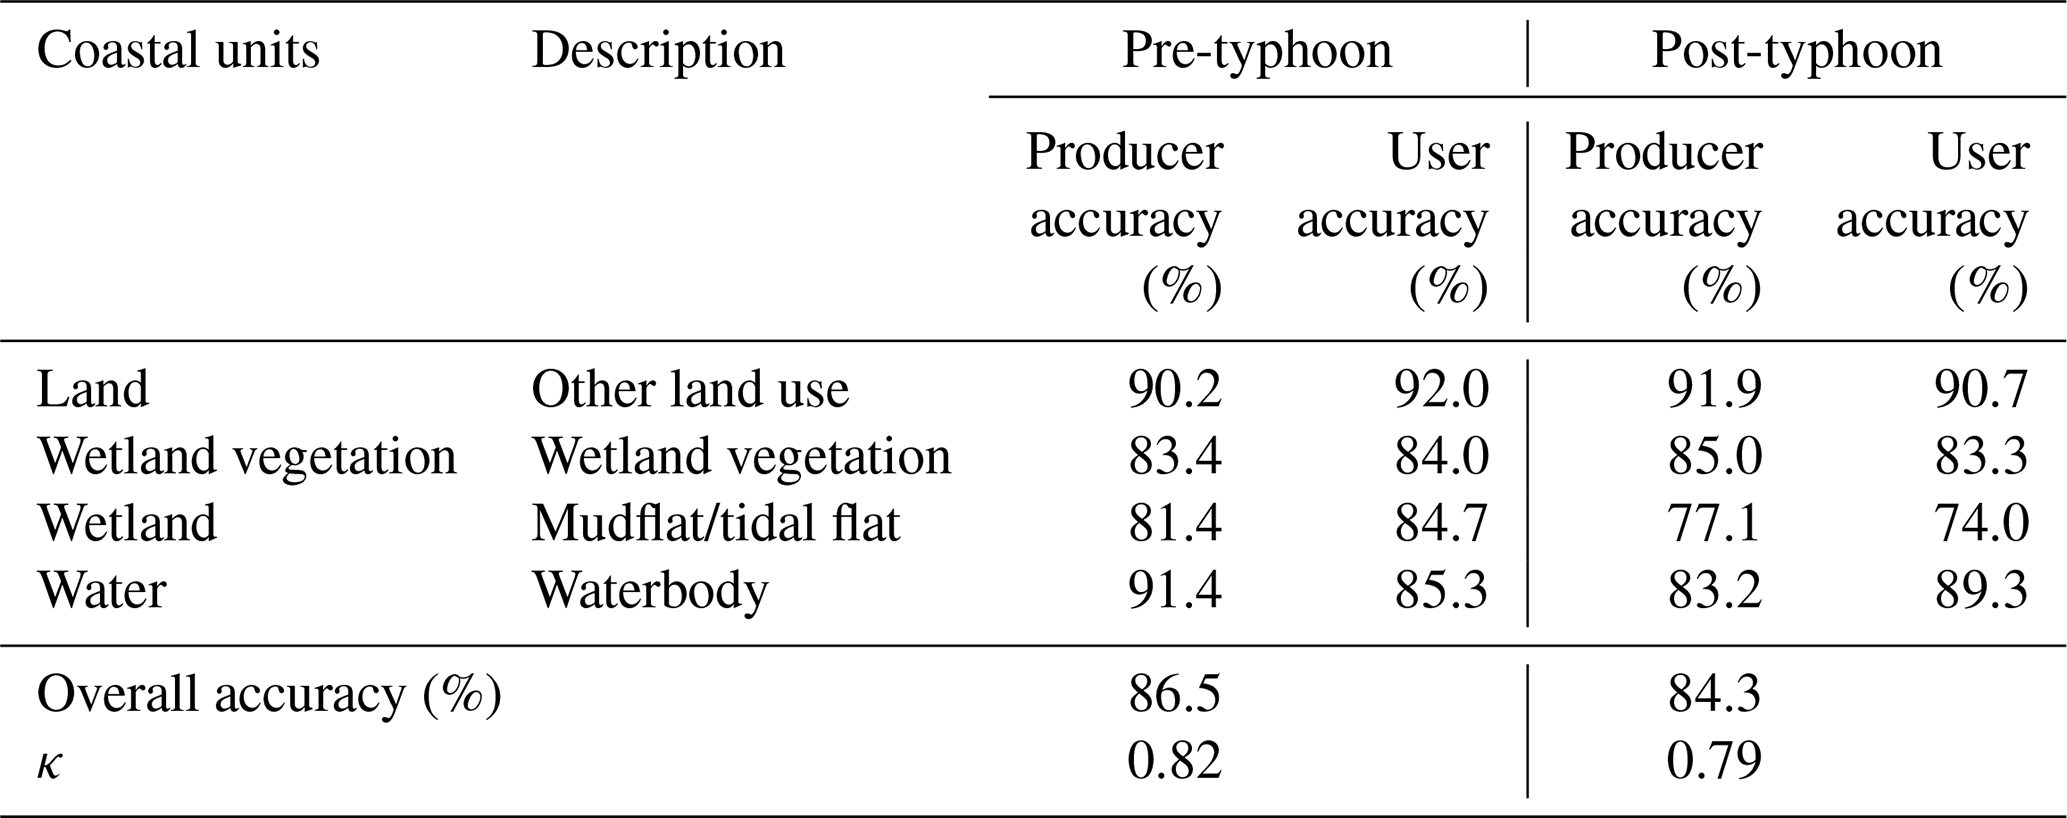
Table 6Area changes in the different coastal units during the pre- and post-typhoon periods in the Mokpo coast.
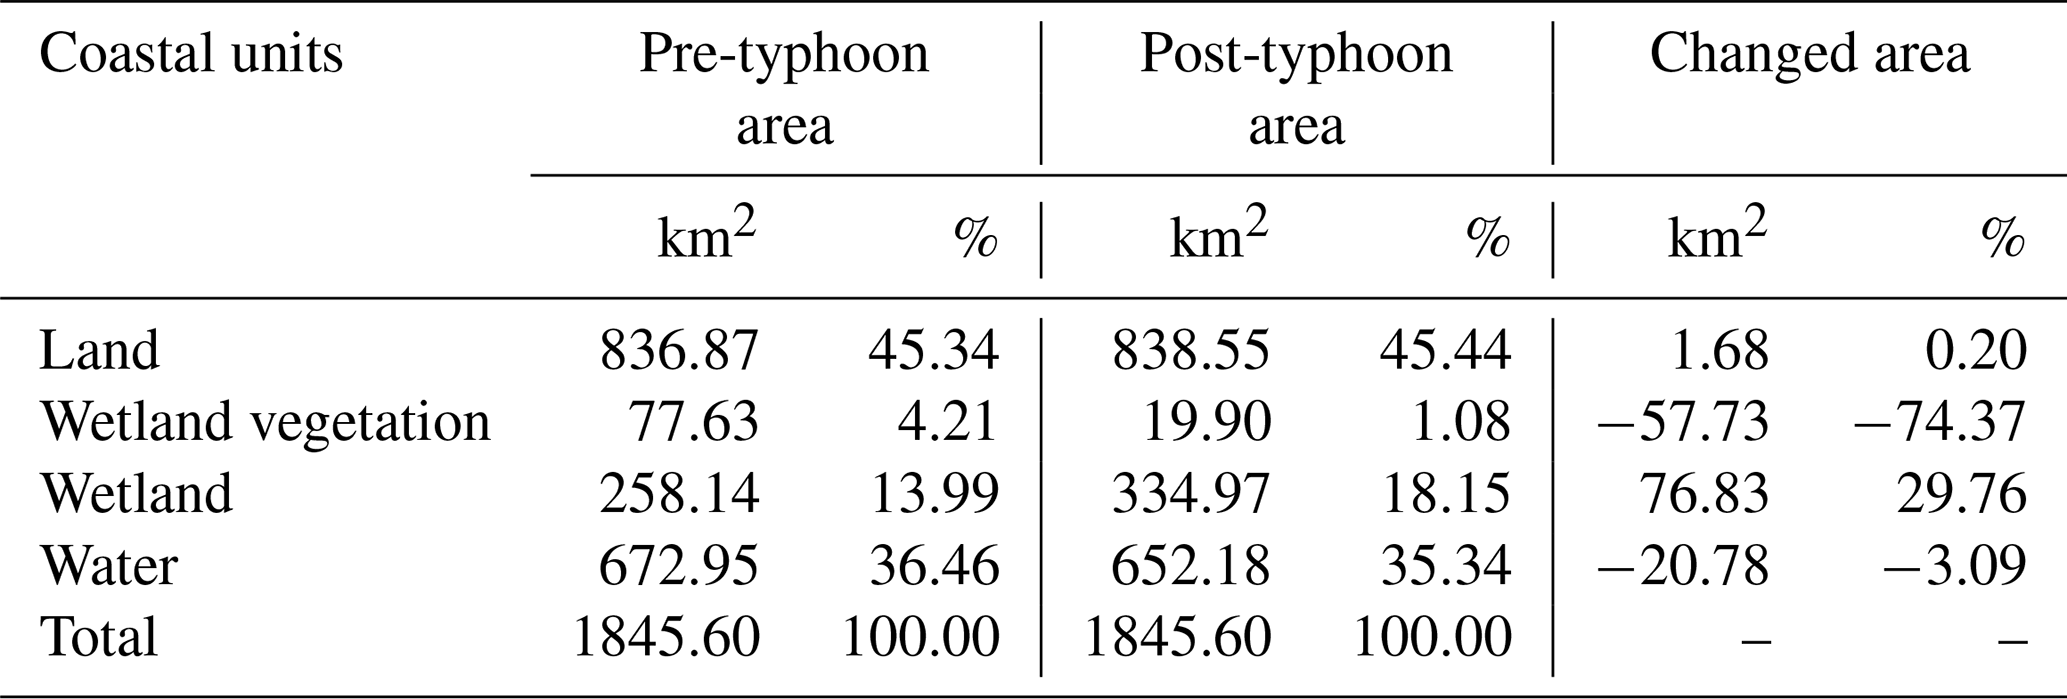
The most remarkable gain was the wetland class after the typhoon. This is shown by an increase in wetlands from 258.14 to 334.97 km2, i.e., an increase of 29.76 % (76.83 km2) during the short periods. Furthermore, the land class has increased by only 0.20 % over the typhoon period, i.e., from 45.34 % (before the typhoon) to 45.44 % (after the typhoon). In addition, it has been noticed that the waterbody decreased by 3.09 % (20.78 km2) after the typhoon. Thus, it can be inferred that most wetland vegetation and waterbodies have been converted into wetlands, which caused the coastal deterioration.
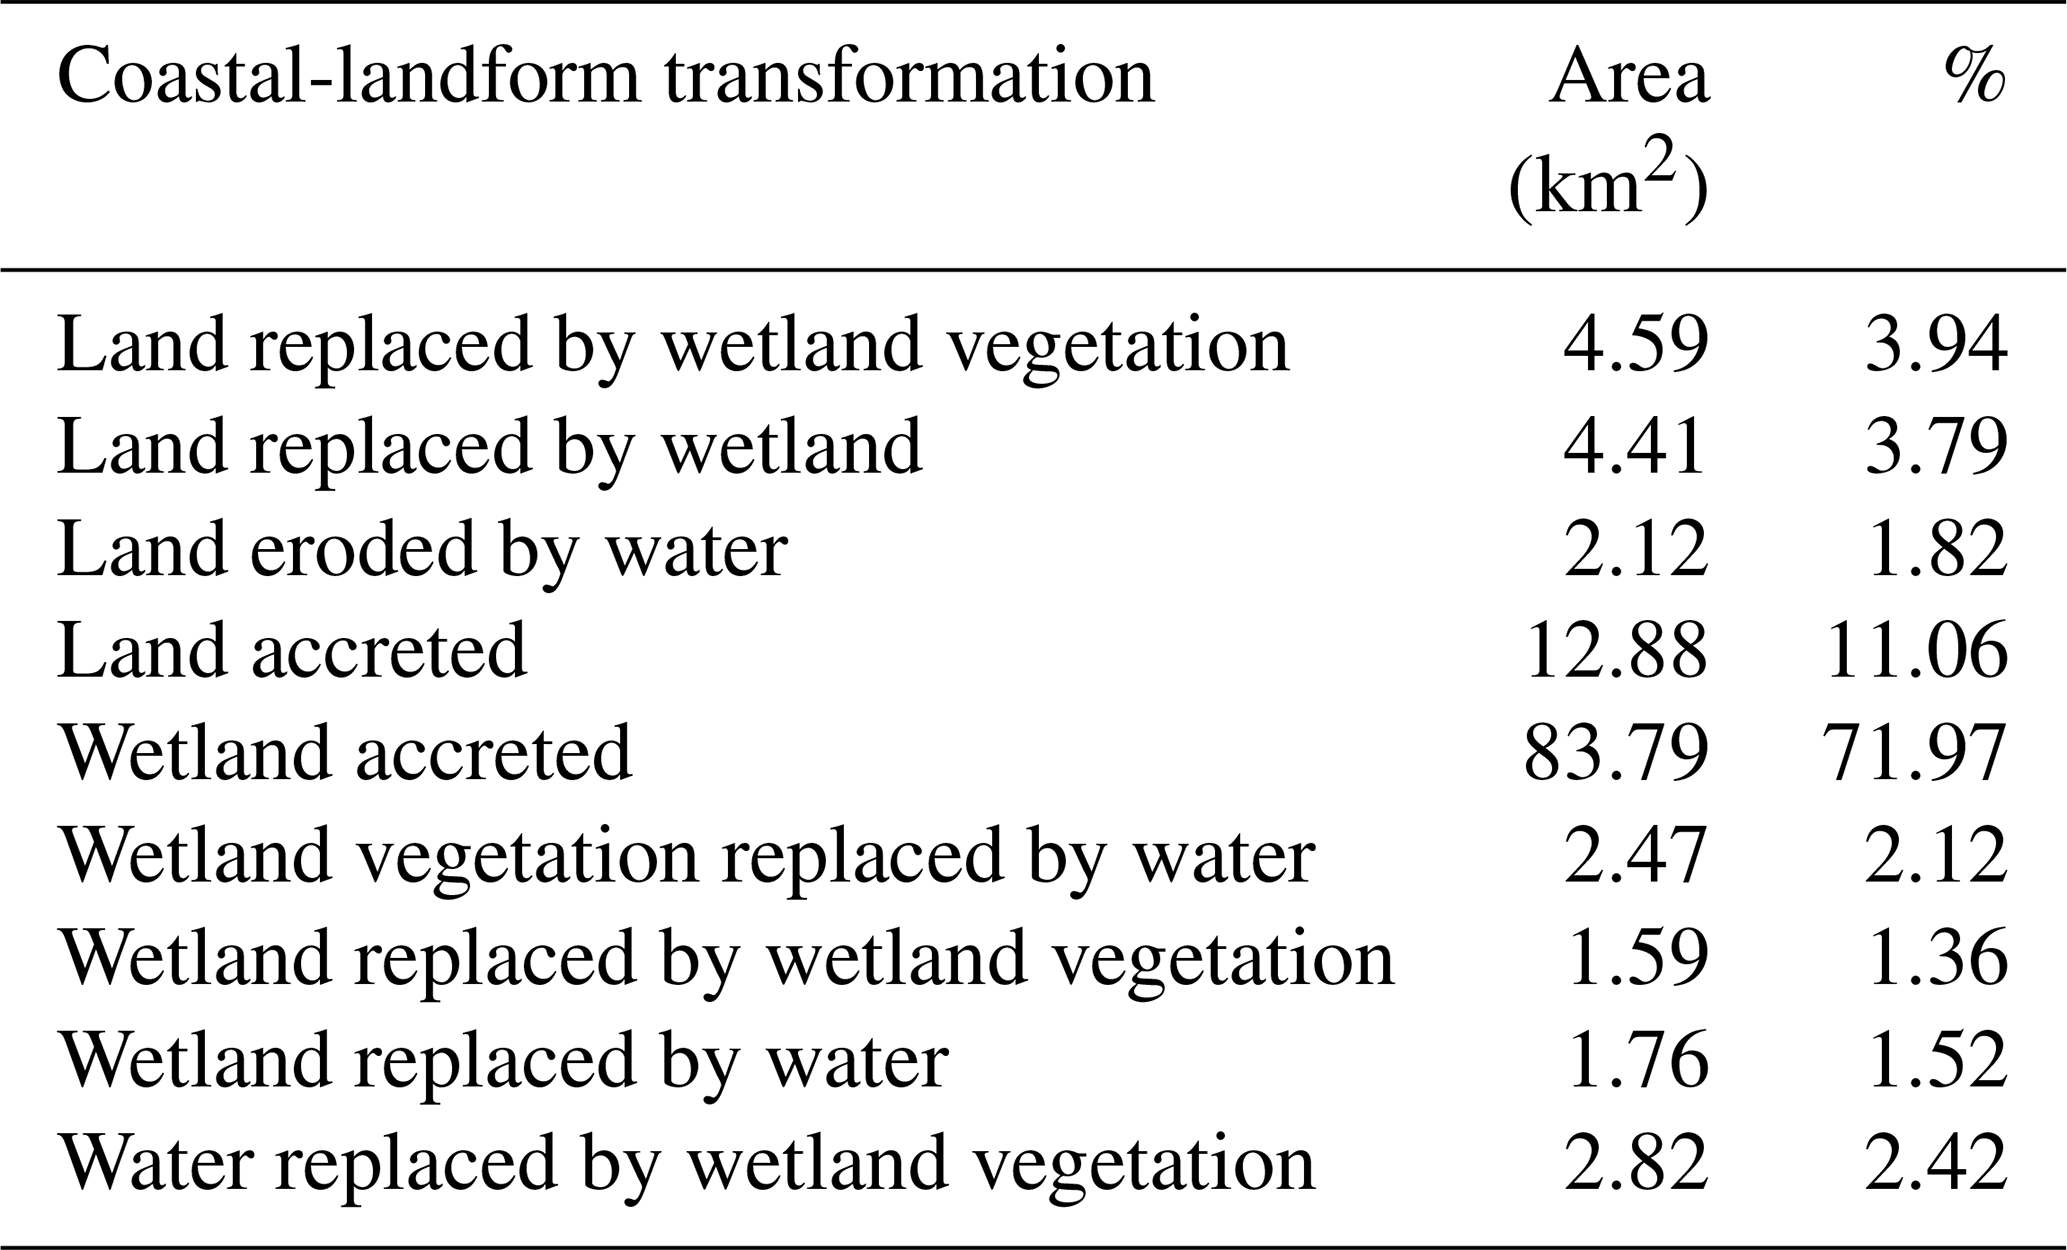
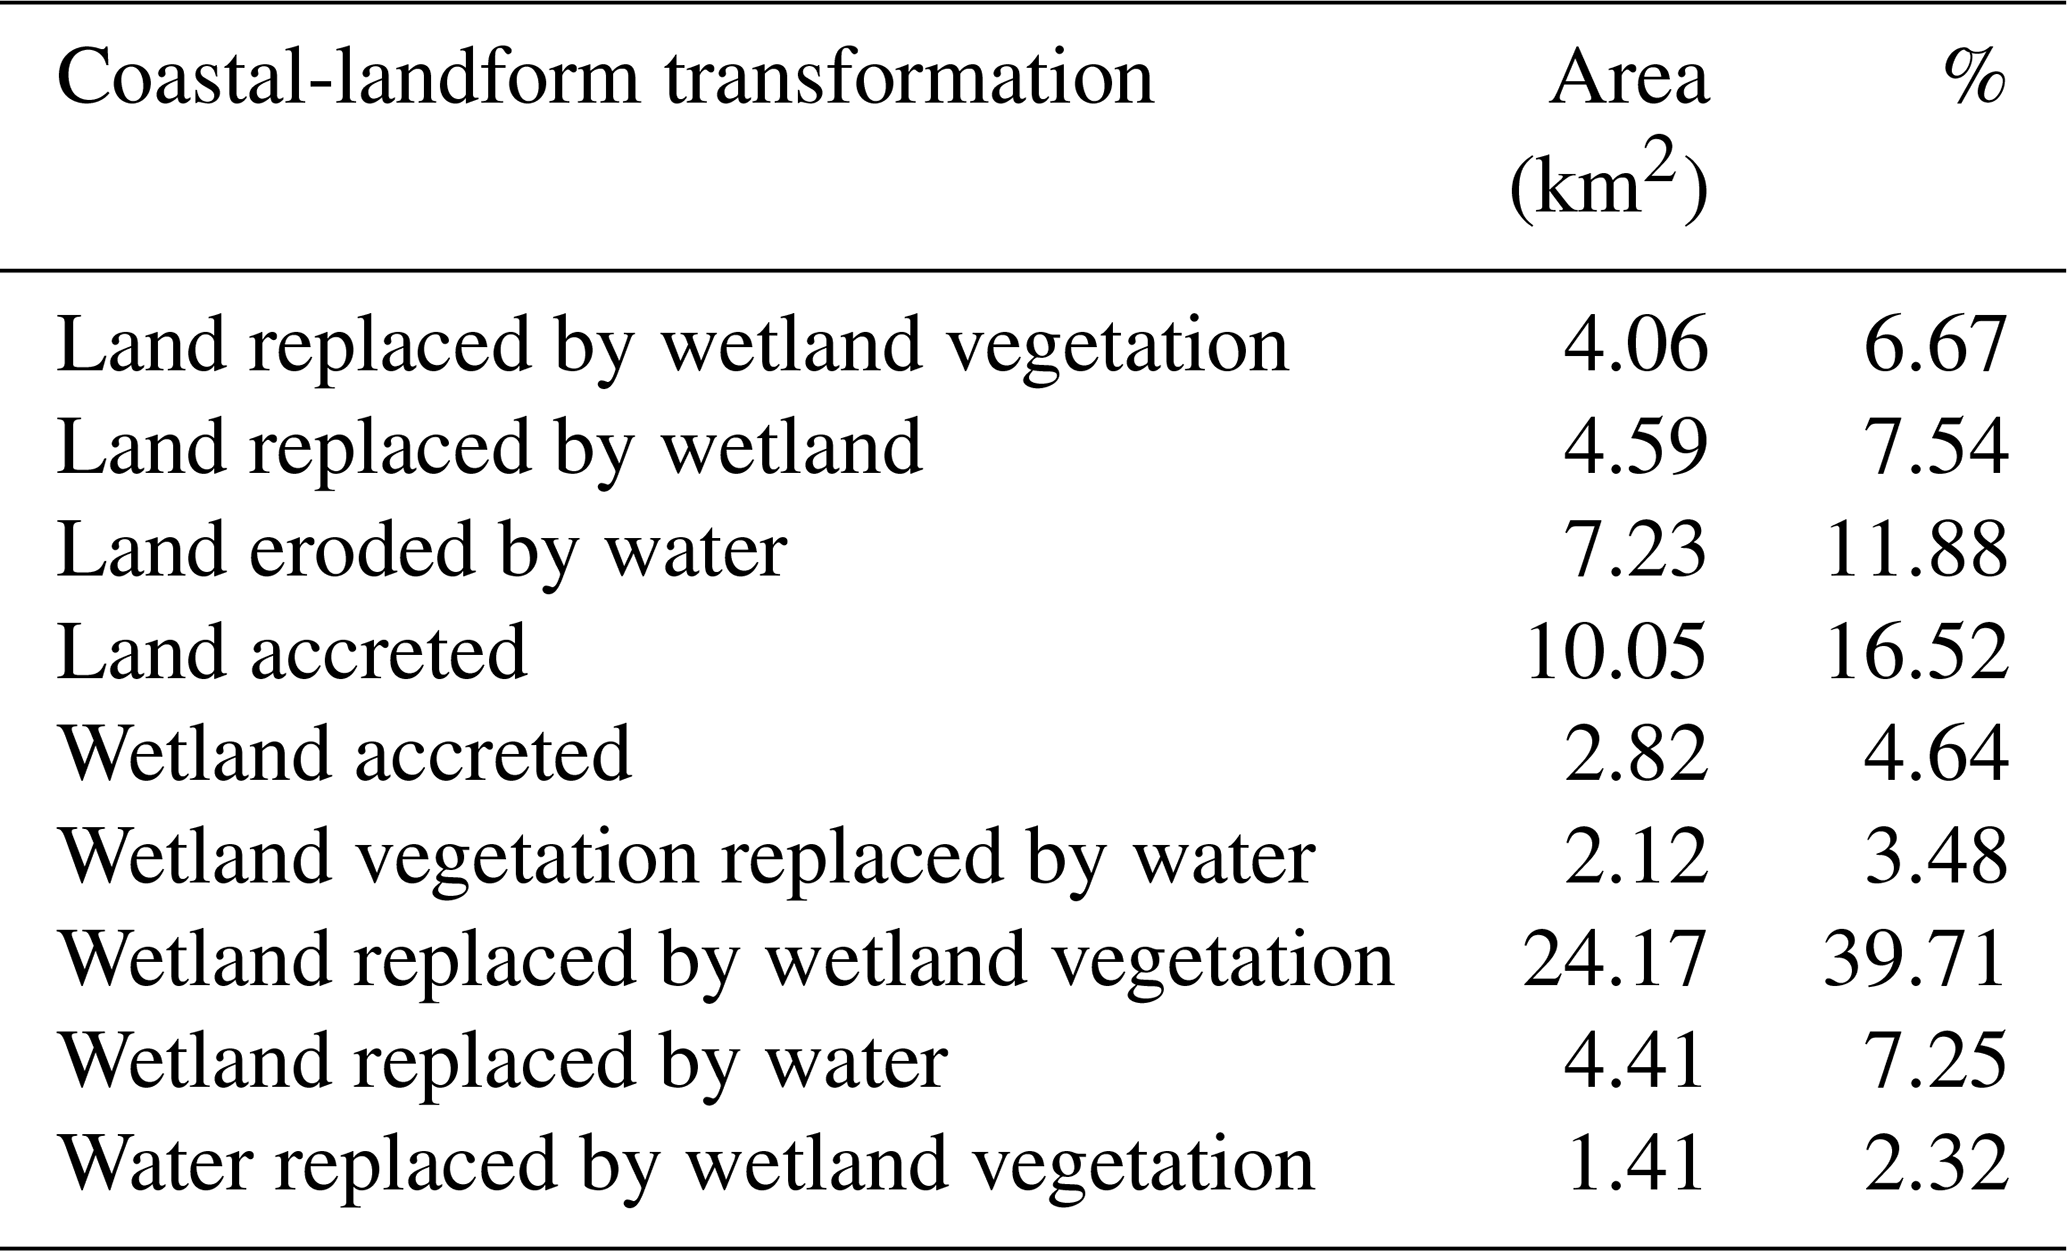
Thereafter, the coastal-landform transformation model was developed through mutual spatial replacements between coastal units. The land transformation model has identified the nine coastal-change units, as shown in Fig. 11c. The results show that the lowland coastal region drastically changed after the typhoon, where the majority of coastal classes have been transformed into wetlands or mudflats. Furthermore, approximately 5.61 % of the land area has been replaced by wetlands and water, whereas 71.97 % of the wetland area has accreted over the wetland vegetation and water due to the impact of Typhoon Soulik (Table 7).
Table 7The details of coastal-landform transformation classes identified in the short period.
4.3 Sediment resuspension during the pre- and post-typhoon periods
The spatial distribution of relative suspended-sediment concentration has been derived through NDSSI for both pre- and post-typhoon images (Fig. 12). Pre-typhoon SSC patterns have been observed a greater SSC inside the creeks of the inner-shelf region of the Mokpo coast as compared to the post-typhoon NDSSI image. However, it has been noted that the SSC has significantly increased along the entire coast in the post-typhoon period (Fig. 12b). Therefore, the spatial changes in the relative SSC have been determined during the August (pre-) and October (post-typhoon) periods, as depicted in Fig. 12c. In general, a flood always transports many suspended materials and concentrates those materials on the upper surface of the water. After the strong events, the flood-transported suspended material is deposited across the delta. A similar phenomenon was observed in the post-typhoon period due to extensive rainfall, which turned into a coastal flood.
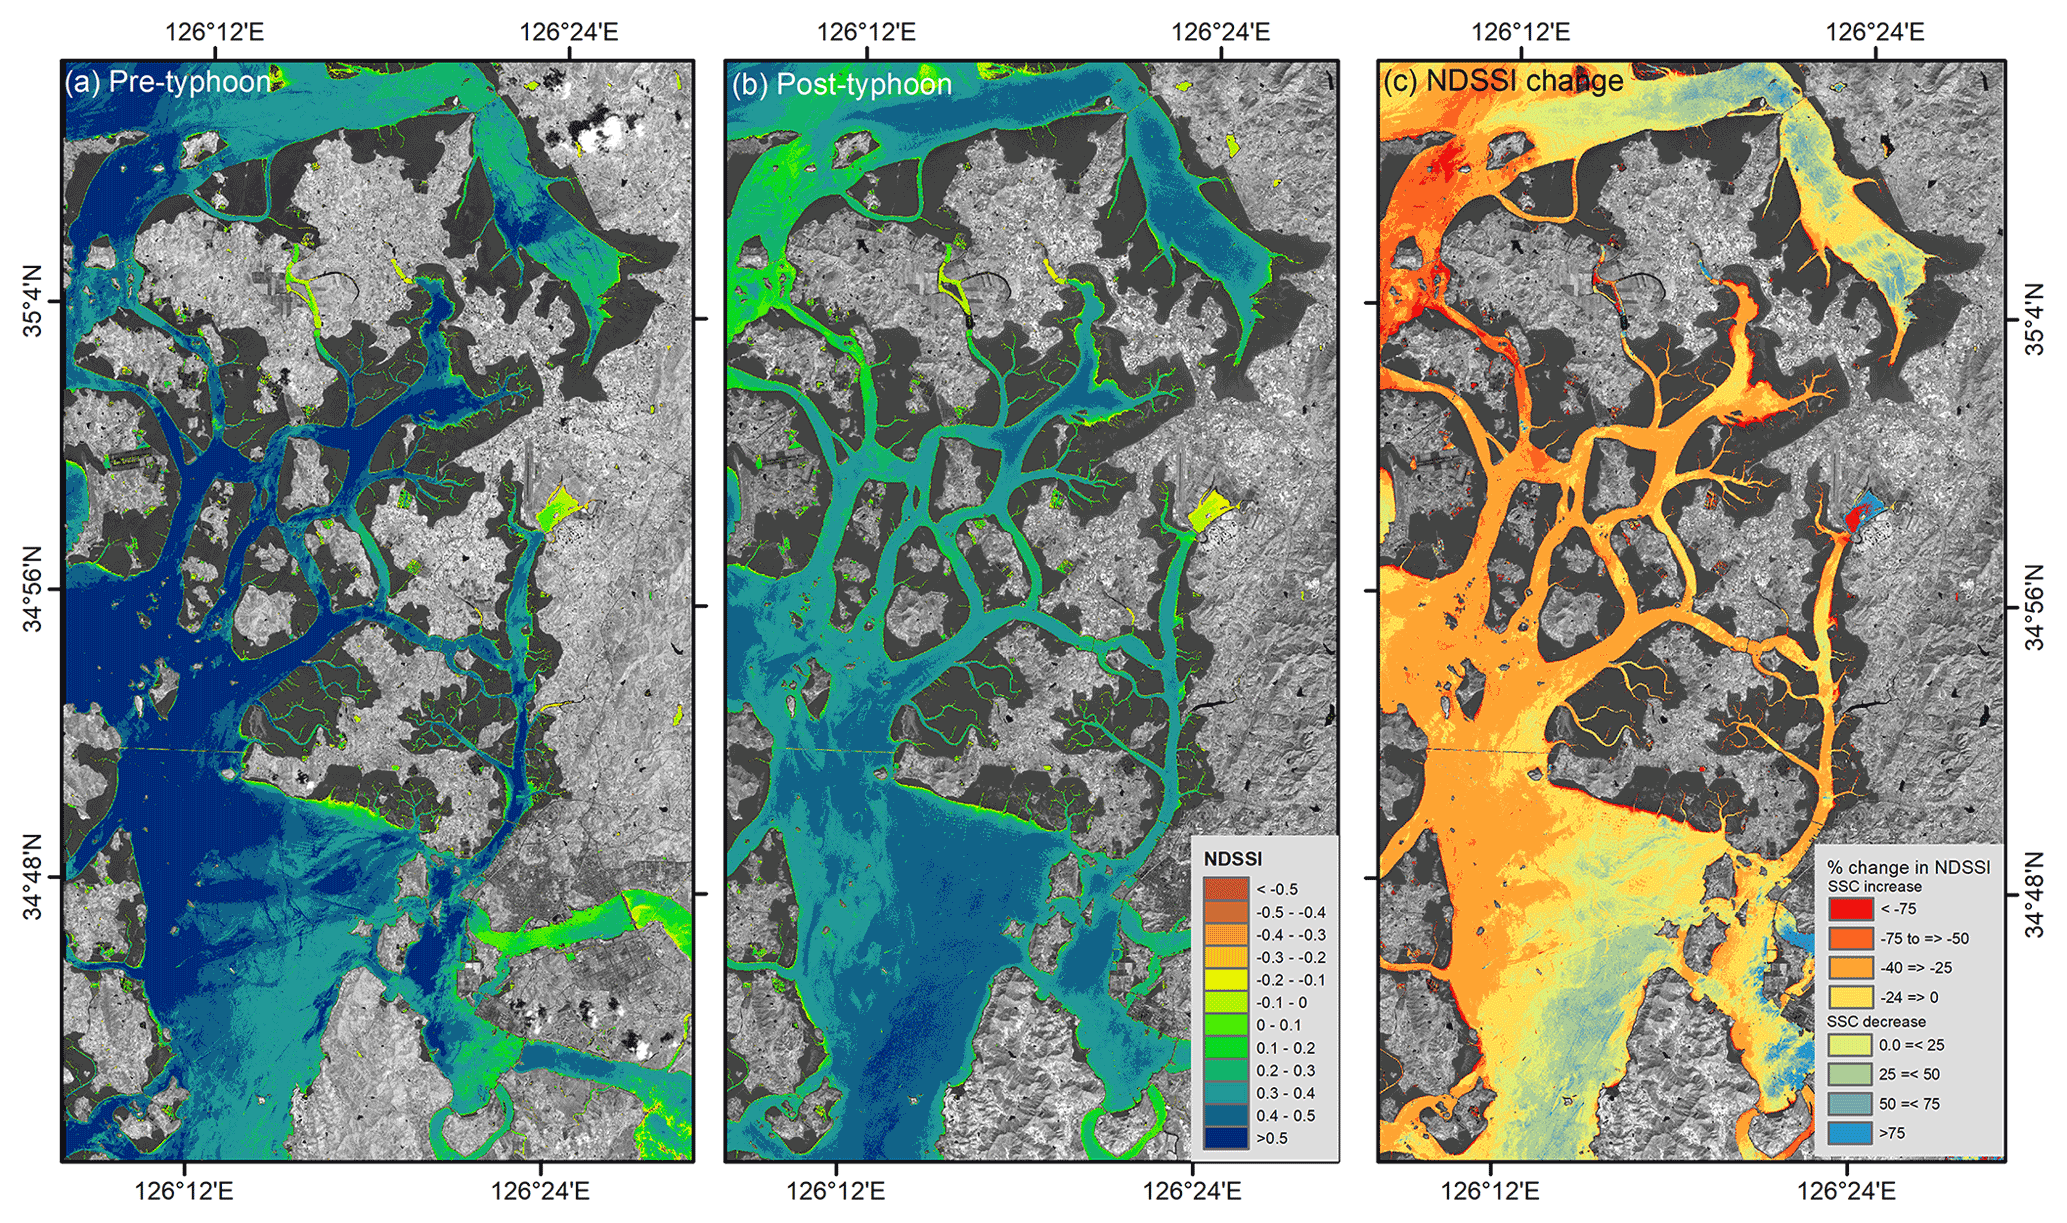
Figure 12Relative SSC for the (a) pre- and (b) post-typhoon periods. (c) The changes in the NDSSI. The background grayscale image represents the NIR band of Sentinel-2 MSI data, downloaded from https://scihub.copernicus.eu/dhus/.
On the other hand, it has been observed that the SSC gradually increased as the wind speed increased from the pre- to post-typhoon periods. The increasing SSC amplitudes indicate the rapid sediment erosion/resuspension over the storm passage. Furthermore, the amplitudes of SSC variations were more visible in shallower water than in deeper water. The effect of typhoons on the SSC variation along the Mokpo coast has been observed through the ΔNDSSI distribution (Fig. 12c). The negative ΔNDSSI values represent the increase in the SSC due to typhoon-induced strong wind and coastal flooding.
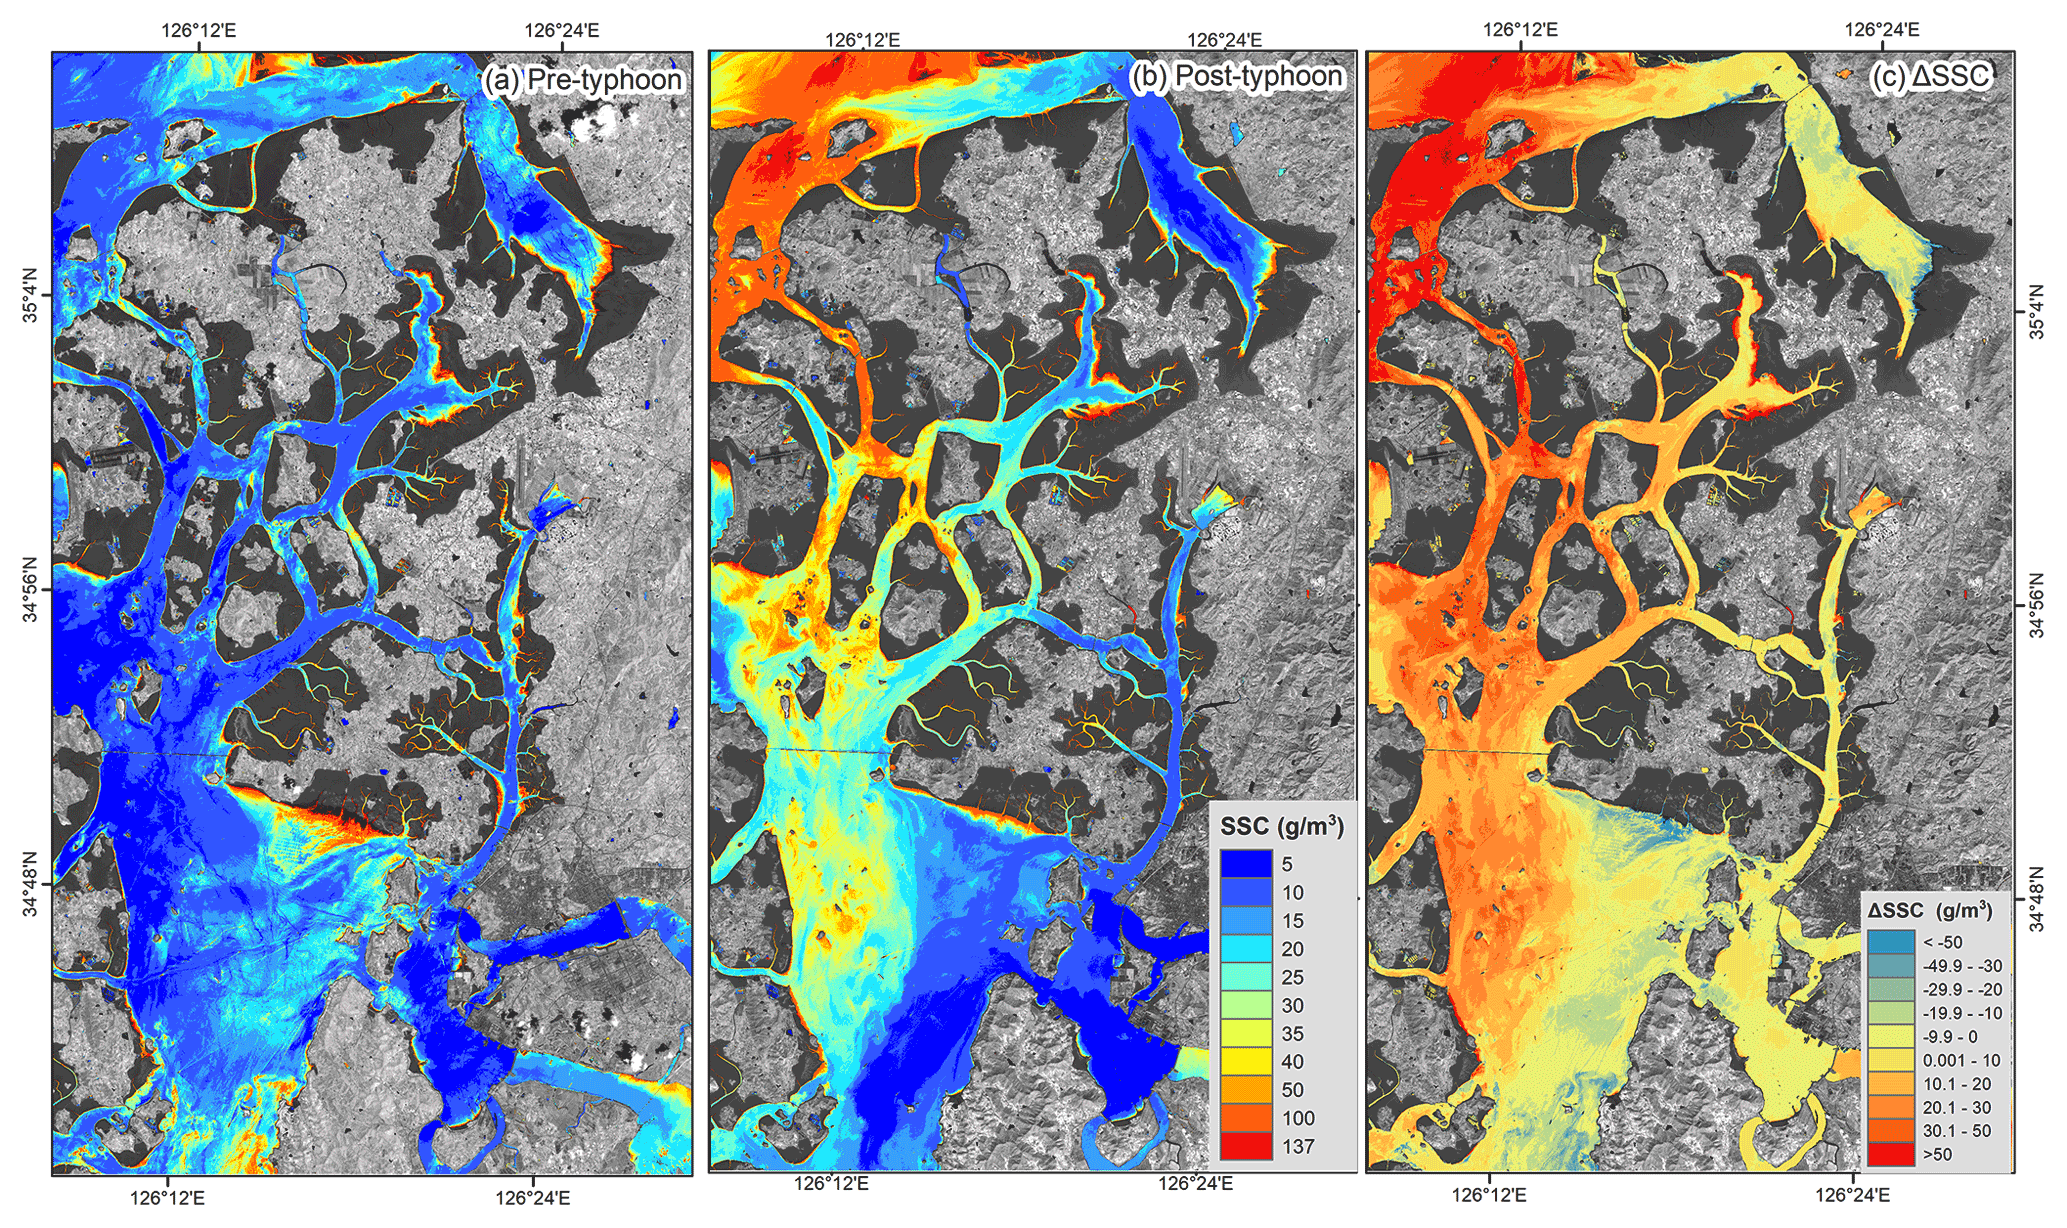
Figure 13The simulated SSC distribution for the surface water of the (a) pre- and (b) post-typhoon periods. (c) The spatial changes in the SSC from the pre- to post-typhoon periods. The background grayscale image represents the NIR band of Sentinel-2 MSI data, downloaded from https://scihub.copernicus.eu/dhus/.
Furthermore, a quantitative analysis of the SSC has been performed based on the algorithm developed by Choi et al. (2014). During the pre-typhoon period, the SSC in the nearshore waters was significantly higher than that of the offshore region (Fig. 13a). The post-typhoon image shows a sharp increase in the SSC distribution, indicating that Typhoon Soulik significantly impacted the SSC variation, with a maximum of > 50 g m−3 (Fig. 13c). In Fig. 13a and b, the spring–neap tidal influence broadly regulated the distribution and change in the SSC throughout the shallow coastal water. The resuspension of the SSC has been observed in the entire study region during the passage of Typhoon Soulik. The pre- and post-typhoon pattern of the relative SSC distribution (Fig. 12c) and the empirically derived SSC distribution (Fig. 13c) are similar.
The outcomes showed that the storm surge and strong waves have considerably aided the sediment resuspension. Thus, the storm waves played an essential role in increasing bottom stress and stirring the seabed sediment (Gong and Shen, 2009). The transport of sediment during the storm adds another mechanism to the long-term morphological evolution of the Mokpo coast. This research revealed the profound significance of typhoons on inner-shelf sedimentation along the coast.
4.4 Impact on coastal erosion and deposition
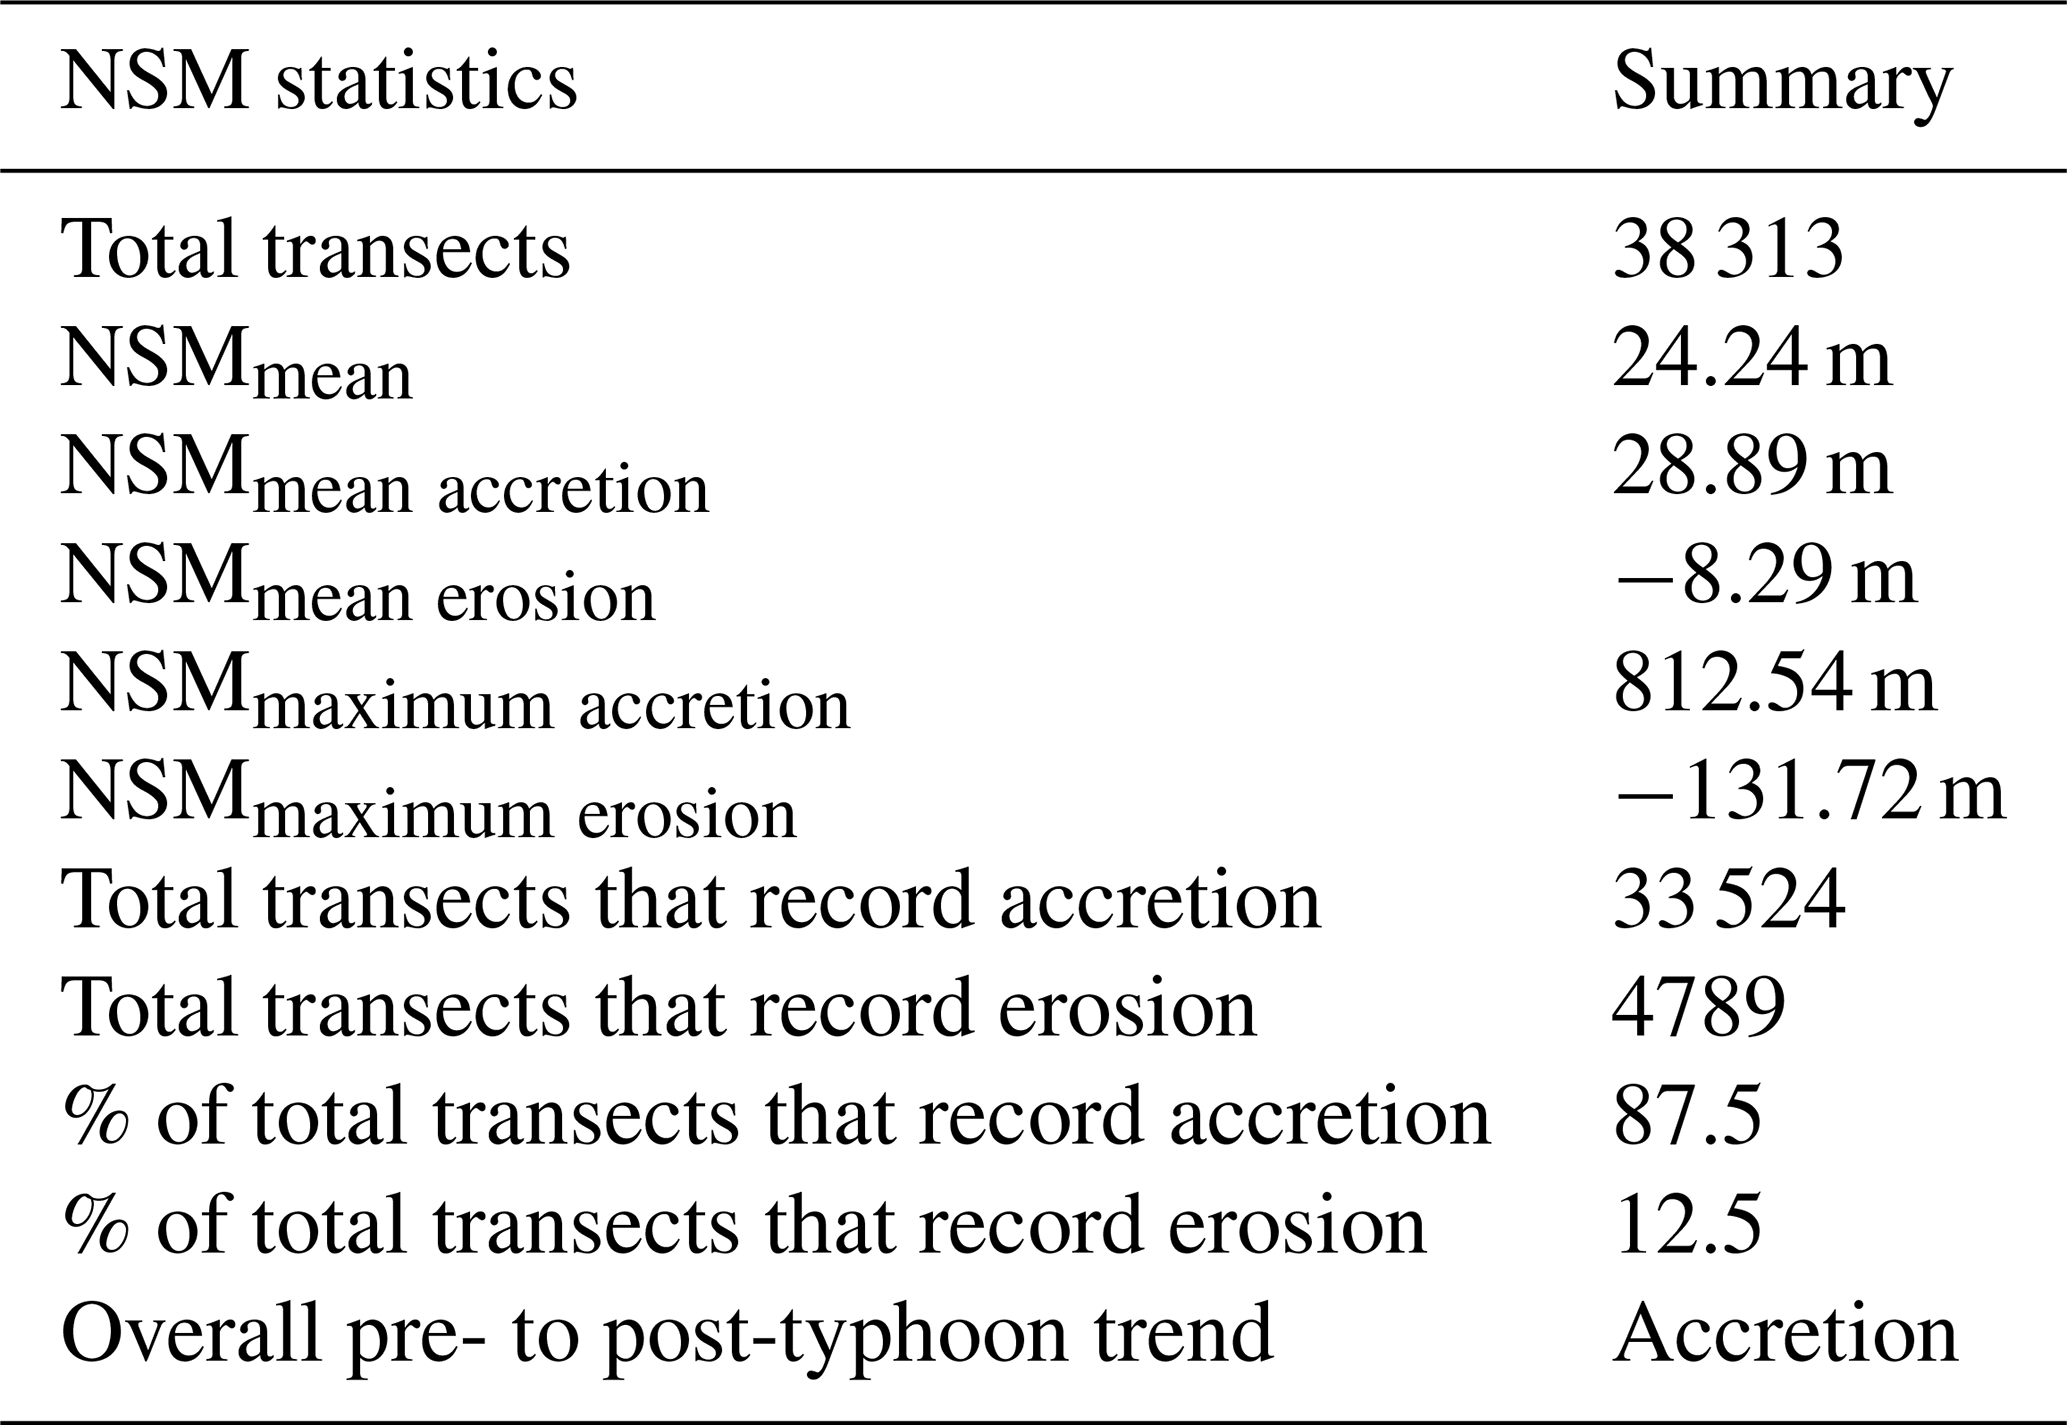
The impacts of the severe Typhoon Soulik at a speed of 62 m s−1 on the coastline of Mokpo have been determined using the NSM method, considering 38 313 transects (10 m transect intervals) along the shoreline. Figure 14 shows the shoreline alteration in the entire Mokpo coastal region from the pre- to post-typhoon periods (i.e., short-term), with an accretion of 87.5 % transects and erosion of 12.5 %. The mean deposition of 28.89 m and a mean erosion of −8.29 m were recorded (Table 8). The shoreline movement between 0–10 m was recorded in the northern part of the coastal region. It has been observed that most transects experienced significant accretion; however, erosion has been observed in a few transects along the southern coastline (Fig. 14). The southern coast experienced sporadic landward movement of the shoreline. In contrast, the rest of the study region experienced significant seaward shoreline movement (Fig. 14a–e).
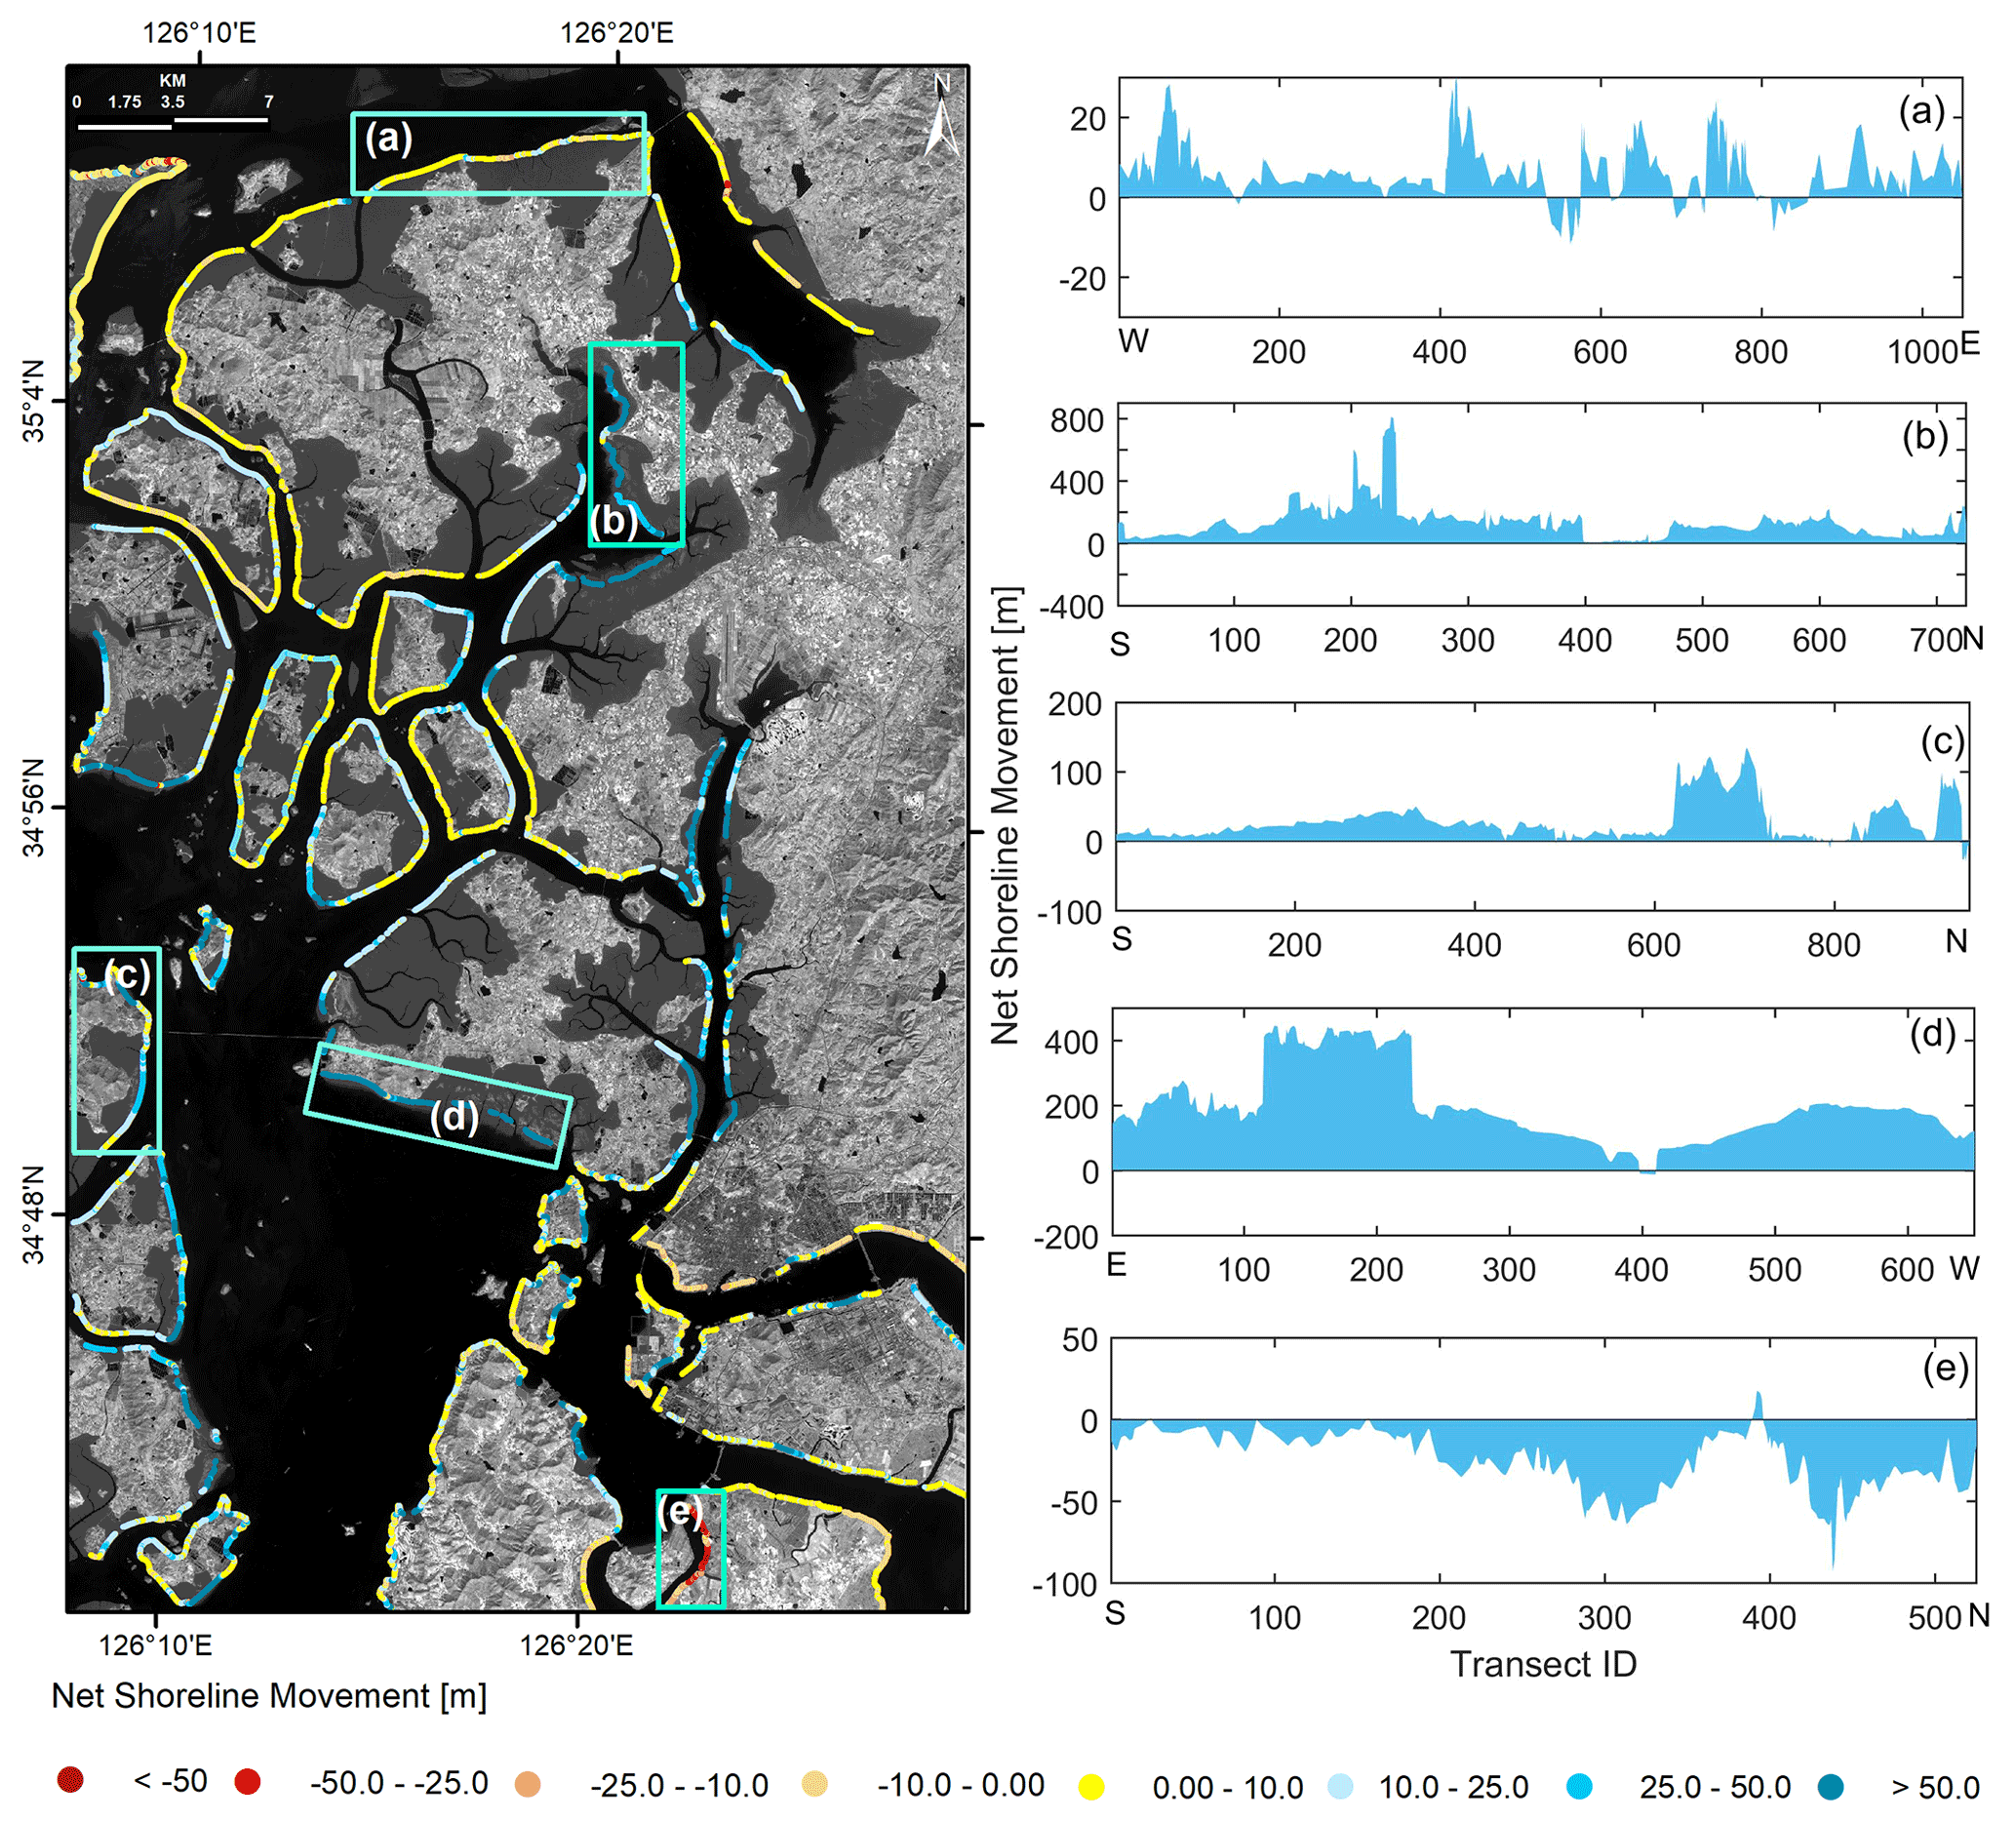
Figure 14Short-term land–water boundary changes (pre- to post-typhoon periods) based on the NSM method (left panel). (a–e) The net movement of the shoreline at different sites. The background grayscale image represents the NIR band of Sentinel-2 MSI data (15 October 2018), downloaded from https://scihub.copernicus.eu/dhus/.
Table 8Short-term (pre- to post-typhoon) shoreline change statistics based on the NSM model.
The wind-generated surface water currents that transported and dispersed erogenous material to deep seas areas from the pre- to post-typhoon periods. On the other hand, the coastal flooding induced by the typhoon increased the sediment from the land to the nearshore region (Figs. 12c and 13c). This allowed sediment to deposit on the wetland or beach areas. The coastal-landform transformation map also revealed changes in the shoreline shift area as the wetland-accreted class.
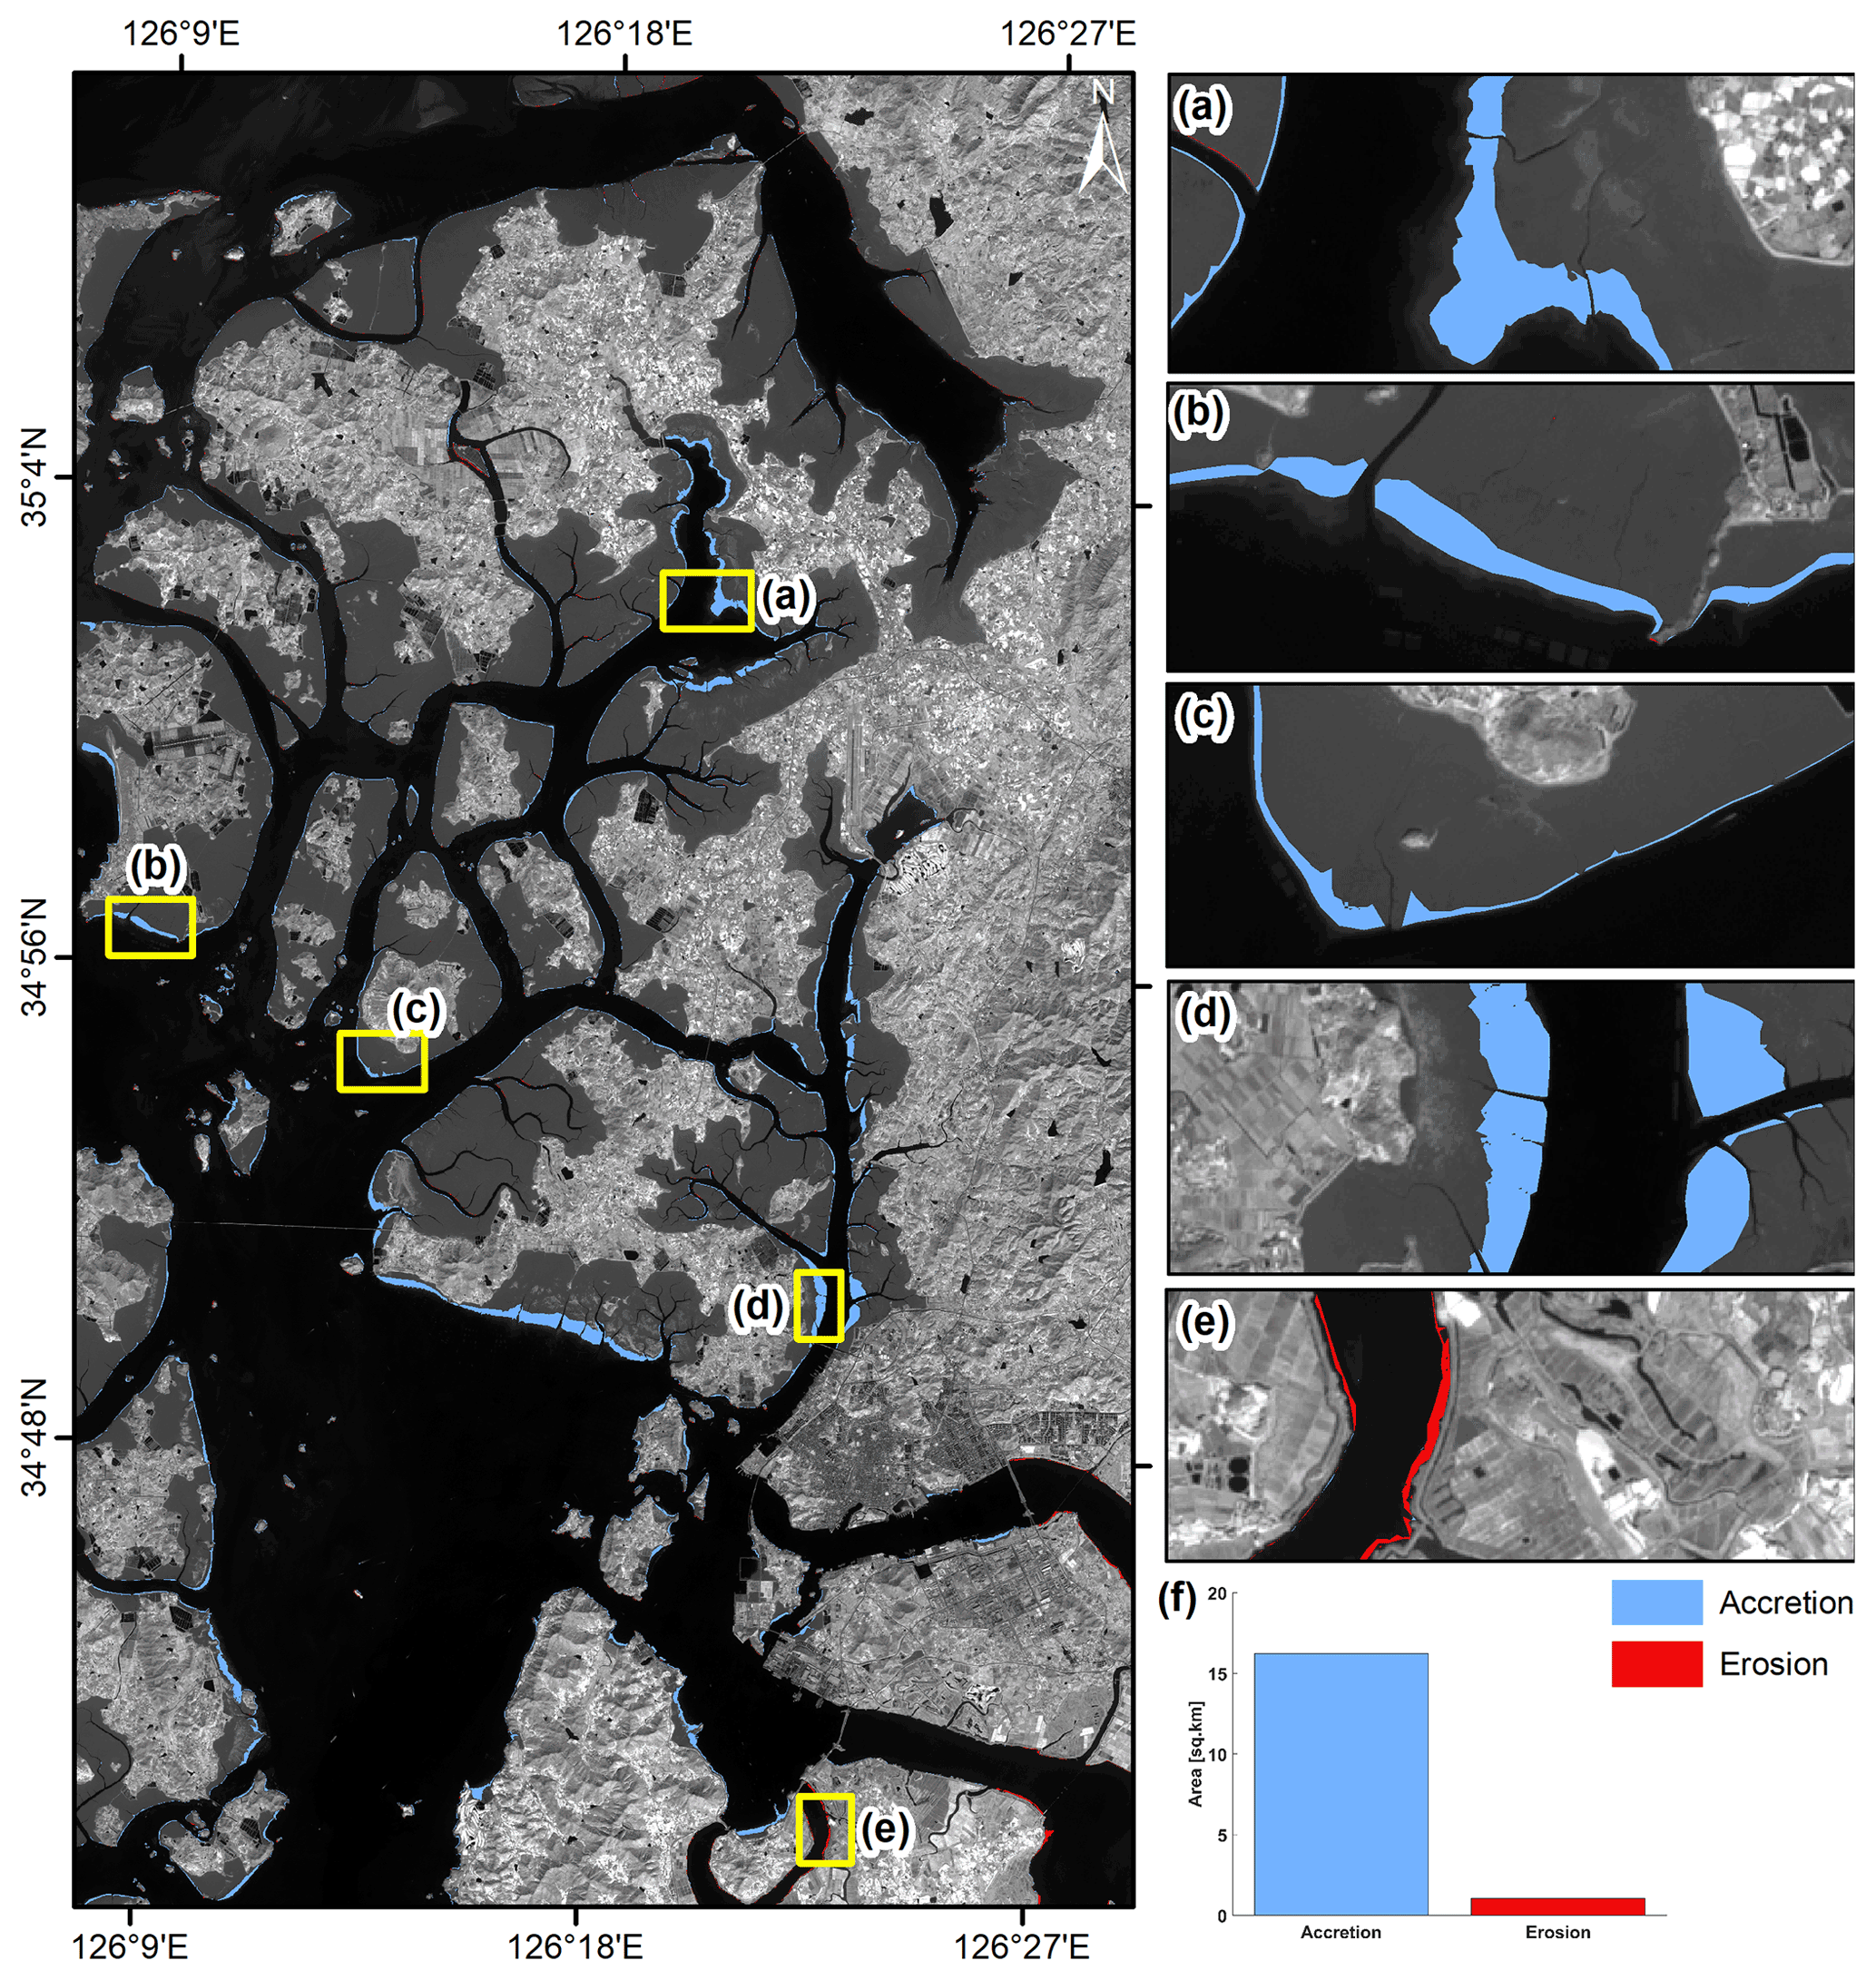
Figure 15Short-term net surface area changes (i.e., erosion and accretion) due to Typhoon Soulik along the Mokpo coast. (a–d) Extensive accretion and (e) erosion. (f) The area changes from the pre- to post-typhoon periods. The background grayscale image represents the NIR band of Sentinel-2 MSI data (15 October 2018), downloaded from https://scihub.copernicus.eu/dhus/.
The net surface area changes along the coastal region have been estimated and are depicted in Fig. 15. The total beach area increases and losses throughout the typhoon period were 16.23 and 1.1 km2, respectively (Fig. 15f). It was observed that Typhoon Soulik drastically increased the wetland (mudflat). These observations were also supported by other proxies, as discussed above.
4.5 Coastal recovery status after Typhoon Soulik
The recovery status, i.e., medium-term coastal changes in the Mokpo coastal region after Typhoon Soulik, has been analyzed using the NSM and coastal-landform change model. For this purpose, another Sentinel-2 MSI Level-1C satellite image was downloaded for October 2019 (1 year after the typhoon), as listed in Table 1. After that, the coastal-landform change model and NSM were performed based on the Sentinel-2 MSI images of October 2018 and 2019 (both images taken during the post-typhoon period) to understand the recovery status of the coastal morphometry. The coastal-landform change model exhibits that the wetland vegetation increased drastically after 1 year of Typhoon Soulik, as depicted in Fig. 16. Table 9 indicates that approximately 16.52 % of the land area has accreted over the wetland and water, whereas 42.03 % of the wetland vegetation area has accreted over the wetland and water after the typhoon. Further, the outcome of the coastal recovery status was visually compared with the high-resolution aerial imagery obtained from the National Land Information Platform website (https://map.ngii.go.kr/, last access: 15 April 2023) and showed strong agreement. Thus, the coastal-landform change model successfully determined the longer-term recovery status in the topography and landforms of the Mokpo coastal region after the typhoon.
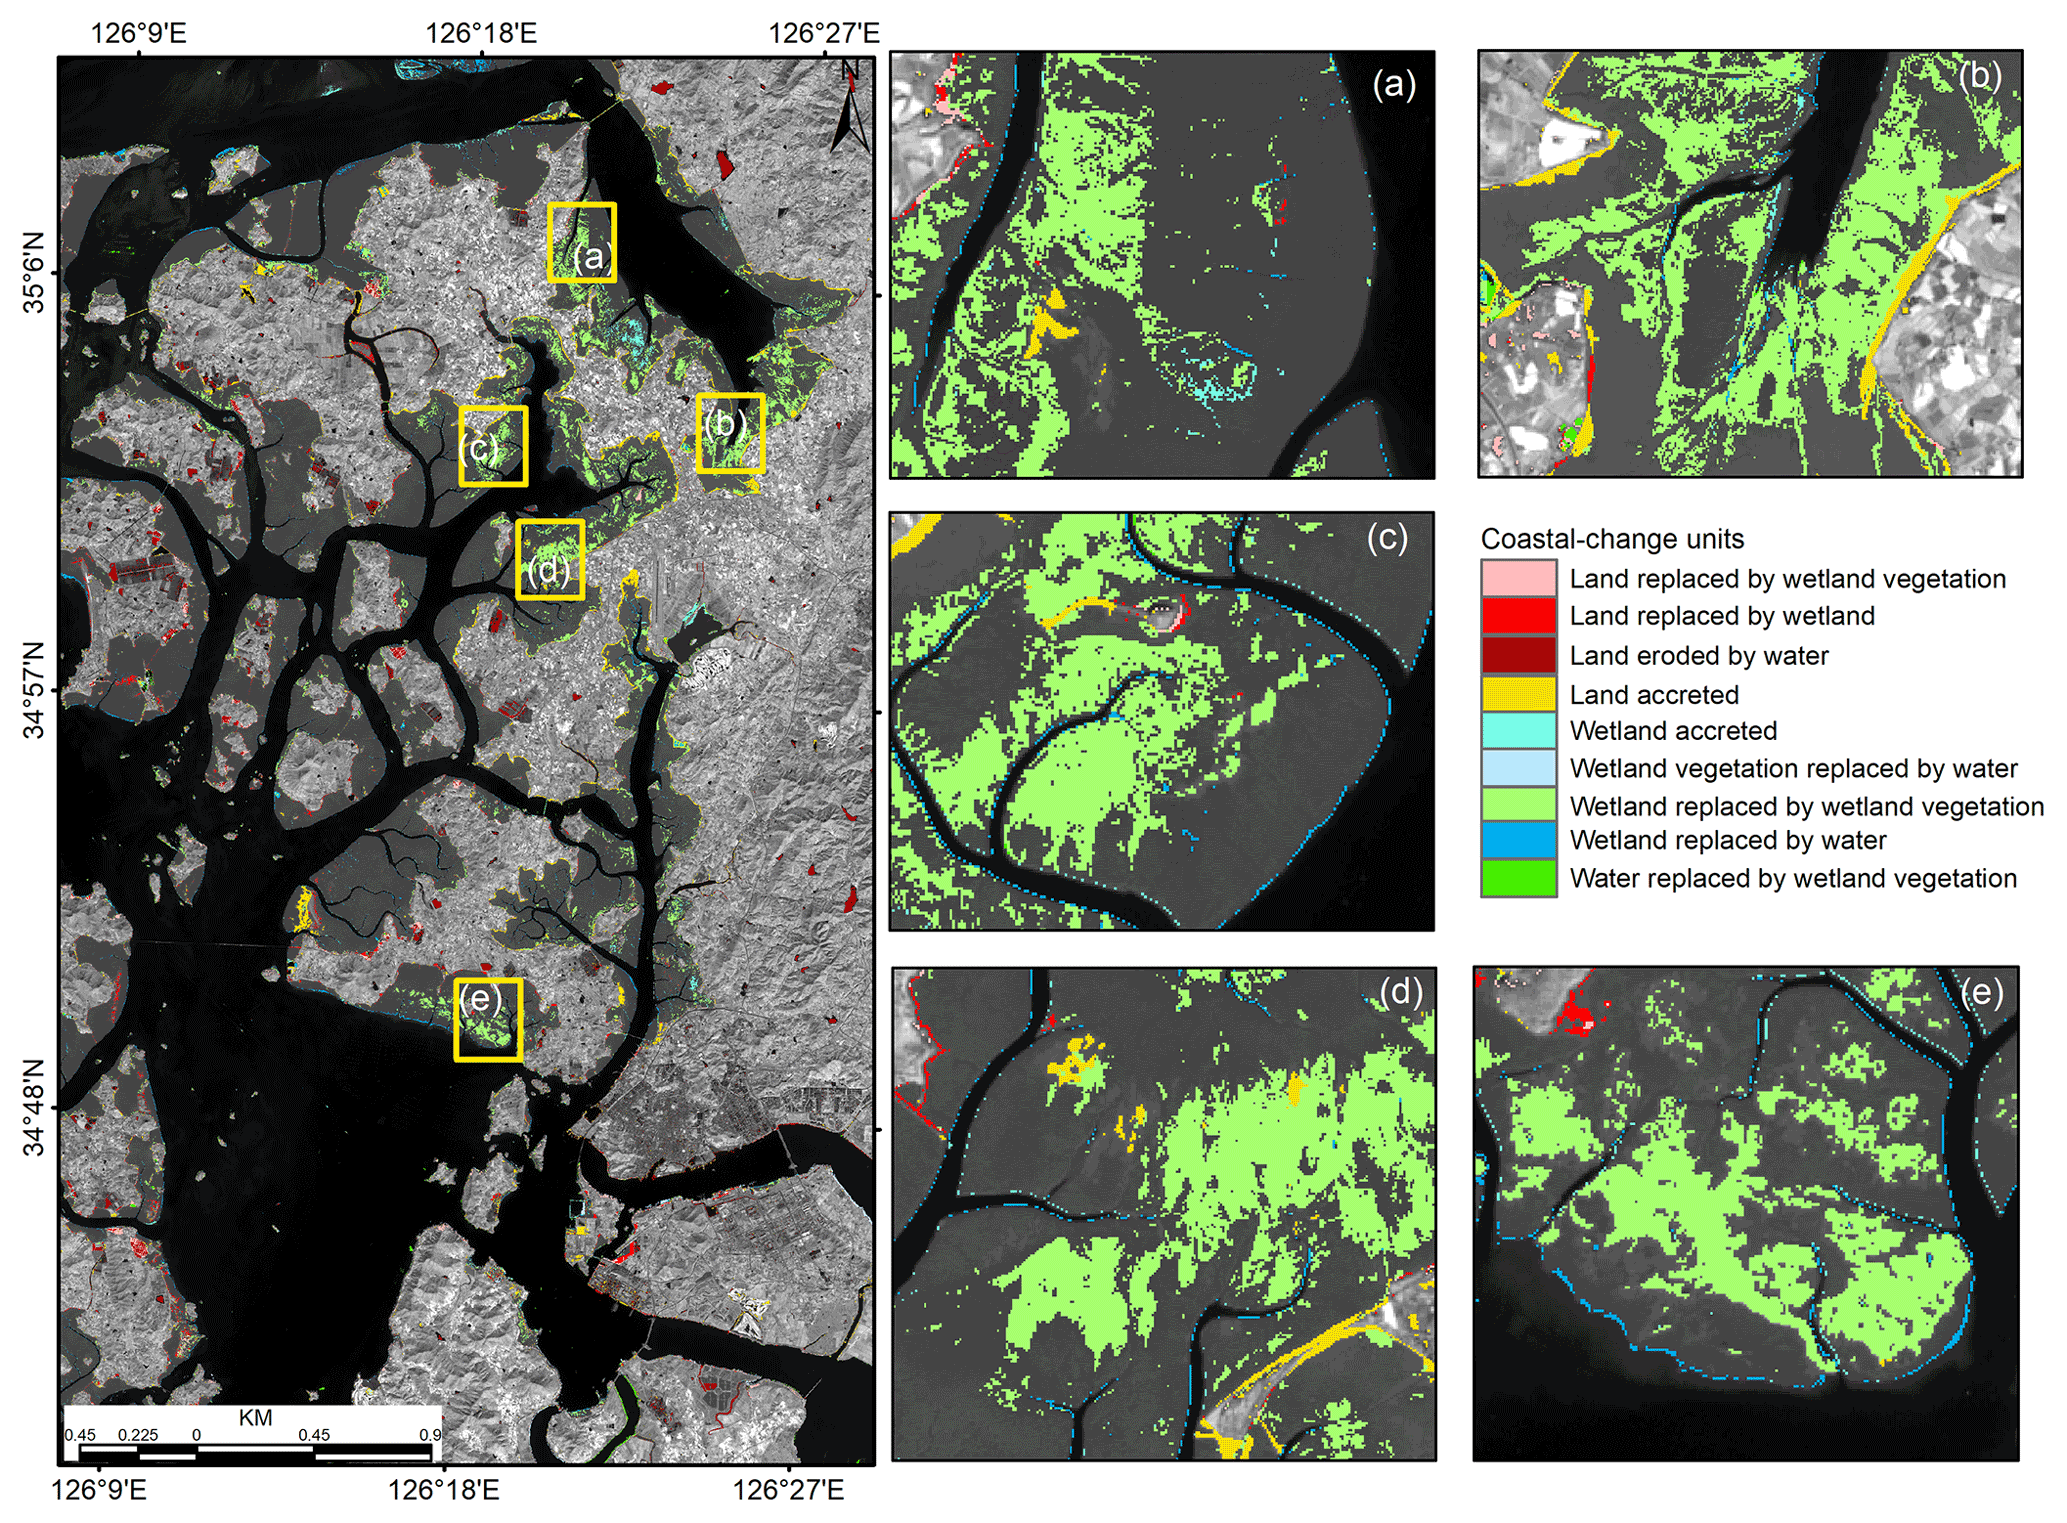
Figure 16Recovery status of different coastal landforms after Typhoon Soulik of the Mokpo coastal region, with (a–e) zoomed-in boxes showing the increase in wetland vegetation at various sites. The background grayscale image represents the NIR band of Sentinel-2 MSI data (20 October 2019), downloaded from https://scihub.copernicus.eu/dhus/.
Table 9The details of medium-term coastal-landform transformation classes identified during the post-typhoon period.
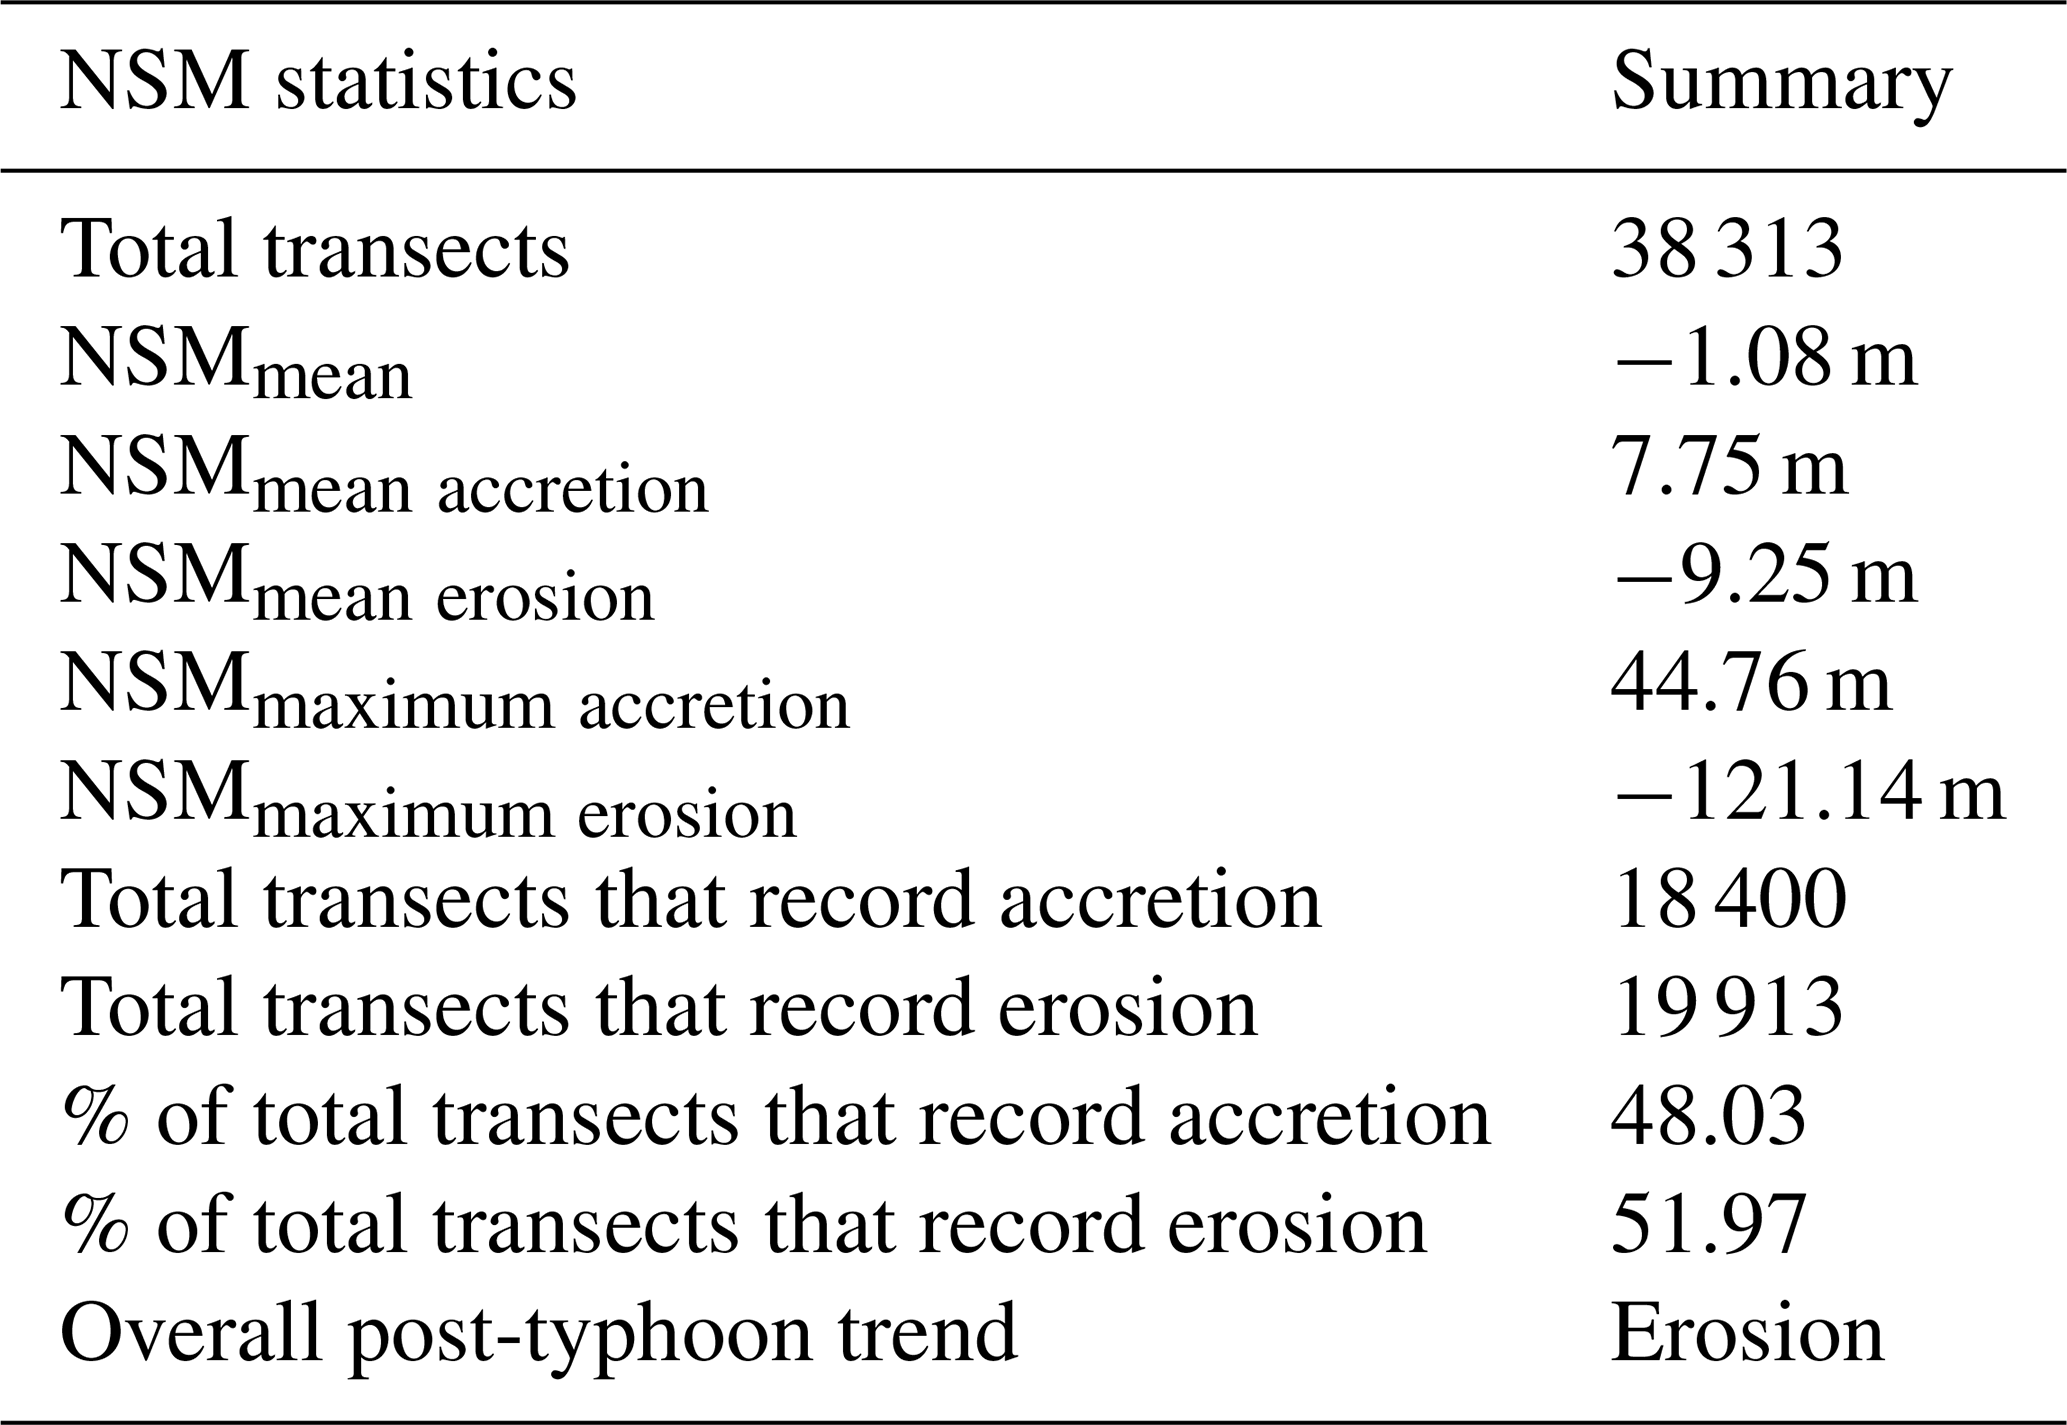
On the other hand, the medium-term effects of a typhoon on the shoreline have also been determined based on the NSM model. The results exhibit the extensive shoreline alteration in the entire Mokpo coastal region 1 year after Typhoon Soulik, with an accretion of 48.03 % transects and erosion of 51.97 %. The NSM statistics showed an average shoreline movement of −1.08 m, with a recorded mean erosion of −9.25 and deposition of 7.75 m (Table 10). The overall erosion was recorded in response to Typhoon Soulik even 1 year later along the Mokpo coastal region. This is due to the extensive damage to wetland vegetation during the typhoon period (Table 7). In addition, it was observed that the wetland experienced accretion during the typhoon period, but it made the coastline vulnerable to erosion in the near future. The natural native vegetation and wetland vegetation play a critical role in the shoreline stability of the coastal region due to its anti-erosive nature. This phenomenon was evident in the NSM statistics obtained during the post-typhoon period. Therefore, the use of these models can help predict how the shoreline and adjacent coastal landforms will respond to typhoons, identify vulnerable areas, and inform recovery efforts. This can enhance the area's resilience to natural disasters and reduce the risk of future erosion and other environmental problems.
Table 10Medium-term shoreline change statistics based on the NSM model.
The objectives of this study were to assess the impact of Typhoon Soulik on the coastal ecology, landform, erosion/accretion, suspended-sediment movement, and associated coastal changes along the Mokpo coast. This research developed an integrated approach for identifying coastal dynamics impacted by typhoons and determining damage severity. The coastline movement, coastal morphodynamics, and quantified severity of vegetation damage from the pre- to post-typhoon periods have been determined based on the Sentinel-2 MSI images. NDVI and FVC have been used to assess the severity of damage caused by Typhoon Soulik to vegetation. The results showed that about 493.9 km2 (26.7 %) of vegetation had been affected in the Mokpo coastal region. Further, it was observed that 6.1 % (112.4 km2) of vegetated areas in low coastal landforms were severely damaged. The land transformation model exhibited that wetland replaced most of the wetland vegetation in the post-typhoon period. Also, it has been found that more aggregated vegetation regions were less susceptible to damage.
The SSC of the Mokpo coastal region is higher in the post-typhoon period compared to pre-typhoon period. The SSC variation influenced the coastal accretion and changed the deltaic islands. The NDSSI and empirical-based SSC distribution of pre- and post-typhoon images exhibit that sedimentation drastically increased after the typhoon. The land accretion process also dominated during the pre- to post-typhoon periods. The wetlands and water have replaced approximately 5.61 % of the land area. On the other hand, 71.97 % of the wetland area has accreted over the wetland vegetation and water. Shoreline change analysis is also performed to understand erosion and accretion in coastal regions. Typhoon Soulik accelerated shoreline movement, affecting the local environmental condition, biodiversity imbalance, and aerial change. In addition, 87.5 % of shoreline transects experienced seaward migration over the typhoon period. The wetland experiences accretion in a shorter period, but it makes the coastline vulnerable to erosion in the near future because the natural native vegetation and wetland vegetation are crucial factors in shoreline stability of the coastal region due to its anti-erosive nature. This phenomenon was evident in the NSM and coastal-landform change model obtained in the medium-term analysis. However, more high-resolution, cloud-free multi-temporal images and in situ observations are required to better understand the medium- to long-term typhoon-induced morphodynamics of the coastal region. It can be concluded that the Mokpo coastal ecosystem has been devastated by this extreme event. Although the observed changes are not alarming, shoreline protection measures still need to be addressed, especially the reforestation in wetland or mudflat regions. The outputs of the present study are needed to better understand the sediment transport process and estuary changes during the pre- and post-typhoon periods. They can also be used to develop appropriate strategies to protect natural ecosystems and for post-disaster rehabilitation.
The models/codes used for the evaluation of typhoon-induced coastal morphodynamics are available from the authors upon reasonable request.
All data used in this study are available from the authors upon request. Open data used in this study are listed in Table 1.
SGY: conceptualization, investigation, supervision, methodology, project administration, data curation, and writing (review and editing). MSS: methodology, data curation, and writing (review and editing). MDA: conceptualization, formal analysis, investigation, methodology, software, data curation, visualization, validation, and writing (original draft preparation and review and editing).
The contact author has declared that none of the authors has any competing interests.
Publisher’s note: Copernicus Publications remains neutral with regard to jurisdictional claims in published maps and institutional affiliations.
This paper was supported by research funds for newly appointed professors of Gangneung-Wonju National University in 2021. The authors are thankful to the European Space Agency (ESA) for providing free satellite images. The authors would like to thank the esteemed reviewers for their valuable comments and suggestions that helped improve the paper.
This work was supported by a National Research Foundation of Korea (NRF) grant funded by the Ministry of Science and ICT (grant no. NRF-2021R1C1C2003316) and Basic Science Research Program through the National Research Foundation of Korea (NRF) funded by the Ministry of Education (grant no. 2021R1A6A1A03044326).
This paper was edited by Mauricio Gonzalez and reviewed by two anonymous referees.
Abbas, S., Nichol, J. E., Fischer, G. A., Wong, M. S., and Irteza, S. M.: Impact assessment of a super-typhoon on Hong Kong's secondary vegetation and recommendations for restoration of resilience in the forest succession, Agr. Forest Meteorol., 280, 107784, https://doi.org/10.1016/j.agrformet.2019.107784, 2020.
Adhikari, M. D., Maiti, S., Bera, A., and Chaudhury, N. R.: Post-tsunami adjustment of coral reef platform and other morphometric changes in Landfall Island, North Andaman – An integrated field and remote sensing-based approach, Regional Studies in Marine Science, 48, 101975, https://doi.org/10.1016/j.rsma.2021.101975, 2021.
Altman, J., Doležal, J., Černý, T., and Song, J. S.: Forest response to increasing typhoon activity on the Korean peninsula: evidence from oak tree-rings, Glob. Change Biol., 19, 498–504, https://doi.org/10.1111/gcb.12067, 2013.
Amiri, R., Weng, Q., Alimohammadi, A., and Alavipanah, S. K.: Spatial–temporal dynamics of land surface temperature in relation to fractional vegetation cover and land use/cover in the Tabriz urban area, Iran, Remote Sens. Environ., 113, 2606–2617, https://doi.org/10.1016/j.rse.2009.07.021, 2009.
Arisanty, D. and Saputra, A. N.: Remote sensing studies of suspended sediment concentration variation in Barito Delta, in: IOP Conference Series: Earth and Environmental Science, 27–28 September 2017, Yogyakarta, Indonesia, 98, 012058, https://doi.org/10.1088/1755-1315/98/1/012058, 2017.
Aswatha, S. M., Mukherjee, J., Biswas, P. K., and Aikat, S.: Unsupervised classification of land cover using multi-modal data from multispectral and hybrid-polarimetric SAR imageries, Int. J. Remote Sens., 41, 5277–5304, https://doi.org/10.1080/01431161.2020.1731771, 2020.
Awad, M. and El-Sayed, H. M.: The analysis of shoreline change dynamics and future predictions using automated spatial techniques: Case of El-Omayed on the Mediterranean coast of Egypt, Ocean Coast. Manage., 205, 105568, https://doi.org/10.1016/j.ocecoaman.2021.105568, 2021.
Bao, A., Huang, Y., Ma, Y., Guo, H., and Wang, Y.: Assessing the effect of EWDP on vegetation restoration by remote sensing in the lower reaches of Tarim River, Ecol. Indic., 74, 261–275, https://doi.org/10.1016/j.ecolind.2016.11.007, 2017.
Bhowmik, A. K. and Cabral, P.: Cyclone Sidr impacts on the Sundarbans floristic diversity, Earth Sci. Res., 2, 62, https://doi.org/10.5539/esr.v2n2p62, 2013.
Bhuiyan, M. J. A. N. and Dutta, D.: Analysis of flood vulnerability and assessment of the impacts in coastal zones of Bangladesh due to potential sea-level rise, Nat. Hazards, 61, 729–743, https://doi.org/10.1007/s11069-011-0059-3, 2012.
Bian, S., Hu, Z., Liu, J., and Zhu, Z.: Sediment suspension and the dynamic mechanism during storms in the Yellow River Delta, Environ. Monit. Assess., 189, 1–13, https://doi.org/10.1007/s10661-016-5688-2, 2017.
Bishop-Taylor, R., Nanson, R., Sagar, S., and Lymburner, L.: Mapping Australia's dynamic coastline at mean sea level using three decades of Landsat imagery, Remote Sens. Environ., 267, 112734, https://doi.org/10.1016/j.rse.2021.112734, 2021.
Byun, D. S., Wang, X. H., and Holloway, P. E.: Tidal characteristic adjustment due to dyke and seawall construction in the Mokpo Coastal Zone, Korea, Estuar. Coast. Shelf S., 59, 185–196, https://doi.org/10.1016/j.ecss.2003.08.007, 2004.
Cakir, H. I., Khorram, S., and Nelson, S. A.: Correspondence analysis for detecting land cover change, Remote Sens. Environ., 102, 306–317, https://doi.org/10.1016/j.rse.2006.02.023, 2006.
Carlson, T. N. and Ripley, D. A.: On the relation between NDVI, fractional vegetation cover, and leaf area index, Remote Sens. Environ., 62, 241–252, https://doi.org/10.1016/S0034-4257(97)00104-1, 1997.
Cha, E. J., Yun, S. G., Moon, I. J., and Kim, D. H.: Binary interaction of typhoons Soulik and Cimaron in 2018 – Part I: Observational characteristics and forecast error, Tropical Cyclone Research and Review, 10, 32–42, https://doi.org/10.1016/j.tcrr.2021.03.001, 2021.
Charrua, A. B., Padmanaban, R., Cabral, P., Bandeira, S., and Romeiras, M. M.: Impacts of the tropical cyclone idai in mozambique: A multi-temporal Landsat satellite imagery analysis, Remote Sens., 13, 201, https://doi.org/10.3390/rs13020201, 2021.
Chau, P. M., Wang, C. K., and Huang, A. T.: The spatial-temporal distribution of GOCI-derived suspended sediment in Taiwan coastal water induced by typhoon Soudelor, Remote Sens., 13, 194, https://doi.org/10.3390/rs13020194, 2021.
Choi, J. K., Park, Y. J., Ahn, J. H., Lim, H. S., Eom, J., and Ryu, J. H.: GOCI, the world's first geostationary ocean color observation satellite, for the monitoring of temporal variability in coastal water turbidity, J. Geophys. Res. Oceans, 117, C09004, https://doi.org/10.1029/2012JC008046, 2012.
Choi, J. K., Park, Y. J., Lee, B. R., Eom, J., Moon, J. E., and Ryu, J. H.: Application of the Geostationary Ocean Color Imager (GOCI) to mapping the temporal dynamics of coastal water turbidity, Remote Sens. Environ., 146, 24–35, https://doi.org/10.1016/j.rse.2013.05.032, 2014.
Choi, K.: Morphology, sedimentology and stratigraphy of Korean tidal flats – Implications for future coastal managements, Ocean Coast. Manage., 102, 437–448, https://doi.org/10.1016/j.ocecoaman.2014.07.009, 2014.
Choi, M. K., Choi, H. G., Moon, H. B., Yu, J., Kang, S. K., and Choi, S. K.: Sources and distributions of organic wastewater compounds on the Mokpo Coast of Korea, Fisheries and Aquatic Sciences, 10, 205–214, https://doi.org/10.5657/fas.2007.10.4.205, 2007.
Chu, T., Guo, X., and Takeda, K.: Remote sensing approach to detect post-fire vegetation regrowth in Siberian boreal larch forest, Ecol. Indic., 62, 32–46, https://doi.org/10.1016/j.ecolind.2015.11.026, 2016.
Congalton, R. G.: A review of assessing the accuracy of classifications of remotely sensed data, Remote Sens. Environ., 37, 35–46, https://doi.org/10.1016/0034-4257(91)90048-B, 1991.
Dai, C, Howat, I. M., Larour, E., and Husby, E.: Coastline extraction from repeat high resolution satellite imagery, Remote Sens. Environ., 229, 260–270, https://doi.org/10.1016/j.rse.2019.04.010, 2019.
Dail, M. B., Corbett, D. R., and Walsh, J. P.: Assessing the importance of tropical cyclones on continental margin sedimentation in the Mississippi delta region, Cont. Shelf Res., 27, 1857–1874, https://doi.org/10.1016/j.csr.2007.03.004, 2007.
Datta, D. and Deb, S.: Analysis of coastal land use/land cover changes in the Indian Sunderbans using remotely sensed data, Geospatial Information Science, 15, 241–250, https://doi.org/10.1080/10095020.2012.714104, 2012.
Deabes, E. A.: Applying ArcGIS to Estimate the Rates of Shoreline and Back-Shore Area Changes along the Nile Delta Coast, Egypt, International Journal of Geosciences, 8, 332, https://doi.org/10.4236/ijg.2017.83017, 2017.
Eastman, J. R., Sangermano, F., Machado, E. A., Rogan, J., and Anyamba, A.: Global trends in seasonality of normalized difference vegetation index (NDVI), 1982–2011, Remote Sens., 5, 4799–4818, https://doi.org/10.3390/rs5104799, 2013.
Eom, J., Lee, C., Jang, J., Choi, J. K., and Park, S.: Study on environmental change monitoring between shoreline change and suspended sediment concentration using Landsat images in Nakdong river, Korea, in: IEEE International Geoscience and Remote Sensing Symposium (IGARSS), 23–28 July 2017, Fort Worth, TX, USA, IEEE, 3607–3609, https://doi.org/10.1109/IGARSS.2017.8127779, 2017.
ERDAS: ERDAS Imagine Tour Guides, ERDAS Inc., Atlanta, GA, https://eclass.uoa.gr/modules/document/file.php/GEOL130/ERDAS_TourGuide.pdf (last access: 9 July 2023), 1997.
ESA: Multispectral instrument (MSI) overview, European Space Agency, https://sentinels.copernicus.eu/web/sentinel/technical-guides/sentinel-2-msi (last access: 7 September 2022), 2020.
ESCAP/WMO Typhoon Committee: Member Report, Republic of Korea, 13th Integrated Workshop, Chiang Mai, Thailand, 5–9 November 2018, ESCAP/WMO Typhoon Committee, https://www.typhooncommittee.org/13IWS/Members13IWS.html (last access: 28 April 2023), 2018.
Filgueiras, R., Mantovani, E. C., Althoff, D., Fernandes Filho, E. I., and Cunha, F. F. D.: Crop NDVI monitoring based on sentinel 1, Remote Sens., 11, 1441, https://doi.org/10.3390/rs11121441, 2019.
Ge, J., Meng, B., Liang, T., Feng, Q., Gao, J., Yang, S., Huang, X., and Xie, H.: Modeling alpine grassland cover based on MODIS data and support vector machine regression in the headwater region of the Huanghe River, China, Remote Sens. Environ., 218, 162–173, https://doi.org/10.1016/j.rse.2018.09.019, 2018.
Goff, J. A., Allison, M. A., and Gulick, S. P.: Offshore transport of sediment during cyclonic storms: Hurricane Ike (2008), Texas Gulf Coast, USA, Geology, 38, 351–354, https://doi.org/10.1130/G30632.1, 2010.
Gong, W. and Shen, J.: Response of sediment dynamics in the York River Estuary, USA to tropical cyclone Isabel of 2003, Estuar. Coast. Shelf S., 84, 61–74, https://doi.org/10.1016/j.ecss.2009.06.004, 2009.
Halder, B. and Bandyopadhyay, J.: Monitoring the tropical cyclone “Yass” and “Amphan” affected flood inundation using Sentinel-1/2 data and Google Earth Engine, Modeling Earth Systems and Environment, 8, 4317–4332, https://doi.org/10.1007/s40808-022-01359-w, 2022.
Hopper, M.: WXTide32 Version 4.0, Free Software Foundation Inc., Cambridge, http://www.wxtide32.com (last access: 25 April 2022), 2004.
Hoque, M. A. A., Phinn, S., Roelfsema, C., and Childs, I.: Assessing tropical cyclone impacts using object-based moderate spatial resolution image analysis: a case study in Bangladesh, Int. J. Remote Sens., 37, 5320–5343, https://doi.org/10.1080/01431161.2016.1239286, 2016.
Hossain, A. A., Mathias, C., and Blanton, R.: Remote sensing of turbidity in the Tennessee River using Landsat 8 satellite, Remote Sens., 13, 3785, https://doi.org/10.3390/rs13183785, 2021.
Hossain, A. K. M. A., Jia, Y., and Chao, X.: Development of remote sensing based index for estimating/mapping suspended sediment concentration in river and lake environments, in: Proceedings of 8th international symposium on ECOHYDRAULICS (ISE 2010), Seoul, Korea, 12–16 September 2010, 435, 578–585, https://scholar.google.com/scholar_lookup?title=Development%20of%20remote%20sensing%20based%20Index%20for%20estimating%2Fmapping%20suspended%20sediment%20concentration%20in%20river%20and%20lake%20environments&author=A.K.M.A.%20Hossain&publication_year=2010&pages=578-585 (last access: 10 July 2023), 2010.
Hu, T. and Smith, R. B.: The impact of Hurricane Maria on the vegetation of Dominica and Puerto Rico using multispectral remote sensing, Remote Sens., 10, 827, https://doi.org/10.3390/rs10060827, 2018.
Hwang, D. J., Choi, J. K., Eom, J., Ryu, J. H., and Woo, H. J.: Long-term monitoring of suspended sediments concentration using GOCI and field data in Han-river estuary, Korea, in: 2016 IEEE International Geoscience and Remote Sensing Symposium, 10–15 July 2016, Beijing, China, IEEE, 2465–2467, https://doi.org/10.1109/IGARSS.2016.7729636, 2016.
Hwang, S., Son, S., Lee, C., and Yoon, H. D.: Quantitative assessment of inundation risks from physical contributors associated with future storm surges: a case study of Typhoon Maemi (2003), Nat. Hazards, 104, 1389–1411, https://doi.org/10.1007/s11069-020-04225-z, 2020.
Jing, X., Yao, W. Q., Wang, J. H., and Song, X. Y.: A study on the relationship between dynamic change of vegetation coverage and precipitation in Beijing's mountainous areas during the last 20 years, Math. Comput. Model., 54, 1079–1085, https://doi.org/10.1016/j.mcm.2010.11.038, 2011.
Kang, J. W.: Changes in tidal characteristics as a result of the construction of sea-dike/sea-walls in the Mokpo coastal zone in Korea, Estuar. Coast. Shelf S., 48, 429–438, https://doi.org/10.1006/ecss.1998.0464, 1999.
Kang, J. W. and Jun, K. S.: Flood and ebb dominance in estuaries in Korea, Estuar. Coast. Shelf S., 56, 187–196, https://doi.org/10.1016/S0272-7714(02)00156-7, 2003.
Kang, J. W., Moon, S. R., Lee, D. S., and Lee, J. L.: Surge-Wave Combined Inundation at Mokpo North Harbour, Korea, J. Coastal Res., SI 50, 1081–1085, 2007.
Kang, K. and Moon, I. J.: Sea Surface Height Changes due to the Tropical Cyclone-Induced Water Mixing in the Yellow Sea, Korea, Front. Earth Sci., 10, 826582, https://doi.org/10.3389/feart.2022.826582, 2022.
Kang, K., Jo, H. J., and Kim, Y.: Ocean responses to Typhoon Soulik (1819) around Korea, Ocean Sci. J., 55, 445–457, https://doi.org/10.1007/s12601-020-0030-x, 2020.
Kavan, J., Wieczorek, I., Tallentire, G. D., Demidionov, M., Uher, J., and Strzelecki, M. C.: Estimating Suspended Sediment Fluxes from the Largest Glacial Lake in Svalbard to Fjord System Using Sentinel-2 Data: Trebrevatnet Case Study, Water, 14, 1840, https://doi.org/10.3390/w14121840, 2022.
Kermani, S., Boutiba, M., Guendouz, M., Guettouche, M. S., and Khelfani, D.: Detection and analysis of shoreline changes using geospatial tools and automatic computation: Case of jijelian sandy coast (East Algeria), Ocean Coast. Manage., 132, 46–58, https://doi.org/10.1016/j.ocecoaman.2016.08.010, 2016.
Keukelaere, L. De, Sterckx, S., Adriaensen, S., Knaeps, E., Reusen, I., Giardino, C., Bresciani, M., Hunter, P., Neil, C., Van der Zande, D., and Vaiciute, D.: Atmospheric correction of Landsat-8/OLI and Sentinel-2/MSI data using iCOR algorithm: validation for coastal and inland waters, Eur. J. Remote Sens., 51, 525–542, https://doi.org/10.1080/22797254.2018.1457937, 2018.
Kim, J. M., Bae, J., Son, S., Son, K., and Yum, S. G.: Development of model to predict natural disaster-induced financial losses for construction projects using deep learning techniques, Sustainability, 13, 5304, https://doi.org/10.3390/su13095304, 2021.
Kim, Y. C.: Handbook of coastal and ocean engineering, World Scientific, https://doi.org/10.1142/6914, 2010.
KMA: Typhoon White Book, Korea Meteorological Administration, https://www.kma.go.kr/download_01/typhoon/typwhitebook_2011.pdf (last access: 20 April 2022), 2011.
KMA: 2018 annual report, Korea Meteorological Administration, https://www.kma.go.kr/download_01/Annual_Report_2018.pdf (last access: 20 April 2022), 2018.
Konda, V. G. R. K., Chejarla, V. R., Mandla, V. R., Voleti, V., and Chokkavarapu, N.: Vegetation damage assessment due to Hudhud cyclone based on NDVI using Landsat-8 satellite imagery, Arab. J. Geosci., 11, 1–11, https://doi.org/10.1007/s12517-017-3371-8, 2018.
Kumar, R., Rani, S., and Maharana, P.: Assessing the impacts of Amphan cyclone over West Bengal, India: a multi-sensor approach, Environ. Monit. Assess., 193, 1–21, https://doi.org/10.1007/s10661-021-09071-5, 2021.
Kwon, J. I., Choi, J. W., Lee, J. C., Min, I. K., and Park, K. S.: Spatio-temporal Characteristics of Storm Surge Events in the Korean Peninsula, J. Coastal Res., 85, 891–895, 2018.
Landis, J. R. and Koch, G. G.: An application of hierarchical kappa-type statistics in the assessment of majority agreement among multiple observers, Biometrics, 33, 363–374, 1977.
Lee, J. K., Kim, J. O., and Oh, Y. S.: Development of Coastal Safety Mapping System by Vulnerability Assessment of Tidal Creeks, J. Coastal Res., 114, 459–463, 2021.
Lee, M. S., Park, K., Chung, J. Y., Ahn, Y. H., and Moon, J. E.: Estimation of coastal suspended sediment concentration using satellite data and oceanic in situ measurements, Korean Journal of Remote Sensing, 27, 677–692, 2011.
Lee, S. W., Nam, S. H., and Kim, D. J.: Estimation of marine winds in and around typhoons using multi-platform satellite observations: Application to Typhoon Soulik (2018), Front. Earth Sci., 16, 175–189, https://doi.org/10.1007/s11707-020-0849-6, 2022.
Lee, Y.: Coastal planning strategies for adaptation to sea level rise: A case study of Mokpo, Korea, Journal of Building Construction and Planning Research, 2, 74–81, https://doi.org/10.4236/jbcpr.2014.21007, 2014.
Lee, Y. K., Choi, J. K., and Lee, H. J.: A study on seasonal dynamics of suspended particulate matter in Korean coastal waters using GOCI, J. Coastal Res., 102, 232–245, https://doi.org/10.2112/SI102-029.1, 2020.
Li, K. and Li, G. S.: Risk assessment on storm surges in the coastal area of Guangdong Province, Nat. Hazards, 68, 1129–1139, https://doi.org/10.1007/s11069-013-0682-2, 2013.
Li, Y. and Li, X.: Remote sensing observations and numerical studies of a super typhoon-induced suspended sediment concentration variation in the East China Sea, Ocean Model., 104, 187–202, https://doi.org/10.1016/j.ocemod.2016.06.010, 2016.
Li, Y., Li, H., Qiao, L., Xu, Y., Yin, X., and He, J.: Storm deposition layer on the Fujian coast generated by Typhoon Saola (2012), Sci. Rep., 5, 1–7, https://doi.org/10.1038/srep14904, 2015.
Liu, Y., Wu, L., and Yue, H.: Biparabolic NDVI-Ts space and soil moisture remote sensing in an arid and semi-arid area, Can. J. Remote Sens., 41, 159–169, https://doi.org/10.1080/07038992.2015.1065705, 2015.
Lu, J., Jiang, J., Li, A., and Ma, X.: Impact of Typhoon Chan-hom on the marine environment and sediment dynamics on the inner shelf of the East China Sea: In-situ seafloor observations, Mar. Geol., 406, 72–83, https://doi.org/10.1016/j.margeo.2018.09.009, 2018.
Lu, L., Wu, C., and Di, L.: Exploring the spatial characteristics of typhoon-induced vegetation damages in the southeast coastal area of China from 2000 to 2018, Remote Sens., 12, 1692, https://doi.org/10.3390/rs12101692, 2020.
Lugo, A. E., Applefield, M., Pool, D. J., and McDonald, R. B.: The impact of Hurricane David on the forests of Dominica, Can. J. Forest Res., 13, 201–211, https://doi.org/10.1139/x83-029, 1983.
Maiti, S. and Bhattacharya, A. K.: Shoreline change analysis and its application to prediction: A remote sensing and statistics based approach, Mar. Geol., 257, 11–23, https://doi.org/10.1016/j.margeo.2008.10.006, 2009.
Maiti, S. and Bhattacharya, A. K.: A three-unit-based approach in coastal-change studies using Landsat images, Int. J. Remote Sens., 32, 209–229, https://doi.org/10.1080/01431160903439965, 2011.
Mallick, B., Ahmed, B., and Vogt, J.: Living with the risks of cyclone disasters in the southwestern coastal region of Bangladesh, Environments, 4, 13, https://doi.org/10.3390/environments4010013, 2017.
McFeeters, S. K.: The use of the Normalized Difference Water Index (NDWI) in the delineation of open water features, Int. J. Remote Sens., 17, 1425–1432, https://doi.org/10.1080/01431169608948714, 1996.
Min, J. E., Ryu, J. H., Shanmugam, P., Ahn, Y. H., and Lee, K. S.: Monitoring suspended sediment distribution using Landsat TM/ETM+ data in coastal waters of Seamangeum, Korea, in: Proceedings of the KSRS Conference, The Korean Society of Remote Sensing, 340–343, pISSN: 1226-9743, https://koreascience.kr/article/CFKO200430710678241.pdf (last access: 9 July 2023), 2004.
Min, J. E., Ahn, Y. H., Lee, K. S., and Ryu, J. H.: Development of Suspended Sediment Algorithm for Landsat TM/ETM+ in Coastal Sea Waters-A Case Study in Saemangeum Area, Korean Journal of Remote Sensing, 22, 87–99, 2006.
Min, J. E., Ryu, J. H., Lee, S., and Son, S.: Monitoring of suspended sediment variation using Landsat and MODIS in the Saemangeum coastal area of Korea, Mar. Pollut. Bull., 64, 382–390, https://doi.org/10.1016/j.marpolbul.2011.10.025, 2012.
Min, J. E., Choi, J. K., Yang, H., Lee, S., and Ryu, J. H.: Monitoring changes in suspended sediment concentration on the southwestern coast of Korea, J. Coastal Res., 70, 133–138, 2014.
Mishra, M., Acharyya, T., Santos, C. A. G., da Silva, R. M., Kar, D., Kamal, A. H. M., and Raulo, S.: Geo-ecological impact assessment of severe cyclonic storm Amphan on Sundarban mangrove forest using geospatial technology, Estuar. Coast. Shelf S., 260, 107486, https://doi.org/10.1016/j.ecss.2021.107486, 2021a.
Mishra, M., Santos, C. A. G., da Silva, R. M., Rana, N. K., Kar, D., and Parida, N. R.: Monitoring vegetation loss and shoreline change due to tropical cyclone Fani using Landsat imageries in Balukhand-Konark Wildlife Sanctuary, India, J. Coast. Conserv., 25, 1–11, https://doi.org/10.1007/s11852-021-00840-5, 2021b.
Moon, I. J., Oh, I. S., Murty, T., and Youn, Y. H.: Causes of the unusual coastal flooding generated by Typhoon Winnie on the west coast of Korea, Nat. Hazards, 29, 485–500, https://doi.org/10.1023/A:1024798718572, 2003.
Na, C. K.: Heavy metals in sediments and organisms from tidal flats along the Mokpo coastal area, Economic and Environmental Geology, 37, 335–345, 2004.
Nandi, G., Neogy, S., Roy, A. K., and Datta, D.: Immediate disturbances induced by tropical cyclone Fani on the coastal forest landscape of eastern India: A geospatial analysis, Remote Sensing Applications: Society and Environment, 20, 100407, https://doi.org/10.1016/j.rsase.2020.100407, 2020.
Nayak, S.: Use of satellite data in coastal mapping, Indian Cartographer, 22, 147–157, 2002.
NGII: Digital elevation model, National Geographical Information Institute, the Ministry of Land, Infrastructure and Transport, Korea, https://www.ngii.go.kr/ (last access: 12 July 2022), 2018.
Parida, B. R., Behera, S. N., Oinam, B., Patel, N. R., and Sahoo, R. N.: Investigating the effects of episodic Super-cyclone 1999 and Phailin 2013 on hydro-meteorological parameters and agriculture: An application of remote sensing, Remote Sensing Applications: Society and Environment, 10, 128–137, https://doi.org/10.1016/j.rsase.2018.03.010, 2018.
Park, J.H., Yeo, D.E., Lee, K., Lee, H., Lee, S.W., Noh, S., Kim, S., Shin, J., Choi, Y., and Nam, S.: Rapid decay of slowly moving Typhoon Soulik (2018) due to interactions with the strongly stratified northern East China Sea, Geophys. Res. Lett., 46, 14595–14603, https://doi.org/10.1029/2019GL086274, 2019.
Phiri, D., Simwanda, M., and Nyirenda, V.: Mapping the impacts of cyclone Idai in Mozambique using Sentinel-2 and OBIA approach, S. Afr. Geogr. J., 103, 237–258, https://doi.org/10.1080/03736245.2020.1740104, 2021.
Rodgers, J. C., Murrah, A. W., and Cooke, W. H.: The impact of Hurricane Katrina on the coastal vegetation of the Weeks Bay Reserve, Alabama from NDVI data, Estuar. Coast., 32, 496–507, https://doi.org/10.1007/s12237-009-9138-z, 2009.
Rouse, J. W., Haas, J. R. H., Schell, J. A., and Deering, D. W.: Monitoring vegetation systems in the Great Plains with ERTS, in: NASA Spec. Publ, 351, 309–317, https://ntrs.nasa.gov/api/citations/19740022614/downloads/19740022614.pdf (last access: 9 July 2023), 1974.
Ryang, W. H., Kang, S. I., and Cho, K. S.: Characteristics of Surface Topography and Sediments before and after the Typhoon Soulik in 2018, Macrotidal Coast of Gochang, Korea, in: AGU Fall Meeting Abstracts, New Orleans, LA, 13–17 December 2021, ADS, OS33B-02, https://ui.adsabs.harvard.edu/abs/2021AGUFMOS33B..02R (last access: 9 July 2023), 2021.
Sadik, M., Nakagawa, H., Rahman, M., Shaw, R., Kawaike, K., and Parvin, G. A.: Assessment of cyclone Aila recovery progress in Bangladesh: a comparison between rice and shrimp farming villages in Koyra, in: Water, Flood Management and Water Security Under a Changing Climate, Springer, Cham, 109–124, https://doi.org/10.1007/978-3-030-47786-8_7, 2020.
Sahoo, B. and Bhaskaran, P. K.: Multi-hazard risk assessment of coastal vulnerability from tropical cyclones–A GIS based approach for the Odisha coast, J. Environ. Manage., 206, 1166–1178, https://doi.org/10.1016/j.jenvman.2017.10.075, 2018.
Santos, C. A. G., do Nascimento, T. V. M., Mishra, M., and da Silva, R. M.: Analysis of long-and short-term shoreline change dynamics: A study case of João Pessoa city in Brazil, Sci. Total Environ., 769, 144889, https://doi.org/10.1016/j.scitotenv.2020.144889, 2021.
Schneider, A.: Monitoring land cover change in urban and peri-urban areas using dense time stacks of Landsat satellite data and a data mining approach, Remote Sens. Environ., 124, 689–704, https://doi.org/10.1016/j.rse.2012.06.006, 2012.
Shahzad, M. I., Meraj, M., Nazeer, M., Zia, I., Inam, A., Mehmood, K., and Zafar, H.: Empirical estimation of suspended solids concentration in the Indus Delta Region using Landsat-7 ETM+ imagery, J. Environ. Manage., 209, 254–261, https://doi.org/10.1016/j.jenvman.2017.12.070, 2018.
Shamsuzzoha, M., Noguchi, R., and Ahamed, T.: Damaged area assessment of cultivated agricultural lands affected by cyclone bulbul in coastal region of Bangladesh using Landsat 8 OLI and TIRS datasets, Remote Sensing Applications: Society and Environment, 23, 100523, https://doi.org/10.1016/j.rsase.2021.100523, 2021.
Sobrino, J. A., Jiménez-Muñoz, J. C., and Paolini, L.: Land surface temperature retrieval from LANDSAT TM 5, Remote Sens. Environ., 90, 434–440, https://doi.org/10.1016/j.rse.2004.02.003, 2004.
Son, S., Kim, Y. H., Kwon, J. I., Kim, H. C., and Park, K. S.: Characterization of spatial and temporal variation of suspended sediments in the Yellow and East China Seas using satellite ocean color data, GISci. Remote Sens., 51, 212–226, https://doi.org/10.1080/15481603.2014.895580, 2014.
Song, W., Mu, X., Ruan, G., Gao, Z., Li, L., and Yan, G.: Estimating fractional vegetation cover and the vegetation index of bare soil and highly dense vegetation with a physically based method, Int. J. Appl. Earth Obs., 58, 168–176, https://doi.org/10.1016/j.jag.2017.01.015, 2017.
Souza, A. J., Dickey, T. D., and Chang, G. C.: Modeling water column structure and suspended particulate matter on the Middle Atlantic continental shelf during the passages of Hurricanes Edouard and Hortense, J. Mar. Res., 59, 1021–1045, https://doi.org/10.1357/00222400160497751, 2001.
Story, M. and Congalton, R. G.: Accuracy assessment: a user's perspective, Photogramm. Eng. Rem. S., 52, 397–399, 1986.
Tang, R., Shen, F., Ge, J., Yang, S., and Gao, W.: Investigating typhoon impact on SSC through hourly satellite and real-time field observations: A case study of the Yangtze Estuary, Cont. Shelf Res., 224, 104475, https://doi.org/10.1016/j.csr.2021.104475, 2021.
Thieler, E. R., Himmelstoss, E. A., Zichichi, J. L., and Ergul, A.: The Digital Shoreline Analysis System (DSAS) version 4.0-an ArcGIS extension for calculating shoreline change, No. 2008-1278, US Geological Survey, https://doi.org/10.3133/ofr20081278, 2009.
Tian, Y., Mingming, J., Zongming, W., Dehua, M., Baojia, D., and Chao, W.: Monitoring invasion process of Spartina alterniflora by seasonal Sentinel-2 imagery and an object-based random forest classification, Remote Sens., 12, 1383, https://doi.org/10.3390/rs12091383, 2020.
Tsai, C. H., Tzang, S. Y., Hsiao, S. S., Cheng, C. C., and Li, H. W.: Coastal structure failures and coastal waves on the north coast of Taiwan due to typhoon Herb, J. Coastal Res., 22, 393–405, 2006.
Tsai, Y. L. S.: Monitoring 23-year of shoreline changes of the Zengwun Estuary in Southern Taiwan using time-series Landsat data and edge detection techniques, Sci. Total Environ., 839, 156310, https://doi.org/10.1016/j.scitotenv.2022.156310, 2022.
Wang, M. and Xu, H.: Remote sensing-based assessment of vegetation damage by a strong typhoon (Meranti) in Xiamen Island, China, Nat. Hazards, 93, 1231–1249, https://doi.org/10.1007/s11069-018-3351-7, 2018.
Wang, S., Mu, L., Qi, M., Yu, Z., Yao, Z., and Zhao, E.: Quantitative risk assessment of storm surge using GIS techniques and open data: A case study of Daya Bay Zone, China, J. Environ. Manage., 289, 112514, https://doi.org/10.1016/j.jenvman.2021.112514, 2021.
Wang, T., Liu, G., Gao, L., Zhu, L., Fu, Q., and Li, D.: Biological and nutrient responses to a typhoon in the Yangtze Estuary and the adjacent sea, J. Coastal Res., 32, 323–332, 2016.
Wang, W., Qu, J. J., Hao, X., Liu, Y., and Stanturf, J. A.: Post-hurricane forest damage assessment using satellite remote sensing, Agr. Forest Meteorol., 150, 122–132, https://doi.org/10.1016/j.agrformet.2009.09.009, 2010.
WMO: Tropical cyclones, World Meteorological Organization, https://public.wmo.int/en/our-mandate/focus-areas/natural-hazards-and-disaster-risk-reduction/tropical-cyclones (last access: 14 August 2022), 2020.
Wong, M. M. F., Fung, J. C. H., and Yeung, P. P. S.: High-resolution calculation of the urban vegetation fraction in the Pearl River Delta from the Sentinel-2 NDVI for urban climate model parameterization, Geoscience Letters, 6, 1–10, https://doi.org/10.1186/s40562-019-0132-4, 2019.
Xu, S., Zhu, X., Helmer, E. H., Tan, X., Tian, J., and Chen, X.: The damage of urban vegetation from super typhoon is associated with landscape factors: Evidence from Sentinel-2 imagery, Int. J. Appl. Earth Obs., 104, 102536, https://doi.org/10.1016/j.jag.2021.102536, 2021.
Yang, Q., Qin, Z., Li, W., and Xu, B.: Temporal and spatial variations of vegetation cover in Hulun Buir grassland of Inner Mongolia, China, Arid Land Res. Manag., 26, 328–343, https://doi.org/10.1080/15324982.2012.709215, 2012.
Yang, Y., Erskine, P. D., Lechner, A. M., Mulligan, D., Zhang, S., and Wang, Z.: Detecting the dynamics of vegetation disturbance and recovery in surface mining area via Landsat imagery and LandTrendr algorithm, J. Clean. Prod., 178, 353–362, https://doi.org/10.1016/j.jclepro.2018.01.050, 2018.
Yin, J., Yin, Z., and Xu, S.: Composite risk assessment of typhoon-induced disaster for China's coastal area, Nat. Hazards, 69, 1423–1434, https://doi.org/10.1007/s11069-013-0755-2, 2013.
Yoon, W. S., Yoon, S. H., Moon, J. H., and Hong, J. S.: Topographic Variability during Typhoon Events in Udo Rhodoliths Beach, Jeju Island, South Korea, Ocean and Polar Research, 43, 307–320, 2021.
Yu, J. J., Kim, D., and Yoon, J.: A Study on the Short-term Morphological Beach Changes of Pado-ri Using UAS-based DEM: Focusing on before and after Typhoon Soulik, Journal of the Association of Korean Geographers, 7, 303–317, 2018.
Yum, S.-G., Wei, H.-H., and Jang, S.-H.: Estimation of the non-exceedance probability of extreme storm surges in South Korea using tidal-gauge data, Nat. Hazards Earth Syst. Sci., 21, 2611–2631, https://doi.org/10.5194/nhess-21-2611-2021, 2021.
Zhang, J., Zhang, Z., Chen, J., Chen, H., Jin, J., Han, J., Wang, X., Song, Z., and Wei, G.: Estimating soil salinity with different fractional vegetation cover using remote sensing, Land Degrad. Dev., 32, 597–612, https://doi.org/10.1002/ldr.3737, 2021.
Zhang, X., Wang, Y., Jiang, H., and Wang, X.: Remote-sensing assessment of forest damage by Typhoon Saomai and its related factors at landscape scale, Int. J. Remote Sens., 34, 7874–7886, https://doi.org/10.1080/01431161.2013.827344, 2013.
Zhang, Y., Sun, Y., Hu, Z., Bian, S., Xiong, C., Liu, J., Chi, W., and Zhang, W.: Increase in Suspended Sediment Contents by a Storm Surge in Southern Bohai Sea, China, Math. Probl. Eng., 2022, 9585386, https://doi.org/10.1155/2022/9585386, 2022.