the Creative Commons Attribution 4.0 License.
the Creative Commons Attribution 4.0 License.
 | 23 Jun 2023
Assessing long-term tephra fallout hazard in southern Italy from Neapolitan volcanoes
Manuel Stocchi
Beatriz Martínez Montesinos
Laura Sandri
Jacopo Selva
Roberto Sulpizio
Biagio Giaccio
Massimiliano Moscatelli
Edoardo Peronace
Marco Nocentini
Roberto Isaia
Manuel Titos Luzón
Pierfrancesco Dellino
Giuseppe Naso
Antonio Costa
Nowadays, modeling of tephra fallout hazard is coupled with probabilistic analysis that takes into account the natural variability of the volcanic phenomena in terms of eruption probability, eruption sizes, vent position, and meteorological conditions. In this framework, we present a prototypal methodology to carry out the long-term tephra fallout hazard assessment in southern Italy from the active Neapolitan volcanoes: Somma–Vesuvius, Campi Flegrei, and Ischia.
The FALL3D model (v.8.0) has been used to run thousands of numerical simulations (1500 per eruption size class), considering the ECMWF ERA5 meteorological dataset over the last 30 years. The output in terms of tephra ground load has been processed within a new workflow for large-scale, high-resolution volcanic hazard assessment, relying on a Bayesian procedure, in order to provide the mean annual frequency with which the tephra load at the ground exceeds given critical thresholds at a target site within a 50-year exposure time. Our results are expressed in terms of absolute mean hazard maps considering different levels of aggregation, from the impact of each volcanic source and eruption size class to the quantification of the total hazard. This work provides, for the first time, a multi-volcano probabilistic hazard assessment posed by tephra fallout, comparable with those used for seismic phenomena and other natural disasters. This methodology can be applied to any other volcanic areas or over different exposure times, allowing researchers to account for the eruptive history of the target volcanoes that, when available, could include the occurrence of less frequent large eruptions, representing critical elements for risk evaluations.
- Article
(8483 KB) - Full-text XML
-
Supplement
(3457 KB) - BibTeX
- EndNote


Volcanic eruptions produce a large variety of hazards, which widely span spatial distributions and impact the environment and society. The most frequent and widespread one is tephra fallout, occurring in more than 90 % of all eruptions (e.g., Newhall and Hobblit, 2002; Jenkins et al., 2015). Although large explosive eruptions impacting populated areas are relatively infrequent, the tephra fallout can result in considerable direct and indirect impacts on society, which are a function of the hazards; exposure of assets and living beings; and vulnerability of critical infrastructure (e.g., Spence et al., 2005; Menoni et al., 2012; Wilson et al., 2012, 2017; Jenkins et al., 2015). The effects of tephra dispersal and deposition vary according to the size of the eruption, the distance from the vent, the occurrence of aggregation phenomena, and the wind field at the time of the eruption. Lapilli mostly fall from the buoyant plume within tens of kilometers, while ash travels much further, sometimes draping the landscape with ephemeral deposits that can be remobilized long after the eruption due to resuspension by winds and possible generation of volcaniclastic flows (e.g., Blong, 1984; Sulpizio et al., 2006; Alderton and Elias, 2020). Load from tephra deposits may generate structural damages to buildings (e.g., Spence et al., 2005; Costa et al., 2009; Mingari et al., 2022), disrupt infrastructures (roads, rails, power lines, etc.; e.g., Swords-Daniels, 2011; Wilson et al., 2012; Jenkins et al., 2015), and impinge on agriculture and livestock (e.g., Blong, 1984; Wilson et al., 2012; Sulpizio et al., 2014; Loughlin et al., 2015). The injection of large amounts of ash particles into the atmosphere may also alter climatic conditions (e.g., Rampino and Self, 2000) and strongly affect aviation safety (e.g., Casadevall, 1994; Miller and J., 2000; Sulpizio et al., 2012; Biass et al., 2014), leading to heavy economic loss (e.g., Folch and Sulpizio, 2010; Tesche et al., 2012; Wilson et al., 2014, 2017; Bonadonna et al., 2021).
Volcanoes are intrinsically multi-hazard and multi-risk phenomena, with potential significant interaction among the different phenomena and/or damaging mechanisms (Zuccaro et al., 2013; Selva, 2022). Forecasting the type and size of the next eruption from a given volcano can be achieved only statistically through a probabilistic quantification based on past eruptive activity, analogue volcanoes, and other geological information and should account for the natural variability of physicochemical processes and the potential scarcity of data, as well as the limited knowledge of volcanic systems and their processes (e.g., Marzocchi and Bebbington, 2012; Selva et al., 2018). Such an approach sustains the so-called probabilistic volcanic hazard assessment (PVHA) method based on Bayesian procedures for transforming all the volcanological information into probability distributions, allowing aleatory and epistemic uncertainties to be properly accounted for (e.g., Marzocchi et al., 2004, 2007, 2010).
In the case of tephra fallout, the main uncertainties are due to the high variability in eruptive source parameters (e.g., total erupted mass, mass eruption rate, time duration, vent position, total grain-size distribution) and meteorological conditions. Marzocchi et al. (2010) presented a Bayesian event tree workflow (BET_VH) to calculate the probability of any kind of long-term volcanic hazard from a general prior event to subsequent events, weighting each one with its own probability of occurrence. Input incorporates results from numerical simulations aimed at exploring the potential impact of the volcanic phenomena over a selected area, while output is in the form of hazard maps showing the probabilities associated with exceeding critical hazard thresholds at given locations. Such Bayesian event tree (BET) models have largely been used to assess both long- and short-term hazard assessments (e.g., Selva et al., 2010, 2014; Sandri et al., 2012, 2014; Thompson and Lindsay, 2015; Constantinescu et al., 2016), extending the output to Bayesian hazard curves (Tonini et al., 2015).
PVHA is often computed for single volcanoes. On the contrary, in many other fields, the hazard is computed by integrating over all the potential sources, as the interest is not in the source (e.g., probability of an earthquake), but in the occurrence of the dangerous phenomenon (e.g., ground shaking) from whatever source (e.g., Cornell, 1968).
Other geohazards, such as for probabilistic tsunami hazard assessment (PTHA) or probabilistic seismic hazard assessment (PSHA) methodologies, provide a framework for assessing the exceedance probability of a given measure of the intensity of the phenomena (e.g., tsunami wave height, peak ground acceleration) at a particular location within a given time window.
As for volcanic eruptions, historical catalogs are usually incomplete, and therefore a computational scheme is usually adopted, based on the combination of probabilistic source models and empirical or numerical models of propagation of the hazardous phenomena (e.g., Grezio et al., 2017; Gerstenberger et al., 2020). Sometimes, the explicit numerical modeling of individual scenarios is required, like in the case of tsunamis or volcanic eruptions (e.g., Selva et al., 2016; Grezio et al., 2017). In all cases, a common description based on the quantification of the mean annual rates of exceedance is possible, making possible an explicit comparison among the different hazards and consequent risks (e.g., Grunthal and Wahlstrom, 2006; Marzocchi et al., 2012). Besides volcanic activity, other geohazards (such as landslides, meteorological events) could be treated within the same computational framework.
In volcanology, this is complicated by the fact that volcanic systems may be very different to each other and may experience different phases of activity, complicating the potential homogeneous integration of different volcanoes in the same hazard quantification (Selva et al., 2022). To this end, some studies applied methodologies to rank multiple volcanoes according to their hazards (e.g., Aspinall et al., 2011; Auker et al., 2015) or their population exposure (e.g., Small and Naumann, 2001; Freire et al., 2019). Jenkins et al. (2022) quantified and ranked exposure to multiple volcanic hazards for 40 volcanoes in southeast Asia, showing which of these volcanoes may have been overlooked because of not being frequently (or recently) active but with the potential to affect large numbers of people and assets. Other studies accounted for multi-hazards (i.e., lava flows, pyroclastic density currents, fallout, tsunami waves, earthquakes) for a single volcano, typically for volcanic islands (e.g., Becerril et al., 2014; Selva et al., 2019).
The Neapolitan area represents one of the highest volcanic risk areas in the world due to the presence of three active and potentially explosive volcanoes and the extremely high exposure (over 3 million people living in the metropolitan area; https://www.cittametropolitana.na.it/, last access: 16 June 2023). Previous studies assessed tephra fall hazard from Neapolitan volcanoes, combining field data and numerical simulations and calculating conditional ash load probability maps for one or a few reference volcanic scenarios (e.g., Barberi et al., 1995; Cioni et al., 2003; Macedonio et al., 2008; Costa et al., 2009; Folch and Sulpizio, 2010; Sulpizio et al., 2012). This approach was very useful to support civil protection emergency plans (e.g., Emergency Plan of Vesuvius; Dipartimento di Protezione Civile, 2019), and it is computationally less expensive and more feasible for near-real-time applications (e.g., Selva et al., 2014). However, it had limitations in representing the full volcanic hazard because uncertainty only accounted for wind conditions (e.g., Macedonio et al., 2008, 2016) but not for the full range of eruptive style, magnitude, and frequency. Furthermore, a single eruptive scenario is not appropriate to achieve an unbiased PVHA (e.g., Selva et al., 2010; Sandri et al., 2016). For this purpose, the analysis of the intra-scenario variability is certainly more complete, allowing a reduction of the epistemic uncertainty (e.g., Selva et al., 2014, 2018; Sandri et al., 2016; Titos et al., 2022; Martinéz Montesinos et al., 2022).
In recent PVHAs at the Neapolitan volcanoes, the importance of quantifying uncertainty has largely been addressed. For instance, Sandri et al. (2016) proposed a stratified sampling procedure to fully explore the intra-size-class aleatory variability, comparing the results with the classical approach based on reference volcanic scenarios, in the case of proximal and medial areas and large tephra loads from Somma–Vesuvius and Campi Flegrei.
It is worth noting that with the term “eruption size class” we referred to the broad range of possible eruptive sizes identified by the total erupted mass, which is used to define the eruption magnitude. Following Sandri et al. (2016), we consider splitting the eruptive size range into a few classes that can be linked to representative members like the classical approach used in past studies. These classes ideally span the general range continuously, whereas representative members, by definition, discretize it. In this regard, the intra-size-class variability represents the aleatory variability due to combinations of parameters characterizing eruptions which belong to the same eruptive class. Moreover, Selva et al. (2018) provided unbiased tephra fallout hazard estimations at Campi Flegrei by using ensemble modeling of alternative choices related to the treatment of submarine eruptive vents and tephra total grain-size distributions considering different mass fractions of ash and percentages of ash aggregates. Since high-performance computational resources are more and more available, Martinéz Montesinos et al. (2022) proposed a new workflow that was applied to Campi Flegrei, aiming at performing robust and unbiased short- and long-term PVHA on a large-scale (thousands of km) and high-resolution (about 2 km) domain, to be used by civil protection agencies, aviation companies, and other stakeholders. However, all these studies provide output PVHA for single volcanoes and do never merge into a single quantification the contribution of the three active volcanoes in the Neapolitan area: Somma–Vesuvius, Campi Flegrei, and Ischia.
A breakthrough study in providing the estimation of the present state of the Neapolitan volcanoes has been proposed by Selva et al. (2022) through the development of a simple physics-based statistical model that satisfactorily fits the eruptive history of all the Neapolitan volcanoes, accounting for potential changes in their eruptive regime. The model is compatible with existing data (including isolated events and long repose periods) and accounts for two activity regimes (high–low) able to describe the temporal modulations in eruptive activity. Thus, the model can provide a homogeneous quantification of the probability of eruption, which takes into account the state of the volcano and the possible transitions. Such estimations do not account for monitoring data or potential state of unrest, as these types of information have been recorded only in the last few decades, while they are obviously missing along the rest of the eruptive history, but they provide a homogeneous input for long-term volcanic hazard.
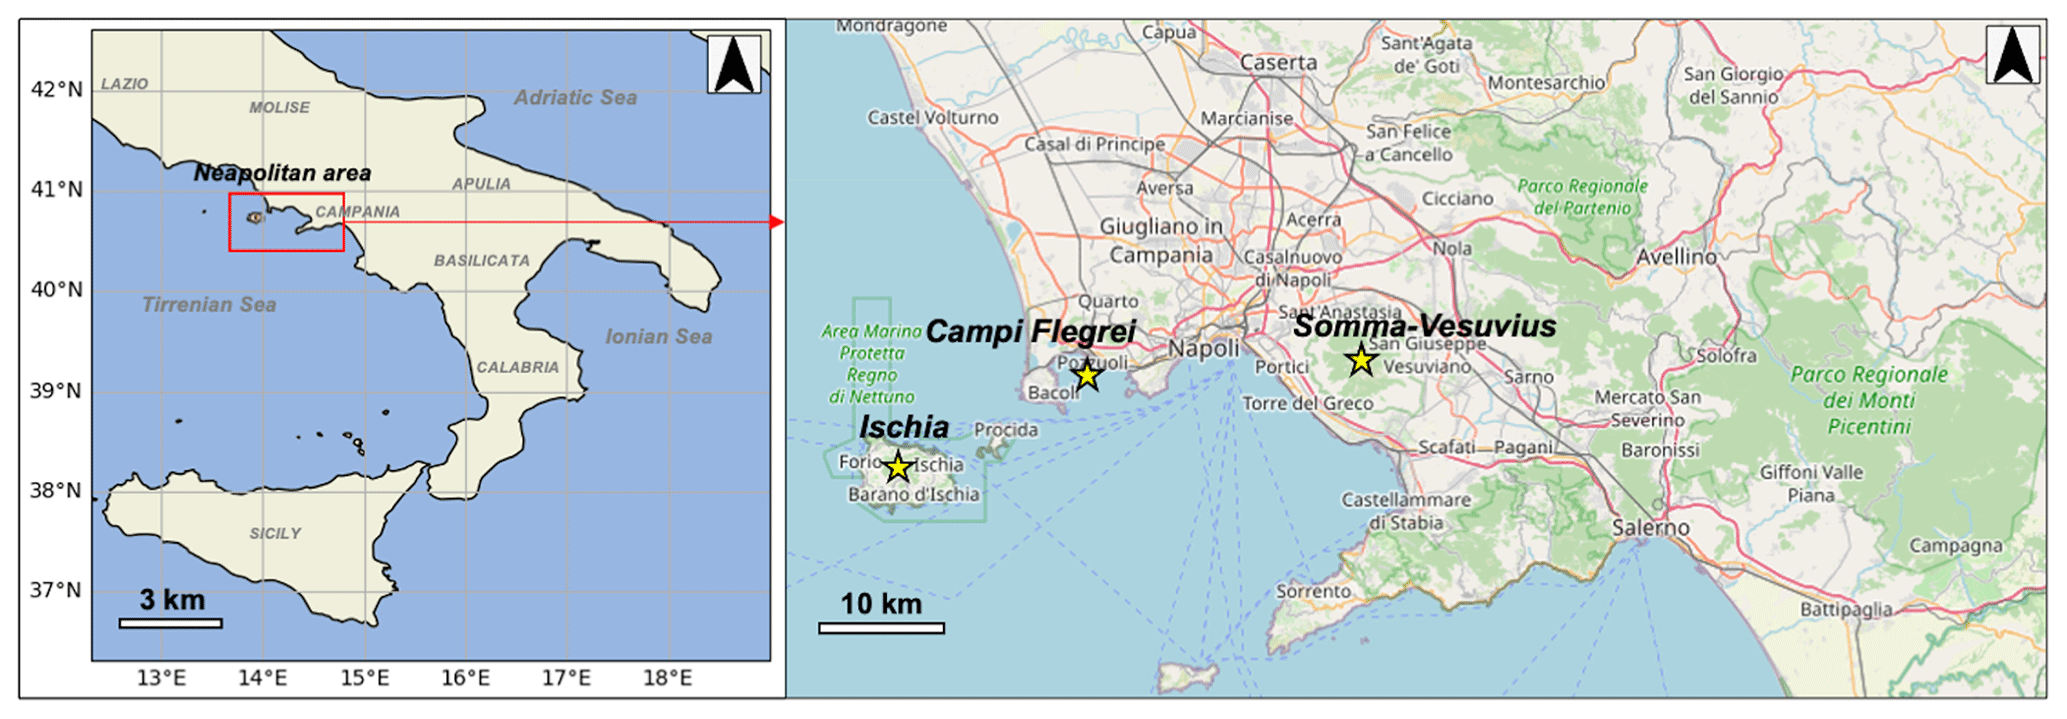
Figure 1Map showing the computational domain (southern Italy) used in the numerical simulations with a magnification of the Neapolitan area. The Somma–Vesuvius, Campi Flegrei, and Ischia volcanoes are indicated as yellow stars. Original map data are available from https://www.openstreetmap.org#map=9/-2.0475/28.5535 (last access: 16 June 2023) OpenStreetMap contributors 2022. Distributed under the Open Data Commons Open Database License (ODbL) v1.0 ©(OpenStreetMap contributors, 2022).
In this work, by merging the model of Selva et al. (2022) into the new PVHA workflow developed by Martinéz Montesinos et al. (2022), we provide a prototypical methodology for long-term tephra fallout hazard assessment on a large-scale domain (southern Italy) at 3 km resolution, combining the impacts of the three active Neapolitan volcanoes. Since the statistical evaluation of the fallout hazard requires us to take into account a wide spectrum of different volcanic scenarios, we explored the intrinsic variability of the explosive eruptions by performing a large number of numerical simulations of tephra dispersion from each volcano, considering the wind patterns over the last 30 years. All simulations were combined to calculate the averaged return period (ARP) of overcoming different tephra load thresholds within a 50-year exposure time. Then, we applied hazard disaggregation (Bazzurro and Cornell, 1999) to quantitatively evaluate the importance of the different volcanoes and different eruptive sizes in the different target areas. This technique, which is widely used in seismic and tsunami hazard analyses in volcanology, can provide important clues about many choices made whenever specific eruptive scenarios were chosen or when high/low priority was given to one or to another volcanic source or size. In this regard, the outcomes of this study add new insights into volcanic risk assessment in southern Italy. In the following, we present the eruptive history of the Neapolitan volcanoes (Sect. 2), the methodology (Sect. 3), and the discussion of the obtained results (Sect. 4), followed by the conclusions (Sect. 5).
2.1 Somma–Vesuvius
The Somma–Vesuvius volcanic complex (Fig. 1) consists of an older volcano, Mt. Somma, dissected by a summit caldera, in which the Vesuvius cone grew after the 472 CE eruption (Santacroce et al., 2008). Four Plinian eruptions associated with caldera collapses repeatedly truncated the Somma volcanic edifice, forming the present-day summit caldera (e.g., Cioni et al., 1999; Santacroce et al., 2008). These are the Pomici di Base (22.03 ± 0.18 cal kyr BP; Santacroce et al., 2008), Mercato (8.89 ± 0.09 cal kyr BP; Mele et al., 2011), Avellino (3.90 ± 0.04 cal kyr BP; Sevink et al., 2011), and Pompeii (79 CE; Sigurdsson and Carey, 1985) eruptions. Sub-Plinian eruptions occurred at 19.1 cal kyr BP (Greenish; Cioni et al., 2003), between Avellino and Pompeii eruptions (APs; Andronico and Cioni, 2002), in 472 CE (Sulpizio et al., 2005) and in 1631 CE (Rosi et al., 1993). The most recent cycle of Vesuvius activity between 1631 CE and 1944 was characterized by recurrent summit and lateral lava effusions associated with semi-persistent and mild explosive activities, interrupted by quiescence periods lasting from months to a maximum of 7 years (Santacroce, 1987; Cioni et al., 2008). During this period, Vesuvius produced a few violent Strombolian eruptions, such as in 1822 CE, 1906 CE, and 1944 CE (e.g., Arrighi et al., 2001; Cole and Scarpati, 2010).
2.2 Campi Flegrei caldera
The Campi Flegrei caldera (Fig. 1) results from at least two main nested collapses related to the Campanian Ignimbrite (CI; 40 ka; e.g., Orsi et al., 1996; De Vivo et al., 2001; Giaccio et al., 2017) and Neapolitan Yellow Tuff (NYT; 15 ka; e.g., Deino et al., 2004) eruptions. A magnitude 6.6 eruption (corresponding to a volcanic explosivity index (VEI) = 6) occurred at about 29 ka (Albert et al., 2019). In the last 15 kyr, volcanism occurred within the NYT caldera in three main epochs of activity (Epoch I, II, and III) dated between 15–9.5, 8.6–8.2, and 4.8–3.8 ka, respectively (Orsi et al., 2004). After a long quiescence, the last eruption generated the Monte Nuovo tuff cone in 1538 CE (e.g., Di Vito et al., 1999; Costa et al., 2022). Most of the explosive eruptions were low- or medium-magnitude events with products dispersed over areas ranging from a few to 500 km2, while the highest-magnitude Plinian events such as Pomici Principali (12.4 cal kyr BP; Sulpizio et al., 2010) and Agnano-Monte Spina (AMS; 4.5 cal kyr BP; de Vita et al., 1999; Sulpizio et al., 2010) dispersed their products over areas > 1000 km2 (Orsi et al., 2009).
2.3 Ischia
Ischia is a volcanic island located in the northwestern part of the Gulf of Naples (Fig. 1; Orsi et al., 1996), characterized by alternating effusive and explosive eruptions (e.g., Selva et al., 2019). Volcanism at Ischia dates back to more than 150 ka and continued with centuries to millennia of quiescence, until the most recent eruption occurred in 1302 CE (e.g., Vezzoli and Barberi, 1988; Sbrana and Toccaceli, 2011; Sbrana et al., 2018). A poorly defined period of pyroclastic activity predated the large Mt. Epomeo Green Tuff caldera-forming eruption (55 ka; Civetta and Gallo, 1991), which was followed by resurgence (Orsi et al., 1991). Volcanism continued up to 33 ka with a series of explosive eruptions of trachytic magmas from the present southwestern and northwestern periphery of the island. After 5 kyr of quiescence volcanism resumed at about 28 ka with the eruption of trachybasaltic magma along the southeastern coast and then continued sporadically until 18 ka. The most recent period of activity began at about 10 ka, but it is mainly concentrated in the past 2.9 kyr, with almost all the vents in the eastern part of the island (Selva et al., 2019). At least 35 effusive and explosive eruptions took place, emplacing lava domes, high-aspect ratio lava flows, tuff cones, tuff rings, and variably dispersed fallout and pyroclastic density current deposits. The most significant recent explosive eruption is the Cretaio eruption that occurred in the 1st century CE(Orsi et al., 1996; Selva et al., 2019).
3.1 PVHA strategy
Similarly to seismic or tsunami hazard (PSHA or PTHA, respectively), PVHA should, in principle, aggregate the contribution of the different sources, quantifying the exceedance probability or the mean annual frequency of a specific seismic threshold at a specific location in a given exposure time window (e.g., Grezio et al., 2017; Gerstenberger et al., 2020, and references therein). Translated into the volcanic context, we implemented the PVHA related to a set S of volcanoes by calculating the mean annual frequency with which a certain hazardous phenomenon quantified by the intensity measure z (tephra load at the ground, in our case) exceeds the threshold Z at a geographical location x during a given exposure time window ΔT. Following Martinéz Montesinos et al. (2022) and Selva et al. (2022), we quantify by
where
-
νi represents the annual rate of occurrence of eruptions from the volcano i for the exposure time ΔT. The evaluation of this parameter is discussed in Sect. 3.3.
-
Considering for each volcano a set of possible eruptive size classes, P(σik|Ei) represents the probability that, in the case of eruption E from the volcano i, it will be of size class k (σik). For Somma–Vesuvius, we considered three eruptive (explosive) size classes proposed by Sandri et al. (2016): small (in which the 1906 CE and 1944 CE eruptions are included; Arrighi et al., 2001; Cole and Scarpati, 2010), medium (in which the 472 CE and 1631 CE eruptions are included; Sulpizio et al., 2005; Rosi et al., 1993), and large (in which the Pompei and Avellino eruptions are included; Macedonio et al., 2008; Sulpizio et al., 2010). For Campi Flegrei, the three explosive eruption size classes adopted in Sandri et al. (2016) and Selva et al. (2018) are considered again: small (e.g., Averno 2; Di Vito et al., 2011), medium (e.g., Astroni 6; Mele et al., 2020), and large (e.g., Agnano Monte Spina; de Vita et al., 1999). Ischia has one eruption size class defined as large, representing the Cretaio Tephra (ca. 60 CE; Orsi et al., 1992, 1996), which is the largest explosive eruption that occurred in the last 3 kyr beside 33 other eruptions of lower intensity (de Vita et al., 2010; Selva et al., 2019, 2022; Primerano et al., 2021). We only considered this class because the Cretaio Tephra is the best-characterized eruption in terms of eruptive source parameters (ESPs; Primerano et al., 2021) and represents the only eruptive scenario which can have a significative impact beyond the island (Selva et al., 2019). The parameters related to all eruption size classes are reported in Table A1. The probability of the different size classes corresponds to node 5 of the BET model (Marzocchi et al., 2007, 2010), and it is here evaluated jointly to νi:
-
Considering for each volcano a set of possible eruptive vent locations, P(γij|Ei) represents the probability of the vent activation γij, conditional to the occurrence of the eruption E from the volcano i. For Somma–Vesuvius, being a stratovolcano, a single vent location is fixed on the present-day crater, since the recurrence of the recent eruptions started from there, and the likelihood of different vent positions is an order of magnitude smaller (Sandri et al., 2018). At Ischia, the majority of eruptive vents are preferentially distributed along the NS direction; therefore we fixed a single vent corresponding to the source of the Cretaio Tephra (Primerano et al., 2021), assuming that the spatial probability on vent locations would not affect the tephra ground load at distal areas on land in the target domain (Fig. 1). For Campi Flegrei, given the dimensions of the caldera with respect to its proximal locations in the target domain (Fig. 1), tephra dispersion is simulated from an equally spaced grid of potential vents having a different probability of opening (conditional to the occurrence of an eruption) based on the geological and geomorphological features of the past eruptive vents opened in the last 5000 years (Selva et al., 2012). This probability corresponds to node 4 in the BET methodology, used for example in Selva et al. (2012) and Martinéz Montesinos et al. (2022);
-
represents the probability that a tephra load z exceeds the threshold Z at the target location x due to the eruption E of size class σik from the vent γij from the volcano i, conditional to the occurrence of such an eruption. To calculate this probability, simulations of tephra dispersion and deposition were performed with FALL3D-8.0 (Folch et al., 2020) using as weather conditions those retrieved from the ECMWF ERA5 database (Hersbach et al., 2018) with a spatial resolution of and a temporal resolution of 3 h. These data were randomly sampled considering 50 d yr−1 from 1 January 1991 to 31 December 2020 so that the simulation days are homogeneously distributed within the 30-year time span. Adopting the approach proposed in (), each simulation represents a volcanic scenario characterized by a set of eruptive source parameters that are randomly sampled from their probability density functions (Tables A1, A2, A3). For each volcano, 1500 volcanic scenarios were assigned to each eruption size class. In this way, the total number of simulations is 10 500 simulations (4500, Somma–Vesuvius; 4500, Campi Flegrei; 1500, Ischia). This probability corresponds to nodes 7 and 8 in the BET methodology used, for example, in Selva et al. (2012), Tonini et al. (2015), and Martinéz Montesinos et al. (2022).
In this way, the mean annual frequency to have a tephra load z overcoming a threshold Z at location x during the 50-year exposure time ΔT from the Neapolitan volcanoes is computed. The curve as a function of the threshold Z represents the final result of PVHA in each target point x, and it is usually referred to as the hazard curve. This is replicated all over the computational domain, which here covers southern Italy. Whenever alternative quantifications of one or more of the parameters in Eq. (1) exist, they jointly represent an estimation of the epistemic uncertainty (see Marzocchi et al., 2021, and references therein).
The specific contribution of each volcano, each eruptive size at one volcano, or whatever other definition of a group of potential eruptions may be quantitatively evaluated using the hazard disaggregation strategy discussed in Bazzurro and Cornell (1999). This method consists of evaluating the probability that the occurrence of a given exceedance (z>Z) is caused by a given group of sources (G), , based on the Bayes rule. Since this evaluation reduces to the quantification of specific ratios of the addends of Eq. (1), it can always be quantified, and thus it nowadays represents a standard post-processing tool for probabilistic hazard, especially seismic hazard.
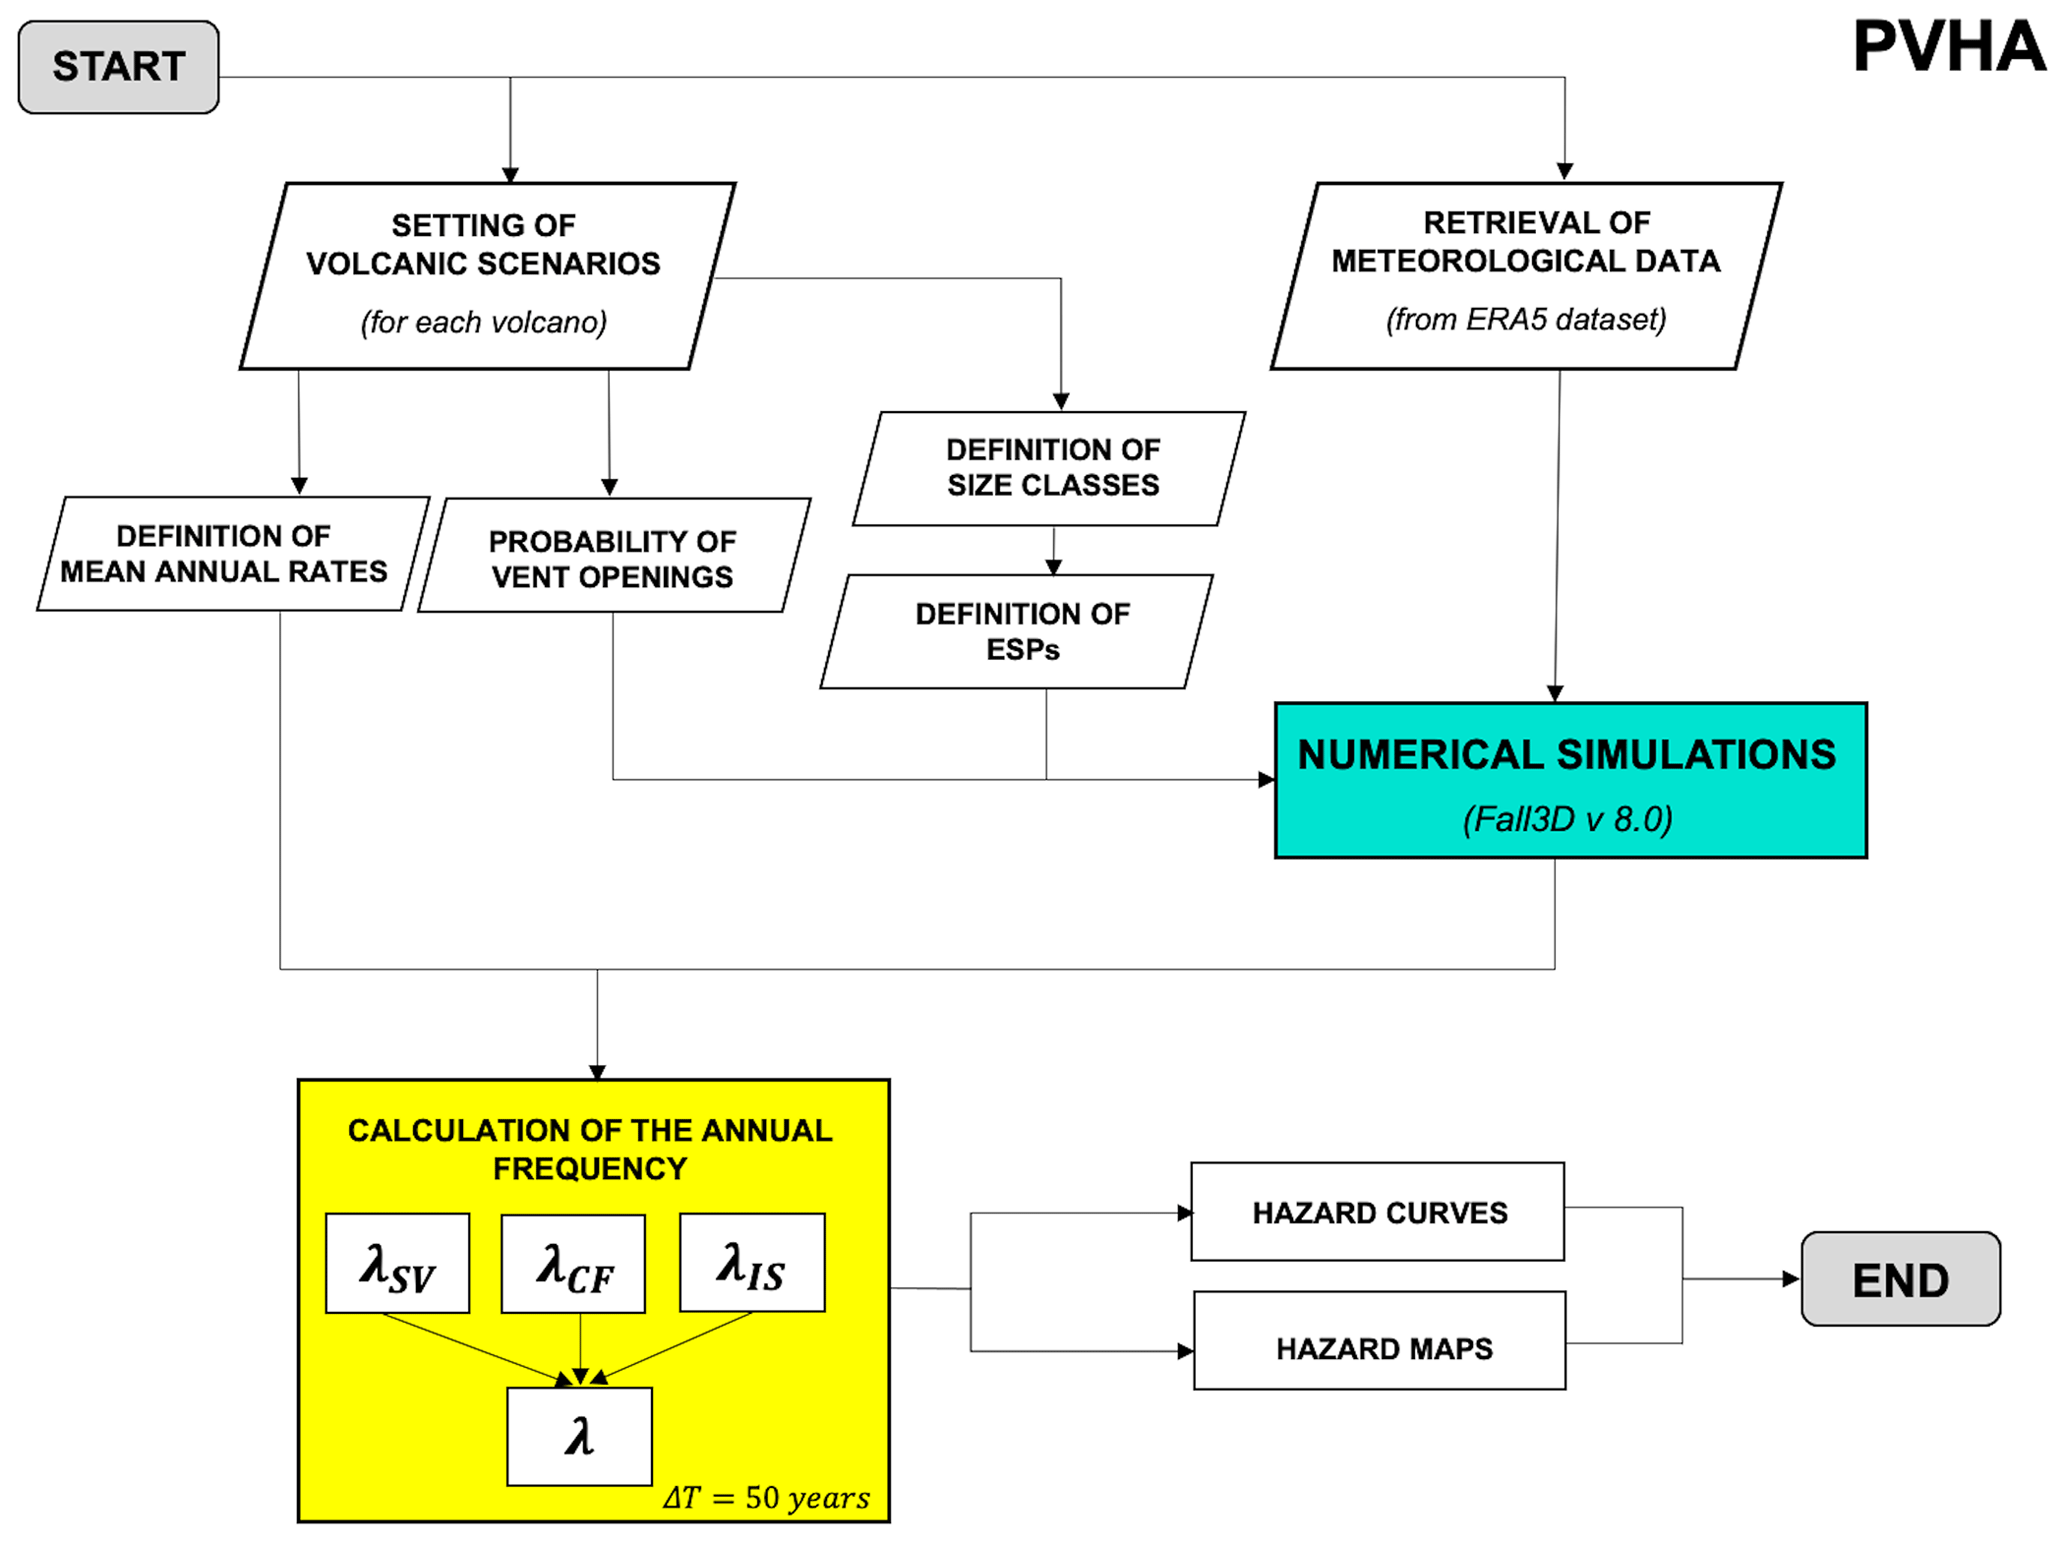
Figure 2Workflow of the PVHA strategy used to provide the calculation of the annual frequency of exceeding a specific intensity threshold value at the target site in 50 years associated with tephra fallout from the Neapolitan volcanoes and the relative hazard curves and maps.
3.2 Tephra dispersion modeling
In this study, we used FALL3D-8.0 (Folch et al., 2020), the Eulerian tephra dispersion model based on the so-called advection–diffusion–sedimentation (ADS) equations, for simulating dispersion of volcanic tephra, gas, and radionuclides, with a wide range of possible model parameterization options (e.g., eruptive parameters, source model, ash aggregation, domain discretization), including the possibility to describe the gravitational spreading of the umbrella region (Costa et al., 2013). In the used version (v8.0) the parallelization strategy, input/output (I/O), model pre-process workflows, and memory management have been improved, leading to a better code scalability, efficiency, and an overall capability to handle much larger problems. The outputs are time-dependent loads at the ground and atmospheric ash concentrations.
In this work, simulations were performed on the HPC cluster ADA of the Istituto Nazionale di Geofisica e Vulcanologia, Bologna (Italy). We run one simulation per sampled day in order to cover all possible daily and seasonal meteorological conditions over the last 30 years.
The eruptive source parameters represent the main volcanological inputs in the model, which are described in detail in Tables A1, A2, and A3. In Table A4 we report the summary of the key model parameters which are not dependent on the eruption size class (Appendix A).
The total time spent for each simulation varies according to the duration of the eruption, which depends on the eruption size class, although the model runs for 24 additional hours after the source term is switched off, given the large size of the target domain: this is necessary in order to ensure that most of the remaining airborne material has sufficient time to settle or to leave the computational domain through the lateral boundaries. We considered a spherical projection computational domain from 36.31 to 42.61∘ N in latitude and from 12.31∘ W to 19∘ E in longitude, with a 0.03 ∘ resolution gridded domain and a vertical σ coordinate system with a linear decay (Fig. 1).
3.3 Construction of hazard curves and maps
In this study, hazard intensity represents tephra accumulated on the ground per unit area, typically expressed in kg m−2 (e.g., Sandri et al., 2016). As discussed in Sect. 3.1, we quantify the hazard as the mean annual frequency of exceeding a specific intensity threshold value at the target site x in 50 years, due to the activity of the three Neapolitan volcanoes. As discussed in Selva et al. (2022), the probability of the different sizes at each volcano P(σik|Ei) may significantly vary through time, as the regime of the volcanoes changes. For example, at Somma–Vesuvius during open-conduit periods, small sizes are favored, while large explosive eruptions are mainly expected during close-conduit periods. On the contrary, it is possible to quantify the average annual eruption rate of the eruption size class k of the volcano i as
considering the potential switch between regimes and the different size distributions in each region (Selva et al., 2022). To account for this, the contribution of volcano i in Eq. (1) can easily be rewritten as
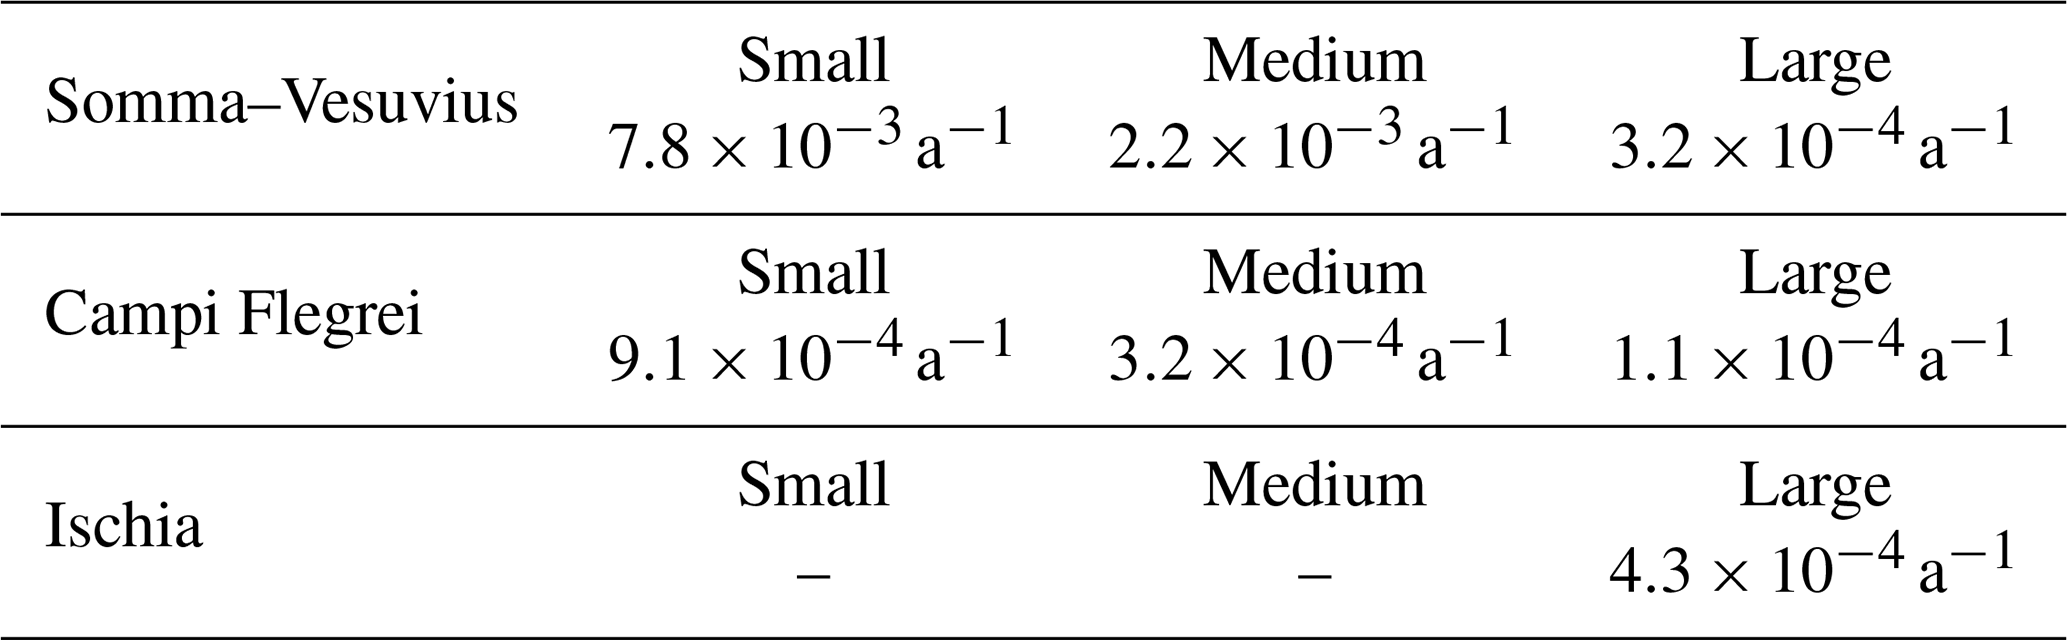
The quantification of νik was based on the recorded activities of the Neapolitan volcanoes in the last 2 kyr for Somma–Vesuvius, 15 kyr for Campi Flegrei, and 3 kyr for Ischia, assuming a non-homogeneous Poisson model because volcanoes randomly oscillate through time between two discrete regimes with different size distributions (Selva et al., 2022). For short ΔT (e.g., shorter than 100 years), νik varies depending on the initial state of the volcano and the length of ΔT, due to the persistence of the volcano in its initial state. Indeed, during short ΔT the state of the volcanic activity is not likely to change; on the contrary, the longer the ΔT, the larger is the probability to change the regime. In Table C1, we report the values of νik for Somma–Vesuvius, Campi Flegrei, and Ischia in 50 years. The rates νik intrinsically account for the aleatory uncertainty in eruption occurrence, changes in the regime, and consequent eruption size distribution (Selva et al., 2022). Alternative models do not exist, so the epistemic uncertainty in these values is not quantified here.
The probabilities P(γij|Ei) and were calculated using the BET workflow at node 4 (vent opening) and nodes 7 and 8 (tephra reaching point z – tephra load overcoming threshold Z), respectively. The BET model formally accounts for potential epistemic uncertainty in the probability at each node. However, this may be severely underestimated whenever alternative approaches do produce significantly different results (Marzocchi et al., 2021). For this reason, the epistemic uncertainty is neglected, and only the average probabilities are evaluated.
Simulations were post-processed for each eruption size class in order to quantify the mean annual frequencies of exceeding a given accumulation of tephra on the computational domain (see Fig. 1) in 50 years. The relative hazard maps were built by assessing a mean hazard curve in each point, considering 16 intensity thresholds from 1 to 1600 kg m−2, which roughly correspond to thicknesses from 1 mm to 1.6 m (considering a typical deposit density of 1600 kg m−3).
Generally, values of ∼1 and are referred to as non-conservative and conservative bounds for airport disruption (e.g., Folch and Sulpizio, 2010; Sulpizio et al., 2012). In the Neapolitan area, the typical thresholds of 200, 300, and 400 kg m−2 are used for roof collapses (e.g., Pareschi et al., 2000; Orsi et al., 2004; Spence et al., 2005). According to these references, here we considered two tephra load thresholds: 10 kg m−2 (∼1 cm) and 300 kg m−2 (∼30 cm). In Fig. 2 we summarize the workflow of the PVHA strategy used in this study.
3.4 Hazard disaggregation
From a multi-volcano hazard assessment perspective, establishing which volcano contributes the most to the hazard at a given location, assuming that a threshold is overcome, is crucial; equally relevant is assessing which eruption size class provides the largest contribution exceeding a given threshold. These issues can be addressed throughout hazard disaggregation analysis as detailed in the following.
The hazard disaggregation scheme permits us to post-process hazard results to display the relative contributions of the different source to the hazard. The contribution of each individual source depends on many factors, like the size and the position of the event, the annual rates of each specific size and position, and the propagation. These are all ingredients of the hazard, but their combination and their balance are not trivial at all. For example, is the hazard impact higher in one unlikely big event or a more likely smaller event with favorable wind? Is the hazard impact higher in one unlikely event in a location usually upwind or a more likely event in a location usually downwind but with a rare variable wind direction? To answer these questions, the only solution is to post-process the hazard combination and balance the different contribution.
3.4.1 Hazard disaggregation by volcanic source
The hazard disaggregation was originally developed to analyze the importance of the different seismic source regions on the seismic probabilistic hazard assessment (SPHA). In this study, it is used to calculate the contribution to the total hazard in each target point of each volcanic source. This intrinsically accounts for both the probability of eruption and the probability that each specific eruption propagates from the source to the target point.
At first, the disaggregation is evaluated for individual volcanoes. In this case, we evaluate , which is the probability that, given the observation of the exceedance of a given threshold Z, this has been caused by an eruption E from the volcano i. To simplify its interpretation, we name this probability dominance Di in a given spatial point x.
Following Bazzurro and Cornell (1999), this probability can be calculated by simply evaluating the ratio of the mean annual frequency of overcoming a given threshold Z in x from that volcano (λi, see Eq. 3) to the mean annual frequency obtained by the sum of the impacts of the three volcanoes in 50 years, which is
To be meaningful, this calculation must be carried out upon a statistically significant number of simulations overcoming such a tephra load threshold; therefore we focus our attention only on a sub-domain, neglecting the distal areas that are reached by a number of simulations less than 101.5 (ca. 30 simulations).
3.4.2 Hazard disaggregation by eruption size class
This kind of disaggregation is performed by calculating, for Somma–Vesuvius and Campi Flegrei only (since Ischia has only one explosive size), the hazard contribution of the different eruption size classes considered. In this case, we first quantify the probability of overcoming the tephra threshold Z due to the occurrence of an eruption E from the volcano i having the eruption size class σik. As in Eq. (4), we express this disaggregation in terms of relative dominance of eruption size class Dik, evaluated as
Notably, the summation in the dividend is not extended to i, meaning that each volcano is treated separately.
4.1 Long-term hazard maps
In this section, we report the results of the PVHA and different levels of disaggregation, from the total hazard assessment of the volcanic sources to the evaluation of the impact due to each volcano obtained by aggregating their eruption size classes.
Generally, hazard curves may be expressed in terms of ARP, which is the inverse of the mean annual frequency. For the sake of simplicity, the most likely values of the ground tephra load occur frequently and may be associated with relatively short ARPs (e.g., 100 years), while a larger Z is exceeded more rarely, corresponding to longer ARPs.
In Fig. 3 the long-term mean hazard maps considering each volcano individually (Fig. 3a–c) and the total mean hazard maps obtained by aggregating the effect of each volcano (Fig. 3d) (see Eq. 4) are shown. Maps are obtained by cutting hazard curves at three different ARPs of 100, 500, and 1000 years, respectively, and reporting in each point of the domain the corresponding tephra load.
At Somma–Vesuvius (Fig. 3a) we show that, for an ARP of 100 years, tephra loads range from ∼100 to 300 kg m−2 in proximity to the volcano, decreasing to 1–10 kg m−2 within ∼250 km. At an ARP of 500 years, higher loads are obviously expected (300–1000 kg m−2 within ∼100 km); at larger distances the maximum tephra load expected with ARP=500 years is 100 kg m−2. For the remaining part of the domain, the expected tephra load with this ARP is ∼ 1–10 kg m−2. For an ARP of 1000 years, the boundaries of tephra load isolines are larger than the previous ones, as expected, covering almost the entire computation domain.
At Campi Flegrei (Fig. 3b), the expected tephra load with an ARP of 100 years ranges from 1 to 100 kg m−2 only in the proximity of the caldera. This is partly due to the uncertainty in the vent position that “blurs” the resulting hazard maps, although offering a more realistic degree of knowledge on future eruptions (Sandri et al., 2016; Massaro et al., 2022). Higher values of tephra loads (from 1 to 500 kg m−2) are expected when ARP is 500 years, decreasing with distances larger than ∼ 80 km. For an ARP of 1000 years, the expected tephra load is higher in the proximity of Campi Flegrei, reaching ∼ 1–10 kg m−2 within ∼ 50 km.
For Ischia, Fig. 3c shows that non-negligible tephra load (between 10 and 300 kg m−2) is only expected on the island when ARP is 100 years; for an ARP of 500 and 1000 years, the highest tephra loads on the Italian mainland are expected around Ischia and the Campi Flegrei area, decreasing up to a range of 1–10 kg m−2 for distances between ∼ 100–170 km.
The total long-term mean hazard maps (Fig. 3d) are obtained by summing the three individual hazard curves (Eq. 1) and cutting the resulting total hazard curve. This corresponds to assuming the independence between different volcanoes. For an ARP of 100 years, areas surrounding the volcanic sources are exposed to tephra loads from 300 to 1000 kg m−2; loads of ∼ 200–100 kg m−2 are expected within ∼ 150 km, decreasing up to 1–10 kg m−2 at ∼ 250 km. For ARPs of 500 and 1000 years, the boundaries of the tephra load isolines become larger with respect to the previous ones, as expected.
We stress that the fringed edges of the distal tephra load are due to a numerical artifact depending on the low number of simulations reaching the targets on the computational domain (Fig. 3).
Somma–Vesuvius shows the largest expected tephra load for all ARPs because its mean annual rate of eruptions is higher by 1 order of magnitude than those of Campi Flegrei and Ischia (Selva et al., 2022; Table C1). Indeed, Campi Flegrei and Ischia are responsible for an expected tephra load only in the proximity of their vents for longer ARPs (500–1000 years). We also remark that the long-term hazard maps show the aleatory uncertainty since, for each volcano, we used the mean annual rate νik corresponding to each eruption size class for a time exposure of 50 years (Table C1).
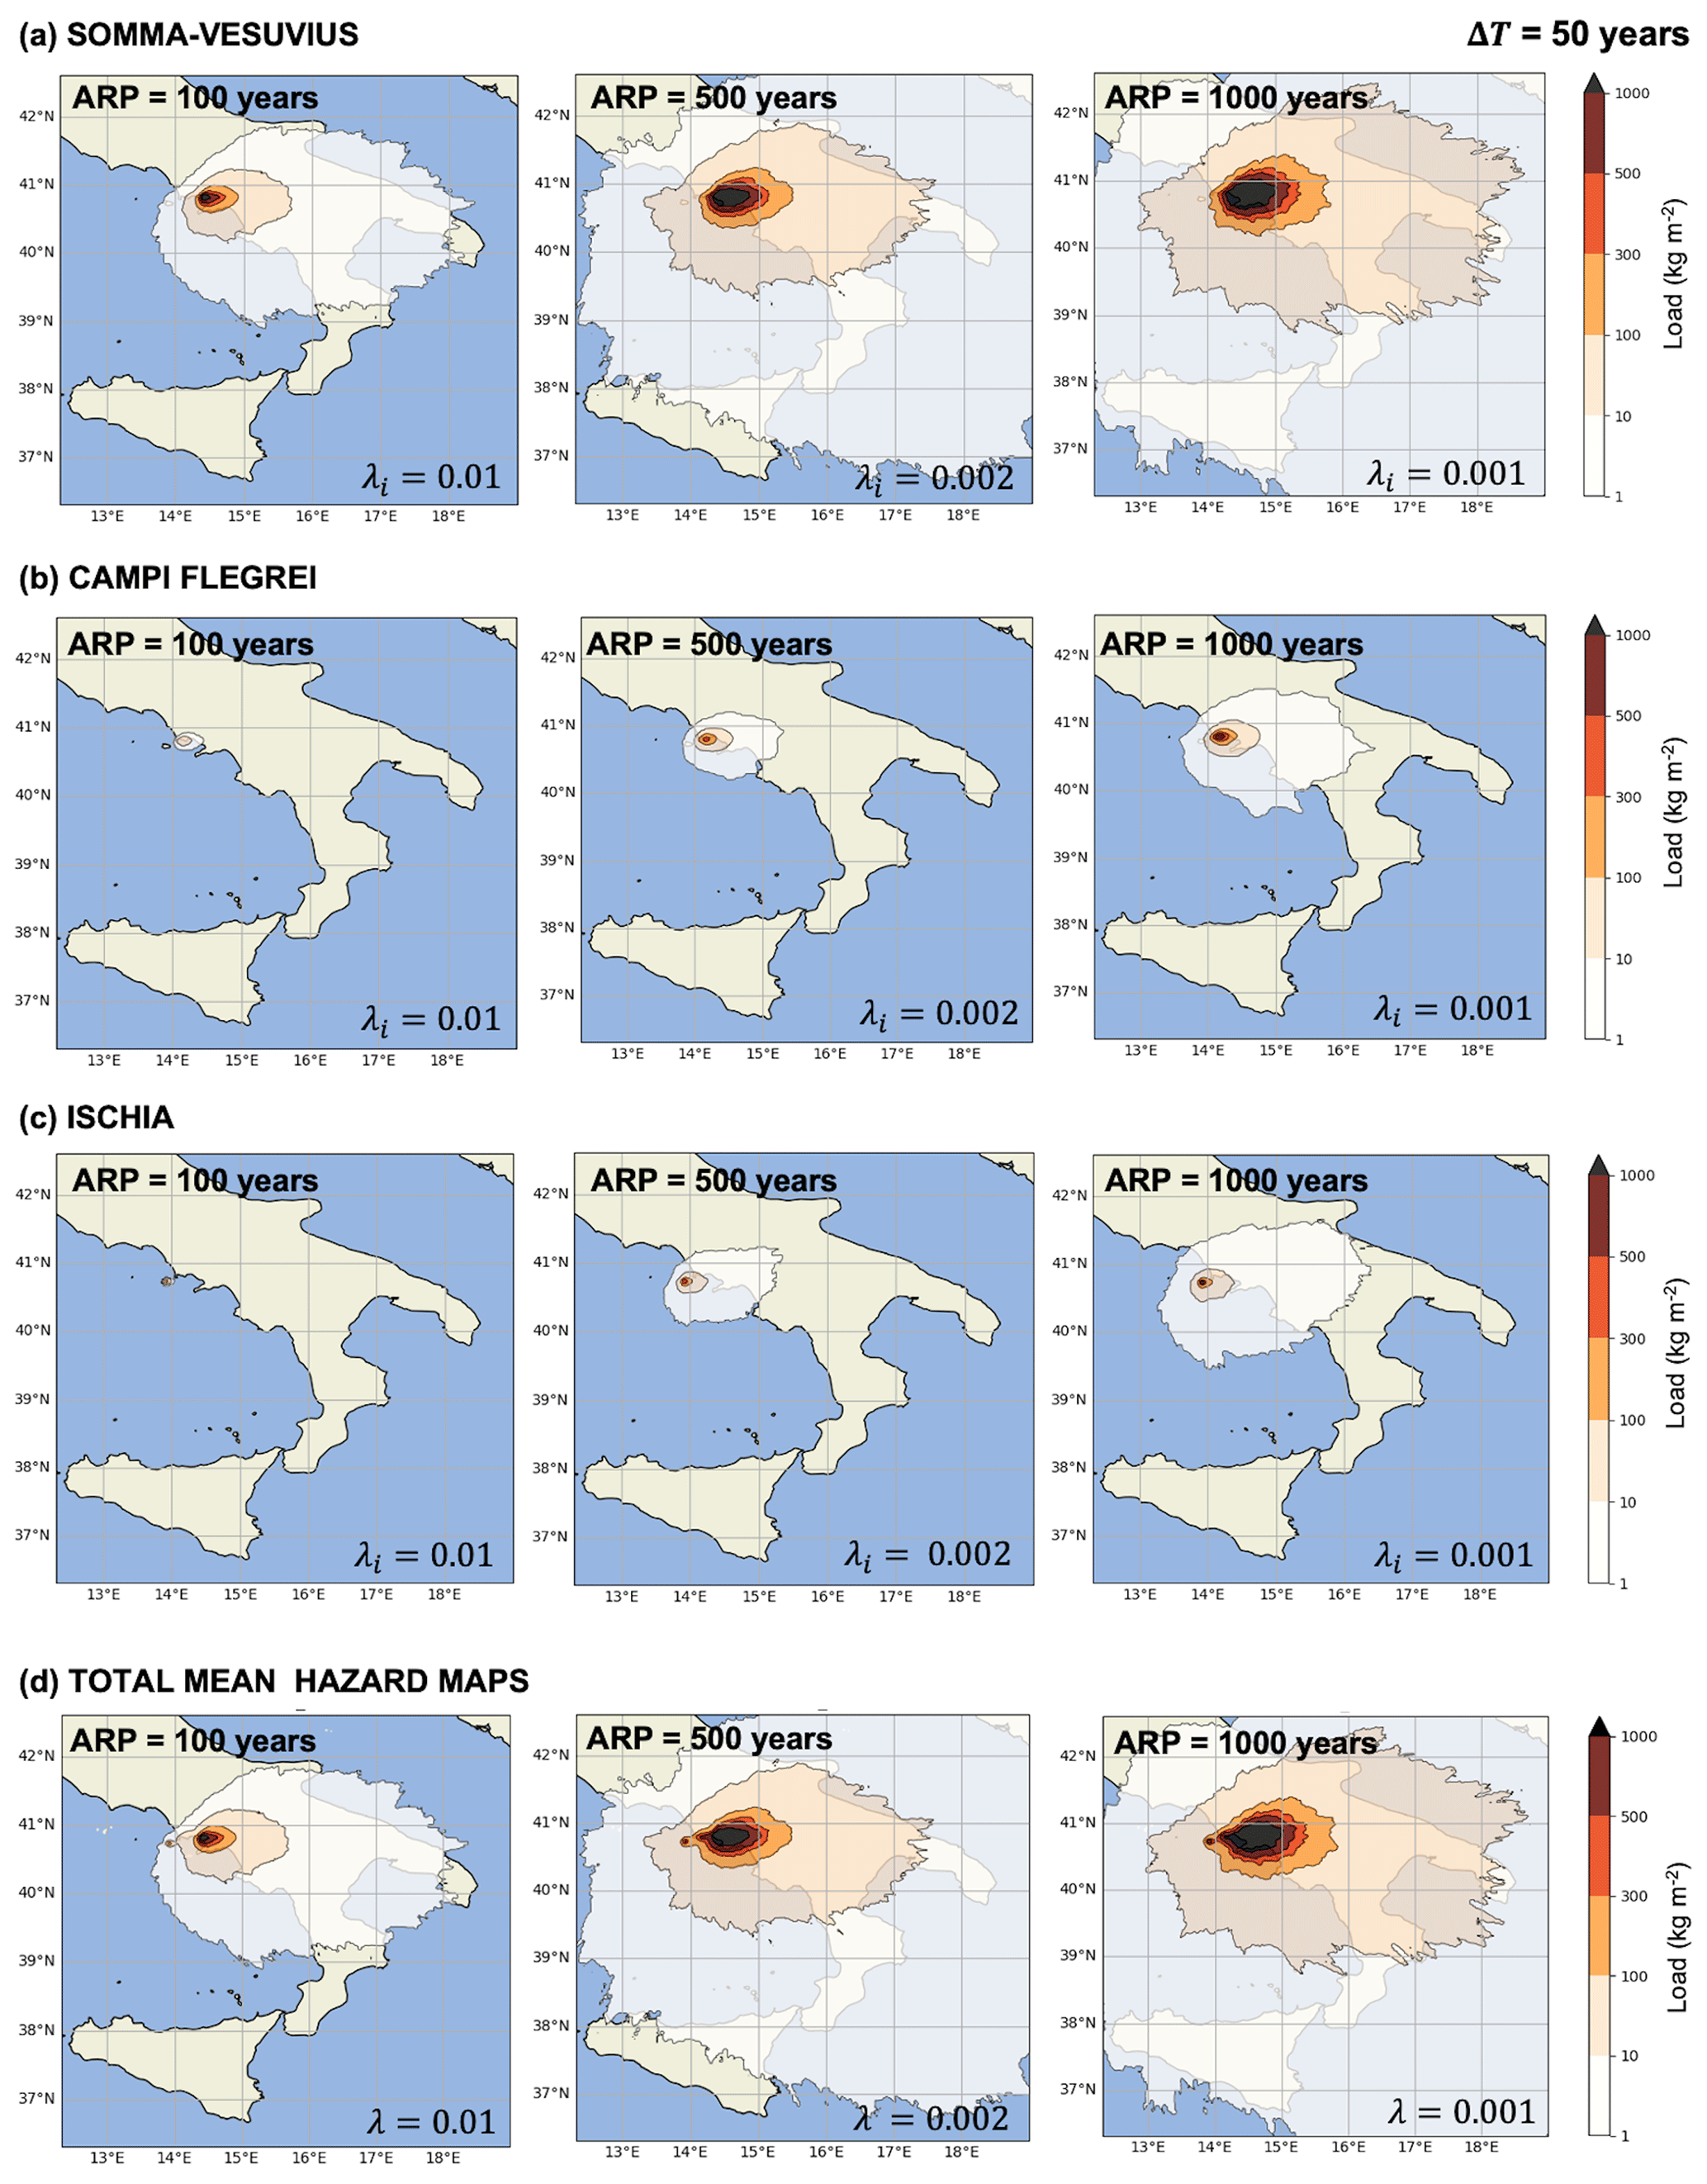
Figure 3Long-term hazard maps reporting the mean hazard intensity (tephra load, kg m−2) in 50 years as a function of the ARP (100, 500, and 1000 years) due to the impact of (a) Somma–Vesuvius (aggregated eruption sizes: small, medium, large), (b) Campi Flegrei (aggregated eruption sizes: small, medium, large), and (c) Ischia (single eruption size: large). (d) Long-term hazard maps in which the combined impact of the three volcanic sources is taken into account. For each intensity threshold (color bar label), the maps show the areas where that value is expected to be exceeded after 24 h from eruption onset with that ARP.
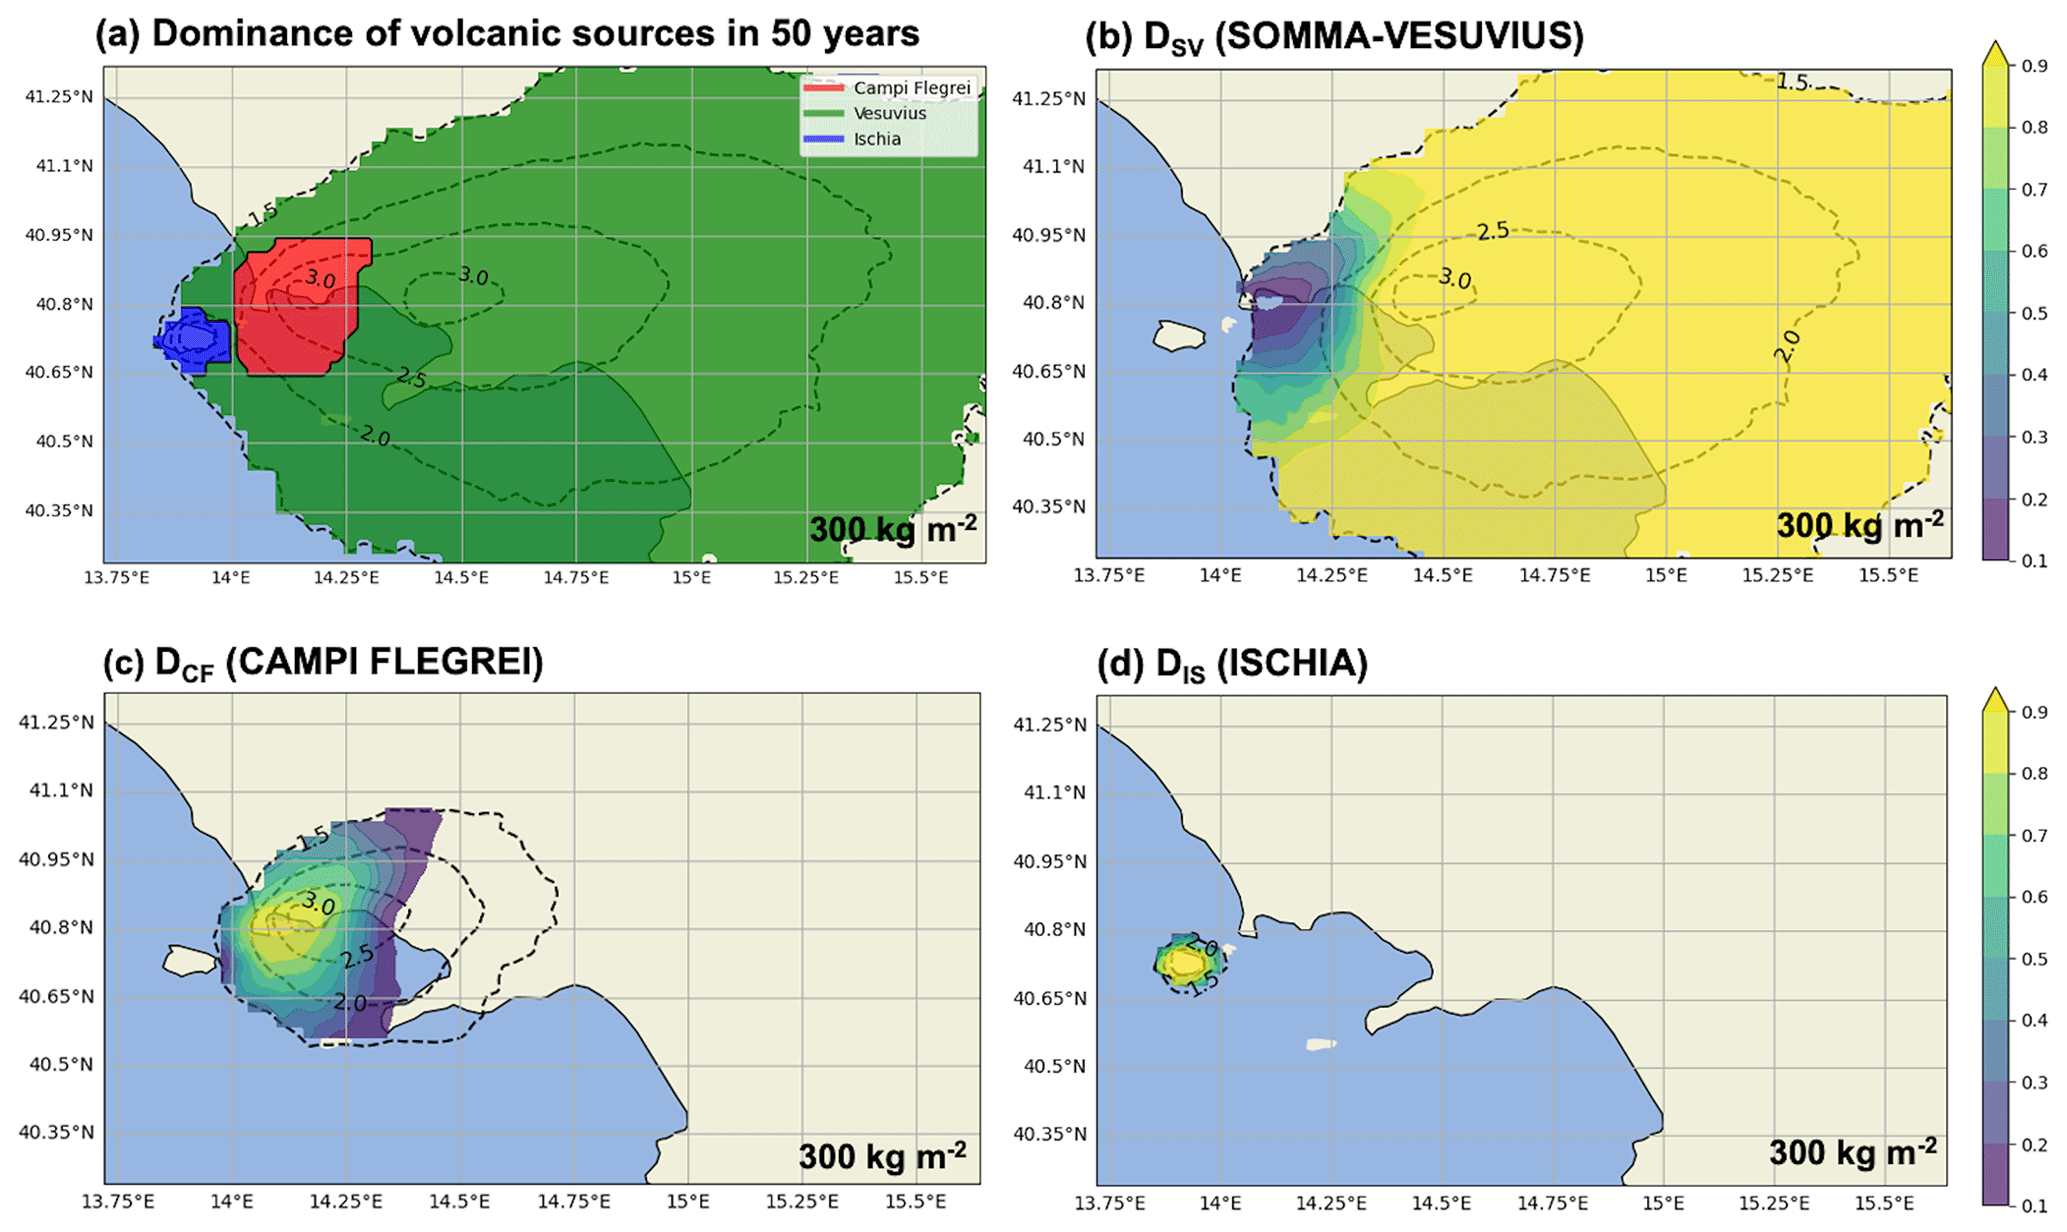
Figure 4Disaggregation per volcanic source. (a) Map showing, in each point, which volcano contributes the most to the hazard of exceeding 300 kg m−2 due to the occurrence of an eruption in 50 years. In panels (b), (c), and (d), the relative dominance of exceeding the threshold due to the occurrence of an eruption from Somma–Vesuvius, Campi Flegrei, and Ischia, respectively, is shown. The dotted black isolines encompass the areas where the labeled number of simulations (in log 10 scale) producing a tephra load greater than 300 kg m−2 is exceeded.
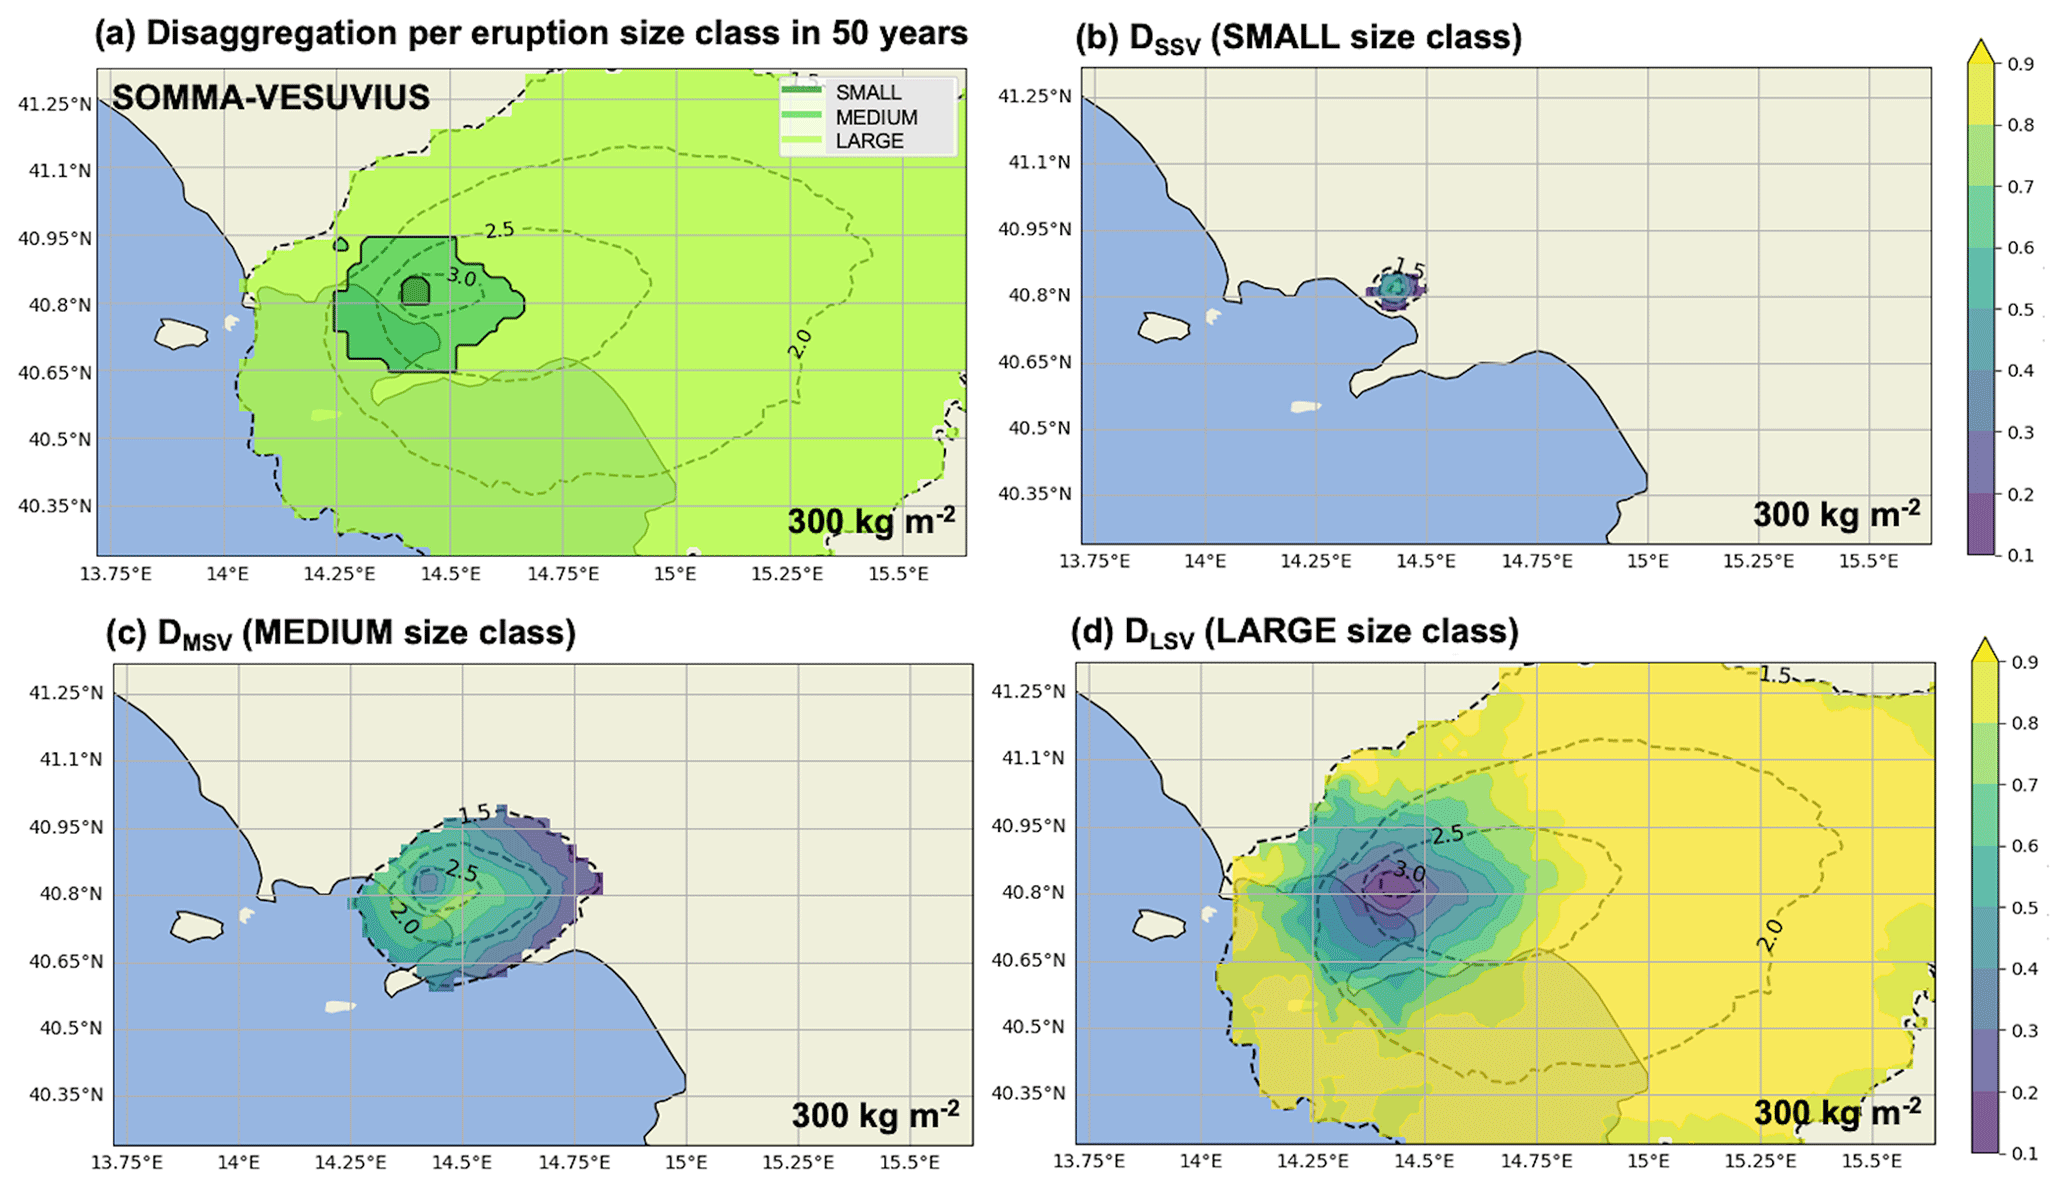
Figure 5Disaggregation per eruption size class. (a) Map showing, in each point, which eruption size class of Somma–Vesuvius contributes the most to the hazard of overcoming 300 kg m−2 due to the occurrence of eruption in 50 years. The relative dominance of overcoming the threshold is accounted for in (b) small, (c) medium, and (d) large size classes. Dashed black contours represent the isolines of the log 10 number of simulations that produce a tephra ground load exceeding 300 kg m−2.
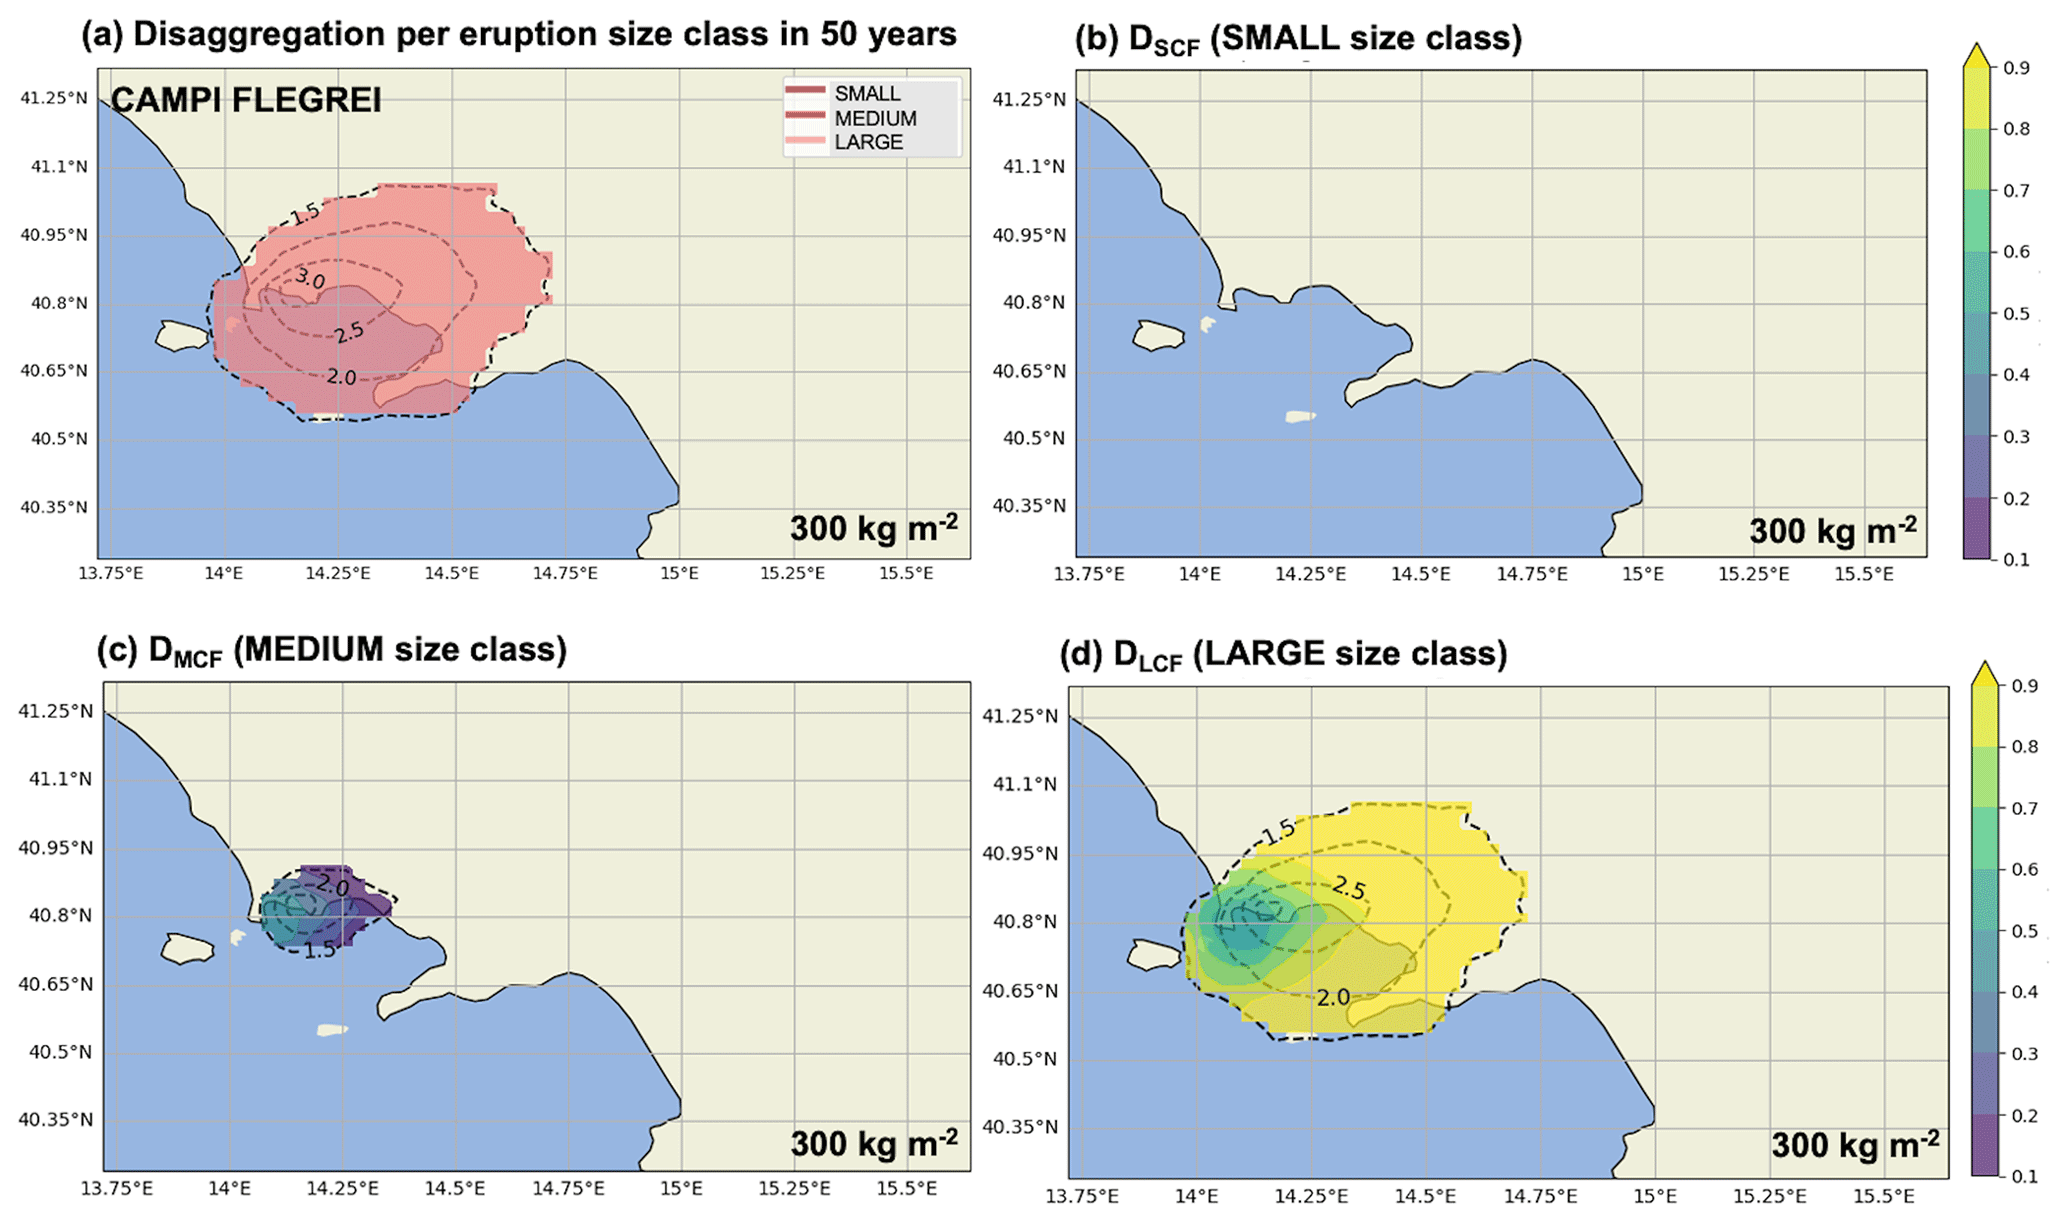
Figure 6Disaggregation per eruption size class. (a) Map showing, in each point, which eruption size class of Campi Flegrei contributes the most to the hazard of exceeding 300 kg m−2 due to the occurrence of an eruption in 50 years. The relative dominance of exceeding the threshold is accounted for in (b) small, (c) medium, and (d) large size classes. Dashed black contours represent the isolines of the log 10 number of simulations that produce a tephra ground load exceeding 300 kg m−2.
4.2 Hazard disaggregation analysis
4.2.1 Volcanic source disaggregation
The disaggregated contribution of each volcanic source in overcoming the threshold of 300 kg m−2 in 50 years is shown in Fig. 4a. Somma–Vesuvius (green area) dominates the largest part of the sub-domain considered, up to distances of ∼90 km (green area; Fig. 4a), while Campi Flegrei and Ischia show their dominance within a radius of a few kilometers from their respective vents (red and blue areas; Fig. 4a). It is worth noting that this considers both the different probabilities of eruptions and the different probabilities of dispersions for the various eruptive sizes. Therefore, these results show the much higher probability of eruption at Somma–Vesuvius led to a general dominance of this volcano, which is overcome by the other volcanoes only upwind (prevalent winds here flow toward southeast), where dispersion from Somma–Vesuvius is less likely. This tendency is also highlighted by mapping, for each volcano separately, the actual value of Di for overcoming the threshold of 300 kg m−2 (Fig. 4b, c, d). We also remark that the dotted black isolines represented in this figure and the following figures encompass the areas in which different numbers of simulations (in log 10 scale) produce a tephra load greater than 300 kg m−2: the larger this number, the more constrained this probability is, since it is evaluated on a larger number of simulations.
4.2.2 Size class disaggregation considering the tephra thresholds of 300 and 10 kg m−2
Figure 5a shows the largest relative dominance among the three eruption size classes considered for Somma–Vesuvius and their contributions separately, while Fig. 5b–d show, respectively, the dominance in overcoming the tephra threshold of 300 kg m−2 in each target point of the domain in 50 years. As for the previous analysis, for such a threshold, the significant number of simulations is restricted to distances up to ∼100 km from the volcanic sources. We note the small size class is dominant in the proximity of the vent, while the medium dominates the adjacent area up to distances of ∼20 km. Distal areas are dominated by the large size class up to distances of ∼100 km (Fig. 5a). In Fig. 6 we show the same information for Campi Flegrei. The large size class homogeneously dominates up to distances of ∼100 km (Fig. 6a). We note that the relative dominance Di1 of the small class is not visible because it is ubiquitously lower than 0.1 (Fig. 6b). Although the medium class provides a contribution from 10 % to 40 % in exceeding the selected threshold of 300 kg m−2 in the proximity of the caldera (Fig. 6c), this is nowhere higher than that shown by the large class (>50 %; Fig. 6d). It is important to stress that a variability in the results of this disaggregation is expected if different thresholds are selected. In this regard, in Fig. 6 we report an example of hazard disaggregation per eruption size class for Campi Flegrei in 50 years, considering a tephra threshold of 10 kg m−2. In this case, results show that the caldera is dominated by the small and medium classes (up to distances of ∼50 km), while the large class nearly completely covers the rest of the southeastern domain, reaching distances of ∼250 km.
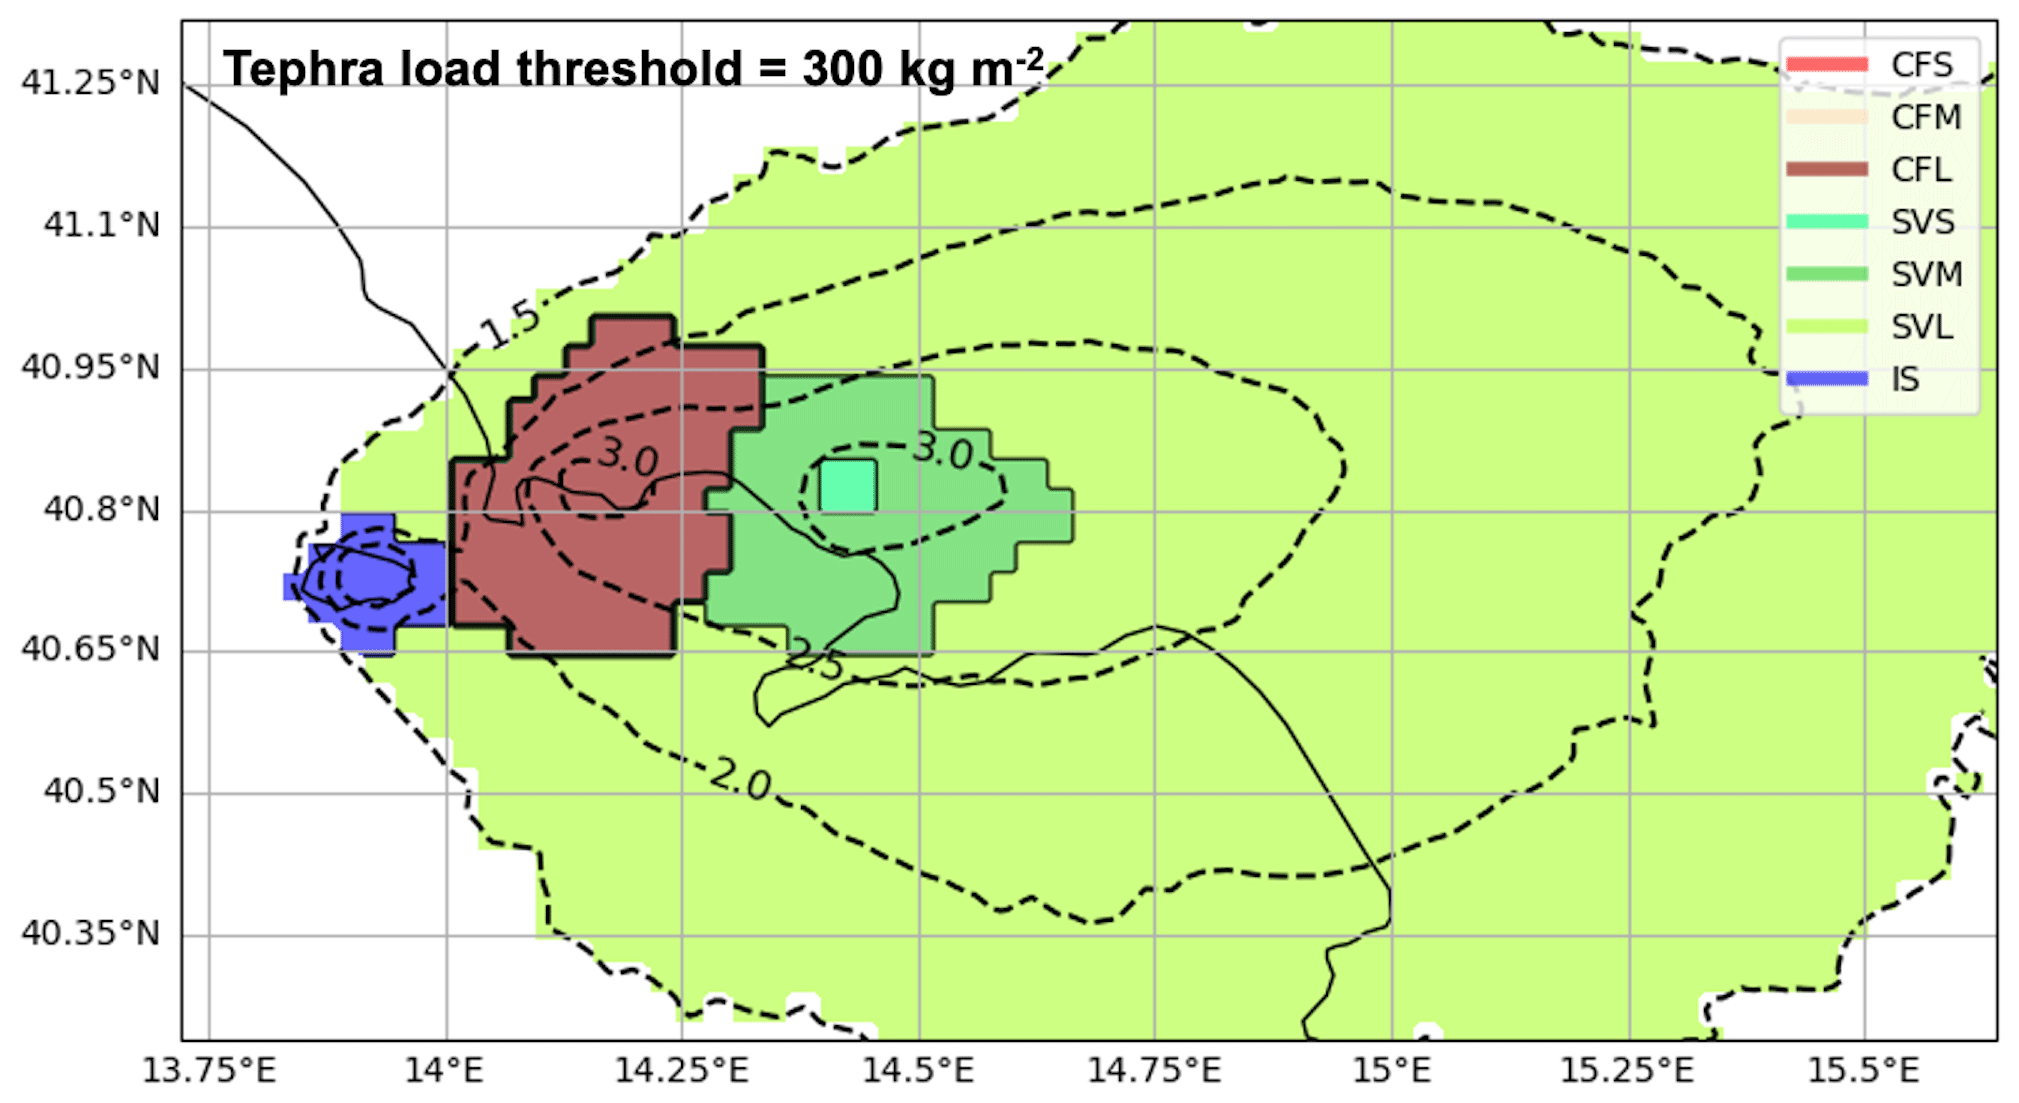
Figure 7Disaggregation per volcanic source and eruption size class. Map showing, in each point, which eruption size class of Somma–Vesuvius, Campi Flegrei, and Ischia contributes the most to the hazard of overcoming 300 kg m−2 due to the occurrence of eruption in 50 years. Dashed black contours represent the isolines of the log 10 number of simulations that produce a tephra ground load exceeding 300 kg m−2.
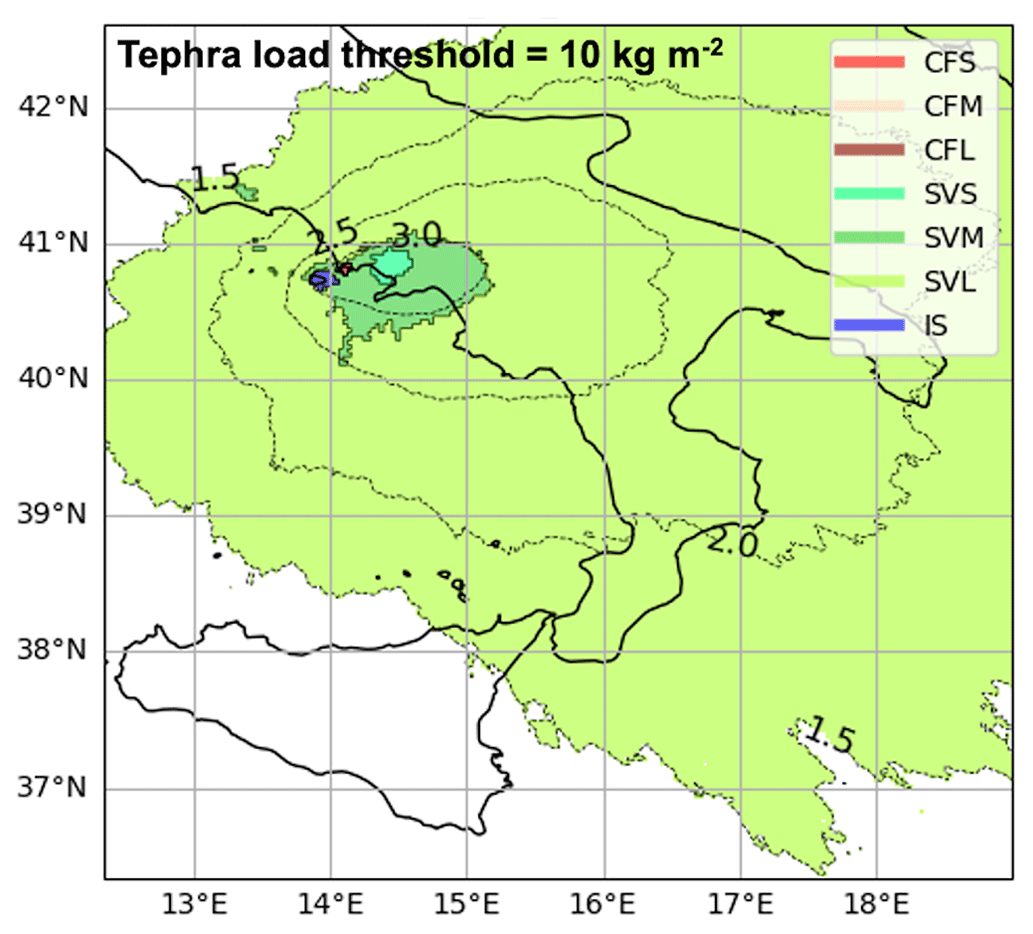
Figure 8Disaggregation per volcanic source and eruption size class. Map showing, in each point, which eruption size class of Somma–Vesuvius and Campi Flegrei contributes the most to the hazard of overcoming 10 kg m−2 due to the occurrence of eruption in 50 years. Dashed black contours represent the isolines of the log 10 number of simulations that produce a tephra ground load exceeding the threshold of 10 kg m−2.
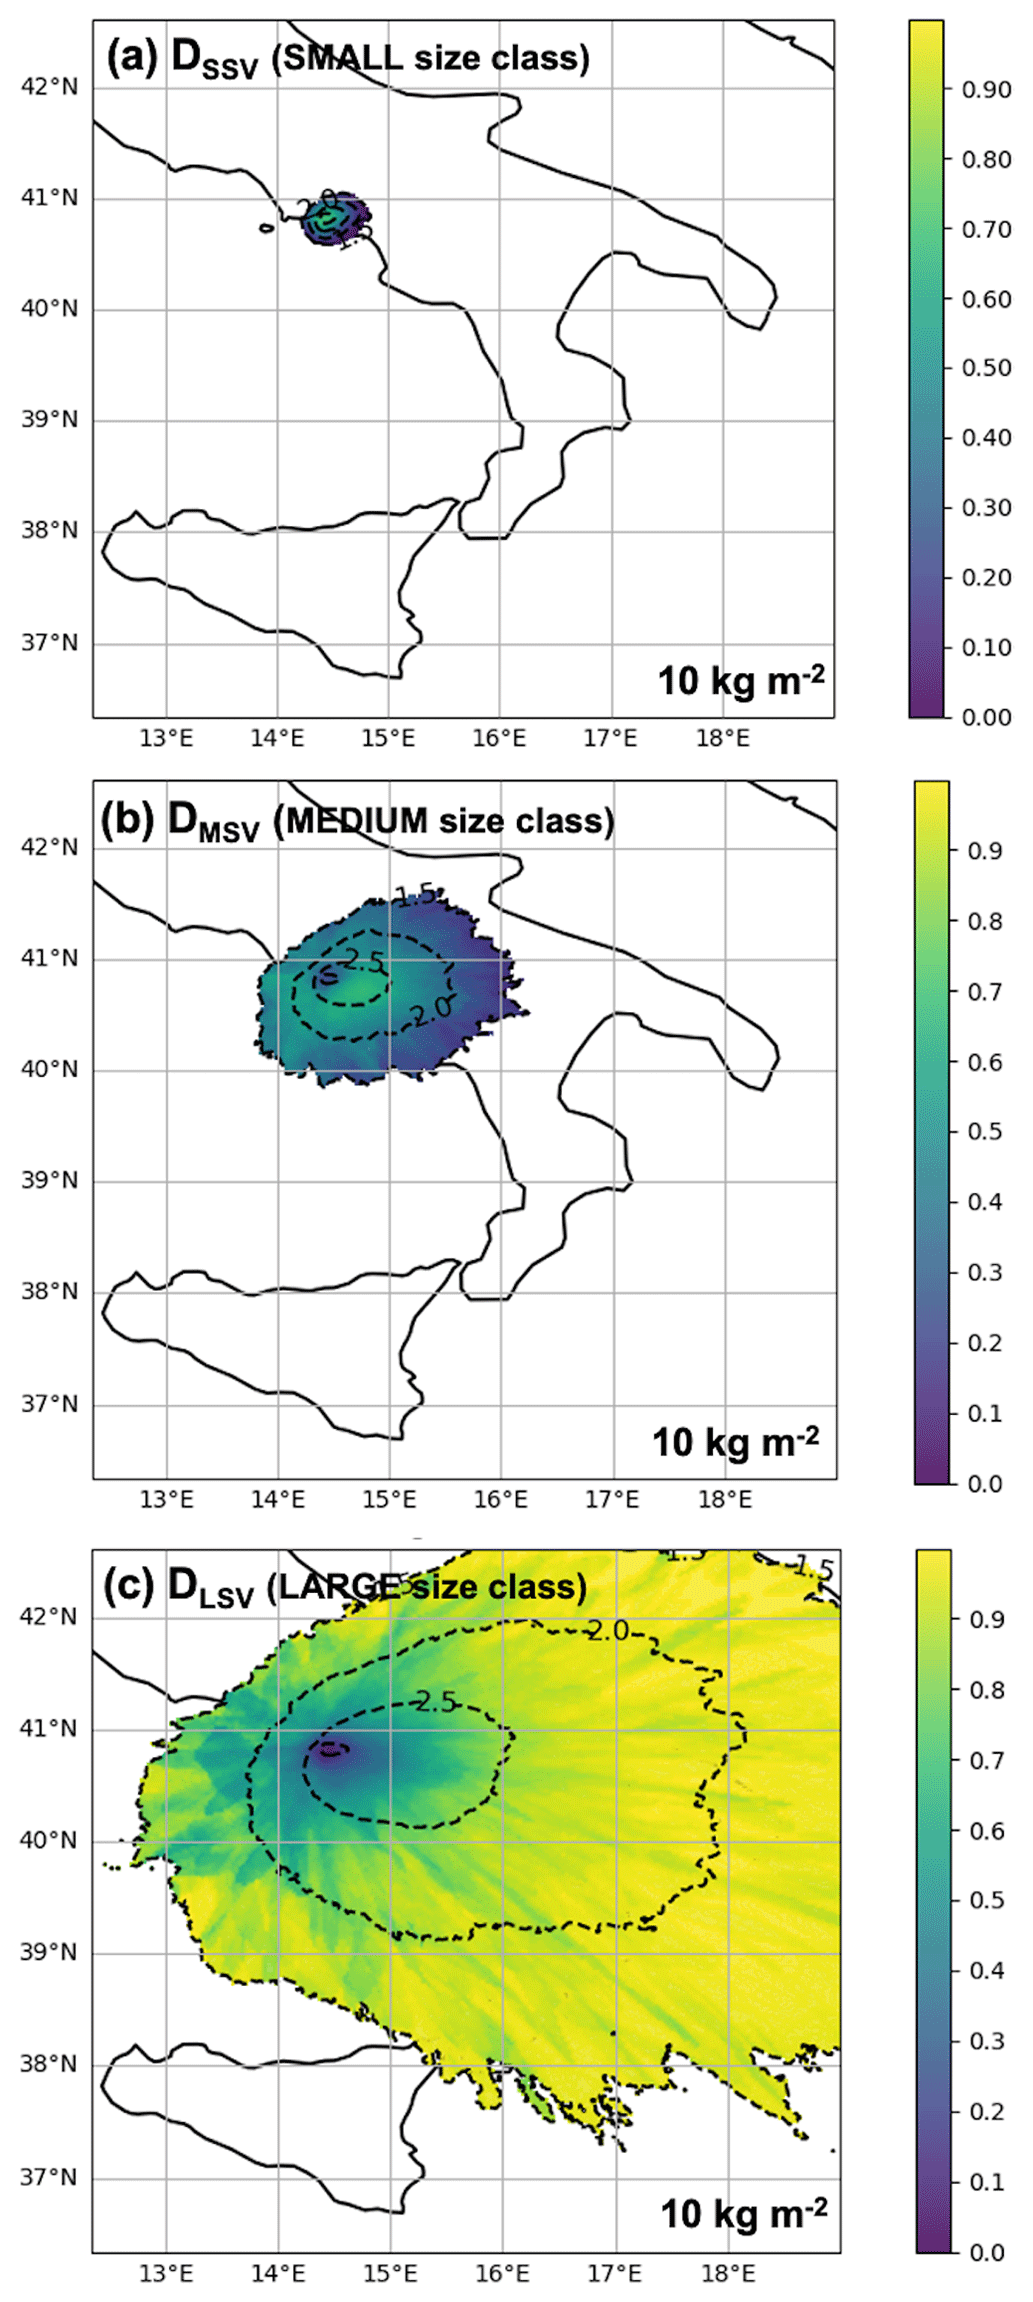
Figure 9Map showing, in each point, which eruption size class of Somma–Vesuvius contributes the most to the hazard of overcoming 10 kg m−2 due to the occurrence of eruption in 50 years. The relative dominance of overcoming the threshold is accounted for in (a) small, (b) medium, and (c) large size classes. Dashed black contours represent the isolines of the log 10 number of simulations that produce a tephra ground load exceeding 10 kg m−2.
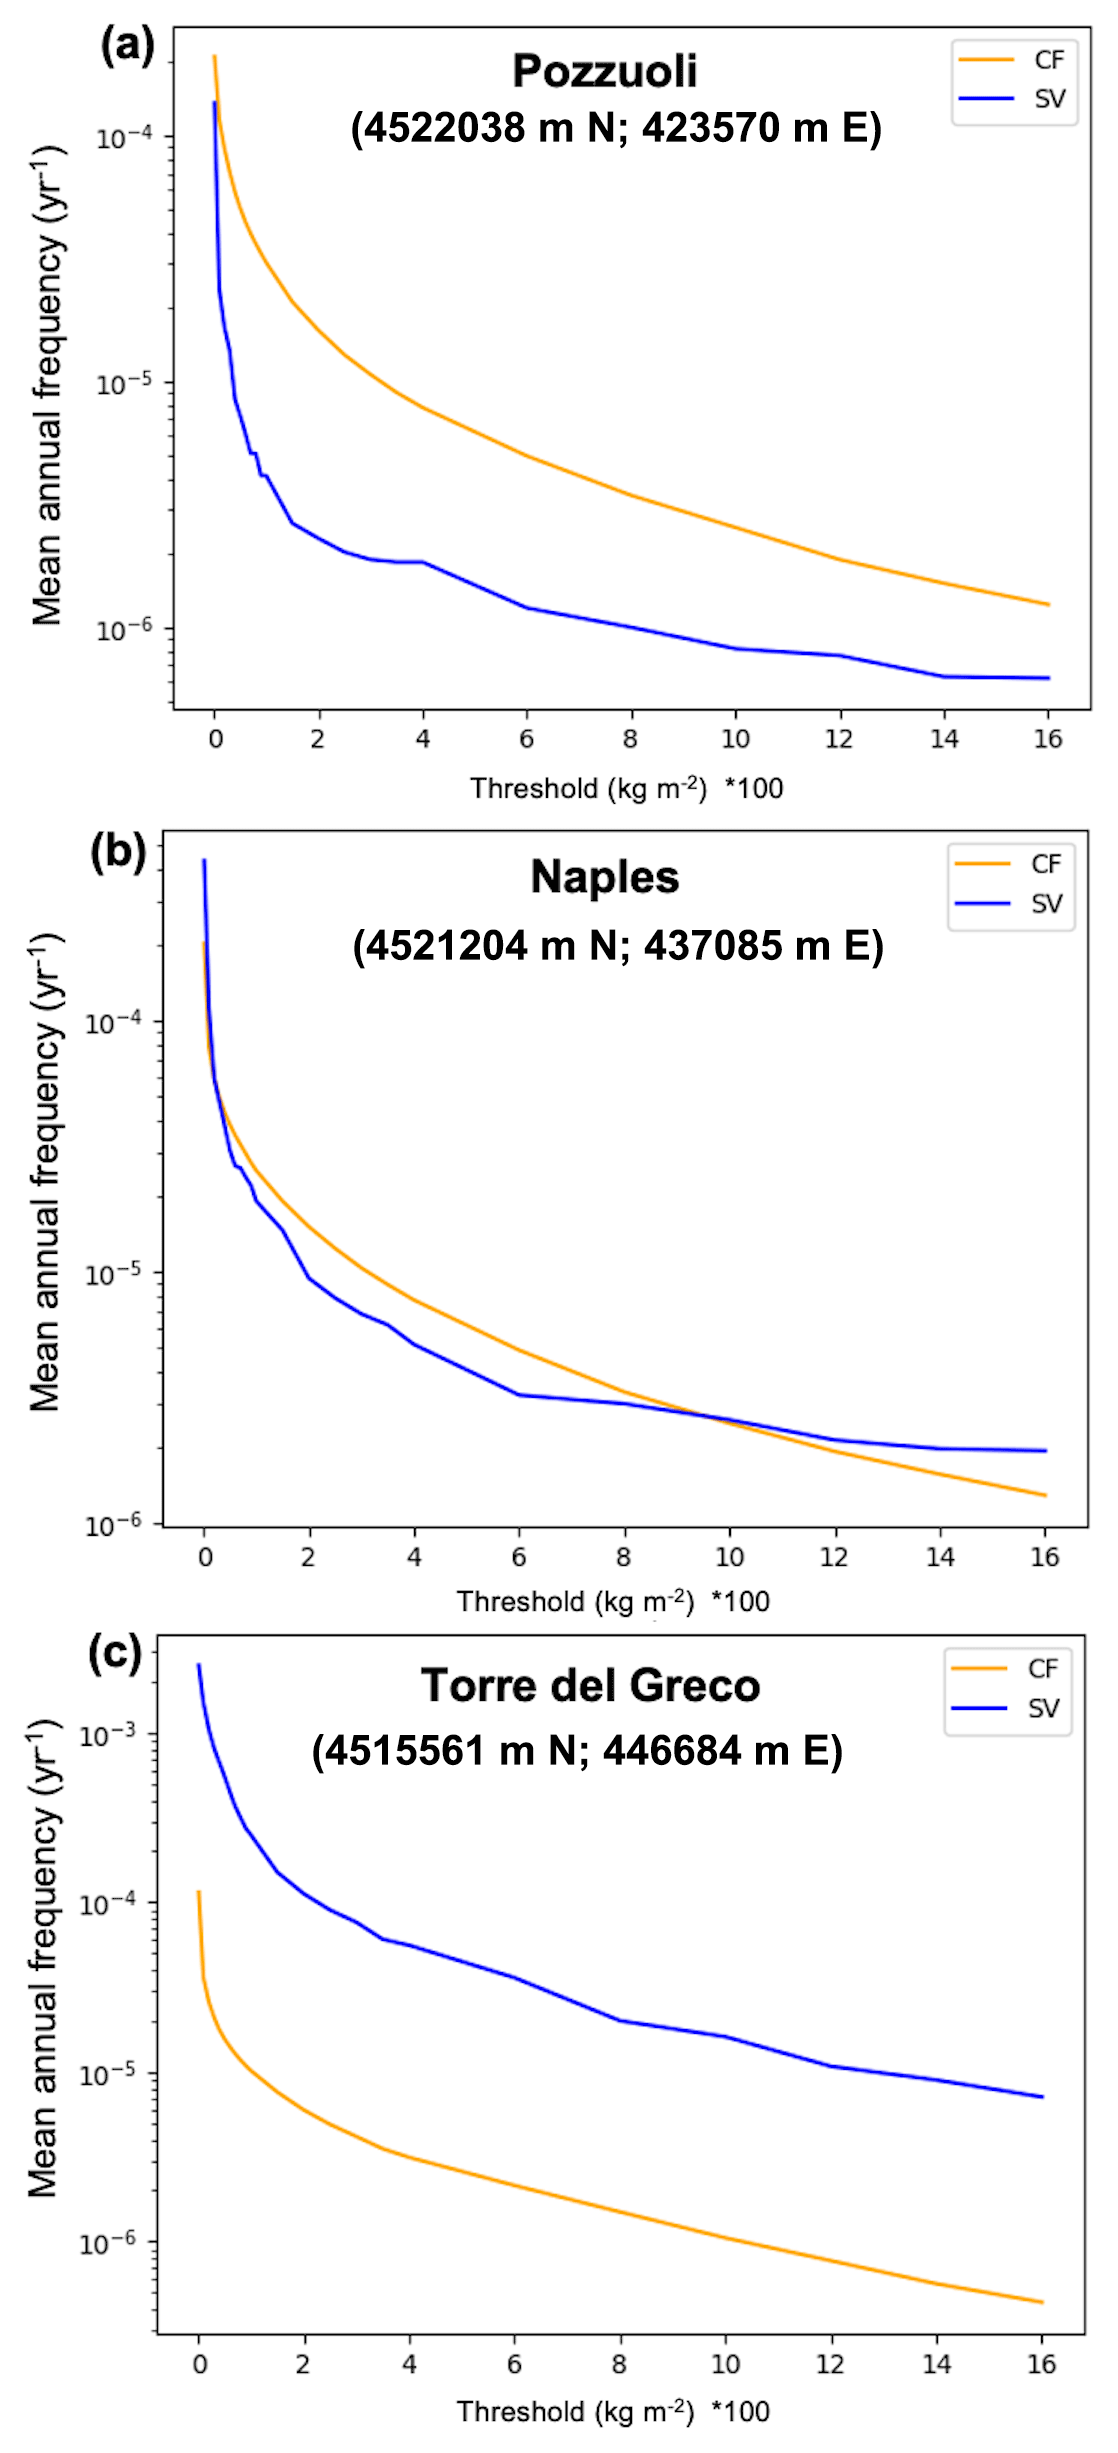
Figure 10Hazard curves showing the mean annual frequency of exceeding a set of intensity thresholds (tephra load, in kg m−2) at three target sites: (a) Pozzuoli, (b) the municipality of Naples, and (c) Torre del Greco due to the impact of Somma–Vesuvius (blue curve) and Campi Flegrei (orange curve) in 50 years. The position of the target sites is expressed in UTM coordinates (UTM zone: 33T).
4.2.3 Visualization of the overall disaggregation
In order to have an overall picture of hazard disaggregation, in Fig. 7 we show the results of the relative dominance per volcanic source and eruption size class for the threshold of 300 kg m−2. As already observed in Fig. 5a, the eruptive size classes of Somma–Vesuvius (green shaded colors) dominate in the largest part of the domain, from the small to the large class at increasing distances from the vent. Notably, the dark red area corresponding to the large class of Campi Flegrei covers the whole caldera up to distances of ∼30 km, as indicated in Fig. 6a. Interestingly, this area almost coincides with the Yellow Zone for tephra fallout hazard taken as reference by the national Italian Civil Protection Department (https://www.protezionecivile.gov.it/it/, last access: 20 June 2023), which is defined as the area having a probability larger than 5 % to overcome 300 kg m−2 conditional to the occurrence of an eruption of medium size on land (Dipartimento di Protezione Civile, 2019). Therefore, our results confirm that Campi Flegrei mainly dominates in this area, even if that choice was not based on a quantitative evaluation of the dominance. More than 800 000 inhabitants live in this area, located in Naples and the surrounding municipalities. Intuitively, Ischia Island is dominated by the Ischian events. This occurs up to distances of ∼10 km, showing that only in this area, with Ischia being upwind with respect to other volcanoes, Ischian fallouts dominate even if the volcano produces significantly smaller eruptions. The results drastically change when varying the tephra load thresholds. In Fig. 8 we show the disaggregation by volcanic source and eruptive size class corresponding to the tephra threshold of 10 kg m−2. Here, the entire computational domain is reached by a significant number of simulations with the exception of the northwestern sector and a large part of Sicily. At this load threshold, Somma–Vesuvius provides the largest dominance (green shaded colors), having the small and medium classes able to dominate up to distances of ∼50 km from the vent and the large class over ∼50 km along the preferential towards the east wind direction. This result is expected for Somma–Vesuvius, which shows the highest mean annual rates in 50 years (Table C1). On the contrary, Campi Flegrei shows a reduced-area largest dominance because the mean annual frequency to overcome the 10 kg m−2 threshold due to an eruption of the large size class (dark red area) is less than that shown by the medium and large size classes of Somma–Vesuvius. Ischia, modeled with a single eruption size class, dominates only locally. In Fig. 9 we show the relative dominance Dik of each eruption size class of Somma–Vesuvius in overcoming the tephra threshold of 10 kg m−2 in 50 years, noting that the small class contributes to this hazard intensity only within distances of ∼60 km from the vent, with a relative dominance of ∼60 % only in the proximal areas (Fig. 9a), while the medium class contributes within distances of ∼100 km (including the Gulf of Naples, the northern part of the peninsula Sorrentina, and Ischia; Fig. 9b). At further distances we observe the large class with radial lobes of relative dominance, likely due to the randomness of the sampling of wind conditions (Fig. 9c). In Fig. 6b–d, we report the same type of results in overcoming the threshold of 300 kg m−2 for Campi Flegrei.
4.3 Implications for the PVHA in the Neapolitan urban area and for multi-hazard evaluation
The proposed PVHA is firstly presented as a combination of the relative contributions of each volcano in terms of mean annual frequency λ of exceeding different tephra load thresholds at a specific location, considering a reference exposure time of 50 years. Then, disaggregation analyses show which volcano, and further which eruption size class, impacts the most on a hazard, i.e., has the largest probability of causing the exceedance of tephra load thresholds of 10 and 300 kg m−2. Even if the disaggregation results are relative to the selected tephra load threshold, this result is general, and it is valid for all thresholds. The complete information for all thresholds is reported only in the entire hazard curves. In Fig. 10 we provide the hazard curves, showing the mean annual frequency of exceeding the tephra load thresholds for three sites along the dominant wind direction: Pozzuoli, Naples, and Torre del Greco. As expected, within the Campi Flegrei caldera (e.g., in Pozzuoli, Fig. 10a) the major hazard is due to the Campi Flegrei volcano for all thresholds, also considering that Pozzuoli is located upwind with respect to Somma–Vesuvius. The center of the city of Naples represents a transition case: the hazard curves seem to be overlapped up to tephra loads of ∼ 10–20 kg m−2, but for higher thresholds (from ∼20 to 1000 kg m−2) Campi Flegrei shows a higher hazard curve (Fig. 10b). This is in accordance with Selva et al. (2012), indicating that hazard exposure of Naples due to the Campi Flegrei caldera, even in quiet periods, is higher than for Somma–Vesuvius, given that expected eruption size classes are comparable (Marzocchi et al., 2004; Orsi et al., 2009), and the city center is closer to the eruptive vents of Campi Flegrei and more directly downwind (e.g., Selva et al., 2010). Beyond the 1000 kg m−2 threshold, the inversion occurs (Somma–Vesuvius dominates), but this trend is not reliable. In the case of Torre del Greco, the highest hazard curve is due to Somma–Vesuvius for all the thresholds (Fig. 10c), being located downwind. The results shown in Figs. 4–8 are due to the superimposition of two effects: the prevalent wind direction and probability of eruption. The probability of eruption is much higher at Somma–Vesuvius than at the other volcanoes (∼34 % in 50 years vs. ∼3 % and ∼12 % in 50 years, respectively; Selva et al. (2022). Wind directions statistically prevail towards the east in the Neapolitan area (e.g., Macedonio et al., 2016) with moderate seasonal variations (e.g., Costa et al., 2009): this aspect affects the model results, making tephra load dispersion oriented (e.g., Figs. 3–8). This means, for example, that the western side of the domain has a lower probability to be reached by a tephra fallout due to Somma–Vesuvius. It is worth noting that some modeling limitations need to be taken into account, since they significantly affect the model results, especially at greater distances from the volcanic sources. Although the number of the simulated volcanic scenarios per eruption size class (1500) represents a good compromise between the quality of the results and computational costs, it restricts the area of reliable results in terms of the number of simulations exceeding the tephra load thresholds at an increasing distance from the vents. However, this equally affects all three volcanoes, even if this effect is more evident for Somma–Vesuvius, which has the highest annual rates. It is also worth noting that the model neglects the epistemic uncertainty that, in the future, could be treated by substituting single estimates with ensembles of alternative estimates (Marzocchi et al., 2021; Selva et al., 2022). Considering this as an intrinsic limitation of the methodology, along with the incomplete geological records, this work provides a prototypal methodology for long-term multi-volcano hazard assessment focused on the full quantification of the natural variability of the modeled phenomena, the aleatory uncertainty. The results obtained in this study produce, for the very first time, a complete PVHA, considering all the volcanoes in order to produce the total unconditional hazard. In this sense, our results significantly improve those from the previous PVHA for tephra fallout conditional to the occurrence of specific representative eruptive scenarios from Neapolitan volcanoes (i.e., Macedonio et al., 2008; Costa et al., 2009), conditional to the occurrence of eruptions at one volcano (e.g., Orsi et al., 2009; Selva et al., 2010, 2018; Sandri et al., 2016). In this sense, our PVHA is, for the first time, fully compatible with other hazard studies like the ones for seismic events (Gerstenberger et al., 2020). The reason is that the natural variability of such phenomena is now fully explored by merging the results of a large number of numerical simulations for three volcanic sources, taking into account the impact of low-probability but high-consequence events. In particular, we estimate the mean annual frequency of exceeding specific tephra load thresholds at selected sites in 50 years (but extendible to any time window), considering the mean annual eruption rate from the model of Selva et al. (2022). Notably, this allows us to also consider that, for each volcano, the sequences of eruptive clusters with different eruptive size distributions may occur, also accounting for isolated eruptions and long-term repose times. It is worth noting that the very large magnitude eruptive events, i.e., for Campi Flegrei, events like the Neapolitan Yellow Tuff (e.g., Lirer and Munno, 1975; Scandone et al., 1991; Orsi et al., 2004) and the Campanian Ignimbrite (e.g., Barberi et al., 1978; Costa et al., 2013), are not taken into account because of their negligible probability of occurrence over an exposure time of 50 years (e.g., Bevilacqua et al., 2016; Orsi et al., 2009). However, they would need to be considered if we selected a larger exposure time window. The proposed methodology also represents a clear step forward into the multi-hazard and risk perspective with respect to the previous PVHAs in response to the need for homogeneous model definitions for an effective comparison among volcanoes and for producing coherent multi-volcano long-term hazards and multiple risk quantifications and risk rankings (i.e., Marzocchi et al., 2015). In doing this, a further challenge is to coordinate the efforts of hazard scientists and decision-makers in order to maximize the PVHA potential benefit for society (Selva, 2022).
In this study, we provide a new long-term PVHA of tephra load associated with explosive eruptions from the Somma–Vesuvius, Campi Flegrei, and Ischia volcanoes. By defining a set of different eruption size classes for each volcano (small, medium, and large), we created a synthetic dataset of tephra ground loads composed by a total of 10 500 numerical simulations (1500 for each eruption size class) that consider a meteorological variability over the last 30 years. The hazard evaluation was performed through the HPC workflow recently developed by Martinéz Montesinos et al. (2022), accounting for the uncertainty in the eruptive source parameters, vent opening (only for Campi Flegrei), and the mean annual rate of eruption for each eruption and size class (Selva et al., 2022). In this way, we obtained a hazard model from which we derived a set of hazard maps for southern Italy, showing the threshold tephra load that would be exceeded with selected ARPs (i.e., 100, 500, 1000 years) within a 50-year exposure time. As expected, the south-southeast (SSE) area of the computational domain is mainly threatened by the tephra fallout hazard, especially in the proximity of the Neapolitan area. By performing hazard disaggregation, we quantified the relative dominance of the three volcanic sources and their eruptive size classes, showing that Somma–Vesuvius gives a major contribution to the total tephra load hazard for most of southern Italy, compared to Campi Flegrei and Ischia. This is mainly due to its greater mean eruption rate, which is an order of magnitude larger than the ones of the other two volcanoes. Campi Flegrei dominates in the area of the city center of Naples, in which the lower mean annual rate of Campi Flegrei is compensated by the low probability of eruption dispersing tephra toward the west in the Neapolitan area. Ischia, instead, dominates only locally. From a wider methodological perspective, this study aims to improve the PVHA in areas in proximity of multiple active volcanoes, like Naples, homogeneously cumulating the effect of all existing volcanoes. This produces a robust approach that allows easier comparisons among the different possible eruptive scenarios (e.g., volcano, size, etc.), as well as with those used for seismic phenomena and other natural disasters. Moreover, this approach can be applied to compute tephra fallout hazard in different areas or for different time spans, accounting for less frequent events that can still be significant for hazard assessment.
Here we report some information about the definition and sampling of the eruptive source parameters (ESPs) for each volcano.
Table A1ESPs for Somma–Vesuvius, Campi Flegrei, and Ischia. For each eruption size class, TEM and the mass of the fallout phase (kg), the duration of the fallout phase (h), and MER (kg s−1) are reported.
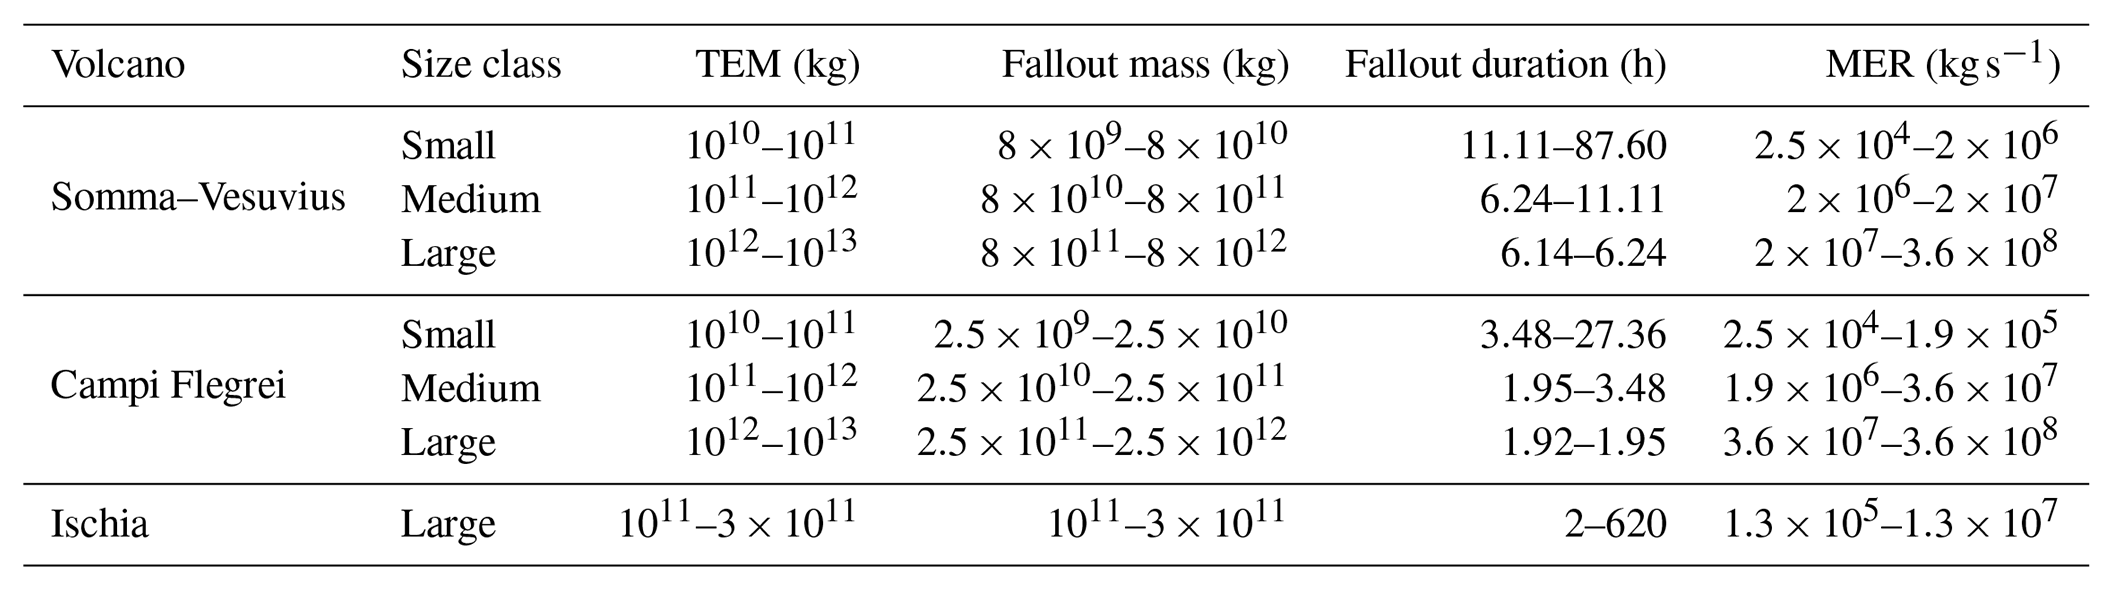
Table A2Parameters of the beta distribution best fitting the field-based total grain size distributions (TGSDs) for Campi Flegrei (Mele et al., 2020). In this case, the reported parameters are referred to as the juvenile, lithics, and crystals; p and (1−p) are, respectively, the coarse and fine sub-population weights; μ1, μ2 and σ1, σ2 are the mean and standard deviations of the two Gaussian distributions in Φ units.
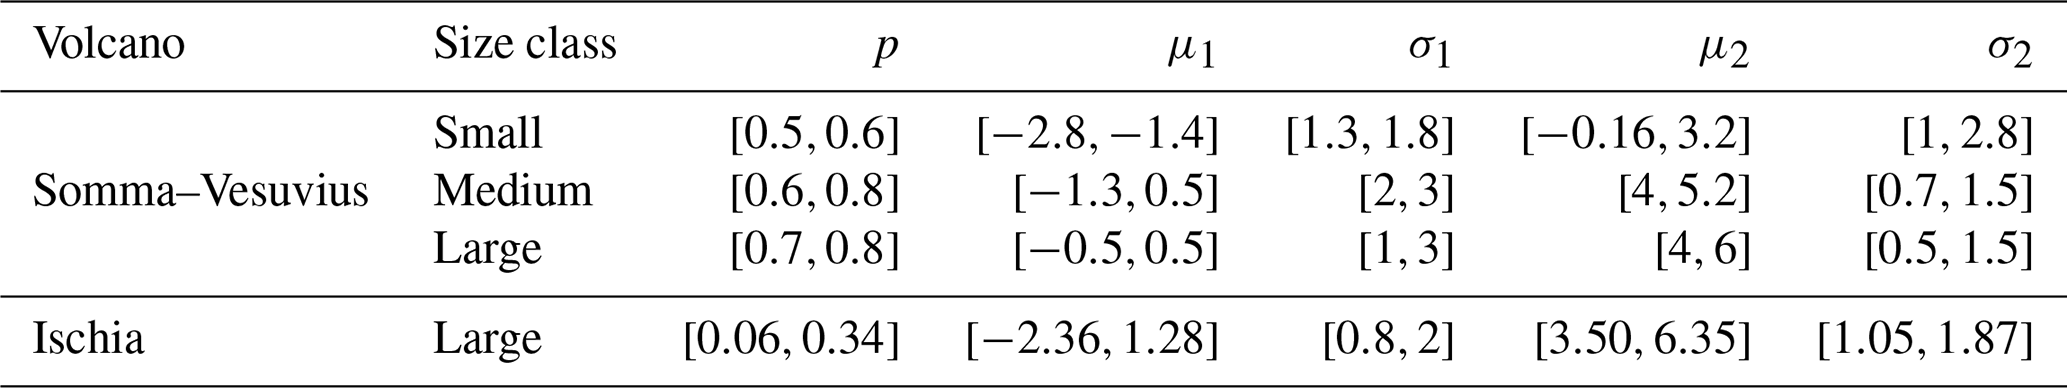
Table A3Parameters of the beta distribution best fitting the field-based TGSDs for Campi Flegrei (Mele et al., 2020). In this case, the reported parameters are referred to as the juvenile, lithics, and crystals; p and (1−p) are, respectively, the coarse and fine sub-population weights; μ1, μ2 and σ1, σ2 are the mean and standard deviations of the two Gaussian distributions in Φ units.
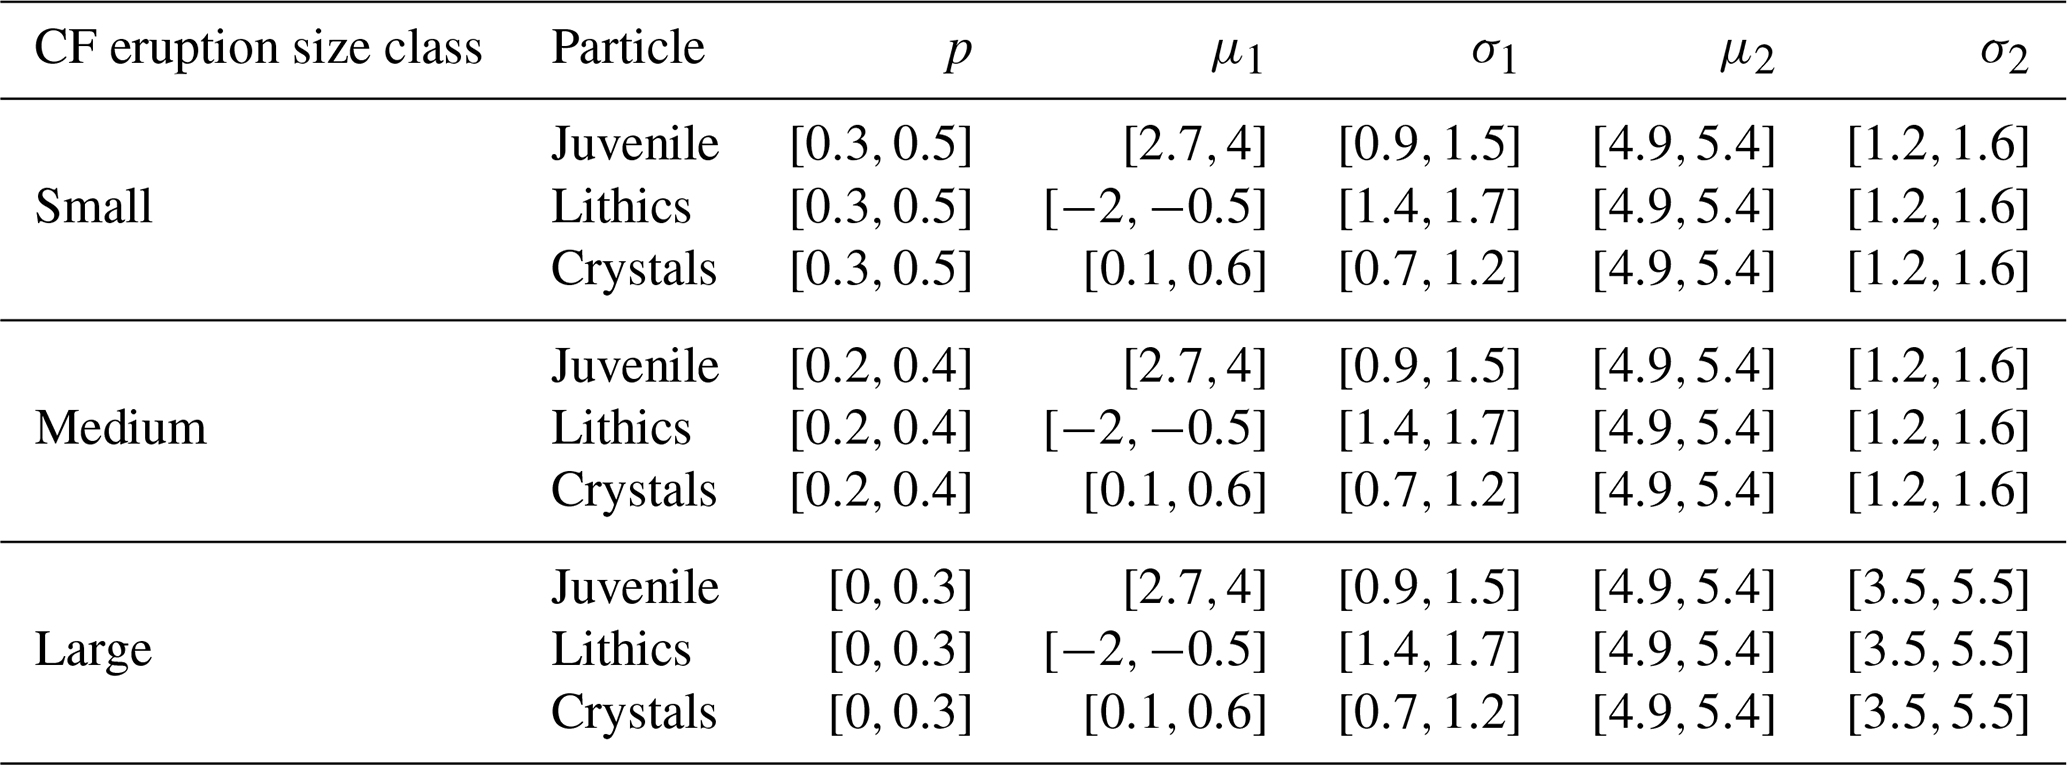
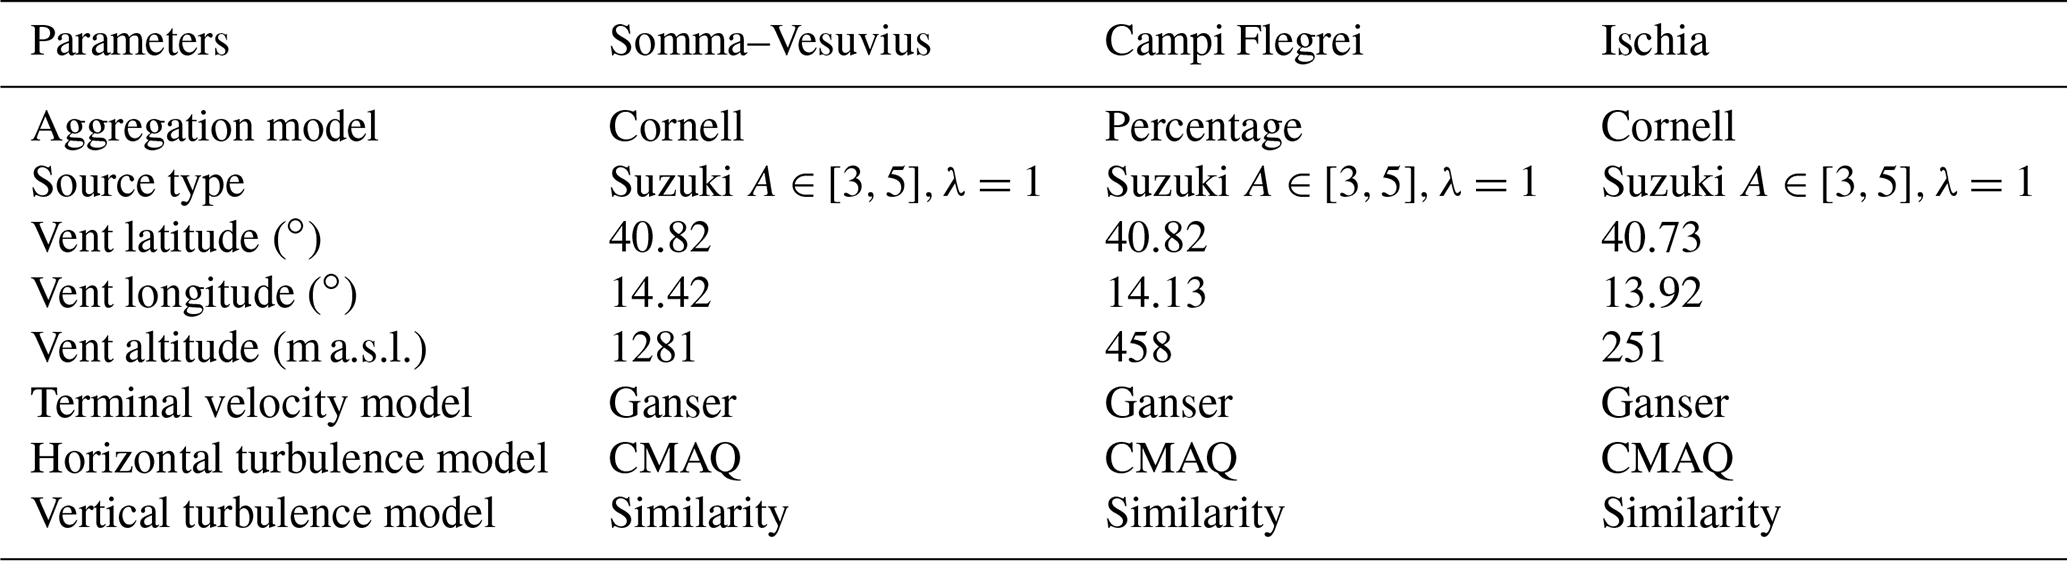
Table A4Some parameters and models used to run numerical simulations in FALL3D v.8.0.
The total erupted mass (TEM) and duration of the fallout phase were randomly sampled from uniform distributions with different ranges for each eruption size class (Sandri et al., 2016; Primerano et al., 2021; Table A1). In this study, we refer to the mass of the fallout phase representing 80 % and 25 % of the total erupted mass (TEM) in the case of Somma–Vesuvius and Campi Flegrei, respectively (Sandri et al., 2016). In the case of Ischia, we assume that the TEM associated with the Cretaio Tephra eruption is almost entirely due to a fallout phase (Primerano et al., 2021).
For Somma–Vesuvius and Campi Flegrei, the mass eruption rate (MER) is assumed to be constant during the eruption, and it was obtained by calculating the ratio between the mass of the fallout phase and its duration. For Ischia, we use the empirical relationship of Mastin et al. (2009), sampling the eruptive column height from a beta distribution (α=2 and β=3, scaled by a factor of 10 km and translated by 5 km such that ) within the interval 5–15 km (as in Primerano et al., 2021). It is worth noting that in the BET workflow, each simulation is weighted according to a power law which depends on the mass of the fallout phase of each eruption size class (Sandri et al., 2016).
Since the dispersion of tephra is strongly influenced by the geometry of the dispersed particles, an accurate characterization of the whole size range of erupted particles is necessary to assign the associated mass and describe the tephra distribution in the proximal and medial areas around the volcano. In this study, TGSD is randomly sampled by a range of values for each size class by assuming a bi-Gaussian distribution (Eq. A1) for the variable Φ (grain size, considering that is the particle diameter in mm):
where p and 1−p are the fine and coarse sub-population weights, and μ1, σ1 and μ2, σ2 are the mean and standard deviation of the two Gaussians, respectively. The five parameters of the distribution (p, μ1, σ1, μ2, σ2) are defined for each eruption size class according to what is reported in the literature (Poret et al., 2020; Mele et al., 2020; Primerano et al., 2021) and randomly sampled from beta distributions (Tables A2, A3). In the case of Ischia, TGSD is estimated following Costa et al. (2016).
For Somma–Vesuvius and Ischia, we consider a bulk class of particles; for Campi Flegrei, the availability of literature data (Mele et al., 2020) allowed Martinéz Montesinos et al. (2022) to consider the representative fractions for juvenile, lithic, and crystal components. Juvenile particles are modeled using a bi-Gaussian distribution, while lithics and crystals through a Gaussian distribution (Mele et al., 2020).
Tephra particle density is set as follows: from 900 to 2500 kg m−3 for Somma–Vesuvius (see Sandri et al., 2016, and references therein) and from 740 to 2460 kg m−3 for Ischia (Primerano et al., 2021). For Campi Flegrei, we distinguished the density of lithics (2500 kg m−3) and crystals (2800 kg m−3) as in Martinéz Montesinos et al. (2022), considering the estimates provided by Mele et al. (2020).
In Table A4 we report the models and other physical parameters used to run the simulations. For each volcano, the emission source term is modeled considering the Suzuki option (Suzuki, 1983; Pfeiffer et al., 2005), which assumes a mushroom-like vertical distribution of emission points depending on two dimensionless parameters λ and A. The parameter λ, introduced by Pfeiffer et al. (2005), controls the distribution of the emitted mass around the maximum, while A controls the vertical location of the maximum of the emission profile. For our applications, λ is set to 1 and A randomly sampled in the range [3,5].
The aggregation of tephra particles affects the sedimentation dynamics and deposition (e.g., Durant et al., 2009; Folch and Sulpizio, 2010). FALL3D, besides the option based on the model of Costa et al. (2013), includes some simple a priori aggregation parameterizations consisting of empirically based predefined fractions of aggregating classes being transferred to one or more classes of aggregates within the eruptive column (i.e., aggregation is performed before transport). We use the Cornell aggregation model (Cornell et al., 1983), selecting a single tephra bin for Somma–Vesuvius (diameter of 200 µm, density sampled within a uniform distribution, 100–600 kg m−3) and Ischia (diameter of 200 µm, density sampled within a uniform distribution, 50–500 kg m−3). For Campi Flegrei, we use the percentage model (Sulpizio et al., 2012), selecting two classes of aggregates for each eruption size class. For accretionary lapilli the diameter is set to 2000 µm, and density is sampled in the range 1000–2000 kg m−3. For other aggregates, the diameter is set to 200 µm, and density varies in the range 100–600 kg m−3 (as in Martinéz Montesinos et al., 2022).
Figure 6 reports the size class disaggregation analysis (see Eq. 5) for Campi Flegrei with a ground load threshold of 300 kg m−2. Here we present the same information for the threshold of 10 kg m−2.
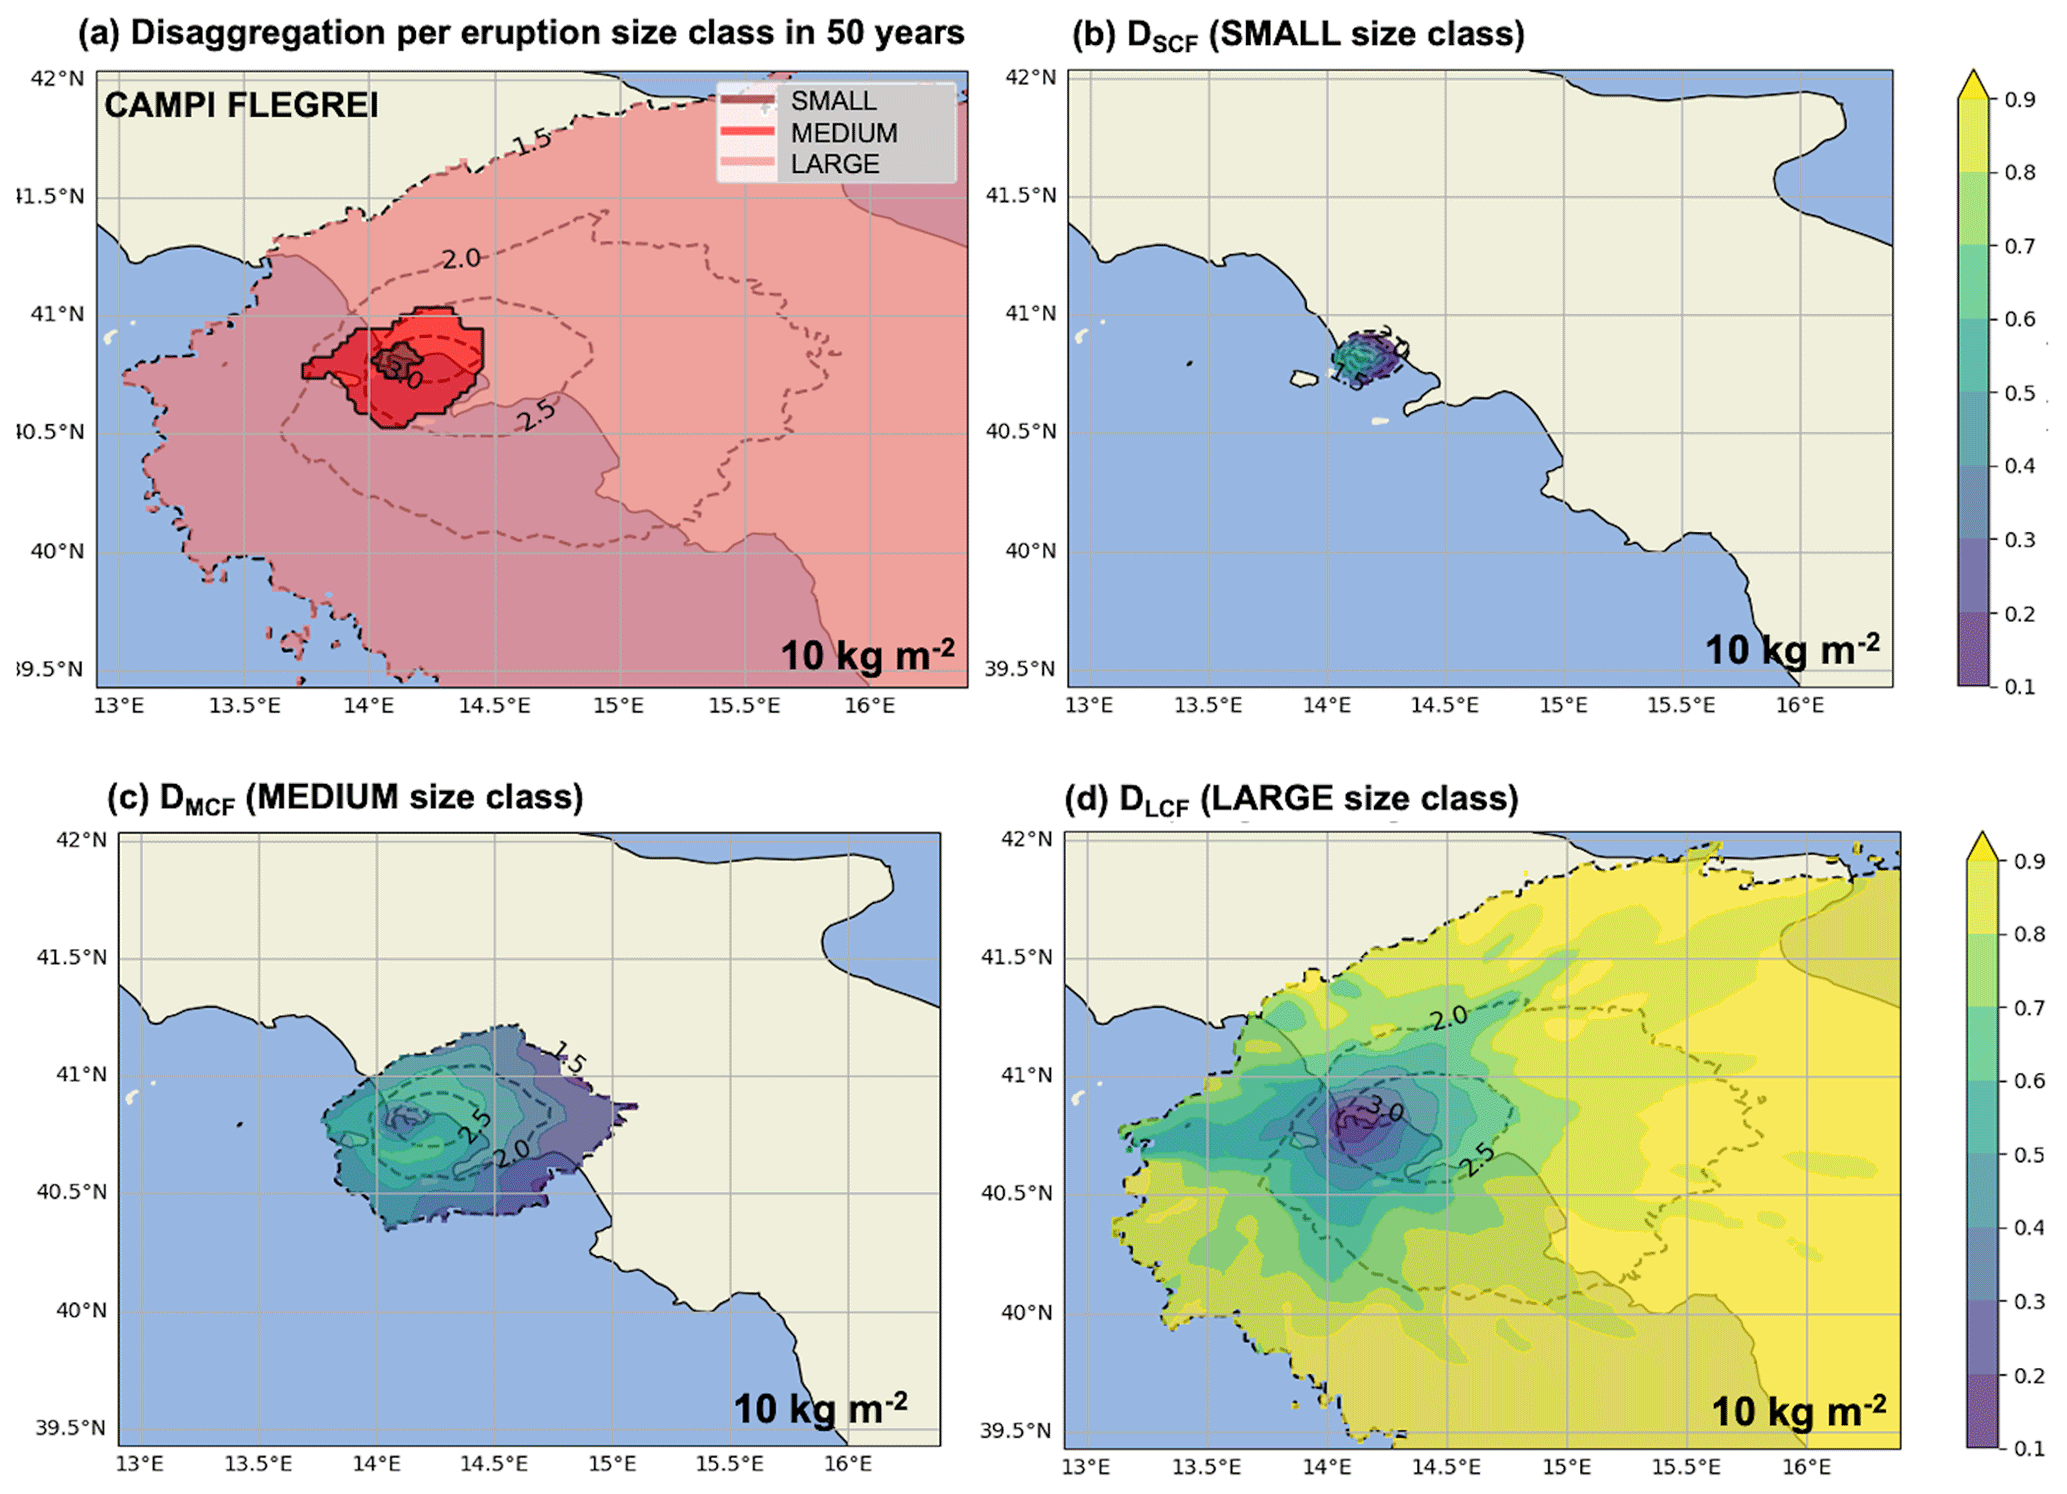
Figure B1Disaggregation per eruption size class. (a) Map showing, in each point, which eruption size class of Campi Flegrei contributes the most to the hazard of overcoming 10 kg m−2 due to the occurrence of eruption in 50 years. Dik of overcoming the threshold is accounted for by (b) small, (b) medium, and (d) large size classes. Dashed black contours represent the isolines of the log 10 number of simulations that produce a tephra ground load exceeding the threshold of 10 kg m−2.
The mean annual rates presented in this appendix have been used in Eq. (3) and have been obtained with the method presented in Selva et al. (2022).
Table C1Mean annual rates (νik) calculated for each eruption size class k of the Somma–Vesuvius, Campi Flegrei, and Ischia volcanoes in 50 years.
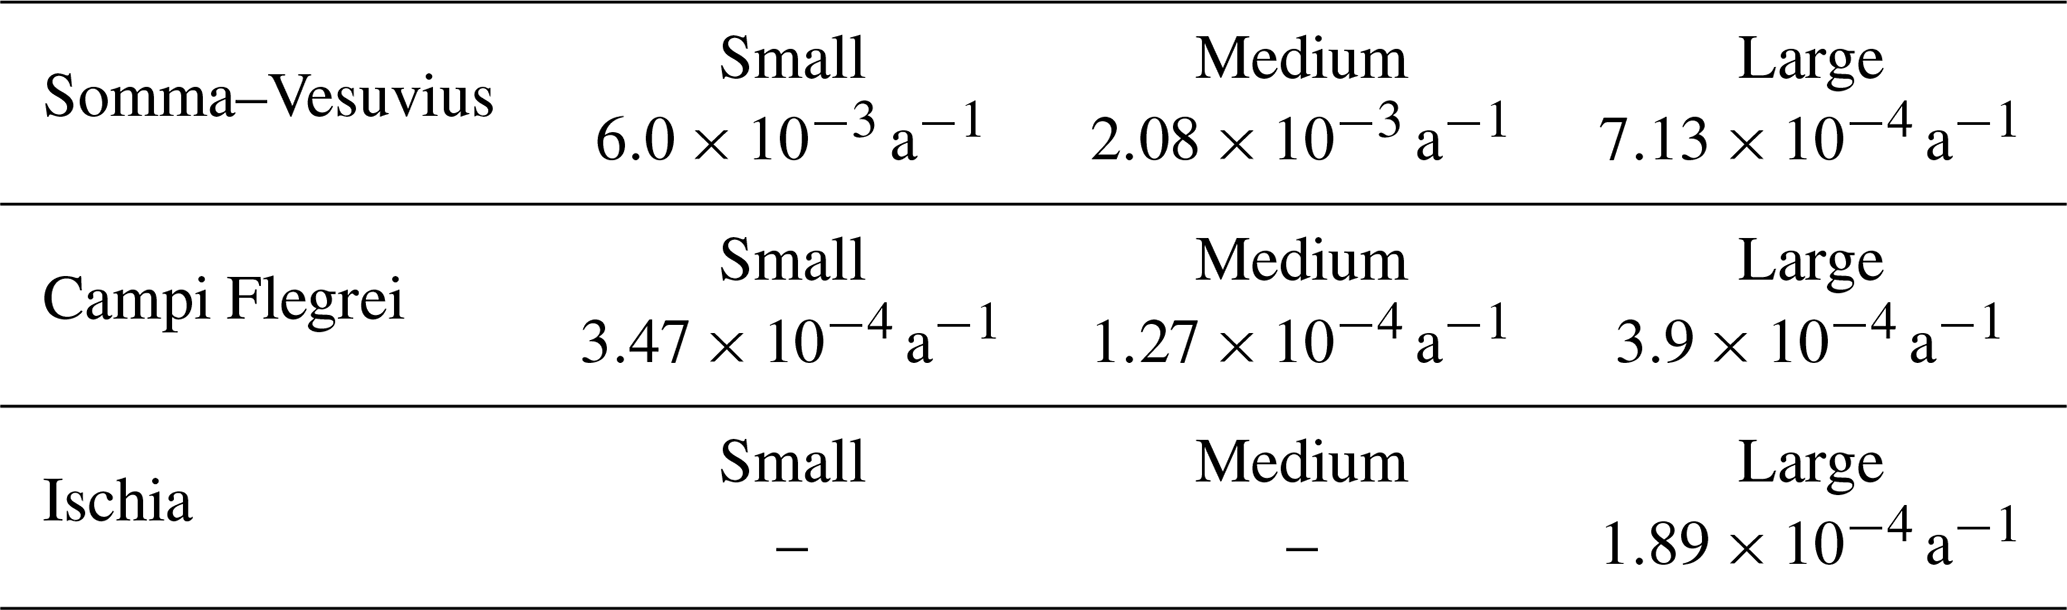
Table C2Mean annual rates (νik) calculated for each eruption size class k of the Somma–Vesuvius, Campi Flegrei, and Ischia volcanoes in 5 years.
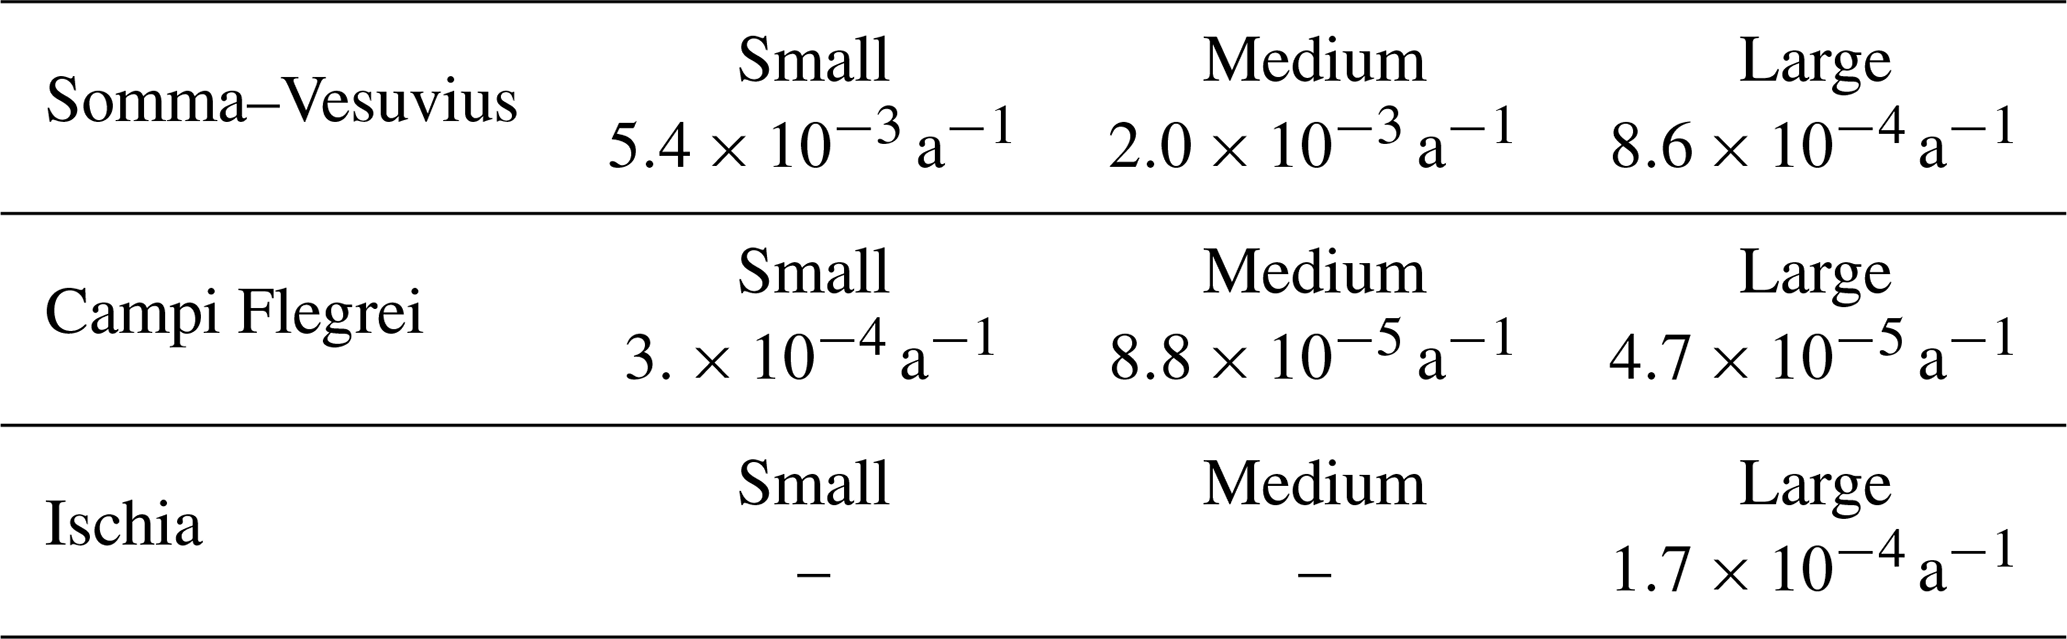
Table C3Mean annual rates (νik) calculated for each eruption size class k of the Somma–Vesuvius, Campi Flegrei, and Ischia volcanoes in 500 years.
NetCDF files containing the long-term hazard map data are available in the Supplement. The codes used for the analysis are available on request by contacting the authors.
The supplement related to this article is available online at: https://doi.org/10.5194/nhess-23-2289-2023-supplement.
AC, LS, JS, and RS: conceptualization and design of the study, analysis and/or interpretation of data, and drafting of the manuscript. BMM, SM, MS, LS, JS, MTL, and AC: coding of the scripts, software and analysis, and interpretation of data. SM, MS, BMM, AC, JS, and LS: drafting of the manuscript. BG, MM, EP, MN, RI, GN, and PD: contributions to the interpretation of the results. AC: coordination of the study. All the authors revised and accepted the submitted version of the manuscript.
The contact author has declared that none of the authors has any competing interests.
Publisher’s note: Copernicus Publications remains neutral with regard to jurisdictional claims in published maps and institutional affiliations.
We thank the Copernicus Climate Change Service ERA5, fifth generation of ECMWF atmospheric reanalyses of the global climate, and the Copernicus Climate Change Service Climate Data Store (CDS) for the access to the meteorological data. MS thanks Stefano Cacciaguerra for the academic and personal support. Giovanni Macedonio and Arnau Folch are warmly acknowledged for very useful and fruitful discussions. We also thank the CSI group of INGV Bologna for the technical support for using the cluster.
The research leading to these results was supported by the Italian Civil Protection Department of the Presidency of the Council of Ministers within the Contratto concernente l'affidamento di servizi per il programma per il supporto al rafforzamento della Governance in materia di riduzione del rischio sismico e vulcanico ai fini di protezione civile nell'ambito del PON Governance e Capacità Istituzionale 2014–2020 (grant no. CIG6980737E65). The simulations for Campi Flegrei were supported by the EU project (ChEESE (grant no. 823844)), and the computational resources were provided within the multi-year PRACE Project Access Volcanic Ash Hazard and Forecast (grant no. 2019215114). This part of the work was granted access to the HPC/AI resources of TGCC (grant no. 2020-RA2020235114) made by GENCI. SM was also supported by the PON Research and Innovation 2014–2020 project referring to research contracts on green topics (grant no. CODICE CUP H95F21001440006). This research was also supported by the RETURN Extended Partnership and received funding from the European Union's NextGenerationEU (National Recovery and Resilience Plan – NRRP, Mission 4, Component 2, Investment 1.3 – D.D. 1243 2/8/2022, PE0000005). Manuel Stocchi was also supported by the PNIR – Programma Nazionale Infrastrutture di Ricerca with the CIR01_00013 project.
This paper was edited by Maria Ana Baptista and reviewed by Ricardo Ramalho and Karoly Nemeth.
Albert, P. G., Giaccio, B., Isaia, R., Costa, A., Niespolo, E., Nomade, S., Pereira, A., Renne, P. R., Hinchliffe, A., Mark, D. F., Brown, R. J., and Smith, V. C.: Evidence for a large-magnitude eruption from Campi Flegrei caldera (Italy) at 29 ka, Geology, 47, 595–599, https://doi.org/10.1130/G45805.1, 2019. a
Alderton, D. and Elias, S. A.: Encyclopedia of Geology (Second edition), Academic Press, Elsevier, ISBN 978-0-323-85447-4, 2020. a
Andronico, D. and Cioni, R.: Contrasting styles of Mount Vesuvius activity in the period between the Avellino and Pompeii Plinian eruptions, and some implications for assessment of future hazards, B. Volcanol., 64, 372–391, https://doi.org/doi.org/10.1007/s00445-002-0215-4, 2002. a
Arrighi, S., Principe, C., and Rosi, M.: Violent strombolian and subplinian eruptions at Vesuvius during post-1631 activity, B. Volcanol., 63, 126–150, https://doi.org/10.1007/s004450100130, 2001. a, b
Aspinall, W., Auker, M., Hincks, T., Mahony, S., Pooley, J., Nadim, F., Syre, E., Sparks, R., and Bank, T.: Volcano hazard and exposure in Track II countries and risk mitigation measures – GFDRR volcano Risk Study, 309, The world bank, NGI Report 20100806, 309 pp., 2011. a
Auker, M. R., Sparks, S., Jenkins, S., Aspinall, W., Brown, S. K., Deligne, N. I., Jolly, G., Loughlin, S., Marzocchi, W., Newhall, C., and Palma, J. L.: Global volcanic hazard and risk, chap. Development of a new global Volcanic Hazard Index (VHI), Cambridge University Press, https://doi.org/10.1017/CBO9781316273, 349–357, 2015. a
Barberi, F., Innocenti, F., Lirer, L., Munno, R., Pescatore, T., and Santacroce, R.: The campanian ignimbrite: a major prehistoric eruption in the Neapolitan area, B. Volcanol., 10–31, https://doi.org/10.1007/BF02597680, 1978. a
Barberi, F., Coltelli, M., Frullani, A., Rosi, M., and Almeida, E.: Chronology ad dispersal characteristics of recently (last 5000 years) erupted tephra of Cotopaxi (Ecuador): implications for long-term eruptive forecasting, J. Volcanol. Geoth. Res., 69, 217–239, https://doi.org/10.1016/0377-0273(95)00017-8, 1995. a
Bazzurro, P. and Cornell, C. A.: Disaggregation of seismic hazard, B. Seismol. Soc. Am., 89, 501–520, https://doi.org/10.1785/BSSA0890020501, 1999. a, b, c
Becerril, L., Bartolini, S., Sobradelo, R., Martí, J., Morales, J. M., and Galindo, I.: Long-term volcanic hazard assessment on El Hierro (Canary Islands), Nat. Hazards Earth Syst. Sci., 14, 1853–1870, https://doi.org/10.5194/nhess-14-1853-2014, 2014. a
Bevilacqua, A., Flandoli, F., Neri, A., Isaia, R., and Vitale, S.: Temporal models for the episodic volcanism of Campi Flegrei caldera (Italy) with uncertainty quantification, J. Geophys. Res.-Solid Earth, 121, 7821–7845, https://doi.org/10.1002/2016JB013171, 2016. a
Biass, S., Scaini, C., Bonadonna, C., Folch, A., Smith, K., and Höskuldsson, A.: A multi-scale risk assessment for tephra fallout and airborne concentration from multiple Icelandic volcanoes – Part 1: Hazard assessment, Nat. Hazards Earth Syst. Sci., 14, 2265–2287, https://doi.org/10.5194/nhess-14-2265-2014, 2014. a
Blong, R.: Volcanic Hazards: A Sourcebok on the effects of eruptions, Elsevier, 76, 113–115, https://doi.org/10.2307/214795, 1984. a, b
Bonadonna, C., Biass, S., Menoni, S., and Gregg, C.: Assessment of risk associated with tephra-related hazards, Elsevier (Hazards and Disasters), https://doi.org/10.1016/B978-0-12-818082-2.00008-1, 329–378, 2021. a
Casadevall, T. J.: The 1989-1990 eruption of Redoubt Volcano, Alaska: impacts on aircrafts operations, J. Volcanol. Geoth. Res., 62, 301–316, https://doi.org/10.1016/0377-0273(94)90038-8, 1994. a
Cioni, R., Santacroce, R., and Sbrana, A.: Pyroclastic deposit as a guide for reconstructing the multi-stage evolution of the Somma-Vesuvius Caldera, B. Volcanol., 61, 207–222, https://doi.org/10.1007/s004450050272, 1999. a
Cioni, R., Longo, A., Macedonio, G., Santacroce, R., Sbrana, A., Sulpizio, R., and Andronico, D.: Assessing pyroclastic fall hazard through field data and numerical simulations: Example from Vesuvius, Chem. Phys. Miner. Rock/Volcanol., 108, 108.B2, https://doi.org/10.1029/2001JB000642, 2003. a, b
Cioni, R., Bertagnini, A., Santacroce, R., and Andronico, D.: Explosive activity and eruption scenarios a Somma-Vesuvius (Italy): Towards a new classification scheme, J. Volcanol. Geoth. Res., 178, 33–346, https://doi.org/10.1016/j.jvolgeores.2008.04.024, 2008. a
Civetta, L., Gallo, G., and Orsi, G.: Sr- and Nd-isotope and trace-element constraints on the chemical evolution of the magmatic system of Ischia (Italy) in the last 55 ka, J. Volcanol. Geoth. Res., 46, 213–230, https://doi.org/10.1016/0377-0273(91)90084-D, 1991. a
Cole, P. D. and Scarpati, P.: The 1944 eruption of Vesuvius, Italy: combining contemporary accounts and field studies for a new volcanological reconstruction, Geol. Mag., 147, 391–415, https://doi.org/10.1017/S0016756809990495, 2010. a, b
Constantinescu, R., Robertson, R., Lindsay, J. M., Tonini, R., Sandri, L., Rouwet, D., Smith, P., and Stewart, R.: Application of the probabilistic model BET_UNREST during a volcanic unrest simulation exercise in Dominica, Lesser Antilles, Geochem. Geophys. Geosyst., 17, 4438–4456, 2016. a
Cornell, C. A.: Engineering seismic risk analysis, B. Seismol. Soc. Am., 58, 1583–1606, 1968. a
Cornell, W., Carey, S., and Sigurdsson, H.: Computer simulation of transport and deposition of the campanian Y-5 ash, J. Volcanol. Geoth. Res., 17, 89–109, https://doi.org/10.1016/0377-0273(83)90063-X, 1983. a
Costa, A., Dell'Erba, F., Di Vito, M. A., Isaia, R., Macedonio, G., Orsi, G., and Pfeiffer, T.: Tephra fallout hazard assessment at the Campi Flegrei caldera (Italy), B. Volcanol., 71, 259–273, 2009. a, b, c, d
Costa, A., Folch, A., and Macedonio, G.: Density-driven transport in the umbrella region of volcanic clouds: Impications for tephra dispersion models, Geophys. Res. Lett., 40, 4823–4827, 2013. a, b, c
Costa, A., Pioli, L., and Bonadonna, C.: Assessing tephra total grain-size distribution: Insights from field data analysis, Earth Planet. Sci. Lett., 443, 90–107, https://doi.org/10.1016/j.epsl.2016.02.040, 2016. a
Costa, A., Di Vito, M. A., Ricciardi, G. P., Smith, V. C., and Talamo, P.: The long and interwined record of humans and the Campi Flegrei volcano (Italy), B. Volcanol., 84, 1–27, 2022. a
de Vita, S., Orsi, G., Civetta, L., Caradente, A., D'Antonio, M., Deino, A. L., di Cesare, T., di Vito, M. A., Fisher, R. V., Isaia, R., Marotta, E., Necco, A., Ort, M. H., Pappalardo, L., Piochi, M., and Southon, J. R.: The Agnano-Monte Spina eruption (4100 years BP) in the restless Campi Flegrei caldera (Italy), J. Volcanol. Geoth. Res., 91, 269–301, https://doi.org/10.1016/S0377-0273(99)00039-6, 1999. a, b
de Vita, S., Sansiviero, F., Orsi, G., Marotta, E., and Piochi, M.: Volcanological and structural evolution of the Ischia resurgent caldera (Italy) over the past 10ky, Geol. Soc. Am., 464, 193–239, 2010. a
De Vivo, B., G., R., and Gans, P.: New constraints on the pyroclastic eruptive history of the Campanian volcanic plain (Italy), Miner. Petrol., 73, 47–65, 2001. a
Deino, A. L., Orsi, G., de Vita, S., and Piochi, M.: The age of Neapolitan Yellow Tuff caldera-forming eruption (Campi Flegrei caldera – Italy) asessed by 40Ar/39Ar dating method, J. Volcanol. Geoth. Res., 133, 157–170, https://doi.org/10.1016/S0377-0273(03)00396-2, 2004. a
Di Vito, M. A., Isaia, R., Orsi, G., Southon, J. R., de Vita, S., D'Antonio, M., Pappalardo, L., and Piochi, M.: Volcanism and deformation since 12,000 years at the Campi Flegrei caldera (Italy), J. Volcanol. Geoth. Res., 91, 221–246, https://doi.org/10.1016/S0377-0273(99)00037-2, 1999. a
Di Vito, M. A., Arienzo, I., Braia, G., Civetta, L., D'Antonio, M., Di Renzo, V., and Orsi, G.: The Averno 2 fissure eruption: a recent small-size expolisve event at the Campi Flegrei Caldera (Italy), B. Volcanol., 73, 295–320, 2011. a
Dipartimento di Protezione Civile: Aggiornamento del Piano nazionale di protezione civile per il Vesuvio, https://www.protezionecivile.gov.it/it/approfondimento/aggiornamento-del-piano-nazionale-di-protezione-civile-il-vesuvio (last access: 16 June 2023), 2019. a, b
Durant, A., Rose, W., Sarna-Wojcicki, A., Carey, S., and Volentik, A.: Hydrometeor-enhanched tephra sedimentation: Constraints from the 18 May 1980 eruption of Mount St. Helens, J. Geophys. Res.-Solid Earth, 114, B3, https://doi.org/10.1029/2008JB005756, 2009. a
Folch, A. and Sulpizio, R.: Evaluating long-range volcanic ash hazard using supercomputing facilities: application to Somma-Vesuvius (Italy), and consequences for civil aviation over the Central Mediterranean area, B. Volcanol., 72, 1039–1059, 2010. a, b, c, d
Folch, A., Mingari, L., Gutierrez, N., Hanzich, M., Macedonio, G., and Costa, A.: FALL3D-8.0: a computational model for atmospheric transport and deposition of particles, aerosols and radionuclides – Part 1: Model physics and numerics, Geosci. Model Dev., 13, 1431–1458, https://doi.org/10.5194/gmd-13-1431-2020, 2020. a, b
Freire, S., Florczyk, A. J., Pesaresi, M., and Sliuraz, R.: An improved global analysis of population distribution in proximity to active volcanoes, 1975–2015, ISPRS Int. J. Geo-Info., 8, 1–35, https://doi.org/10.3390/ijgi8080341, 2019. a
Gerstenberger, M. C., Marzocchi, W., Allen, T., Pagani, M., Adams, J., Danciu, L., Field, E., Fujiwara, H., Luco, N., Meletti, C., and Petersen, M.: Probabilistic Seismic Hazard Analysis at Regional and National Scales: State of the Art and Future Challenges, Rev. Geophys., 58, e2019RG000653, https://doi.org/10.1029/2019RG000653, 2020. a, b, c
Giaccio, B., Hajdas, I., Isaia, R., Deino, A., and Nomade, S.: High-precision 14C and 40Ar/39Ar dating of the Campanian Ignimbrite (Y-5) reconcilies the time scales of climatic-cultural processes at 40ka, Sci. Rep., 7, 1–10, 2017. a
Grezio, A., Babeyko, A., Baptista, M. A., Behrens, J., Costa, A., Davies, G., Geist, E. L., Glimsdal, S., Gonzales, F. I., Griffin, J., Harbitz, C. B., LeVeque, R. J., Lorito, S., Lohvolt, F., Omira, R., Mueller, C., Paris, R., Parsons, T., Polet, J., Power, W., Selva, J., Sorensen, M. B., and Thio, H. K.: Probabilistic tsunami hazard analysis: multiple sources and global application, Rev. Geophys., 55, 1158–1198, 2017. a, b, c
Grunthal, G. and Wahlstrom, R.: New generation of probabilistic seismic hazard assessment for the area Cologne/Aachen considering the uncertainties of the input data, Nat. Hazards, 38, 159–176, 2006. a
Hersbach, H., Bell, B., Berrisford, B., Biavati, P., Horányi, A., Muñoz Sabater, J., Nicolas, J., Peubey, C., Radu, R., Rozum, I., Schepers, D., Simmons, A., Soci, C., Dee, D., and Thépaut, J.: ERA5 hourly data on pressure levels from 1959 to present, 1999–2049, https://doi.org/10.24381/cds.bd0915c6, 2018. a
Jenkins, S. F., Biass, S., Williams, G. T., Hayes, J. L., Tennant, E., Yang, Q., Burgos, V., Meredith, E. S., Lerner, G. A., Syarifuddin, M., and Verolino, A.: Evaluating and ranking Southeast Asia's exposure to explosive volcanic hazards, Nat. Hazards Earth Syst. Sci., 22, 1233–1265, https://doi.org/10.5194/nhess-22-1233-2022, 2022. a
Jenkins, S. J., Wilson, T., Magill, C., Steward, C., Blong, R., Marzocchi, W., Boulton, M., Bonadonna, C., and Costa, A.: Global volcanic hazard and risk, chap. Volcanic ash fall hazard and risk, Cambridge University Press, 173–222, 2015. a, b, c
Lirer, L. and Munno, R.: Il tufo giallo napoletano (Campi Flegrei), Period Mineral, 44, 103–118, 1975. a
Loughlin, S. C., Sparks, S., Brown, S. K., Jenkins, S. F., and Vye-Brown, C. (Eds.): Global volcanic hazard and risk, Cambridge University Press, 389 pp., https://doi.org/10.1017/CBO9781316276273, 2015. a
Macedonio, G., Costa, A., and Folch, A.: Ash fallout scenarios at Vesuvius: Numerical simulations for hazard assessment, J. Volcanol. Geoth. Res., 178, 366–377, https://doi.org/10.1016/j.jvolgeores.2008.08.014, 2008. a, b, c, d
Macedonio, G., Costa, A., Scollo, S., and Neri, A.: Ash fallout scenarios at Vesuvius: numerical simulations and implications for hazard assessment: example from Vesuvius (Italy), J. Appl. Volcanol., 5, 1–19, 2016. a, b
Martinéz Montesinos, B., Titos Luzón, M., Sandri, L., Oleksandr, R., Cheptov, A., Macedonio, G., Folch, A., Barsotti, S., Selva, J., and Costa, A.: On the feasibility and usefulness of high-performance computing in probabilistic volcanic hazard assessment: An application to tephra hazard from Campi Flegrei, Frontiers in Earth Sciences, 1–26, https://doi.org/10.3389/feart.2022.941789, 2022. a, b, c, d, e, f, g, h, i, j
Marzocchi, W. and Bebbington, M. S.: Probabilistic eruption forecasting at short and long time scales, B. Volcanol., 74, 1777–1805, https://doi.org/10.1007/s00445-012-0633-x, 2012. a
Marzocchi, W., Sandri, L., Gasparini, P., Newhall, C., and Boschi, E.: Quantifying probabilities of volcanic events: The example of volcanic hazard at Mount Vesuvius, J. Geophys. Res.-Solid Earth, 109, B11, https://doi.org/10.1029/2004JB003155, 2004. a, b
Marzocchi, W., Sandri, L., and Selva, J.: BET_EF: a probabilistic tool for long- and short-term erution forecasting, B. Volcanol., 70, 623–632, https://doi.org/10.1007/s00445-007-0157-y, 2007. a, b
Marzocchi, W., Sandri, L., and Selva, J.: BET_VH: a probabilistic tool for long-term volcanic hazard assessment, B. Volcanol., 72, 705–716, https://doi.org/10.1007/s00445-010-0357-8, 2010. a, b, c
Marzocchi, W., Newhall, C., and Gordon, W.: The scientific management of volcanic crises, J. Volcanol. Geoth. Res., 247, 181–189, https://doi.org/10.1016/j.jvolgeores.2012.08.016, 2012. a
Marzocchi, W., Selva, J., Costa, A., Sandrri, a., Tonini, R., and Macedonio, G.: Global volcanic hazard and risk, chap. Tephra fall hazard for the Neapolitan area, Cambridge University Press, 139–246, https://doi.org/10.1017/CBO9781316273, 2015. a
Marzocchi, W., Selva, J., and Jordan, T. H.: A unified probabilistic framework for volcanic hazard and eruption forecasting, Nat. Hazards Earth Syst. Sci., 21, 3509–3517, https://doi.org/10.5194/nhess-21-3509-2021, 2021. a, b, c
Massaro, S., Rossi, E., Sandri, L., Bondadonna, C., Selva, j., Moretti, R., and Komorowski, J.-C.: Assessing hazard and potential impact associated with volcanic ballistic projectiles: The example of la Soufriére de Guadeloupe volcano (Lesser Antilles), J. Volcanol. Geoth. Res., 423, 107453, https://doi.org/10.1016/j.jvolgeores.2021.107453, 2022. a
Mastin, L. G., Guffanti, M., Servranckx, R., Webley, P. W., Barsotti, S., Dean, K. G., Durant, A. J., Ewert, J. W., Neri, A., Rose, W. I., Schneider, D. J., Siebert, Lee andStunder, B. J., Swanson, G. L., Tupper, A. C., Volentik, A. C. M., and Waythomas, C. F.: A multidisciplinary effort to assign realistic source parameters to models of volcanic ash-cloud transport and dispersion during eruptions, J. Volcanol. Geoth. Res., 186, 10–21, https://doi.org/10.1016/j.jvolgeores.2009.01.008, 2009. a
Mele, D., Dellino, P., Sulpizio, R., and Braia, G.: A systematic investigation on the aerodynamics of ash particles, J. Volcanol. Geoth. Res., 203, 1–11, 2011. a
Mele, D., Costa, A., Dellino, P., Supizio, R., Dioguardi, F., Isaia, R., and Macedonio, G.: Total grain size distribution of components of fallout deposits and implications on magma fragmentation mechanisms: examples from Campi Flegrei caldera (Italy), B. Volcanol., 82, 1–12, https://doi.org/10.1007/s00445-020-1368-8, 2020. a, b, c, d, e, f, g
Menoni, S., Molinari, D., Parker, D., Ballio, F., and Tapsell, S.: Assessing multifaceted vulnerability and resilience in order to design risk-mitigation, Nat. Hazards, 64, 2057–2082, https://doi.org/10.1007/s11069-012-0134-4, 2012. a
Miller, T. P. and Casadevall, T. J.: Encyclopedia of Volcanoes, chap. Volcanic ash hazards to aviation, Elsevier, ISBN 9780080547985, 2000. a
Mingari, L., Folch, A., Prata, A. T., Pardini, F., Macedonio, G., and Costa, A.: Data assimilation of volcanic aerosol observations using FALL3D+PDAF, Atmos. Chem. Phys., 22, 1773–1792, https://doi.org/10.5194/acp-22-1773-2022, 2022. a
Newhall, C. and Hobblit, R.: Constructing event trees for volcanic crises, B. Volcanol., 64, 3–20, https://doi.org/10.1007/s004450100173, 2002. a
OpenStreetMap contributors: Planet dump retrieved from https://planet.osm.org (last access: 16 June 2023), https://www.openstreetmap.org (last access: 16 June 2023), 2022. a
Orsi, G., Gallo, G., and Zanchi, A.: Simple-shearing block resurgence in caldera depressions. A model from Pantelleria and Ischia, J. Volcanol. Geoth. Res., 47, 1–11, https://doi.org/10.1016/0377-0273(91)90097-J, 1991. a
Orsi, G., D'Antonio, M., de Vita, S., and Gallo, G.: The Neapolitan Yellow Tuff, a large-magnitude trachytic phreatoplinian eruption: eruptive dynamics, magma withdrawal and caldera collapse, J. Volcanol. Geoth. Res., 53, 275–287, https://doi.org/10.1016/0377-0273(92)90086-S, 1992. a
Orsi, G., De Vita, S., and Di Vito, M.: The restless, resurgent Campi Flegrei nested caldera (Italy): constraints on its evolution and configuration, J. Volcanol. Geoth. Res., 74, 179–214, https://doi.org/10.1016/S0377-0273(96)00063-7, 1996. a, b, c, d
Orsi, G., Di Vito, M. A., and Isaia, R.: Volcanic hazard assessment at the restless Campi Flegrei caldera, B. Volcanol., 66, 514–530, https://doi.org/10.1007/s00445-003-0336-4, 2004. a, b, c
Orsi, G., Di Vito, M. A., Selva, J., and Marzocchi, W.: Long-term forecast of eruption style and size at Campi Flegrei caldera (Italy), Earth Planet. Sci. Lett., 287, 265–276, https://doi.org/10.1016/j.epsl.2009.08.013, 2009. a, b, c, d
Pareschi, M. T., Cavarra, L., Favalli, M., Giannini, F., and Meriggi, A.: Natural Hazards, chap. GIS and Volcani Risk, Springer, 361–379, https://doi.org/10.1007/978-94-017-2386-2_16, 2000. a
Pfeiffer, T., Costa, A., and Macedonio, G.: A model for the numerical simulation of tephra fall deposit, J. Volcanol. Geoth. Res., 140, 273–294, https://doi.org/10.1016/j.jvolgeores.2004.09.001, 2005. a, b
Poret, M., Di Donato, M., Costa, A., Sulpizio, R., Mele, D., and Lucchi, F.: Characterizing magma fragmentation and its relationship with eruptive tyles of Somma-Vesuvius Volcano (Naples, Italy), J. Volcanol. Geoth. Res., 393, 106683, https://doi.org/10.1016/j.jvolgeores.2019.106683, 2020. a
Primerano, P., Giordano, G., Costa, A., de Vita, S., and Di Vito, M. A.: Reconstructing fallout features and dispersal of Cretaio Tephra (Ischia Island, Italy) trough field data analysis and numerical modellinng: Implications for hazard assessment, J. Volcanol. Geoth. Res., 415, 107248, https://doi.org/10.1016/j.jvolgeores.2021.107248, 2021. a, b, c, d, e, f, g, h
Rampino, M. and Self, S.: Encyclopedia of Volcanoes, chap. Volcanism and biotic extinctions, Elsevier, Hardback ISBN 9780123859389, eBook ISBN 9780123859396, 2000. a
Rosi, M., Principe, C., and Vecci, R.: The 1631 Vesuvius eruption. A reconstruction based on historical and stratigraphical data, J. Volcanol. Geoth. Res., 58, 151–182, https://doi.org/10.1016/0377-0273(93)90106-2, 1993. a, b
Sandri, Laura ad Jolly, G., Lindsay, J., Howe, T., and Marzocchi, W.: Combining long- and short-term probabilistic volcacnic hazard assessment with cost-benefit analysis to sipport decision making in a volcanic crisis from the Auckland Volcanic Field, New Zealand, B. Volcanol., 74, 7005–723, https://doi.org/10.1007/s00445-011-0556-y, 2012. a
Sandri, L., Tonini, R., Rouwet, D., Constantinescu, R., Mendoza-Rosas, A. T., Andrade, D., and Bernard, B.: Volanic Unrest, Chap. The need to quantify hazard related to Non-magmatic unrest: from BET_EF to BET_UNREST, Volcanic Unrest, 63, https://doi.org/10.1007/978-3-319-58412-6, 2017. a
Sandri, L., Thouret, J.-C., Constantinescu, R., Biass, S., and Tonini, R.: Long-term multi-hazard assessment for El Misti volcano (Perù), B. Volcanol., 76, 1–26, https://doi.org/10.1007/s00445-013-0771-9, 2014. a
Sandri, L., Costa, A., Selva, J., Tonini, R., Macedonio, G., Folch, A., and Sulpizio, R.: Beyond eruptive scenarios: assessing long term tephra fallout hazard assessment from Neapolitan volcanoes, Sci. Rep., 6, 24271, https://doi.org/10.1038/srep24271, 2016. a, b, c, d, e, f, g, h, i, j, k, l, m
Sandri, L., Tierz, P., Costa, A., and Marzocchi, W.: Probabilistic hazard from pyroclastic density currents in the Neapolitan area (Southern Italy), J. Geophys. Res.-Solid Earth, 123, 3474–3500, https://doi.org/10.1002/2017JB014890, 2018. a
Santacroce, R.: Somma-Vesuvius, Quaderni de la Ricerca Scientifica, 235 pp., ISSN 0556-9664, 1987. a
Santacroce, R., Cioni, R., Marianelli, P., Sbrana, A., Sulpizio, Roberto ad Zanchetta, G., Donahue, D. J., and Joron, J. L.: Age and whole rock-glass compositions of proximal pyroclastic from the major explosive eruptions of Somma-Vesuvius: a review as a tool for distal tephrostratigraphy, J. Volcanol. Geoth. Res., 177, 1–18, https://doi.org/10.1016/j.jvolgeores.2008.06.009, 2008. a, b, c
Sbrana, A. and Toccaceli, R.: Carta Geologica della Regione Campania – Foglio 464 – Isola di Ischia, 216 pp. + 1 carta: 10.000, 2011. a
Sbrana, A., Marianelli, P., and Pasquini, G.: Volcanology of Ischia (Italy), J. Maps, 14, 494–503, https://doi.org/10.1080/17445647.2018.1498811, 2018. a
Scandone, R., Bellucci, F., Lirer, L., and Rolandi, G.: The structure of the Campanian Plain and the actiity of the Neapolitan volacanoes (Italy), J. Vocanol. Geoth. Res., 48, 1–31, https://doi.org/10.1016/0377-0273(91)90030-4, 1991. a
Selva, J.: Challenges in uncertainty treatment in volcanic hazard analyses, invited Lecture at Cities on Volcanoes, 11 Conference, 2022, Heraklion (Crete, Greece), 12–17 June 2022, 2022. a, b
Selva, J., Costa, A., Marzocchi, W., and Sandri, L.: BET_VH: exploring the influence f natural uncertainties on long-term hazard from tephra fallout at Campi Flegrei (Italy), B. Volcanol., 72, 717–733, https://doi.org/10.1007/s00445-010-0358-7, 2010. a, b, c, d
Selva, J., Orsi, G., Di Vito, M. A., Marzocchi, W., and Sandri, L.: Probability hazard map for future vent opening at the Campi Flegrei caldera, Italy, B. Volcanol., 74, 497–510, https://doi.org/10.1007/s00445-011-0528-2, 2012. a, b, c, d
Selva, J., Costa, A., Sandri, Laura Macedonio, G., and Marzocchi, W.: Probabilistic short-term volcaninc hazard in phases of unrest: A case study for tephra fallout, J. Geophys. Res.-Solid Earth, 119, 8805–8826, https://doi.org/10.1002/2014JB011252, 2014. a, b, c
Selva, J., Tonini, R., Molinari, I., Tiberti, M. M., Romano, F., Grezio, A., Melini, D., Pianatesi, A., Basili, R., and Lorito, S.: Quantification of source uncerainties in Seismic Probabilistc Tsunami Haard Analysis (SPTHA), Geophys. J. Int., 205, 1780–1803, https://doi.org/10.1093/gji/ggw107, 2016. a
Selva, J., Costa, A., De Natale, G., Di Vito, M. A., Isaia, R., and Macedonio, G.: Sensitivity test and esnemble hazard assessment for tephra fallout at Campi Flegrei, Italy, 1–25, https://doi.org/10.3389/feart.2021.629736, 2018. a, b, c, d, e
Selva, J., Acocella, V., Bisson, M., Caliro, S., Costa, A., Della Seta, M., De Martino, P., de Vita, S., Federico, C., Giordano, G., Martino, S., and Cardaci, C.: ultiple natural hazards at volcanic islands: a review for the Ischia volcano (Italy), J. Appl. Volcanol., 8, 1–43, https://doi.org/10.1186/s13617-019-0086-4, 2019. a, b, c, d, e, f
Selva, J., Sandri, L., Taroni, M., Sulpizio, R., Tierz, P., and Costa, A.: A simple two-state model interprets temporal modulations in eruptive activity and enhances multivolcano hazard quantification, Sci. Adv., 8, 8.44, eabq4415, https://doi.org/10.1126/sciadv.abq4415, 2022. a, b, c, d, e, f, g, h, i, j, k, l, m, n, o
Sevink, J., van Bergen, M. J., vn der Plicht, J., Feiken, H., Anastasia, C., and Huizinga, A.: Robust date for the Bronza Age Avellino eruption (Somma-Vesuvius): 3945 ± 10 calBP (1995 ± 10 calBC), Quaternary Sci. Rev., 30, 1035–1046, https://doi.org/10.1016/j.quascirev.2011.02.001, 2011. a
Sigurdsson, H. and Carey, S.: The Natural History of Pompeii, chap. The Eruption of Vesuvius in A.D: 79, 332–387, Oxford University Press, 37-64. ISBN 0521800544, 9780521800549, 1985. a
Small, C. and Naumann, T.: The global distribution of human population and recent volcanism, Global Environ. Change Part B, 3, 93–109, https://doi.org/10.3763/ehaz.2001.0309, 2001. a
Spence, R. J. S., Kelman, I., Baxter, P. J., Zuccaro, G., and Petrazzuoli, S.: Residential building and occupant vulnerability to tephra fall, Nat. Hazards Earth Syst. Sci., 5, 477–494, https://doi.org/10.5194/nhess-5-477-2005, 2005. a, b, c
Sulpizio, R., Mele, D., Dellino, P., and La Volpe, L.: A complex, Subplinian-type eruption from low-viscosity, phonolitic to tephri-phonolithic magma: the AD 472 (Pollena) eruption of Somma-Vesuvius, Italy, B. Volcanol., 67, 743–767, https://doi.org/10.1007/s00445-005-0414-x, 2005. a, b
Sulpizio, R., Zanchetta, G., Demi, F., Di Vito, M. A., Pareschi, M. T., and Santacroce, R.: Neogene-Quaternary continental marin volcanism: A perspective from México, chap. The Holocene syneruptive volcaniclastic debris flows in the Vesuvian area: Geological data as a guide for hazard assessment, The Geol. Soc. Am., 402, 203–221, https://doi.org/10.1130/2006.2402(10), 2006. a
Sulpizio, R., Bonasia, R., Dellino, P., Mele, D., Di Vito, M. A., and La Volpe, L.: The Pomici di Avellino ruption of Somma-Vesuvius (3.9 ka BP). Part II: sedimentology and physical volcanonology of pyroclastic density current deposits, B. Volcanol., 72, 559–577, https://doi.org/10.1007/s00445-009-0340-4, 2010. a, b, c
Sulpizio, R., Folch, A., Costa, A., Scaini, C., and Dellino, P.: Hazard assessment of far-range volcanic ash dispersal from a violent Strombolian eruption at Somma-Vesuvius volcano, Naples, Itay: implications on civil aviation, B. Volcanol., 74, 2205–2218, https://doi.org/10.1007/s00445-012-0656-3, 2012. a, b, c, d
Sulpizio, R., Zanchetta, G., Caron, B., Dellino, P., Mele, D., Giaccio, B., Insinga, D., Paterne, M., Siani, G., Costa, A., Macedonio, G., and Santacroce, R.: Volcanic ash hazard in the Central Mediterranean assessed from geological data, B. Volcanol., 76, 1–8, https://doi.org/10.1007/s00445-014-0866-y, 2014. a
Suzuki, T.: A theoretical model for dispersion of tephra, Arc Volcanism: Physics and Tectonics, 113, 95–113, 1983. a
Swords-Daniels, V.: Living with Volcanic Risk: The consequences of, and Response to, ongoing volcanic ashfall from a social infrastructures systems perspective on Montserrat, New Zealand J. Psychol., 40, 131, 2011. a
Tesche, M., Glantz, P., Johansson, C., Norman, M., Hiebsch, A., Ansmann, A., Althausen, A., Engelmann, R., and Seifert, P.: Volcanic ash over Scandinavia originating from the Grímsvo otn eruptions in May 2011, J. Geophys. Res.-Atmos., 117, D9, https://doi.org/10.1029/2011JD017090, 2012. a
Thompson, M. A. and Lindsay, Jan M. an Gaillard, J.: The influence of probabilistic volcanic hazard map properties on hazard communication, J. Appl. Volcanol., 4, 1–24, https://doi.org/10.1186/s13617-015-0023-0, 2015. a
Titos, M., Martínez Montesinos, B., Barsotti, S., Sandri, L., Folch, A., Mingari, L., Macedonio, G., and Costa, A.: Long-term hazard assessment of explosive eruptions at Jan Mayen (Norway) and implications for air traffic in the North Atlantic, Nat. Hazards Earth Syst. Sci., 22, 139–163, https://doi.org/10.5194/nhess-22-139-2022, 2022. a
Tonini, R., Sandri, L., and Thompson, M. A.: PyBethVH: A Python tool for probabilistic volcanic hazard assessment and for Generation of Bayesian hazard curves and maps, Comput. Geosci., 79, 38–46, https://doi.org/10.1016/j.cageo.2015.02.017, 2015. a, b
Vezzoli, L. and Barberi, F.: Progetto finalizzato geodinamica: monografie finali. X: Island of Ischia, Quaderni de la RIcerca Scientifica, 114, 1–123, 1988. a
Wilson, G., Wilson, T. M., Deligne, N. I., and Cole, J. W.: Volcanic hazard impacts to critical infrastructures: A review, J. Volcanol. Geoth. Res., 286, 148–182, https://doi.org/10.1016/j.jvolgeores.2014.08.030, 2014. a
Wilson, T. M., Stewart, C., Sword-Daniels, V., Leonard, G. S., Johnston, D. M., Cole, J. W., Wardman, J., Wilson, G., and Bernard, S. T.: Volcanic ash impacts on critical infrastructures, Phys. Chem. Earth, Parts A/B/C, 45–46, 5–23, https://doi.org/10.1016/j.pce.2011.06.006, 2012. a, b, c
Wilson, T. M., Deligne, N. I., Blake, D. M., and Cole, J. W.: Framework for developing volcanic fragility and vulnerability functions for critical infrastructures, J. Appl. Volcanol., 6, 1–24, 2017. a, b
Zuccaro, G., Leone, M. F., Del Cogliano, D., and Sgroi, A.: Economic impact of explosive volcanic eruptions: a simulation-based assessment model applied to Campania region volcanoes, J. Volcanol. Geoth. Res., 226, 1–15, 2013. a
- Abstract
- Introduction
- Eruptive history of Neapolitan volcanoes
- Methodology
- Results and discussion
- Conclusions
- Appendix A: definition and sampling of the eruptive source parameters
- Appendix B: disaggregation per eruption size class for Campi Flegrei
- Appendix C: mean annual eruption rates
- Code and data availability
- Author contributions
- Competing interests
- Disclaimer
- Acknowledgements
- Financial support
- Review statement
- References
- Supplement