the Creative Commons Attribution 4.0 License.
the Creative Commons Attribution 4.0 License.
 | 25 May 2023
Optimal probabilistic placement of facilities using a surrogate model for 3D tsunami simulations
Kenta Tozato
Shuji Moriguchi
Shinsuke Takase
Yu Otake
Michael R. Motley
Anawat Suppasri
Kenjiro Terada
This study proposes a framework for utilizing results obtained from advanced numerical simulations and performing probabilistic tsunami hazard assessment for investigating optimal facility placement. A set of numerical simulations of the tsunami off the Pacific coast caused by the 2011 Tohoku earthquake are performed considering uncertainties in fault parameters. Both inundation depths and tsunami forces acting on buildings are numerically simulated and defined as tsunami hazard indices. Proper orthogonal decomposition is then applied to numerical results for extracting characteristic spatial modes, which can be used to construct surrogate models. Monte Carlo simulations (MCSs) were performed at a low computational cost using surrogate models. The optimal placement of facilities was probabilistically investigated with the help of genetic algorithms using the MCS results along with the concept of system failure probability. The results indicate that the proposed framework allows determining the optimal placement of facilities by applying different strategies at low computational costs while effectively reflecting the results of advanced tsunami simulations.
- Article
(18356 KB) - Full-text XML
- BibTeX
- EndNote


A tsunami is a natural disaster that has a large geological impact, with a recent example of the global 2022 Tonga tsunami (Omira et al., 2022; Kubota et al., 2022). Hazard prediction using numerical methods is essential for reducing the damage caused by tsunamis. Numerical analysis techniques for tsunamis have developed considerably over the years, and high-accuracy hazard assessments and predictions have now become possible (Qin et al., 2018; Xiong et al., 2019). Natural disasters such as tsunamis have numerous uncertainties (Grezio et al., 2017), and therefore, conducting probabilistic hazard assessments that consider such factors is of high importance. Advanced numerical analyses are often unsuitable for probabilistic hazard assessment because they require a large number of calculation cases. Therefore, it is necessary to develop a framework that effectively uses few but reliable numerical simulation results for a probabilistic assessment.
Probabilistic analyses of natural disasters have been performed for many years in the fields of seismology. Among these, the study by Cornell (Cornell, 1968) is considered groundbreaking. Many research results have been reported on probabilistic seismic hazard analyses (PSHAs) (McGuire, 1977; Ishikawa and Kameda, 1988). Probabilistic tsunami hazard analyses (PTHAs) have been performed based on PSHAs, to investigate the relationship between tsunami heights and their exceedance probabilities in a specified period (Geist and Parsons, 2006; Annaka et al., 2007; Fukutani et al., 2015; Mori et al., 2017; Omira et al., 2016). Some other studies focused on actual regions such as the southeast Aegean Sea (Mitsoudis et al., 2012), Makran subduction zone (Heidarzadeh and Kinjo, 2011; El-Hussain et al., 2016), Cascadia subduction zone (Park and Cox, 2016; LeVeque et al., 2016; Salmanidou et al., 2021), Nankai Trough subduction zone (Nakano et al., 2020; Baba et al., 2022), and other regions (Sørensen et al., 2012; Omira et al., 2015). In addition, slip distributions have been investigated based on probabilistic approaches (LeVeque et al., 2016; Nakano et al., 2020; Scala et al., 2020). Moreover, numerous studies have been conducted to efficiently utilize numerical simulations by constructing surrogate models and utilizing them in PTHAs. For example, response surface-based approaches that use a polynomial functions (Kotani et al., 2020), a radial basis function (Gopinathan et al., 2021), and Gaussian process regression (Salmanidou et al., 2021; Alhamid et al., 2022) have been reported. A surrogate model constructed based on the concept of the singular value decomposition is noteworthy because spatial modes are utilized efficiently (Fukutani et al., 2021).
The appropriate placement of infrastructure and evacuation facilities is important to mitigate the tsunami impact on coastal communities. Several studies have used a probabilistic approach for the optimal placement of network systems and facilities considering the uncertainties of disasters such as earthquakes or tsunamis. These studies focused on risk assessments for infrastructure system networks (Gomez and Baker, 2019; Miller and Baker, 2015), optimization of relief supply bases and their delivery (Cavdur et al., 2020a, b; Maharjan and Hanapla, 2020), optimal placement of public and evacuation facilities (Park et al., 2012; Zhang and Yun, 2019; Doerner et al., 2008), emergency medical service networks (Mohamadi and Yaghoubi, 2017), and optimal allocation of budgets for disaster countermeasures (Rawls and Turnquist, 2010).
As discussed above, many research studies exist on PTHAs and the probabilistic optimal placement of facilities; however, only a few studies efficiently used the results obtained from advanced numerical analysis. In this study, we applied mode decomposition using proper orthogonal decomposition (POD) (Kerschen et al., 2005) to enable effective use of data by extracting data characteristics or reducing data dimensions. The POD is often treated as an equivalent of the Karhunen–Loève decomposition developed by Karhunen (1947) or Kosambi (1943), or the principal component analysis (PCA) (Jolliffe and Cadima, 2016) developed by Hotelling (1933). POD has numerous applications in a wide range of fields, and there are various application examples in the fields of both seismic and tsunami engineering. For example, Ha et al. (2008) applied POD for reducing computational costs to construct a tsunami surrogate model. LeVeque et al. (2016) and Melgar et al. (2016) applied the Karhunen–Loève expansion for considering the fault slip distribution under various scenarios. In addition, Nojima et al. (2018) conducted research on the combination of singular value decomposition and numerical simulations to predict the distribution of strong motion; Bamer and Bucher (2012) used nonlinear finite element methods to construct a surrogate model using POD for predicting the behavior of buildings. Moreover, Fukutani et al. (2021) constructed a surrogate model that used POD to implement probabilistic inundation assessments. POD can extract features of spatial and temporal distributions of risk indices, and therefore it is suitable for constructing surrogate models for disaster hazard assessment.
Given this context, we constructed a surrogate model by applying POD to advanced three-dimensional (3D) tsunami simulations. We propose a method in which this surrogate model is used to efficiently investigate the optimal placement of facilities such as infrastructure facilities, relief supply bases, and evacuation shelters based on the probability theory. Research examples of PTHAs using surrogate models of numerical simulations include the previously mentioned approach of using mode decomposition by Fukutani et al. (2021) and the approach of using response surfaces by Kotani et al. (2020). However, to the best of our knowledge, there is no study that investigates the optimal placement of facilities based on probability theory using a surrogate model. We constructed a surrogate model using mode decomposition based on the results obtained from advanced numerical simulations. We also developed a method that can efficiently investigate the optimal placement of facilities based on the probability theory using this surrogate model.
The rest of this paper is organized as follows. Section 2 describes the framework and methods used in this study. In Sect. 3, we applied the proposed method to the Great East Japan Earthquake (Tsuji et al., 2011) as an application example that considers the actual damage, and we validated the constructed surrogate model. We also implemented Monte Carlo simulations to conduct probabilistic risk assessments. Furthermore, the Monte Carlo simulation results and a genetic algorithm were integrated to investigate the optimal placement of facilities, and the usefulness of the proposed method was discussed. Finally, Sect. 4 describes the conclusions.
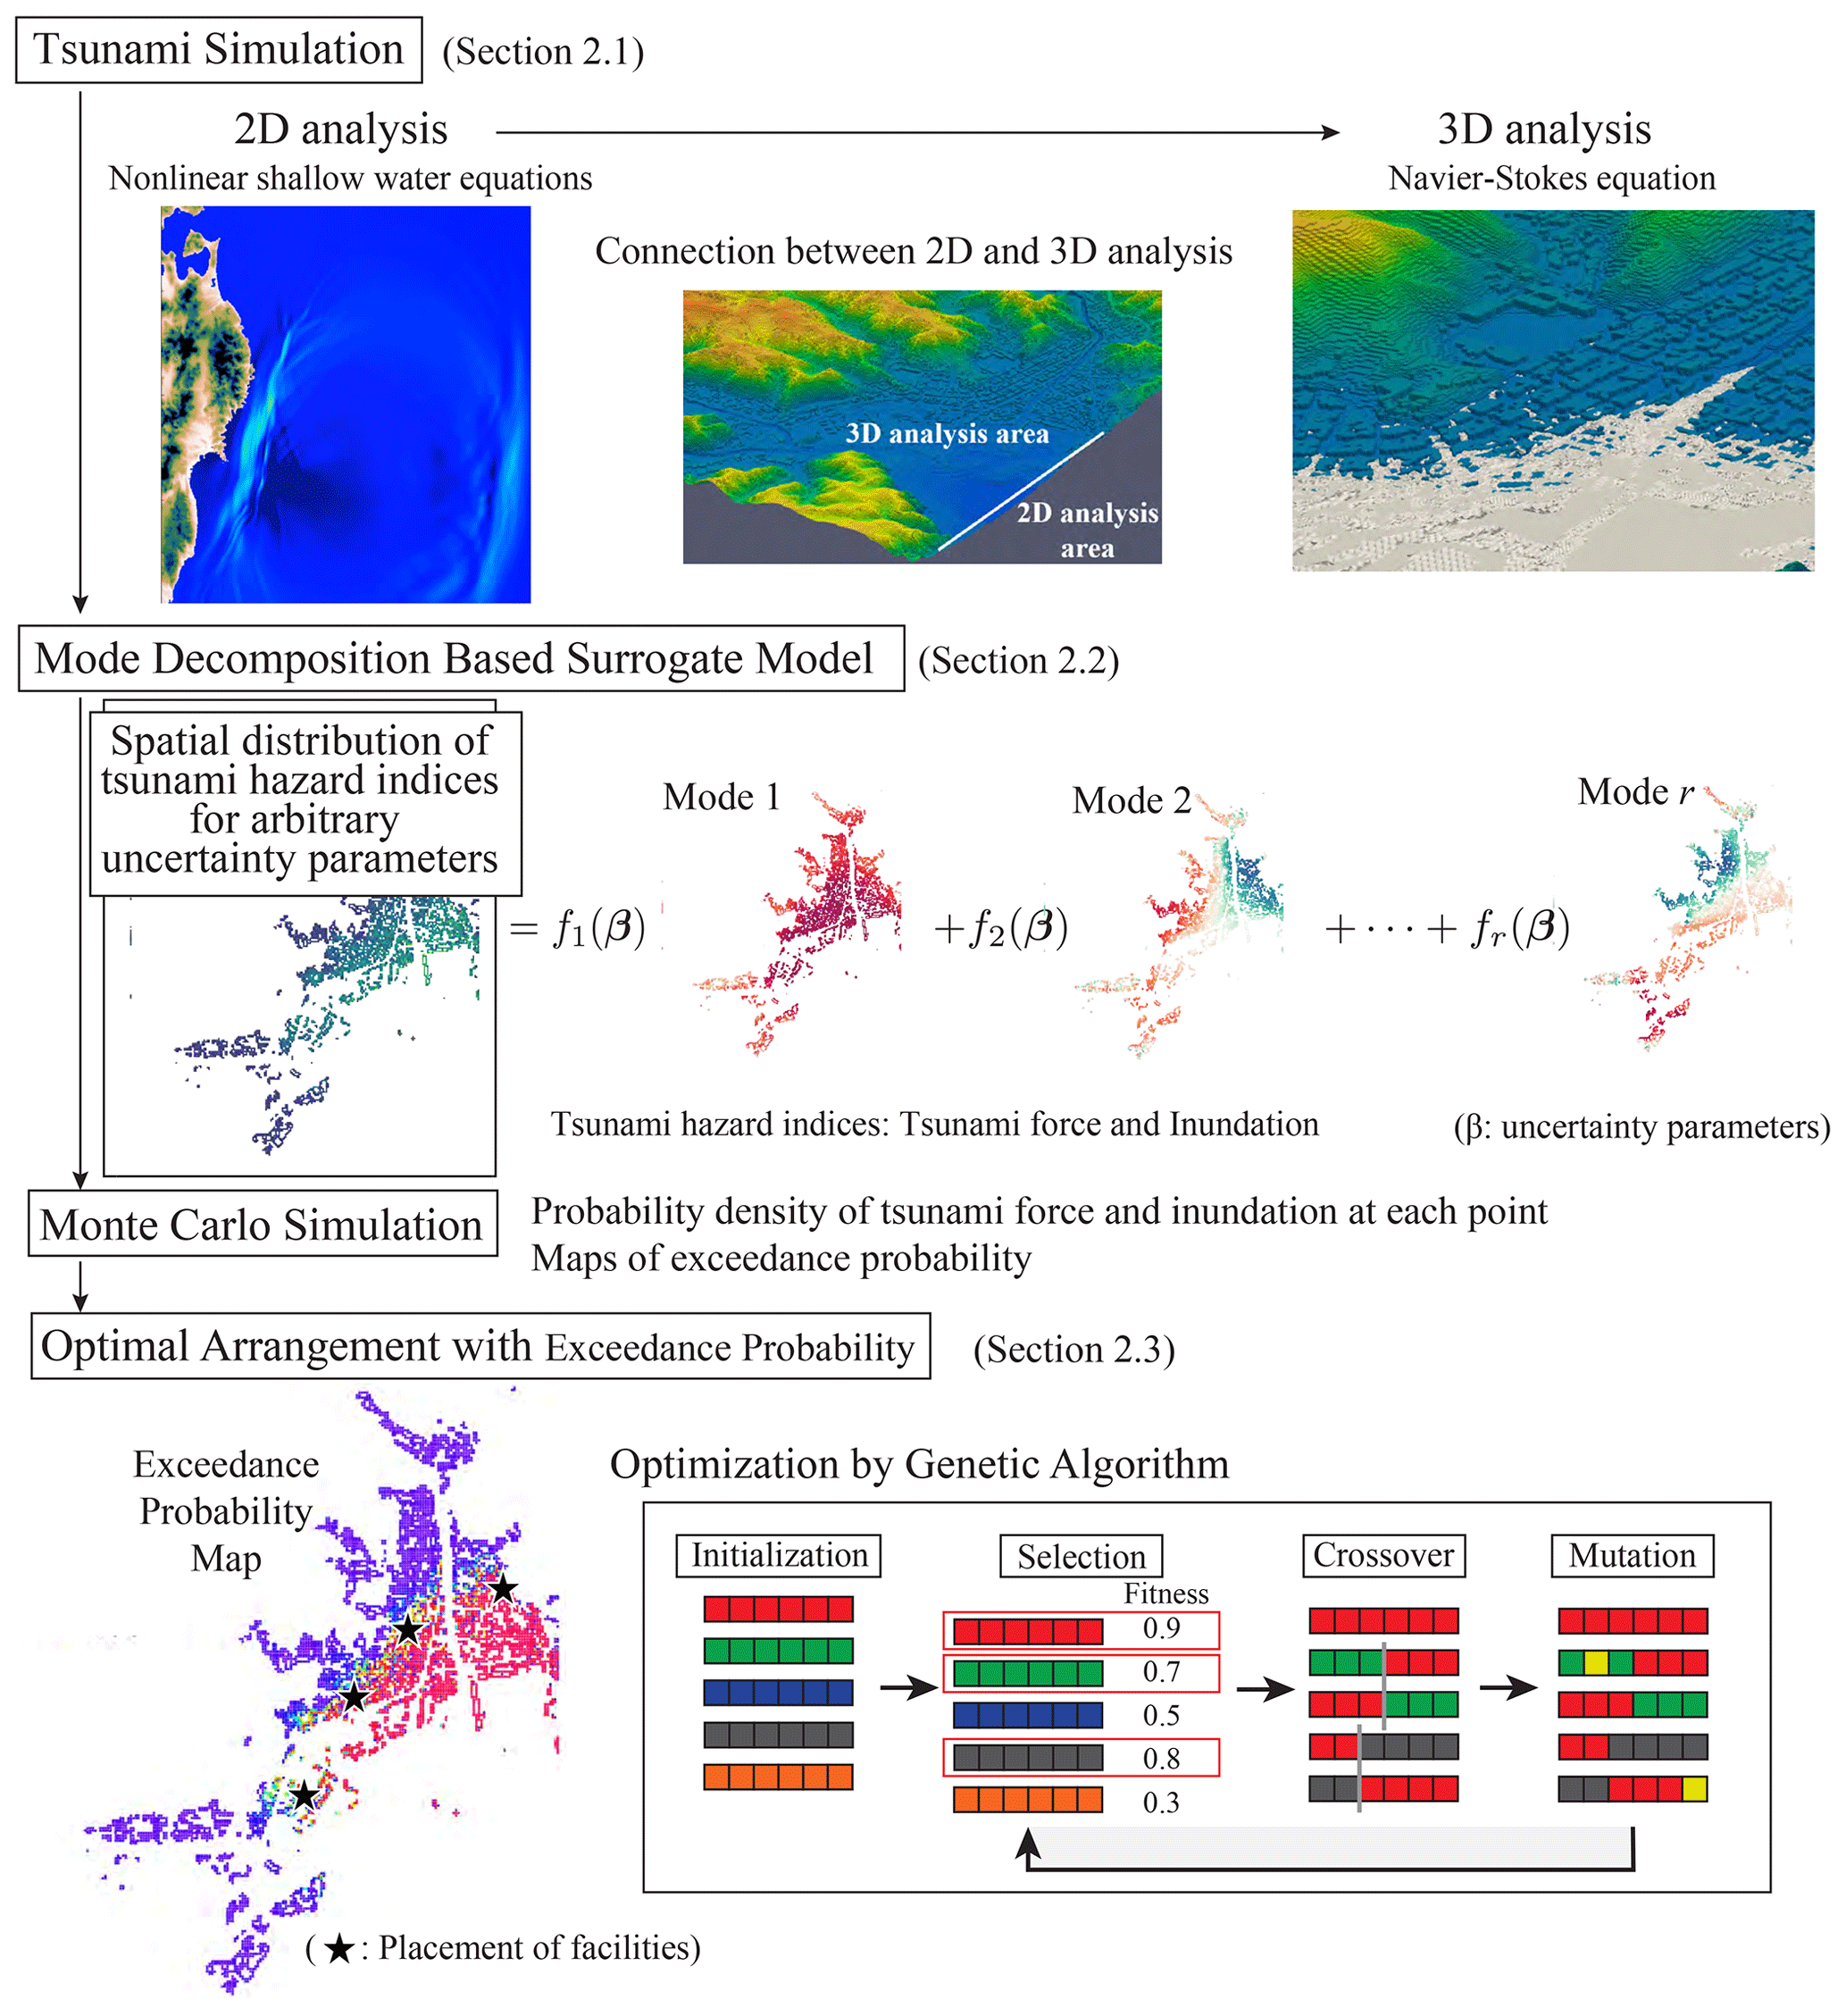
Figure 1Flowchart of probabilistic tsunami hazard analysis using the mode-decomposition-based surrogate model.
A combined two-dimensional (2D) and 3D tsunami analysis was conducted for multiple scenarios with different fault parameters. The maximum tsunami fluid force and maximum inundation depth were adopted as the assessment indicators. The POD was applied to results obtained from these analyses to extract the spatial modes of the tsunami force and inundation depth; these spatial modes were used to construct a surrogate model. Based on this model, the spatial distribution of the tsunami hazard index for an arbitrary scenario can be calculated with a low computational cost. This surrogate model and the uncertainty parameter fluctuation information were combined to implement a Monte Carlo simulation, and the probability distribution of the tsunami force and inundation depth was computed at each assessment point. A threshold value was set to create an exceedance probability map. Finally, the Monte Carlo simulation results and a genetic algorithm were integrated to investigate the optimal facility placement. Figure 1 shows a flowchart of this study.
2.1 Tsunami simulation method
Numerical analyses were conducted to construct a surrogate model of each tsunami hazard index in the target region. A numerical analysis that combined 2D and 3D analyses was conducted. First, a wide-area 2D tsunami analysis was performed; then, the time history of the tsunami wave height and flow velocity observed offshore of the target area were acquired. In this study, the analyses were conducted using TUNAMI-N2 (Imamura, 1995; Goto et al., 1997). The following continuity and nonlinear longwave equations were solved in the 2D analysis:
where M, N, η, D, g, and n represent the flow rate in the x direction, flow rate in the y direction, water level, total water depth, gravitational acceleration, and Manning roughness coefficient, respectively.
The obtained tsunami wave height and flow velocity were set as boundary conditions, and the tsunami waves reaching the target area were analyzed. The method proposed by Takase et al. (2016) is used for the boundary conditions of the 2D and 3D analyses. The time-series data of the wave height and flow velocity obtained from the 2D wide-area analysis were stored and transferred to the 3D numerical analysis by linear interpolation in space. The interpolated values were input to the 3D analysis as input data.
A 3D analysis was performed to assess the fluid force acting on the buildings in the target area. We employed the following set of 3D Navier–Stokes and continuity equations in the analysis domain Ωns∈R3
where ρ, u, σ, and f represent the mass density, velocity vector, stress tensor, and body force vector, respectively. Further, assuming a Newtonian fluid, the stress is calculated as
where p, μ, and ε(u) represent the pressure, coefficient of viscosity, and velocity gradient tensor, respectively. ε(u) is defined as
A stabilized finite element method (SFEM) is used to solve the governing equations of the 3D simulation. The detailed explanation of the numerical method used in this study is described in the relevant paper (Tozato et al., 2022). For the tsunami uncertainty, two fault parameters were adopted as uncertainty parameters, and the numerical analyses were conducted for several scenarios in which these parameters were changed. The specific analysis area setting conditions are presented in Sect. 3.
2.2 Construction of the surrogate model using mode decomposition
POD was used to extract the spatial characteristic modes from the results of the numerical analysis. To apply POD, a column vector xi (called a data vector) was defined to accommodate a tsunami hazard index, for which we selected the spatial distribution of either the maximum impact force acting on the buildings or the maximum inundation depth obtained from a numerical simulation for scenario i. If there are n evaluation points, xi has n components. Then, a data matrix was created by arranging all data vectors according to a certain rule to be used for a target of POD.
where N refers to the number of scenarios. Furthermore, the vertical line in Eq. (8) was used to indicate that the data vector is a column vector. Using this matrix, the covariance matrix of the data was expressed in the form of C=XXT. The eigenvalues and eigenvectors represent the variances and spatial modes. We assumed that eigenvalues were arranged in the descending order from the first mode; the eigenvalue and eigenvector corresponding to the jth mode were expressed as λj and uj, respectively. Furthermore, in POD, the contribution rate of each mode is often used as a criterion for determining the number of dimensions to be reduced. The contribution rate is an index that shows how much each mode explains the data. The contribution rate of the jth mode dj is expressed using the eigenvalues as
Singular value decomposition was used to express the data matrix using the eigenvalue λj and eigenvector uj:
where U, Σ, V, p, and AT=ΣVT represent a matrix in which modes are arranged in the column direction, a matrix in which the square roots of the eigenvalues are arranged in diagonal terms, a matrix in which the eigenvectors of XTX are arranged, the number of eigenvalues greater than zero, and a matrix in which the POD coefficients are arranged, respectively. The relationship of singular value decomposition for the result of one scenario is given as
where αik donates the ik component of matrix A in which the POD coefficients are arranged. When removing modes with low explainability for data, the data vector was expressed approximately as a linear combination that excludes the modes with a low contribution rate by determining the number of modes r to be reduced from the contribution rate or other indices.
A reduction in dimensions results in a loss of information contained in the omitted modes. If these data xi are the result of the uncertainty parameter βi, the POD coefficients of any uncertainty parameter β can be expressed. Therefore, next, the POD coefficients αik are expressed as functions of the uncertainty parameter. The surrogate model can be expressed as a function of the uncertainty parameter for each corresponding mode.
Radial basis functions (RBFs) (Buhmann, 1990) were used as interpolation functions to handle cases where analysis scenarios were not evenly arranged in the parameter space. The function fk(β) corresponding to mode k can be expressed as
where βi w, ϕ(β,βi), and γ represent the input parameter group for scenario i, weight, basis function, and a parameter that determines the smoothness of the function, respectively. The weights of RBF interpolation can be obtained by substituting the correspondence between the known input parameter βi and POD coefficient αik that expresses the output result.
They can be expressed in their respective bold forms as
where αk represents a vector in which the coefficients of the kth mode are arranged and wk represents a vector in which the weights of fk(β) are arranged. The function using the weight obtained in Eq. (15) is expressed as an interpolation that passes through all referenced data points. However, cases in which referenced data points change or oscillate at a local level can result in interpolation with a minor physical meaning. To resolve such issues, we introduced a regularization term for computing the weights. We introduced L2 regularization called ridge regression (Hoerl and Kennard, 1970); weight wk was obtained by solving the following optimization problem.
This process is used in the field of machine learning to prevent overfitting. Here, λ indicates the degree of regularization. Introducing the regularization term allows suppressing the local oscillations and enabling smooth interpolations. However, care must be taken for cases in which regularization is introduced because this may not pass through all data points. Furthermore, the accuracy of interpolation depends on the RBF parameter γ and regularization parameter λ, and therefore, these parameters must be determined appropriately. In this study, a combination of these parameters was determined by cross-validation (Stone, 1947) and Bayesian optimization (Močkus, 1975).
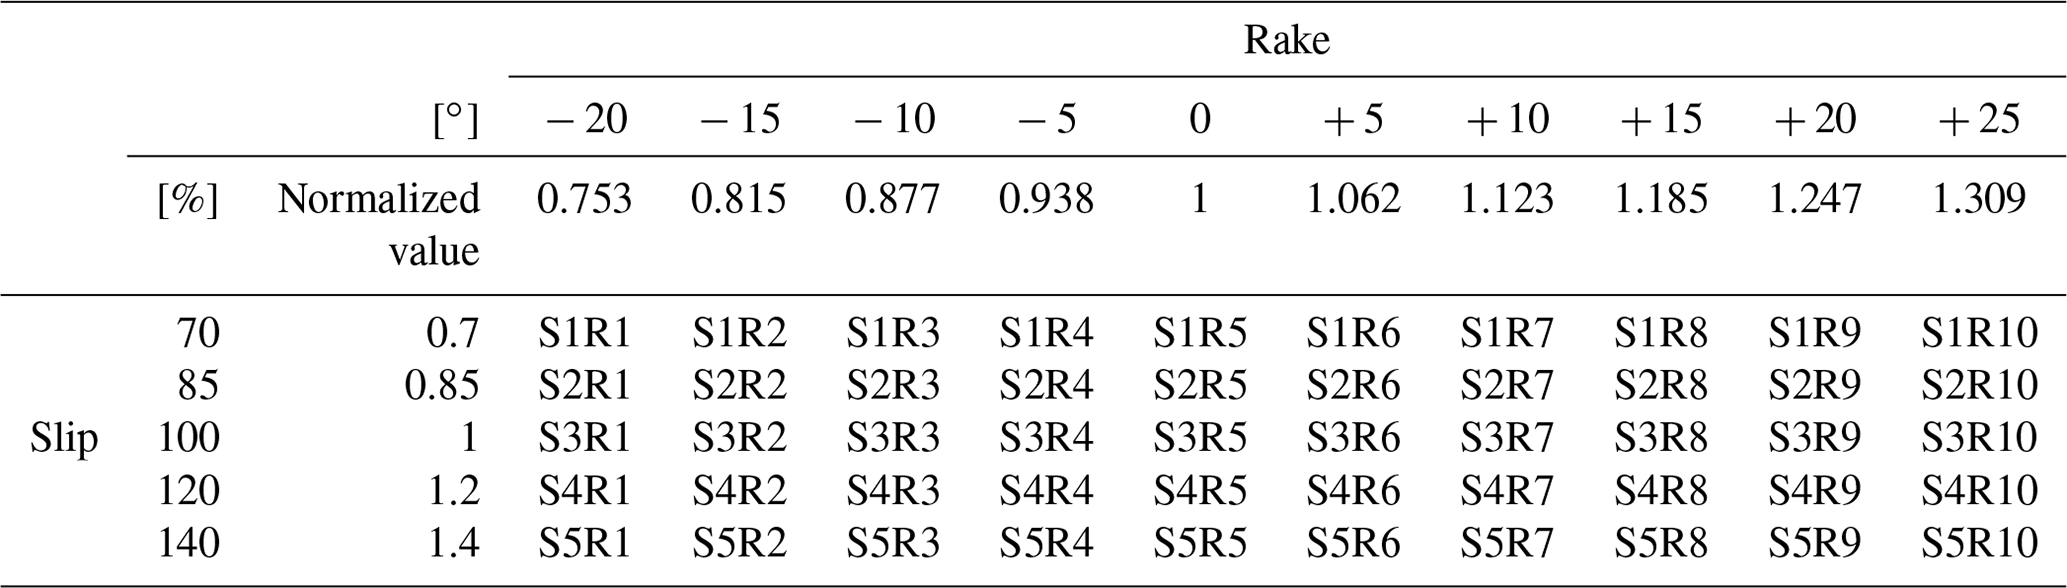
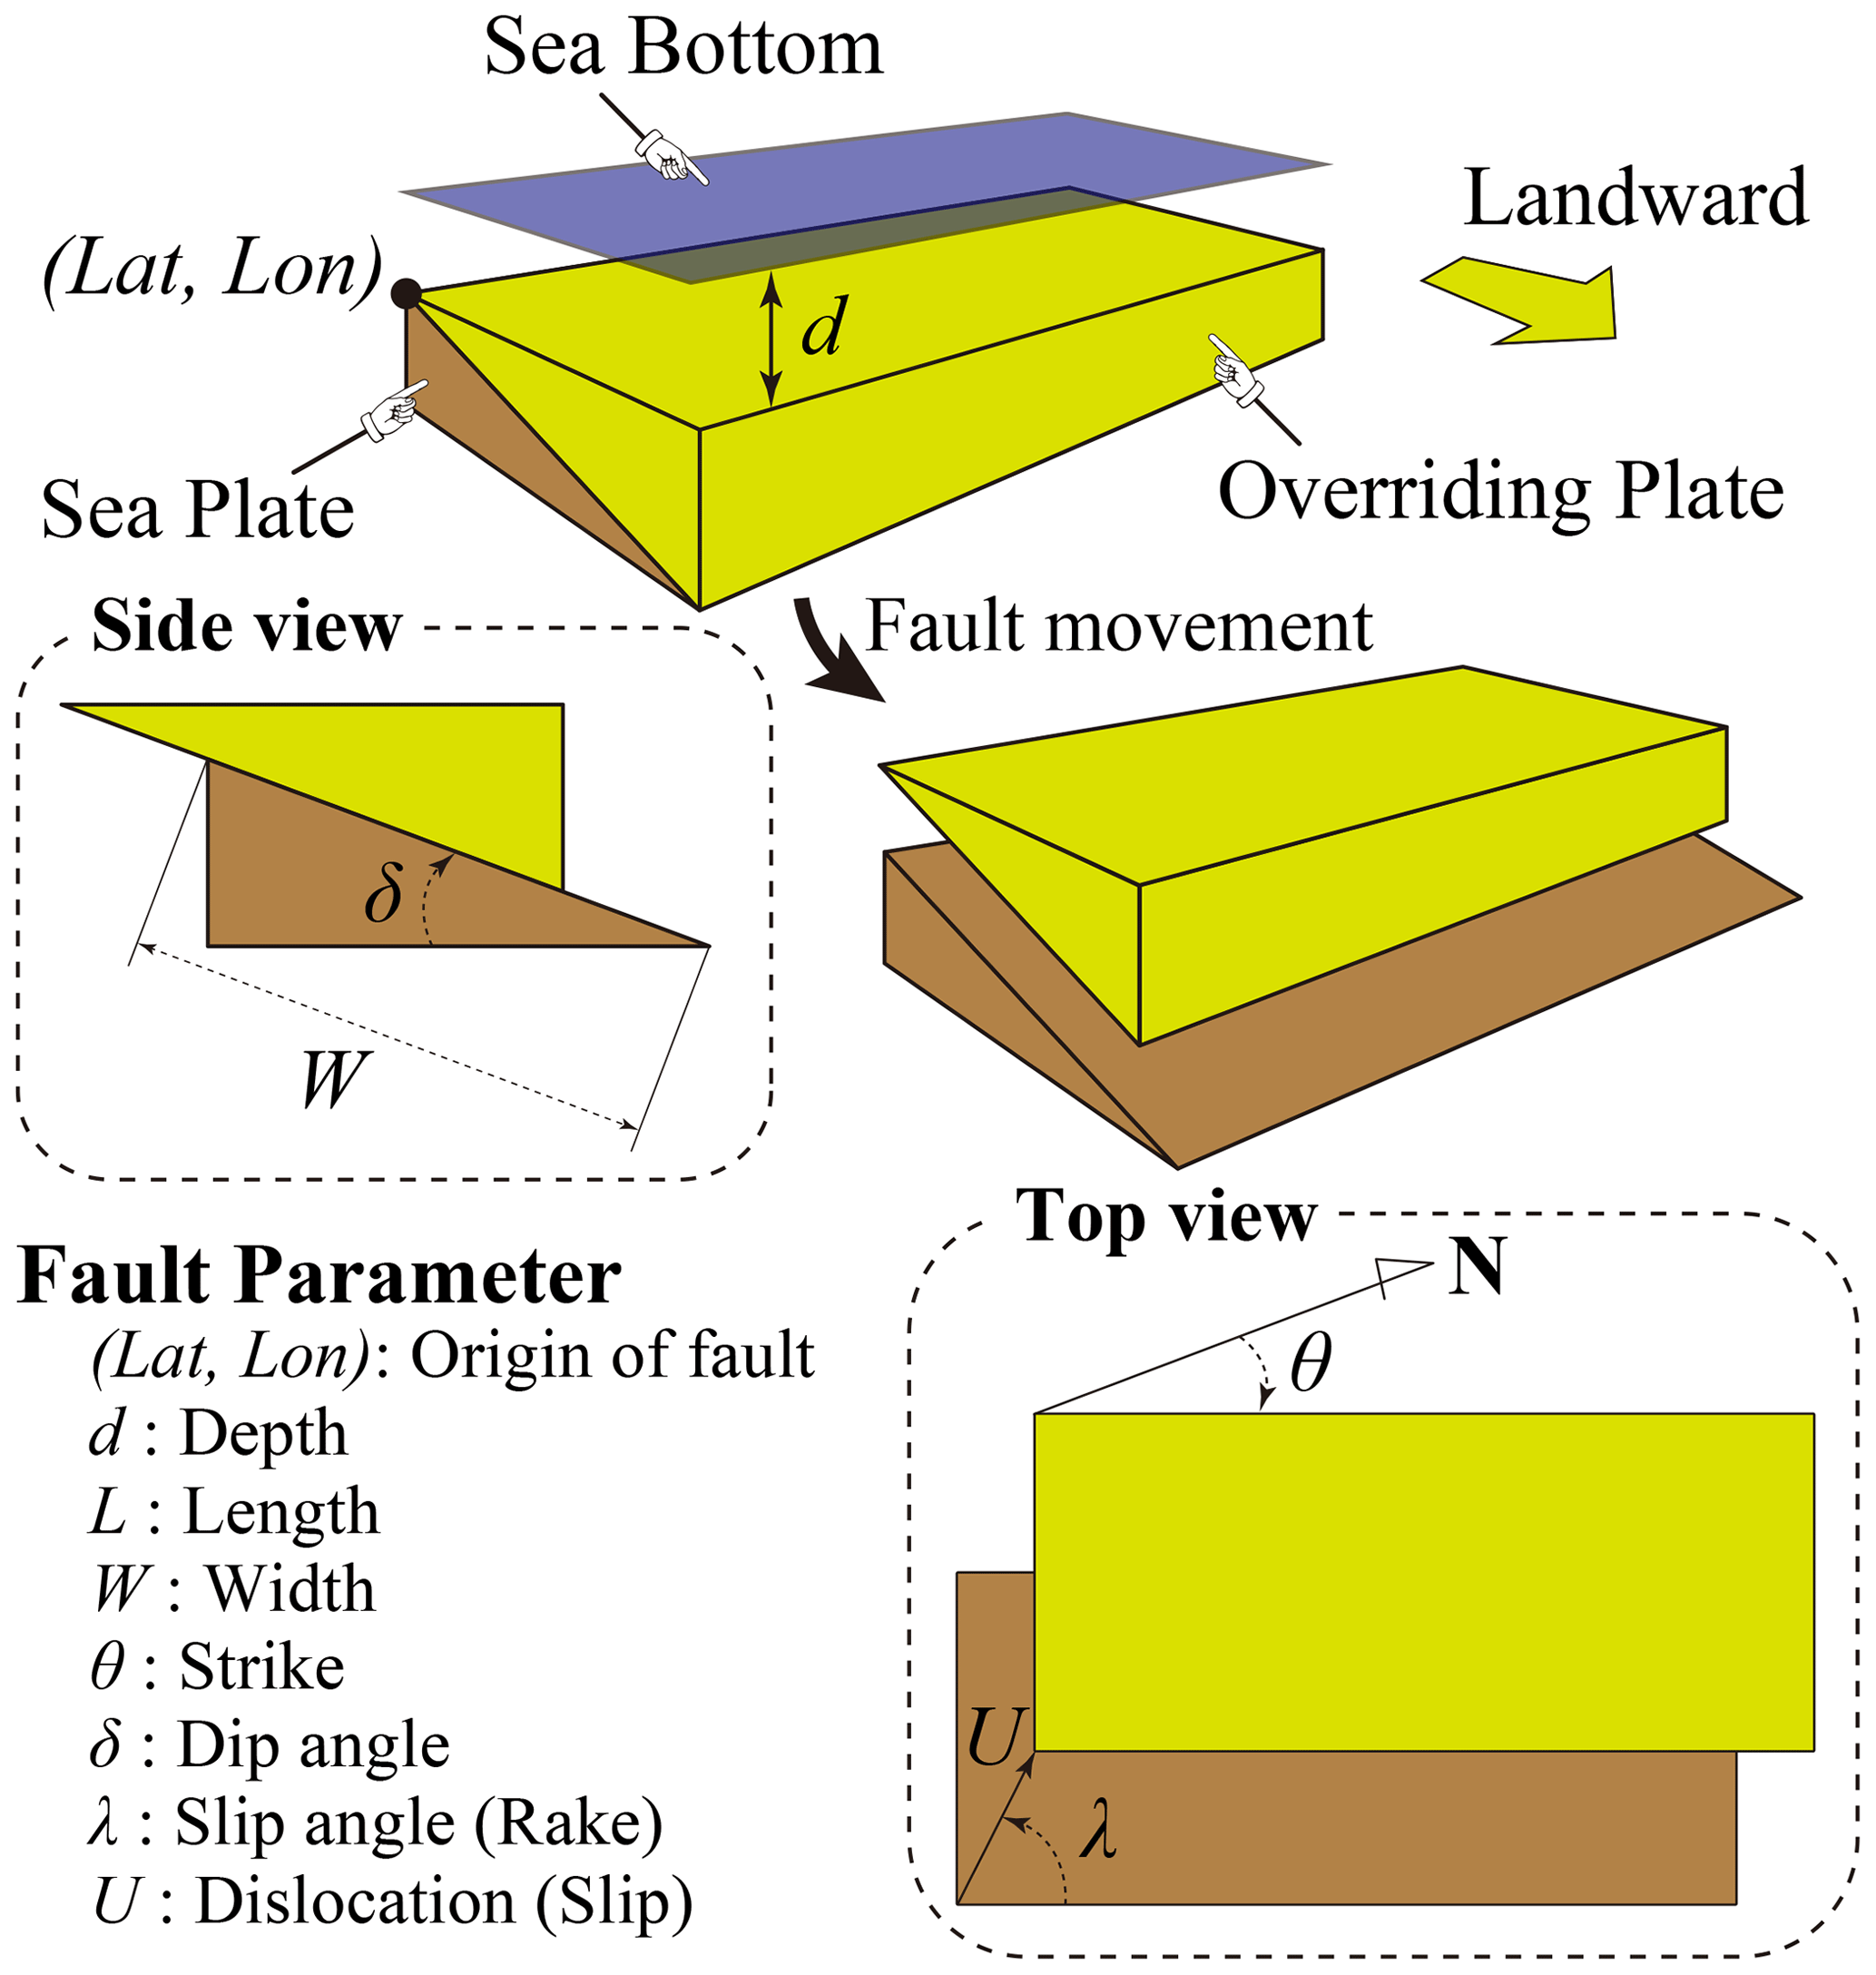
Figure 3Illustration of the fault parameters (adapted from Kotani et al., 2020).
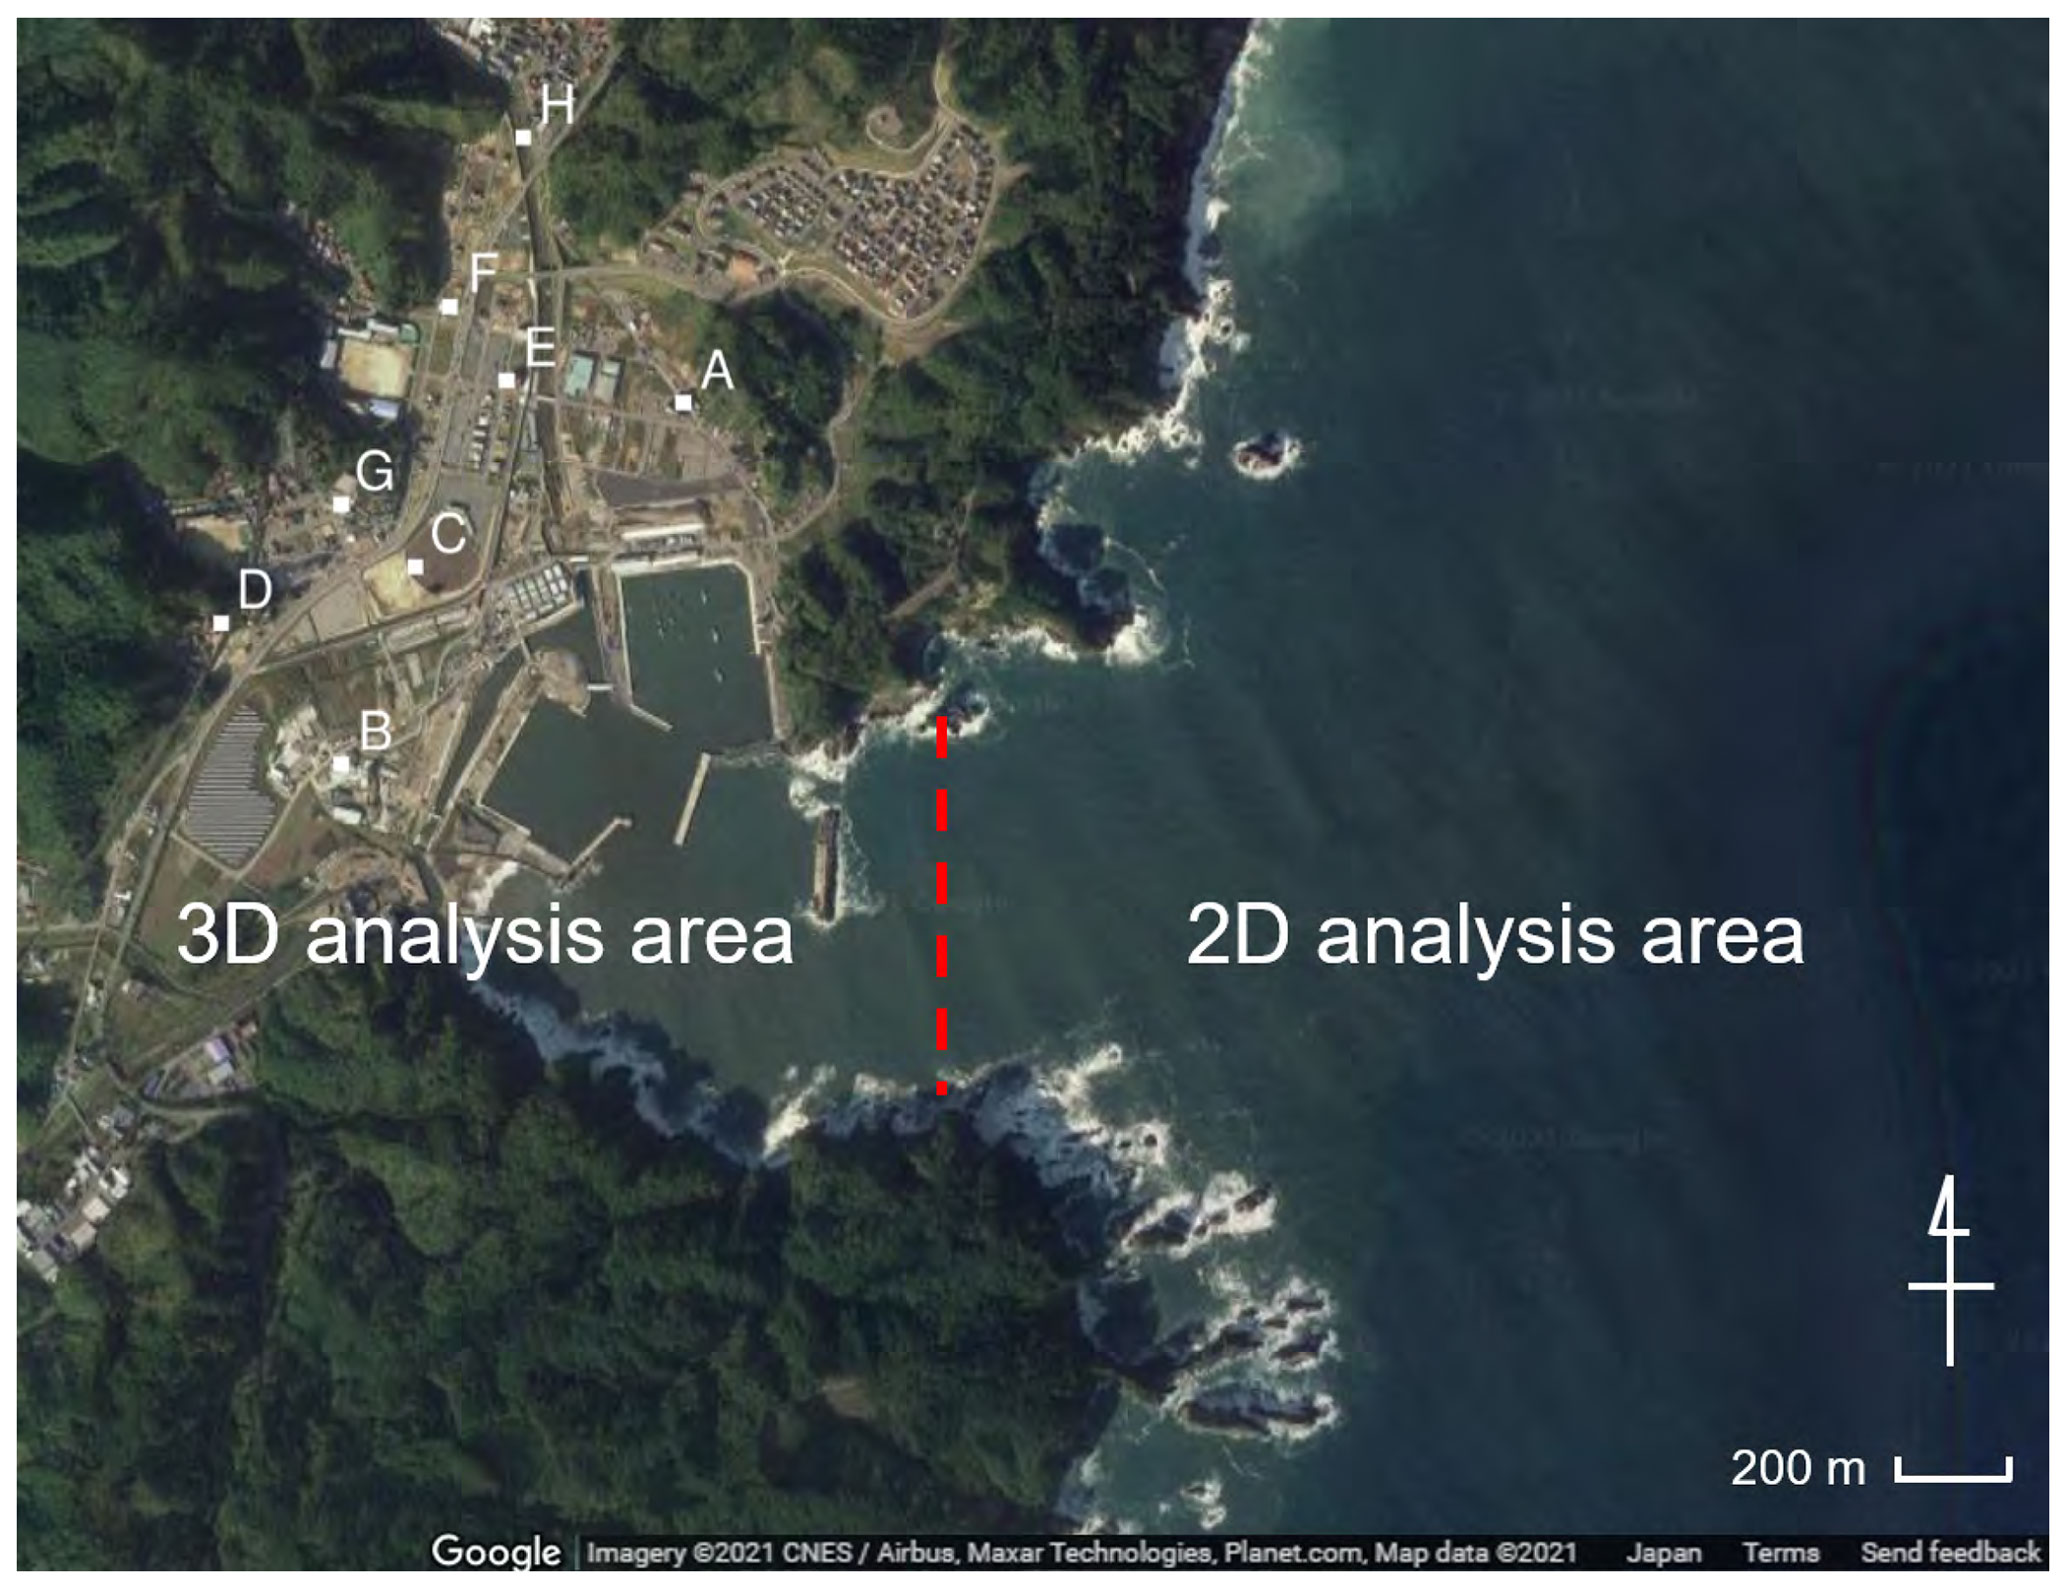
Figure 4Boundary between 2D and 3D analysis areas. Points A to H are used to compare the inundation depths between the observational data and simulation results (© Google Maps, Tozato et al., 2022).

Figure 5Snapshots of the tsunami runup obtained through 3D analysis (Tozato et al., 2022).
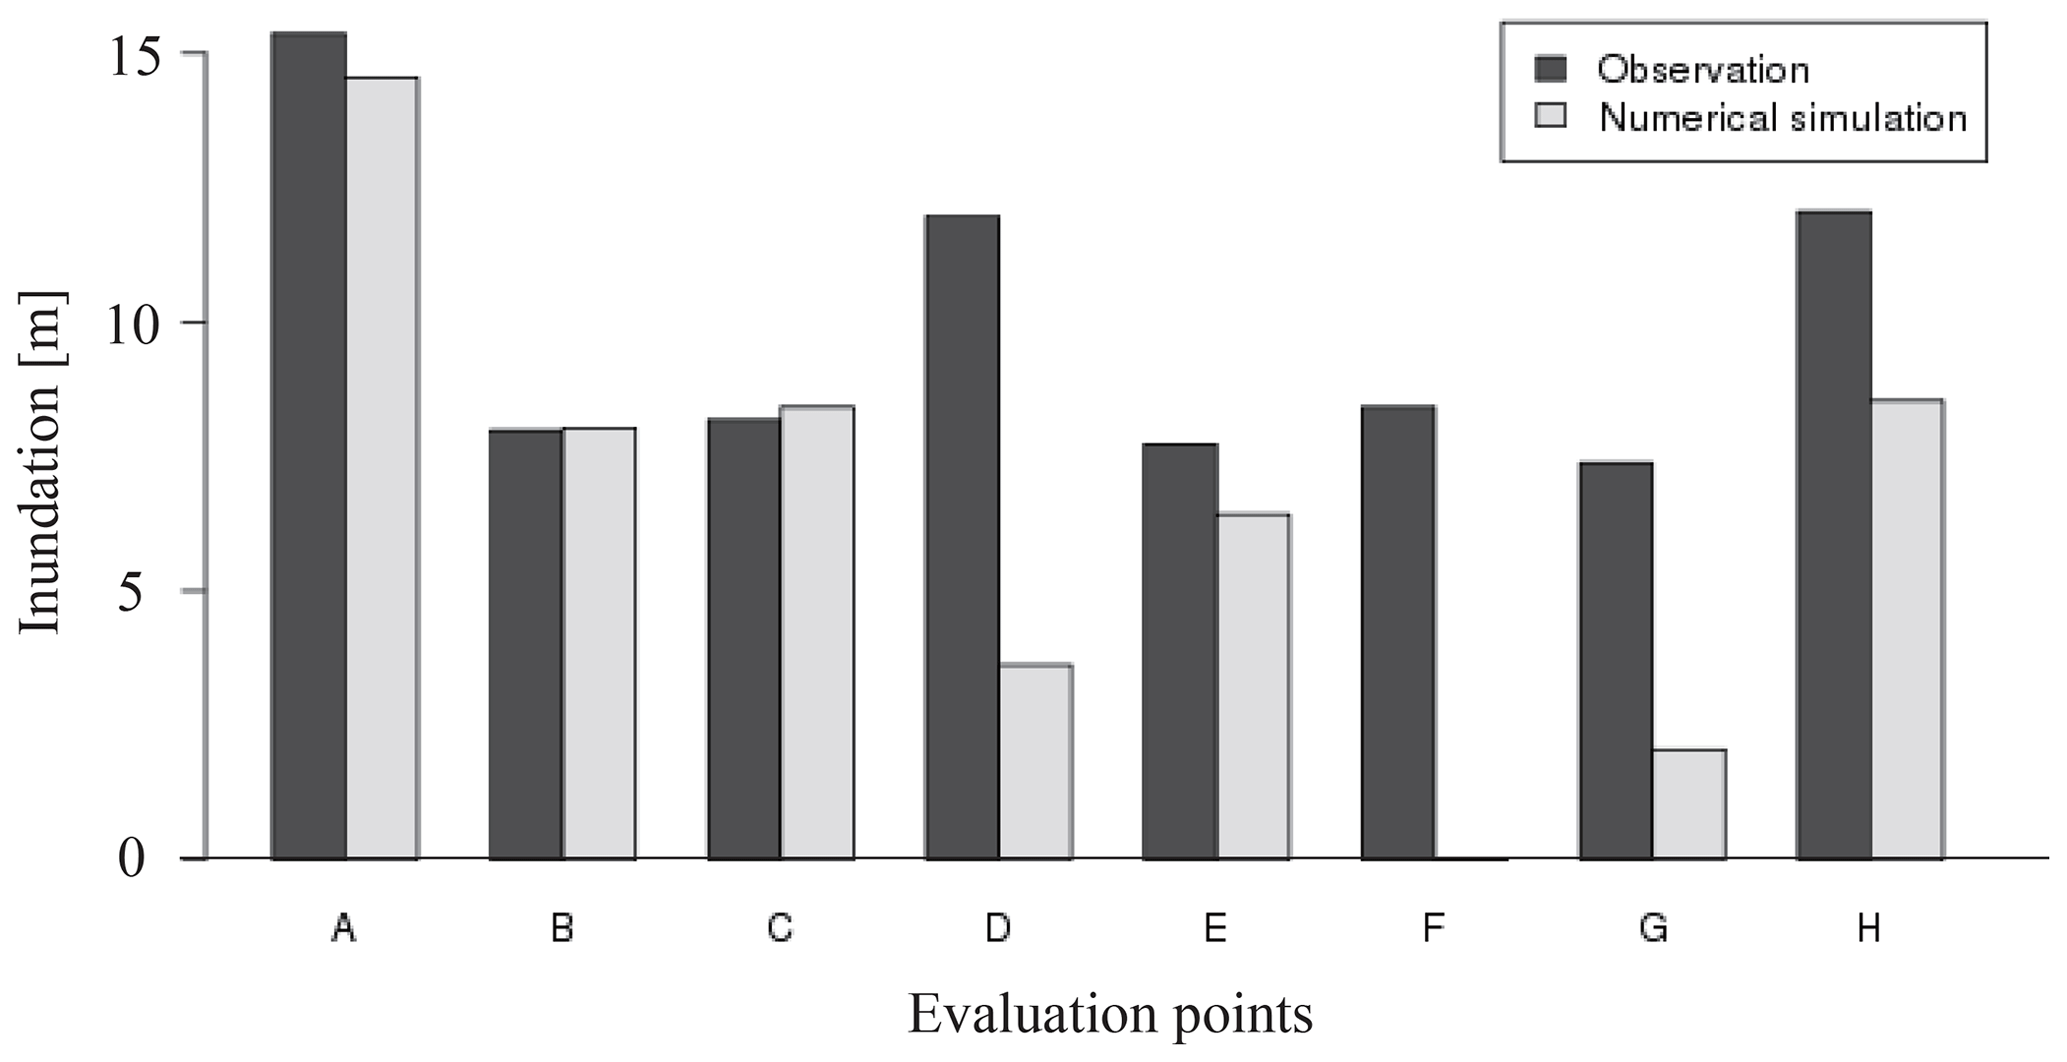
Figure 6Comparison of the inundation between observational data and numerical simulation (observation data are provided by field survey results, The 2011 Tohoku Earthquake Tsunami Joint Survey Group, 2012; Tozato et al., 2022).
2.3 Search for optimal placement using a genetic algorithm
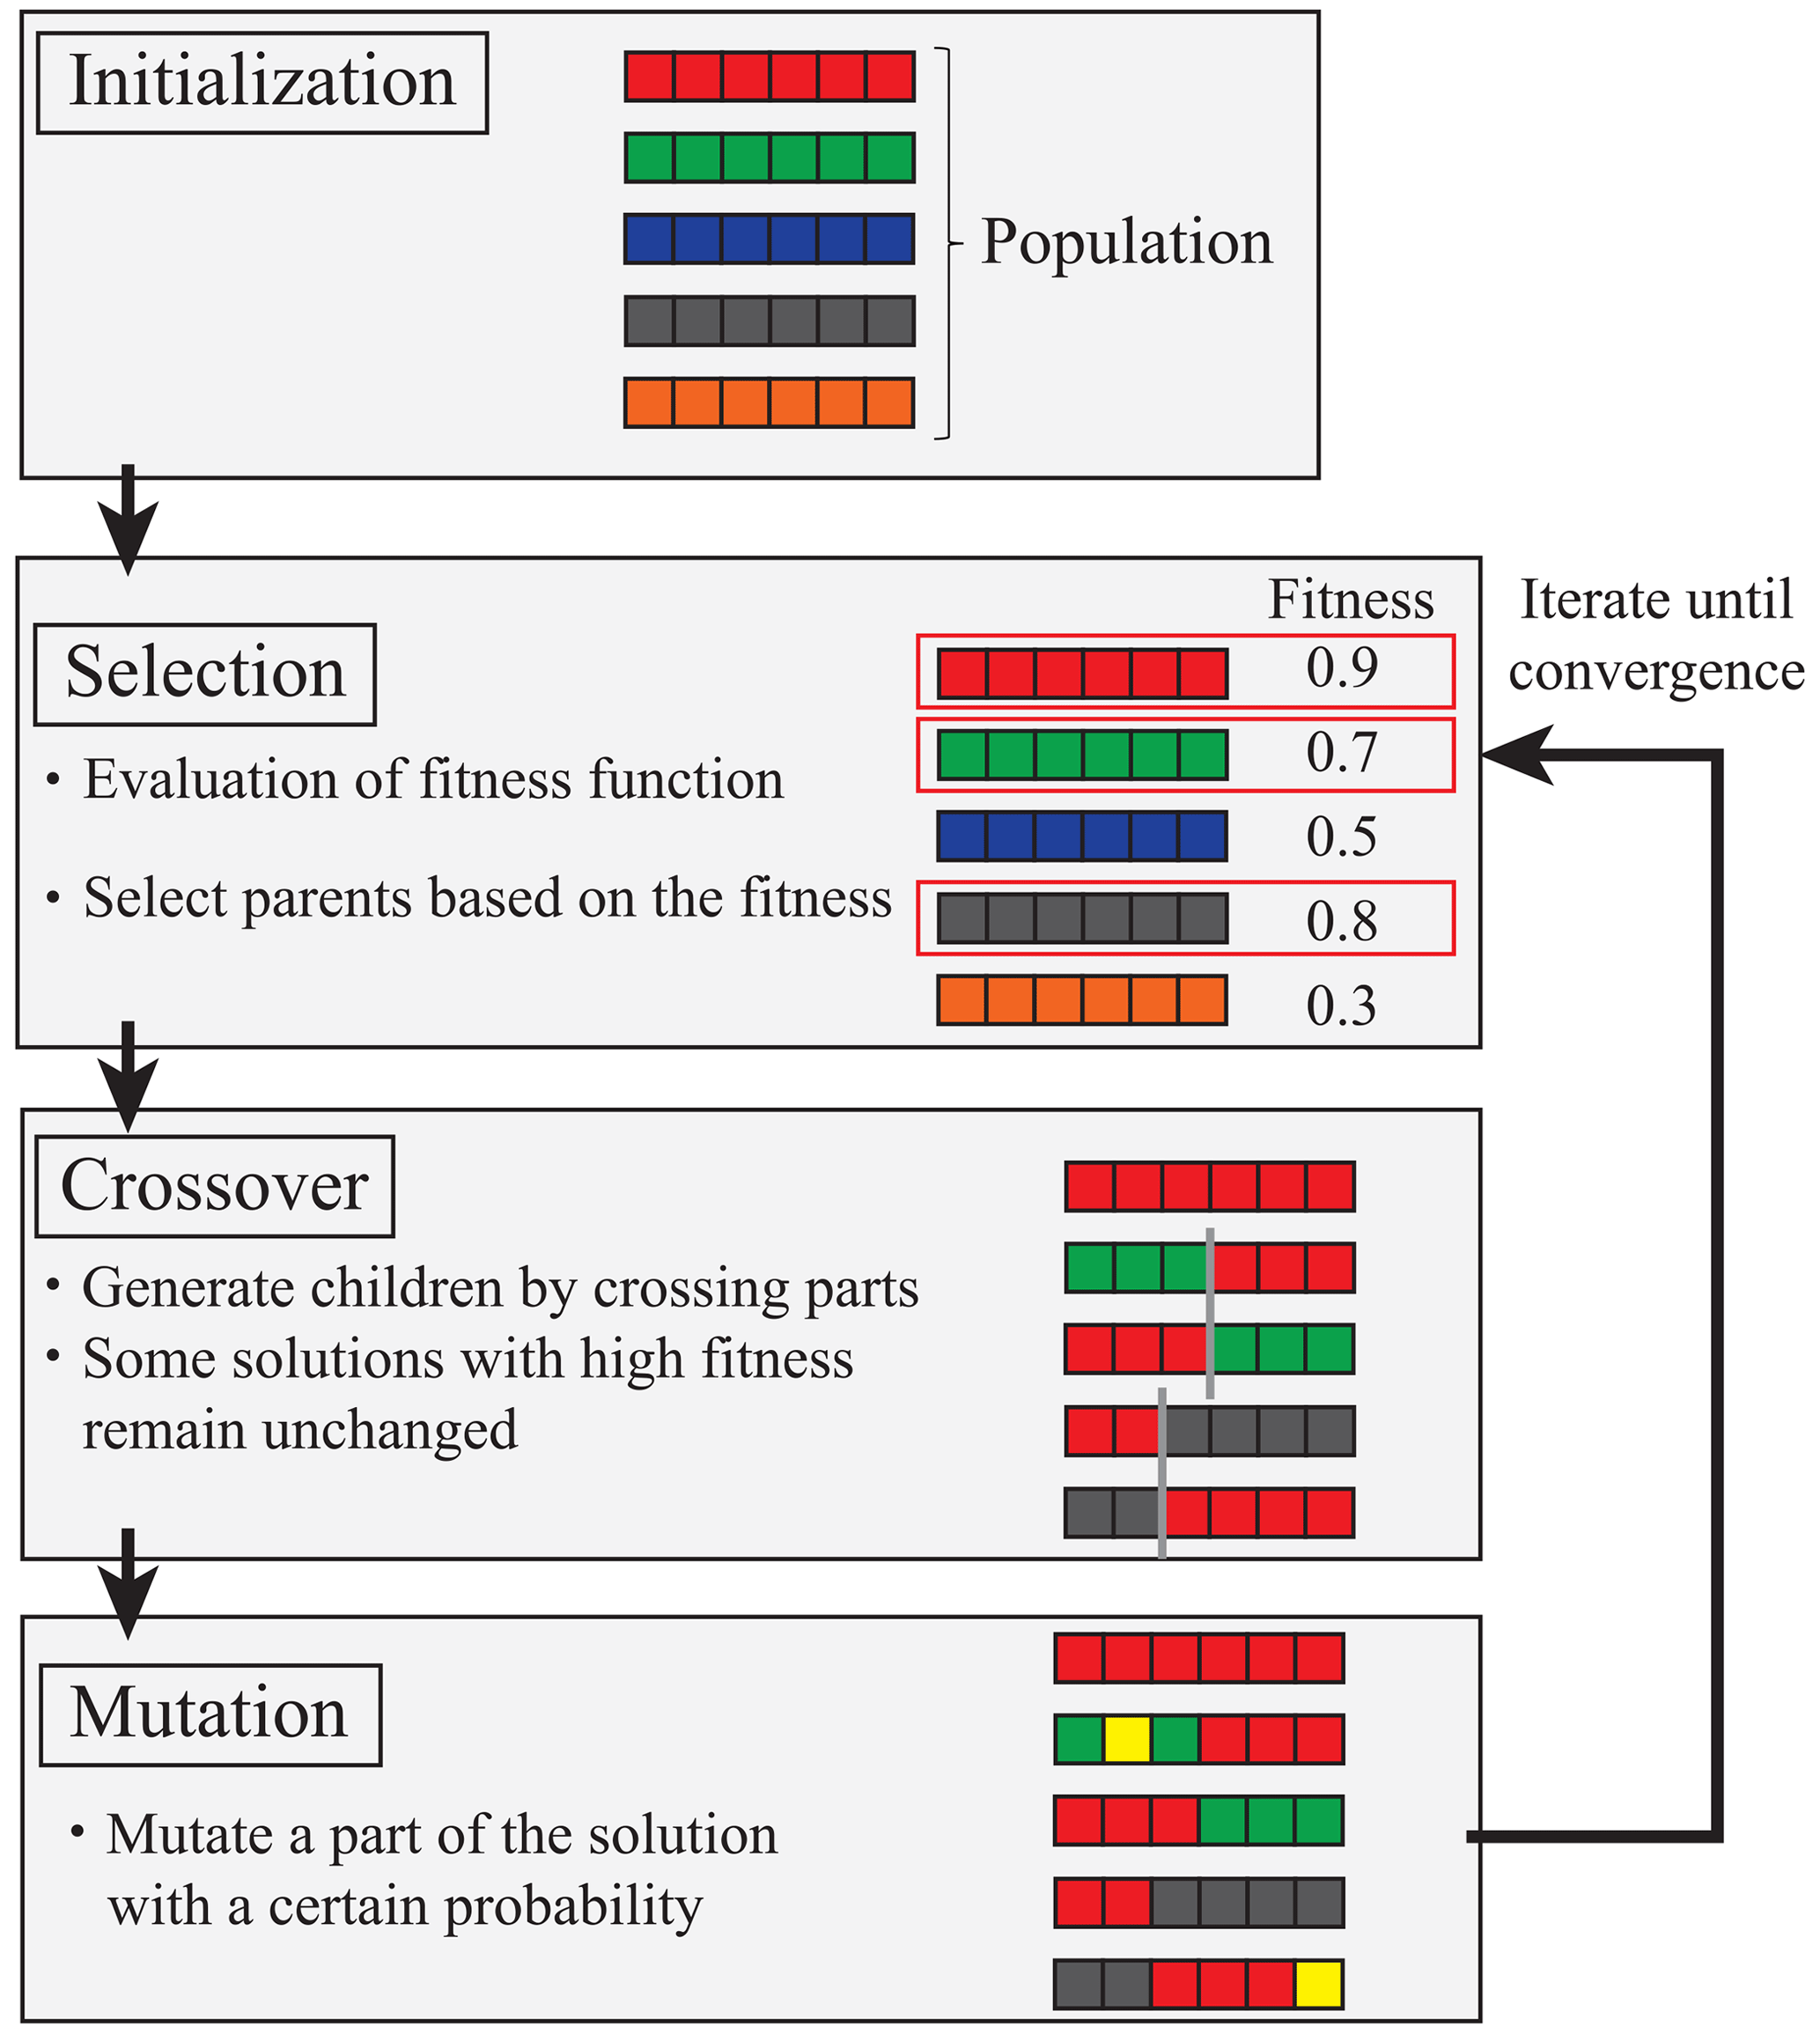
A genetic algorithm (Holland, 1992) was used to search for the optimal placement. Genetic algorithms search for approximate solutions of data, where multiple individuals whose solution candidates are expressed with genes are prepared, individuals with high fitness are preferentially selected, and the solutions are searched for by repeating crossover and mutation operations. The problem targeted in this study includes an extremely large number of assessment points; furthermore, checking all combinations is extremely inefficient. We adopted the genetic algorithm for the combination optimization problem.
Figure 2 shows an overview of the genetic algorithm. In this study, the assessment point number was placed in the component of each individual, and these combinations were optimized using a genetic algorithm. First, the number of individuals was determined, and a combination of points to be selected was randomly determined for the initial individuals. Second, the fitness was calculated for the generated individuals. Two individuals that will be the parents of the next generation were then selected based on the obtained fitness. The parent selection method involves selecting high-fitness individuals as parents and eliminating low-fitness individuals. The next generation of individuals is generated by randomly exchanging each component for the two selected parents. The location and number of exchanges are determined randomly; this is repeated until the number of individuals in the next generation reaches the initially set number. We adopted an elite conservation strategy to avoid the deterioration of fitness during generational change, with settings such that some top individuals with high fitness can pass on to the next generation. The final next-generation individuals were determined by mutating each component of each individual with a certain probability. In this process, the point number may be duplicated within one individual. In such cases, the duplicated point is re-selected randomly. This process was repeated until the fitness converged, and an optimal point combination was determined.
The method described in the previous section was applied to a problem in which an actual tsunami was assumed. We conducted a set of numerical analyses that considered uncertainties with the 2011 earthquake off the coast of Tohoku as the target event. We applied mode decomposition on these results to construct a surrogate model of the numerical analysis and implemented Monte Carlo simulations to investigate the optimal placement of facilities probabilistically.
3.1 Tsunami simulation
We used the same numerical analysis results as those reported in the previous research (Tozato et al., 2022). The reader is referred to the study by (Tozato et al., 2022) for details regarding the computational conditions. This study considers the slip and rake as uncertainty parameters (Fig. 3) because these parameters are supposed to have a deep relationship with the characteristics of a fault stagger. Parameters at the time of the earthquake off the coast of Tohoku were set as mean values, with the slip varying between 0.7 and 1.4 times and the rake varying between −20 and . The fault parameters are shown in Fig. 3, and Table 1 summarizes all analysis cases. In this study, the validity of the constructed surrogate model was verified using rake cases among the 50 cases presented in Table 1. The remaining 40 cases were used to construct the surrogate model.
Figures 4 and 5 show the target area and snapshots of the analysis results of the inundation area for the mean case (S3R5). The simulation result for case S3R5, which corresponds to the actual tsunami condition, is compared with the observed data to confirm the validity of the numerical simulations (The 2011 Tohoku Earthquake Tsunami Joint Survey Group, 2012; Mori et al., 2012). Figure 6 shows the simulated and observed inundation depths at points A to H indicated in Fig. 4. These results show that observation values were reproduced in areas around the shore, although there were some differences between the numerical analysis results and observed results at locations far away from the shore. The difference between the numerical analysis results and observed values in locations away from the shore was considered because the outflows of the buildings were not considered. Hence, the waves did not reach the locations far away from the shore.
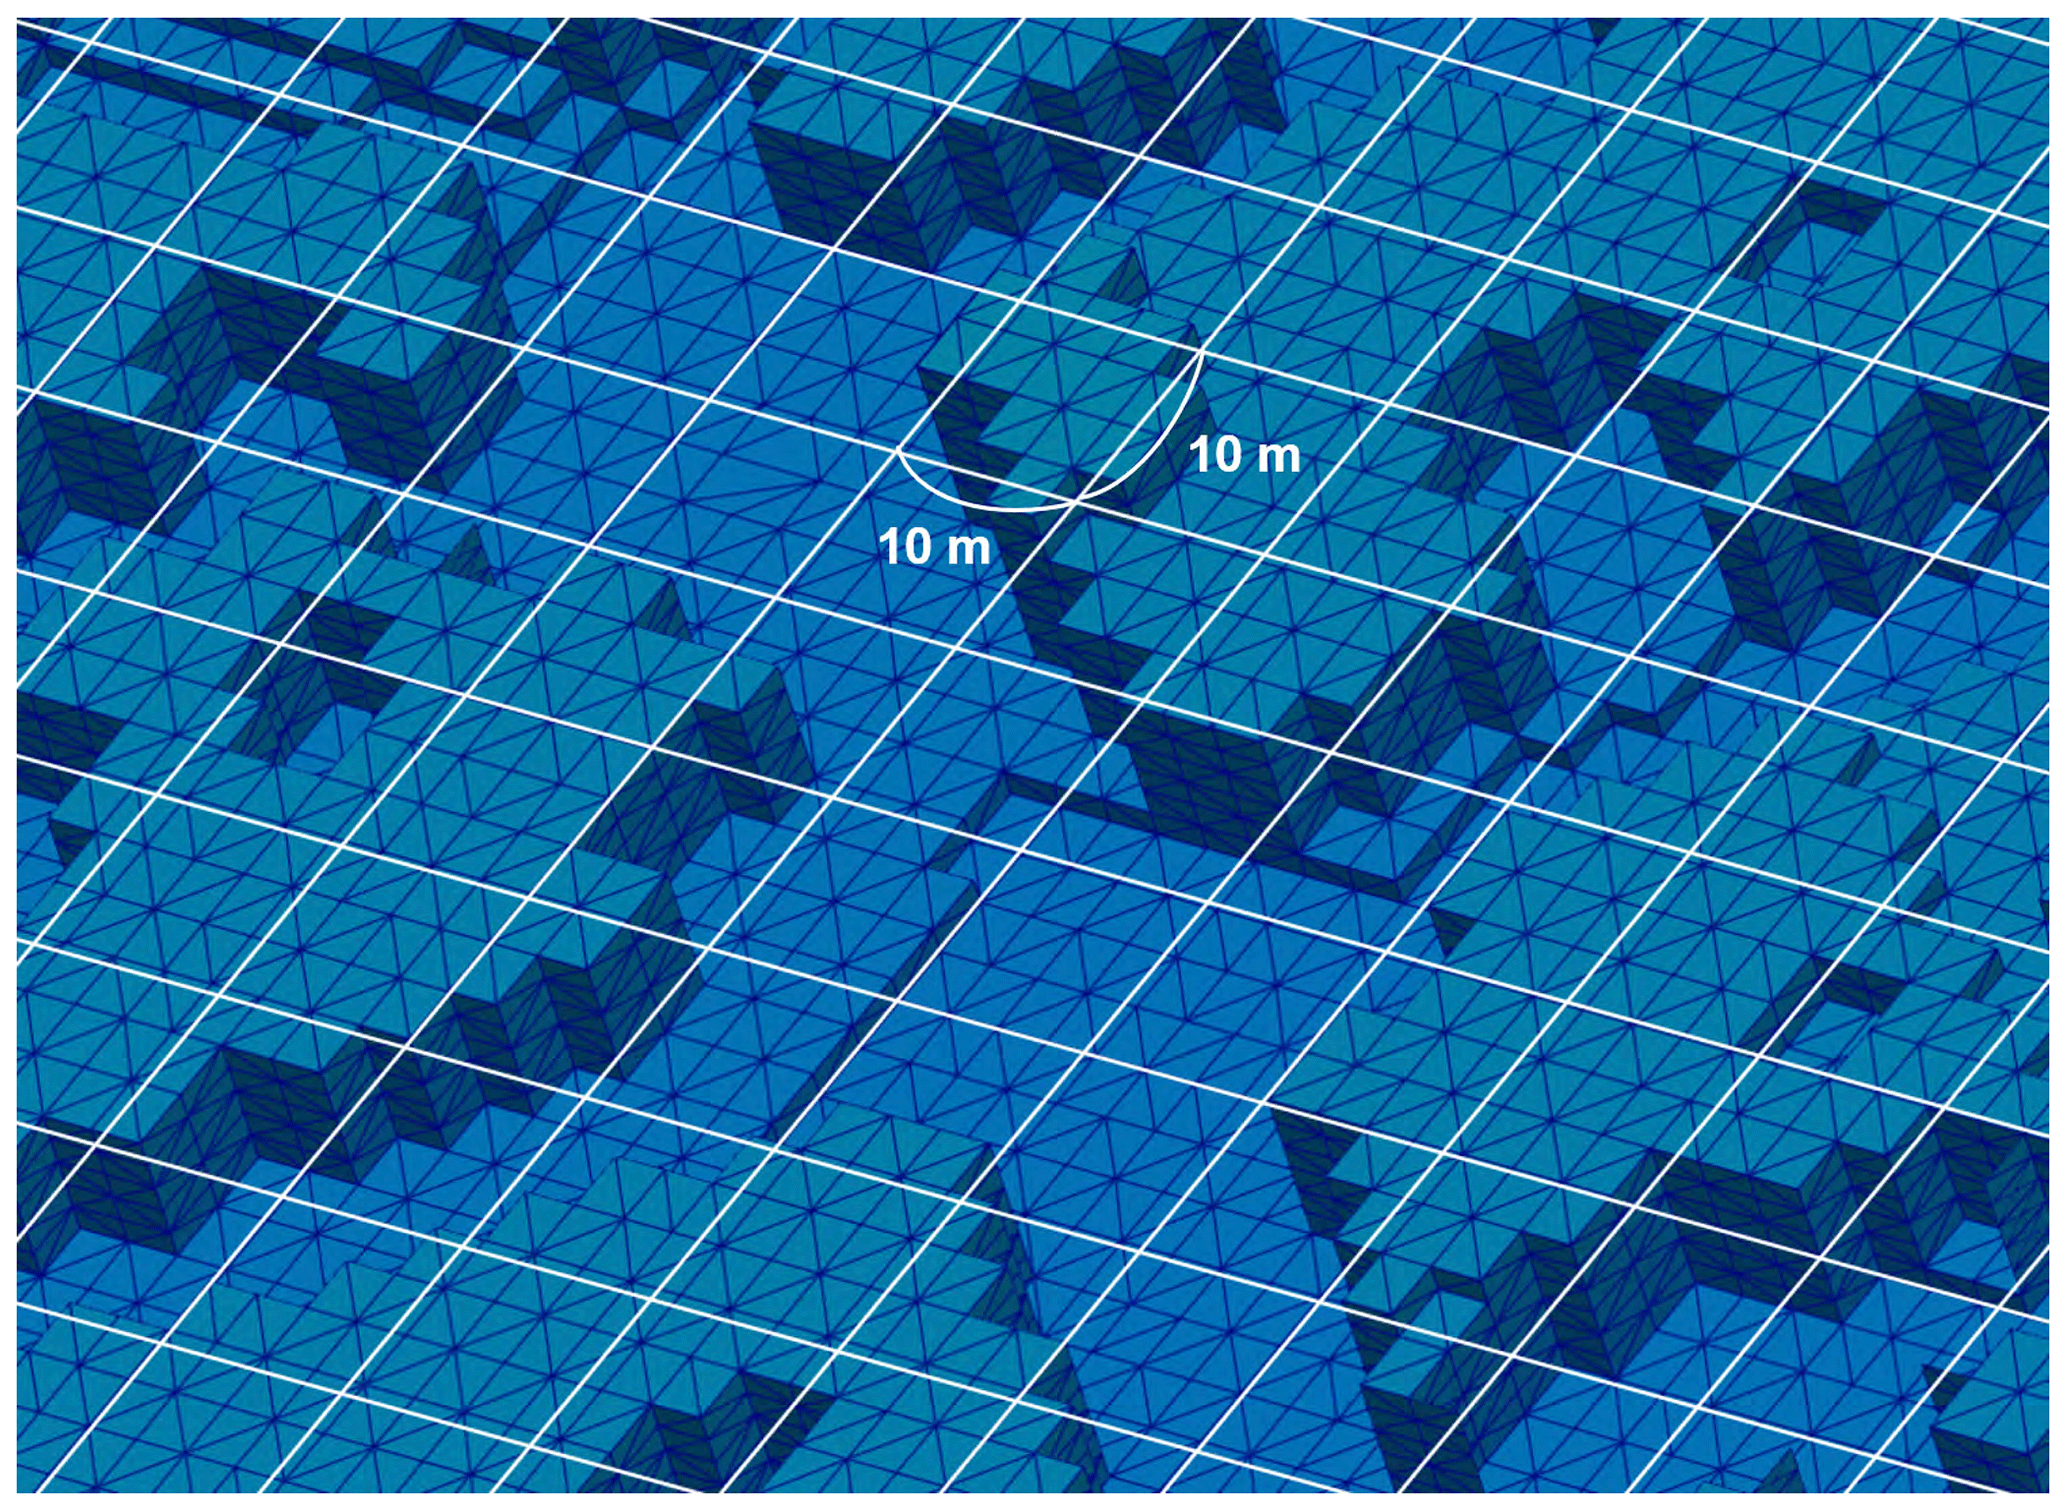
Both the impact force acting on the buildings and the inundation depth were adopted as tsunami hazard indices. The effects of the tsunami fluid force were considered in the recent design criteria (American Society of Civil Engineers, 2017; Nakano, 2017), and therefore, we considered the fluid force acting on buildings as a tsunami hazard index. A 3D simulation was conducted to construct a surrogate model of the tsunami fluid force. However, the tsunami fluid force is strongly influenced by the direction that the building faces, and it is difficult to assess the fluid force for each point. Thus, the tsunami fluid force was assessed with a 2D mesh consisting of approximately 10 m × 10 m grids in this study, each of which is a unit for force evaluation. The tsunami impact force is calculated by synthesizing all pressures acting on the surfaces of buildings within each grid in the two horizontal directions and averaged over the grid. Then, each grid is considered a point associated with this averaged force. In addition, for each point, the maximum impact force is represented by evaluating the maximum value over the analysis time. An image of a mesh for evaluating the tsunami force is shown in Fig. 7. The target area is 2145×2600 m; hence, the number of assessment points in the POD is .
3.2 Construction of a surrogate model with POD
POD was applied to the numerical analysis results for constructing a surrogate model. The data at each point were normalized in advance to mean values of 0 and standard deviations of 1 when applying the POD. Figure 8 shows the spatial modes extracted by the POD from the first mode to the third mode. The values shown in the figure are those of the eigenvectors uj; these values were adjusted so that the maximum absolute value of the components in the eigenvectors was 1. The characteristics of the spatial distribution could be read for each tsunami hazard index from the extracted modes. A comparison of the spatial modes of the maximum impact force and maximum inundation depth confirmed that the three modes shown in Fig. 8 have similar spatial characteristics. For example, in the first mode, the sign was the same overall, and the value on the coast side was large; therefore, the mode showed an overall tendency where the coast side was the most affected by the tsunami, with the effect becoming smaller and moving away from the coast. In the second mode, a tendency could be seen where the maximum impact force and maximum inundation depth were opposite at the east and west sides. In the third mode, a tendency could be seen where the maximum impact force and maximum inundation depth were opposite at the north and south sides. These modes were considered to be related to the inflow direction of the tsunami. The higher-dimension modes included the characteristics of the local sections.

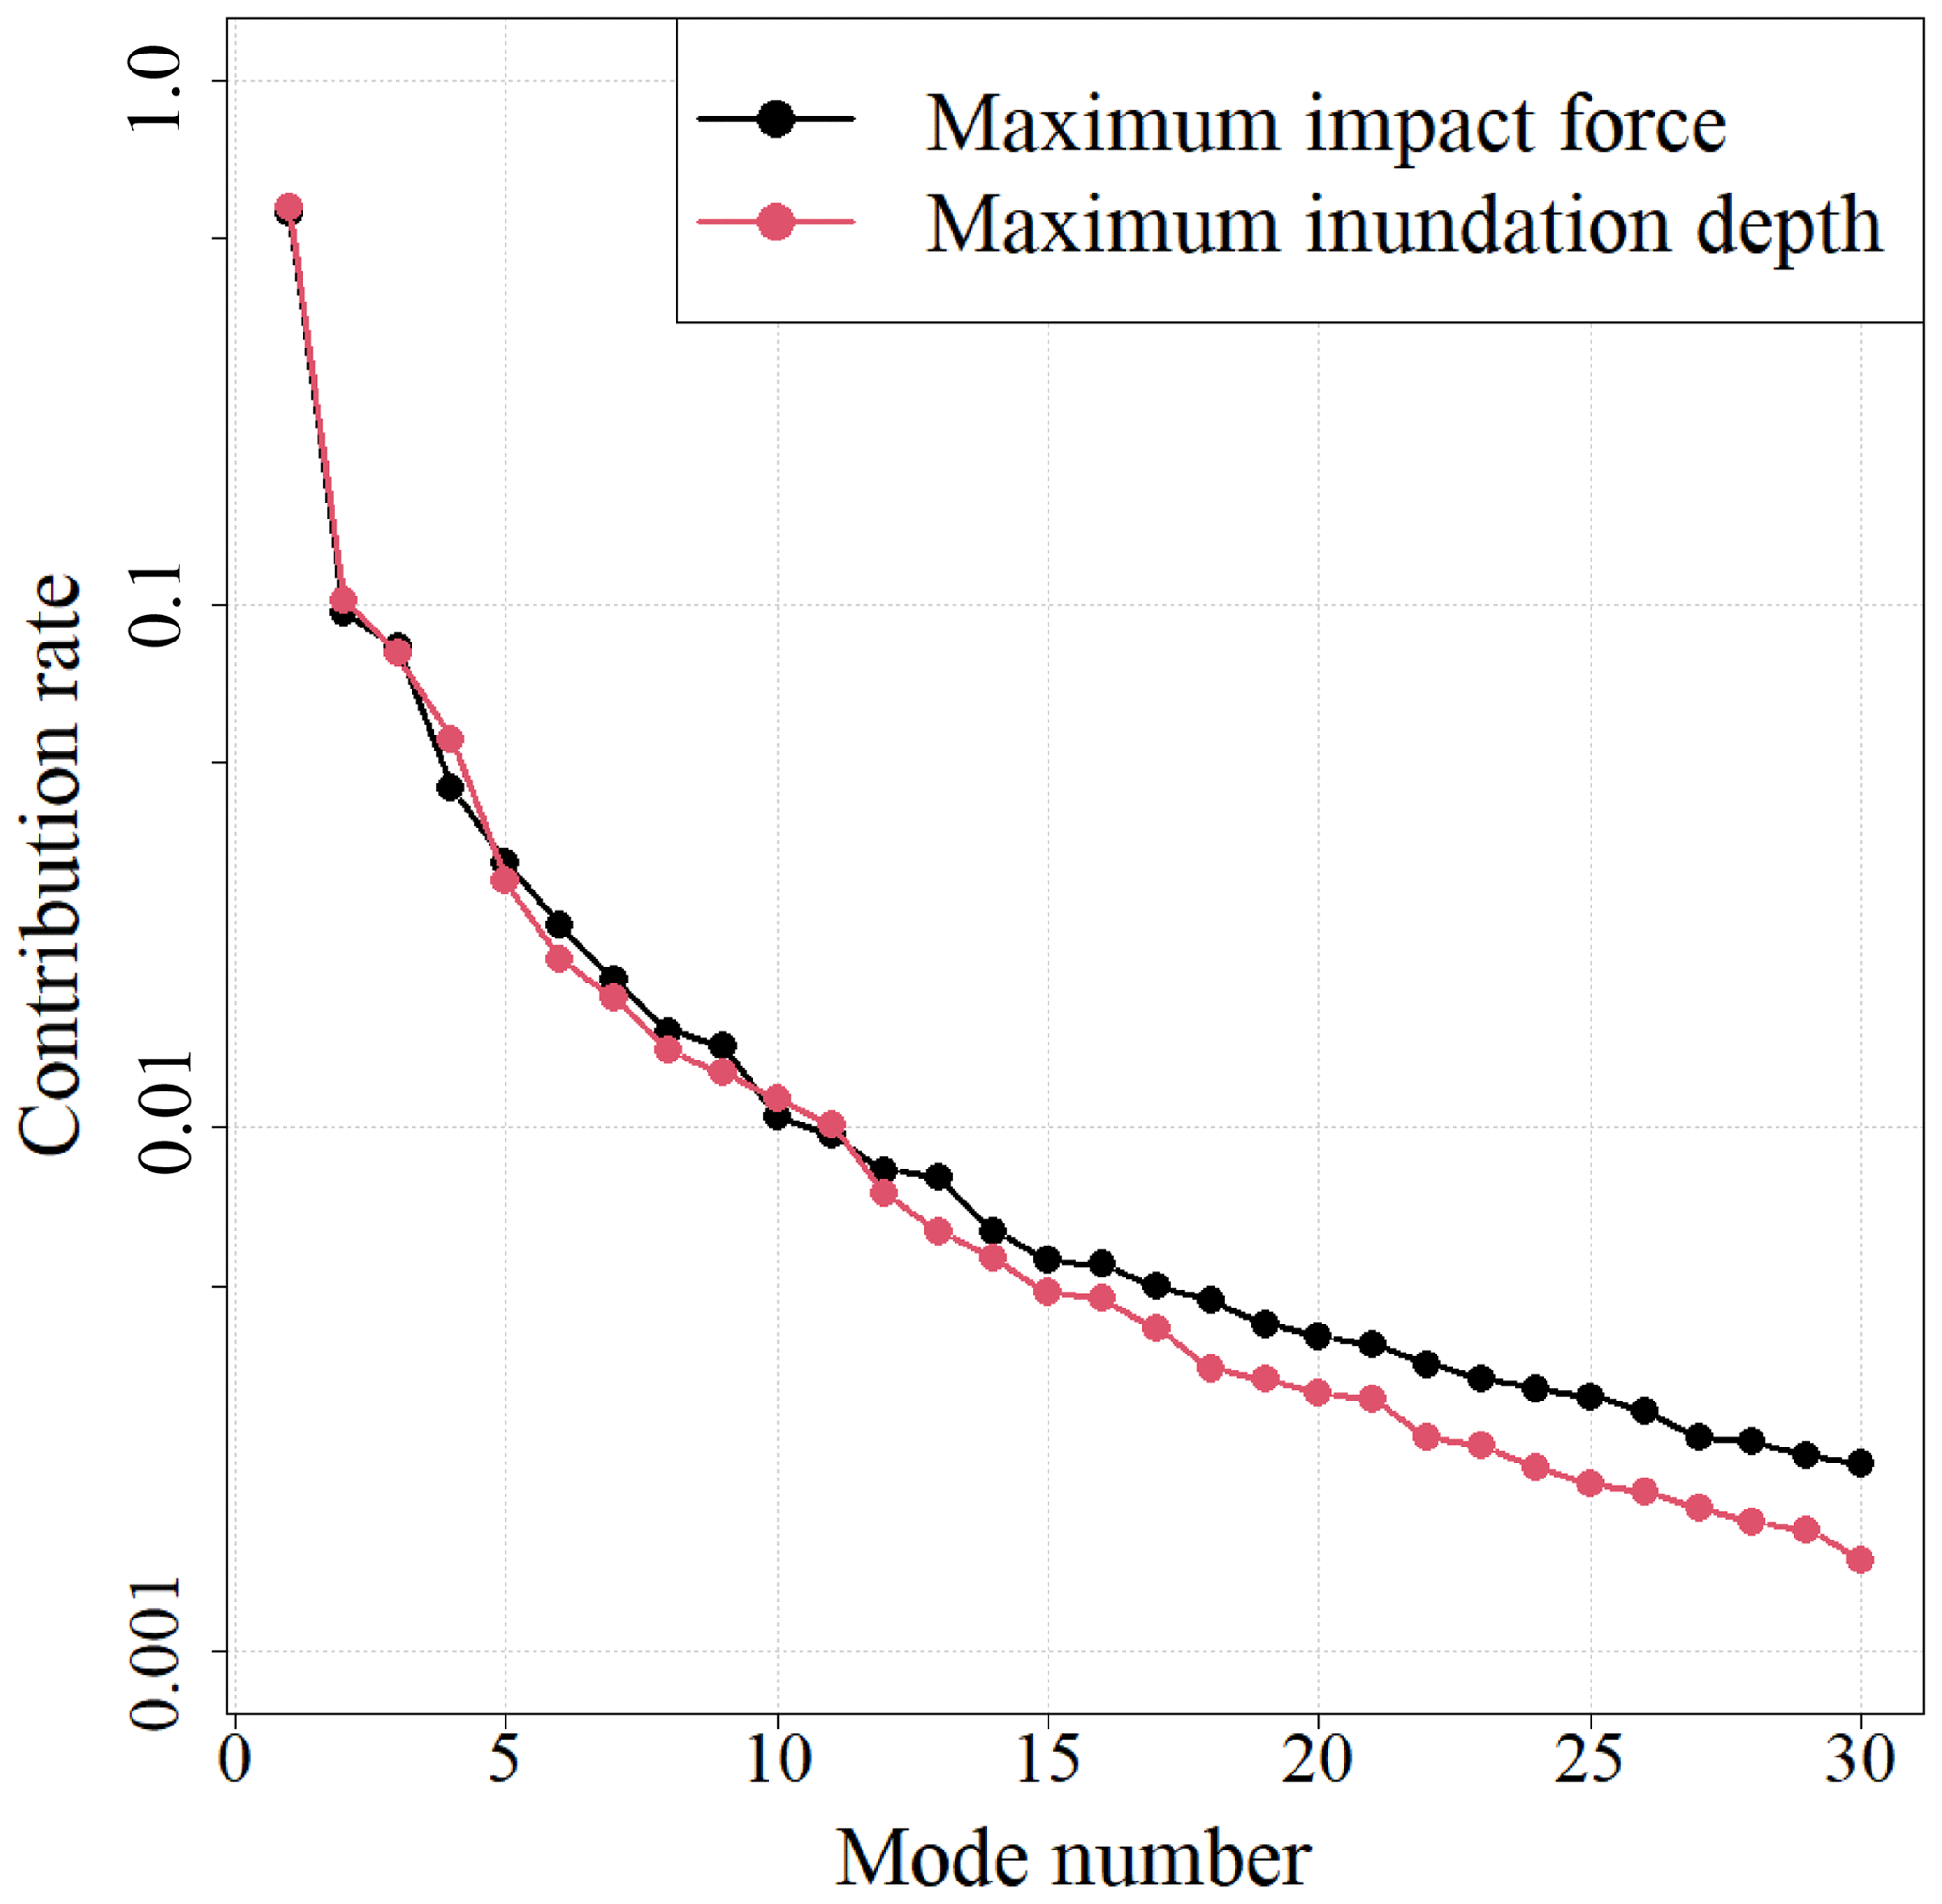
Figure 8Spatial modes for each tsunami hazard index extracted by POD. Left: first mode, middle: second mode, and right: third mode (© Google Maps).
Figure 9 shows the contribution rates of the modes. The contribution rate of the first mode was high for both the maximum impact force and maximum inundation depth.
The coefficients of each mode were expressed as a function of uncertainty parameters. The RBF interpolation shown in Eq. (14) is used. The regularization shown in Eq. (17) is introduced in the calculation to obtain the weight. The accuracy of the surrogate model changed according to the RBF smoothness and regularization parameters, and therefore, it is important to determine these parameters appropriately. In this study, these parameters were determined using cross-validation.
Learning and verification cases used for cross-validation were obtained by considering 40 cases used in the construction of the surrogate model, removing 4 cases that correspond to the corners of the parameter space (S1R1, S1R10, S5R1, S5R10), and dividing the remaining cases between learning and verification cases for cross-validation. Corner data were not used for verification cases because these data were extrapolated. In this example, the number of divisions between the learning and verification cases was set to 12. The model was constructed using 37 cases for a single validation, which was conducted using 3 cases. Further, the cross-validation error was calculated by comparing the reconstructed results using the spatial mode and considering the ratio of the mean absolute error to the mean value as
where n, xij, , and er represent the number of assessment points, number of scenarios, numerical analysis result for scenario i and point j, value for scenario i and point j when reconstructed with the surrogate model, and error when the number of modes is r, respectively.
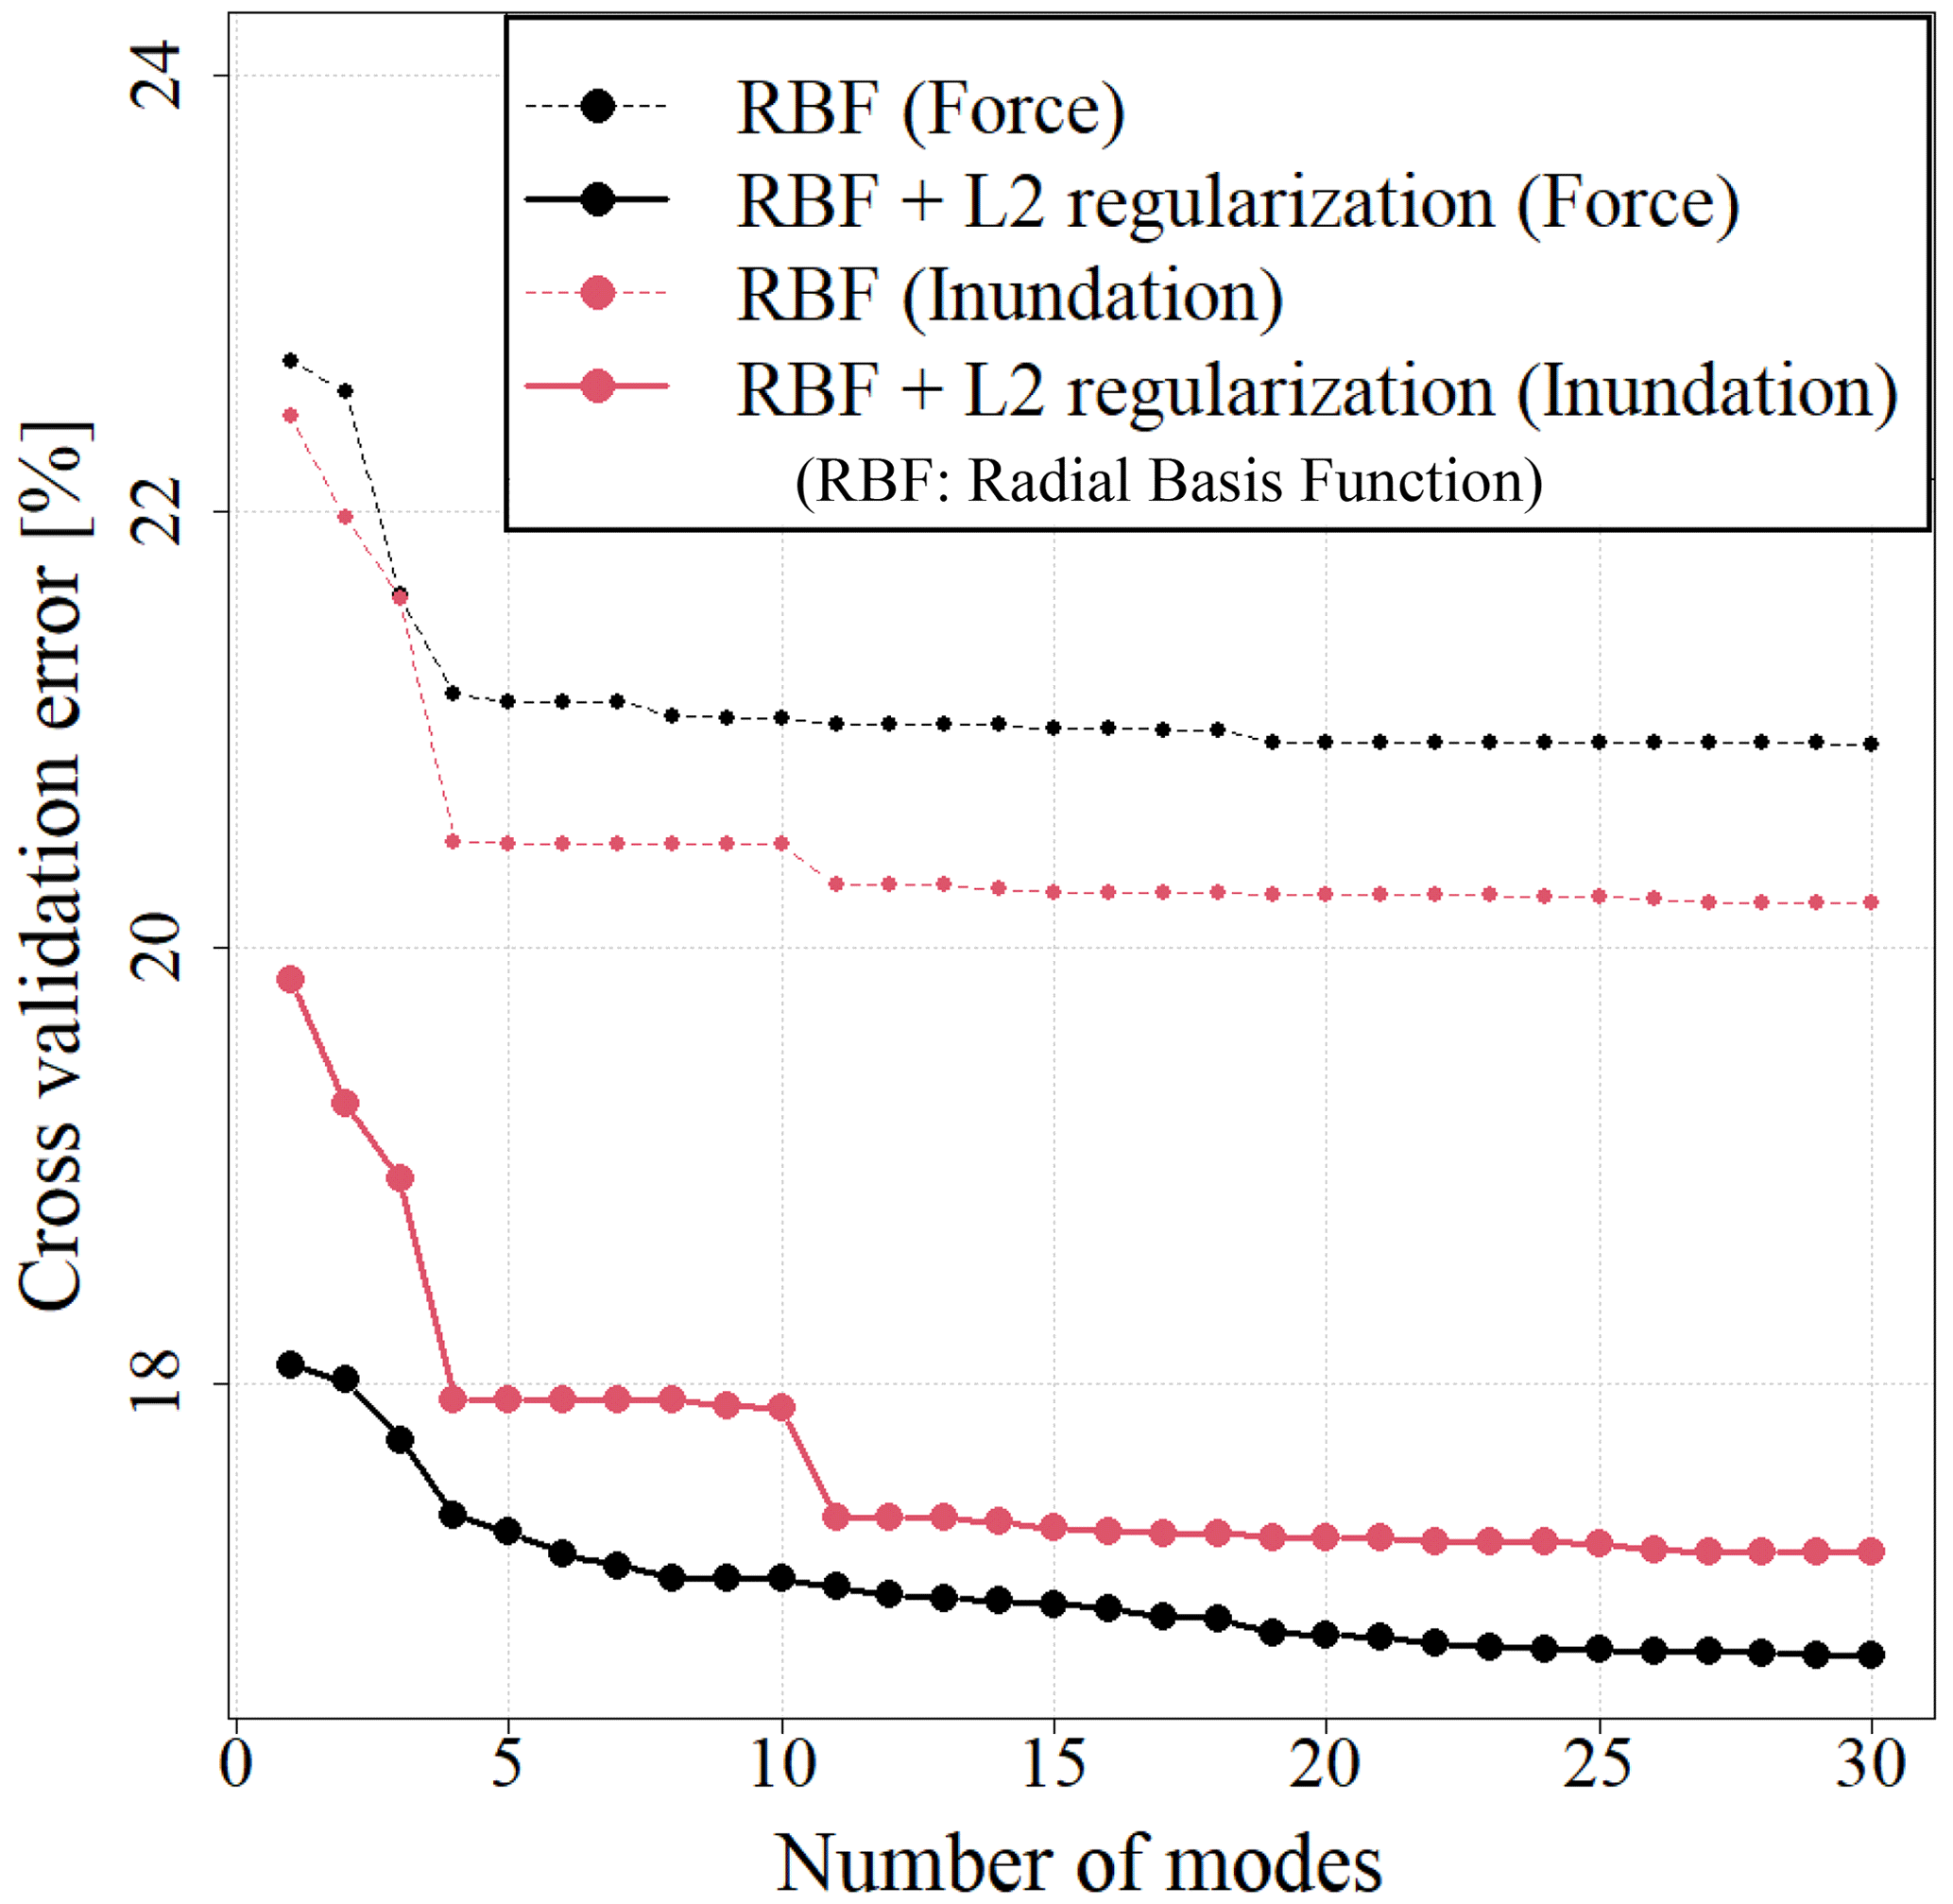
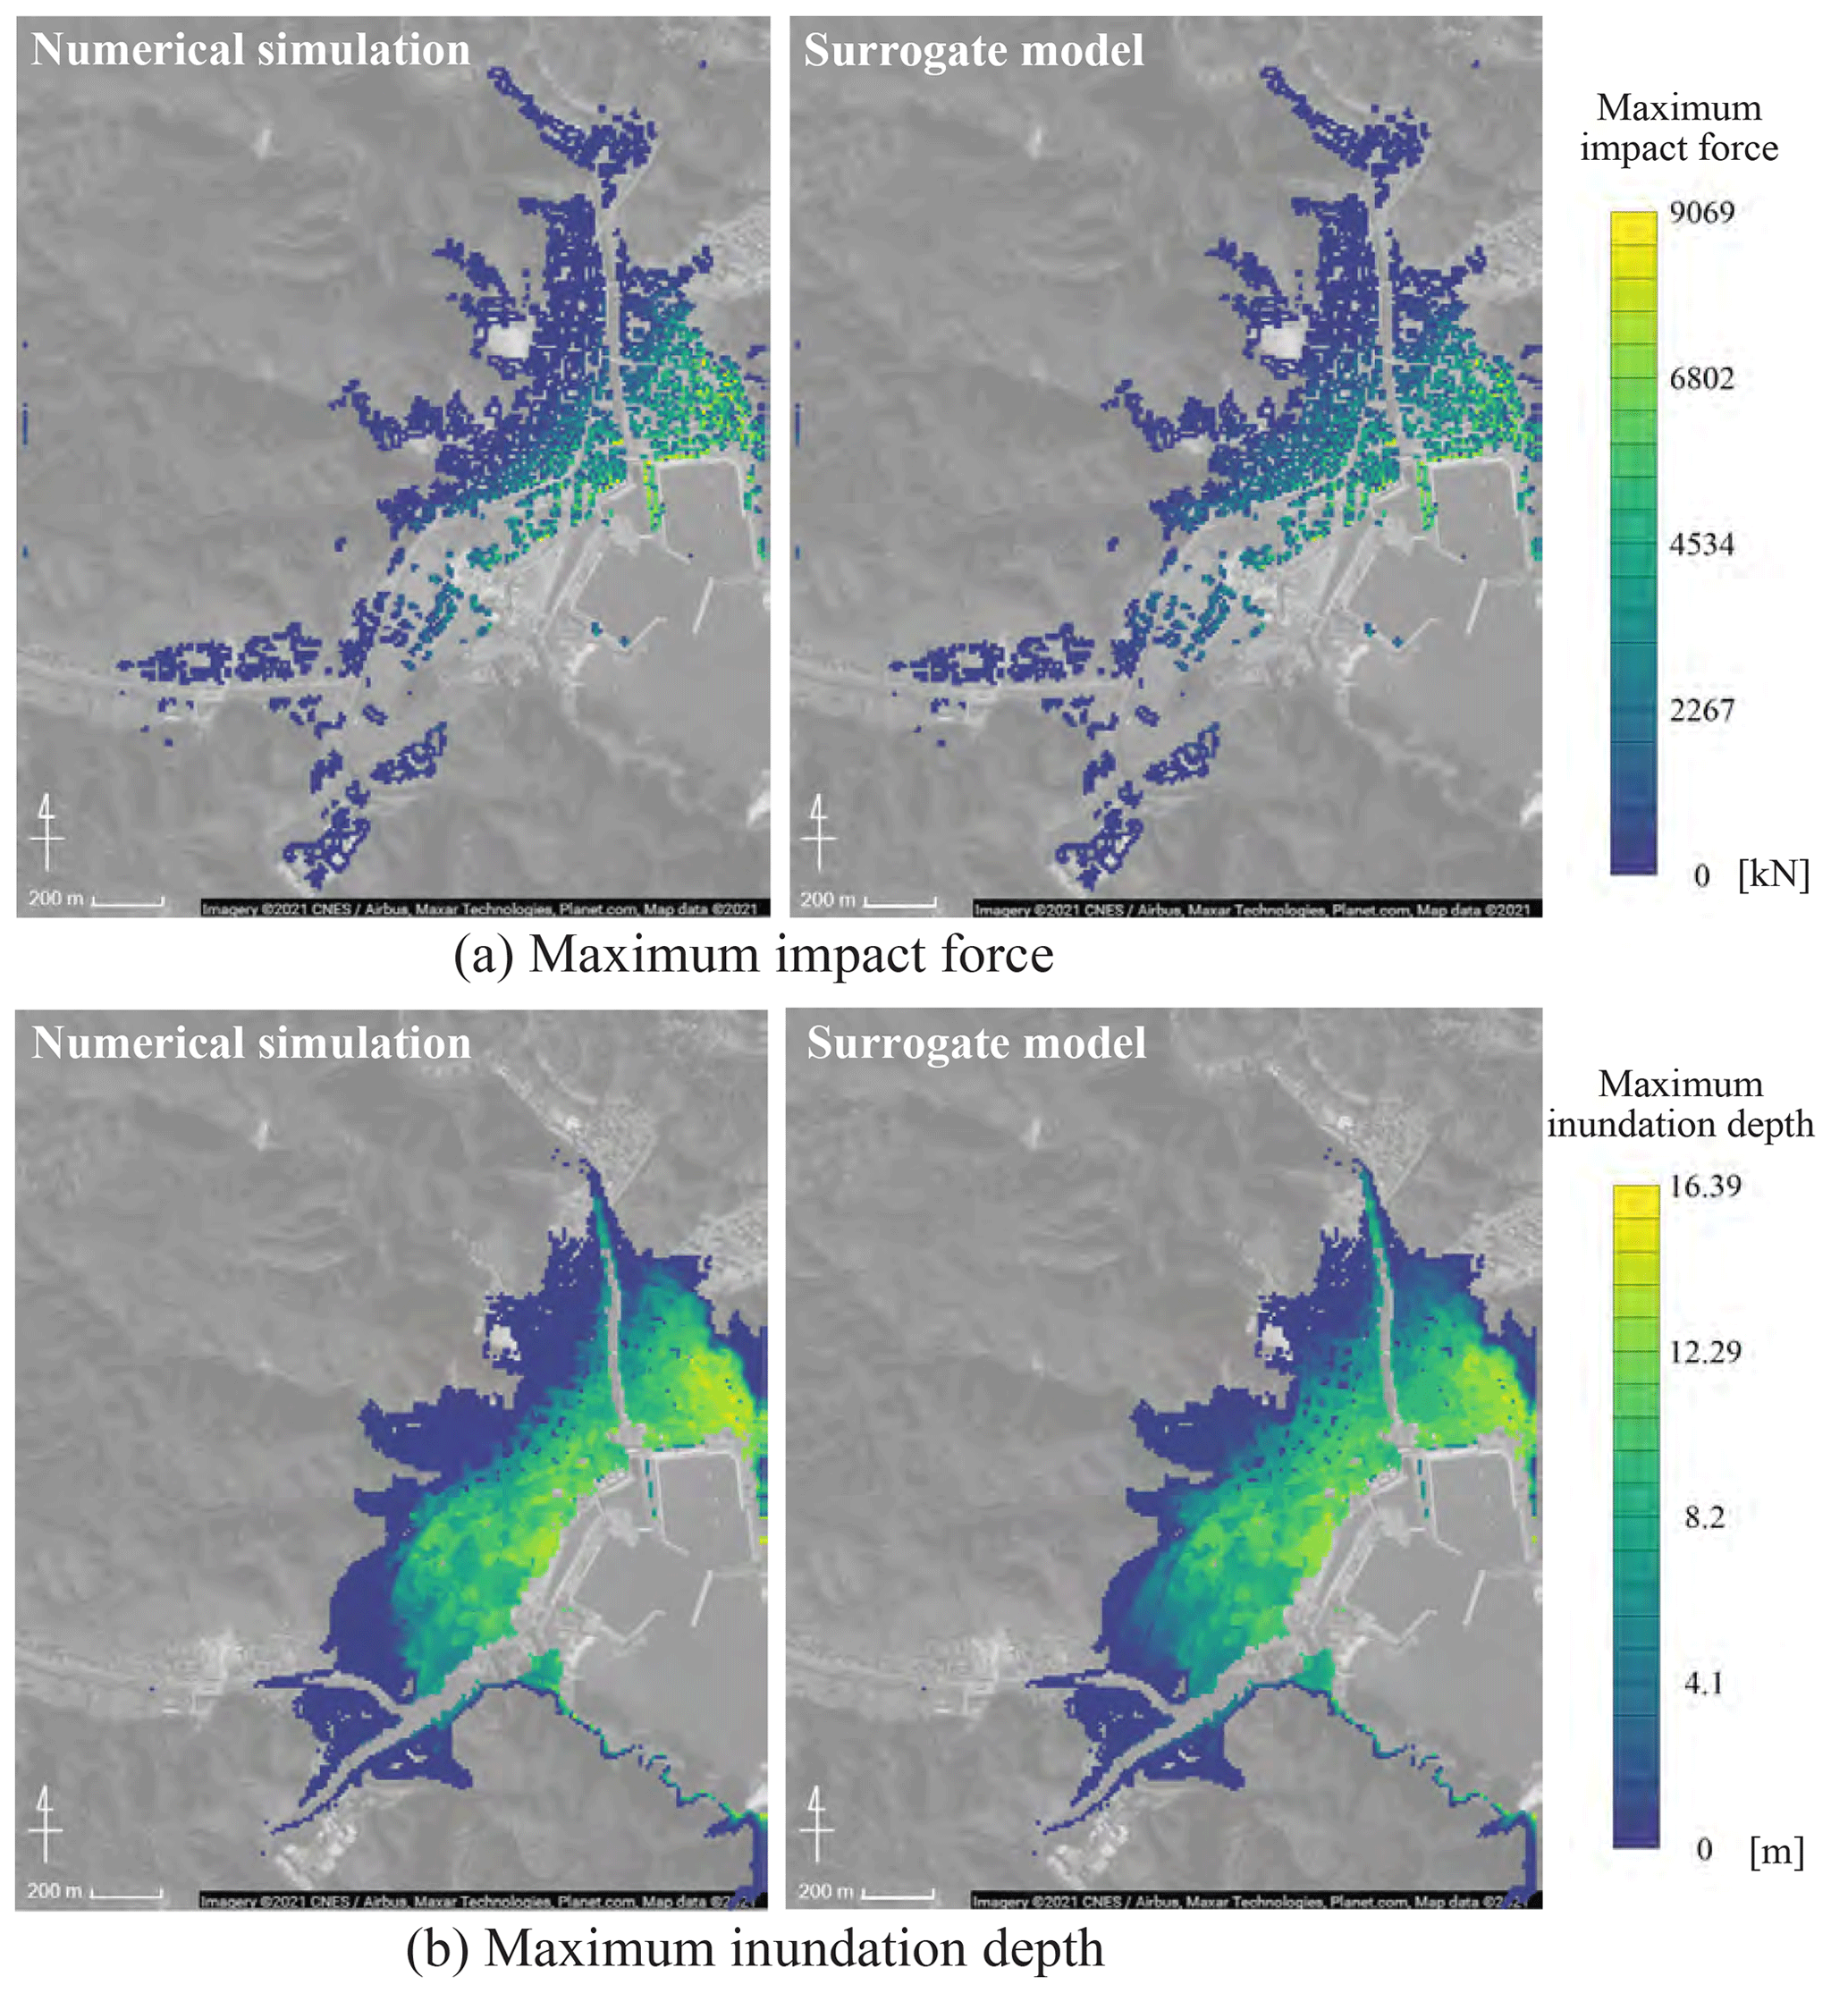
Figure 11Comparison between the results of the numerical simulation and the surrogate model (scenario: S3R3) (© Google Maps).
Figure 10 shows the cross-validation error of the maximum impact force and the maximum inundation depth for each number of modes. Cases in which no regularization term is present (Eq. 15) are also shown in Fig. 10. Bayesian optimization was used for the search in the parameter space. The number of searches was set to 80, and the upper confidence bound (UCB) strategy was used for the acquisition function. The error comparison confirmed that the accuracy of the surrogate model was improved by introducing the regularization term. A robust surrogate model can be constructed by introducing the regularization term.
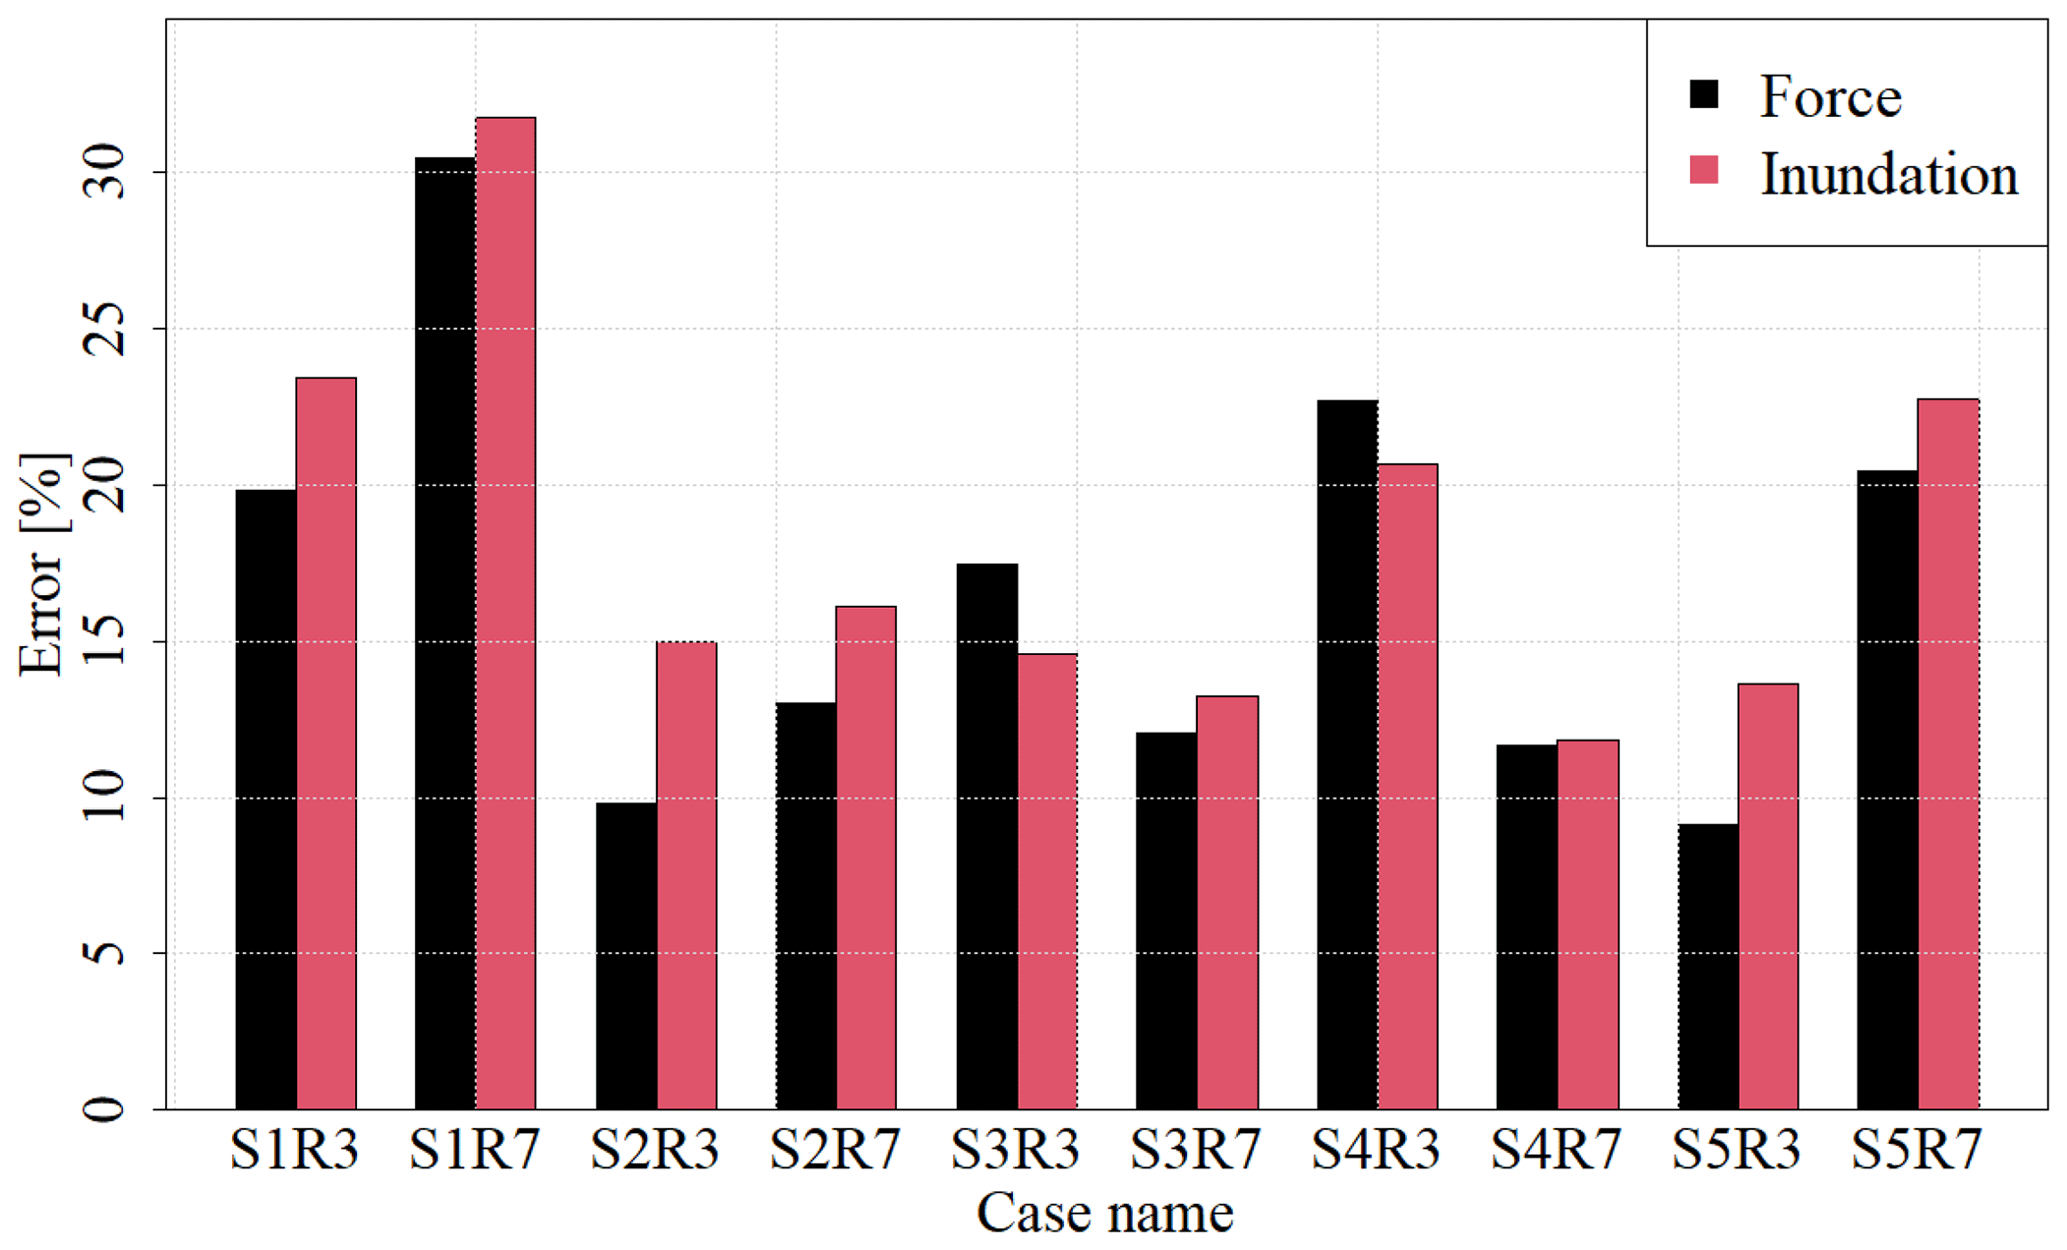
Figure 12Errors between the numerical simulation and surrogate model for each validation scenario.
Finally, the validity of the surrogate model was verified by comparing the numerical simulation results for scenarios not used for the constructed surrogate model with the results of the constructed surrogate model. Figure 11 shows a comparison between the numerical simulation and surrogate model results for the S3R3 scenario. For the number of modes used in the surrogate model, the maximum impact force was set to 8 and the maximum inundation depth was set to 11. Figure 12 shows the mean absolute errors calculated by Eq. (18) in the calculations for the 10 scenarios used for validation. Figure 11 shows that the constructed surrogate models can roughly represent the targeted spatial distribution of the maximum impact force and maximum inundation depth. Figure 12 shows that 10 % or higher errors occur in some validation scenarios, and the areas of large error are localized because there is a possibility that spatial modes used for surrogate models cannot properly capture the local characteristics.
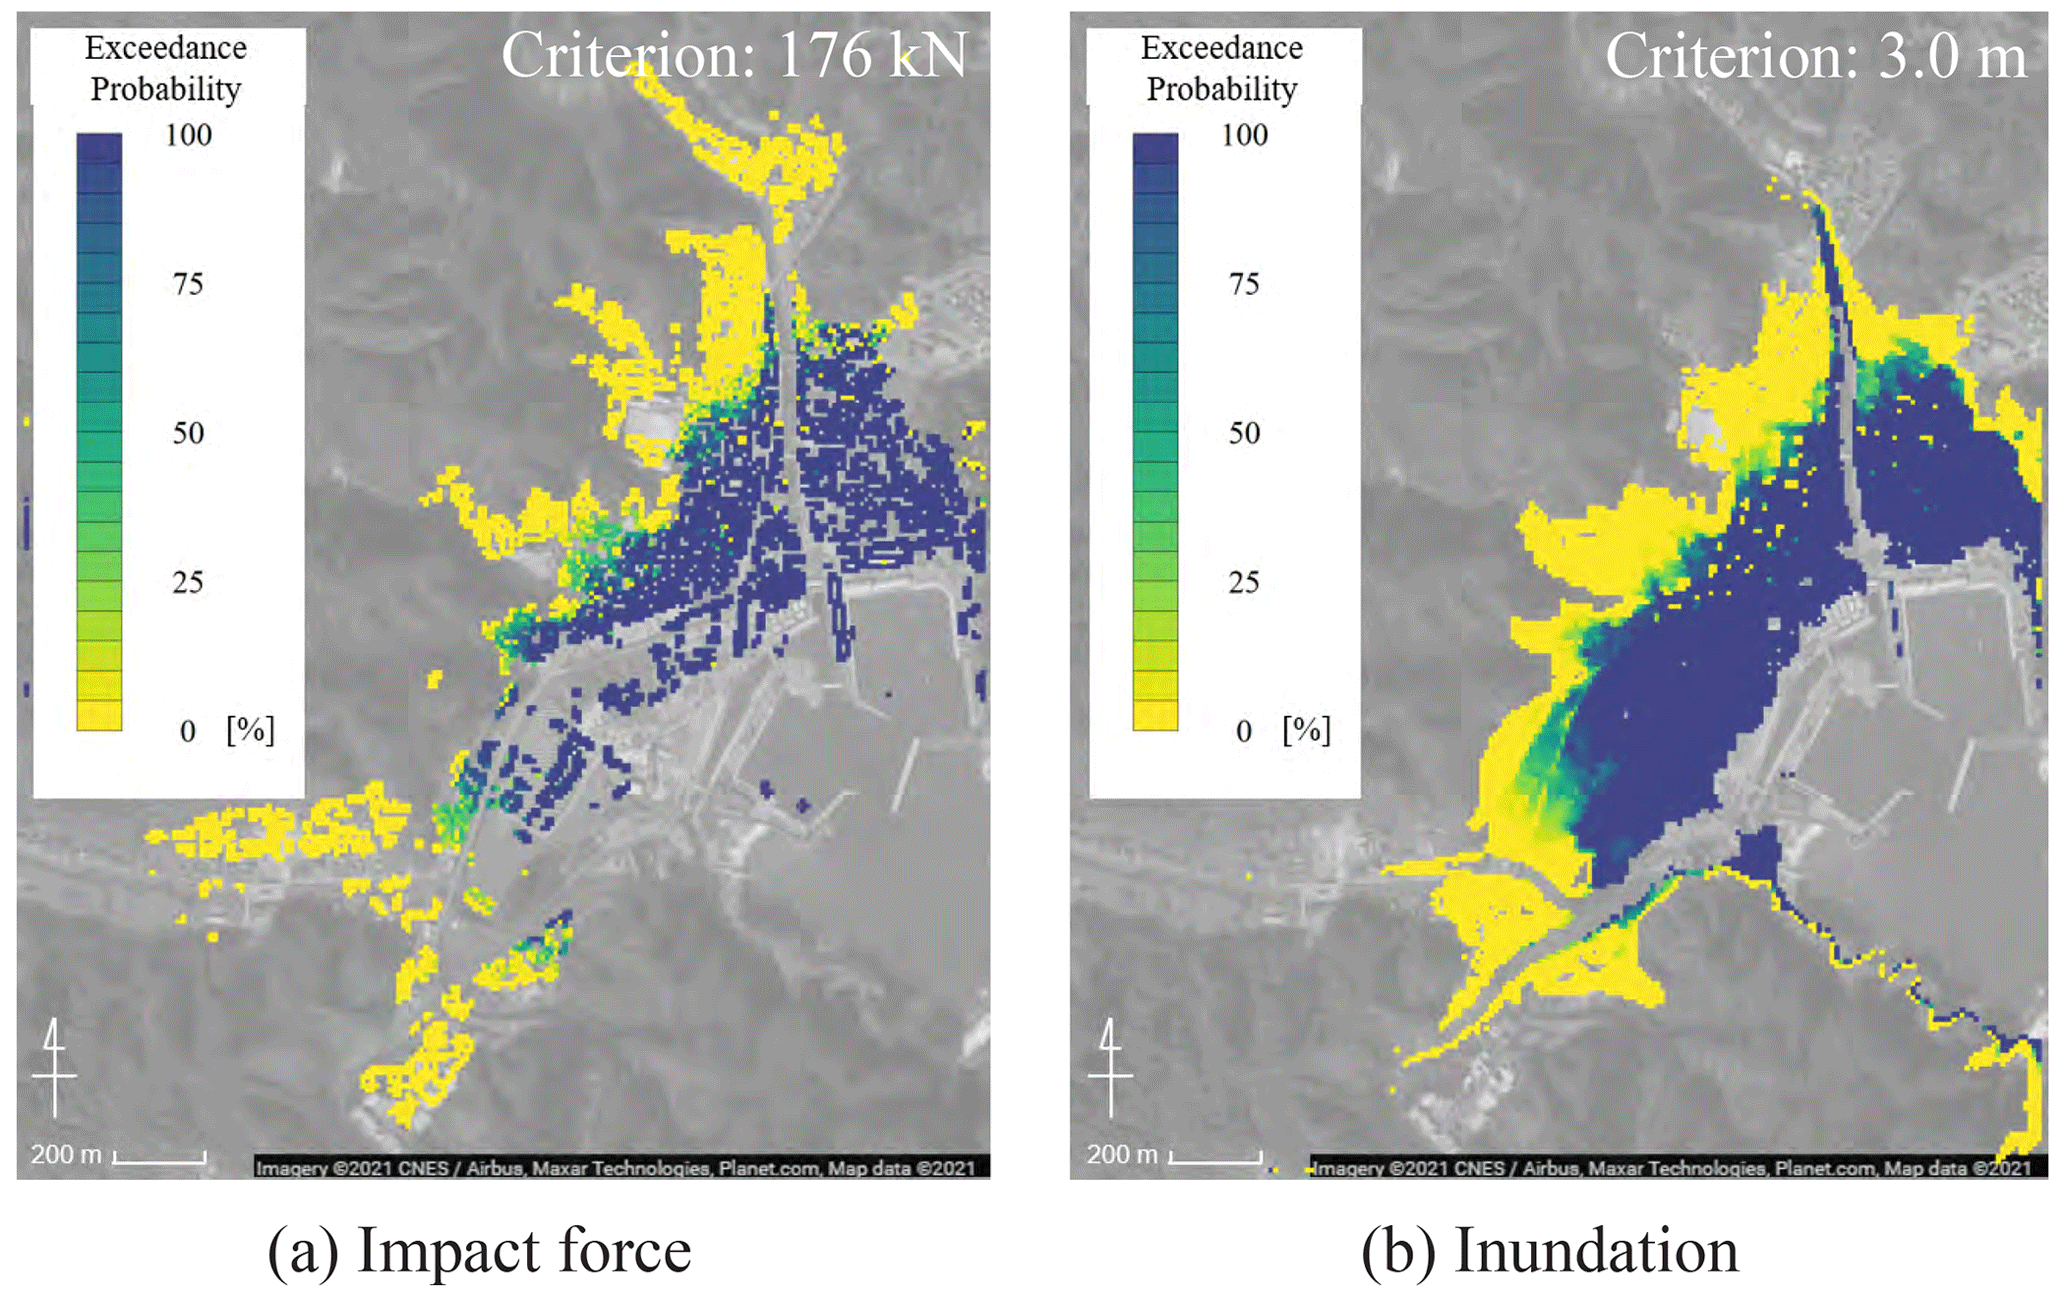
Figure 13Spatial distribution for the exceedance probability (© Google Maps).
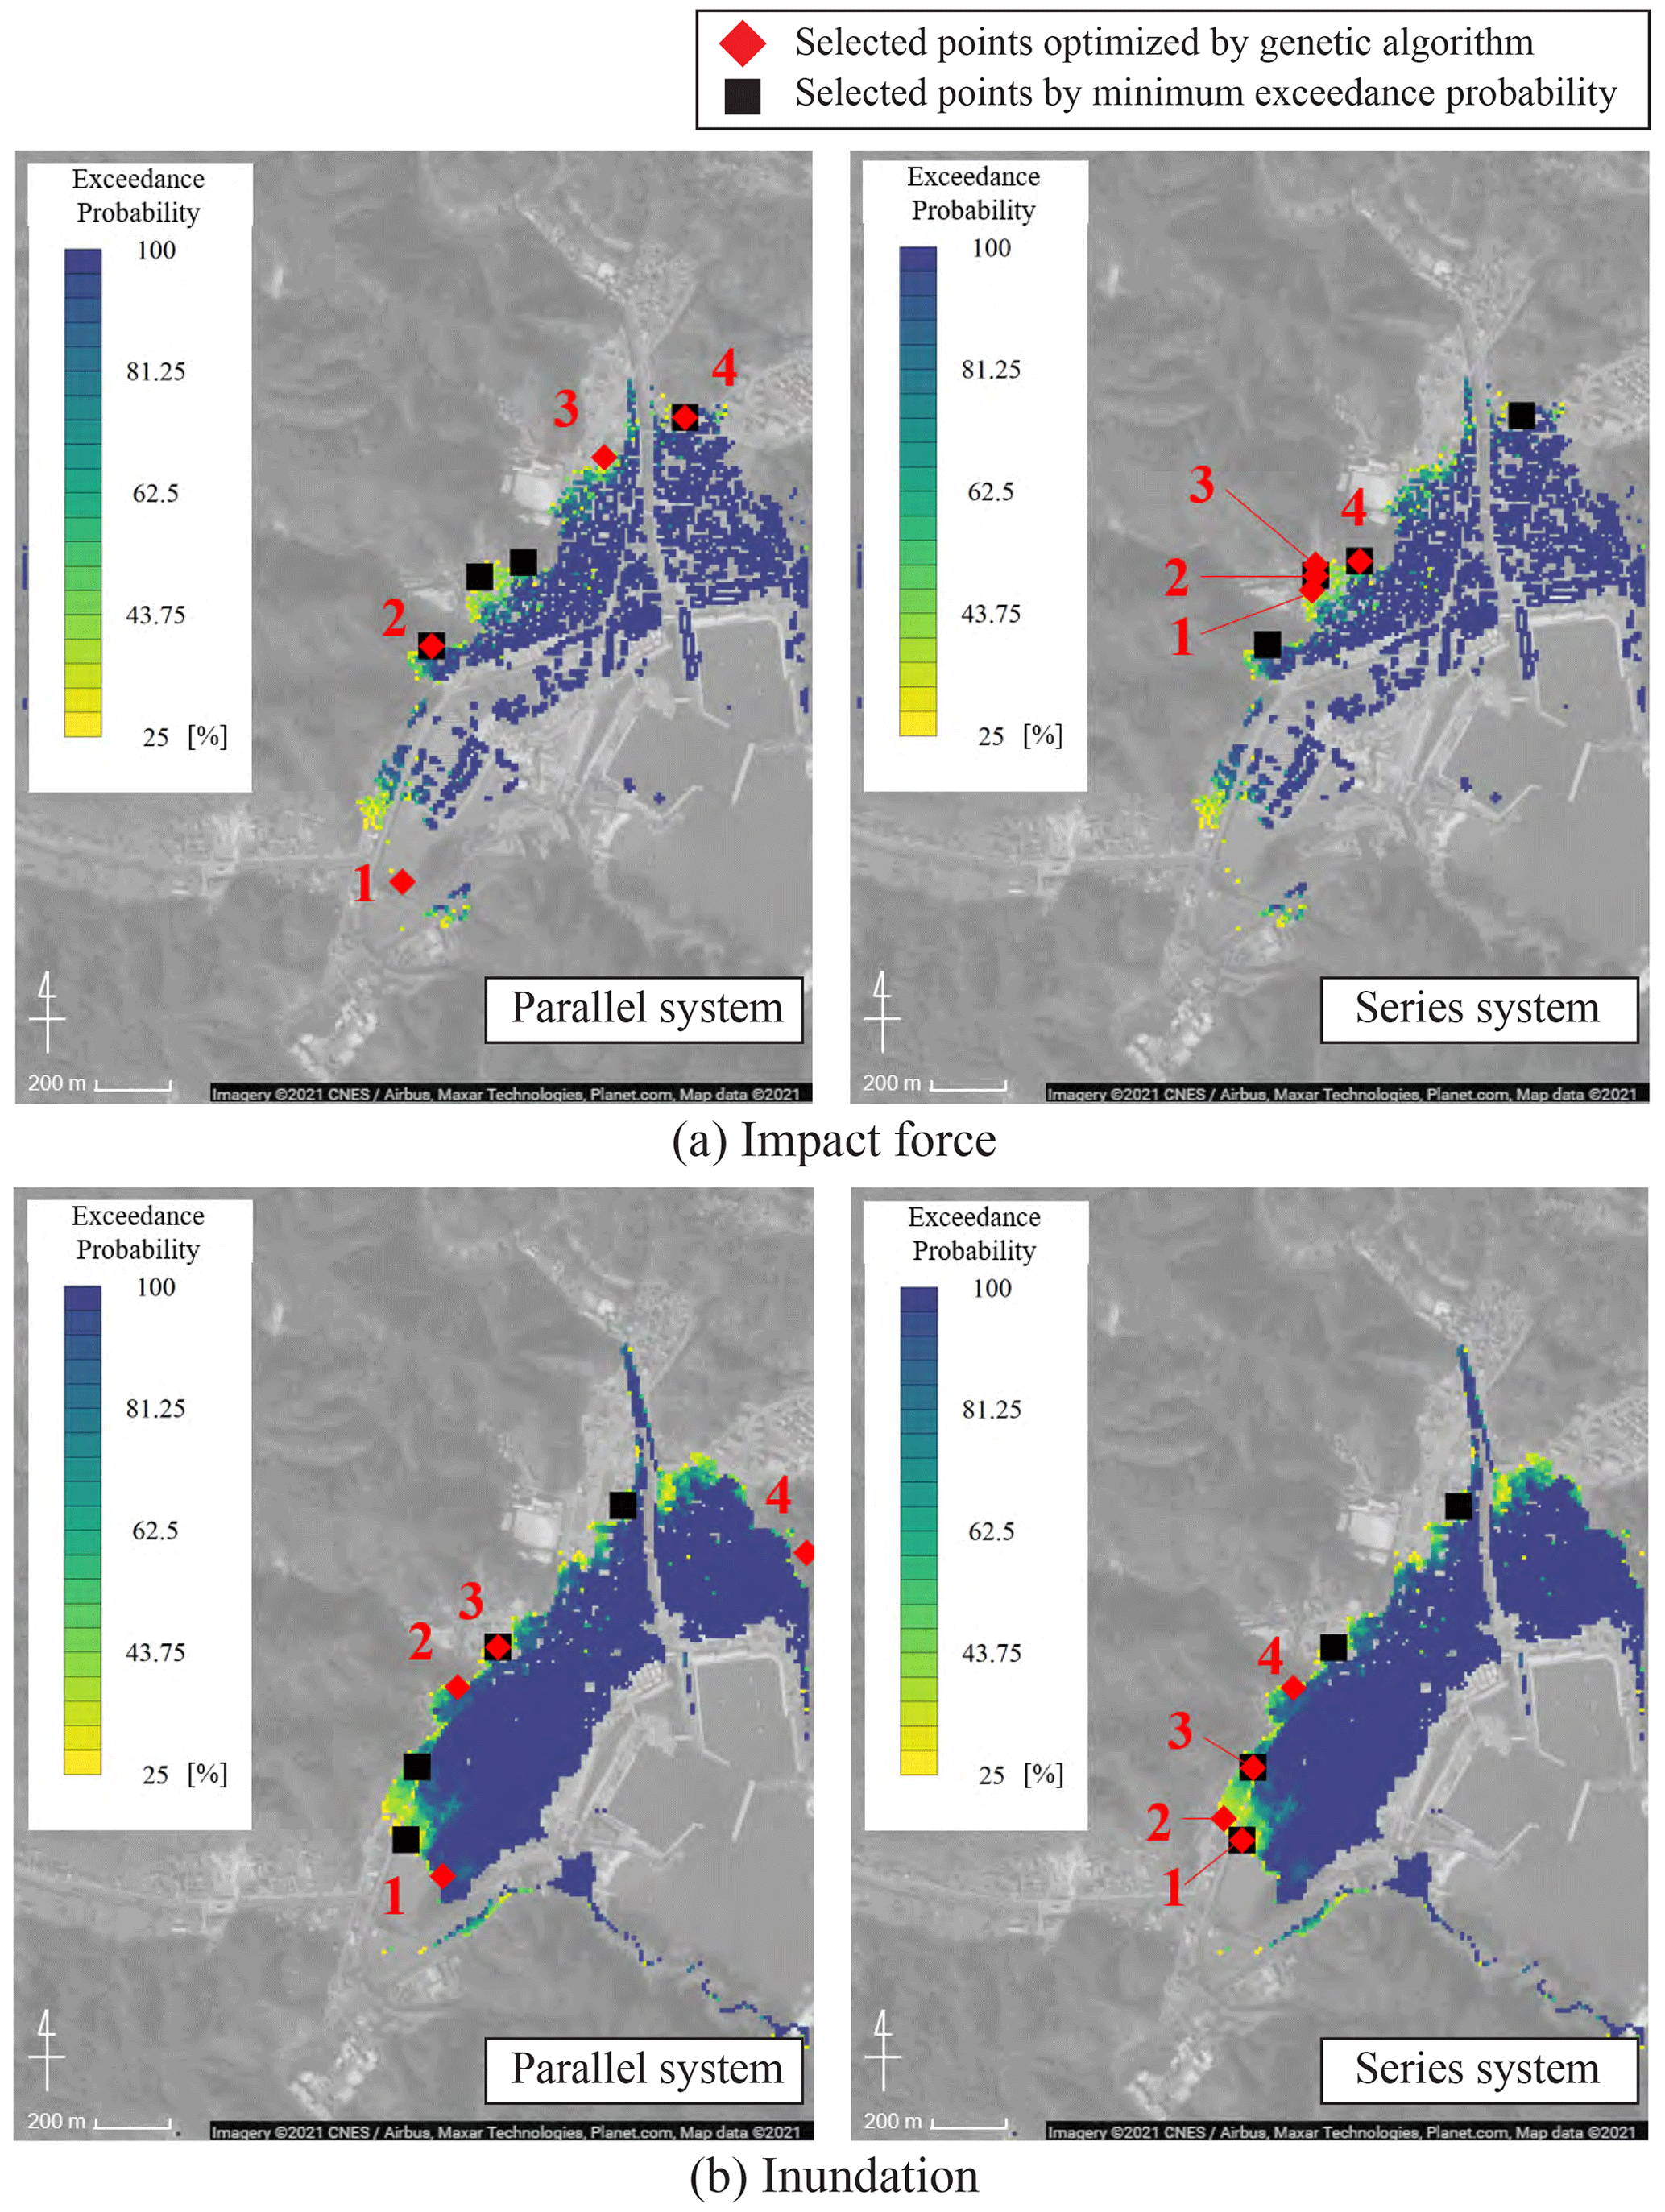
Figure 14Optimal placements obtained from the genetic algorithm for each hazard index (© Google Maps). Points selected by minimum exceedance probability show the results of placements determined in the order of decreasing exceedance probability at each evaluation point. Only search areas are colored in this figure.
3.3 Monte Carlo simulation
We conducted probabilistic tsunami hazard assessments using a constructed surrogate model. The surrogate model enables the computation of the spatial distribution of hazard indices at a low computational cost. Hence, many trials can be secured at a relatively low computational cost. Thus, a risk assessment that efficiently utilizes the advanced numerical simulation results is conducted.
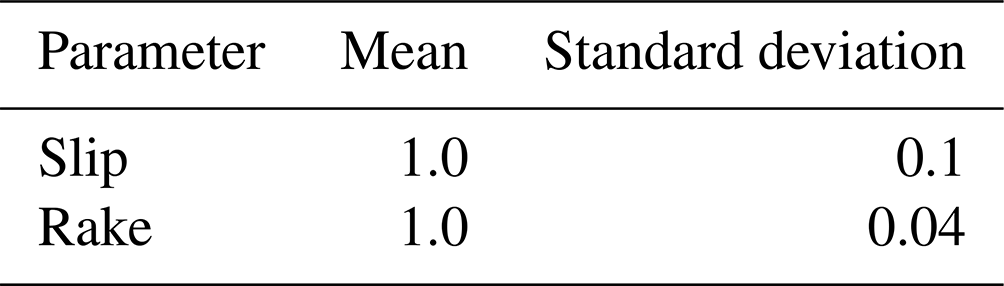
We conducted a probabilistic assessment of the tsunami hazard by applying Monte Carlo simulations. The variation of uncertainty parameters must be quantitatively assessed probabilistically for Monte Carlo simulations. We assumed that the slip and rake followed a normal distribution, and the probability distribution parameters were set as summarized in Table 2. Normalized values were used as the input parameters for the mean values, and therefore, these were set as 1.0. For the standard deviation of the slip, a value of 0.1 was used, which indicated a standard deviation value 10 % of the mean value. For a normal distribution, the spread of approximately three times the given standard deviation was present; therefore, the value of three times the standard deviation was set as this value to cover the range listed in Table 1. For the standard deviation of the rake, Japan Society of Civil Engineering (2011) conducted probabilistic assessments where the rake was varied by . We considered this degree of variation and used a value of 0.04, which resulted in a variation of approximately 3 times the standard deviation.
Table 2Information on the variation of uncertainty parameters.
Monte Carlo simulations were conducted using uncertainty parameters listed in Table 2 and the surrogate model. The information of each uncertainty parameter was used to randomly generate a combination of the slip and rake; then, this value was assigned to the mode coefficient functions of the surrogate model. The spatial distribution of the hazard index was calculated by multiplying the coefficients and modes. This was repeated for all 10 000 trials. The probability density distributions of the maximum impact force and maximum inundation depth at each point were calculated.
The maps of exceedance probability were obtained from the results of Monte Carlo simulations. The exceedance probability at each evaluation point was calculated assuming the failure that can be defined by the criteria of each hazard index. According to the previous studies (Suppasri et al., 2013, 2019), we defined the following criteria: the maximum impact force = 176 kN and the maximum inundation depth = 3 m. The obtained exceedance probability maps for both hazard indices are shown in Fig. 13. In both maps, there is a tendency that high exceedance probabilities arise near the coast and low exceedance probabilities occur farther away from the coast. There are some differences between the maps. For example, the exceedance probability of the maximum impact force tends to be high in areas where there are many buildings. The computational cost of surrogate models is considerably low, and therefore such probabilistic maps can be obtained easily.
3.4 Optimal placement of facilities using genetic algorithms
Results of the Monte Carlo simulation are used to investigate an optimal placement of facilities. The optimal placement is examined for both parallel and series systems, and the results are compared. In a parallel system, system failure occurs when all facilities have failed; in contrast, a series system fails when any facility fails. The failure of the facility is defined as exceeding the failure criterion for each hazard index.
The optimization problem is defined as selecting the components of the system from the evaluation points for hazard indices. The areas that have 25 % or higher exceedance probabilities for each failure criterion are set as the target areas. The points of the system were selected only in these high-risk areas because a point with an exceedance probability of 0 % should always be selected if there are such points in the target area; this does not result in an optimal problem. Although this condition is not realistic, we employed it as a calculation condition to clearly represent the performance of the proposed method.
Table 3System failure probability for each hazard index and each system.
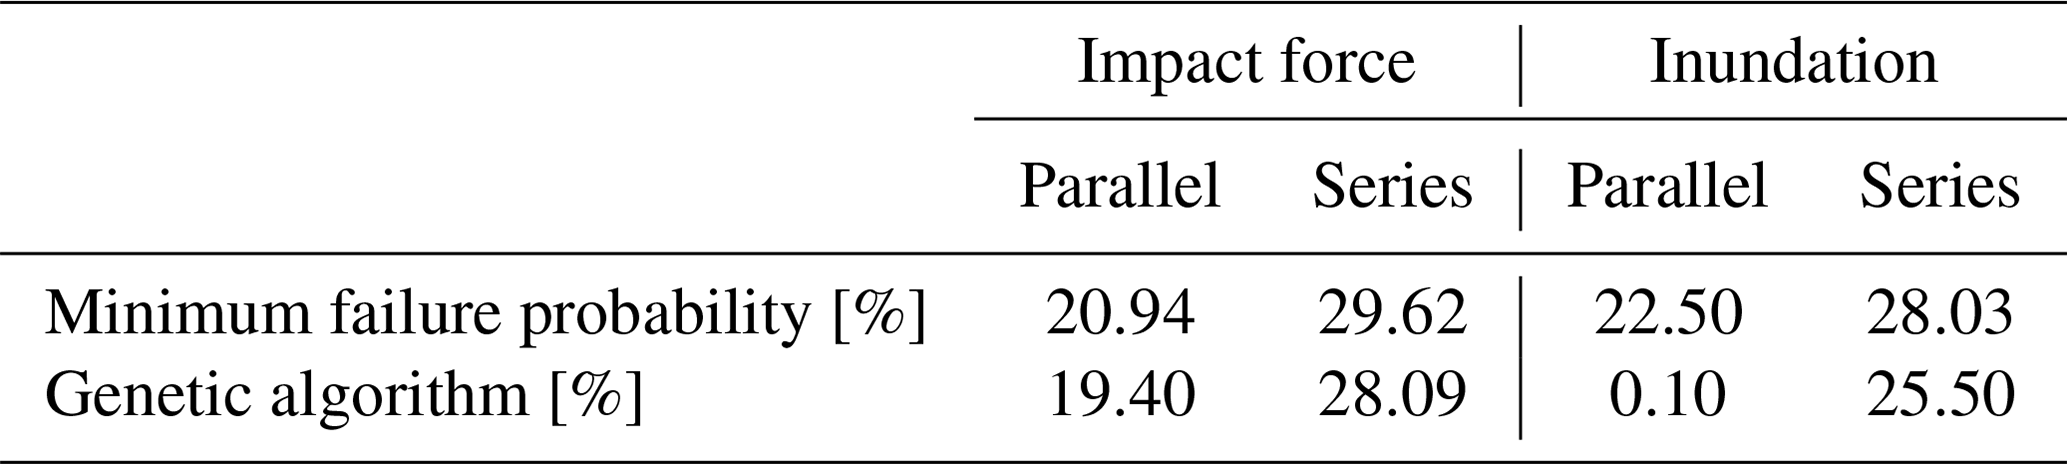
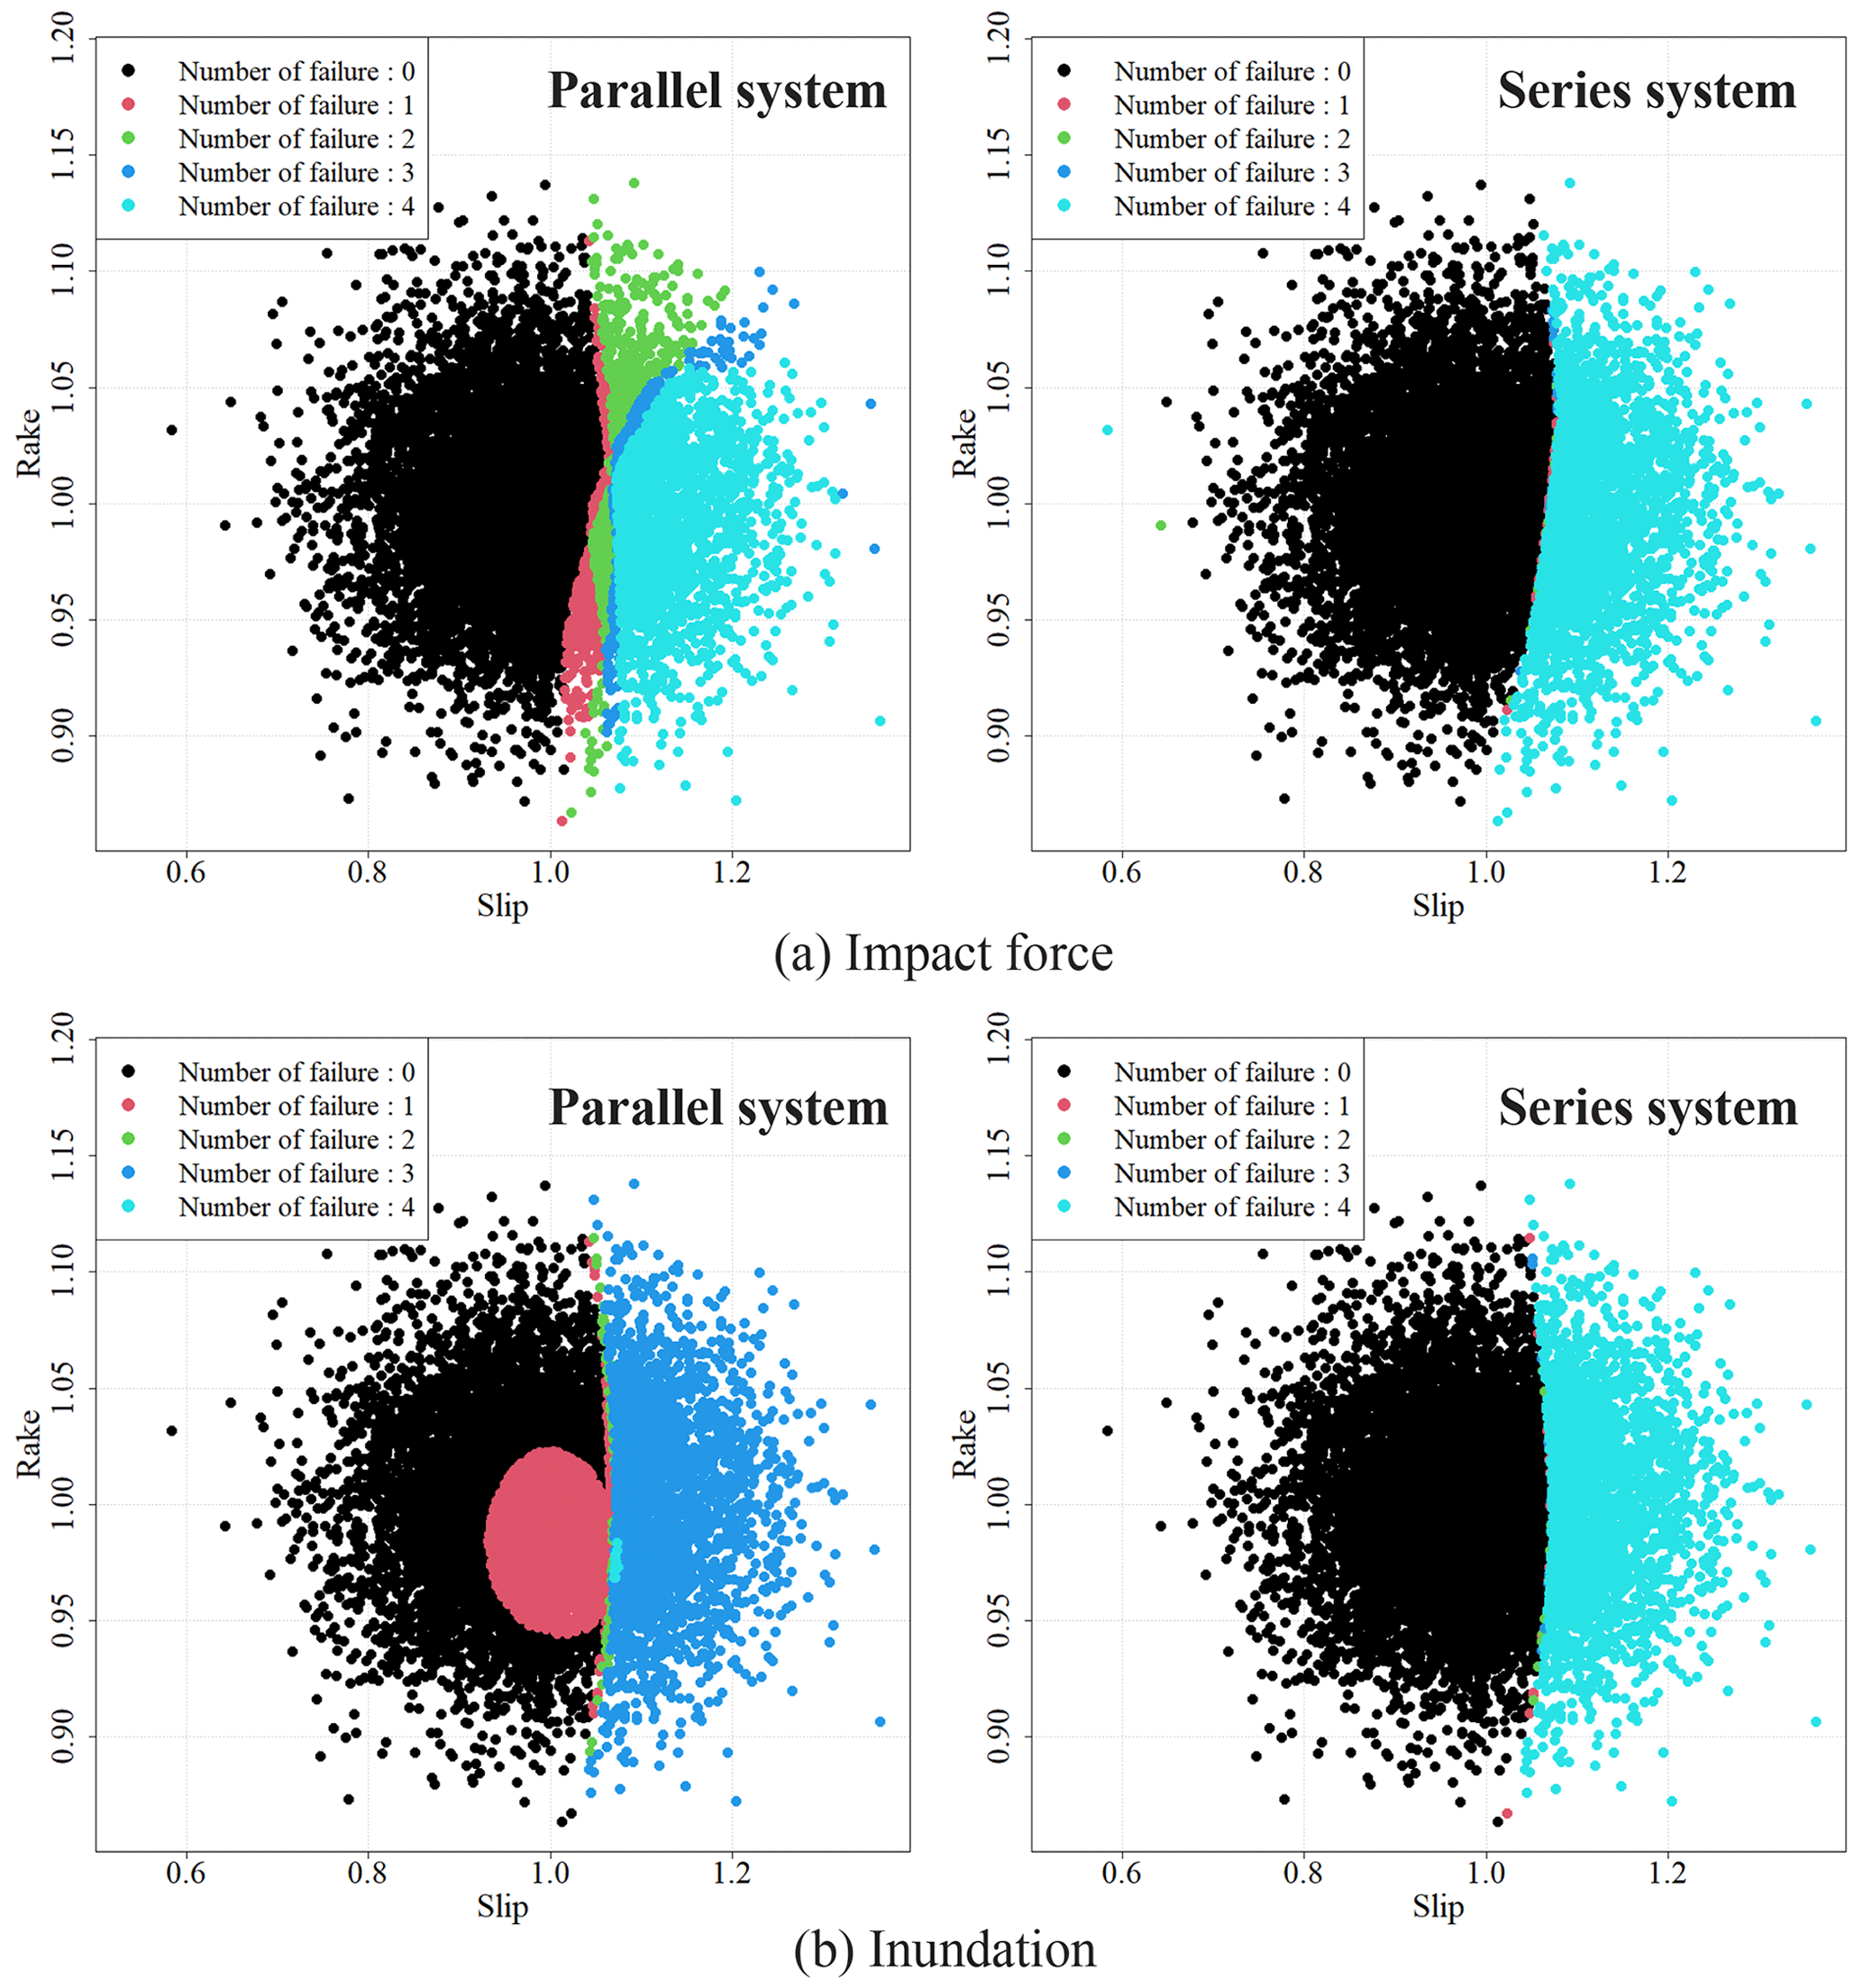
Figure 15The scatter plot of the uncertainty parameters colored by the number of failure points for each placement.
The number of individuals for the genetic algorithm was set to 200, and the mutation probability was set to 10% for each component of each individual. We adopted an elite conservation strategy, wherein solutions with high fitness values are likely to be selected for the crossover operation. The solution was said to converge when the solution individuals do not change over 2000 steps. We investigated cases in which the number of facilities was four for each failure criterion and system. Since the solution may depend on initial conditions, we conducted three trials under the same conditions for each case.
The results of the optimal placements based on the concepts of the parallel and series systems for each hazard index are illustrated in Fig. 14. The results are compared with the placements determined based on a simple strategy in which the placement of the facilities is selected in the order of lower exceedance probability. The system failure probabilities for each placement are summarized in Table 3. The system failure probabilities are expressed as the probability of failure of all facilities for parallel systems and the probability of failure of one or more facilities for the series system.
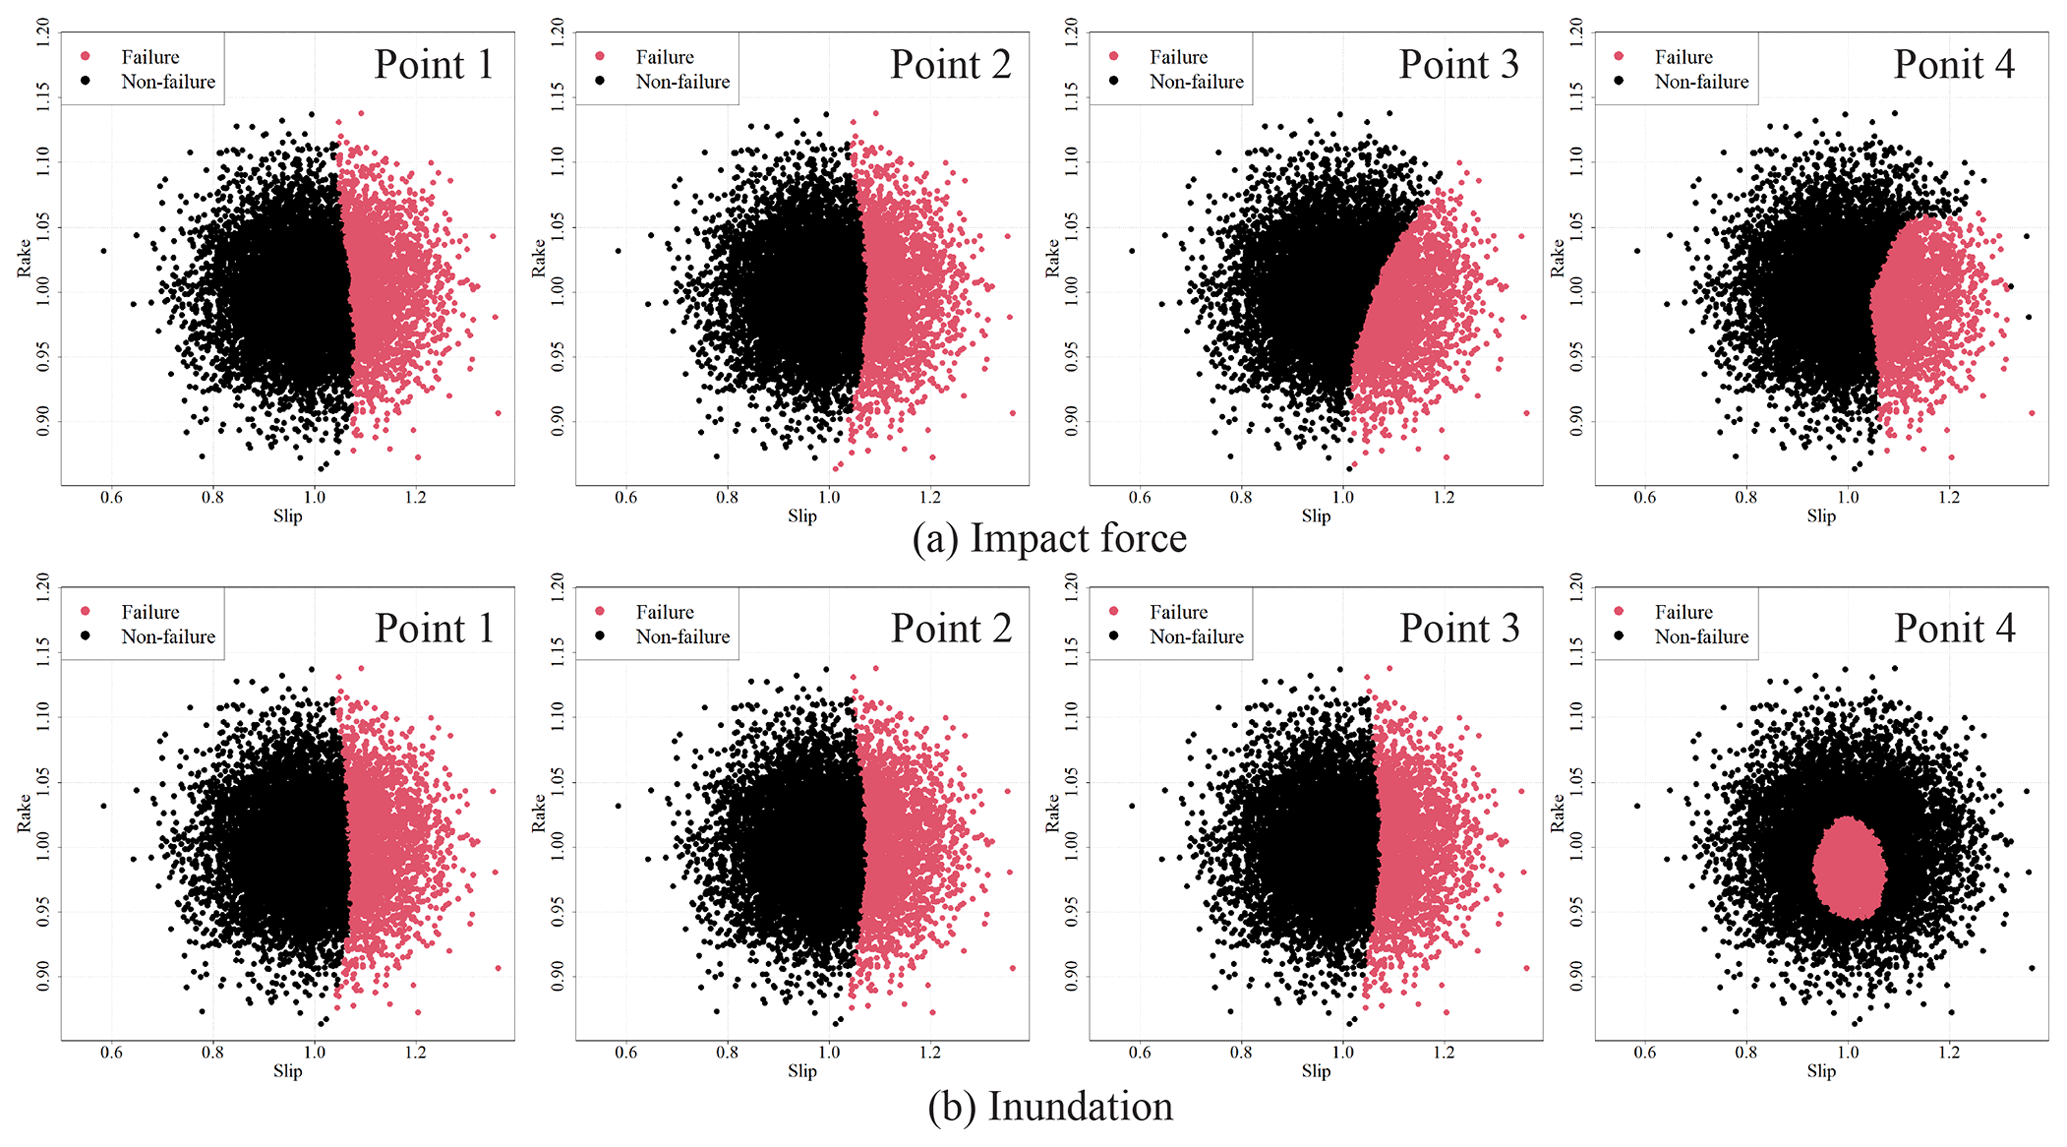
Figure 16Scatter plot of the uncertainty parameters colored by failure or non-failure for the parallel system.
The results shown in Fig. 14 indicate that the selected points are placed away from the coastline. This tendency is attributed to the low failure probability points being located away from the coastal region. Different placements were obtained for the maximum impact force and inundation depth. Comparing the parallel and series systems shows that the points are selected by focusing on similar locations in the series system (whereas they are spatially distributed in the parallel system). In the series system, the points are concentrated in an arrangement such that the probability of the exceedance is small. In contrast, one or more facilities need to be safe in the parallel system, which is why the selected points are spatially distributed.
Comparing the placement selected by the genetic algorithms and those selected in the order of lower exceedance probabilities shows that some selected locations are different. System failure probabilities shown in Table 3 indicate that the lower failure probability tends to be obtained by the genetic algorithm. Therefore, the genetic algorithm is indeed suitable in this optimal placement problem.
The placements selected for each system were analyzed in detail. Figure 15 shows the scatter plots of the uncertainty parameters (slip and rake) considered in the Monte Carlo simulation, and the number of failure points was colored. The placement for the parallel system is optimized around a smaller light-blue area, and the placement for the series system optimizes around a larger black area. Figure 15 shows that the slip contributes to the failure of each point and the system for all placements because failure occurs only in the high-slip case. The rake contributes to the parallel system placement because the number of failure points changes in the same slip values for the parallel system.
In the series system, the scenarios are separated into two situations: all safe and all failed. In contrast, the parallel system presents a more complex placement pattern. Figure 16 shows a colored scenario in the uncertainty parameter space. The optimal points for the maximum impact force are selected such that they do not fail depending on the rake. The inundation depth confirms that point 4 has a unique tendency compared to those of the other points. This numerical example indicates that the optimal placement is discussed efficiently by the proposed method.
Optimal facility placements can be investigated in a probabilistic manner based on the information obtained from the advanced numerical simulation using the results of the Monte Carlo simulation with the surrogate models. This method can be used to solve the problem of the optimal placement of facilities such as relief bases, shelters, and infrastructure facilities during disasters.
We proposed a method that enables investigating the optimal facility placement probabilistically by efficiently utilizing the information obtained from advanced numerical simulations. The placement was investigated probabilistically using genetic algorithms and Monte Carlo simulation (MCS) results obtained from the surrogate model. The surrogate models of two tsunami hazard indices (tsunami force and inundation depth) were constructed based on 3D tsunami simulation results. The placements of the parallel and series systems that minimize system failure probability were investigated. The results indicate that the facilities were placed by concentrating on similar locations in the series system; however, they were spatially distributed in the parallel system. The placements can be searched at a low computational cost using the surrogate models and genetic algorithm.
The uncertainty parameters in this study were limited to two when conducting PTHAs; however, there are many uncertainties in actual tsunami. Therefore, it is important to conduct a probabilistic hazard assessment that considers the uncertainties. The extent to which each uncertainty parameter will fluctuate must be assessed in advance to determine cases in which the numerical simulations or Monte Carlo simulations are to be conducted. The surrogate model constructed with the proposed method can represent tsunami hazard indices with sufficient accuracy for interpolation (within the range of uncertainty parameters for which numerical simulations were conducted). The accuracy often decreases for cases of extrapolation (outside the range of uncertainty parameters for which the numerical simulations were conducted); thus, it is important to assess uncertainty fluctuation. In addition, because the accuracy of the surrogate model changes with the amount of training data and the number of spatial modes used in the surrogate model, it is necessary to establish a method to properly determine them in future studies. We used the simulation data set created in a previous study and therefore could not investigate their effect on surrogate modeling. However, an appropriate amount of training data should be determined considering accuracy. Therefore, it may be necessary to consider adopting an approach like adaptive surrogate modeling (Wang et al., 2014; Gong et al., 2016) to improve the accuracy of surrogate models. We calculated the exceedance probability with the failure criterion as a constant when investigating the exceedance probability and optimal placement. However, the failure criteria vary according to the building properties. Thus, using the building property information would enable a more advanced probabilistic risk assessment and optimal placement of facilities.
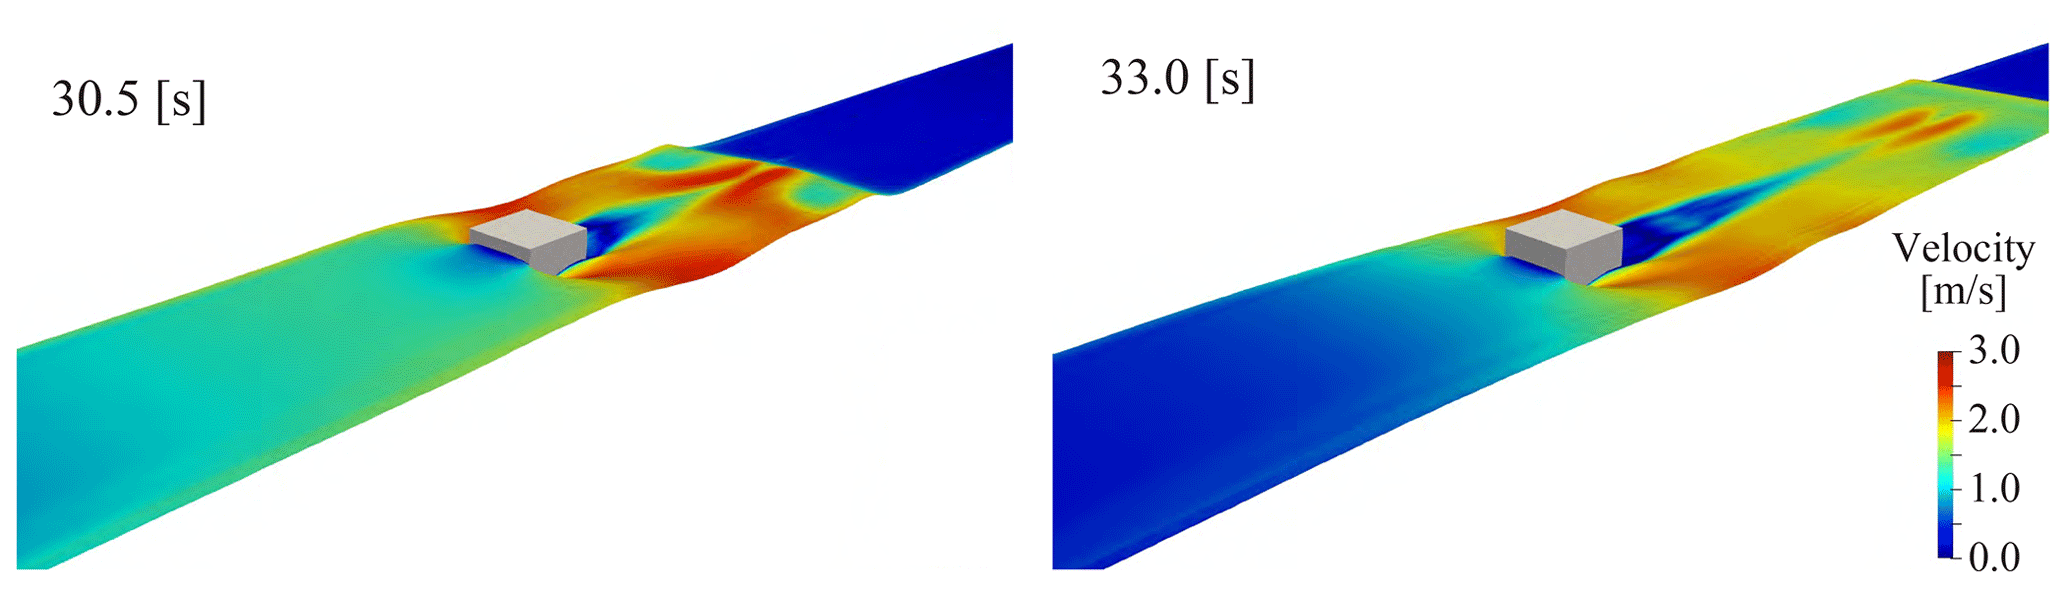
We verified the validity of the 3D analysis method adopted in this study by comparing the experimental results with those of the study by Winter et al. (2020), in which experiments were conducted on the fluid force acting on the structure while changing the structural placement. We conducted a comparison between the experimental results under the conditions shown in Fig. A1 with the analysis results. Details of the experiment are as shown in the study by Winter et al. (2020). Comparisons between the experimental results and the numerical analysis results were performed regarding the temporal changes in the water level on the front side of the structure and the fluid force acting on the structure. Figure A2 shows the comparison results for the fluid force and water level. The validity of the adopted numerical analysis was confirmed because the experimental results for fluid force and water depth were captured by the numerical simulations. Figure A3 shows a snapshot of the simulation results.
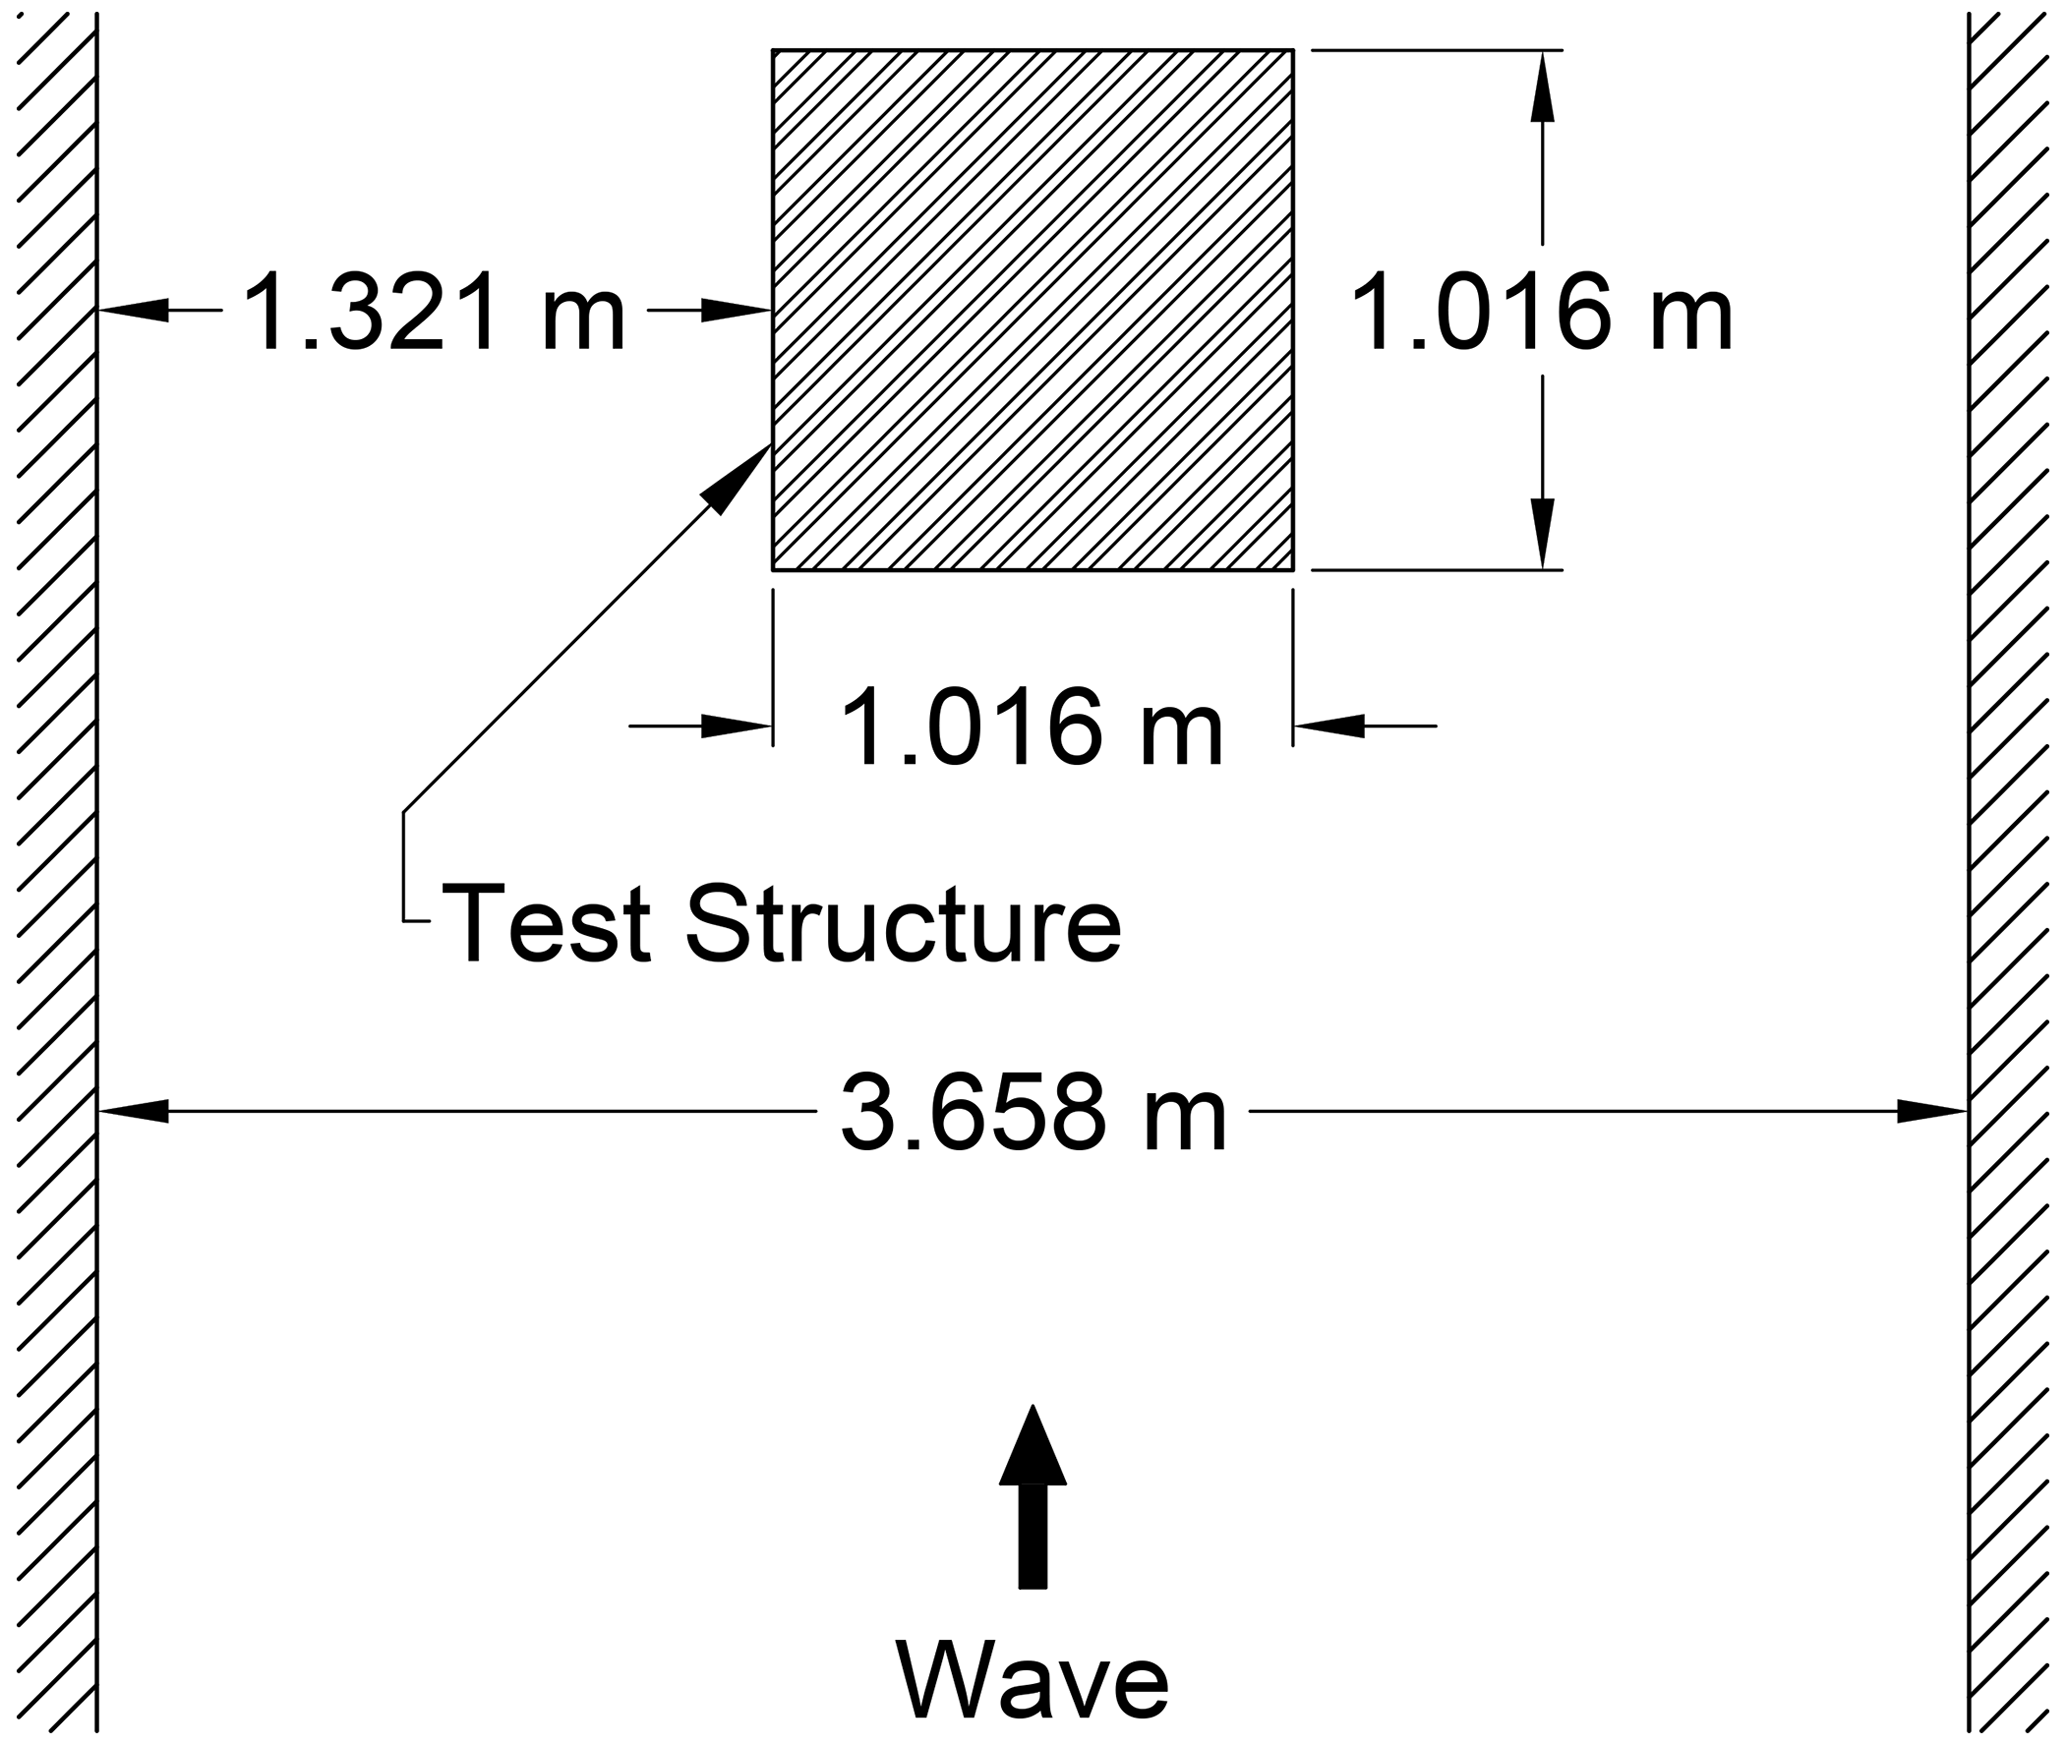
Figure A1Configuration of the test structure (adapted from Winter et al., 2020).
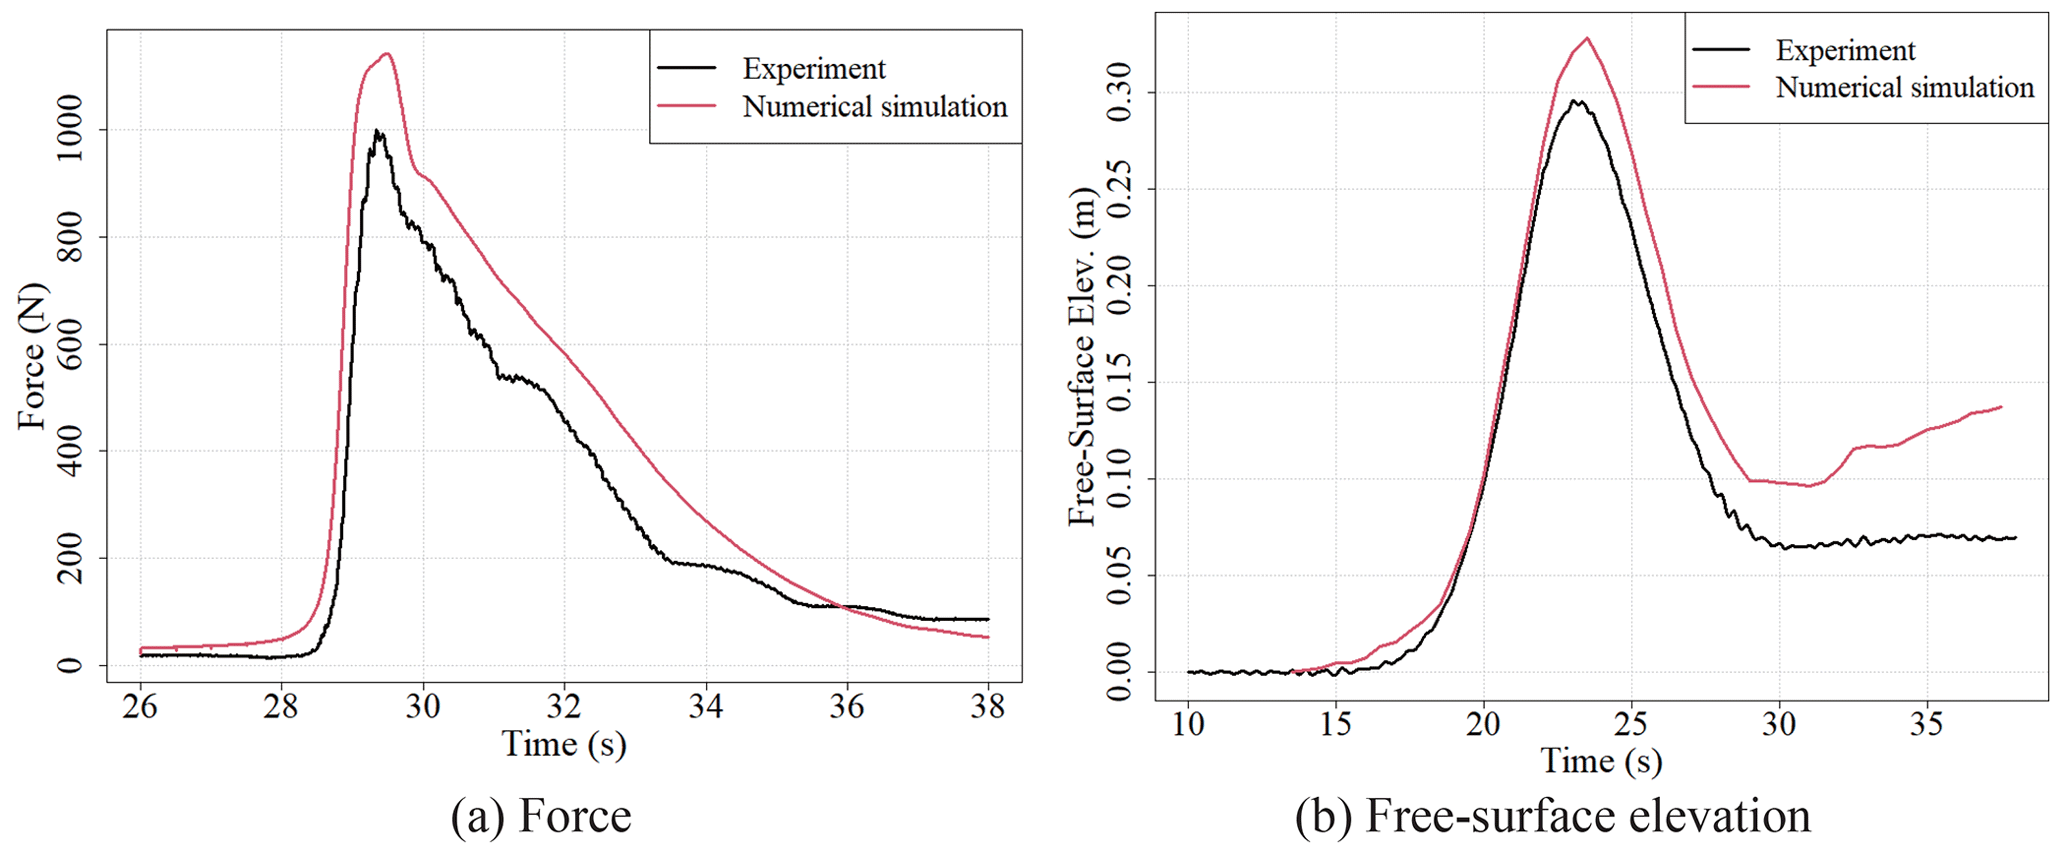
Figure A2Comparison between experimental results and numerical simulation results (a force and b free-surface elevation).
Source code and details of the tsunami simulation were sourced from Kotani et al. (2020) (https://doi.org/10.1016/j.coastaleng.2020.103719). Outputs of the simulations are available at the Zenodo open-access repository at https://doi.org/10.5281/zenodo.6394294 (Tozato, 2022).
KTo contributed to methodology, analyses, and preparing the original manuscript. SM contributed to the conceptualization and methodology and prepared the manuscript. ST contributed to the numerical simulations. YO and AS contributed to the methodology and conceptualization. MRM contributed to the investigation and reviewing the manuscript. KTe contributed to the supervision and reviewing the manuscript.
The contact author has declared that none of the authors has any competing interests.
Publisher’s note: Copernicus Publications remains neutral with regard to jurisdictional claims in published maps and institutional affiliations.
This paper was edited by Rachid Omira and reviewed by Jinsheng Wang and one anonymous referee.
Alhamid, A. K., Akiyama, M., Ishibashi, H., Aoki, K., Koshimura, S., and Frangopol, D. M.: Framework for probabilistic tsunami hazard assessment considering the effects of sea-level rise due to climate change, Struct. Saf., 94, 102152, https://doi.org/10.1016/j.strusafe.2021.102152, 2022. a
Annaka, T., Satake, K., Sakakiyama, T., Yanagisawa, K., and Shuto, N.: Logic-tree approach for probabilistic tsunami hazard analysis and its applications to the Japanese coasts, Pure Appl. Geophys, 164, 577–592, https://doi.org/10.1007/s00024-006-0174-3, 2007. a
Baba, T., Kamiya, M., Tanaka, N., Sumida, Y., Yamanaka, R., Watanabe, K., and Fujiwara, H.: Probabilistic tsunami hazard assessment based on the Gutenberg–Richter law in eastern Shikoku, Nankai subduction zone, Japan, Earth Planets Space, 74, 156, https://doi.org/10.1186/s40623-022-01715-1, 2022. a
Bamer, F. and Bucher, C.: Application of the proper orthogonal decomposition for linear and nonlinear structures under transient excitations, Acta Mech., 223, 2549–2563, https://doi.org/10.1007/s00707-012-0726-9, 2012. a
Buhmann, M. D.: Multivariate cardinal interpolation with radial-basis functions, Constr. Approxim., 6, 225–255, https://doi.org/10.1007/BF01890410, 1990. a
Cavdur, F., Kose-Kucuk, M., and Sebatli, A.: Allocation of temporary disaster-response facilities for relief-supplies distribution: A stochastic optimization approach for after disaster uncertainty, Nat. Hazards Rev., 22, 05020013, https://doi.org/10.1061/(ASCE)NH.1527-6996.0000416, 2020a. a
Cavdur, F., Sebatli-Saglam, A., and Kose-Kucuk, M.: A spreadsheet-based decision support tool for temporary-disaster-response facilities allocation, Saf. Sci., 124, 104581, https://doi.org/10.1016/j.ssci.2019.104581, 2020b. a
Cornell, C. A.: Engineering seismic risk analysis, Bull. Seismol. Soc. Am., 58, 1583–1606, https://doi.org/10.1785/BSSA0580051583, 1968. a
Doerner, K. F., Gutjahr, W. J., and Nolz, P. C.: Multi-criteria location planning for public facilities in tsunami-prone coastal areas, OR Spectrum, 31, 651–678, https://doi.org/10.1007/s00291-008-0126-7, 2008. a
El-Hussain, I., Omira, R., Deif, A., Al-Habsi, Z., Al-Rawas, G., Mohamad, A., Al-Jabri K., and Baptista, M. A.: Probabilistic tsunami hazard assessment along Oman coast from submarine earthquakes in the Makran subduction zone, Arab. J. Geosci., 9, 668, https://doi.org/10.1007/s12517-016-2687-0, 2016. a
Gong, W., Duan, Q., Li, J., Wang, C., Di, Z., Ye, A., Miao, C., and Dai, Y.: Multiobjective adaptive surrogate modeling-based optimization for parameter estimation of large, complex geophysical models, Water Resour. Res., 52, 1984–2008, https://doi.org/10.1002/2015WR018230, 2016. a
Fukutani, Y., Suppasri, A., and Imamura, F.: Stochastic analysis and uncertainty assessment of tsunami wave height using a random source parameter model that targets a Tohoku-type earthquake fault, Stoch. Env. Res. Risk A., 29, 1763–1779, https://doi.org/10.1007/s00477-014-0966-4, 2015. a
Fukutani, Y., Moriguchi, S., Terada, K., and Otake, Y.: Time-dependent probabilistic tsunami inundation assessment using mode decomposition to assess uncertainty for an earthquake scenario, J. Geophys. Res.-Oceans, 126, e2021JC017250, https://doi.org/10.1029/2021JC017250, 2021. a, b, c
Geist, E. L. and Parsons, T.: Probabilistic analysis of tsunami hazards, Nat. Hazards, 37, 277–314, https://doi.org/10.1007/s11069-005-4646-z, 2006. a
Gomez, C. and Baker, J. W.: An optimization-based decision support framework for coupled pre- and post-earthquake infrastructure risk management, Struct. Saf., 77, 1–9, https://doi.org/10.1016/j.strusafe.2018.10.002, 2019. a
Gopinathan, D., Heidarzadeh, M., and Guillas, S.: Probabilistic quantification of tsunami current hazard using statistical emulation, Proc. R. Soc., 477, 20210180, https://doi.org/10.1098/rspa.2021.0180, 2021. a
Goto, C., Ogawa, Y., Shuto, N., and Imamura, F.: Numerical method of tsunami simulation with the leap-frog scheme, IUGG/IOC TIME Project, IOC Manual and Guides, 35, 1–126, 1997. a
Grezio, A., Babeyko, A., Baptista, M. A., Behrens, J., Costa, A., Davies, G., Geist, E. L., Glimsdal, S., González, F. I., Griffin, J., Harbitz, C. B., LeVeque, R. J., Lorito, S., Løvholt, F., Omira, R., Mueller, C., Paris, R., Parsons, T., Polet, J., Power, W., Selva, J., Sørensen, M. B., and Thio, H. K.: Probabilistic Tsunami Hazard Analysis: Multiple sources and global applications, Rev. Geophys., 55, 1158–1198, https://doi.org/10.1002/2017RG000579, 2017. a
Ha, D. M., Tkalich, P., and Chan, E. S.: Tsunami forecasting using proper orthogonal decomposition method, J. Geophys. Res.-Oceans, 113, C06019, https://doi.org/10.1029/2007JC004583, 2008. a
Heidarzadeh, M. and Kijko, A.: A probabilistic tsunami hazard assessment for the Makran subduction zone at the northwestern Indian Ocean, Nat. Hazards, 56, 577–593, https://doi.org/10.1007/s11069-010-9574-x, 2011. a
Hoerl, A. E. and Kennard, R. W.: Ridge regression: Biased estimation for nonorthogonal problems, Technometrics, 12, 55–67, https://doi.org/10.1080/00401706.1970.10488634, 1970. a
Holland, J. H.: Adaptation in Natural and Artificial Systems, second edition, University of Michigan Press, Ann Arbor, MI, ISBN 9780262581110, 1992. a
Hotelling, H.: Analysis of a complex of statistical variables into principal components, J. Educ. Psychol., 25, 417–441, 1933. a
Imamura, F.: Review of tsunami simulation with a finite difference method, in Long-Wave Runup Models, edited by: Yeh, H., Liu, P., and Synolakis, C., World Scientific Publishing, Hackensack, N. J, 25–42, https://doi.org/10.1142/9789814530330, 1995. a
Ishikawa, Y. and Kameda, H.: Hazard-consistent magnitude and distance for extended seismic risk analysis, Proceedings of the 9th World Conference on Earthquake Engineering, Tokyo-Kyoto, 89–94, 2–9 August 1988. a
Japan Society of Civil Engineering: The method of probabilistic tsunami hazard analysis (in Japanese), https://committees.jsce.or.jp/ceofnp/system/files/PTHA20111209_0.pdf, 2011. a
Jolliffe, I. T. and Cadima, J.: Principal component analysis: a review and recent developments, Philos. T. R. Soc. A, 374, 20150202, https://doi.org/10.1098/rsta.2015.0202, 2016. a
Karhunen, K.: Über lineare Methoden in der Wahrscheinlichkeitsrechnung, Ann. Acad. Sci. Fenn. A1, 37, 3–79, 1947. a
Kerschen, G., Golinval, J. C., Vakakis, A. F., and Bergman, L. A.: The method of proper orthogonal decomposition for dynamical characterization and order reduction of mechanical systems: An overview, Nonlinear Dyn. 41, 147–169, https://doi.org/10.1007/s11071-005-2803-2, 2005. a
Kosambi, D. D.: Statistics in function space, J. Indian Math. Soc., 7, 76–88, 1943. a
Kotani, T., Tozato, K., Takase, S., Moriguchi, S., Terada, K., Fukutani, Y., Otake, Y., Nojima, K., Sakuraba, M., and Choe, Y.: Probabilistic tsunami hazard assessment with simulation-based response surfaces, Coast. Eng., 160, 103719, https://doi.org/10.1016/j.coastaleng.2020.103719, 2020. a, b, c, d
Kubota, T., Saito, T., and Nishida, K.: Global fast-traveling tsunamis driven by atmospheric Lamb waves on the 2022 Tonga eruption, Science, 377, 91–94, https://doi.org/10.1126/science.abo4364, 2022. a
LeVeque, R. J., Waagan, K., Gonźalez, F. I., Rim, D., and Lin, G.: Generating random earthquake events for probabilistic tsunami hazard assessment, Pure Appl. Geophys., 173, 3671–3692, https://doi.org/10.1007/s00024-016-1357-1, 2016. a, b, c
Maharjan, R. and Hanaoka, S.: A credibility-based multi-objective temporary logistics hub location- allocation model for relief supply and distribution under uncertainty, Socio-Econ. Plan. Sci., 70, 100727, https://doi.org/10.1016/j.seps.2019.07.003, 2020. a
McGuire, R. K.: Seismic design spectra and mapping procedures using hazard analysis based directly on oscillator response, Earthq. Eng. Struct. Dyn., 5, 211–234, https://doi.org/10.1002/eqe.4290050302, 1977. a
Melgar, D., LeVeque, R. J., Dreger, D. S., and Allen, R. M.: Kinematic rupture scenarios and synthetic displacement data: An example application to the Cascadia Subduction Zone, J. Geophys. Res.-Sol. Ea., 121, 6658–6674, https://doi.org/10.1002/2016JB013314, 2016. a
Miller, M. and Baker, J.: Ground-motion intensity and damage map selection for probabilistic infrastructure network risk assessment using optimization, Earthq. Eng. Struct. Dyn., 44, 1139–1156, https://doi.org/10.1002/eqe.2506, 2015. a
American Society of Civil Engineers: Minimum Design Loads and Associated Criteria for Buildings and Other Structures, American Society of Civil Engineers, ASCE/sei 7-16 edition, 2017. a
Mitsoudis, D. A., Flouri, E. T., Chrysoulakis, N., Kamarianakis, Y., Okal, E. A., and Synolakis, C. E.: Tsunami hazard in the Southeast Aegean Sea, Coast. Eng., 60, 136–148, https://doi.org/10.1016/j.coastaleng.2011.09.004, 2012. a
Močkus, J.: On bayesian methods for seeking the extremum, Springer, Berlin, Heidelberg, https://doi.org/10.1007/3-540-07165-2_55, 1975. a
Mohamadi, A. and Yaghoubi, S.: A bi-objective stochastic model for emergency medical services network design with backup services for disasters under disruptions: An earthquake case study, Int. J. Disast. Risk Re., 23, 204–217, https://doi.org/10.1016/j.ijdrr.2017.05.003, 2017. a
Mori, N. and Takahashi, T.: The 2011 Tohoku Earthquake Tsunami joint survey group: Nationwide post event survey and analysis of the 2011 Tohoku earthquake tsunami, Coast. Eng. J., 54, 1250001-1–1250001-27, https://doi.org/10.1142/S0578563412500015, 2012. a
Mori, N., Goda, K., and Cox, D.: Recent process in probabilistic tsunami hazard analysis (PTHA) for mega thrust subduction earthquakes, 2011 Jap. Earthq. Tsunami Reconstr. Restor., 47, 469–485, https://doi.org/10.1007/978-3-319-58691-5_27, 2017. a
Nakano, Y.: Structural design requirements for tsunami evacuation buildings in Japan, ACI Symp. Publ., 1–12, 313, 2017. a
Nakano, M., Murphy, S., Agata, R., Igarashi, Y., Okada, M., and Hori, T.: Self-similar stochastic slip distributions on a non-planar fault for tsunami scenarios for megathrust earthquakes, Prog. Earth Planet Sci., 7, 45, https://doi.org/10.1186/s40645-020-00360-0, 2020. a, b
Nojima, N., Kuse, M., and Duc, L. Q.: Mode decomposition and simulation of strong ground motion distribution using singular value decomposition, J. Jap. Assoc. Earthq. Eng., 18, 95–114, https://doi.org/10.5610/jaee.18.2_95, 2018. a
Omira, R., Baptista, M. A., and Matias, L.: Probabilistic tsunami hazard in the Northeast Atlantic from near- and far-field tectonic sources, Pure Appl. Geophys., 172, 901–920, https://doi.org/10.1007/s00024-014-0949-x, 2015. a
Omira, R., Matias, L., and Baptista, M. A.: Developing an event-tree probabilistic tsunami inundation model for NE Atlantic coasts: Application to a case study, Pure Appl. Geophys., 173, 3775–3794, https://doi.org/10.1007/s00024-016-1367-z, 2016. a
Omira, R., Ramalho, R. S., Kim, J., González, P. J., Kadri, U., Miranda, J. M., Carrilho, F., and Baptista, M. A: Global Tonga tsunami explained by a fast-moving atmospheric source, Nature, 609, 734–740, https://doi.org/10.1038/s41586-022-04926-4, 2022. a
Park, H. and Cox, D. T.: Probabilistic assessment of near-field tsunami hazards: Inundation depth, velocity, momentum flux, arrival time, and duration applied to seaside, Oregon. Coast. Eng., 117, 79–96, https://doi.org/10.1016/j.coastaleng.2016.07.011, 2016. a
Park, S., van de Lindt, J. W., Gupta, R., and Cox, D.: Method to determine the locations of tsunami vertical evacuation shelters, Nat. Hazards, 63, 891–908, https://doi.org/10.1007/s11069-012-0196-3, 2012. a
Qin, X., Motley, M. R., and Marafi, N. A.: Three-dimensional modeling of tsunami forces on coastal communities, Coast. Eng., 140, 43–59, https://doi.org/10.1016/j.coastaleng.2018.06.008, 2018. a
Rawls, C. G. and Turnquist, M. A.: Pre-positioning of emergency supplies for disaster response, Transp. Res. B Methodol., 44, 521–534, https://doi.org/10.1016/j.trb.2009.08.003, 2010. a
Salmanidou, D. M., Beck, J., Pazak, P., and Guillas, S.: Probabilistic, high-resolution tsunami predictions in northern Cascadia by exploiting sequential design for efficient emulation, Nat. Hazards Earth Syst. Sci., 21, 3789–3807, https://doi.org/10.5194/nhess-21-3789-2021, 2021. a, b
Scala, A., Lorito, S., Romano, F., Murphy, S., Selva, J., Basili, R., Babeyko, A., Herrero, A., Hoechner, A., Løvholt, F., Maesano, F. E., Perfetti, P., Tiberti, M. M., Tonini, R., Volpe, M., Davies, G., Festa, G., Power, W., Piatanesi, A., and Cirella, A.: Effect of shallow slip amplification uncertainty on probabilistic tsunami hazard analysis in subduction zones: Use of long-term balanced stochastic slip models, Pure Appl. Geophys., 177, 1497–1520, https://doi.org/10.1007/s00024-019-02260-x, 2020. a
Sørensen, M. B., Spada, M., Babeyko, A., Wiemer, S., and Grünthal, G.: Probabilistic tsunami hazard in the Mediterranean Sea, J. Geophys. Res., 117, B01305, https://doi.org/10.1029/2010JB008169, 2012. a
Stone, M.: Cross-validatory choice and assessment of statistical predictions, J. Roy. Stat. Soc. Ser. B, 36, 111–147, https://doi.org/10.1111/j.2517-6161.1974.tb00994.x, 1947. a
Suppasri, A., Mas, E., Charvet, I., Gunasekera, R., Imai, K, Fukutani, Y., Abe, Y., and Imamura, F.: Building damage characteristics based on surveyed data and fragility curves of the 2011 great east Japan tsunami, Nat. Hazards, 66, 319–341, https://doi.org/10.1007/s11069-012-0487-8, 2013. a
Suppasri, A., Pakoksung, K., Charvet, I., Chua, C. T., Takahashi, N., Ornthammarath, T., Latcharote, P., Leelawat, N., and Imamura, F.: Load-resistance analysis: an alternative approach to tsunami damage assessment applied to the 2011 Great East Japan tsunami, Nat. Hazards Earth Syst. Sci., 19, 1807–1822, https://doi.org/10.5194/nhess-19-1807-2019, 2019. a
Takase, S., Moriguchi, S., Terada, K., Kato, J., Kyoya, T., Kashiyama, K., and Kotani, T.: 2D-3D hybrid stabilized finite element method for tsunami runup simulations, Comput. Mech., 58, 411–422, https://doi.org/10.1007/s00466-016-1300-4, 2016. a
The 2011 Tohoku Earthquake Tsunami Joint Survey Group: Field survey results, official survey data, http://www.coastal.jp/tsunami2011/index.php?Field survey results (last access: 21 March 2022), 2012. a, b
Tozato, K.: K-Tozato/3D_tsunami_simulation: (Dataset_for_NHESS), Zenodo [data set], https://doi.org/10.5281/zenodo.6394294, 2022. a
Tozato, K., Takase, S., Moriguchi, S., Terada, K., Otake, Y., Fukutani, Y., Nojima, K., Sakuraba, M., and Yokosu, H.: Rapid tsunami force prediction by mode-decomposition-based surrogate modeling, Nat. Hazards Earth Syst. Sci., 22, 1267–1285, https://doi.org/10.5194/nhess-22-1267-2022, 2022. a, b, c, d, e, f, g, h
Tsuji, Y., Satake, K., Ishibe, T., Kusumoto, S., Harada, T., Nishiyama, A., Kim, H. Y., Ueno, T., Murotani, S., Oki, S., Sugimoto, M., Tomari, J., Heidarzadeh, M., Watada, S., Imai, K., Choi, B. H., Yoon, S. B., Bae, J. S., Kim, K. O., and Kim, H. W.: Field surveys of tsunami heights from the 2011 Off the Pacific Coast of Tohoku, Japan, earthquake, Bull. Earthq. Res. Inst. Univ. Tokyo, 86, 29–279, 2011 (in Japanese with English abstract). a
Wang, C., Duan, Q., Gong, W., Ye, A., Di, Z., and Miao, C.: An evaluation of adaptive surrogate modeling based optimization with two benchmark problems, Environ. Model. Soft., 60, 167–179, https://doi.org/10.1016/j.envsoft.2014.05.026, 2014. a
Winter, A. O., Alam, M. S., Asce, S. M., Shekhar, K., Motley, M. R, Asce, M., Eberhard, M. O., Barbosa, A. R., Asce, A. M., Lomonaco, P., Arduino, P., and Cox, D. T.: Tsunami-like wave forces on an elevated coastal structure: Effects of flow shielding and channeling, J. Waterw. Port Coast. Ocean Eng., 146, 04020021, https://doi.org/10.1061/(ASCE)WW.1943-5460.0000581, 2020. a, b, c
Xiong, Y., Liang, Q., Park, H., Cox, D., and Wang, G.: A deterministic approach for assessing tsunami-induced building damage through quantification of hydrodynamic forces, Coast. Eng., 144, 1–14, https://doi.org/10.1016/j.coastaleng.2018.11.002, 2019. a
Zhang, W. and Yun, Y.: Multi-scale accessibility performance of shelters types with diversity layout in coastal port cities: A case study in Nagoya City, Japan, Habitat Int., 83, 55–64, https://doi.org/10.1016/j.habitatint.2018.11.002, 2019. a
- Abstract
- Introduction
- Search method for the probabilistic optimal placement using a surrogate model
- Application to case studies with a recent tsunami
- Conclusions
- Appendix A: Verifying the validity of the numerical analysis method
- Code and data availability
- Author contributions
- Competing interests
- Disclaimer
- Review statement
- References