the Creative Commons Attribution 4.0 License.
the Creative Commons Attribution 4.0 License.
 | 03 May 2023
Evaluation of liquefaction triggering potential in Italy: a seismic-hazard-based approach
Gabriele Ferretti
Davide Scafidi
In the present study, we analyze ground-motion hazard maps and hazard disaggregation in order to define areas in Italy where liquefaction triggering due to seismic activity can not be excluded. To this end, we refer to the triggering criteria (not to be confused with liquefaction susceptibility criteria, which essentially take into account soil type and depth to groundwater) proposed by the Italian Guidelines for Seismic Microzonation, which are described in the main body of the paper. However, the study can be replicated in other countries that adopt different criteria. The final goal is the definition of a screening map for all of Italy that classifies sites in terms of liquefaction triggering potential according to their seismic hazard level. The map, which is referred to with the Italian acronym MILQ – Mappa del potenziale d'Innesco della LiQuefazione (i.e., map of liquefaction triggering potential), and the associated data are freely accessible at the following web address: https://distav.unige.it/rsni/milq.php (last access: 28 April 2023). Our results can be useful to guide land-use planners in deciding whether liquefaction is a hazard that needs to be considered within the planning processes or not. Furthermore, they can serve as a guide for recommending geological and geotechnical investigations aimed at the evaluation of liquefaction hazards or, conversely, rule out further studies with consequent savings in efforts and money.
- Article
(12159 KB) - Full-text XML
- BibTeX
- EndNote


Liquefaction is one of the most complex earthquake-induced phenomena in geotechnical earthquake engineering. Commonly the term liquefaction, though used to indicate a variety of different but related phenomena (e.g., flow slide failures, lateral spreading, sand boils), is associated with soil permanent deformations produced by a rapid excess pore pressure increase (and a concurrent reduction in effective stresses) in saturated cohesionless soils subjected to earthquake loading (e.g., Kramer, 1996). Under these conditions, the pore water pressure in the soil mass increases in response to the seismic shaking, and the soil loses its shear strength and behaves temporarily as a viscous liquid.
The assessment of liquefaction hazards at a site always involves two questions: (1) are the geological conditions prone to liquefaction and (2) will liquefaction be triggered by future earthquakes? The latter is usually asked in case of a positive answer to the first question, namely the following: if the site is susceptible to soil liquefaction, will liquefaction be triggered by future seismicity? While answering the first question may involve costly in situ investigations mainly aimed at defining the depth of the water table and soil granulometry, the answer to the second question can be simply obtained by querying national hazard maps via online web services, at least at the screening level. The scope is to get the value of the two ground-motion parameters commonly used in liquefaction hazard assessments: peak horizontal acceleration (in the present work, the terms “peak horizontal acceleration” and “peak ground acceleration”, as well as the respective acronyms PHA and PGA, are used interchangeably) at the ground surface for the return period of interest and earthquake magnitude (e.g., maximum magnitude, mean, or modal magnitude from hazard disaggregation). These parameters are related to the duration and intensity of ground shaking and are key factors of the well-known simplified approach of Seed and Idriss (1971) for evaluating the liquefaction resistance of soils (see also Youd et al., 2001). Thus, it may be convenient to reverse the question above: if liquefaction can be triggered by seismic activity at the site of interest, is the site susceptible to soil liquefaction? Indeed, if the seismic hazard is deemed too low to trigger liquefaction (i.e., if the values of the surface PGA and earthquake magnitude for that site are below some threshold values), then one can avoid recommending specific investigations aimed at the geological and geotechnical characterization of the subsoil. This reversed decision scheme can be useful to guide land-use planners in deciding whether liquefaction is a hazard that needs to be considered within the planning processes or not.
With the increased availability of data in recent years, substantial research has been carried out to establish thresholds of magnitude and PGA at the ground surface below which the possibility of triggering liquefaction can be discounted. Although the use of a minimum threshold magnitude is controversial (Musson, 2020; Green and Bommer, 2019), available studies converge to a value of 5.0 (e.g., Atkinson et al., 1984; Green and Bommer, 2019), while a threshold of about 0.1 g has been suggested for the PGA at the ground surface (e.g., Santucci de Magistris et al., 2013; Santucci de Magistris, 2015). However, exceptional liquefaction phenomena induced by minor events (i.e., with magnitude less than 5.0) have been observed in extremely susceptible soils (e.g., Martino et al., 2014; Santucci de Magistris, 2015, and references therein; Zimmaro et al., 2019; Brandenberg et al., 2020; Bozzoni et al., 2021). Such values are adopted by the Italian building code (Ministero delle Infrastrutture e dei Trasporti, 20181), as well as by the Italian Guidelines for Seismic Microzonation released by the SM Working Group (2008 and 20152) (hereinafter, we will use the ICMS acronym, commonly used in Italy).
The scope of the present work is to define a liquefaction triggering map of Italy that can be used for seismic microzonation purposes and, therefore, can guide land-use planning within the framework of risk mitigation programs. According to the Italian Catalogue of Earthquake-Induced Ground Failures – CEDIT (Martino et al., 2014; Caprari et al., 2018), more than 300 liquefaction events have occurred in Italy since 1000 CE, the last of which are associated with the 2012 Emilia seismic sequence (e.g., Scognamiglio et al., 2012; Minarelli et al., 2022). Therefore, it is of paramount importance to define a map that classifies sites as a function of their liquefaction triggering potential. To this end, we combine data from the reference Italian seismic hazard maps (MPS Working Group, 2004; Stucchi et al., 2011) and hazard disaggregation (Barani et al., 2009), which is here expressed in terms of magnitude contributions to the hazard. Note that the results presented in this work do not address the issue of liquefaction assessments for structural design, for which the hazard corresponding to multiple return periods should be taken into account. In this work, we focus on the 475-year return period according to the ICMS. The reliability of the results is checked by comparing them with observations of past liquefaction events in Italy (Martino et al., 2014; Caprari et al., 2018), as well as in light of recent case studies associated with the 2012 Emilia seismic sequence.
Although we are aware that liquefaction hazard requires site-specific geological and geotechnical investigations (liquefaction is indeed a highly localized phenomenon), our study may serve as a reference guide for identifying sites where the possibility of triggering liquefaction can be discounted. Moreover, it provides basic ground-motion data for evaluating liquefaction resistance of soils at specific sites and for defining liquefaction susceptibility maps (e.g., Zumpano et al., 2022). Such data are freely available through the web service at https://distav.unige.it/rsni/milq.php (last access: 28 April 2023).
According to the ICMS, liquefaction is expected to occur if the following conditions are met (SM Working Group, 2008, 2015).
-
The lithological sequence presents layers of non-cohesive, saturated soil (sandy silts, sands, silty sands, gravely sands, clayey sands, and sandy gravels) down to 20 m depth.
-
The average depth of the water table is within 15 m of the ground surface.
-
Expected seismic events must be characterized by moment magnitude values. Mw≥5 and must produce a surface peak ground acceleration amax≥0.1 g.
If even one of the conditions above is not verified, we can assume that the area under study is not susceptible to liquefaction.
In this study, our focus is on the third condition. Contrary to the first two ones, it does not require local data, at least at a screening level (corresponding to the so-called level 1 microzonation in the ICMS). We use national hazard maps along with the corresponding hazard disaggregation results to define those sites in Italy where this condition is not met – that is, where the triggering of liquefaction phenomena is unlikely and can be excluded. If the condition is not met, then we can avoid recommending specific geotechnical investigations aimed at verifying the first two criteria, with consequent savings in efforts and money.
In order to define those areas in Italy where seismic activity could trigger liquefaction (according to the third condition listed in the previous section), we analyze the reference seismic hazard data for the national territory. First, the PGA hazard for rock conditions and flat topography associated with a return period of 475 years (MPS Working Group, 2004; Stucchi et al., 2011) is modified to incorporate site amplification due to local geology and irregular topography (recall that the 475-year return period is assumed as the single, reference return period by the ICMS). Essentially, the resulting amax map allows us to define areas with high (i.e., amax≥0.1 g) and low (i.e., amax<0.1 g) local seismic hazard. Then, 1D disaggregation results (i.e., magnitude disaggregation) are produced based on the reference work of Barani et al. (2009) and analyzed to define those sites where the hazard is controlled by scenarios with magnitude Mw≥5. As sites respond at specific characteristic frequencies (depending on local geological characteristics) and disaggregation results may vary significantly with response period (T), disaggregation analysis is carried out for different values of T. Particular attention is paid to the choice of mean or modal magnitude values as reference scenarios in order to avoid both non-conservative and over-conservative scenarios. A cross analysis of hazard and disaggregation data is finally performed via the QGIS software (https://www.qgis.org/en/site/, last access: 28 April 2023; QGIS.org, 2021) to define the sites where liquefaction triggering is expected to occur.
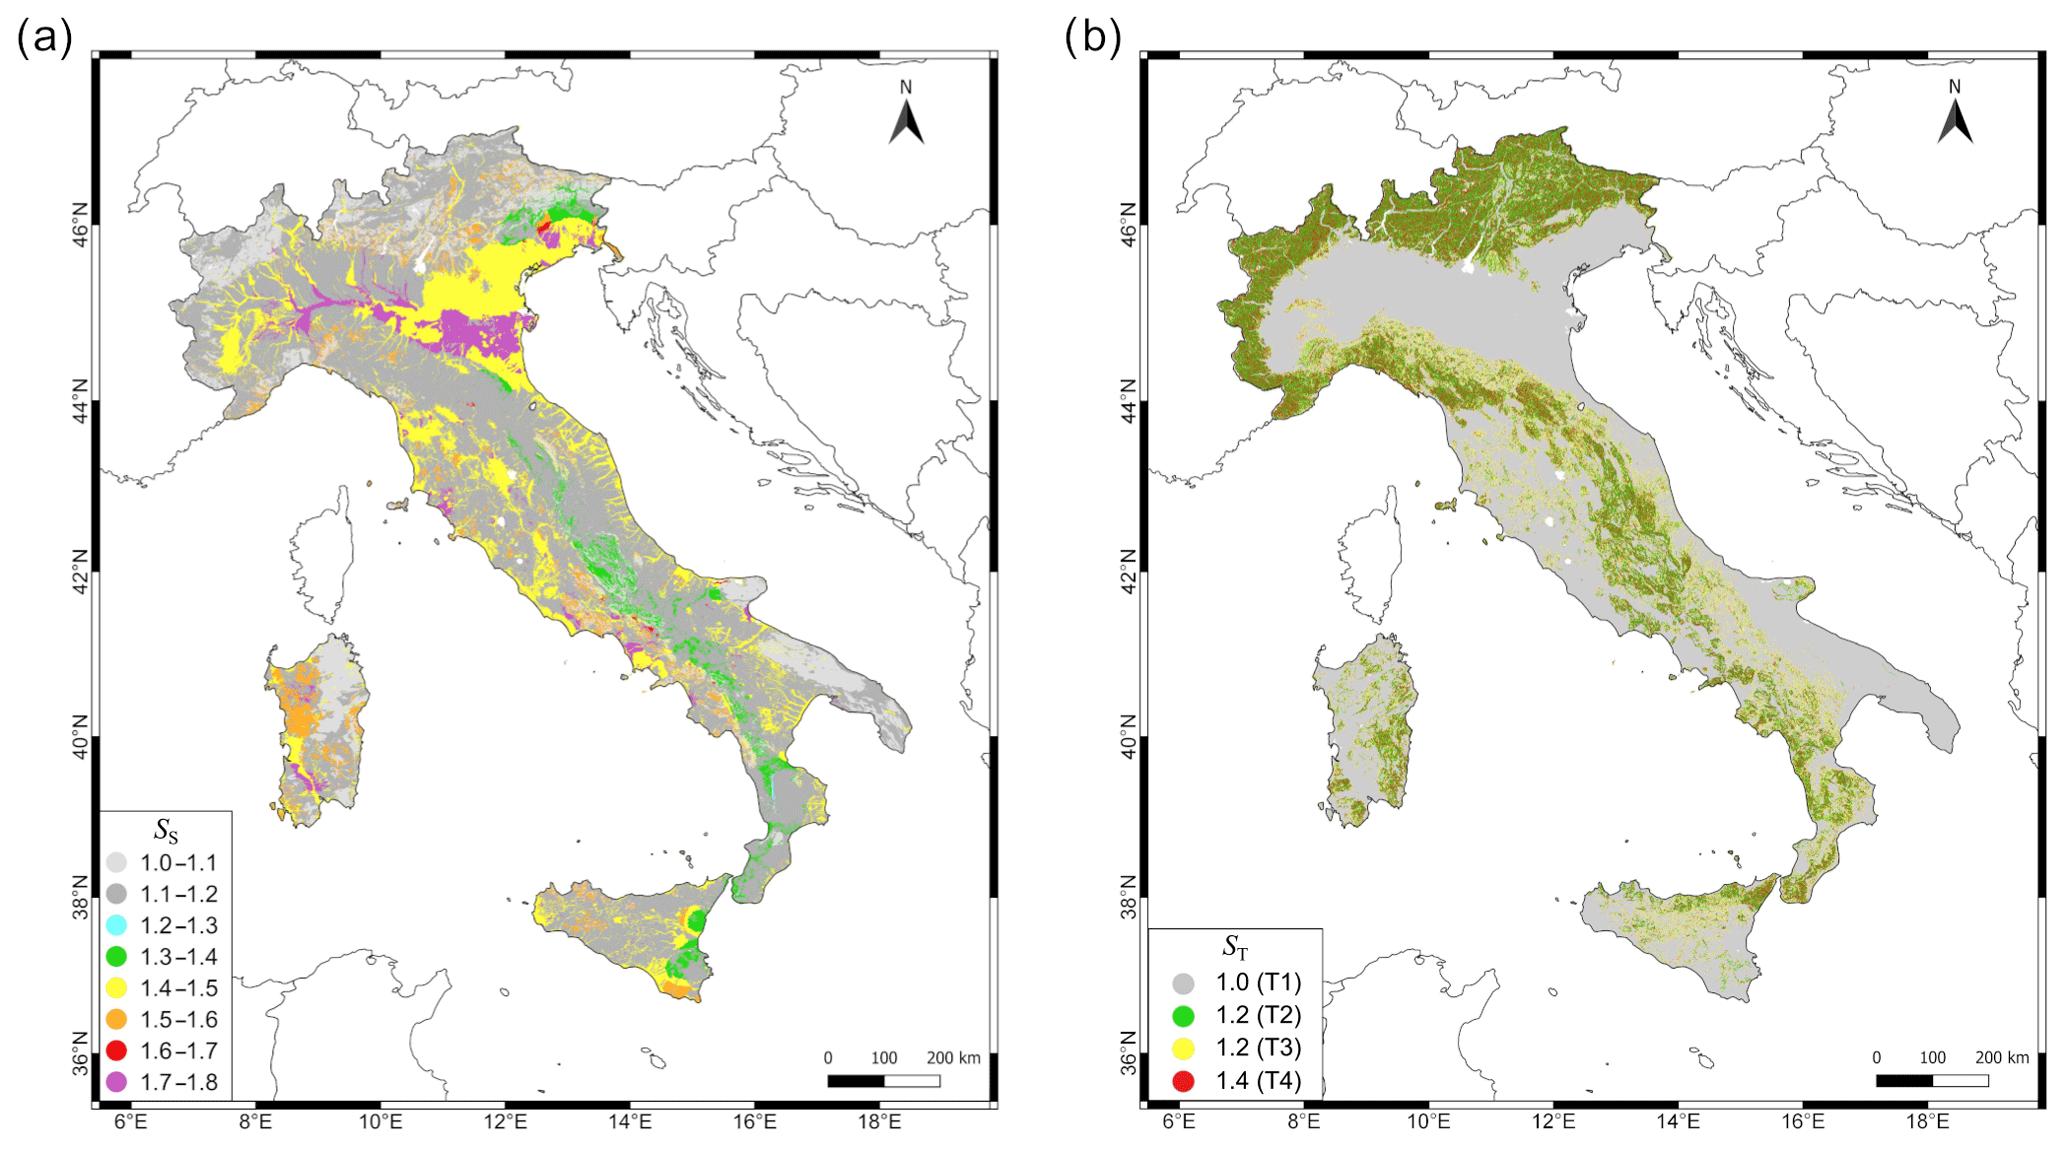
Figure 1(a) Soil amplification factor (SS) map; (b) topographic amplification factor (ST) map (topographic classes, T1–T4, are indicated in the legend).
3.1 Seismic hazard map
In order to define those sites with surface peak horizontal acceleration amax≥0.1 g for a return period of 475 years, we refer to the Italian seismic hazard map adopted by the national building code to define the design seismic action (MPS Working Group, 2004; Stucchi et al., 2011). We recall here that this map was developed assuming flat topography and rock conditions. Hence, following the definition of surface peak horizontal acceleration, where the word “surface” is used to indicate that amax refers to site-specific conditions, we first need to amend the reference hazard in order to incorporate possible ground-motion amplification effects related to sub-surface lithological conditions and topographic irregularities. According to the updated Italian building code (Ministero delle Infrastrutture e dei Trasporti, 2018), the rock seismic action at a given site is corrected by a site term (S) that accounts for both soil and topographic conditions (i.e., where SS and ST are the stratigraphic and topographic amplification factors, respectively). For that site, the values of SS and ST can be defined according to simple site classification criteria, which are not reported here for the sake of brevity. While the soil classification is mainly based on the values of the VS,eq parameter3 (i.e., time-averaged shear-wave velocity above the seismic bedrock, the latter being defined as the rock formation or rigid soil with VS≥800 m s−1), the topographic classification is based on site acclivity. Recently, Forte et al. (2019) developed a soil classification map for all of Italy in compliance with the ground types (also referred to as “soil types” or “subsoil classes”) defined by the updated Italian building code4. Mascandola et al. (2021a) did the same for topography, providing a topographic classification map of Italy. We refer to these works to amend the reference PGA hazard map for rock conditions and flat topography associated with a return period of 475 years (i.e., ag hazard map). In compliance with the Italian building code, . The maps in Fig. 1 show the geographic distributions of SS and ST using the same grid of Forte et al. (2019), which is adopted as reference to produce the final results. It is worth noting that the highest values of SS are concentrated in the Po Plain sedimentary basin where, as mentioned previously, several liquefaction phenomena were triggered during the 2012 Emilia seismic sequence (we refer the reader to the Discussion section for details on this area). The comparison between the original ag hazard map for a return period of 475 years and the corresponding amax map is presented in Fig. 2. As expected, incorporating the site term into the hazard increases the number of sites where liquefaction is likely to occur. The number of sites with amax≥0.1 g grows from 753 820 to 883 363.
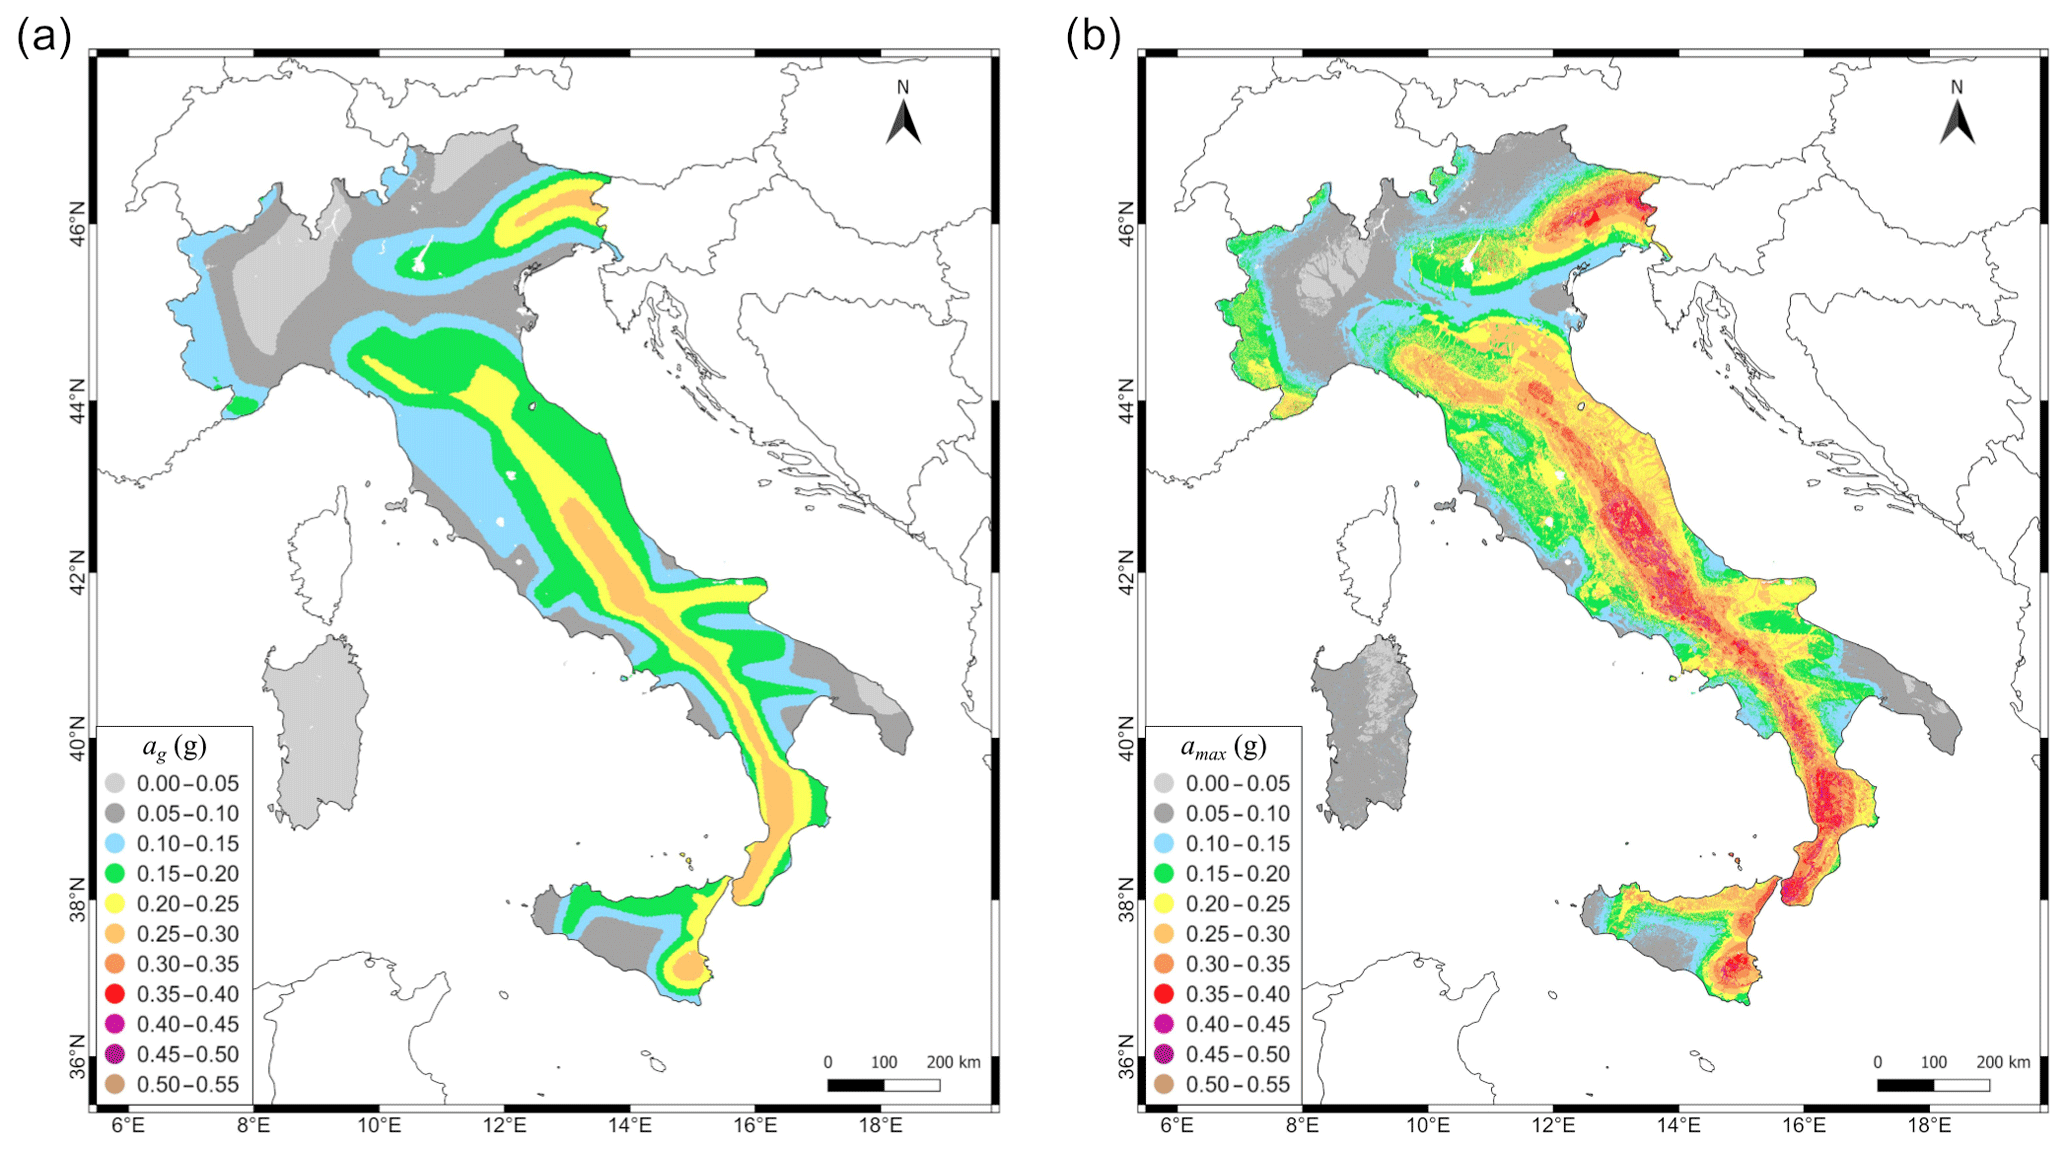
Figure 2(a) Peak horizontal acceleration hazard map for rock conditions and flat topography corresponding to a return period of 475 years (ag hazard map); (b) peak horizontal acceleration hazard map at the ground surface for a return period of 475 years (amax hazard map).
3.2 Hazard disaggregation
In order to define the sites where the seismic hazard is controlled by Mw≥5 scenarios, we have disaggregated the hazard corresponding to a return period of 475 years for all computation nodes considered in the hazard assessment of Italy (MPS Working Group, 2004; Stucchi et al., 2011). Specifically, the contributions from different magnitude scenarios are determined (by summation) from the joint M–R–ε distributions originally computed by Barani et al. (2009), where R is the source-to-site distance and ε indicates the ground-motion error term. That work still represents the reference disaggregation study for Italy and, as such, is taken as reference by the ICMS. Accordingly, we consider bins of 0.5 magnitude units. Note that, according to Iervolino (2016), there is no need to consider the site correction term S in the disaggregation process. In our application, indeed, disaggregation results are invariant with soil category.
As the ICMS does not specify how to handle response periods in the disaggregation process (i.e., it is not specified if the controlling magnitude should result from the disaggregation of the hazard for a specific value of T), we have disaggregated the spectral acceleration hazard associated with periods of 0.01 (i.e., PGA), 0.2, and 1 s. While PGA hazard disaggregation may be appropriate for rock sites (which are known to resonate at high frequencies and where one can exclude the possibility of liquefaction), it can provide non-conservative results for most soil sites, which generally have resonance periods in the 0.1–1 s range (this range may extend up to longer periods in the case of deep alluvial valleys). It is known, indeed, that the contribution from larger magnitudes increases as T increases. Therefore, disaggregating the hazard for different spectral periods allows us to define the controlling magnitude in relation to geological conditions (through site classification). We expect that with decreasing VS,eq and/or increasing soil thickness the site resonance period increases (e.g., Kramer, 1996). Therefore, for those sites characterized by lower values of VS,eq and/or thicker soils (i.e., sites classified as ground type C, D, or E in the Italian building code), it seems reasonable to define the controlling earthquake based on the disaggregation of the hazard at longer periods.
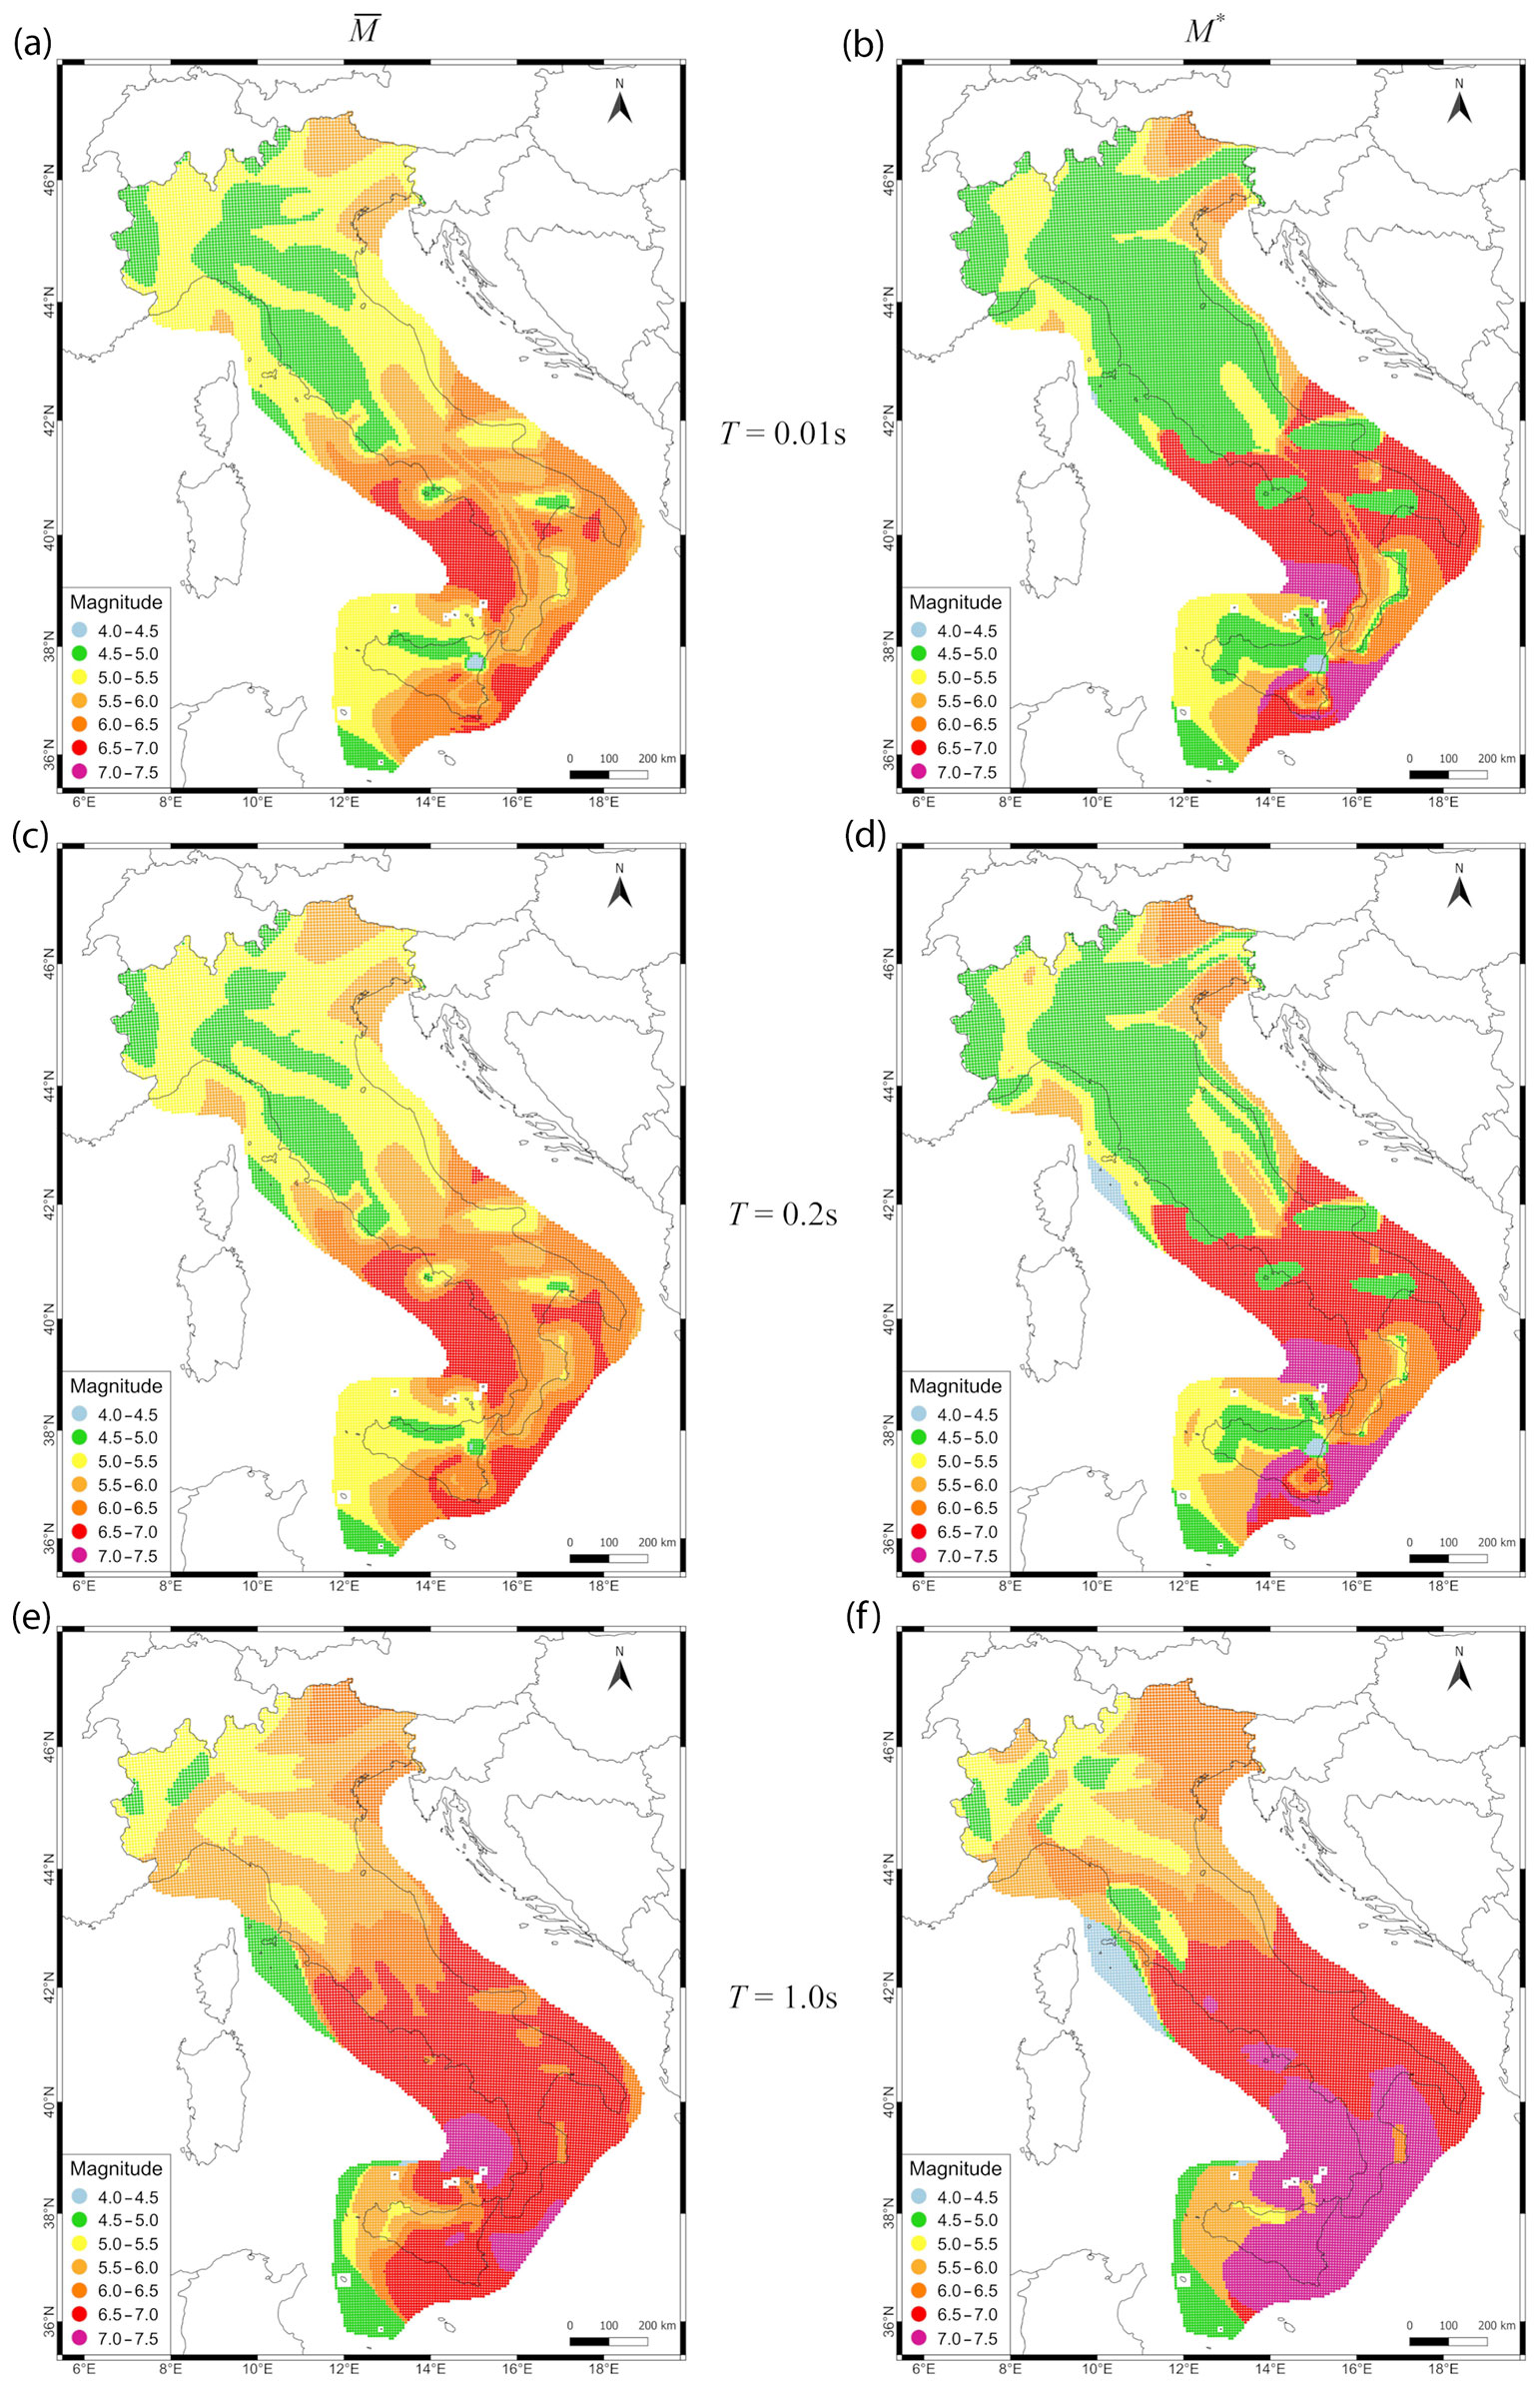
Figure 3Maps of mean (a, c, e) and modal (b, d, f) magnitude values obtained from the 1D disaggregation of the 475-year spectral acceleration hazard corresponding to a response period (T) of 0.01, 0.2, and 1 s.
The maps in Fig. 3 show the geographic distribution of mean and modal magnitudes ( and M∗, respectively) for the three periods considered. Comparing the maps for the same period immediately reveals significant differences between mean and modal scenarios. On average, larger magnitudes control the hazard in areas characterized by either a higher seismic activity (e.g., Central and Southern Apennines) or very low seismicity (e.g., southeastern edge of the Italian peninsula where the hazard is controlled by large-magnitude, distant events), while lower magnitudes dominate in areas of mild-to-moderate but relatively frequent seismic activity (e.g., some areas in the Po Plain and western Alps). However, with the same area, the values of and M∗ may vary substantially. We observe that the maps of are generally more conservative than those of M∗, especially in areas where the hazard is lower (e.g., northern Italy). Which earthquake scenario should be considered as representative of the site hazard? Should the mean or the mode be considered? Moreover, which mode should be considered in the case of bimodal distributions? These questions are still open in the scientific community, in the sense that there is no common opinion about the choice of the mean or the mode. It is well known that the mode has the clear advantage of representing the most likely scenario but is sensitive to the binning scheme adopted. On the other hand, the mean is not sensitive to the bin size, but it might not represent the most likely scenario or, in some cases (not so infrequent, particularly in the case of bimodal distributions), it could represent an unlikely one. In this work, we solve the crucial issue of the controlling earthquake by adopting the conservative view that stronger is safer. Specifically, for each period considered, we assume the following.
-
In the case of unimodal distributions with no skew (i.e., symmetric or nearly symmetric about the mean) (Fig. 4a), either the mean or modal magnitude can be indiscriminately taken as the preferred magnitude (.
-
In the case of unimodal, negatively skewed distributions (Fig. 4b), the modal magnitude is assumed as the preferred magnitude (.
-
In the case of unimodal, positively skewed distributions (Fig. 4c), the mean magnitude is assumed as the preferred magnitude (.
-
In the case of bimodal distributions, the second mode ( is taken as the preferred magnitude ( if its contribution to the hazard is greater than the contribution associated with the mean magnitude (Fig. 4d). Conversely, we assume that its contribution to the hazard is negligible, and the mean, which reflects that contribution to some extent, is assumed as the preferred magnitude ( (Fig. 4e). Thus, this latter case resembles the case of a unimodal, positively skewed distribution (see the previous bullet point) and avoids selecting over-conservative scenarios with very small contributions (i.e., unlikely scenarios).
The maps resulting from the application of the criteria above are shown in the left column of Fig. 5 for the three spectral periods considered. For each of them, the maps in the right column show the geographic distribution of the contributions associated with . It can be observed that such contributions are generally larger than 10 %. As expected, the maps in the left column show that the values of increase with increasing spectral period, reaching the largest values in Southern Italy for T=1.0 s, where is between 7.0 and 7.5. Note the similarity of the maps corresponding to T=0.01 s (i.e., PGA) and T=0.2 s, with the latter being slightly more conservative. Despite this similarity, we prefer to consider both these maps in order to distinguish between rock sites, for which PGA hazard disaggregation is geologically consistent, and sites characterized by deposits of dense soil, which are expected to resonate at longer periods.
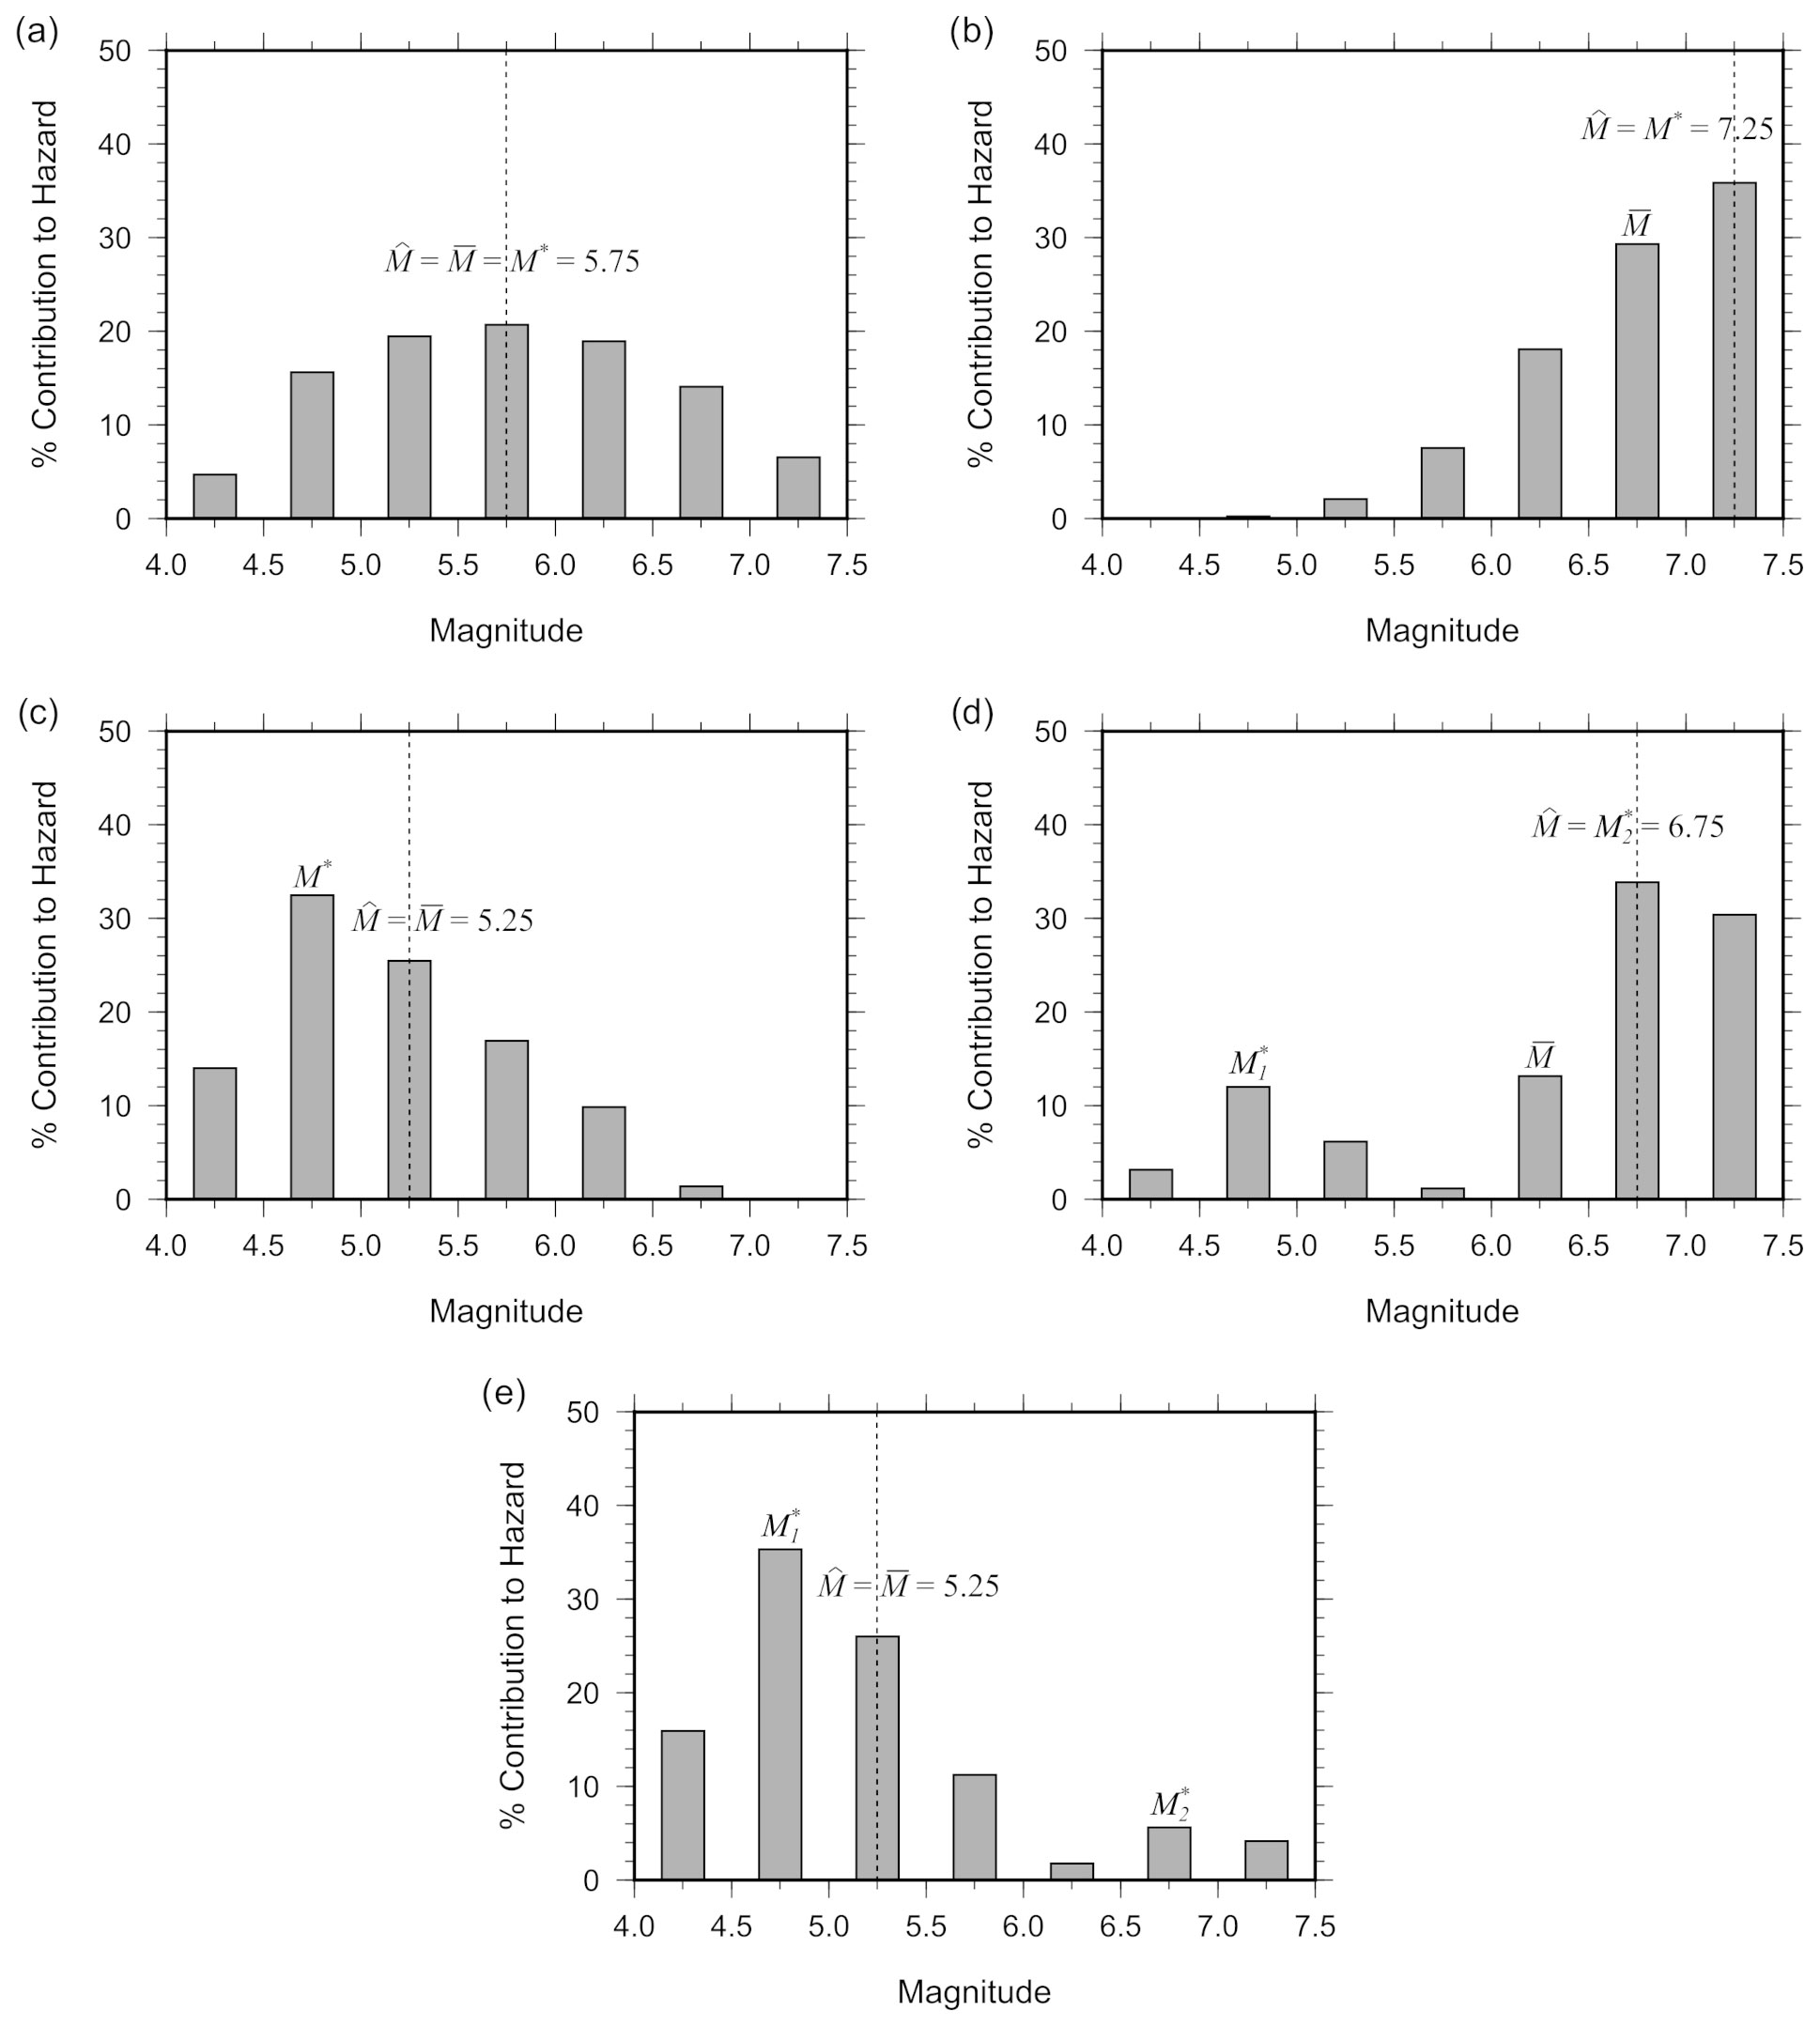
Figure 4Example probability mass functions (PMFs) of magnitude: (a) unimodal PMF with no skew; (b) negatively skewed PMF; (c) positively skewed PMF; (d) bimodal PMF with the second mode contributing to the hazard more than the mean scenario; and (e) bimodal PMF with the second mode contributing to the hazard less than the mean magnitude. Mean (, modal (M∗), and preferred magnitude ( are displayed in each panel. In the case of bimodal distributions (panels d and e), the first and second mode are indicated as and , respectively.
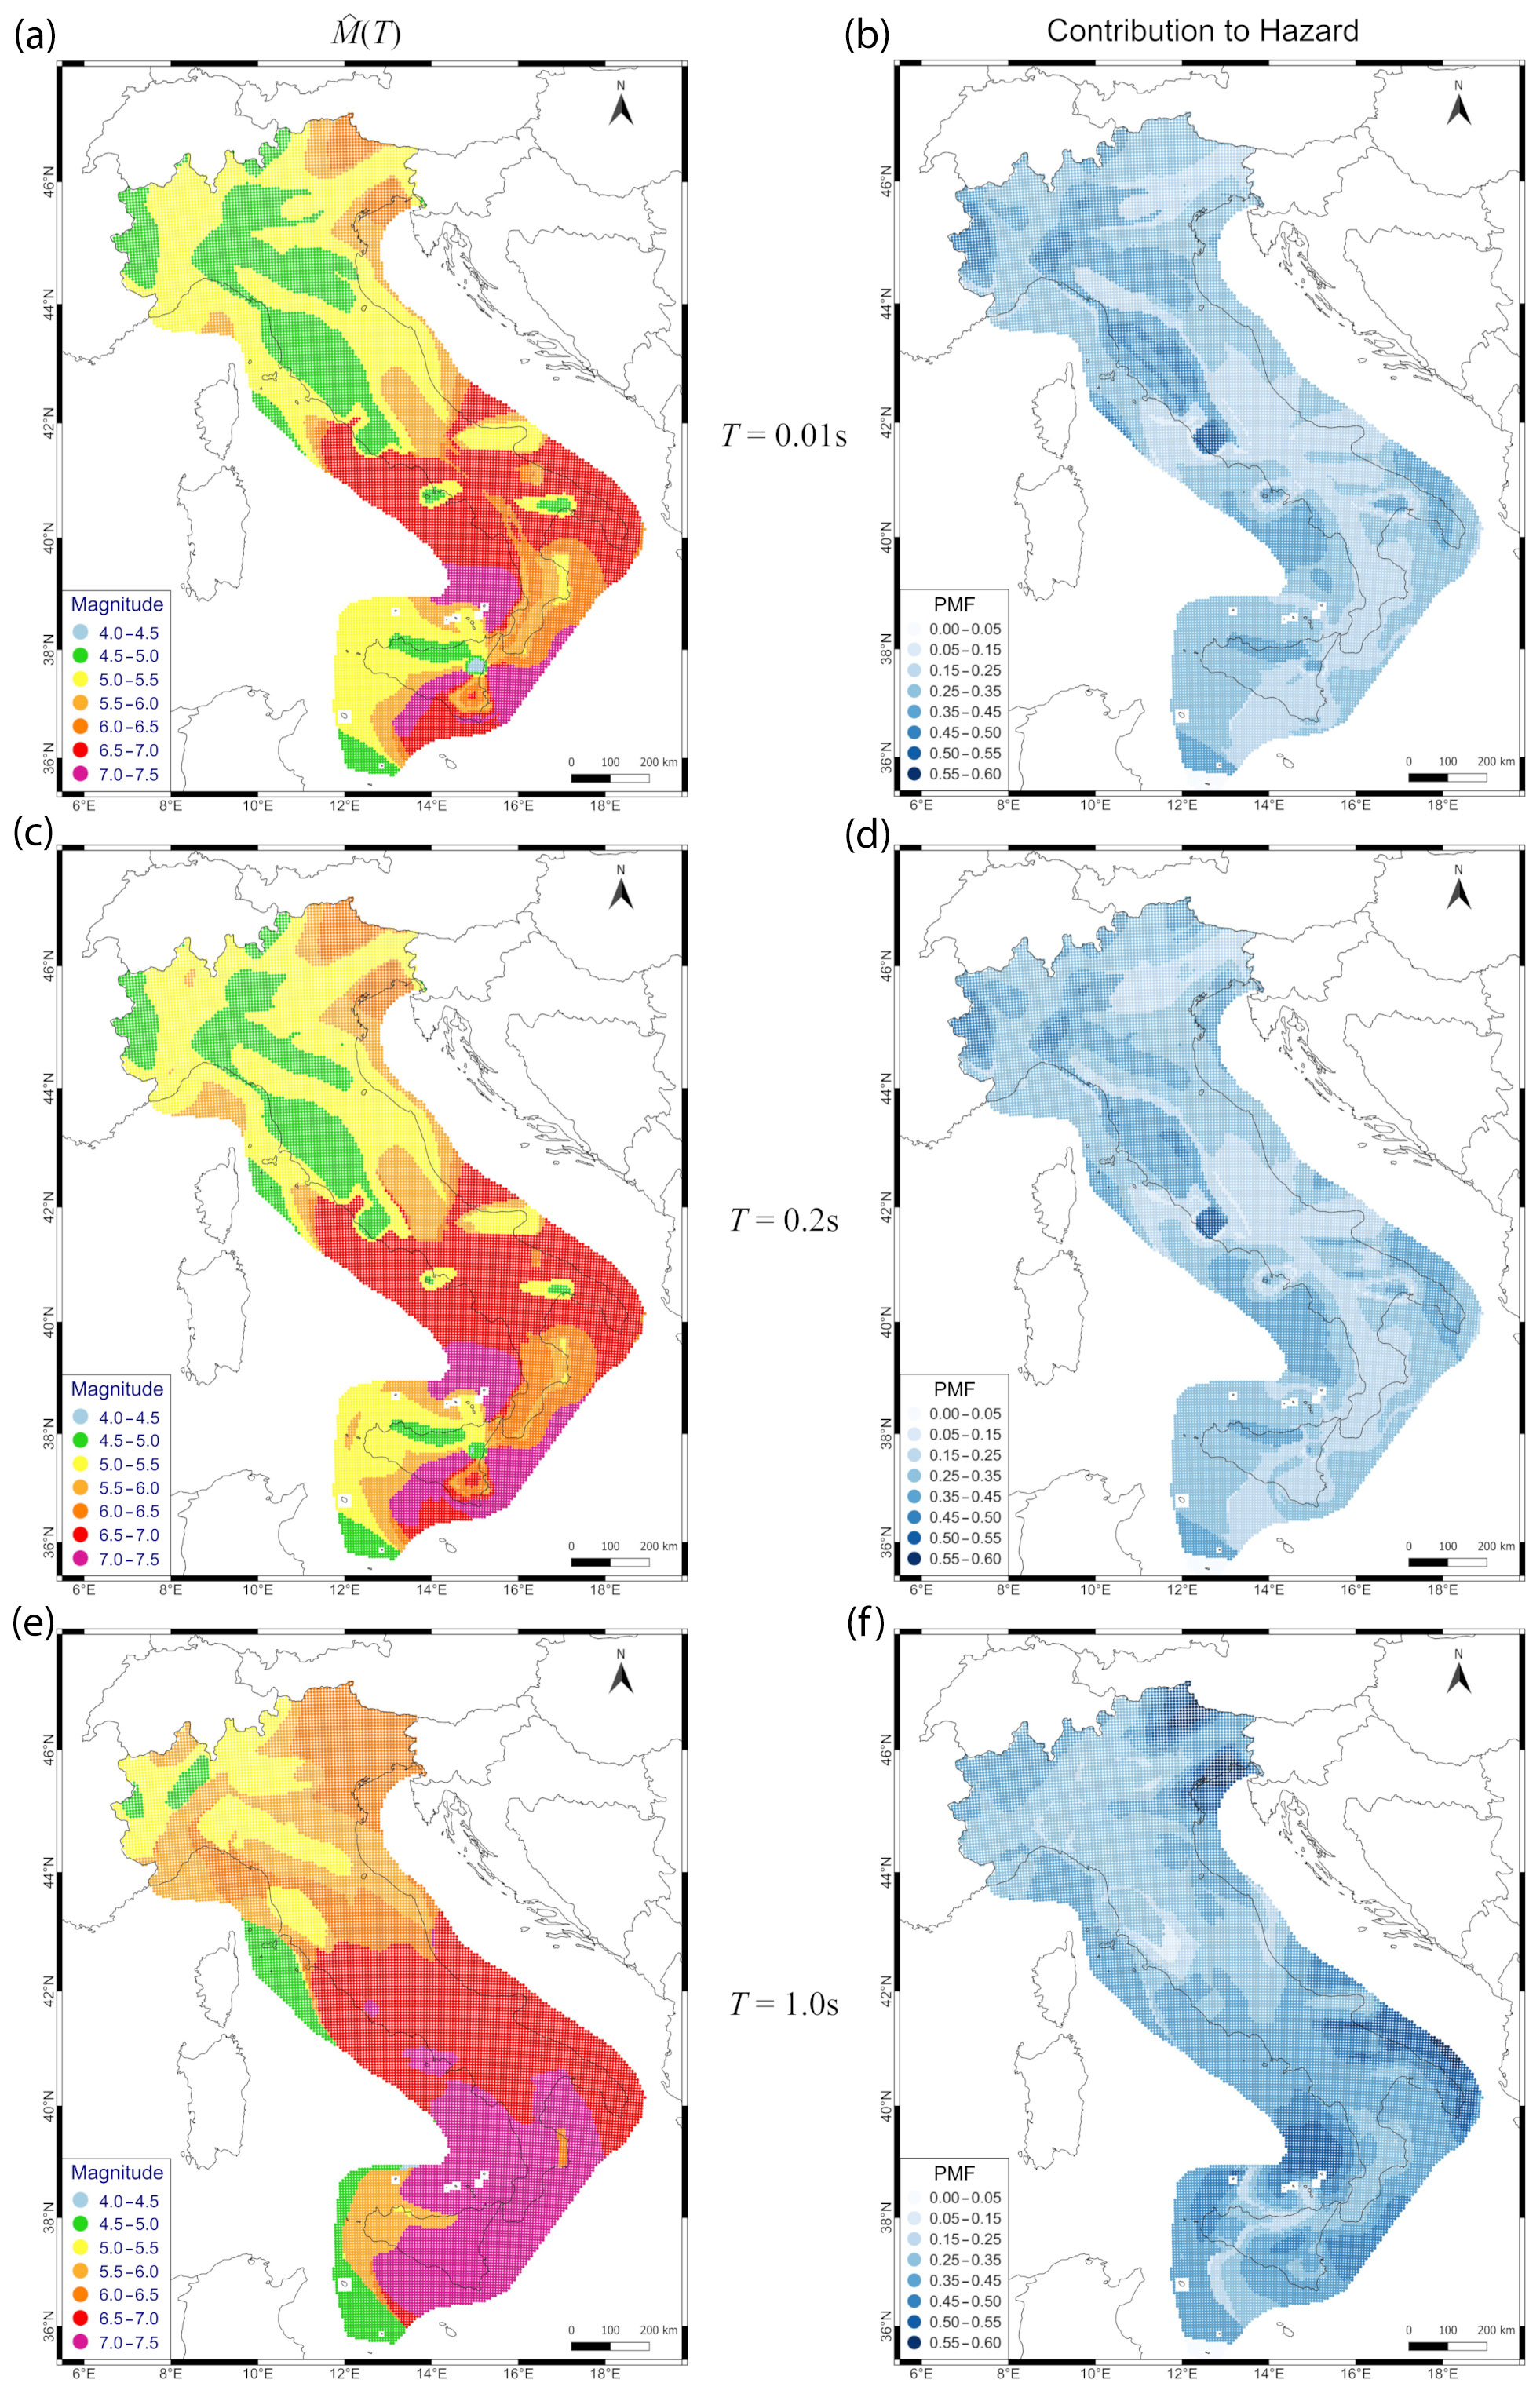
Figure 5Maps of preferred magnitude (a, c, e) and related contribution to the hazard (b, d, f) for spectral periods of 0.01, 0.2, and 1 s. The contribution to the hazard for each value of is expressed by the probability mass function (PMF) of magnitude in that point (i.e., magnitude bin).
The three maps shown in Fig. 5 are used in conjunction with the map of site classification (Fig. 9b in Forte et al., 2019) to define the final map of (from here on, we drop the dependence of on T to indicate the preferred magnitude) according to the following criteria:
-
for ground type A sites (i.e., rock sites or stiff soils with VS≥800 m s−1);
-
for ground type B sites (i.e., soft rock or deposits of dense soil characterized by a gradual increase in the mechanical properties with depth and 360 m s−1);
-
for ground type C, D, and E sites (i.e., sites characterized by deposits of loose-to-medium cohesionless soil with thickness either greater (C and D sites) or less than 30 m (E sites) and 100 m s−1).
The resulting map of is shown in Fig. 6.

Figure 6Maps of preferred magnitude : for ground type A; for ground type B; and for ground types C, D, and E (the reader may refer to the main body of the article for an explanation of the ground types). Note that the value of assigned to the entire island of Sardinia, for which hazard and hazard disaggregation are not available (MPS Working Group, 2004), is based on historical seismicity (characterized by rare events with magnitude less than 5; Rovida et al., 2020, 2022).
Combining the maps in Figs. 6 and 2b leads to the liquefaction triggering map shown in Fig. 7, which is referred to with the Italian acronym MILQ – Mappa del potenziale d'Innesco della LiQuefazione (map of liquefaction triggering potential). The color scale has been chosen to divide sites into classes of increasing liquefaction triggering potential (LTP), from no potential (i.e., amax<0.1 g and to very high potential (i.e., amax≥0.2 g and . Analyzing the map, we observe the following:
-
9.8 % of nodes fall in areas with no liquefaction triggering potential (class LTP-0: amax<0.1 g and ; they are mainly concentrated in very few areas in the northwest and in almost all of the island of Sardinia.
-
20.4 % of nodes have very low liquefaction triggering potential (class LTP-1: amax<0.1 g and or g and ; most of them are concentrated in areas characterized by low-to-moderate ground-motion hazard, controlled by small-to-moderate magnitude events (e.g., northern Italy, areas along the northern Tyrrhenian coast).
-
8.8 % of nodes have low liquefaction triggering potential (class LTP-2: amax<0.1 g and or amax≥0.2 g and ; most of these nodes are in low-seismicity areas (e.g., northeastern Alps and southeastern Italy) where the hazard tends to be controlled by stronger, generally distant events or, conversely, in areas of higher hazard but controlled by low magnitudes (e.g., northern Sicily).
-
10.5 % of nodes have moderate liquefaction triggering potential (class LTP-3: 0.1 g ≤ amax<0.2 g and ; most of them are concentrated in northern Italy, especially in the western sector and in the Po Plain, and in central Sicily, where both the ground-motion hazard and are moderate.
-
31.6 % of nodes have high liquefaction triggering potential (class LTP-4: and or amax≥0.2 g and . Most of them are concentrated in areas of increased seismic activity in central and southern Italy and in the northeast; the nodes with the highest values of are located in areas characterized by lower ground-motion hazard (e.g., some areas along the southern Tyrrhenian and Ionian coasts and in central-eastern Sicily).
-
18.9 % of nodes have very high liquefaction triggering potential (class LTP-5: amax≥0.2 g and ; most of these nodes are concentrated in central and southern Italy, following the Apennine arc down to the volcanic area in eastern Sicily, and in the northeast, where the ground-motion hazard reaches the highest levels and is dominated by (local) moderate-to-high-magnitude seismicity.
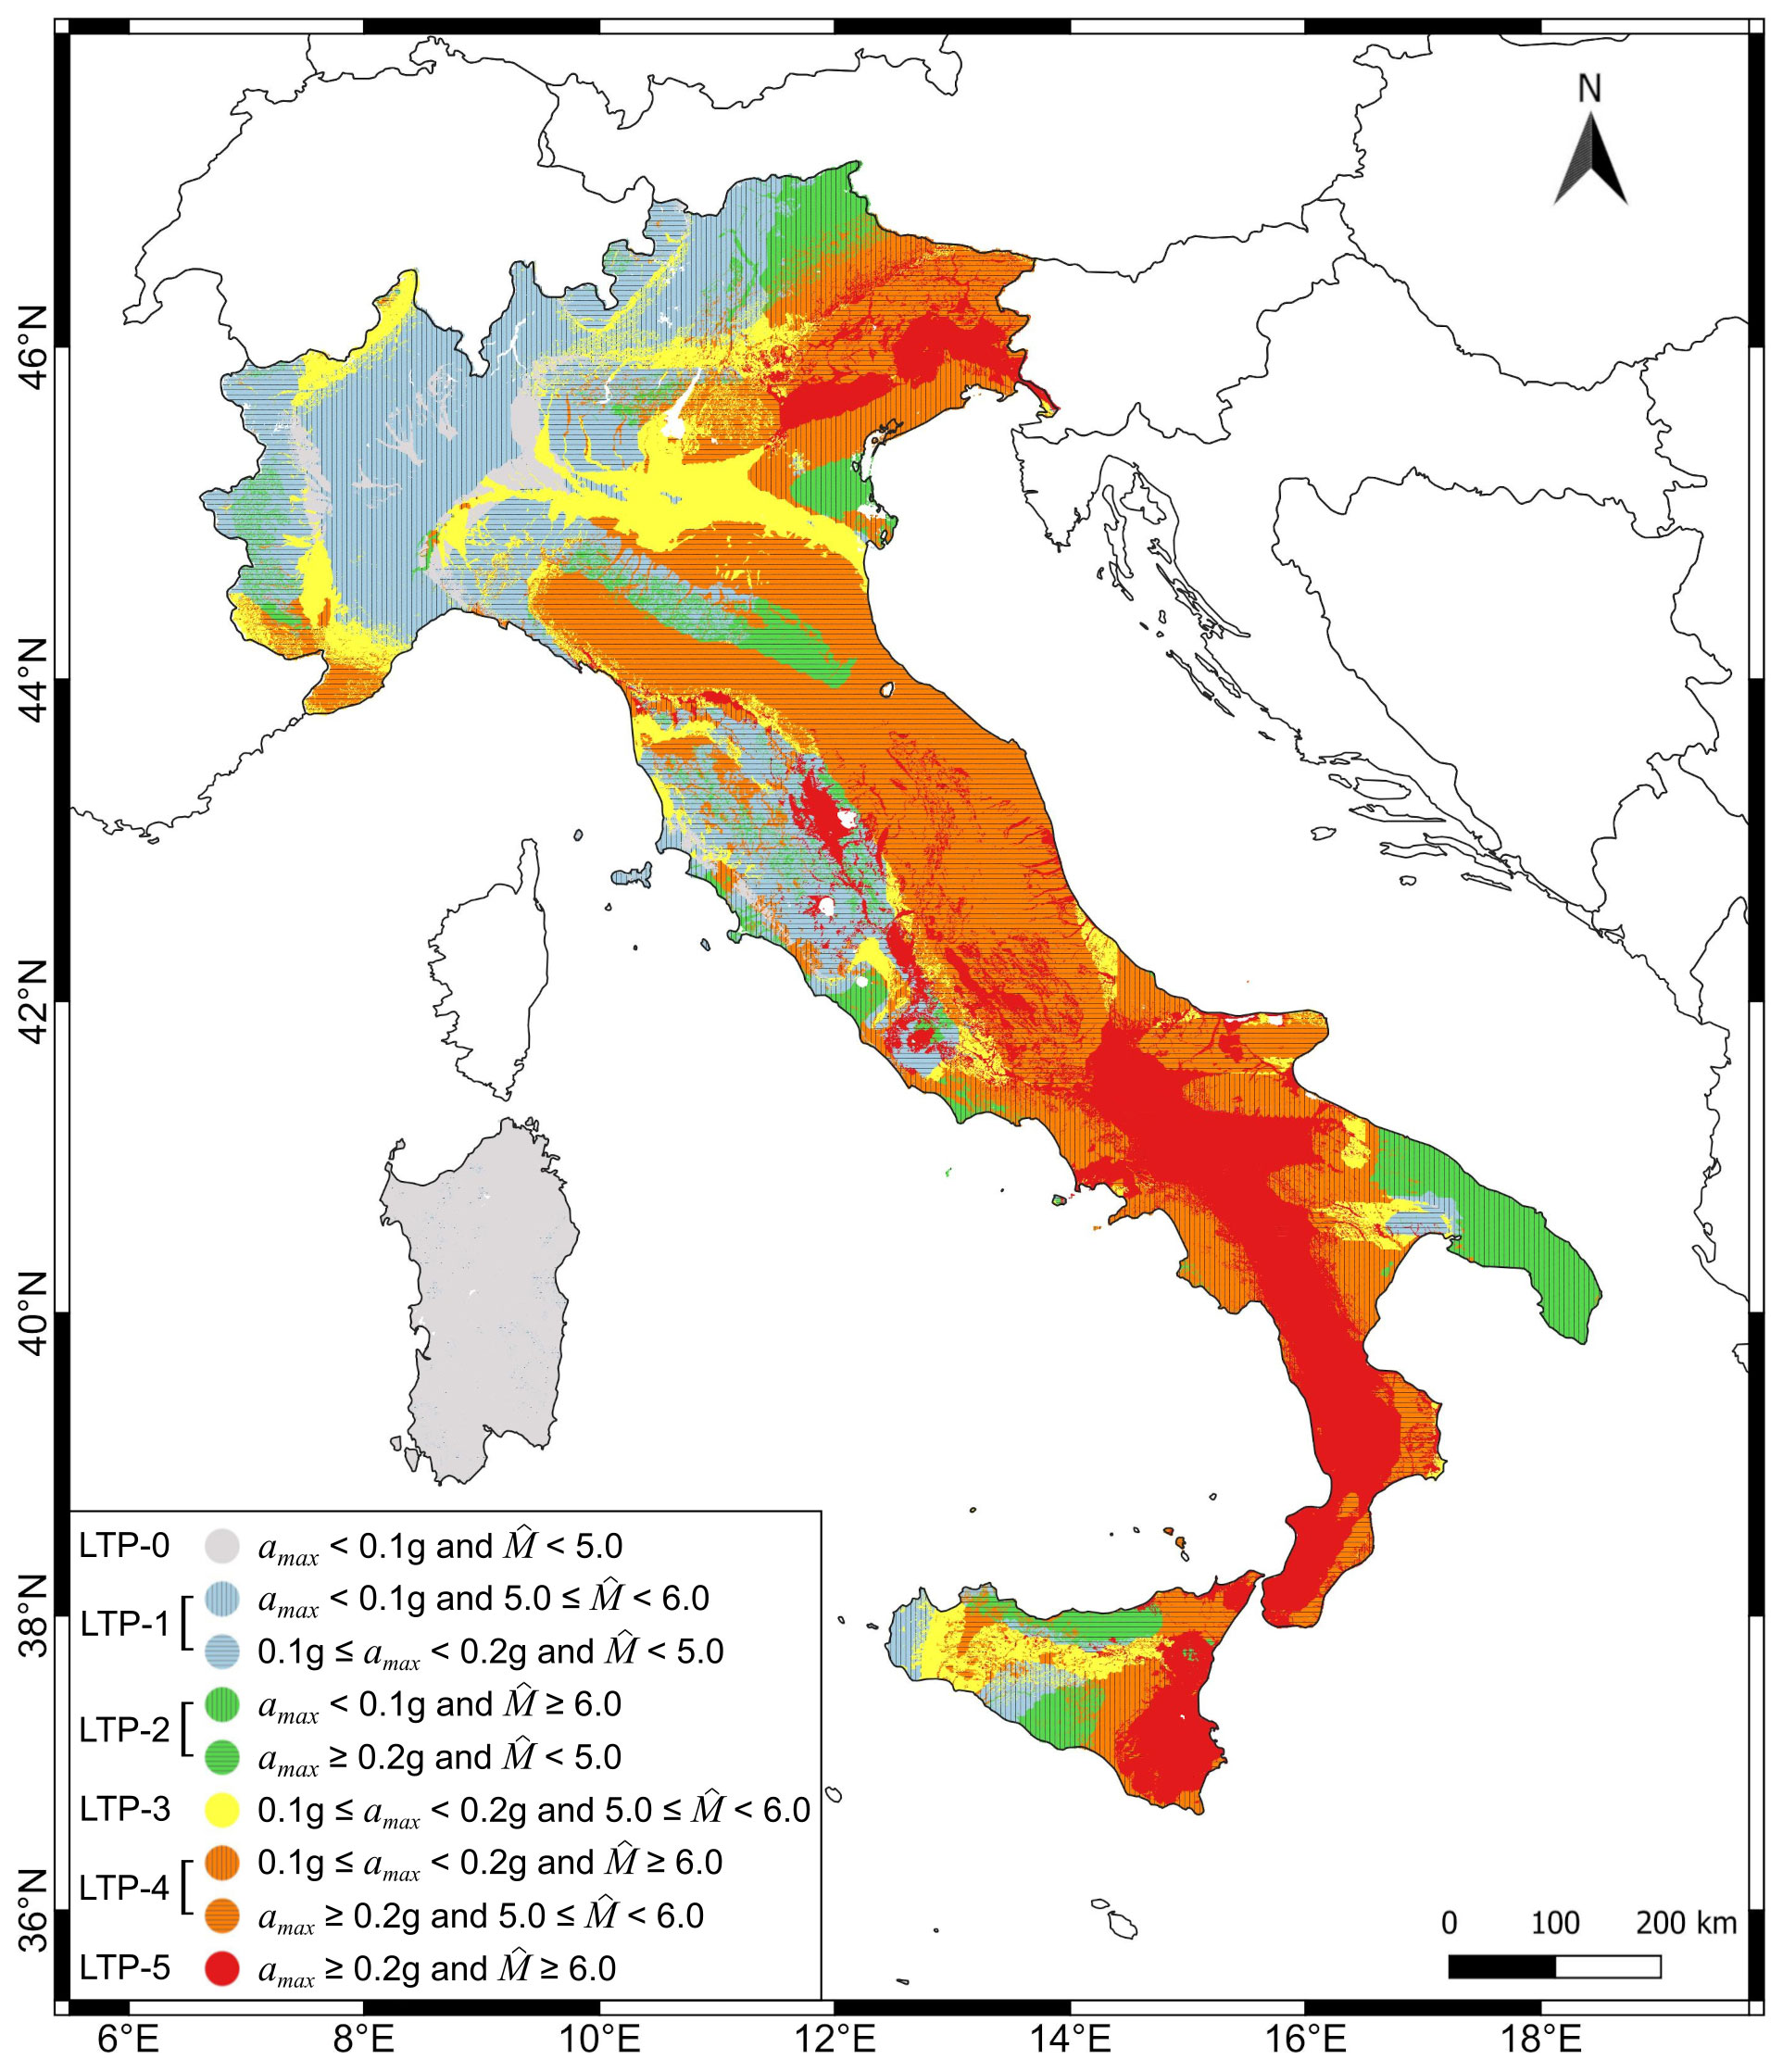
Figure 7Liquefaction triggering map of Italy (MILQ) for a return period of 475 years. Liquefaction triggering potential (LTP) classes are indicated in the legend: no potential (LTP-0), very low potential (LTP-1), low potential (LTP-2), moderate potential (LTP-3), high potential (LTP-4), and very high potential (LTP-5).
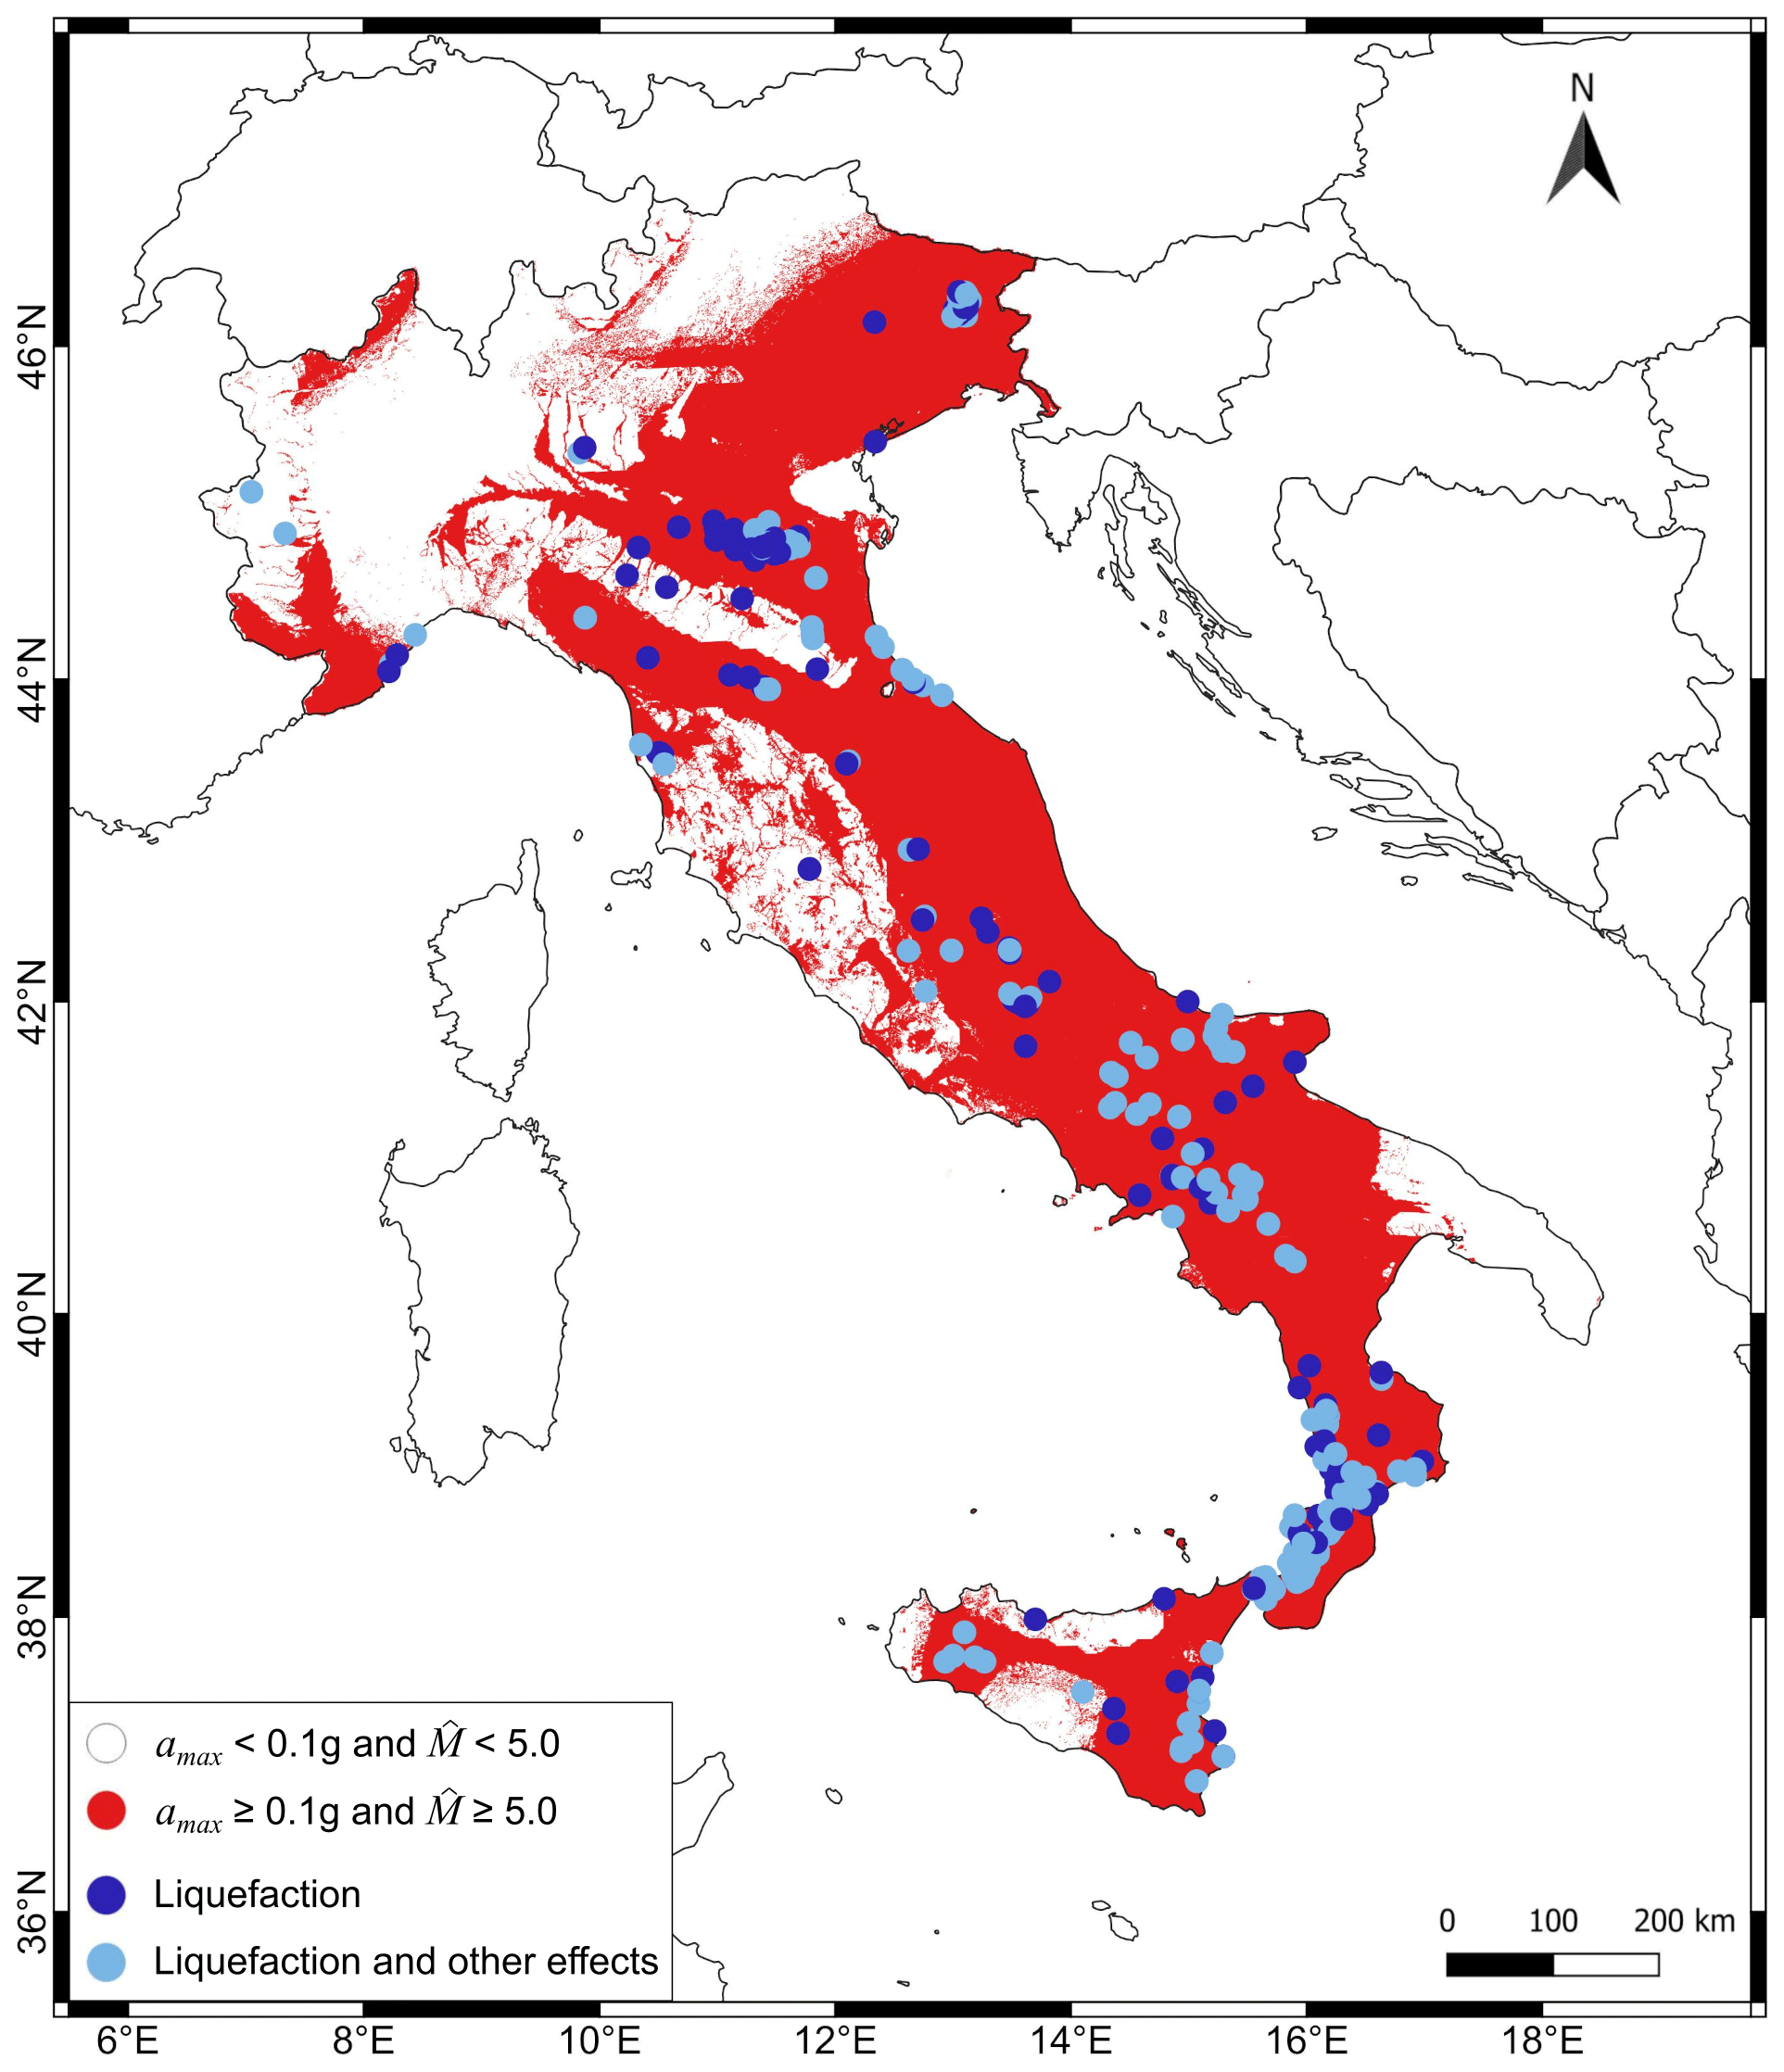
Figure 8Same as Fig. 7 but in red and white. Red is used when both the value of surface peak horizontal acceleration for a return period of 475 years, amax, and the preferred magnitude, , are equal to or greater than the thresholds of 0.1 g and 5.0, respectively. White is used otherwise. The historical liquefaction phenomena that occurred in Italy from 1117 CE to 2018 (from the Italian Catalogue of Earthquake-Induced Ground Failures – CEDIT; Caprari et al., 2018) are superimposed. The term “other effects” in the legend refers to other earthquake-induced phenomena, such as landslides, ground cracks, and surface faulting.
To make our results available to land-use planners and practitioners, we have developed a web service, freely accessible at https://distav.unige.it/rsni/milq.php (last access: 28 April 2023). The web service data are stored in a “PostgreSQL” database. All the online components were developed in “PHP” and “HTML5” languages to ensure adherence to current web standards. Online maps are based on “Leaflet”, an open-source JavaScript library for mobile-friendly interactive maps.
For a specified location (defined by a pair of geographic coordinates), the web service provides the values of amax and computed according to the site classifications adopted in the present study. Specifically, the values associated with the nearest node are returned (no interpolation is performed). In addition, as the actual ground type and topographic class at a site (e.g., resulting from site-specific data) can differ from those considered here, the service allows the user to change them through a user-friendly interface and returns the updated values of amax and as output. Alternatively, in line with the ICMS document (level 2 and 3 seismic microzonation) and the Italian building code (for sites that can not be classified in one of the subsoil classes mentioned in the previous section, and/or in the case of complex topography), the web service allows the amplification factor value (S) obtained from specific studies (e.g., ground response analysis) to be entered. In this case, the user is also requested to select the value of the spectral period T of interest among those considered in the disaggregation analysis (e.g., as a function of site response) to obtain the value of .

Figure 9Distribution of liquefaction events in Italy (from the Italian Catalogue of Earthquake-Induced Ground Failures – CEDIT; Caprari et al., 2018) for each class of liquefaction triggering potential (LTP).
Given the practical importance of liquefaction triggering potential maps, they should be subjected to testing before application. In the present study, we examine the reliability of the map in Fig. 7 by analyzing the geographic distribution of past liquefaction phenomena reported in the Italian Catalogue of Earthquake-Induced Ground Failures – CEDIT (Martino et al., 2014; Caprari et al., 2018). These events have been superimposed on that map (blue and light blue dots), which is now displayed in Fig. 8 using a more intuitive red and white scale, with the red color indicating the sites where liquefaction triggering is expected to occur (see the caption for further details). As is evident, most observations fall in red areas, thus indicating the consistency of our results. The matched observations are 314 out of 328. A more quantitative analysis of the results is provided by the histogram in Fig. 9, which shows the percentage of CEDIT observations for each class of liquefaction triggering potential defined above (from LTP-0 to LTP-5). Among the observations that fall in the red areas of the map in Fig. 8, 92 % of them correspond to nodes with high or very high liquefaction triggering potential (classes LTP-4 and LTP-5), while 4 % have a moderate potential (class LTP-3). Only 4 % of observations correspond to nodes with very low or low triggering potential (classes LTP-1 and LTP-2). No observations fall in regions with no triggering potential (class LTP-0).
Despite the good agreement between our map and past observations, a few questions need to be answered. To what extent does this matching derive from the criterion adopted to define in relation to the soil resonance? In other words, what is the sensitivity of our results to the choice of for different ground types? Can one obtain similar conservative results just assuming the disaggregation results for a single spectral period (e.g., T=0.01 s in line with the definition of amax) and increasing the return time (e.g., to 2475 years)? To answer these questions, we focus on the Po Plain area, which experienced liquefaction in several locations during the 2012 Emilia seismic sequence (Scognamiglio et al., 2012; Minarelli et al., 2022). The Quaternary deposits, consisting mainly of an alternation of sands, silts, and clays, are rather homogeneous throughout this area. Indeed, according to the soil classification of Forte et al. (2019) (see Fig. 9b therein), most sites in the Po Plain basin can be classified as ground type C or D (i.e., sites characterized by deposits of loose-to-medium cohesionless soil with thickness greater than 30 m and 100 m s−1). However, deep stratigraphic discontinuities can be identified (e.g., Mascandola et al., 2019). Such discontinuities are responsible for significant ground-motion amplification at long periods (>1 s) (e.g., Luzi et al., 2013; Abraham et al., 2015; Mascandola et al., 2021b).
For the Po Plain area, Fig. 10 compares alternative liquefaction triggering scenarios by adopting different assumptions: precisely, Fig. 10a is just a zoom of Fig. 8; Fig. 10b is the same as Fig. 10a but is obtained by assuming regardless of the ground type; finally, Fig. 10c is the same as Fig. 10b but for a return period of 2475 years. As expected, comparing the map in Fig. 10b with the reference one in Fig. 10a reveals that disaggregating only the PGA hazard can lead to an underestimation of the liquefaction triggering potential at soil sites. Such an underestimation can be significant at sites characterized by thick and soft soil deposits, as they generally have resonance periods much larger than 0.1 s. This justifies the use of the disaggregation of the hazard associated with either short or long spectral periods depending on site response. Especially for soft soil sites or sites characterized by thick soil deposits, the use of hazard disaggregation corresponding to longer periods prevents the adoption of non-conservative provisions by land-use planners or practitioners. As for the map in Fig. 10c, which refers to a return period of 2475 years, it still provides a conservative scenario like the reference map in Fig. 10a, but that scenario is justified neither by the local geology (see above) nor by the return period of a Mw=5.9 earthquake, such as the main shock of the 2012 Emilia seismic sequence with its epicenter near the town of Ferrara. According to the MPS Working Group (2004), indeed, the return period of a Mw=5.9 earthquake in that area is about 360 years.
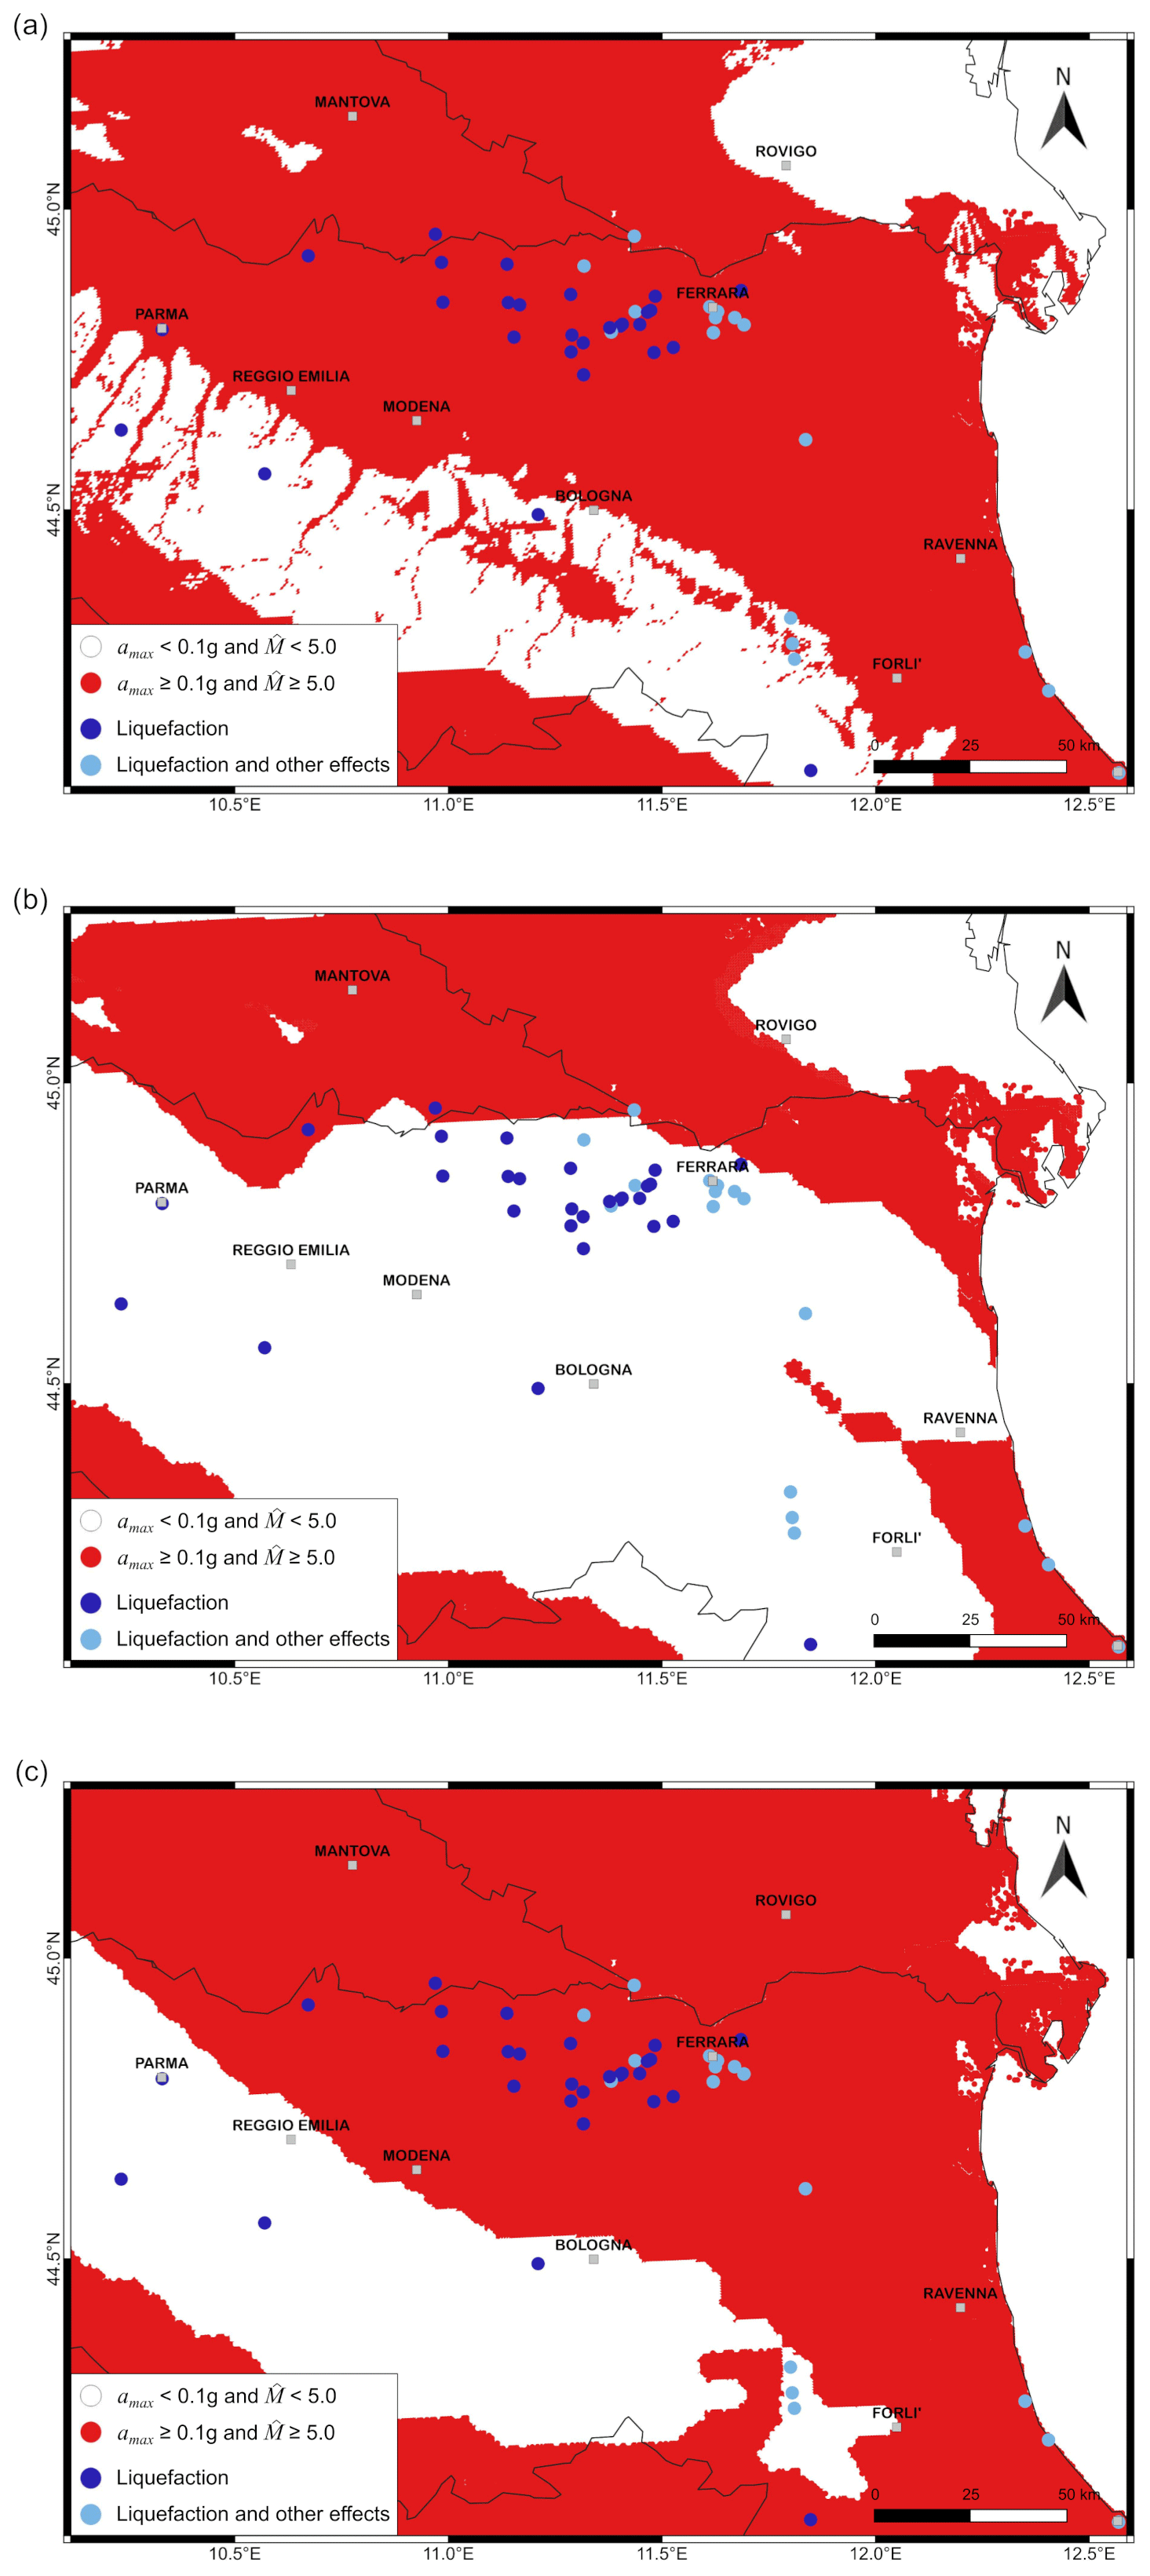
Figure 10Liquefaction triggering and historical liquefaction phenomena in the Po Plain area: (a) zoom of Fig. 8; (b) same as panel (a) but obtained by assuming regardless of the ground type (see the map in top left corner of Fig. 5); and (c) same as panel (b) but for a return period of 2475 years (i.e., the values of amax and used as input refer to a return period of 2475 years).
Besides ground-motion amplification effects, which are undoubtedly the most important of all seismic (site) effects because of their impact on the environment and society, instability phenomena induced by earthquake ground shaking (i.e., surface faulting, ground failure, and soil liquefaction) also play a key role in defining risk mitigation strategies and land-use planning. In recent years, the identification of unstable areas and the subsequent quantification of the instabilities have become primary activities of seismic microzonation studies. In this context, our study has focused on the identification of areas susceptible to soil liquefaction in Italy. We have analyzed ground-motion hazard maps and the associated hazard disaggregation to define areas where liquefaction triggering due to seismic activity can not be excluded and where, therefore, further efforts are required to evaluate liquefaction susceptibility. The final result is a liquefaction triggering map showing areas with different triggering potential (Fig. 7). The information contained therein (particularly the value of can be considered as an alternative to the results one can obtain by applying other approaches, particularly those proposed by the SM Working Group (2008, 2015; interested readers may also refer to the note of Technical Commission on Seismic Microzonation, 2018) for the determination of the reference magnitude for liquefaction susceptibility assessment. It is worth noting that, regardless of the approach used, soil liquefaction is a highly localized phenomenon whose occurrence is intimately related to site-specific geological and geotechnical conditions, which deserve focused investigations. Therefore, studies like the one presented here primarily serve as a basic guide to identifying sites where the possibility of triggering liquefaction can be discounted within the land-use planning process.
Despite the reliability of our results, which was examined by analyzing the distribution of past liquefaction events over the Italian territory, they can certainly be refined as soon as site-specific studies become available. On the one hand, site-specific hazard analyses (e.g., Cramer et al., 2014; Barani et al., 2020; Mascandola et al., 2023) allow the refinement of the values of amax. On the other hand, in situ measurements provide a more accurate definition of the ground type for the site of interest. At least as far as this issue is concerned, practitioners and land-use planners can interrogate our results through the web service at https://distav.unige.it/rsni/milq.php (last access: 28 April 2023) and refine the level of liquefaction triggering potential of the site of interest by changing the ground type and the topographic class through a user-friendly interface or by entering the site-specific amplification factor value at hand (e.g., determined from ground response analysis) along with the value of the spectral period of interest. The service returns as output the updated values of amax and , thus allowing the refinement of the triggering potential level.
The results presented in this paper are stored in a “PostgreSQL” database and made available through the online web service at https://distav.unige.it/rsni/milq.php (last access: 28 April 2023; Università di Genova, 2023). They can also be provided to the editorial board members, referees, and readers upon request.
SB carried out most of the analyses (i.e., computation of amax and hazard disaggregation), wrote the main body of the manuscript, and prepared Figs. 4 and 9. GF contributed to the analyses (particularly to the computation of amax), carried out an independent check of the values of , and prepared all the figures (except for Figs. 4 and 9) via the QGIS software. DS developed the web service (https://distav.unige.it/rsni/milq.php, last access: 28 April 2023) for the dissemination of the results. All authors reviewed the manuscript and contributed to the interpretation of the results.
The contact author has declared that none of the authors has any competing interests.
Publisher’s note: Copernicus Publications remains neutral with regard to jurisdictional claims in published maps and institutional affiliations.
This article is part of the special issue “Earthquake-induced hazards: ground motion amplification and ground failures”. It is not associated with a conference.
We are grateful to two anonymous reviewers for their suggestions that brought significant improvements to the study. We are also thankful to Iunio Iervolino and Eugenio Chioccarelli for providing us with the VS,eq map and the fruitful discussions. We thank the staff of the “Seismic Section” of the Tuscany Region Administration, Massimo Baglione and Vittorio D'Intinosante, for the useful discussions and suggestions.
This paper was edited by Giovanni Forte and reviewed by two anonymous referees.
Abraham, J. R., Lai, C. G., and Papageorgiou, A.: Basin-effects observed during the 2012 Emilia earthquake sequence in Northern Italy, Soil Dyn. Earthq. Eng., 78, 230–242, 2015.
Atkinson, G. M., Finn, W. D. L., and Charlwood, R. G.: Simple computation of liquefaction probability for seismic hazard applications, Earthq. Spectra, 1, 107–123, 1984.
Barani, S., Spallarossa D., and Bazzurro, P.: Disaggregation of probabilistic ground-motion hazard in Italy”, Bull. Seismol. Soc. Am., 99, 2638–2661, 2009.
Barani, S., Ferretti, G., and De Ferrari, R.: Incorporating results from seismic microzonation into probabilistic seismic hazard analysis: An example in western Liguria (Italy), Eng. Geol., 267, 105479, https://doi.org/10.1016/j.enggeo.2020.105479, 2020.
Bozzoni, F., Cantoni, A., De Marco, M. C., and Lai, C. G.: ECLiq: European interactive catalogue of earthquake induced soil liquefaction phenomena, Bull. Earthq. Eng., 19, 4719–4744, 2021.
Brandenberg, S. J., Zimmaro P, Stewart, J. P., Kwak, D. Y., Franke, K. W., Moss, R. E., Çetin, K. Ö., Can, G., Ilgac, M., Stamatakos, J., Weaver, T., and Kramer, S. L.: Next-generation liquefaction database, Earthq. Spectra, 36, 939–959, 2020.
Caprari P., Della Seta, M., Martino, S., Fantini, A., Fiorucci, M., and Priore, T.: Upgrade of the CEDIT database of earthquake-induced ground effects in Italy, Ital. J. Eng. Geol. Environ., 2, 23–39, 2018.
Cramer, C. H., Van Arsdale, R. B., Dhar, M. S., Pryne, D., and Paul, J.: Update of Urban Seismic-Hazard Maps for Memphis and Shelby County, Tennessee: Geology and VS Observations, Seismol. Res. Lett., 85, 986–996, 2014.
Forte, G., Chioccarelli, E., De Falco, M., Cito, P., Santo, A., and Iervolino, I.: Seismic soil classification of Italy based on surface geology and shear-wave velocity measurements, Soil Dyn. Earthq. Eng., 122, 79–93, 2019.
Green, R. A. and Bommer, J. J.: What is the smallest earthquake magnitude that needs to be considered in assessing liquefaction hazard?, Earthq. Spectra, 35, 1441–1464, 2019.
Iervolino, I.: Soil-invariant seismic hazard and disaggregation, Bull. Seismol. Soc. Am., 106, 1900–1907, 2016.
Kramer, S. L.: Geotechnical Earthquake Engineering. Prentice-Hall, Upper Saddle River, New Jersey, 653 pp., 1996.
Luzi, L., Pacor, F., Ameri, G., Puglia, R., Burrato, P., Massa, M., Augliera, P., Franceschina, G., Lovati, S., and Castro, R.: Overview on the strong-motion data recorded during the May–June 2012 Emilia seismic sequence, Seismol. Res. Lett., 84, 629–644, 2013.
Martino, S., Prestininzi, A., and Romeo, R. W.: Earthquake-induced ground failures in Italy from a reviewed database, Nat. Hazards Earth Syst. Sci., 14, 799–814, https://doi.org/10.5194/nhess-14-799-2014, 2014.
Mascandola, C., Massa, M., Barani, S., Albarello, D., Lovati, S., Martelli, L., and Poggi, V.: Mapping the Seismic Bedrock of the Po Plain (Italy) through Ambient-Vibration Monitoring, Bull. Seismol. Soc. Am., 109, 164–177, 2019.
Mascandola, C., Luzi L., Felicetta, C., and Pacor, F.: A GIS procedure for the topographic classification of Italy, according to the seismic code provisions, Soil Dyn. Earthq. Eng., 148, 106848, https://doi.org/10.1016/j.soildyn.2021.106848, 2021a.
Mascandola, C., Barani, S., Massa, M., and Albarello, D.: New insights into long-period (>1 s) seismic amplification effects in deep sedimentary basins: A case of the Po Plain basin of northern Italy, Bull. Seismol. Soc. Am., 111, 2071–2086, 2021b.
Mascandola, C., Barani S., and Albarello D.: Impact of site-response characterization on probabilistic seismic hazard in the Po Plain (Italy), Bull. Seismol. Soc. Am., 2023, 1–17 pp., https://doi.org/10.1785/0120220177, 2023.
Minarelli L., Amoroso, S., Civico, R., De Martini, P. M., Lugli, S., Martelli, L., Molisso, F., Rollins, K. M., Salocchi, A., Stefani, M., Cultrera, G., Milana, G., and Fontana, D.: Liquefied sites of the 2012 Emilia earthquake: a comprehensive database of the geological and geotechnical features (Quaternary alluvial Po plain, Italy), Bull. Earthq. Eng., 20, 3659–3697, 2022.
Ministero delle Infrastrutture e dei Trasporti: Norme tecniche per le costruzioni, D.M. 14 Gennaio 2008, Supplemento ordinario alla Gazzetta Ufficiale No. 29, 4 Febbraio, 2008.
Ministero delle Infrastrutture e dei Trasporti: Aggiornamento delle “Norme tecniche per le costruzioni”, D.M. 17 Gennaio 2018, Supplemento ordinario alla Gazzetta Ufficiale N. 42 del 20 Febbraio, 2018.
Mori, F., Mendicelli, A., Moscatelli, M., Romagnoli, G., Peronace, E., and Naso, G.: A new Vs30 map for Italy based on the seismic microzonation dataset, Eng. Geol., 275, 105745, https://doi.org/10.1016/j.enggeo.2020.105745, 2020.
Musson, R. M. W.: DISCUSSION OF “What is the smallest earthquake magnitude that needs to be considered in assessing liquefaction hazard?”, edited by: Green, R. A. and Bommer, J. J., Earthquake Spectra, 35, 1441–1464, Earthquake Spectra, 36, 452–454, https://doi.org/10.1177/8755293019878189, 2020.
MPS Working Group: Redazione della mappa di pericolosità sismica prevista dall'Ordinanza PCM 3274 del 20 marzo 2003, Final Report, INGV, Milano-Roma 2004, 65 pp + 5 appendixes, 2004.
QGIS.org: QGIS Geographic Information System, QGIS Association, https://www.qgis.org/en/site/ (last access: 28 April 2023), 2021.
Rovida, A., Locati, M., Camassi, R., Lolli, B., Gasperini, P., and Antonucci, A.: Catalogo Parametrico dei Terremoti Italiani (CPTI15), versione 4.0, Istituto Nazionale di Geofisica e Vulcanologia (INGV). https://doi.org/10.13127/CPTI/CPTI15.4, 2022.
Rovida, A., Locati, M., Camassi, R., Lolli, B., and Gasperini, P.: The Italian earthquake catalogue CPTI15, Bull. Earthq. Eng., 18, 2953–2984, 2020.
Santucci de Magistris, F.: The occurrence of liquefaction at low acceleration level, in: Proceedings of the 6th International Conference on Earthquake Geotechnical Engineering, Christchurch, 1–4 November 2015, New Zealand, 2015.
Santucci de Magistris, F., Lanzano, G., Forte, G., and Fabbrocino, G.: A database for PGA threshold in liquefaction occurrence, Soil Dyn. Earthq. Eng., 54, 17–19, 2013.
Scognamiglio, L., Margheriti, L., Mele, F. M., Tinti, E., Bono, A., De Gori, P., Lauciani, V., Lucente, F. P., Mandiello, A. G., Marcocci, C., Mazza, S., Pintore, S., and Quintiliani, M.: The 2012 Pianura Padana Emiliana seimic sequence: locations, moment tensors and magnitudes, Ann. Geophys., 55, 549–559, 2012.
Seed, H. B. and Idriss, I. M.: Simplified procedure for evaluating soil liquefaction potential, J. Geotech. Engrg. Div., ASCE, 9, 1249–1273, 1971.
SM Working Group: Indirizzi e criteri per la microzonazione sismica, Conferenza delle Regioni e delle Province autonome – Dipartimento della protezione civile, Roma, 2008, https://www.protezionecivile.gov.it/it/pubblicazione/indirizzi-e-criteri-la-microzonazione-sismica (last access: 21 October 2022), 2008.
SM Working Group: Guidelines for Seismic Microzonation, Conference of Regions and Autonomous Provinces of Italy – Civil Protection Department, Rome, 2015, https://www.centromicrozonazionesismica.it/it/download/category/9-guidelines-for-seismic-microzonation (last access: 21 October 2022), 2015.
Stucchi, M., Meletti, C., Montaldo, V., Crowley, H., Calvi, G. M., and Boschi, E.: Seismic hazard assessment (2003–2009) for the Italian building code, Bull. Seismol. Soc. Am., 101, 1885–1911, 2011.
Technical Commission on Seismic Microzonation: Land use guidelines for areas affected by liquefaction (LQ), version 1.0, Rome, 2018, https://www.centromicrozonazionesismica.it/it/download/category/22-land-use-guidelines-for-areas-affected-by-liquefaction (last access: 21 October 2022), 2018.
Università di Genova: VERSIONE BETA TEST MILQ – Mappa del potenziale di Innesco della LiQuefazione (Italia), Università di Genova [data set], https://distav.unige.it/rsni/milq.php (last access: 28 April 2023), 2023.
Youd, T. L., Idriss, I. M., Andrus, R. D., Arango, I., Castro, G., Christian, J. T., Dobry, R., Finn, W. D. L., Harder Jr., L. F., Hynes, M. E., Ishihara, K., Koester, J. P., Liao, S. S. C., Marcuson III, W. F. , Martin, G. R., Mitchell, J. K. , Moriwaki, Y., Power, M. S., Robertson, P. K., Seed, R. B., and Stokoe, K. H.: Liquefaction resistance of soils: summary report from the 1996 NCEER and 1998 NCEER/NSF workshops on evaluation of liquefaction resistance of soils, J. Geotech. Geoenviron. Eng., 127, 817–833, 2001.
Zimmaro, P., Brandenberg, S. J., Stewart, J. P., Kwak, D. Y., Franke, K. W., Moss, R. E. S., Cetin, K. O., Can, G., Ilgac, M., Stamatakos, J., Juckett, M., Mukherjee, J., Murphy, Z., Ybarra, S., Weaver, T., Bozorgnia, Y., and Kramer, S. L.: Next-generation liquefaction database, Next-generation liquefaction consortium, https://doi.org/10.21222/c2j040, 2019.
Zumpano V., Pisano, L., Filice, F., Ugenti, A., de Lucia, D., Wasowski, J., Santaloia, F., and Lollino, P.: Regional-scale seismic liquefaction susceptibility mapping via an empirical approach validated by site-specific analyses, Geosciences, 12, 215, https://doi.org/10.3390/geosciences12050215, 2022.
It is worth noting that, compared to the original version released in 2008 (Ministero delle Infrastrutture e dei Trasporti, 2008), the 2018 update of the Italian building code does not specify a lower-bound magnitude for liquefaction triggering.
This is the English edition of the original document released by the SM Working Group in 2008.
Note that, in Italy, VS,eq has replaced the well-known VS,30 parameter, which assumes a fixed depth of 30 m for the calculation of the time-averaged shear-wave velocity in the subsoil.
For the sake of completeness, Forte et al. (2019) also developed a similar map based on the VS,30 parameter, the parameter which was adopted by the older Italian norms (Ministero delle Infrastrutture e dei Trasporti, 2008) and Eurocode 8 (European Committee for Standardization, 2004) for the purpose of site classification. Almost concurrently, a VS,30 map was developed by Mori et al. (2020).