the Creative Commons Attribution 4.0 License.
the Creative Commons Attribution 4.0 License.
 | 24 Apr 2023
Effect of extreme El Niño events on the precipitation of Ecuador
Paolo Ramoni-Perazzi
Ezequiel Zamora-Ledezma
Mary L. Puche
Marco Marquez
José I. Quintero
Wilmer Rojas
Alberto Quintero
Guillermo Bianchi
Irma A. Soto-Werschitz
Marco Aurelio Arizapana-Almonacid
Extreme El Niño events stand out not only because they have powerful impacts but also because they are significantly different from other El Niños. In Ecuador, such events are accountable for negatively impacting the economy, infrastructure, and population. Spatial–temporal dynamics of precipitation anomalies from various types of extreme El Niño events are analyzed and compared. Results show that for eastern Pacific (EP) and coastal Pacific (COA) El Niño types, most precipitation extremes occur in the first half of the second year of the event. Any significant difference between events becomes more evident at this stage. Spatially, for any event, 50 % of all extreme anomalies occurred at elevations < 150 m. The difference between events was significant when considering the altitude when reaching 80 % of all extreme anomalies: the eastern Pacific (EP) El Niño from 1997/98 (EP98) at 500 m, the El Niño from January to April 2017 (COA17) at 800 m, and the EP El Niño from 1982/83 (EP83) at 1000 m. Nevertheless, in some sectors of the Andean Cordillera, the El Niño–Southern Oscillation (ENSO) signal could be detected at 3200–3900 m. The distance to the coastline and the steepness of relief may play a determining role. At lowlands, anomalies are most severe in regions where the seasonality index is the highest. These results are useful at different decision-making levels for identifying the most appropriate practices reducing vulnerability from a potential increase in extreme El Niño frequency and intensity.
- Article
(16551 KB) - Full-text XML
- BibTeX
- EndNote


El Niño is the positive (warm) phase of the El Niño–Southern Oscillation (ENSO), characterized as a complex phenomenon of variable extent and intensity and contrasted impacts, from regional to global. It originates from the unusual warming of sea surface temperature (SST) from the center of the equatorial Pacific Ocean to the coasts of Peru and Ecuador, bringing anomalously heavy rainfall to this region (Gelati et al., 2014; Zambrano-Mera et al., 2018), and is associated with substantial socioeconomic impacts (Cai et al., 2020). Because of the different locations of maximum SST anomalies and associated atmospheric heating, El Niño events are classified as eastern Pacific (EP) and central Pacific (CP) warming events (Wang et al., 2016). Eastern Pacific El Niños tend to have a stronger effect than central Pacific El Niños, linked to the anomalous SST and convection (Cai et al., 2020). According to Cai et al. (2020), during an eastern Pacific El Niño, anomalously warm waters (+1.5–3.0 ∘C) are often observed adjacent to the equatorial South American Pacific coast. Through transferring heat from the ocean to the atmosphere, this anomalous warming elevates air temperatures in the coastal region, triggering localized atmospheric convection and heavy rainfall.
But, such atmospheric–oceanic coupling at the South American Pacific coast is not exclusive to eastern El Niño events. The coastal event is the least frequent type of El Niño event but has a proven capability of generating extreme precipitation in Ecuador and Peru (e.g., the coastal El Niño of 2017). This type of extreme event is very rare and, until 2017, only two coastal El Niños were previously reported in 1891 and 1925 (Takahashi and Martínez, 2017). While recent attention has been brought to the central Pacific and the eastern Pacific El Niño events, the coastal El Niño represents another facet of ENSO that requires further study (Takahashi et al., 2018a, b). The coastal El Niño of 2017 was an exceptional marine heat wave that did not last very long (only 3 months) but exhibited SST anomalies higher than any other extreme El Niño event (+7 ∘C) (Pietri et al., 2021). Differently from the eastern Pacific El Niños, which are formed by the downwelling of equatorial Kelvin waves, the coastal El Niño of 2017 seemed to have been formed by a marine heat wave generated by a local decrease in the winds in the eastern Pacific, close to the coast of Ecuador and Peru (Echevin et al., 2018; Hu et al., 2019).
Before 1972, and more specifically before 1982, the 20th century was dominated by rather mild El Niño events. Thus, El Niño was viewed as a regional phenomenon that interested mainly climate specialists. It was after learning from their devastating effects from the occurrence of two of the most extreme El Niño events in history (i.e., 1982/83 and 1997/98 events) that the term El Niño not only became familiar to the general public but also was seriously brought to the attention of governments and policymakers worldwide (Glantz, 2015; Hameed et al., 2018).
Extreme El Niño events have a proven capacity not only to severely affect the local climate but also to have an impact at a global scale through oceanic and atmospheric teleconnections (Dewitte and Takahashi, 2019). Extreme El Niño events stand out not only for their powerful impacts but also for their significant differences from other El Niños (Hong et al., 2014; Hameed et al., 2018). Now, the main difficulty in the investigation of extreme El Niño dynamics has been related to the fact that, by definition, these occur rarely and very few have been observed comprehensively, and there is still not a clear picture of the extreme El Niño teleconnection complexity (Dewitte and Takahashi, 2019). In the satellite era, only three strong El Niño events (excluding the coastal type) have been observed (1982/83, 1997/98, and 2015/16). Nevertheless, and despite their limited number, extreme El Niño events may share some common features (Hong, 2016). Therefore, the group study of extreme El Niño provides an excellent starting point to understand the complexity of the El Niño phenomenon.
With a current population of around 18 million and a continental surface of 248 540 km2, Ecuador is located between 1.5∘ N and −5.0∘ S, comprising an important extension of both the tropical South American Pacific coast and the Amazon Basin. These two geographical regions are separated by the Andean Cordillera which crosses the country from north to south and constitutes a substantial topographic barrier (Morán-Tejeda et al., 2016). Regarding the presence of the Andean mountain chain, this most certainly modifies the ENSO signal (Vuille et al., 2000; Morán-Tejeda et al., 2016; Tobar and Wyseure, 2017; Quishpe-Vásquez et al., 2019). However, there is no clear explanation of how far into the Andes the effects of ENSO are perceived (Morán-Tejeda et al., 2016). Detailed basin-wide assessments of the influence of ENSO in the transition from the coastal plain toward the western Andean Cordillera are also very scarce (Pineda et al., 2013). Various studies have considered precipitation in Ecuador (Rossel et al., 1999; Bendix and Bendix, 2006; Buytaert et al., 2006) or have focused on precipitation in specific areas of the country (Mora and Willems, 2012; Thielen et al., 2015, 2016). In general, a strong connection between ENSO and precipitation in Ecuador has been found, but none of the previous studies analyzed stations throughout the entire country (Morán-Tejeda et al., 2016). According to Morán-Tejeda et al. (2016), a study of trends and variability in precipitation, based on up-to-date data for the entire country, is still lacking – a situation that is especially true when considering the different effects on spatial and temporal precipitation dynamics resulting from the occurrence of various types of extreme El Niño events (Thielen et al., 2021a).
In Ecuador, historical extreme El Niño events are accountable for generating very important, direct or indirect, negative effects on the economy, infrastructure, and population (OPS and OMS, 1999). Most economic costs are related to losses of agricultural production and damages to infrastructure (USD 640.6 million in 1982/83 and USD 2882 million in 1997/98). Around 60 % of the population of Ecuador may have their living conditions altered, directly or indirectly, by the occurrence of an extreme El Niño event. They have been responsible for generating major migratory waves (CEPAL, 1998). For instance, over 1 million Ecuadorians fled the country after Ecuador's economy was impacted due to El Niño in 1972/73 and 1982/83 (Bernabé et al., 2014), as well as in 1997/98 (OPS, 2000). Extreme El Niño events in Ecuador have also been accountable for important epidemics of diverse vector-transmitted and infectious diseases such as cholera, leptospirosis, dengue, chikungunya, zika, malaria, etc. (Gabastou et al., 2002; World Bank Group, 2011).
Now, in response to greenhouse warming, extreme El Niño events are projected to double their occurrence, while a less pronounced increase is projected for moderate El Niño events (Gulizia and Pirotte, 2022; Cai et al., 2014). Likewise, climate model projections also indicate an increase in the frequency of extreme coastal El Niño (Peng et al., 2019). Of course, these impacts on climate extremes as well as the associated socioeconomic impacts would also take place much more frequently (Gulizia and Pirotte, 2022; López et al., 2022).
Taking into account the implications for Ecuador of such a forecast, the main objective of the present study was to analyze and compare, based on up-to-date data for the entire insular and continental territory, the dynamics of precipitation anomalies resulting from the various types of extreme El Niño events, including the coastal El Niño. The results were discussed regarding the spatial and temporal variability generated by the topographic gradients of the dorsal of the Andes at both the Pacific slope and the Amazon slope, as well as in terms of their principal basins or hydrological systems. The results provide solid and opportune evidence that can be used at different decision-making levels for identifying, in the context of global climate change scenarios, the most appropriate practices for reducing vulnerability and risks from a potential increase in extreme El Niño frequency and intensity.
2.1 Study area
The study area was defined as the totality of the continental and insular (offshore) territory of Ecuador. As for the continental territory, this was first divided into two main and distinctive zones: the Pacific slope (116 592 km2) and the Amazon slope (131 948 km2). Delineation of these zones was defined by the dorsal of the Andes, a dominant orographic barrier determining if runoff from rainfall is to be drained to the Pacific shore or the Amazon Basin. Following the CNRH (2002) classification system, each of these two continental zones was further divided into hydrographic systems or basins regarding their climate and spatial homogeneity. Through GIS applications, data from HydroSHEDS (https://www.hydrosheds.org/, last access: 20 April 2023) were used to delineate each basin. This resulted in 23 hydrographic systems for the Pacific slope and 7 for the Amazon slope (see Fig. 1). Finally, regarding the insular territory, a unique hydrographic system was established encompassing all offshore islands, specifically the Galapagos Islands (8233 km2).
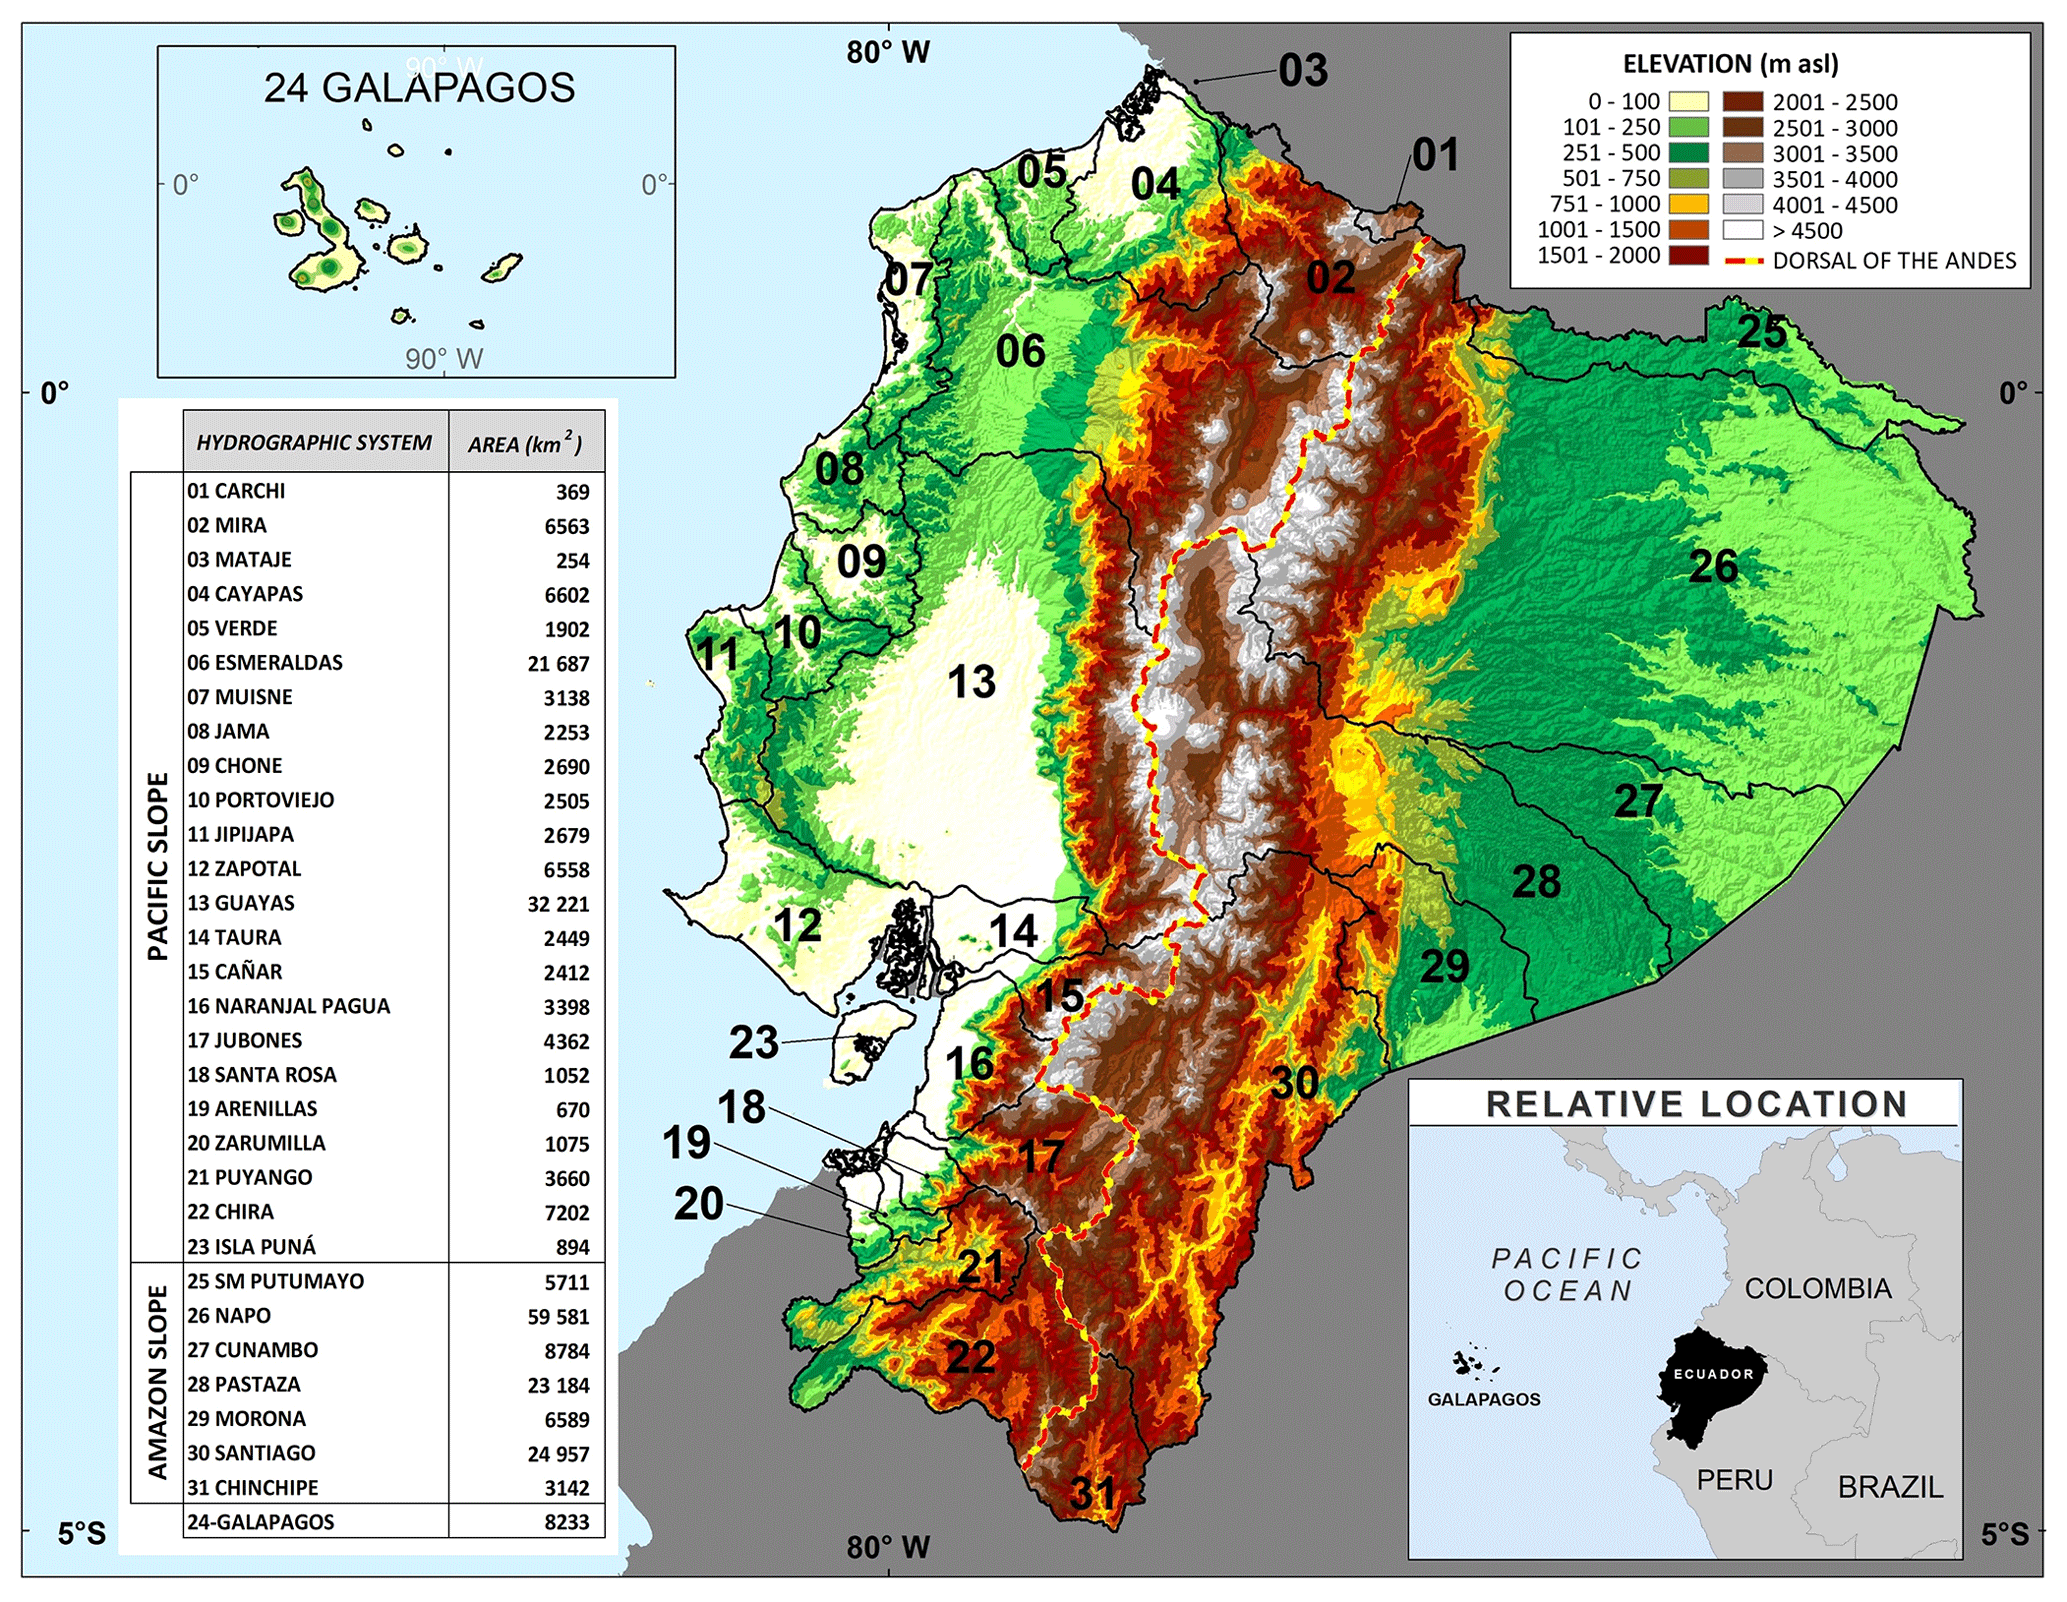
Figure 1Map of study area, defined as the totality of the territory of Ecuador. The continental territory is divided by the dorsal of the Andes into two main and distinctive zones: the Pacific slope (116 592 km2) and the Amazon slope (131 948 km2). Following the CNRH (2002) classification system, each of these two continental zones was further divided into 30 hydrographic systems: 23 for the Pacific slope and 7 for the Amazon slope. Regarding the insular territory, a unique hydrographic system was established encompassing all offshore islands, specifically the Galapagos Islands (8233 km2).
2.2 Data
Precipitation data were obtained from the Climate Hazards Group Infrared Precipitation with Stations (CHIRPS V2.0, https://www.chc.ucsb.edu/data/chirps/, last access: 19 April 2023). CHIRPS V2.0 is a quasi-global gridded rainfall time series dataset spanning 50∘ S–50∘ N from 1981 to the near present, with 0.05∘ resolution satellite imagery, in situ station data, and great applications for monitoring precipitation extremes (Funk et al., 2015). Precipitation layers derived from interpolations of data from climate gauge networks have proven to have some limitations (Deblauwe et al., 2016). CHIRPS V2.0 provides reliable precipitation observations with high accuracy and is particularly suitable for areas with few rainfall gauges (Paredes-Trejo et al., 2016; Beck et al., 2017), especially over montane (López-Bermeo et al., 2022) or arid regions (Paredes-Trejo et al., 2017; Ramoni-Perazzi et al., 2021) where extreme events may be rather common. According to Beck et al. (2017), in a global-scale evaluation of 23 precipitation datasets, CHIRPS V2.0 tends to perform the best in the hydrological modeling of tropical regions, specifically in Central and South America. As for Ecuador, Thielen et al. (2021a) successfully tested its applicability in the spatial–temporal analysis of hydroclimatological extreme events in one of the most important and extended basins of the Ecuadorian Pacific slope. For the present study, monthly data for the time series January 1981/December 2018 were obtained from 456 rasters. Monthly and annual mean, as well as some other basic precipitation parameters, were obtained through GIS applications.
2.3 Calculation of the Standardized Pluviometric Drought Index – SPDI
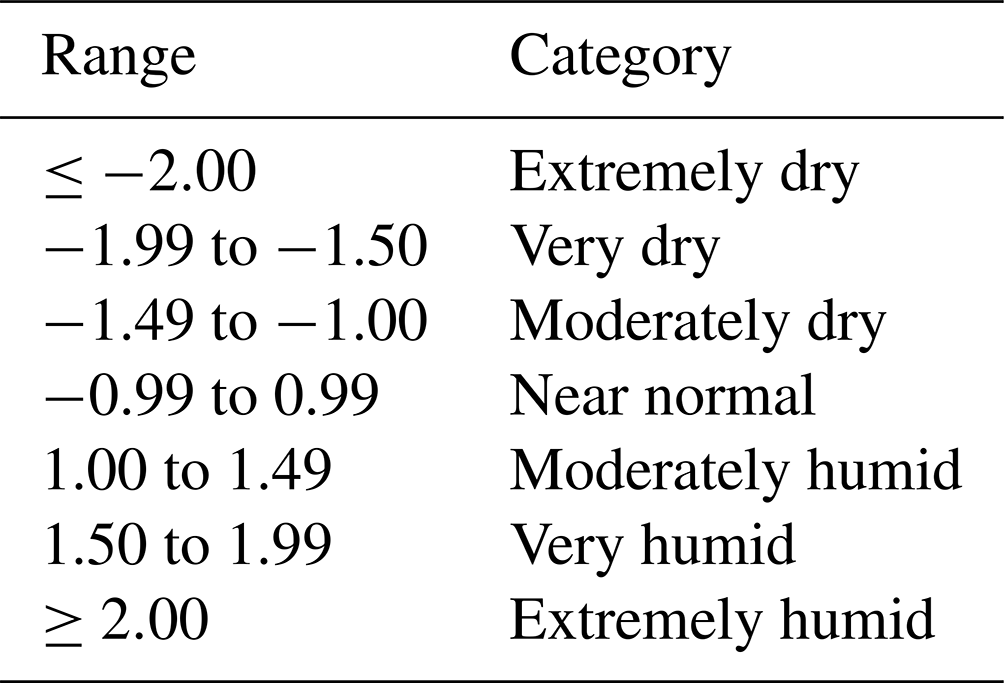
In this study, the precipitation spatial–temporal dynamics were analyzed by the Standardized Pluviometric Drought Index (SPDI) developed by Pita (2001). The SPDI is a monthly rainfall index that is based on the calculation of cumulative monthly rainfall anomalies, similar to the well-known Standardized Precipitation Index (SPI) of McKee et al. (1993), more specifically, the 12-month SPI. As in this index, values ranging from +1 to +1.5 and +1.5 to +2.0 are associated with moderately humid and very humid episodes, respectively, and values exceeding +2 are representative of extremely humid episodes. Moderately dry, very dry, and extremely dry spells are characterized by the same ranges with a negative sign (see Table 1). One of the main advantages of using the SPDI is that it reflects precisely the beginning and end of each extreme precipitation event and gives continuous information about its duration and intensity (Sanchez-Toribio et al., 2010). This ability makes it particularly suitable for characterizing long-lasting extreme events such as ENSO. Differently than the SPI, the SPDI does not require its application at multiple timescales to reflect the different durations of extreme events (Peña-Gallardo et al., 2016). The SPDI curves sometimes explain wet and dry periods not indicated by the SPI curves (Mega and Medjerab, 2021). The SPDI is calculated as follows:
-
First stage, Eq. (1)
where APi is the monthly precipitation anomaly, Pi is the monthly precipitation, and PMED is the median precipitation of the month for the series. As for this study, the series is 1981–2010.
-
Second stage, Eq. (2).
where APAi is the accumulated precipitation anomaly of the month.
-
Third stage, Eq. (3).
where is the average value of accumulated precipitation anomalies of all the months of the series, and σAPA is the standard deviation of accumulated precipitation anomalies of all the months of the series.
Table 1Categories resulting from SPDI estimation, adapted from McKee et al. (1993).
In short, the first stage estimates the rainfall anomaly for each of the months of the series. The second stage allows us to identify and calculate the accumulated rainfall anomalies from the first month in which there is a (positive or negative) rainfall anomaly until – as a result of the accumulations – an opposite accumulated anomaly is detected. Finally, in the third phase, these accumulated anomalies were standardized by converting them into z scores. Such standardization allows for obtaining universally valid and comparable values for different precipitation indexes, such as the SPI.
GIS applications allowed us to apply these equations to the 456 aforementioned CHIRPS V2.0 rasters and to generate SPDI products such as images of 0.05∘ resolution or monthly zonal values and at different space and/or time criteria. In the present study, monthly values of SPDI were estimated, based on the 1981–2010 climatology, for the three main zones: the Pacific slope, Galapagos, and Amazon slope, as well as for each of the 30 continental hydrological systems (see Fig. 1). Analysis of monthly SPDI dynamics was performed in the 2-year series comprising each extreme El Niño event. The significance of the statistical difference between monthly precipitation and/or SPDI values for any pair of extreme events, in each of the three zones, was identified by two-tailed paired t tests and an α=0.05, while similarities in the spatial–temporal dynamics of SPDI between the 30 hydrological systems were identified through cluster analysis (K-means clustering using Euclidean distance). Gong and Richman (1995) noted that nonhierarchical methods, such as the K-means algorithm, outperformed hierarchical methods (Ward's and the average linkage methods) when tested with precipitation data, as well as with SPI series (Santos et al., 2010).
2.4 Altitudinal dynamics of SPDI
As for continental Ecuador and through geoprocessing tools available from GIS software, results from SPDI estimations for each extreme El Niño event were combined with rasterized altitude data obtained from Shuttle Radar Topography Mission (SRTM) 1 Arc-Second Global (approx. 30 m resolution and freely available at https://earthexplorer.usgs.gov/, last access: 19 April 2023) and then resampled at CHIRPS resolution (i.e., 0.05∘). The frequency of pixels with SPDI ≥ 2.0 was determined along the entire altitudinal gradient for both the Pacific and the Amazon slope and for each extreme El Niño event. The significance of the statistical differences between any pair of such SPDI spatial dynamics was identified by two-tailed paired t tests and an α=0.05.
2.5 Seasonality index ()
The seasonality of precipitation in continental Ecuador was estimated by the Seasonality Index () (Walsh and Lawler, 1981), which quantifies the variability in monthly precipitation throughout the year. It is estimated by the sum of the absolute deviations of mean monthly precipitation from the overall monthly mean divided by the mean annual precipitation, as shown in Eq. (4):
where is the mean precipitation of month n, and is the mean annual rainfall. The can vary from 0 (if all months have equal precipitation amounts) to 1.83 (if all the rainfall occurs in a single month). Thus, the higher the , the more seasonal or concentrated the precipitation is. The relationship between the resulting seasonality index and the anomalies of precipitation (as SPDI) was evaluated at a basin level.
2.6 Definitions of extreme El Niño events: the mega El Niño and the coastal El Niño
The Oceanic Niño Index (ONI) is NOAA's primary indicator for monitoring ENSO. It is based on the monitoring of sea surface temperatures (SSTs) in the central Pacific Ocean and is used to identify the onset of an above-average SST threshold that persists for several months, encompassing both the beginning and end of an El Niño episode (Glantz and Ramirez, 2020). The ONI tracks the running 3-month average SSTs in the east-central tropical Pacific (5∘ S–5∘ N, 120–170∘ W), specifically in the Niño 3.4 region. El Niño occurs when the anomalies exceed +0.5 ∘C for at least 5 consecutive months. The threshold is further broken down into weak (with a +0.5 to +0.9 SST anomaly), moderate (+1.0 to +1.4), strong (+1.5 to +1.9), and very Strong (≥ 2.0) events. As for very strong or mega-El Niño events, the SST anomalies may be +2.0 ∘C for several months (Chen et al., 2017). According to these parameters, three mega-El Niño events were identified since 1951: 1982/83, with a mean ONI from October 1982 to February 1983 of 2.09 ∘C; 1997/98, with a mean ONI from September 1997 to February 1998 of 2.20 ∘C; and 2015/16, with a mean ONI from October 2015 to February 2016 of 2.22 ∘C. (data source http://www.cpc.ncep.noaa.gov/data/indices/oni.ascii.txt, last access: 19 April 2023). Additionally, regarding where the SST anomalies peak, El Niño events can be classified as eastern Pacific (EP), involving the easterly Niño 1+2 region, and as central Pacific (CP), mainly Niño 3.4 (Larkin and Harrison, 2005; Ashok et al., 2007; Kug et al., 2009). Although all aforementioned mega-El Niño events have been EP El Niño events, the 2015/16 event should be considered a mixed regime of both EP and CP El Niño (Santoso et al., 2017; L'heureux et al., 2017; Vicente-Serrano et al., 2017; Wang et al., 2020), mainly due to an erratic response of SST peaking (Xie and Fang, 2019). As for the present study, the three mega-El Niño events are referred to as follows: EP83, for the EP El Niño event from 1982/83; EP98, for the EP El Niño from 1997/98; and MIX16, for the mixed CP/EP El Niño event from 2015/16.
Besides tropical Pacific El Niño events (EP or CP), the study area is also affected by a more local type of El Niño event: the coastal El Niño, a very rare and unique event which develops differently from either CP or EP El Niño events. To distinguish the coastal El Niño from the warm ENSO phase, ENFEN (2012) operationally defines the coastal El Niño based on the seasonal Niño 1+2 SST anomaly as having a 3-month-running mean Niño 1+2 SST above 0.4 ∘C for 3 or more consecutive months. A strong coastal El Niño developed off the coast of Peru from January to April 2017 (ENFEN, 2017; WMO, 2017a, b; Takahashi and Martínez, 2017; Ramírez and Briones, 2017; Garreaud, 2018) (hereafter COA17) and has been the strongest on record, and it developed rather fast and unexpectedly from the warming of SST specific to the far eastern tropical Pacific.
3.1 Pacific slope
3.1.1 Precipitation
Historical mean annual precipitation for the Pacific slope resulted in 1348 mm (series 1981–2010). About 70 % of annual precipitation occurs during the first 4 months of the year (January–April). According to Walsh and Lawler (1981), precipitation here is markedly seasonal with a long drier season ( = 0.96). As appreciated in Fig. 2a, mean monthly precipitation during the first year (Year 1) of any extreme El Niño event does not differ significantly from that of the historical mean (p < 0.05). It is during the second year (Year 2) of the El Niño event, specifically the first half, when precipitation significantly differs from that of historical values. For example, annual precipitation for Year 2 of mega-El Niño events EP83 (i.e., 1983) and EP98 (i.e., 1998) resulted in a significantly higher level (2483 mm, p = 0.003 and 2590 mm, p = 0.022, respectively) than the historical mean. Although precipitation values between mega-El Niño events EP83 and EP98 were not significantly different (p = 0.194), values for Year 1 were significantly drier in EP83 than in EP98 (1234 vs. 1609 mm, p = 0.042). On the other hand, during the other mega-El Niño event, MIX16, neither Year 1 nor Year 2 presented annual precipitation significantly different than those of the historical mean (1368 mm, p = 0.868 and 1299 mm, p = 0.666, respectively). As for the coastal El Niño, COA17, annual precipitation for the year 2017 was not significantly different from the historical mean (2072 mm, p = 0.097).
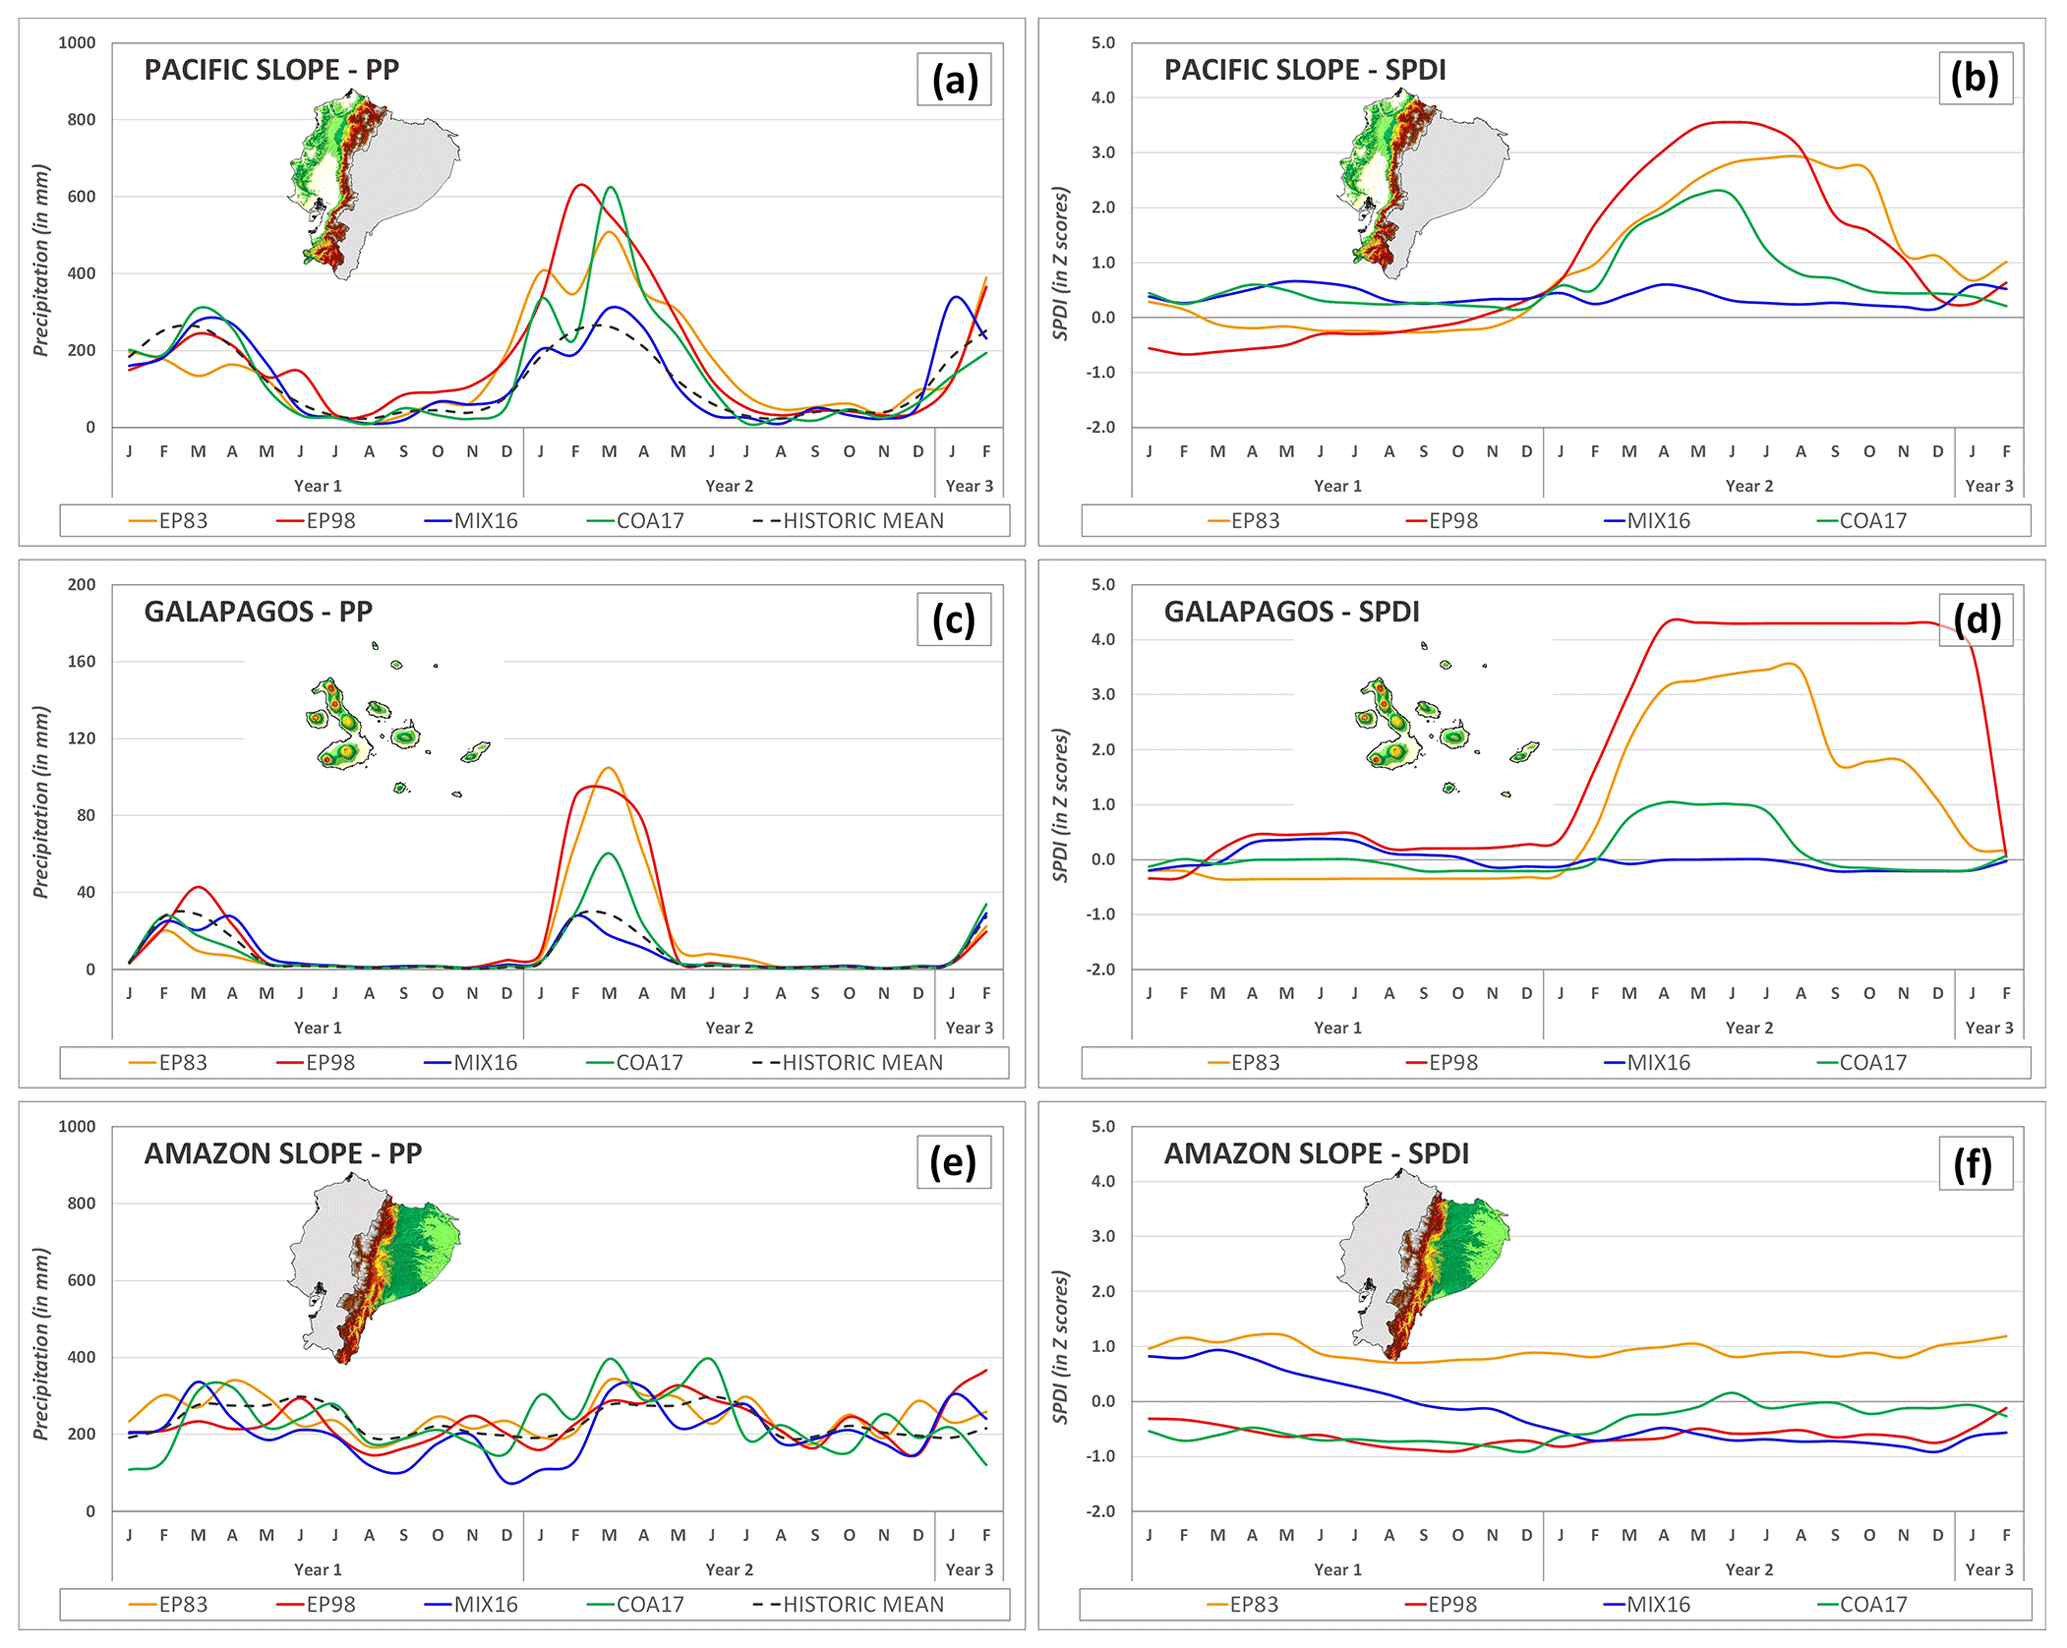
Figure 2(a) The mean monthly precipitation (in mm) for the main study zones (the Pacific slope, Galapagos, and Amazon slope, correspondingly) for each extreme El Niño event (EP83, EP98, MIX16, and COA17) and Year 1 and Year 2. (b) The resulting mean Standardized Pluviometric Drought Index – SPDI (in Z scores) for each extreme El Niño event (EP83, EP98, MIX16, and COA17) and Year 1 and Year 2.
3.1.2 SPDI
The resulting SPDI temporal dynamics between the different extreme El Niño events are given in Fig. 2b. As a result of precipitation dynamics during Year 1 (Fig. 2a), neither mega-El Niño events nor coastal El Niño events showed SPDI values different than the “near-normal” condition (−0.99–0.99). On the other hand, the Pacific slope experienced “extremely humid” conditions (SPDI ≥ 2.00) during Year 2 of EP83 and EP98, with mean SPDI values not significantly different: 2.02 and 2.19, respectively (p = 0.431). As for EP83, precipitation anomalies started in March 1983 (SPDI = 1.64) and lasted for 10 months until December of that year (SPDI = 1.12). For 7 consecutive months (April–October), EP83 presented a sustained extremely humid condition (SPDI ≥ 2.00). In 1983, 54.9 % of continental Ecuador was affected by this extreme precipitation anomaly, from which 93.8 % comprised the Pacific slope (Fig. 3a). In this easterly slope, about 90 % of such extreme precipitation occurred at altitudes of 1900 m or less and over half at less than 200 m a.s.l. (Fig. 4).
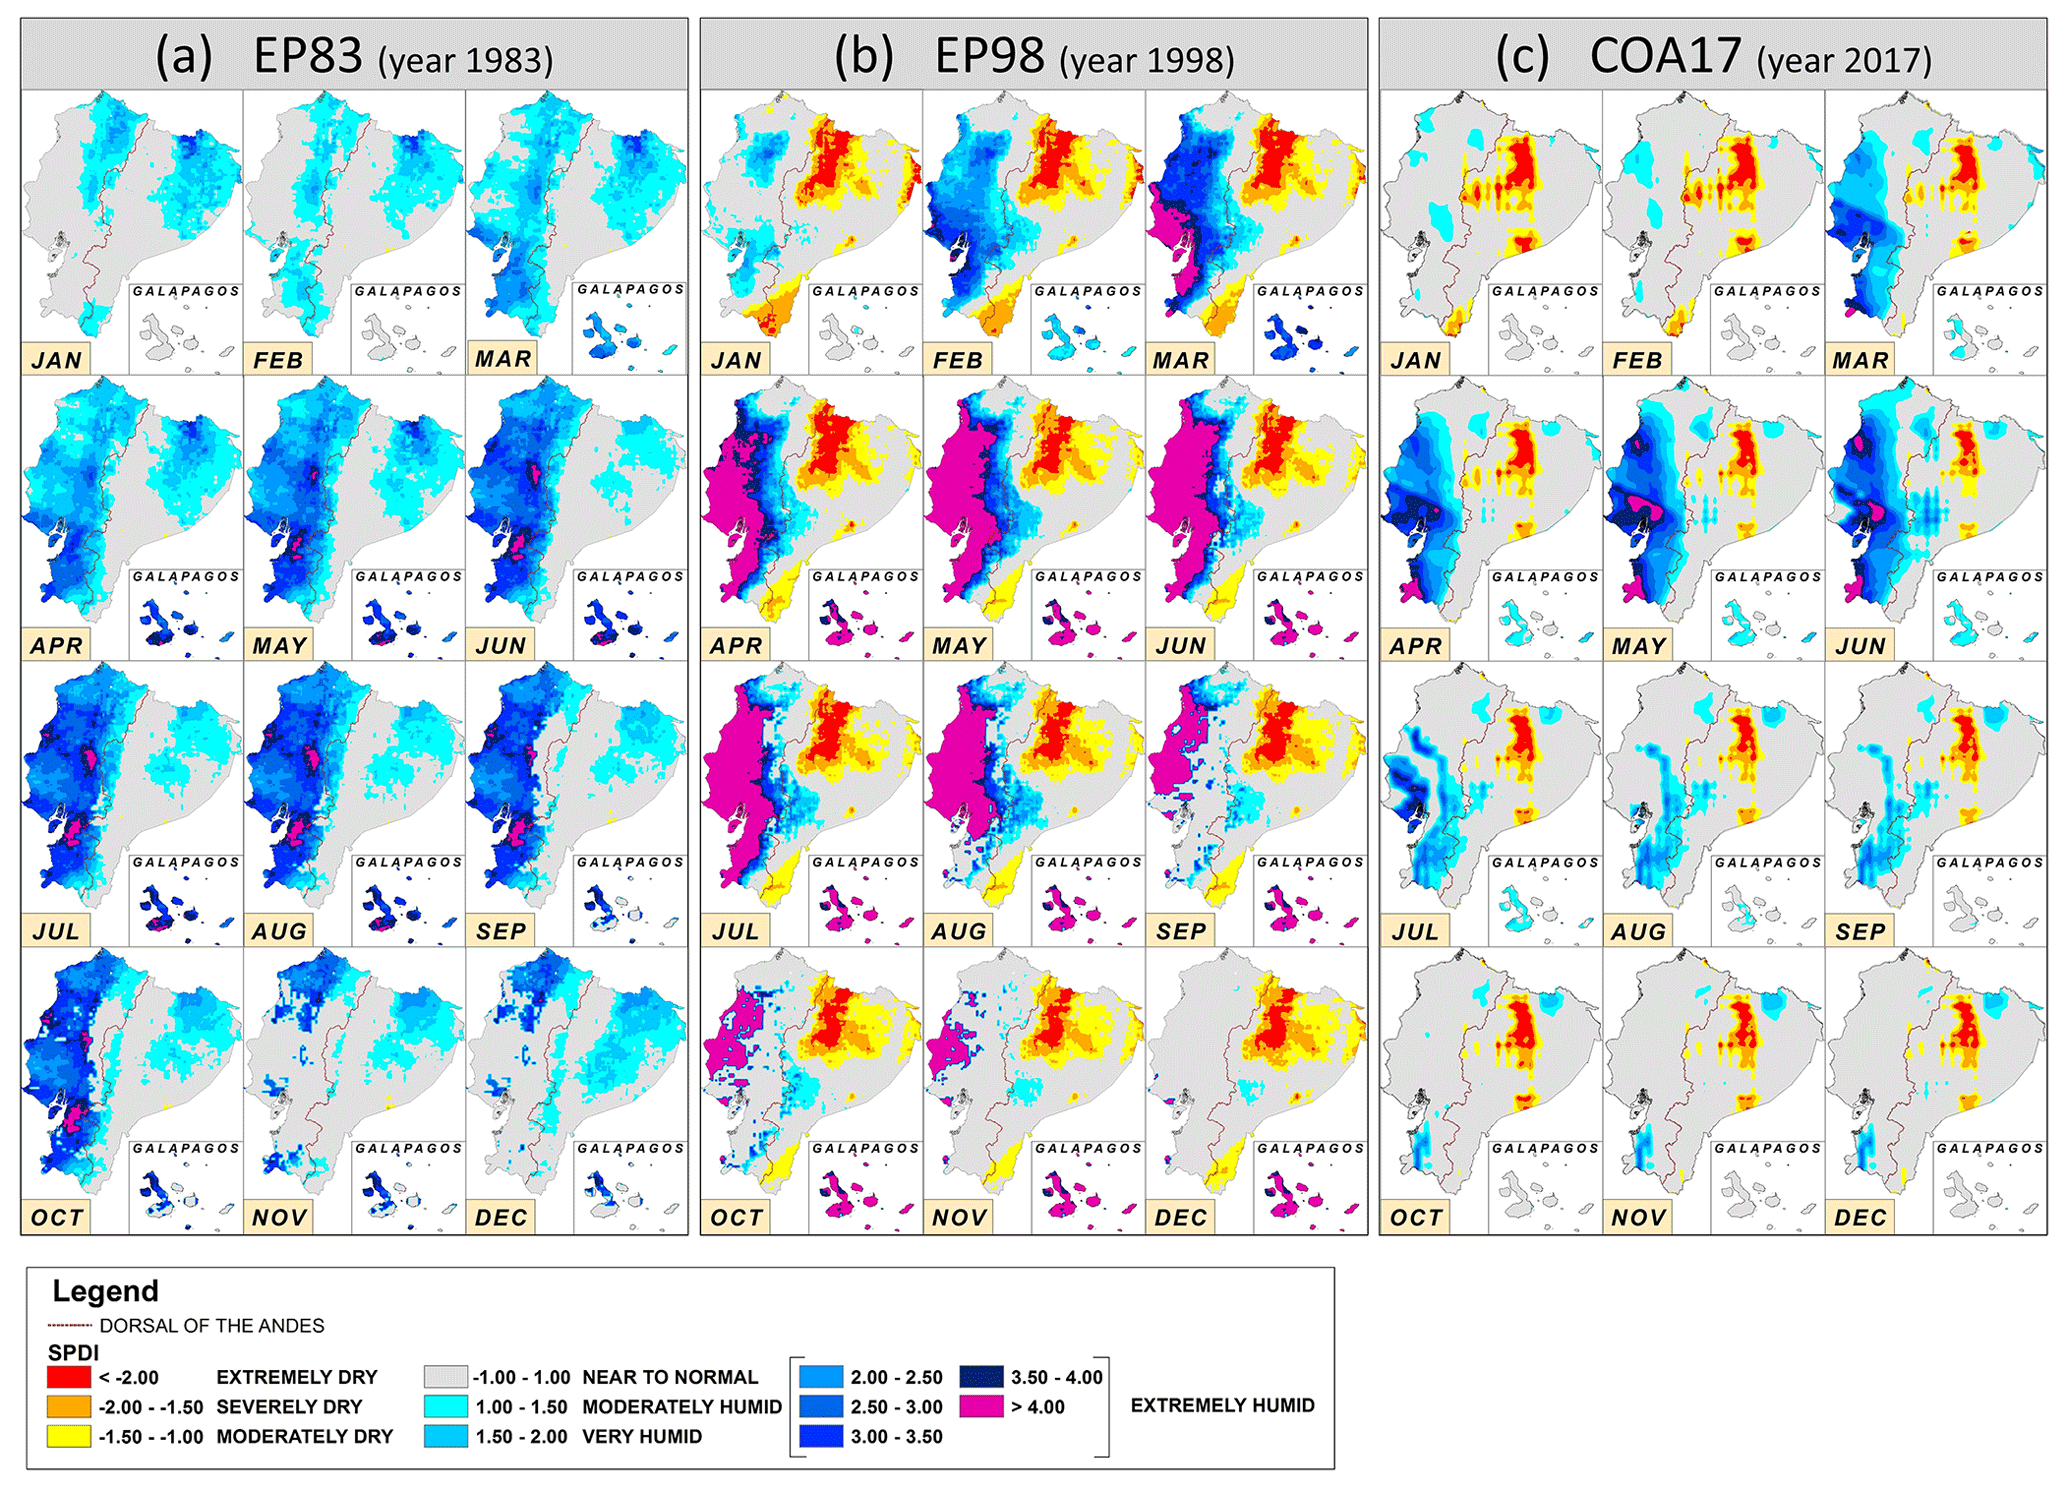
Figure 3Spatial dynamics of Standardized Pluviometric Drought Index (SPDI) of Year 2 for the eastern Pacific mega-El Niño events EP83 (year 1983) (a) and EP98 (year 1998) (b) and the coastal El Niño COA17 (year 2017) (c). SPDI categories are adapted from McKee et al. (1993).
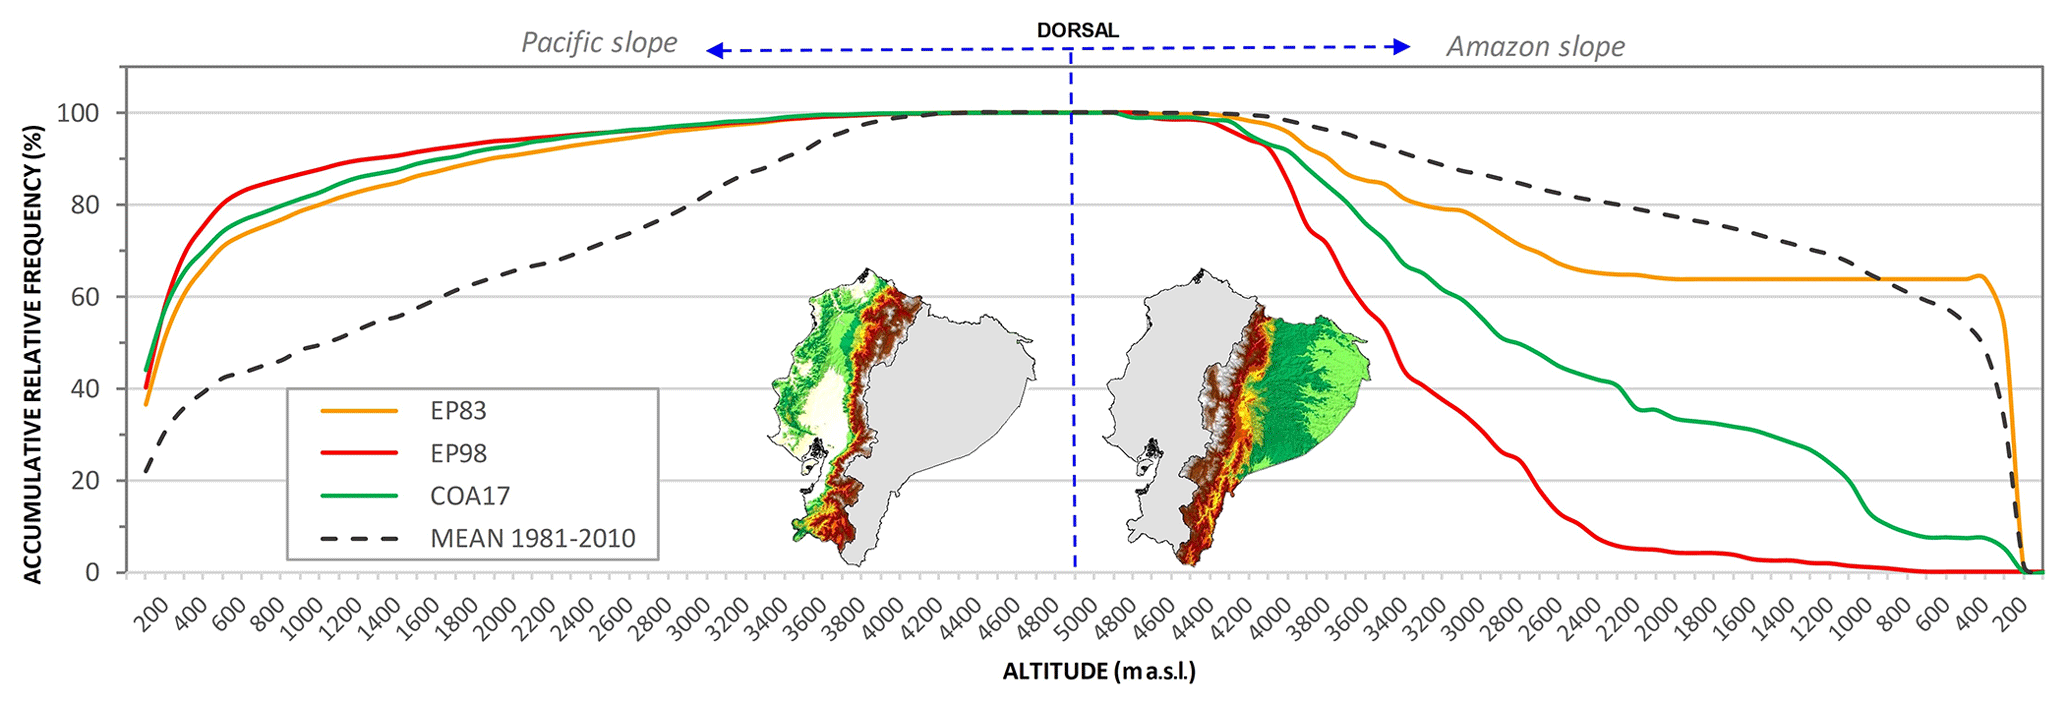
Figure 4Accumulative relative frequency (%) of extremely humid conditions (SPDI ≥ 2.0) for Year 2 of mega-El Niño events EP83 and EP98 and the coastal El Niño COA17 regarding the altitude (m a.s.l.) of continental Ecuador, as well as the historic mean frequency (series 1981–2010).
Even though precipitation anomalies during EP98 also lasted 10 months (February–November 1998), extremely humid conditions (SPDI ≥ 2.00) for this mega El Niño were reduced to 6 months (March–August), reaching a maximum SPDI value of 3.56 by June 1998 (Fig. 2b). It is also evident from this figure that extremely wet SPDI values were obtained for the Pacific slope earlier in the EP98 than in EP83 mega El Niño. About 75.6 % of continental Ecuador was affected by precipitation anomalies of SPDI ≥ 2.00 during Year 2 of EP98. As in the previous mega Niño, the area mostly comprised the Pacific slope (98.8 % of the total area, Fig. 3b). On this slope, during 1998, 90 % of extreme precipitation occurred at altitudes of 1300 m or lower and about 50 % of such precipitation at coastal areas with elevations less than 150 m a.s.l. (Fig. 4).
Precipitation during mega El Niño MIX16 resulted in SPDI dynamics for Year 2 (i.e., 2016) being extremely different (p < 0.0001) from Year 1 and Year 2 of both EP83 and EP98. During this mixed mega El Niño, the SPDI value for 2015 tended to be similar to that of 2016 (0.41 and 0.33, respectively; p = 0.051) for a resulting “near-normal” precipitation condition for the entire duration of this extreme El Niño event (Fig. 2b).
During 2017, coastal El Niño COA17 generated a precipitation anomaly lasting 5 months (March–July), with an SPDI maximum of 2.23 for about 2 months (Fig. 2b). SPDI dynamics during 2017 were significantly different from that of Year 2 of EP83 and EP98 (p < 0.05), affecting only 5.7 % of continental Ecuador with extreme precipitation anomalies of SPDI ≥ 2.00. Still, as in the two mega-El Niño EP events, over 88.7 % of this area comprised the Pacific slope (Fig. 3c). Extreme precipitation anomalies in COA17 reached the breakpoint of 90 % at an altitude of about the same as EP83, 1700 m a.s.l. As in EP98, over 50 % of all extreme anomalies occurred at elevations under 150 m (Fig. 4).
3.2 Galapagos
3.2.1 Precipitation
Historical annual mean precipitation of the Galapagos resulted in 89 mm (series 1981–2010), much drier than that of the Pacific slope (Fig. 2a). About 82 % of annual precipitation occurs from February to April, reflecting an extreme seasonality ( = 1.28; Walsh and Lawler, 1981). As in the Pacific slope, precipitation in Galapagos during Year 1, for any of the extreme El Niño events considered, did not differ significantly (p > 0.05) from that of the historical mean. On the other hand, during Year 2 of mega-El Niño events EP83 and EP98 (1983 and 1998, respectively), rainfall about tripled that of the monthly mean value for the 30-year series 1981–2010 (267 and 284 mm, respectively), an increase that tends to be significantly higher than the historical mean (p ≈ 0.06). Annual precipitation among mega-El Niño events EP83 and EP98, as for Year 1 and Year 2, did not differ significantly (p = 0.1390 and 0.616, respectively). As for MIX16, this mega-El Niño event did not generate precipitation significantly different from those of the historical mean, neither in 2015 (96 mm, p = 0.260) nor in 2016 (74 mm, p = 0.641). Likewise, the coastal El Niño of 2017 (COA17) did not generate precipitation any different from that of the historical mean (131 mm, p = 0.205) for the Galapagos Islands.
3.2.2 SPDI
As for Year 1 in Galapagos, all of the mega-El Niño events generated an SPDI value near normal (−0.99–0.99), a situation that changed very significantly in Year 2 of both EP83 and EP98 when the mean condition turned to extremely humid: 2.13 in 1983 and 3.64 in 1998 (see Fig. 2b). From this figure, as well as from Fig. 3a and b, it is evident for Year 2 that an extremely significant difference (p < 0.0001) in the temporal dynamics of SPDI values between EP83 and EP98 mega-El Niño events exists. For instance, in 1983, the extremely humid condition (SPDI ≥ 2.0) was reached abruptly in March and lasted until August that year when it reached a maximum SPDI value of 3.46. From April to August 1983, 99 % of the Galapagos was affected by an SPDI mean value of 3.33. As for 1998, the overall impact of excessive rainfall lasted 12 months. It started in February when precipitation generated a very humid condition (SPDI = 1.64), and for the next 11 months an extremely humid condition persisted with SPDI values ranging from 3.01 to 4.31, affecting more than 98 % of the Galapagos surface. Mega-El Niño EP98 effects lasted until the first months of 1999 after a sudden drop in SPDI values: from 3.82 in January to 0.06 in February. No significant effects on SPDI value dynamics were associated with the mega-El Niño MIX16 event. As for the coastal El Niño of 2017, from April to June, precipitation generated an SPDI value reaching 1.01 to 1.03, a value that barely denotes a moderately wet condition (see Figs. 2b and 3c). SPDI monthly value dynamics of 1983 in the Galapagos were not significantly different from that in the Pacific slope (p = 0.606) (see Fig. 2b). On the other hand, in 1998, a very significant difference (p = 0.003) in SPDI dynamics was observed between these two contrasting geographical regions. Such a significant difference was also observed in the resulting SPDI from the coastal El Niño of 2017 between the Galapagos and continental Ecuador.
3.3 Amazon slope
3.3.1 Precipitation
Historical annual mean precipitation (series 1981–2010) for the Amazon slope was 2824 mm, more than double that of the Pacific slope (1348 mm). The monthly precipitation from March to July is about 10 %, that is 50 % of the annual total amount. As for the rest of the year, that is from August to February, precipitation discretely drops to around 7 % per month (see Fig. 2a). This results in a seasonality index of 0.26 which, according to Walsh and Lawler (1981), is referred to as places where precipitation is spread throughout the year but with a definite wetter season. As for precipitation in Year 1, both EP98 and MIX16 showed values significantly drier (p < 0.05) than the historical mean (2538 and 2269 mm, respectively). While for Year 2, none of the extreme El Niño events, EP83, EP98, MIX16, or COA17, showed a significate value different from the historical (p > 0.05). MIX16 was significantly drier (2519 mm, p < 0.05) than EP83, EP98, and COA17 (2978, 2801, and 3134 mm, respectively).
3.3.2 SPDI
Neither the three mega-El Niño events nor the coastal El Niño of 2017 generated SPDI values different than near normal (−0.99–0.99, Fig. 2b) in the Amazon slope. Mean SPDI values for Year 2 of EP98, MIX16, and COA17 were significantly drier (−0.64, −0.69, and −0.19, respectively; p < 0.0001) than EP83 (0.89). No significant difference (p > 0.05) was observed between SPDI values of Year 1 and Year 2 of either EP83 (0.92 and 0.89) or EP98 (−0.64 and −0.64). On the other hand, a very high significant difference was detected between SPDI values for the years 2015 and 2016 (0.33 and −0.69, respectively; p < 0.0001). SPDI values for Year 2 of EP83 was significantly higher than those of EP98, MIX16, and COA17 (p < 0.0001, see Fig. 2b). As for areas of continental Ecuador with extreme precipitation anomalies of SPDI ≥ 2.00, around 6.2 % occurred in the Amazon slope during Year 2 of EP83, 1.2 % during EP98, and 11.3 % during COA17 (Fig. 3a, b, and c). No such extreme events were observed during MIX16 for this slope during 2016. About 90 % of all extreme precipitation during EP98 occurred at rather high altitudes (2500–4000 m a.s.l.), while for COA17 such extreme events encompassed a much wider altitudinal gradient (1000–4000 m a.s.l.) (Fig. 4). Extreme precipitation anomalies were most spatially restricted during EP83 for the Amazon slope: 64 % comprised altitudes between 300 and 400 m a.s.l. and the remaining 39 % from elevations > 2500 m. In the lowlands of the Amazon slope, the presence of precipitation anomalies observed in Fig. 3 (positive as in EP83 or negative as in EP98 and COA17) was preexistent long before the beginning of any of these extreme El Niño events, thus unrelated to their dynamics (CAF, 2000).
3.4 Hydrological systems
3.4.1 Eastern Pacific El Niño event EP83
From cluster analysis of 1983 (i.e., Year 2) of this mega Niño's SPDI monthly data, four distinctive groups of hydrological systems are evident (Table 2). The first group conformed by 11 basins (Cluster 1: Naranjal Pagua, Isla Puná, Jubones, Taura, Guayas, Cañar, Zapotal, Puyango, Santa Rosa, Arenillas, and Zarumilla), all belonging to the Pacific slope, having an extremely high collective monthly mean SPDI from March to October of 2.89 (Table 2a), with a mean affection of 89.0 % of the area during that same time (Table 2b). A second group of five Pacific slope basins (Cluster 2: Jipijapa, Chone, Portoviejo, Muisne, and Jama) also showed an 8-month consecutive March–October pulse of an extremely high collective SPDI mean (2.47) (Table 2a). But, differently than Cluster 1, in Cluster 2 the mean SPDI of the first 3 months of the March–October pulse was significantly lower (p < 0.05). As a result, basins from Cluster 2 have less extended affection areas during the trimester March–May (69.2 %) (Table 2b). Another difference in the SPDI response during mega El Niño EP83 among these two clusters of basins is the higher values reached in February in Cluster 1 compared to Cluster 2. No significant difference (p > 0.05) was observed between these two clusters during the remaining months of 1983 (January, November–December).
Table 2Standardized Precipitation Drought Index (SPDI) temporal and spatial dynamics at the different hydrographic systems for 1983 (Year 2) of the mega-El Niño event EP83. Cluster analysis (K-means clustering using Euclidean distance) was performed on both rows and columns and with the statistical tool ClustVis (Metsalu and Vilo, 2015).
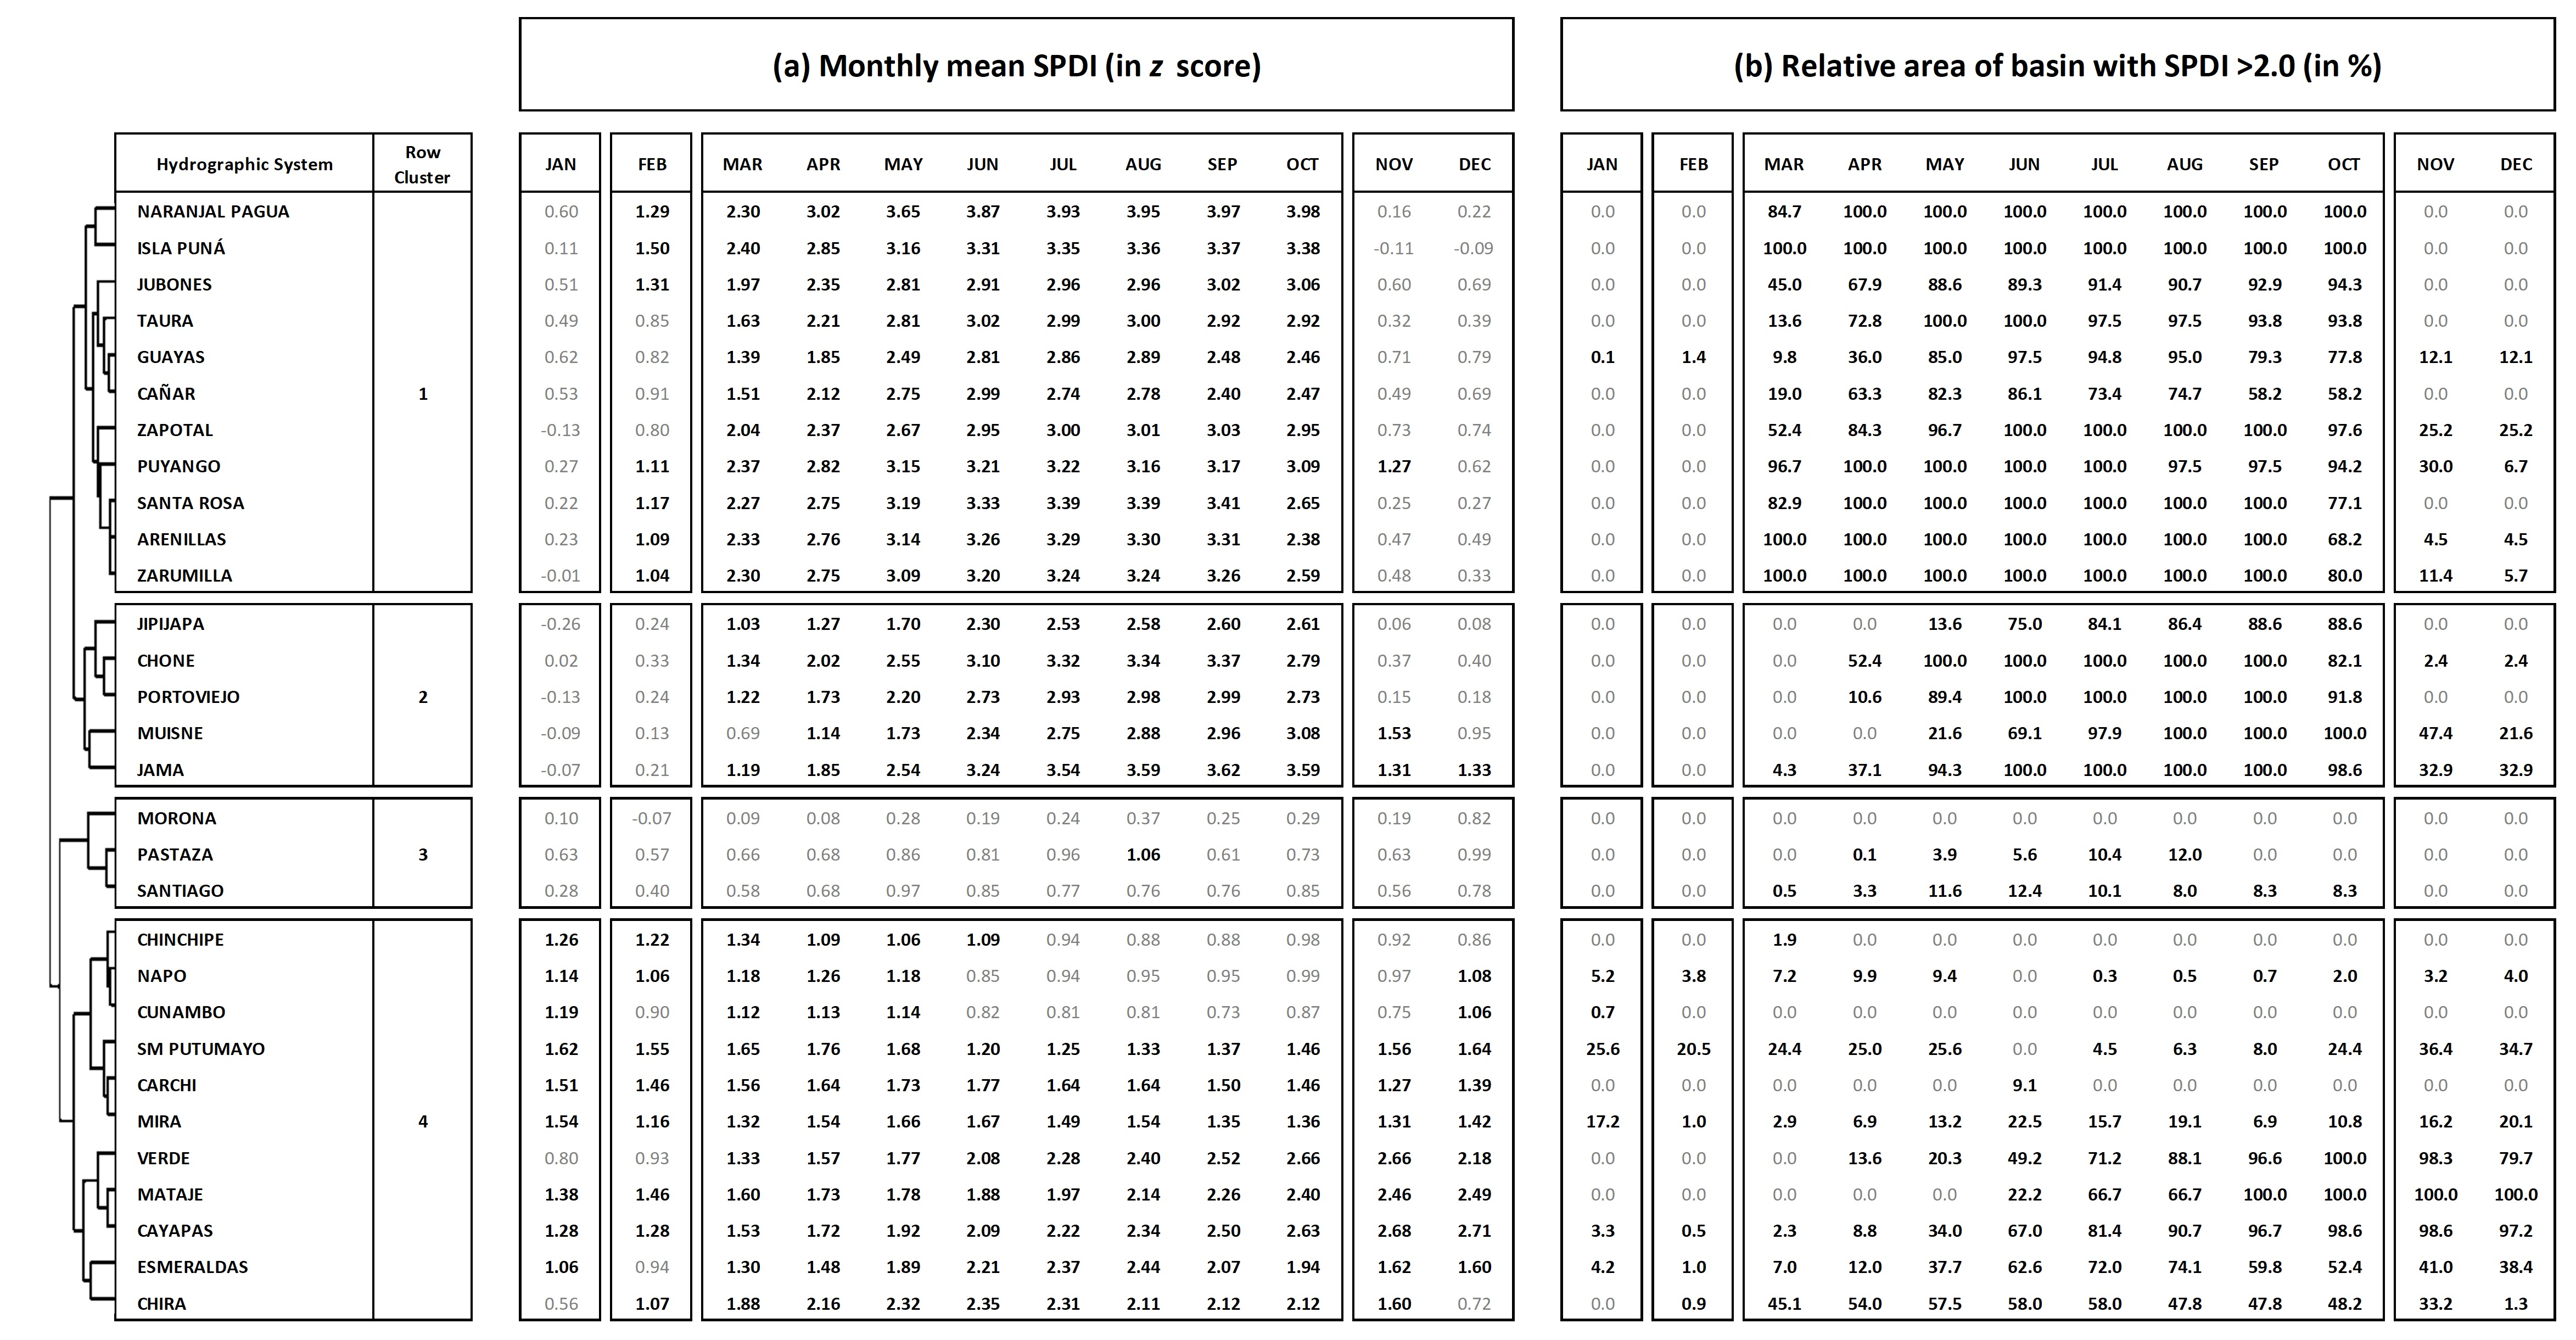
Two additional clusters of hydrological systems resulted from the spatial–temporal analysis of 1983 SPDI monthly data. Cluster 3 is a group of three southerly Amazon slope basins (Morona, Pastaza, and Santiago), where none of them showed significant precipitation anomalies (i.e., SPDI > 1.0) (Table 2a). Cluster 4, on the other side, showed SPDI dynamics that generated moderately to very humid conditions throughout the entire year and were not confined only to the March–October pulse observed for Clusters 1 and 2. Cluster 4 comprises 11 basins from both slopes: four from the Amazon slope (Chinchipe, Napo, Cunambo, and Sm Putumayo), six from the northernmost section of the Pacific slope (Carchi, Mira, Verde, Mataje, Cayapa, and Esmeraldas), and one from the southernmost basin of the Pacific slope (Chira, see Table 2a). In this cluster, the most extreme precipitation anomalies as well as the most extended area of affection occurred from June until October and even until the end of 1983. This was mainly due to the SPDI dynamics of the Pacific slope basins (Table 2b).
3.4.2 Eastern Pacific El Niño event EP98
During 1998, that is Year 2 of the EP98 mega-El Niño event, two distinctive groups of hydrological systems showed prolonged and extremely high precipitation anomalies (Table 3). The first large group, conformed by 14 Pacific slope basins (Cluster 1: Jubones, Esmeraldas, Puyango, Jama, Muisne, Guayas, Naranjal Pagua, Taura, Cañar, Zapotal, Arenillas, Santa Rosa, Zarumilla, and Isla Puná) with a January–July mean monthly SPDI of 3.68, was affected by a sustained extremely humid condition for 6 to 7 consecutive months (February–July/August). For some basins of this first cluster, the effects of such extremely wet conditions were prolonged up to October (Table 3a). Spatially, besides the northern basin of Esmeraldas (with only 39.7 %), the rest of the basins of this first cluster were affected by extreme precipitation anomalies in about 92.7 % of their areas (Table 3b). A second smaller group of Pacific slope basins (Cluster 2: Portoviejo, Chone, and Jipijapa), presented a January–July mean monthly SPDI condition as extremely humid as Cluster 1 (3.62 vs. 3.68). But, differently than Cluster 1, this group of three basins steadily prolonged their extremely humid condition until November, for a total span of 10 months, resulting in a collective SPDI mean value significantly higher than for any cluster and for any other extreme El Niño event (Table 3a), steadily affecting, fairly homogeneously, about 93 % of the basins areas (Table 3b).
Table 3Standardized Precipitation Drought Index (SPDI) temporal and spatial dynamics at the different hydrographic systems for 1998 (Year 2) of the mega-El Niño event EP98. Cluster analysis (K-means clustering using Euclidean distance) was performed on both rows and columns and with the statistical tool ClustVis (Metsalu and Vilo, 2015).
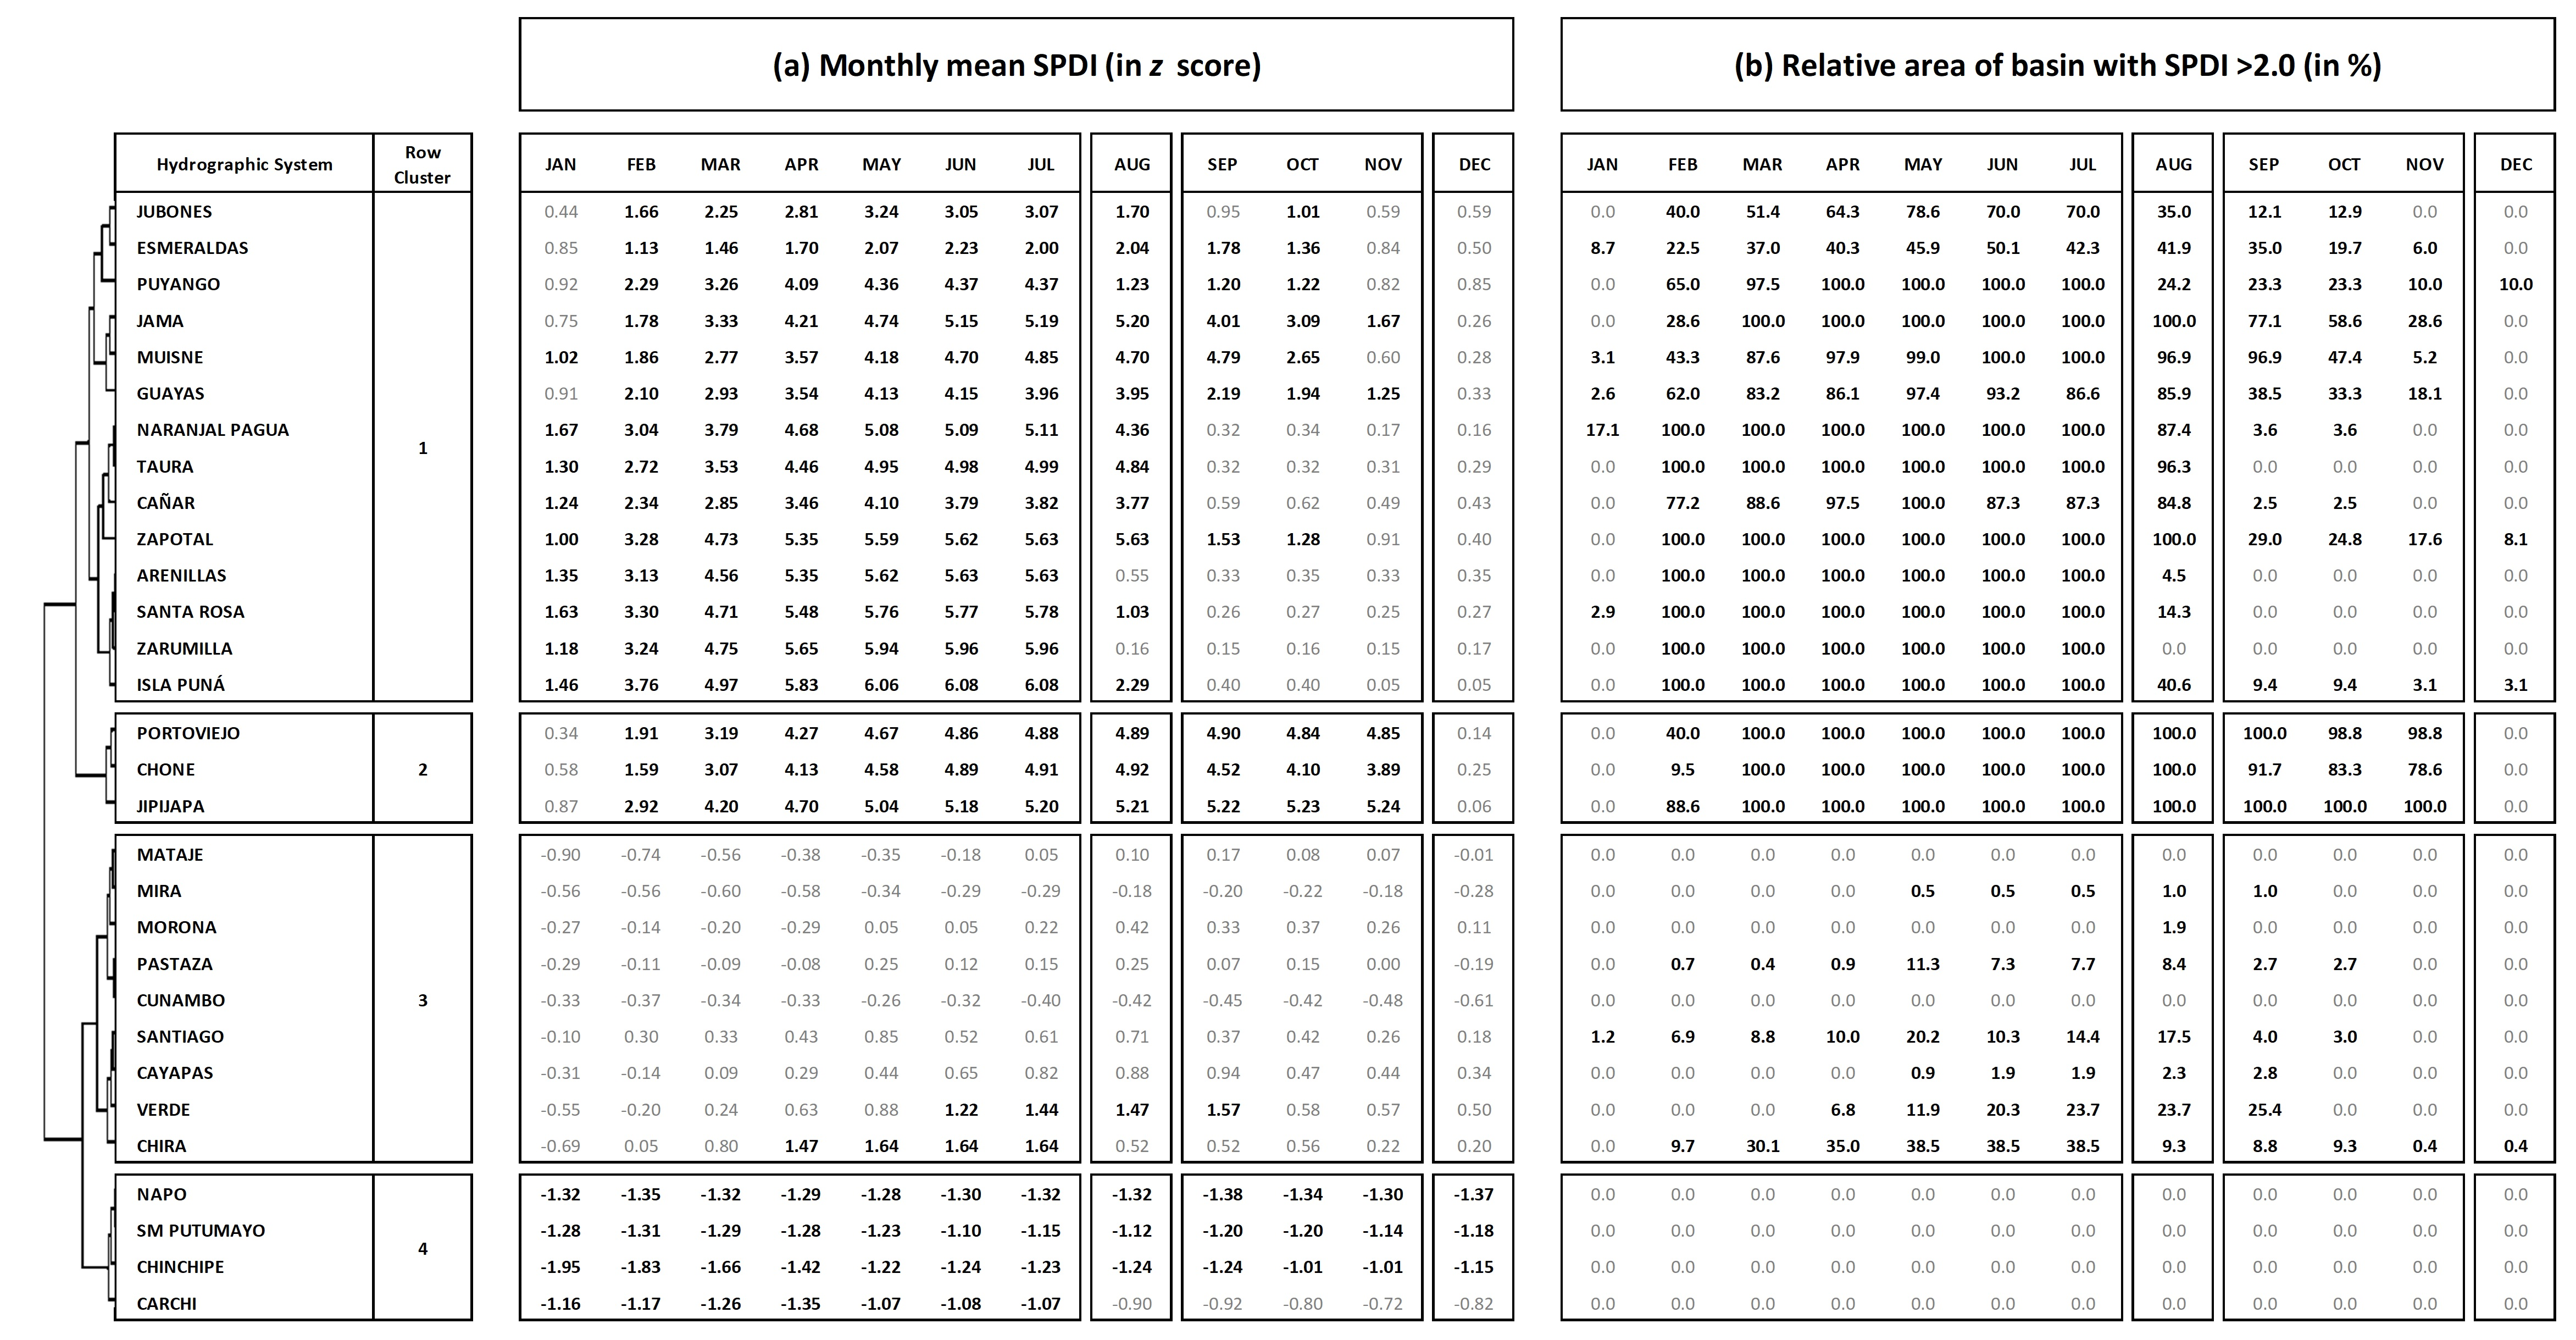
On the other hand, the mega-El Niño event EP98 did not appear to have generated humid precipitation anomalies for the rest of the continental Ecuadorian basins. Cluster 3, for example, a nine-basin group during 1998 from both the Amazon and Pacific slopes (Mataje, Mira, Morona, Pastaza, Cunambo, Santiago, Cayapa, Verde, and Chira), showed a collective sustained SPDI mean value about normal (> −1, < 1; Table 3a). Moreover, during this mega-El Niño event, Cluster 4, a four-basin group (Napo, Sm Putumayo, Chinchipe, and Carchi), showed a moderately dry mean precipitation condition (SPDI = −1.23, Table 3a).
3.4.3 Mixed El Niño event MIX16
As for the effects of mega-El Niño event MIX16 on the hydrological systems' precipitation, overall monthly SPDI values for 2016 were well defined as near normal (−0.99–0.99). During this event, only five systems (Jama, Chone, Arenillas, Puyango, and Zarumilla) showed a short-lasting (2 months, March–April) and discrete increase in SPDI values, barely reaching a moderately humid condition, with a collective SPDI mean of 1.12. While the Pacific slope's systems tended to have positive SPDI values during 2016, the Amazon slope's systems tended to have rather negative ones. As for Chinchipe, this southernmost Amazon Basin showed an overall 2006 SPDI value of −1.40, a moderately dry condition.
3.4.4 Coastal El Niño event COA17
During the coastal El Niño of 2017, a group of 15 Pacific slope basins (Cluster 1: Zarumilla, Taura, Chone, Jama, Naranjal Pagua, Cañar, Guayas, Jubones, Jipijapa, Portoviejo, Zapotal, Isla Puná, Chira, Puyango, and Santa Rosa) showed an extremely humid condition from March to June (mean SPDI = 2.63) (Table 4a). During these 4 months, the coastal El Niño event affected 78.4 % of the area of the basins of Cluster 1. By July, the affected area was 47.0 % and then lowered to 13.3 % for the rest of the year (Table 4b). Precipitation anomalies of varying intensities extended until September for some of these basins of Cluster 1. In the case of Santa Rosa, the anomalies lasted until December.
Table 4Standardized Precipitation Drought Index (SPDI) temporal and spatial dynamics at the different hydrographic systems for the year 2017 of the coastal El Niño (COA17). Cluster analysis (K-means clustering using Euclidean distance) was performed on both rows and columns and with the statistical tool ClustVis (Metsalu and Vilo, 2015).

From cluster analysis of SPDI dynamics during COA17, two other groups of basins from both Pacific and Amazon slopes were identified: Cluster 2 (Verde, Cayapas, Mataje, Esmeraldas, Muisne, Sm Putumayo, Mira, Cunambo, Carchi, and Santiago) and Cluster 3 (Morona, Pastaza, Napo, and Chinchipe) (Table 4a). While Cluster 2 mean SPDI values tended to be positive and Cluster 3 negative, none showed precipitation dynamics that resulted, spatially and temporarily, in a mean condition different than normal. The last cluster, conformed exclusively by rather small and southernmost Pacific slope basins (Cluster 4: Arenillas), showed a unique SPDI dynamic when, from March to December, it reached a sustained extremely humid condition (mean SPDI = 2.8), spatially affecting 98.9 % of the basin's area from March to June and 66.2 % from July to December (Table 4a and b).
In this study, the application of the SPDI was most appropriate when analyzing and comparing temporal and spatial dynamics of precipitation extremes among different extreme El Niño events. Likewise, CHIRPS V2.0 was confirmed to be a valuable source of monthly precipitation data for monitoring extreme events and contributed to the understanding of the spatial and temporal variability of monthly rainfall in Ecuador, as demonstrated for other extended South American regions (Paredes-Trejo et al., 2016; Baez-Villanueva et al., 2018; Rivera et al., 2019; Thielen et al., 2020, 2021b).
For any of the considered regions (the Pacific slope, Galapagos, and Amazon slope) and for any of the extreme El Niño events, EP83, EP98, MIX16, and COA17, precipitation during the first year (Year 1: 1982, 1997, 2015, and 2016, correspondingly) was not significantly different from that of the historical annual mean (series 1981–2010) (Fig. 2). On the other hand, for both the Pacific slope and the Galapagos, it is during the second year of EP83, EP98, and COA17 (Year 2: 1983, 1998, and 2017, correspondingly), and more specifically during the first half of these years, coincidentally encompassing the rainy season, when most precipitation extremes occur. According to Cai et al. (2020), the rainfall impacts on the coast of Ecuador and Peru occur mainly in the rainy months of February, March, and April when regional SSTs are seasonally at their highest, and the threshold for deep convection is more likely to be reached. As for Year 2 of MIX16 (2016), there was no evidence of any significant precipitation anomaly generated on Ecuadorian territory by the occurrences of the mixed (EP–CP) type of extreme El Niño.
Regarding overall SPDI dynamics (series 1981–2020) at both the Pacific slope and the Galapagos, 85.7 % of the months showed any degree of positive precipitation anomaly (SPDI > 1.0), and 100 % of the months showed an extremely wet condition (SPDI ≥ 2.0), which were associated with Year 2 of an extreme El Niño event (Fig. 2). Such extreme rainfall conditions were concomitant, with a lag of 0 months, to the presence of warm SST temperatures in the easternmost Niño region (i.e., Niño 1+2) and for both the EP El Niños (Thielen et al., 2015; de Guenni et al., 2017; Morán-Tejeda et al., 2016; Quishpe-Vásquez et al., 2019) and the coastal El Niño (Thielen et al., 2021a; Rollenbeck et al., 2022). Through transferring heat from the ocean to the atmosphere, this anomalous warming elevates air temperatures in the coastal region, triggering localized atmospheric convection and heavy rainfall (Cai et al., 2020). Based on SSTs at Niño 1+2 dynamics, Thielen et al. (2016) predicted that precipitation anomalies in the Ecuadorian coast generated by the mixed-type El Niño of 2015/16 would not be as significant as those from the El Niños of 1982/83 and 1997/98, a forecast that was fully corroborated in the present research. This lack of response in coastal and insular precipitation is most certainly true for CP El Niño events, as well as for the mixed (EP–CP) El Niño type, such as MIX16. As for the Amazon slope, even though the number of months showing any degree of positive precipitation anomaly (SPDI > 1.0) was double that of the coastal and insular zones, less than 4 % of the months occurred during an extreme El Niño event, from which none reached the extremely wet condition (SPDI ≥ 2.0). According to Kiefer and Karamperidou (2019), during EP and COA warm events, the coastal region is prone to extreme precipitation associated with convective bursts originating from the Pacific, while during a warm CP El Niño, as well as during a cold La Niña, moisture originates from the Atlantic and may reach the area as broader-scale less-intense precipitation.
At the Pacific slope, there are no significant differences (p > 0.05) in SPDI values resulting from EP83 and EP98 when considered on annual bases. For both of these eastern Pacific mega-El Niño events, precipitation anomalies lasted 10 months, reaching mean SPDI values of 2.09 for 1983 and 2.39 for 1998 (Tables 2 and 3). Differences between these two events become extremely significant when comparing the first 6 months, precipitation anomalies during EP98 occurred sooner and reached faster maximum SPDI values during the first 6 months of 1998 than during 1983, or any other extreme El Niño event. SPDI dynamics for the first 6 months of Year 2 between EP83 and COA17 tended to be similar (p > 0.01) (Tables 2 and 3).
Regarding how far the extreme El Niño events' influence extends in the Pacific slope, the present study identified three of the most relevant facts:
-
For any extreme El Niño event, over 50 % of all extreme anomalies occurred at elevations under 150 m (Fig. 4). This represents over 40 % of the Ecuadorian coastal surface and involves the most strategic zone for Ecuador, since it comprises almost all lowland agriculture and aquaculture, which after petroleum oil production represent the main activities generating export products. This zone also holds, besides a high density of rural population as well as numerous small- to medium-sized towns, the largest city in Ecuador: Guayaquil, with a little more than 2.5 million inhabitants.
-
The difference between extreme El Niño events was more significant (p < 0.05) when considering how far into the Andes the precipitation anomalies are perceived. For instance, during the long-lasting EP98, 80 % of all extreme anomalies (SPDI ≥ 2.0) occurred at elevations up to 500 m, while for the relatively less-lasting extreme events, such as COA17 and EP83, this value was reached at altitudes much higher: at 800 m and 1000 m, respectively (Fig. 4).
-
The difference between the three extreme El Niño events disappears at around 3000 m a.s.l. when reaching the accumulation of 97 % of all extreme anomalies (SPDI ≥ 2.0). At an altitude of 4000 m, all extreme El Niño events reach the mean (series 1981–2010), which is a little before all reach 100 % at the maximum height of 4300 m a.s.l. (Fig. 4).
Several authors have also investigated the ENSO influence extends inside continental Ecuador. Bendix and Bendix (2006) and Kiefer and Karamperidou (2019), for instance, showed that positive rainfall anomalies during ENSO mainly affect the coastal plain of Ecuador to the western slope of the Andes at altitudes < 1800 m, while Pineda et al. (2013) observed ENSO signals at locations as high as 2700 m. Regarding the presence of ENSO signals at high altitudes in the Pacific slope, relief plays a twofold role in the control of ocean–atmospheric forcing: it can modulate the atmospheric circulation, leading to a dissipation of the signal, or it can favor meteorological processes, leading to an enhancement of orographic precipitation (Pineda et al., 2013). There is no easy answer to the difference between the results from such studies regarding how far the extreme El Niño events' influence extends on the Pacific slope.
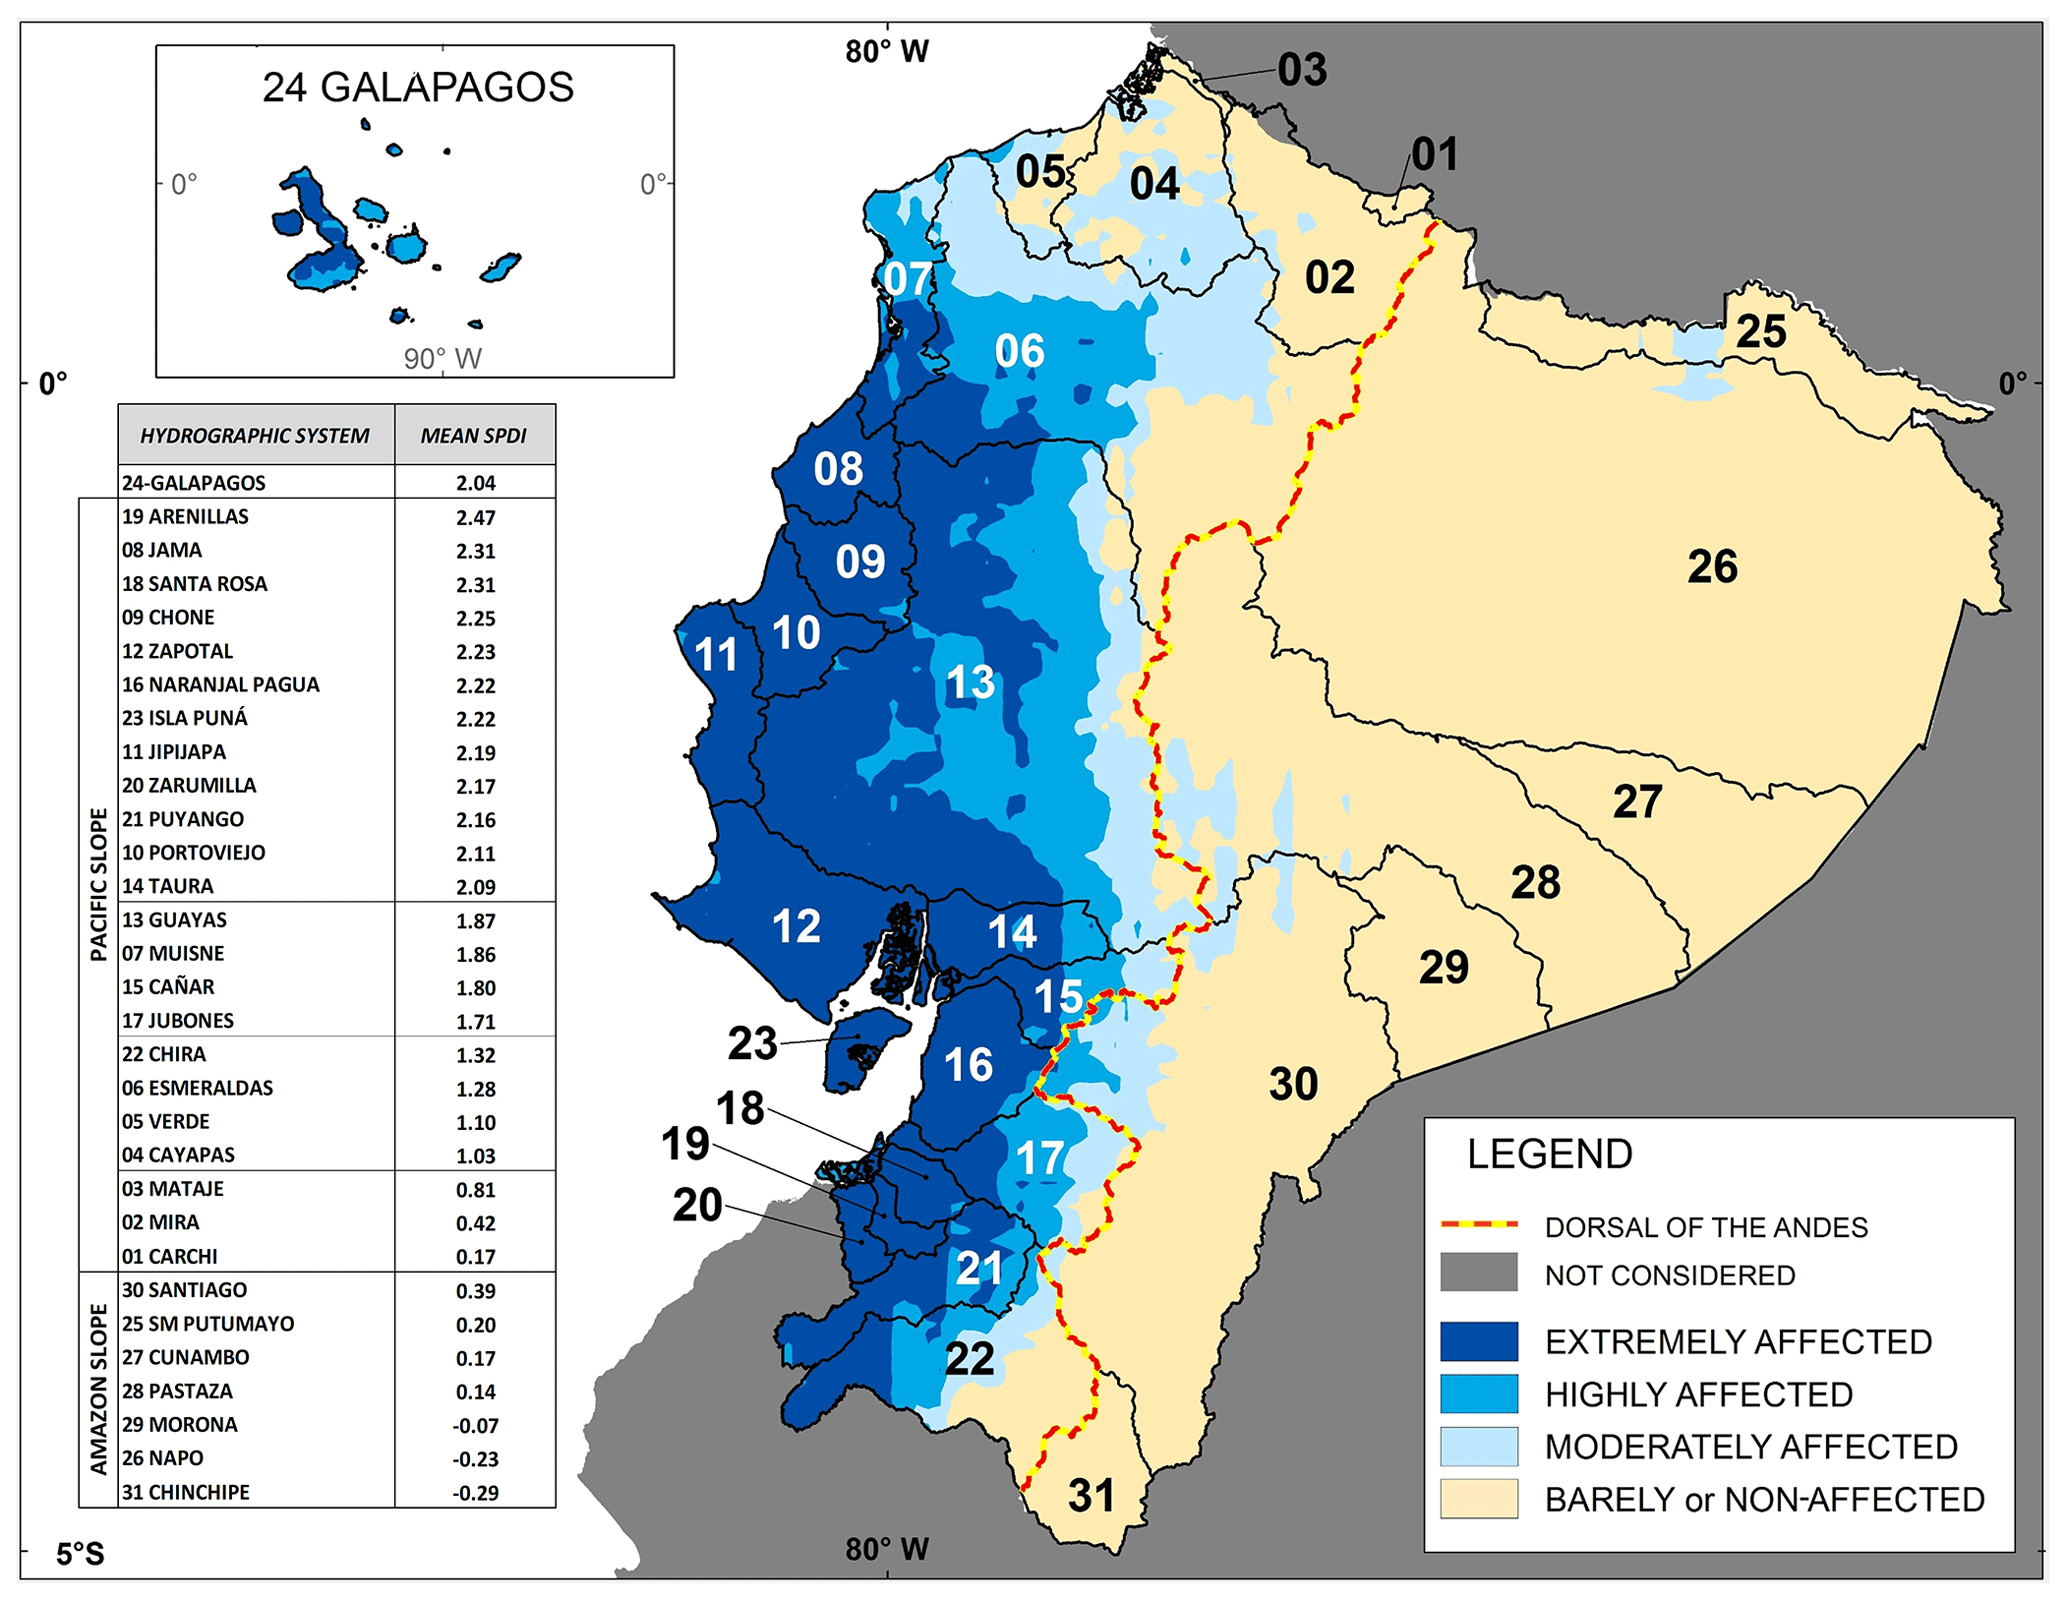
Figure 5Potential affectation from precipitation anomalies generated by extreme El Niño events, as determined from mean annual (Year 2) SPDI resulting from the mega-El Niño events EP83 and EP98 and the coastal El Niño COA17.
Preexisting studies have limited their analysis to specific areas of Ecuador or may have confronted severe data limitations due to discontinuities in space and in time. Such limitations were overcome in the present study. Figure 5 is the spatial representation, for the entire territory of Ecuador, of the mean annual (Year 2) precipitation anomalies (as SPDI) generated by the most important extreme El Niño events since 1981, that is the mega El Niños EP83 and EP98 and the coastal El Niño COA17. From this figure, it is evident that the ENSO signal is variable not only along the lowlands of the Pacific slope but also along the highlands and the dorsal of the Andes. From north to south, the first half of the 1030 km of the dominant orographic barrier of the dorsal of the Andes does not show any effect or signal from ENSO – that is, no precipitation anomalies are generated by extreme El Niño events at the highest sections of the hydrographic systems Mira, Esmeraldas, and part of Guayas. From this point on, and for 320 km along the dorsal of the Andes, the highest sections of the systems Guayas, Cañar, Naranjal Pagua, and Jubones showed moderate to high precipitation anomalies (SPDI 1.0–1.5) during an extreme El Niño event. But then again, in the last 165 km of the dorsal of the Andes, which corresponds to the highest sections of the southernmost hydrographic system, CHIRA, any ENSO signal disappeared. At this point, there is no clear pattern regarding extreme El Niño events and the generation of precipitation anomalies in the highest sections of the Andean Cordillera. In any case, the ENSO signal was observed at mean altitudes ranging from 3200 to 3900 m. Other physical determinants such as the distance to the coastline and the steepness of the Cordillera may play an important role in determining the degree of the ENSO signal. Coincidentally, the aforementioned 320 km transect that did reach precipitation anomalies was located at a distance from the seashore of 120 km or less, also showing a dominant steep relief (Figs. 1 and 5).
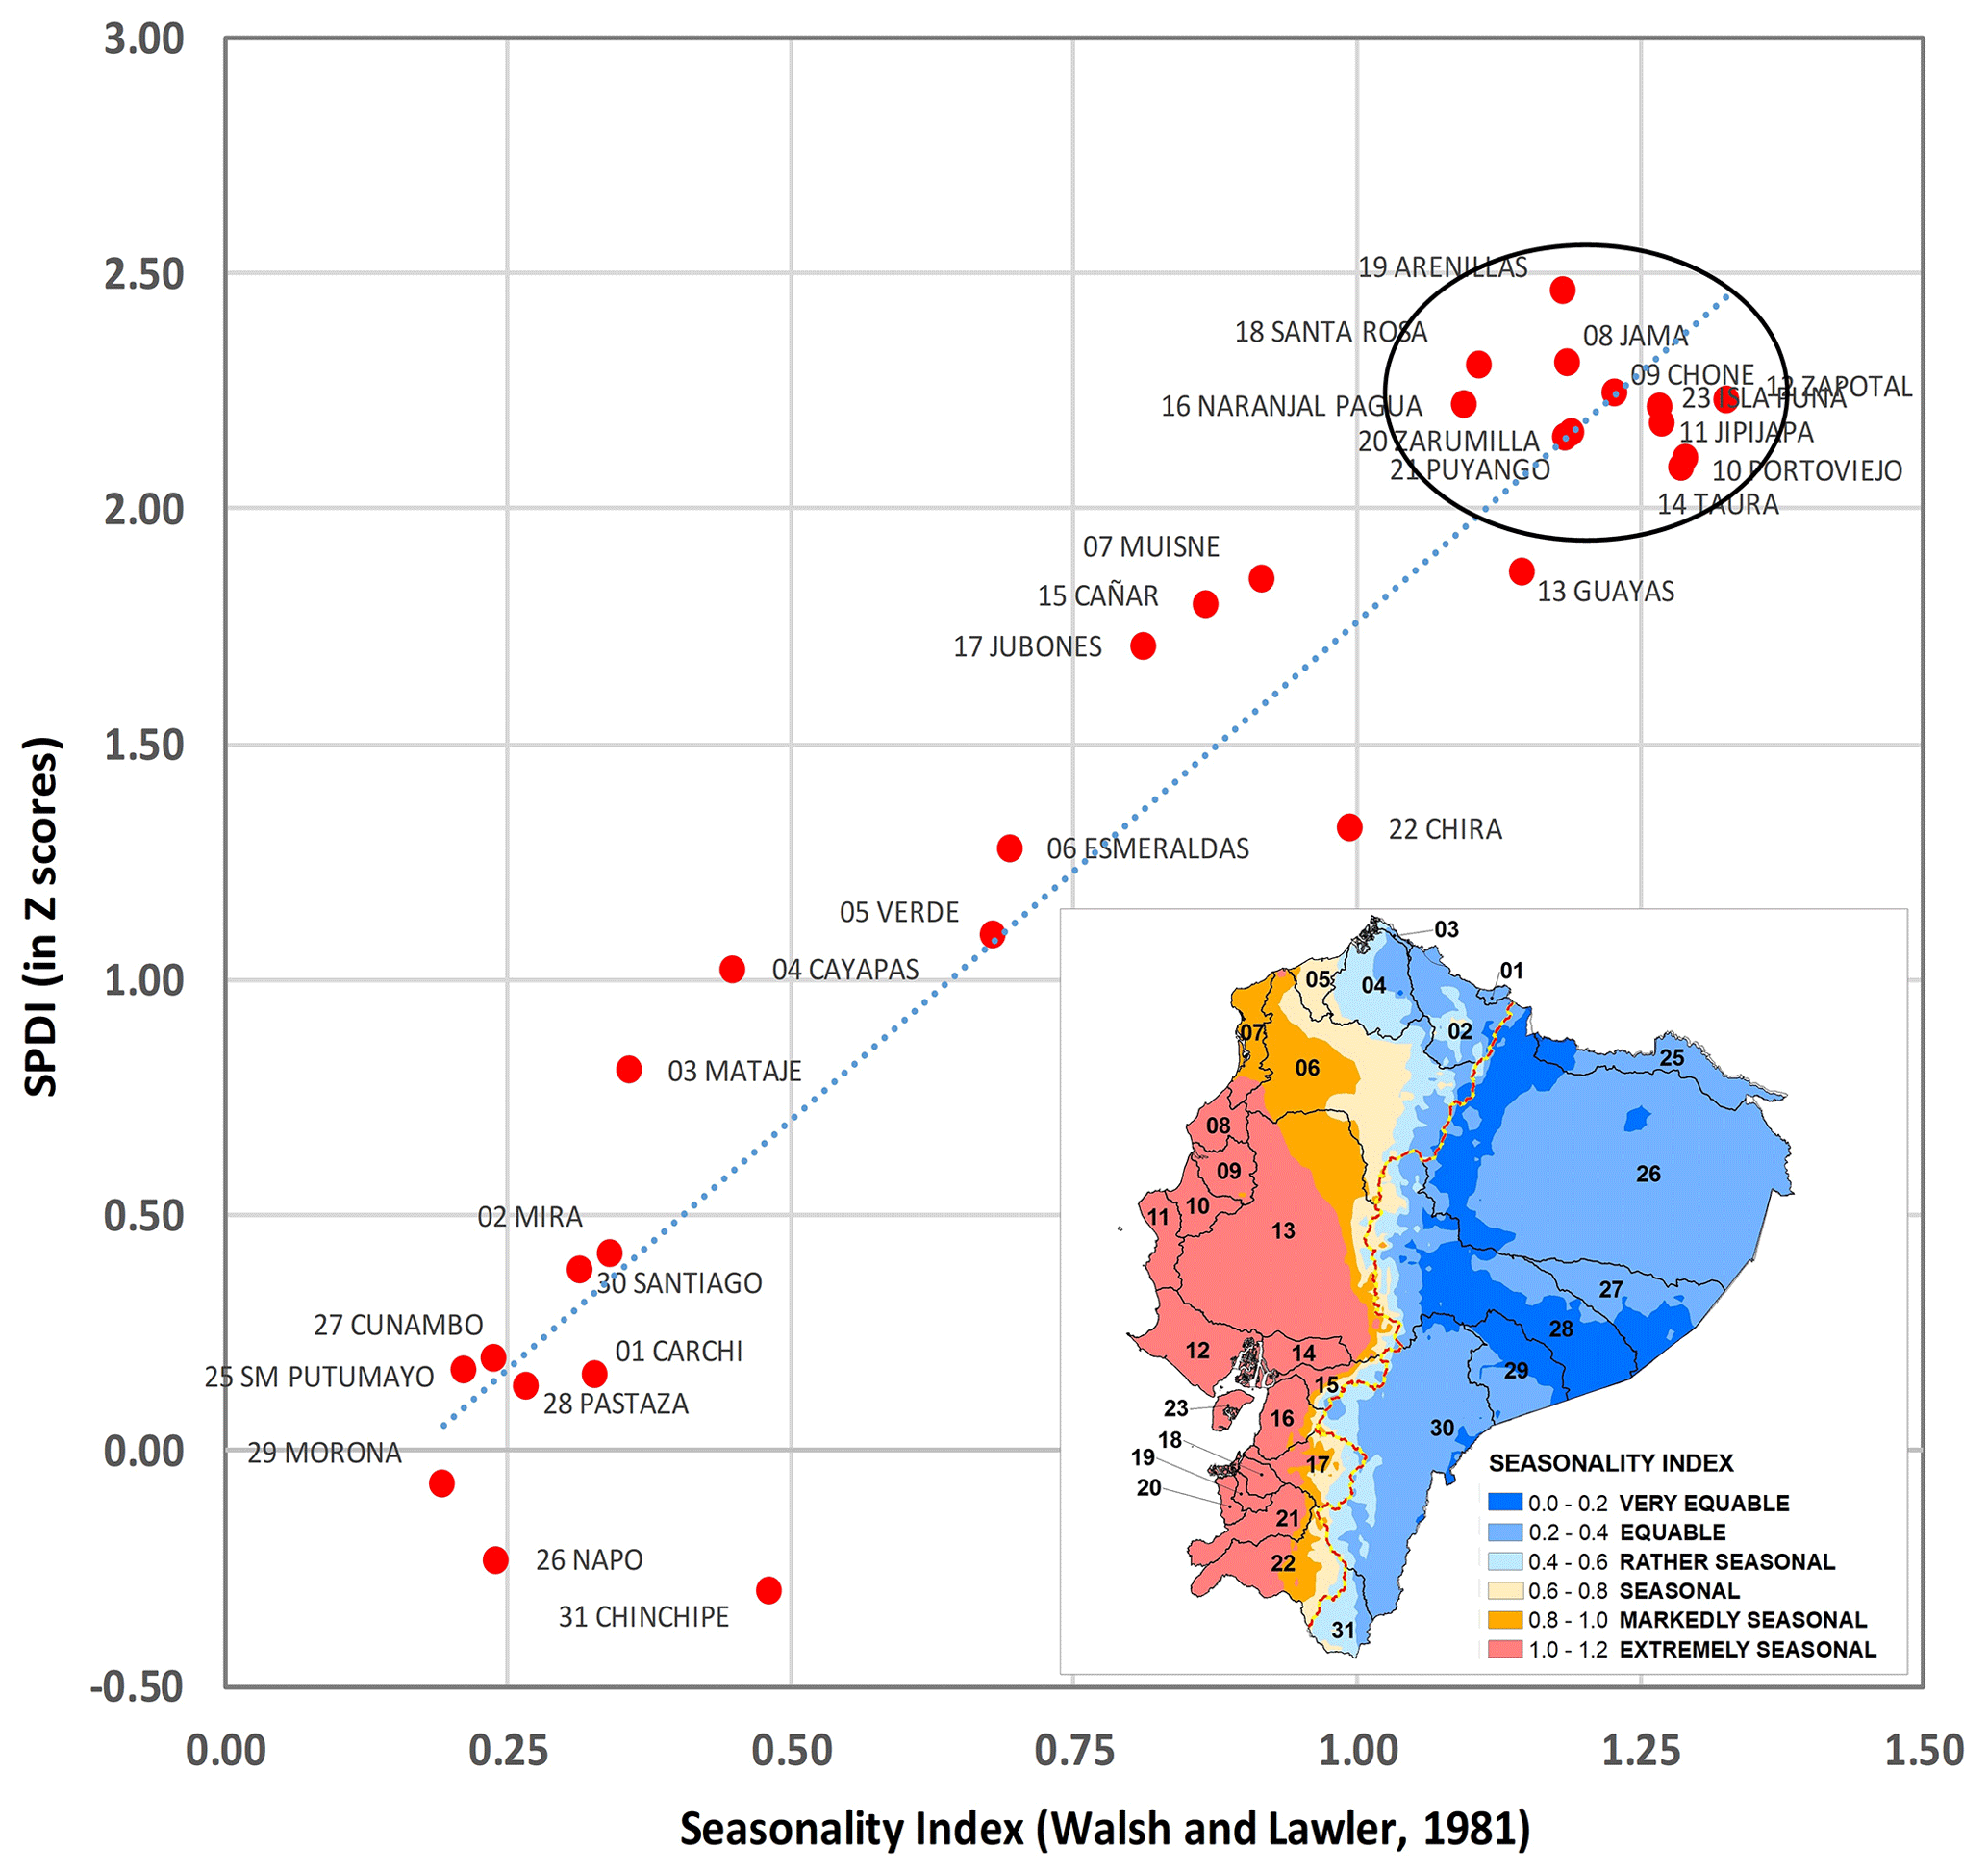
Figure 6Relationship at a basin level between the Seasonality Index (; Walsh and Lawler, 1981) and the mean annual (Year 2) SPDI resulting from the mega-El Niño events EP83 and EP98 and the coastal El Niño COA17. An extremely humid condition (SPDI ≥ 2.0) is reached in basins with the highest values (i.e., with rainy seasons concentrated in 3 or fewer months, ≥ 1.00).
Now, from the results of the spatial–temporal analysis of precipitation dynamics it is evident that the degree of seasonality also conditions the magnitude of the ENSO signal in the entire continental Ecuador. Figure 6, for instance, shows that it is in the most extremely seasonal regions ( 1.0–1.2) where precipitation anomalies are the strongest, while regions with low or no seasonality ( 0.0–0.6) show no precipitation anomaly during the event of an extreme El Niño. According to Carréric et al. (2019), the strong EP El Niño event peak in boreal winter is extended by 2 months, which results in significantly more events peaking in February–March–April, the season when the climatological intertropical convergence zone is at its southernmost location. The Pacific slope shows strong seasonality, while the Amazon slope exhibits mild to no seasonality and the Sierra a moderate seasonality (Tobar and Wyseure, 2017).
From Figs. 5 and 6 a list of the most vulnerable hydrographic systems regarding affectation in the event of an extreme El Niño becomes easily identifiable. Besides the insular system of the Galapagos, the other 13 are continental systems from the Pacific slope that show the highest seasonality in their precipitation: Arenillas (SPDI 2.47 and 1.18), Jama (2.31 and 1.19), Santa Rosa (2.31 and 1.11), Chone (2.25 and 1.23), Zapotal (2.23 and 1.33), Naranjal Pagua (2.22 and 1.10), Isla Puná (2.22 and 1.27), Jipijapa (2.19 and 1.27), Zarumilla (2.17 and 1.19), Puyango (2.16 and 1.19), Portoviejo (2.11 and 1.29), Taura (2.09 and 1.29), and Guayas (1.87 and 1.15).
The present study generates reliable information about the most relevant aspects of spatial–temporal extreme precipitation dynamics resulting from the various types of extreme El Niño events, including the coastal El Niño, information that becomes valuable and is highly strategic considering that these extreme climatic events are expected to double their occurrence in the foreseeable future.
-
For both the Pacific slope and Galapagos, it is during the first half of the second year of an extreme El Niño event, coincidentally encompassing the rainy season, when most precipitation extremes occur, and it is during this time when any difference between extreme El Niño events becomes more evident.
-
There was no evidence of any significant precipitation anomaly generated on Ecuadorian territory by the occurrences of the mixed (EP–CP) type of extreme El Niño. Likewise, there was no evidence of any significant precipitation anomaly generated on the Amazon slope by the occurrences of any type of extreme El Niño: eastern Pacific, central Pacific, mixed, or coastal.
-
For any extreme El Niño event, over 50 % of all extreme anomalies (SPDI ≥ 2.0) occurred at elevations under 150 m. But, differences between events become significant when considering how far into the Andes the precipitation anomalies are perceived. For instance, during EP98, 80 % of all extreme anomalies occurred at elevations up to 500 m, while for COA17 and EP83, this was 800 and 1000 m, respectively. Any difference between extreme El Niño events disappears again around 3000 m a.s.l. when accumulative extreme anomalies reach 97 %. Finally, at an altitude of 4000 m, all extreme El Niño events reach the historical mean (series 1981–2010).
-
Nevertheless, the ENSO signal is variable not only along the lowlands of the Pacific slope but also along the highlands and along the dorsal of the Andes. Here, the ENSO signal can be observed, in continuous sections of several hundred kilometers, at mean altitudes ranging from 3200 to 3900 m. Other physical determinants such as the distance to the coastline and the steepness of the Cordillera may play an important role in determining the degree of the ENSO signal on the Andean Cordillera.
-
Finally, the degree of seasonality also conditions the magnitude of the ENSO signal in the entire continental Ecuador: it is in the regions showing the highest seasonality index where the most severe precipitation anomalies from extreme El Niño events occur. In these terms, 13 hydrographic systems from the Pacific slope showing strong seasonality resulted in being the most vulnerable to extreme precipitation generated by extreme El Niño events. Both the north of Ecuador and the Amazon slope exhibit mild to no seasonality. Concomitantly, hydrographic systems from these regions show no significant precipitation anomalies regardless of the type or strength of El Niño event.
Results from the present research allowed us to generate the most valuable information regarding the similarities and differences between the effects on precipitation from different types of extreme El Niño events, as well as to highlight spatially and quantitatively those regions or hydrographic systems where most extreme precipitation anomalies are most likely to occur in the event of an extreme El Niño, either an eastern Pacific or a coastal El Niño. Access to information like this is most strategic when designing and incorporating disaster risk analyses and policies (Ward et al., 2014). For instance, Fig. 5 shows where the most negative direct effects from such anomalies are expected, as well as where such extreme events may exert strong and widespread influences on both flood hazard and risk. Because extreme El Niño events have some predictive capacity, mainly the eastern Pacific type, these specific results represent a solid contribution toward developing a risk-predictive model with applications for improved disaster planning (Ward et al., 2014). The results also provide solid and opportune evidence for identifying, in the context of global climate change scenarios, an increase in the frequency and intensity of extreme climatic events as well as the most appropriate management practices aimed at achieving sustainability of ongoing anthropogenic activities in one of the most climatically vulnerable regions of the Pacific coast of South America. The latter is done either by adapting or mitigating the direct effects such as flooding and mudslides, as well as by reducing the risk of indirect effects such as in the case of the emergence of important infectious diseases in a region that, historically and linked to the occurrence of extreme climatic events, has shown to be the most vulnerable to significant epidemics of cholera, leptospirosis, dengue, chikungunya, zika, malaria, etc. (OPS and OMS, 1999; World Bank Group, 2011), and more recently to COVID-19, one of the worst pandemics known to humankind in recent history, about which there is currently no indication about what to expect and how to control the spread of such a virus in the event of an extreme El Niño in the Ecuador or elsewhere.
All data used are available online. Basin delineation data are freely available from HydroSHEDS (https://www.hydrosheds.org; Lehner et al., 2008). Rasterized precipitation data are freely available from Climate Hazards Group Infrared Precipitation with Stations (CHIRPS V2.0, https://iridl.ldeo.columbia.edu/SOURCES/.UCSB/.CHIRPS/.v2p0/.monthly/.global/; Funk et al., 2014). Rasterized altitude data are freely available from Earth Explorer (https://doi.org/10.5067/MEaSUREs/SRTM/SRTMGL1.003; NASA JPL, 2013). ONI data are freely available from the NOAA Center for Weather and Climate Prediction of the National Weather Service Climate Prediction Center (https://www.cpc.ncep.noaa.gov/data/indices/; Climate Prediction Center/NCEP/NWS/NOAA, 2023).
Conceptualization: DRT, PRP, MLP. Data curation: DRT, MM, WR, JIQ, IASW. Formal analysis: DRT, PRP, MM, WR, JIQ. Funding acquisition: DRT, MAAA, EZL, AQ. Investigation: DRT, PRP, MLP. Methodology: DRT, PRP, MLP. Project administration: DRT, AQ, MAAA. Resources: DRT, AQ, MAAA. Software: DRT, MM, WR, JIQ, GB, IASW. Supervision: PRP, GB. Validation: DRT, PRP, EZL, MLP. Visualization: DRT, PRP, MM, WR, JIQ, MLP, IASW. Writing (original draft): DRT, PRP, MLP. Revision and re-validation: DRT, PRP, EZL, MLP.
The contact author has declared that none of the authors has any competing interests.
Publisher’s note: Copernicus Publications remains neutral with regard to jurisdictional claims in published maps and institutional affiliations.
The access to GIS software was provided by the Service Unit of Geographical System Information (UniSIG) and the Ecology Center of the Venezuelan Institute for Scientific Research (IVIC), Caracas, Venezuela. Finally, the authors wish to thank the anonymous reviewers for their recommendations, which resulted in a significant improvement of the present work.
This research has been supported by the Fondo Nacional de Ciencia Tecnología e Innovación and the Ministry of Science and Technology of Venezuela (grant no. 20220PGP53). Financial support has also been provided by the Research Institute of Universidad Técnica de Manabí (UTM), Portoviejo, Ecuador; the Programa de movilizaciones para investigación en Cambio Climatico (grant no. AMSUD 189-2020-FONDECYT); and the Fondo del Canon Minero, Universidad Nacional Autónoma de Huanta. Grants from the Organization of American States by the Programa de Alianças para a Educação e a Capacitação (Bolsas Brasil – PAEC OEA-GCUB) were assigned to Paolo Ramoni-Perazzi and Irma A. Soto-Werschitz.
This paper was edited by Paolo Tarolli and reviewed by three anonymous referees.
Ashok, K., Behera, S. K., Rao, S. A., Weng, H., and Yamagata, T.: El Niño Modoki and its possible teleconnection, J. Geophys. Res., 112, C11007, https://doi.org/10.1029/2006JC003798, 2007.
Baez-Villanueva, O. M., Zambrano-Bigiarini, M., Ribbe, L., Nauditt, A., Giraldo-Osorio, J. D., and Thinh, N. X.: Temporal and spatial evaluation of satellite rainfall estimates over different regions in Latin-America, Atmos. Res., 213, 34–50, https://doi.org/10.1016/j.atmosres.2018.05.011, 2018.
Beck, H. E., Vergopolan, N., Pan, M., Levizzani, V., van Dijk, A. I. J. M., Weedon, G. P., Brocca, L., Pappenberger, F., Huffman, G. J., and Wood, E. F.: Global-scale evaluation of 22 precipitation datasets using gauge observations and hydrological modeling, Hydrol. Earth Syst. Sci., 21, 6201–6217, https://doi.org/10.5194/hess-21-6201-2017, 2017.
Bendix, A. and Bendix, J.: Heavy rainfall episodes in Ecuador during El Niño events and associated regional atmospheric circulation and SST patterns, Adv. Geosci., 6, 43–49, https://doi.org/10.5194/adgeo-6-43-2006, 2006.
Bernabé, M. A., Carreón, D., Cerca, M., Culqui, J., González, M. E., González, M., Gutiérrez, C., Gutiérrez, R., Herrera, G., Padilla, O., Pauker, F., Rodriguez, F., Rodríguez, G., Salazar, R., Toulkeridis, T., Vasco, C., and Zacarías, S.: Amenazas de origen natural y gestión de riesgo en el Ecuador 1 – Algunos elementos fundamentales en el manejo de reducción de riesgo de desastres (RRD), Editorial ESPE, Quito, Ecuador, ISBN 978-9942-21-705-9, 2014.
Buytaert, W., Celleri, R., Willems, P., Bièvre, B., and Wyseure, G.: Spatial and temporal rainfall variability in mountainous areas: a case study from the south Ecuadorian Andes, J. Hydrol., 329, 413–421, https://doi.org/10.1016/j.jhydrol.2006.02.031, 2006.
Cai, W., Borlace, S., Lengaigne, M., Rensch, P. v., Collins, M., Vecchi, G., Timmermann, A., Santoso, A., McPhaden, M. J., Wu, L., England, M. H., Wang, G., Guilyardi, E., and Jin, F.-F.: Increasing frequency of extreme El Niño events due to greenhouse warming, Nat. Clim. Change, 4, 111–116, https://doi.org/10.1038/NCLIMATE2100, 2014.
Cai, W., McPhaden, M. J., Grimm, A. M., Rodrigues, R. R., Taschetto, A. S., Garreaud, R. D., Dewitte, B., Poveda, G., Ham, Y.-G., Santoso, A., Ng, B., Anderson, W., Wang, G., Geng, T., Jo, H.-S., Marengo, J. A., Alves, L. M., Osman, M., Li, S., Wu, L., Karamperidou, C., Takahashi, K., and Vera, C.: Climate impacts of the El Niño–Southern Oscillation on South America, Nat. Rev. Earth Environ., 1, 215–231, https://doi.org/10.1038/s43017-020-0040-3, 2020.
Carréric, A., Dewitte, B., Cai, W., Capotondi, A., Takahashi, K., Yeh, S.-W., Wang, G., and Guémas, V.: Change in strong Eastern Pacific El Niño events dynamics in the warming climate, Clim. Dynam., 54, 901–918, https://doi.org/10.1007/s00382-019-05036-0, 2019.
Chen, L., Li, T., Wang, B., and Wang, L.: Formation mechanism for 2015/16 Super El Niño, Sci. Rep., 7, 2975, https://doi.org/10.1038/s41598-017-02926-3, 2017.
Climate Prediction Center/NCEP/NWS/NOAA: Monthly Atmospheric and SST Indices, NOAA Center for Weather and Climate Prediction of the National Weather Service Climate Prediction Center, https://www.cpc.ncep.noaa.gov/data/indices/, last access: 20 April 2023.
Comisión Económica para América Latina y El Caribe (CEPAL): Ecuador: Evaluación de los efectos socioeconómicos del fenómeno El Niño 1997–1998, PNUD-CAF, 78 pp., https://repositorio.cepal.org/handle/11362/31104 (last access: 20 April 2023), 1998.
Consejo Nacional de Recursos Hídricos (CNRH): División hidrográfica del Ecuador 9 – Propuesta del CNRH y el Grupo Interinstitucional para oficializar en el Ministerio de Relaciones Exteriores, in: Consejo Nacional de Recursos Hídricos – CNRH, Ministerio del Ambiente, Quito, Ecuador, http://intranet.comunidadandina.org/Documentos/Reuniones/DTrabajo/SG_REG_EMAB_IX_dt%203_Ax2.pdf (last access: 20 April 2023), 2002.
Corporación Andina de Fomento (CAF): Las lecciones de El Niño. Ecuador. Memorias del fenómeno El Niño 1997–1998. Retos y propuestas para la región andina, Corporación Andina de Fomento – CAF, Caracas, Venezuela, ISBN 980-340-174-2, 2000.
Deblauwe, V., Droissart, V., Bose, R., Sonké, B., Blach-Overgaard, A., Svenning, J.-C., Wieringa, J. J., Ramesh, B. R., Stévart, T., and Couvreur, T. L. P.: Remotely sensed temperature and precipitation data improve species distribution modelling in the tropics, Global Ecol. Biogeogr., 25, 443–454, https://doi.org/10.1111/geb.12426, 2016.
de Guenni, L. B., García, M., Muñoz, Á. G., Santos, J. L., Cedeño, A., Perugachi, C., and Castillo, J.: Predicting monthly precipitation along coastal Ecuador: ENSO and transfer function models, Theor. Appl. Climatol., 129, 1059–1073, https://doi.org/10.1007/s00704-016-1828-4, 2017.
Dewitte, B. and Takahashi, K.: Extreme El Niño Events, in: Tropical extremes: Natural variability and trends, Elsevier Inc., https://doi.org/10.1016/B978-0-12-809248-4.00006-6, 2019.
Echevin, V., Colas, F., Espinoza-Morriberon, D., Vasquez, L., Anculle, T., and Gutierrez, D.: Forcings and evolution of the 2017 Coastal El Niño off Northern Peru and Ecuador, Front. Earth Sci., 5, 367, https://doi.org/10.3389/fmars.2018.00367, 2018.
Estudio Nacional del Fenómeno El Niño (ENFEN): Definición operacional de los eventos El Niño y La Niña y sus magnitudes en la costa del Perú, Nota Técnica Abril 2012, http://www.infocoders.com/projects/ENFEN/download/icen-nota-tecnica-definicion-operacional-de-los-eventos-el-nino-y-la-nina-y-sus-magnitudes-en-la-costa-del-peru/ (last access: 19 April 2023), 2012.
Estudio Nacional del Fenómeno El Niño (ENFEN): El Niño costero 2017, Informe técnico extraordinario No. 001-2017/ENFEN, 31 pp., http://www.infocoders.com/projects/ENFEN/download/informe-tecnico-el-nino-costero-2017/ (last access: 19 April 2023), 2017.
Funk, C. C., Peterson, P. J., Landsfeld, M. F., Pedreros, D. H., Verdin, J. P., Rowland, J. D., Romero, B. E., Husak, G. J., Michaelsen, J. C., and Verdin, A. P.: A quasi-global precipitation time series for drought monitoring, U.S. Geological Survey Data Series 832, 4 p., https://doi.org/10.3133/ds832, 2014 (data available at: https://iridl.ldeo.columbia.edu/SOURCES/.UCSB/.CHIRPS/.v2p0/.monthly/.global/, last access: 21 April 2023).
Funk, C., Peterson, P., Landsfeld, M., Pedreros, D., Verdin, J., Shukla, S., Husak, G., Rowland, J., Harrison, L., Hoell, A., and Michaelsen, J.: The climate hazards infrared precipitation with stations – A new environmental record for monitoring extremes, Sci. Data, 2, 150066, https://doi.org/10.1038/sdata.2015.66, 2015.
Gabastou, J.-M., Pesantes, C., Escalante, S., Narváez, Y., Vela, E., García, L., Zabala, D., and Yadon, Z. E.: Características de la epidemia de cólera de 1998 en Ecuador, durante el fenómeno de “El Niño”, Rev. Panam. Salud Públ./Pan Am. J. Public Health, 12, 157–164, 2002.
Garreaud, R. D.: A plausible atmospheric trigger for the 2017 coastal El Niño, Int. J. Climatol., 38, e1296–e1302, https://doi.org/10.1002/joc.5426, 2018.
Gelati, E., Madsen, H., and Rosbjerg, D.: Reservoir operation using El Niño forecasts – case study of Daule Peripa and Baba, Ecuador, Hydrolog. Sci. J., 59, 1559–1581, https://doi.org/10.1080/02626667.2013.831978, 2014.
Glantz, M. H.: Shades of chaos: lessons learned about lessons learned about forecasting El Niño and its impacts, Int. J. Disaster Risk Sci., 60, 94–103, https://doi.org/10.1007/s13753-015-0045-6, 2015.
Glantz, M. H. and Ramirez, I. J.: Reviewing the oceanic Niño Index (ONI) to enhance societal readiness for El Niño's impacts, Int. J. Disaster Risk Sci., 11, 394–403, https://doi.org/10.1007/s13753-020-00275-w, 2020.
Gong, X. and Richman, M. B.: On the application of cluster analysis to growing season precipitation data in North America east of the Rockies, J. Climate, 8, 897–931, https://doi.org/10.1175/1520-0442(1995)008<0897:OTAOCA>2.0.CO;2, 1995.
Gulizia, C. and Pirotte, M. N.: Characterization of simulated extreme El Niño events and projected impacts on South American climate extremes by a set of CMIP5 global climate models, Int. J. Climatol., 42, 48–62, https://doi.org/10.1002/joc.7231, 2022.
Hameed, S. N., Jin, D., and Thilakan, V.: A model for super El Niños, Nat. Commun., 9, 2528, https://doi.org/10.1038/s41467-018-04803-7, 2018.
Hong, L.-C.: Super El Niño, Springer Science+Business Media, Singapore, https://doi.org/10.1007/978-981-10-0527-5, 2016.
Hong, L.-C., Ho, L., and Jin, F.-F.: A southern hemisphere booster of super El Nino, Geophys. Res. Lett., 410, 2142–2149, https://doi.org/10.1002/2014GL059370, 2014.
Hu, Z.-Z., Huang, B., Zhu, J., Kumar, A., and McPhaden, M. J.: On the variety of coastal El Niño events, Clim. Dynam., 52, 7537–7552, https://doi.org/10.1007/s00382-018-4290-4, 2019.
Kiefer, J. and Karamperidou, C.: High-resolution modeling of ENSO-induced precipitation in the tropical Andes: Implications for proxy interpretation, Paleoceanography and Paleoclimatology, 34, 217–236, https://doi.org/10.1029/2018PA003423, 2019.
Kug, J. S., Jin, F.-F., and An, S.-I.: Two types of El Niño events: cold tongue El Niño and warm pool El Niño, J. Climate, 22, 1499–1515, https://doi.org/10.1175/2008JCLI2624.1, 2009.
Larkin, N. K. and Harrison, D. E.: Global seasonal temperature and precipitation anomalies during El Niño autumn and winter, Geophys. Res. Lett., 32, L16705, https://doi.org/10.1029/2005GL022860, 2005.
Lehner, B., Verdin, K., and Jarvis, A.: New global hydrography derived from spaceborne elevation data, Eos, Transactions, 89, 93–94, 2008 (data available at: https://www.hydrosheds.org, last access: 20 April 2023).
L'heureux, M. L., Takahashi, K., Watkins, A. B., Barnston, A. G., Becker, E. J., Liberto, T. E. D., Gamble, F., Gottschalck, J., Halpert, M. S., Huang, B., Mosquera-Vásquez, K., and Wittenberg, A. T.: Observing and Predicting the 2015–16 El Niño, B. Am. Meteorol. Soc, 98, 1363–1382, https://doi.org/10.1175/2018BAMSStateoftheClimate.1, 2017.
López, H., Lee, S.-K., Kim, D., Wittenberg, A. T., and Yeh, S.-W.: Projections of faster onset and slower decay of El Niño in the 21st century, Nat. Commun., 13, 1915, https://doi.org/10.1038/s41467-022-29519-7, 2022.
López-Bermeo, C., Montoya, R. D., Caro-Lopera, F. J., and Díaz-García, J. A.: Validation of the accuracy of the CHIRPS precipitation dataset at representing climate variability in a tropical mountainous region of South America, Phys. Chem. Earth, 127, 103184, https://doi.org/10.1016/j.pce.2022.103184, 2022.
McKee, T. B., Doesken, N. J., and Kleist, J.: The relationship of drought frequency and duration to time scales, Eighth Conference on Applied Climatology, Anaheim, California, 17–22 January 1993, American Meteorological Society, Proceedings of the 8th Conference on Applied Climatology, 17, 179–184, https://www.droughtmanagement.info/literature/AMS_Relationship_Drought_Frequency_Duration_Time_Scales_1993.pdf (last access: 21 April 2023), 1993.
Mega, N. and Medjerab, A.: Statistical comparison between the standardized precipitation index and the standardized precipitation drought index, Model. Earth Syst. Environ., 7, 373–388, https://doi.org/10.1007/s40808-021-01098-4, 2021.
Metsalu, T. and Vilo, J.: Clustvis: a web tool for visualizing clustering of multivariate data using Principal Component Analysis and heatmap, Nucleic Acids Res., 43, W566–W570, https://doi.org/10.1093/nar/gkv468, 2015.
Mora, D. E. and Willems, P.: Decadal oscillations in rainfall and air temperature in the Paute River Basin–Southern Andes of Ecuador, Theor. Appl. Climatol., 108, 267–282, https://doi.org/10.1007/s00704-011-0527-4, 2012.
Morán-Tejeda, E., Bazo, J., López-Moreno, J. I., Aguilar, E., Azorín-Molina, C., Sanchez-Lorenzo, A., Martínez, R., Nieto, J. J., Mejía, R., Martín-Hernández, N., and Vicente-Serrano, S. M.: Climate trends and variability in Ecuador (1966–2011), Int. J. Climatol., 36, 3839–3855, https://doi.org/10.1002/joc.4597, 2016.
NASA JPL: NASA Shuttle Radar Topography Mission Global 1 arc second, NASA EOSDIS Land Processes DAAC [data set], https://doi.org/10.5067/MEaSUREs/SRTM/SRTMGL1.003, 2013.
Organización Panamericana de la Salud (OPS): Crónicas de desastres – Fenómeno El Niño 1997–1998, Organización Panamericana de la Salud – OPS, Washington, D.C., 290 pp., ISBN 92-75-32318-6, 2000.
Organización Panamericana de la Salud (OPS) and Organización Mundial de la Salud (OMS): Impacto del Fenómeno del Niño en Infraestructura de Agua Potable – Lecciones Aprendidas en Ecuador, Organización Panamericana de la Salud – OPS, Organización Mundial de la Salud – OMS, 79 pp., http://cidbimena.desastres.hn/docum/crid/CD_Agua/pdf/spa/doc14591/doc14591.htm (last access: 20 April 2023), 1999.
Paredes-Trejo, F. J., Alves-Barbosa, H., Peñaloza-Murillo, M. A., Moreno, M. A., and Farías, A.: Intercomparison of improved satellite rainfall estimation with CHIRPS gridded product and rain gauge data over Venezuela, Atmósfera, 29, 323–342, https://doi.org/10.20937/ATM.2016.29.04.04, 2016.
Paredes-Trejo, F. J., Alves-Barbosa, H., and Lakshmi-Kumar, T. V.: Validating CHIRPS-based satellite precipitation estimates in Northeast Brazil, J. Arid Environ., 139, 26–40, https://doi.org/10.1016/j.jaridenv.2016.12.009, 2017.
Peña-Gallardo, M., Gámiz-Fortis, S. R., Castro-Díez, Y., and Esteban-Parra, M. J.: Análisis comparativo de índices de sequía en Andalucía para el periodo 1901–2012, Cuad. Investig. Geogr., 42, 67–88, https://doi.org/10.18172/cig.2946, 2016.
Peng, Q., Xie, S.-P., Wang, D., Zheng, X.-T., and Zhang, H.: Coupled ocean-atmosphere dynamics of the 2017 extreme coastal El Niño, Nat. Commun., 10, 298, https://doi.org/10.1038/s41467-018-08258-8, 2019.
Pietri, A., Colas, F., Mogollon, R., Tam, J., and Gutierrez, D.: Marine heatwaves in the Humboldt current system: from 5-day localized warming to year-long El Niños, Sci. Rep., 11, 21172, https://doi.org/10.1038/s41598-021-00340-4, 2021.
Pineda, L., Ntegeka, V., and Willems, P.: Rainfall variability related to sea surface temperature anomalies in a Pacific–Andean basin into Ecuador and Peru, Adv. Geosci., 33, 53–62, https://doi.org/10.5194/adgeo-33-53-2013, 2013.
Pita, M. F.: Un nouvel indice de sécheresse pour les domaines méditerranéens. Application au bassin du Guadalquivir (sudouest de l'Espagne), Publications de l'Association Internationale de Climatologie, 13, 225–233, 2001.
Quishpe-Vásquez, C., Gámiz-Fortis, S. R., García-Valdecasas-Ojeda, M., Castro-Díez, Y., and Esteban-Parra, M. J.: Tropical Pacific sea surface temperature influence on seasonal streamflow variability in Ecuador, Int. J. Climatol., 39, 3895–3914, https://doi.org/10.1002/joc.6047, 2019.
Ramírez, I. J. and Briones, F.: Understanding the El Niño costero of 2017: The definition problem and challenges of climate forecasting and disaster responses, Int. J. Disaster Risk Sci., 8, 489–492, https://doi.org/10.1007/s13753-017-0151-8, 2017.
Ramoni-Perazzi, P., Passamani, M., Thielen, D. R., Padovani, C., and Arizapana, M. A.: BrazilClim: The overcoming of limitations of preexisting bioclimate data, Int. J. Clim., 42, https://doi.org/10.1002/joc.7325, 2021.
Rivera, J. A., Hinrichs, S., and Marianetti, G.: Using CHIRPS Dataset to assess wet and dry conditions along the semiarid Central-Western Argentina, Adv. Meteorol., 2019, 8413964, https://doi.org/10.1155/2019/8413964, 2019.
Rollenbeck, R., Orellana-Alvear, J., Bendix, J., Rodriguez, R., Pucha-Cofrep, F., Guallpa, M., Fries, A., and Célleri, R.: The Coastal El Niño Event of 2017 in Ecuador and a weather radar analysis, Remote Sens., 14, 824, https://doi.org/10.3390/rs14040824, 2022.
Rossel, F., Le Goulven, P., and Cadier, E.: Areal distribution of the influence of ENSO on the annual rainfall in Ecuador, Rev. Des Sci. De L'Eau, 132, 183–200, 1999.
Sanchez-Toribio, M. I., Garcia-Marin, R., Conesa-Garcia, C., and Lopez-Bermudez, F.: Evaporative demand and water requirements of the principal crops of the Guadalentín valley (SE Spain) in drought periods, Span. J. Agric. Res., 8, S66–S75, https://doi.org/10.5424/sjar/201008S2-1349, 2010.
Santos, J. F., Pulido-Calvo, I., and Portela, M. M.: Spatial and temporal variability of droughts in Portugal, Water Resour. Res., 46, W03503, https://doi.org/10.1029/2009WR008071, 2010.
Santoso, A., McPhaden, M. J., and Cai, W. The defining characteristics of ENSO extremes and the strong 2015/2016 El Niño, Rev. Geophys., 55, 1079–1129, https://doi.org/10.1002/2017RG000560, 2017.
Takahashi, K. and Martínez, A. G.: The very strong coastal El Niño in 1925 in the far-eastern Pacific, Clim. Dynam., 52, 7389–7415, https://doi.org/10.1007/s00382-017-3702-1, 2017.
Takahashi, K., Aliaga-Nestares, V., Avalos, G., Bouchon, M., Castro, A., Cruzado, L., Dewitte, B., Gutiérrez, D., Lavado-Casimiro, W., Marengo, J., Martínez, A. G., Mosquera-Vásquez, K., and Quispe, N.: The 2017 Coastal El Niño, in: State of the Climate in 2017, edited by: Blunden, J., Arndt, D. S., and Hartfield, G., B. Am. Meteorol. Soc., 99, Si–S322, https://doi.org/10.1175/2018BAMSStateoftheClimate.1, 2018a.
Takahashi, K., Karamperidou, C., and Dewitte, B.: A theoretical model of strong and moderate El Niño regimes, Clim. Dynam., 52, 7477–7493, https://doi.org/10.1007/s00382-018-4100-z, 2018b.
Thielen, D. R., Cevallos, J., Erazo, T., Zurita, I. S., Figueroa-Pico, J. A., Quintero, J. I., Matute, N., Velásquez, G., and Puche Cardenas, M. L.: Dinámica de los eventos climáticos extremos en la cuenca del río Portoviejo, Manabí, Ecuador, Revista La Técnica, 14, 80–91, 2015.
Thielen, D. R., Cevallos, J., Erazo, T., Figueroa-Pico, J. A., Velásquez, G., Matute, N., Quintero, J. I., and Puche Cardenas, M. L.: Dinámica espacio-temporal de las precipitaciones durante el evento de El Niño 97/98 en la cuenca de Río Portoviejo, Manabí, costa ecuatoriana del Pacífico, Revista de Climatología, 16, 35–50, 2016.
Thielen, D. R., Schuchmann, K.-L., Ramoni-Perazzi, P., Marquez, M., Rojas, W., Quintero, J. I., and Marques, M. I.: Quo vadis Pantanal? Expected precipitation extremes and drought dynamics from changing sea surface temperature, PLoS ONE, 15, e0227437, https://doi.org/10.1371/journal.pone.0227437, 2020.
Thielen, D. R., Ramoni-Perazzi, P., Marquez, M., Quintero, J., Soto-Werschitz, I. A., Rojas, W., Thielen, K., and Puche, M. L.: Hydroclimatological extreme events affecting the Daule-Peripa Reservoir (Coast of Ecuador) – Historical dynamics and teleconnections, Revista de Climatología, 21, 127–145, 2021a.
Thielen, D. R., Ramoni-Perazzi, P., Puche, M. L., Márquez, M., Quintero, J. I., Rojas, W., Soto-Werschitz, A., Thielen, K., Nunes, A., and Libonati, R.: The Pantanal under Siege – On the Origin, Dynamics and Forecast of the Megadrought Severely Affecting the Largest Wetland in the World, Water, 13, 3034, https://doi.org/10.3390/w13213034, 2021b.
Tobar, V. and Wyseure, G.: Seasonal rainfall patterns classification, relationship to ENSO and rainfall trends in Ecuador, Int. J. Climatol., 38, 1808–1819, https://doi.org/10.1002/joc.5297, 2017.
Vicente-Serrano, S. M., Aguilar, E., Martínez, R., Martín-Hernández, N., Azorin-Molina, C., Sanchez-Lorenzo, A., Kenawy, A. E., Tomás-Burguera, M., Moran-Tejeda, E., López-Moreno, J. I., Revuelto, J., Beguería, S., Nieto, J. J., Drumond, A., Gimeno, L., and Nieto, R.: The complex influence of ENSO on droughts in Ecuador, Clim. Dynam., 48, 405–427, https://doi.org/10.1007/s00382-016-3082-y, 2017.
Vuille, M., Bradley, R. S., and Keimig, F.: Climate variability in the Andes of Ecuador and its relation to Tropical Pacific and Atlantic sea surface temperature anomalies, J. Climate, 13, 2520–2535, https://doi.org/10.1175/1520-0442(2000)013<2520:CVITAO>2.0.CO;2, 2000.
Walsh, P. D. and Lawler, D. M.: Rainfall seasonality: description, spatial patterns and change through time, Weather, 36, 201–208, 1981.
Wang, C., Deser, C., Yu, J.-Y., DiNezio, P., and Clement, A.: El Niño and Southern Oscillation (ENSO): A Review, in: Coral Reefs of the Eastern Pacific, edited by: Glymn, P., Manzello, D., and Enochs, I., Springer Science Publisher, https://doi.org/10.1007/978-94-017-7499-4_4, 2016.
Wang, G., Cai, W., and Santoso, A.: Stronger increase in the frequency of extreme convective El Niño than extreme warm El Niño under greenhouse warming, J. Climate, 33, 675–690, https://doi.org/10.1175/JCLI-D-19-0376.1, 2020.
Ward, P. J., Jongman, B., Kummu, M., Dettinger, M. D., Sperna Weiland, F. C., and Winsemius, H. C.: Strong influence of El Niño Southern Oscillation on flood risk around the world, P. Natl. Acad. Sci. USA, 111, 15659–15664, https://doi.org/10.1073/pnas.1409822111, 2014.
World Bank Group: Vulnerability, Risk Reduction, and Adaptation to Climate Change – Ecuador, World Bank Group, 15 pp., https://www.uncclearn.org/resources/library/vulnerability-risk-reduction-and-adaptation-to-climate-change-ecuador/ (last access: 20 April 2023), 2011.
World Meteorological Organization (WMO): El Niño/La Niña update: 15 February 2017, 5 pp., https://community.wmo.int/en/activity-areas/climate/wmo-el-ninola-nina-updates (last access: 20 April 2023), 2017a.
World Meteorological Organization (WMO): El Niño/La Niña update: 28 April 2017, 5 pp., https://community.wmo.int/en/activity-areas/climate/wmo-el-ninola-nina-updates (last access: 20 April 2023), 2017b.
Xie, R. and Fang, X.: The unusual 2014–2016 El Niño events: Dynamics, prediction and enlightenments, Sci. China Earth Sci., 62, 626–633, https://doi.org/10.1007/s11430-019-9561-2, 2019.
Zambrano-Mera, Y. E., Rivadeneira-Vera, J. F., and Pérez-Martín, M. A.: Linking El Niño Southern Oscillation for early drought detection in tropical climates: The Ecuadorian coast, Sci. Total Environ., 643, 193–207, https://doi.org/10.1016/j.scitotenv.2018.06.160, 2018.