the Creative Commons Attribution 4.0 License.
the Creative Commons Attribution 4.0 License.
Rainfall thresholds estimation for shallow landslides in Peru from gridded daily data
Carlos Millán-Arancibia
Waldo Lavado-Casimiro
This work aims to generate and evaluate regional rainfall thresholds obtained from a combination of high-resolution gridded rainfall data, developed by the National Service of Meteorology and Hydrology of Peru, and information from observed shallow landslide events. The landslide data were associated with rainfall data, determining triggering and non-triggering rainfall events with rainfall properties from which rainfall thresholds are determined. The validation of the performance of the thresholds is carried out with events that occurred during 2020 and focuses on evaluating the operability of these thresholds in landslide warning systems in Peru. The thresholds are determined for 11 rainfall regions. The method of determining the thresholds is based on an empirical–statistical approach, and the predictive performance of the thresholds is evaluated with true skill statistics. The best predictive performance is the mean daily intensity–duration (Imean−D) threshold curve, followed by accumulated rainfall E. This work is the first estimation of regional thresholds on a country scale to better understand landslides in Peru, and the results obtained reveal the potential of using thresholds in the monitoring and forecasting of shallow landslides caused by intense rainfall and in supporting the actions of disaster risk management.
- Article
(4841 KB) - Full-text XML
- BibTeX
- EndNote
Landslides are one of the most globally impactful hazards causing casualties and damage to public and private property and are responsible for at least 17 % of all natural hazard deaths in the world (Chae et al., 2017; Segoni et al., 2018). Rainfall is the main trigger for shallow landslides, which are responsible for fatalities and economic losses worldwide (Petley, 2012). In Peru, landslides are the fifth most common natural hazard, generating the most emergencies in the last 16 years (INDECI, 2019) along with heavy rains, low temperatures, strong winds, and floods. Most landslides occur during the South American monsoon (Zhou and Lau, 1998) between November and April, and most of them belong to the category of the debris flow that is shallow in nature (Naidu et al., 2018). However, consideration of the physiographic and climatic environment of the country with regard to the relationship between rainfall and landslides has not yet been investigated. Therefore, knowing and understanding the relationship between landslides and rainfall could be valuable in objectively proposing warning and monitoring systems for areas susceptible to landslides.
Terrain saturation is the main cause of landslide occurrence, and this saturation effect can arise in different ways (intense rains; thaws; changes in the level of groundwater; water discharge in lakes, lagoons, and reservoirs; and an increase in stream flow). Out of all these factors that cause saturation and affect soil stability conditions, rainfall is the most frequent and important one in triggering landslides (Prenner et al., 2018; Segoni et al., 2014). However, the maximum probability of occurrence of landslides is not always associated with extreme conditions of heavy rainfall and soil moisture; there is also the influence of the antecedent condition of rainy days prior to the occurrence of landslides (Abraham et al., 2020).
One of the techniques used in the study of rainfall as a triggering factor for landslides is the determination of rainfall thresholds, which has been widely studied worldwide using various methods (empirical, statistical, manual, and probabilistic methods and with physically based models) (Guzzetti et al., 2007; Segoni et al., 2018; Tang et al., 2019; Berti et al., 2020). For rain-induced landslides, the threshold can be defined as rainfall, soil moisture, or hydrological conditions that, when reached or exceeded, are likely to trigger landslides. Thresholds have been developed at different times (sub-hourly, hourly, daily, monthly) and spatial scales (slope scales, local, basin, regional, national, global) depending on the information available (Segoni et al., 2018). For example, empirical–statistical approaches for the estimation of global (Caine, 1980; Guzzetti et al., 2008; Kirschbaum and Stanley, 2018) and national (Leonarduzzi et al., 2017; Peruccacci et al., 2017; Uwihirwe et al., 2020) thresholds have been developed. Empirical approaches to forecasting the occurrence of landslides depend on the definition of rainfall thresholds obtained from different hydrometeorological variables (Gariano et al., 2015; Segoni et al., 2018). A large number of analysis variables could be used to define thresholds (up to 22 were reported) (Guzzetti et al., 2007, 2008). Under this approach, rainfall thresholds for landslide occurrence aim to separate triggering from non-triggering rainfall events. Empirical approaches are widely applied because their analysis and implementation do not require the constant monitoring of the other physical variables on which other types of most robust models are based (e.g., physically based models), and this drawback of the robust models is the main advantage of empirical approaches and its applicability over large areas (Rosi et al., 2012). Another advantage of its application is that it is not subject to the challenges accompanied by other models, mainly the many high-quality input data, such as soil information that is needed, which are associated with high uncertainties too.
Thresholds can be set for different spatial scales depending on the extent of the analysis. A regional scale is understood to be the administrative subdivision of a nation, typically extending over 1000 km2 (Segoni et al., 2018). In the study of national territories, it is necessary to take into account the high meteorological and spatial physiographic variability of the study area, in order to obtain more accurate and reliable rainfall thresholds. This is achieved through the regionalization of the study area into areas with homogeneous meteorological conditions (Segoni et al., 2014). Different approaches have been used for regionalization in the analysis of thresholds; for example, rainfall indices have been used, such as the annual average, daily maximum, monthly average, and monthly daily maximum rainfall, among others (Augusto Filho et al., 2020; Segoni et al., 2014), as well as an environmental subdivision within a national territory based on erodibility and climatology represented by the maximum daily intensity of a rainfall event (Leonarduzzi et al., 2017) or on topography, lithology, land-use, land cover, climate, and meteorology (Peruccacci et al., 2017). In this study, we refer to regions, such as the subdivision of the Peruvian territory, from a maximum daily rainfall perspective.
The main objective of this work is to estimate rainfall thresholds to test the feasibility of a potential early warning system of shallow landslides generated by rainfall from a gridded rainfall database and shallow landslide inventory. Additionally, this work focuses on implementing an objective methodology for empirical rainfall-based landslide early warning at a regional scale, combining a gridded rainfall database and shallow landslide inventory. The novelty of this work is that this is the first approximation of rainfall thresholds in Peru that combines gridded rainfall data and observed event data for landslide monitoring.
2.1 Area of study
Peru is located on the west coast of South America and is characterized by maximum rainfall rates that occur between November and March in its Andean region, with most of the rainfall being produced by convection (Lavado Casimiro et al., 2011). Peru's climate variability is determined by the South American monsoon system, the southward shift of the intertropical convergence zone (ITCZ), and differential warming between the ocean and the land, which contributes to a greater influx of moisture eastward from the tropical Atlantic Ocean to the South American continent, and in which the Andes mountain range plays an important role in modulating rainfall on both the eastern and western slopes (Poveda et al., 2014; Bookhagen and Strecker, 2008; Boers et al., 2014; Lavado Casimiro et al., 2011; Llauca et al., 2021).
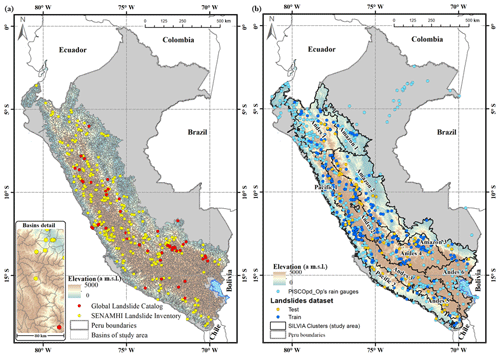
This study adopts the study domain defined for the Monitoring System of Potential Mass Movements Generated by Heavy Rains (SILVIA) (Millan, 2020; Millan et al., 2021) of the National Service of Meteorology and Hydrology of Peru (SENAMHI). This domain was obtained from the superposition of two databases. The first one was a map of landslide susceptibility from the Geological, Mining, and Metallurgical Institute of Peru (Villacorta et al., 2012), which has five categories of susceptibility. The second database contained information regarding spatial discretization in basins of the GEOGloWS ECMWF Streamflow Service (David et al., 2011; Qiao et al., 2019; Souffront Alcantara et al., 2019; Lozano et al., 2021), from which the domain of this study was divided into 5373 basins with median areas of approximately 105 km2. The study area and spatial distribution of the basins are shown in Fig. 1.
2.2 Rainfall data: PISCOpd_Op
The main source of information for this study was the gridded daily rainfall dataset PISCOpd_Op (Gridded Daily Rainfall Operative data of PISCO). PISCOpd_Op is an operational rainfall dataset part of the Peruvian Interpolated data of SENAMHI's Climatological and Hydrological Observations (PISCO) with gridded data on rainfall (Aybar et al., 2020), air temperature (Huerta et al., 2018), reference evapotranspiration (Huerta et al., 2022), and monthly discharges (Llauca et al., 2021) at the scale of all of Peru. PISCOpd_Op has a spatial resolution of 0.1∘ and a daily temporal resolution. PISCOpd_Op has data from 1981 and is updated daily, accumulating daily rainfall (from 07:00 to 07:00 local time, LT), generated from 416 conventional SENAMHI rain gauge networks (see Fig. 1b). PISCOpd_Op is generated based on a genRE interpolation method (van Osnabrugge et al., 2017), which consists of an interpolation using inverse distance weighting (IDW) and includes multipliers that are based on the monthly climatology of PISCOp.
2.3 Landslide event data
The second main source of information used for this research was two catalogs of landslide events: the Landslides Catalog of SENAMHI-Peru (LCS) and the Global Landslide Catalog (GLC-NASA) (Kirschbaum et al., 2015a). Both catalogs consider all types of shallow landslides triggered by rainfall that have been reported in the media, in databases of agencies associated with disasters, in scientific reports, and in other available sources. Most of them belong to the debris flow category which is shallow in nature (Naidu et al., 2018). In this sense, this study used shallow landslides for all types of shallow landslide processes.
The LCS was implemented in January 2019 and has 330 records from the 2014–2020 period. The GLC has 6788 registrations for the whole world, while for Peru, 49 landslide events have been registered, which were temporarily distributed between 2007 and 2014. To use these data, exploratory analyses were performed to avoid inconsistencies in the recording of the events. The spatial correspondence of the data was evaluated through spatial sub-setting between the event locations and the study area. We also assessed data consistency regarding typographical errors. As a result, two incongruous events were determined: the first one was reported in a place without landslide occurrence conditions (out of the study area) and was therefore not considered in the analysis. In the second event, an error in its tabulation was determined; this error was corrected, and the event was included in the analysis. The total number of landslide records is 377, and the spatial distribution of these events is shown in Fig. 1.
2.4 Rainfall threshold model
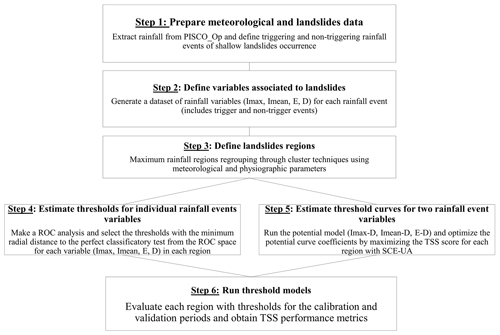
An empirical–statistical approach was used to define rainfall thresholds for landslide-susceptible regions, consisting of the following steps: (1) determination of rainfall events from a historical rainfall series, (2) definition of the variables of rainfall events, (3) definition of landslide regions from maximum daily rainfall region and GEOGloWS basins for the area studio, (4) threshold estimation for individual rainfall event variables for the calibration period based on an objective maximization of predictive performance, (5) threshold estimation for a combination of rainfall event variables for the calibration period based on an objective maximization of predictive performance, and (6) run thresholds models and get metrics for analysis and discussions (the methodology is presented in Fig. 2). Below are the details of the method.
The first step was the construction of a historical rainfall series from gridded rainfall data (PISCOpd_Op) for each basin that had a minimum of one landslide event. After obtaining the rainfall series, rainfall events were defined along with a historical series for each selected basin. For this work, we define an independent rainfall event as a series of consecutive rainy days where it has rained above a minimum rainfall threshold (Fig. 3). Many authors use minimum thresholds of 1 mm to define rainy days (Dai, 2006; Dai et al., 2007; Leonarduzzi et al., 2017; Shen et al., 2021; Tian et al., 2007; Yong et al., 2010). However, given the great climatology spatial variability in the study area, it was determined that there was not a single minimum threshold for the entire territory, but a minimum threshold was discretized from the bias of PISCOpd_Op for non-rainy days. The PISCOpd_Op bias was determined when rain gauges did not report rain (0 mm), and the discretized minimum threshold (Umin) of rain was defined according to the following Eq. (1):
where s is the average of simple bias when rainfall stations reported a value of 0 rainfall compared with the estimation in PISCOpd_Op. And U0 is the initial minimum rainfall threshold, and it is established as 1 mm for all regions with the exception of coastal Pacific regions at which it is considered 0.5 mm. Once rainfall events were defined, they were classified into triggering or non-triggering events, i.e., if a landslide occurred during the rainfall event.
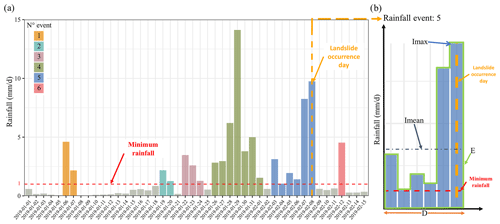
Figure 3(a) Extract from the rainfall time series (rainy period 2019) for an example basin, where rainfall events are observed (each color is a rainfall event, and the lead-colored ones are non-rainy days). (b) An example of a rainfall event associated with the occurrence of a landslide, in this case, the rain event no. 5, where the variables analyzed for the estimation of thresholds are shown: the maximum daily intensity Imax (mm per day), the accumulated rainfall E (mm), the duration D (day), and the mean daily intensity (mm per day).
The second step was to determine analysis variables for each rainfall event, for which the maximum daily intensity Imax (mm per day), the accumulated rainfall E (mm), the duration D (day), and the mean daily intensity (mm per day) were calculated. Concerning the triggering rainfall events, two scenarios were considered. The first scenario (entire event – EE) considers all the rainy days of the rainfall event, including the rainfall of the landslide occurrence day, to determine the properties of the rainfall event (Fig. 3). The second scenario (antecedent event – AE) considers only the antecedent rainy days to landslide occurrence to determine the properties of the rainfall event; i.e., AE does not consider the rainfall of the landslide occurrence day. The reason for analyzing the second scenario was to evaluate the level of incidence that is attributed only to antecedent conditions for landslide occurrence, as this allows us to evaluate if it is possible to forecast or warn landslides based only on the antecedent conditions. The temporal evolution of hydrometeorological variables provides an idea of how the critical conditions of the activation of landslides develop (Prenner et al., 2018; Segoni et al., 2018).
The third step consisted of dividing the study area into regions based on clustering techniques (this step is explained in more detail in Sect. 2.5). Next, GEOGloWS basins were merged with regions to determine their spatial correspondence. The fourth and fifth step was to objectively select a rainfall threshold that separates triggering rainfall events from non-triggering rainfall events with the best level of predictive performance. Rainfall thresholds were established by maximizing predictive performance in two ways: the first way includes every rainfall event property independently (Imax, E, D, Imean), and the second one determined was through curve-like thresholds that related two properties (Imax−D and Imean−D) in the form of , where V represents the rainfall properties (Imax and Imean); a and b are the scale and shape parameters of the curve (while for logarithmic space, a is the intersection parameter, and b denotes the slope of the linear curve). Finally, the sixth step consisted of applying the model to the rainfall events and comparing it with the observed landslide events and getting the predictive performance metrics for each region at calibration and validation periods.
2.5 Regionalization
According to the study, on a national scale, it is necessary to consider the meteorological and spatial physiographic high variability governing the country to obtain reliable rainfall thresholds, since a single global or national threshold cannot represent such variability. To achieve rainfall thresholds on a national scale, the approach used was the regionalization of the study area in areas with homogeneous meteorological conditions (Segoni et al., 2014). Research related to thresholds has used rainfall indices such as the annual average, daily maximum, monthly average, monthly daily maximum of rainfall, and other environmental variables for the regionalization of study areas (Augusto Filho et al., 2020; Leonarduzzi et al., 2017; Segoni et al., 2014).
This study uses SENAMHI's Homogeneous Regions of Maximum Daily Rainfall (Yupanqui et al., 2017) as input for the regionalization of the study area. These regions were determined based on clustering techniques from 535 automatic rainfall stations, in which 10 macro-regions and 30 subregions of maximum daily rainfall were identified. The climatic regions established for the present study consisted of a grouping of the 30 maximum daily rainfall regions. The regrouping consisted of a multi-criteria analysis based mainly on the fact that the grouped regions did not exceed a threshold value of 10 in the heterogeneity test (Hosking and Wallis, 1997), which included events recorded in the databases in addition to sharing the similarity of the covariates of relief (altitude) and climatology (mean rainfall). Although this value of 10 indeed exceeds the level of heterogeneity recommended of 2, this tolerance is contemplated since they are regions obtained from a regrouping. From this analysis, 11 regions were obtained for the study area (see Fig. 1). Four thresholds of independent variables (Imax, E, D, Imean) and three curved thresholds (Imax−D and Imean−D) were defined for each region. The total was 77 thresholds for the study area, and 7 thresholds for each region. Figure 4 presents an accumulated rain E box diagram showing its predictive power to discriminate between triggering and non-triggering rainfall events.
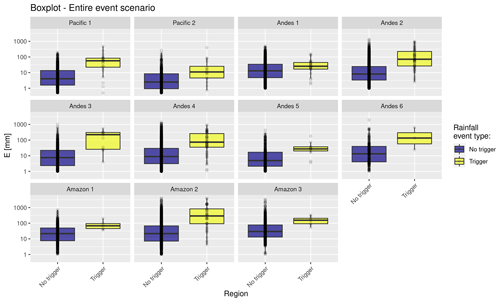
Figure 4Boxplot of triggering (yellow) and non-triggering (blue) total rainfall E for the 11 regions established in this study for Peru. The boxplot graphs include outliers and show the potential predictive for the E variable to separate triggering and non-triggering events of shallow landslides. Also, the plot shows the regional variability of the triggering rainfall events.
2.6 Calibration and validation of thresholds
Calibration and validation are fundamental processes for objectively defining thresholds. The purpose of calibration is to estimate thresholds based on the maximization of predictive or classifier performance capacity. Validation aims to show the potential of the ability to predict or differentiate triggering and non-triggering rainfall events. Among the calibration and validation approaches, the most recommended is to divide the datasets for threshold estimation and another independent set for validation (Segoni et al., 2018). In this work, 377 recorded landslide events were used to define rainfall thresholds in Peru (Fig. 1). For the calibration, all events occurring before 2020 were selected, representing approximately 70 % of the recorded events. Regarding the validation process, it consisted of evaluating thresholds calibrated using the landslide events recorded in 2020, which represented approximately 30 % of the recorded events. This process was carried out for the year 2020, as we wanted to know how the thresholds would perform when they were assimilated into a regional early warning system. This method of calibration/validation that set 1 year of the dataset to the validation procedure is a method that has been used in other research (e.g., Kirschbaum et al., 2015b; Dikshit et al., 2019).
For the evaluation of thresholds in the calibration and validation procedure, a confusion matrix (also called a contingency table) was used. A confusion matrix is a tool used to determine the accuracy of binary classification models (triggering and non-triggering rainfall events) and also used to evaluate the analysis of concordance between the results of the model and the observed data. A confusion matrix was computed for each threshold and counted the number of true successes or true positives (TPs), the number of false positives (FPs), the number of true negatives (TNs), and the number of false negatives (FNs), from which various performance statistics can be calculated. Some of the most common measures for landslide forecasting are the sensitivity (), specificity () and true skill statistic () (e.g., Staley et al., 2013; Gariano et al., 2015; Leonarduzzi et al., 2017; Mirus et al., 2018; Leonarduzzi and Molnar, 2020; Hirschberg et al., 2021).
The TSS is an efficiency statistic that helps in the measurement of the goodness-of-threshold models, as it is an integrative measure of the predictive performance of the model. The TSS is more objective than simply a random manual estimation (Frattini et al., 2010). It varies between 1 and −1, with its optimal score equal to 1, which indicates the maximum performance of the model. is the difference between the true positive rate (sensitivity se) and false alarm rate (1-specificity sp), which are the two most important components for providing early warnings (Leonarduzzi et al., 2017). The TSS is also referred to as the Peirce skill score (Peirce, 1884), the Youden index (Youden, 1950), or the Hanssen–Kuipers skill score (Hanssen and Kuipers, 1965). The benefit of using the specificity over the false positive rate is that in a perfect model TSS, sensitivity, and specificity all equal 1 (Hirschberg et al., 2021).
For thresholds based on properties independently (Imax, E, D, or Imean), the overall impression of the predictive power was estimated with the so-called receiver operating characteristic (ROC) curve (Fawcett, 2006), from which the minimum radial distance to the perfect classificatory test (TSS=1, with se=1 and ) was used to select the individual variable threshold (e.g., Uwihirwe et al., 2020; Gariano et al., 2015; Postance et al., 2018), while for the curve-like thresholds (Imax−D and Imean−D) the scale parameter a and the shape parameter b of the curve model are simultaneously tuned to maximize the true skill statistics (TSS) (e.g., Leonarduzzi et al., 2017; Hirschberg et al., 2021), with an initial approximation of the curve based on a= average of the variable V of the triggering rainfall events and b=0.5. This maximization was automatically calibrated using the shuffled complex evolutionary algorithm (SCEA-UA) (Duan et al., 1993), considering the TSS as the objective function. The methodology was applied for each region within the study area, finding different thresholds for each of them.
3.1 Rainfall thresholds
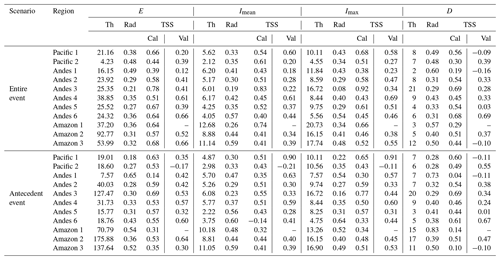
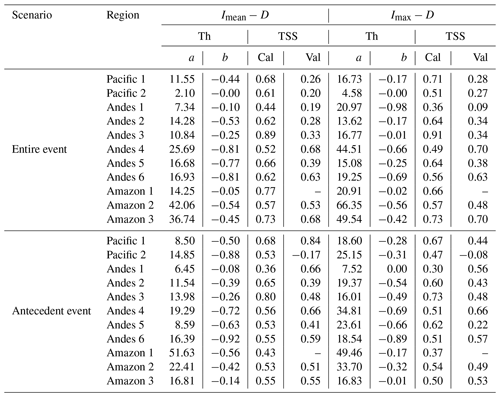
The calibrated thresholds for the individual properties of the events (Imax, E, D, Imean) are shown in Table 1, and the curved thresholds (Imax−D and Imean−D) are shown in Table 2. They are presented for two scenarios: the first one describes the rainfall events that include rainfall on the landslide occurrence day, called the entire event (EE), and the second one only includes the antecedent conditions up to 1 d before the landslide occurrence, called the antecedent event (AE), given that we are interested in analyzing landslide events under an approach that includes the predictive capacity of antecedent conditions and their influence on the occurrence of future events for the operation of early warning services.
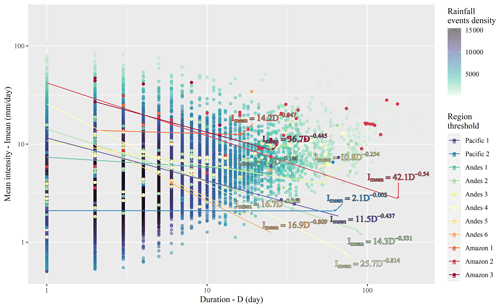
From the results, it is observed that thresholds with the best average performance for entire events were E (TSS=0.59) for individual properties and Imean−D (TSS=0.65) for combined curves. As expected, the integration of properties into curves produced a better overall performance compared with the properties of individual events. Between the two curves (Imax−D and Imean−D), the Imean−D curve performed the best (Fig. 5), with TSS=0.65 for calibration and TSS=0.42 for validation.
The results show that the components with the lowest performance for threshold determination were duration (D) for both the calibration period and validation, followed by the average rainfall rate (Imean). In the case of the combined curves, there is a smaller difference in their performances, with the Imax−D being the one with the lowest performance. These thresholds do not have a good ability to discriminate between triggering rainfall events and non-triggering events.
3.2 Impact of regionalization
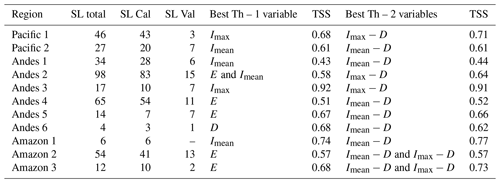
The study area was regionalized into 11 regions based on maximum daily rainfall information. The estimated results show the rainfall variability of Peru in the magnitudes of the thresholds for each region is presented in Table 1. Regionally, the best-performing threshold of a single variable, cumulative rainfall E, averaging 33 mm, ranged from 4.23 mm (Pacific 2) to 92.77 mm (Amazon 2). Imax ranged from 4.55 mm d−1 (Pacific 2) to 20.73 mm d−1 (Amazon 1) with an average of 11.83 mm d−1. The region with the best predictive performance was Andes 3, with a TSS of 0.8 for the mean of the thresholds of individual variables and a TSS of 0.89 for the mean of the threshold-type curve in scenario 2. The threshold with the best performance for this region was Imax=16.72 mm d−1 (TSS=0.92), which correctly separated 100 % of triggering rainfall events and only had an 8 % rate of false alarms. Similarly, the Imax−D curve (TSS=0.91) correctly separated 100 % of triggering rainfall events and only had a 9 % rate of false alarms. A summary of the best single variable and curved thresholds based on the TSS for calibration results for each region is presented in Table 3.
Table 3Number of SL events and best thresholds for one and two variables for each region (Th: threshold, SL: number of landslides per region, Cal: calibration, Val: validation).
Regionalization improves the separation between triggering and non-triggering rainfall events. The results for single-variable thresholds are presented in Fig. 6. The calibrated thresholds performed better overall in the Andes 3 (TSS=0.83) areas compared with the Andes 1 (TSS=0.4), Andes 4 (TSS=0.47), and Amazon 1 (TSS=0.5) regions, which were the regions with the lowest performance. In fact, most of the landslides recorded occurred in the Andes 3 region (Fig. 7). With respect to the two Pacific regions, the Pacific 1 region (TSS=0.66) performed better than the Pacific 2 region (TSS=0.51). In the wettest regions of the Amazon, the Amazon 1 region was the best performing, followed by the Amazon 3 and Amazon 2 regions. This Amazon region and the Altiplano region (Andes 6) were the regions with the least calibration events.
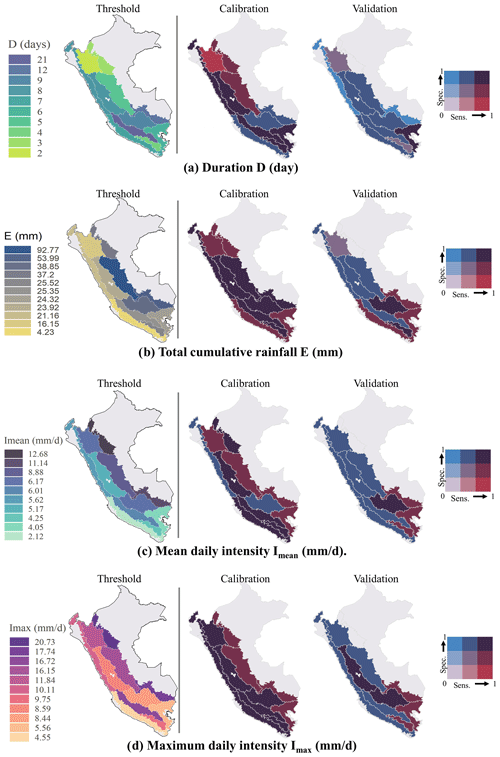
Figure 6The first column shows the spatial distribution of rainfall thresholds for independent variable magnitudes for Peru: (a) day D (days), (b) total cumulative rainfall E (mm), (c) mean daily intensity Imean (mm per day), and (d) maximum daily intensity Imax (mm per day). The second and third columns show the bivariate maps, indicating the spatial distribution of the sensitivity (probability of correctly predicting landslide triggering rainfall events) and specificity (probability of correctly predicting non-triggering rainfall events from landslide) of the thresholds for calibration and validation.
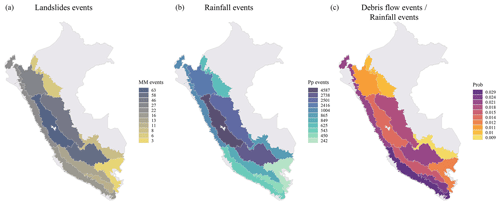
Figure 7Spatial distribution at regional scale of the number of landslide events (a), number of rainfall events (b), and a probability (c) of landslides triggering rainfall event.
The results do not show that any drainage (Pacific, Andes, or Amazon) stands out in separating triggering and non-triggering rainfall events; on the contrary, there are regions with good performance and regular performance along the Pacific, Andes, and Amazon. The Andes 6 (4 SL events), Amazon 1 (6 SL events), and Amazon 3 (12 SL events) regions were the ones that had the least number of events for calibration and validation. The other regions included more than 10 events (Fig. 7), highlighting the Andes 2 (98 SL events), Andes 4 (65 SL events), Amazon 2 (54 SL events), and Pacific 1 (46 SL events) regions.
3.3 Effect of antecedent conditions
It is known that the antecedent conditions of the soil play an important role in the occurrence of landslides, especially in their magnitude. This is the reason why this study was analyzed and included the separation of rainfall events that only consider the rate of rain until a day before the day of landslide occurrence (Table 1). It is observed that, in the calibration phase, the antecedent event scenario obtained lower returns than the integer event scenario. However, in the validation stage for the year 2020, it was observed that, for some thresholds in isolation, their performance was higher; for example, for the Pacific 1 region, the Imax and Imean thresholds obtained higher performances than the entire event scenario (including the rainfall rate of the mm event day). This means that in the days prior to the day of occurrence, there was a day with intense rain greater than that on the day of occurrence, and this allows the separation of that event as a triggering event, in addition to altering the average rainfall rate associated with said event.
3.4 Evaluation of threshold performance
Validation was carried out for the events that occurred in 2020 by simulating the operability of the calibrated thresholds in a regional alert system. The Amazon 1 region did not contemplate landslide events for that year, so it did not enter this assessment. The validation shows that in most thresholds there was a clear magnitude decrease (Tables 1 and 2). For example, the Imax threshold, which obtained the best performance in calibration, decreased for this period, except for the Andes 4, Andes 6, and Amazon 3 regions, which improved in this validation; this means that the threshold allowed for the separation of the rainfall events of 2020 better than expected in calibration.
The variable D was confirmed to be, by itself, a bad threshold separator for the separation of triggering rain events from those that are not triggering. Even with negative performances (Pacific 1, Andes 1, and Amazon 3), this negativity was associated with the sensitivity (correct prediction of landslides) of the model for these regions, which was 0; i.e., the estimated threshold in the calibration was not able to separate the rainfall events. However, this variable shows that we can associate landslides with continuous rainfall events with an antecedent duration of 8 d.
Regarding the variability of the thresholds (Fig. 5), we can explain it mainly to the rainfall climatology in Peru. It can be seen that the magnitudes have a relationship concerning the spatial distribution of rainfall in Peru, that is, low thresholds related to rainfall of lesser magnitude in the arid zones in the western part of Peru (Pacific), thresholds intermediates related to the increase in the magnitude of rainfall in the middle part or mountainous region (Andes) and the highest thresholds related to wet regions (Amazon). However, the Andes 1, Andes 3, and Andes 6 regions do not have this relationship, so this discussion is not conclusive and is considered to be related to limited data, so it is suggested that this variability be confirmed in future research that includes more shallow landslides events data.
Regarding the validation period, 61 events were used in total, resulting in the TSS statistic being more sensitive, mainly due to the increased sensitivity of the model (i.e., the probability of correctly predicting triggering rainfall events of landslide), while specificity remained approximately the same (i.e., the probability of correctly predicting non-triggering rainfall events of landslide). This effect points to the importance of obtaining wide and robust inventories of landslides.
In this research, rainfall thresholds were determined that allow for the separation of triggering and non-triggering rainfall events for shallow landslide occurrence in two scenarios based on rainfall event variables. This type of analysis has already been objectively developed in previous studies (Peruccacci et al., 2017, 2012; Segoni et al., 2014; Rosi et al., 2012; Leonarduzzi et al., 2017; Uwihirwe et al., 2020; Abraham et al., 2019). But, this work is the first approximation of regional thresholds on a national scale in Peru and will serve as a starting point and reference for the continued development of this type of research in Peru.
The estimated thresholds are shown in Table 1 for independent variables and Table 2 for curve thresholds. The thresholds with the best performance were E for the individual variables and Imean−D for curve thresholds. The variable that had the lowest performance was the duration of the event, D, so it should not be used independently but rather combined with other event variables. However, it allows us to associate landslide events with the antecedent rain conditions of the last 8 d, an association that can be used for future research.
Concerning the curve-like thresholds, the TSS had a slight improvement, all exceeding 0.5 in the calibration of the Imean−D (the threshold with the best performance for curved thresholds), except for Andes 1. The selection of these thresholds is based on an optimization model (maximizing the TSS), through which a high detection rate of landslides (sensitivity) is sought, maintaining, as far as possible, a low rate of detection of false positives (specificity). However, it was observed that to seek this optimization, the detection of landslides is sacrificed (giving false negatives), though false alarms are reduced, and this is a dilemma in terms of alert systems, but TSS is a good balance between landslides detection and false alarms.
The Pacific 1 region is constantly impacted by shallow landslides and also contains most of the cities with the highest population density in Peru, so their evaluation is highly relevant. In this region, it was observed that the Imax (TSS=0.68) and Imax−D (TSS=0.71) were the best thresholds for the entire event scenario, which indicates that the catchments in this region are highly susceptible to events of maximum intensity. While the Imax (TSS=0.65) and Imean−D (TSS=0.68) thresholds were the best thresholds for the antecedent event scenario. The Imax variable had the best performance, which suggests that high-intensity rains have a high conditioning impact on landslide development. Regarding the fact that validation performances in the antecedent scenario were higher in the calibration performances, it may be because the validation set is too small.
Regionalization was necessary given the high climatic variability in Peru, evidenced by the differences in magnitude between the thresholds. This regionalization helped us to observe the regions of Peru where there is greater landslide occurrence and the response to this type of daily threshold. For example, we observed that the Andes 2 (the region with the highest number of events) had a better response for Imax in the calibration and validation process. Peruccacci et al. (2012) found that the number of events must be greater than 175 to limit the relative uncertainty below 10 %, but this figure may change for a different dataset. Based on this, it is observed that only four regions (Andes 2, Andes 4, Pacific 1, and Amazon 2) have a number of events that are acceptable. The other regions have a greater source of uncertainty due to the quantity of the data. A summary of the number of shallow landslide events used for the research and the thresholds with the best performances per region is presented in Table 3.
The evaluation of the performance of the thresholds was carried out through validation with the events of 2020. However, it was observed that the performances decreased, which may be due to the fact that, in the year 2020, there were no extreme rainfall events as in other years, and the number of landslides was lower than in other years. Even the Amazon 1 region had no record of activation events; thus, we can state that the low performance was because the thresholds do not represent landslide events with low-impact magnitude, and this is associated with one of the focuses of the model, which is to reduce the rate of false alarms.
Table 4TSS comparison between validation approaches (1 year: 1-year selection and Random: random selection).

The calibration/validation methodology, based on taking 1 year of observations for the validation set, which was used in other research works (e.g., Kirschbaum et al., 2015b; Dikshit et al., 2019), is quite short, and there is the risk of overinterpretation. For this reason, this method was compared with other validation methods based on a random selection of the dataset (e.g., Brunetti et al., 2021; Gariano et al., 2020). According to this method, the data were divided randomly into 70 % for calibration and 30 % for validation. The comparison of both validation approaches is shown in Table 4. In this regard, the comparison between the validation methods did not indicate significant changes between each method. The results are very similar probably because the data size is not large enough to note the variations between the methods. It is highly recommended for future research to focus on the expansion of the dataset and then compare the validation method efficiency.
There are still many limitations to rainfall threshold study at the regional scale in Peru. Mainly, the landslide short records are not enough to limit uncertainty in the threshold definition (Peruccacci et al., 2012; Hirschberg et al., 2021). Another important source of uncertainty was the use of coarse temporal rainfall data resolution that cause a systematic underestimation of the thresholds (Marra, 2019; Gariano et al., 2020). Another is the spatial rainfall data resolution because a 10 km cell may cover several streams. And finally, the regionalization can be not enough representative of the high variability of descriptor landslide variables. These limitations must be taken into account in future research.
This study is the first approximation of the regional rainfall thresholds for landslide occurrence in Peru. It was conducted to estimate and analyze the relationship between rainfall and its landslide trigger effect in 11 rainfall regions in Peru using an empirical method. The advantage of this study is the use of landslide datasets available at the national scale to objectively determine and compare rainfall thresholds. Daily gridded rainfall data and landslide data were used to estimate triggering and non-triggering rainfall events for the occurrence of landslides. With these data it was possible to estimate and validate rainfall thresholds for the activation of shallow landslides triggered by rainfall. Our main conclusions are
- a.
The generation of thresholds using the empirical–statistical method and calibrations based on minimum radial distance and maximum true skill statistics (TSS) were successful in defining rainfall thresholds for landslides. The best predictive performance was obtained using the mean intensity–duration (Imean−D) threshold curve, followed by the total rainfall E. The duration of the event independently has very low predictive power.
- b.
The performances of the calibrated thresholds had a high variability between regions. These differences in performance are associated with the high variability of rainfall events in each region, where best performances occur in areas where it is easier to separate triggering and non-triggering rainfall events for shallow landslides occurrence (e.g., Andes 3, Amazon 1, Amazon 3, and Pacific 1 regions). However, in other regions, this separation between rainfall events is more complex to carry out, since there are a lot of non-triggering rainfall events with high magnitudes, reflecting in lower performances (e.g., Andes 1, Andes 4, and Amazon 2). Thus, the regionalization shows that there exist regions where the climate component had more predominance in the shallow landslide occurrence in comparison with other regions where lithology could have more influence in the occurrence of shallow landslides than just the rains. Future studies can explore regionalization based on lithology.
- c.
Through the rainfall and landslides databases, it is possible to generate daily rainfall thresholds for shallow landslide occurrence. However, the uncertainties associated with these databases are the main source of uncertainty for the thresholds. The few landslides recorded made the validation performance highly sensitive to the few data (i.e., a single event could lead to a high or low value of the performance statistics). Thus, only four regions (Andes 2, Andes 4, Pacific 1, and Amazon 2) have enough events to limit these uncertainties. Despite these uncertainties, the framework set up of this work allows for systematic updates of the thresholds as the records grow.
The results of this work demonstrate the potential of rainfall thresholds based on the characteristics of rainfall events associated with landslides for implementation in landslide monitoring in Peru. Future work should focus on three main perspectives based on the limitations and sources of uncertainty: (i) improvement in the spatio-temporal resolution of gridded rainfall; (ii) improvement in the spatial discretization of regions where the greatest number of landslides take place, which is dependent firstly on improving the spatio-temporal resolution of rainfall; and (iii) the assimilation of landslide databases to improve the certainty of the thresholds and reduce their sensitivity.
The source code with an example data set is available from GitHub (https://doi.org/10.4211/hs.1b0db50d8e4c40199ba841d8640c568a; Millan-Arancibia and Lavado-Casimiro, 2023).
CMA conducted the analysis and interpreted the results. WLC and CMA conceived the research and prepared the paper.
The contact author has declared that neither of the authors has any competing interests.
Publisher’s note: Copernicus Publications remains neutral with regard to jurisdictional claims in published maps and institutional affiliations.
This article is part of the special issue “Hydro-meteorological extremes and hazards: vulnerability, risk, impacts, and mitigation”. It is a result of the European Geosciences Union General Assembly 2022, Vienna, Austria, 23–27 May 2022.
This work was supported by the National Service of Meteorology and Hydrology of Peru (SENAMHI), which also provided access to the rainfall and landslide databases. The authors are grateful to the journal editor Francesco Marra and to three anonymous referees for their constructive comments that contributed to improving the work.
This paper was edited by Francesco Marra and reviewed by three anonymous referees.
Abraham, M. T., Pothuraju, D., and Satyam, N.: Rainfall thresholds for prediction of landslides in Idukki, India: An empirical approach, Water, 11, 1–16, https://doi.org/10.3390/w11102113, 2019. a
Abraham, M. T., Satyam, N., Pradhan, B., and Alamri, A. M.: Forecasting of Landslides Using Rainfall Severity and Soil Wetness: A Probabilistic Approach for Darjeeling Himalayas, Water, 12, 804, https://doi.org/10.3390/w12030804, 2020. a
Augusto Filho, O., da Silva Júnior, P. S., and Eiras, C. G. S.: Simple rainfall indices for forecasting hazardous events of hydrologic and geologic nature, Nat. Hazards, 101, 689–709, https://doi.org/10.1007/s11069-020-03890-4, 2020. a, b
Aybar, C., Fernández, C., Huerta, A., Lavado, W., Vega, F., and Felipe-Obando, O.: Construction of a high-resolution gridded rainfall dataset for Peru from 1981 to the present day, Hydrolog. Sci. J., 65, 770–785, https://doi.org/10.1080/02626667.2019.1649411, 2020. a
Berti, M., Bernard, M., Gregoretti, C., and Simoni, A.: Physical Interpretation of Rainfall Thresholds or Runoff-Generated Debris Flows, J. Geophys. Res.-Earth, 125, e2019JF005513, https://doi.org/10.1029/2019JF005513, 2020. a
Boers, N., Bookhagen, B., Barbosa, H. M., Marwan, N., Kurths, J., and Marengo, J. A.: Prediction of extreme floods in the eastern Central Andes based on a complex networks approach, Nat. Commun., 5, 1–7, https://doi.org/10.1038/ncomms6199, 2014. a
Bookhagen, B. and Strecker, M. R.: Orographic barriers, high-resolution TRMM rainfall, and relief variations along the eastern Andes, Geophys. Res. Lett., 35, 1–6, https://doi.org/10.1029/2007GL032011, 2008. a
Brunetti, M. T., Melillo, M., Gariano, S. L., Ciabatta, L., Brocca, L., Amarnath, G., and Peruccacci, S.: Satellite rainfall products outperform ground observations for landslide prediction in India, Hydrol. Earth Syst. Sci., 25, 3267–3279, https://doi.org/10.5194/hess-25-3267-2021, 2021. a
Caine, N.: The rainfall intensity-duration control of shallow landslides and debris flows, Geogr. Ann. A, 62, 23–27, https://doi.org/10.2307/520449, 1980. a
Chae, B. G., Park, H. J., Catani, F., Simoni, A., and Berti, M.: Landslide prediction, monitoring and early warning: a concise review of state-of-the-art, Geosci. J., 21, 1033–1070, https://doi.org/10.1007/s12303-017-0034-4, 2017. a
Dai, A.: Precipitation Characteristics in Eighteen Coupled Climate Models, J. Climate, 19, 4605–4630, https://doi.org/10.1175/JCLI3884.1, 2006. a
Dai, A., Lin, X., and Hsu, K.-L.: The frequency, intensity, and diurnal cycle of precipitation in surface and satellite observations over low- and mid-latitudes, Clim. Dynam., 29, 727–744, https://doi.org/10.1007/s00382-007-0260-y, 2007. a
David, C. H., Maidment, D. R., Niu, G. Y., Yang, Z. L., Habets, F., and Eijkhout, V.: River network routing on the NHDPlus dataset, J. Hydrometeorol., 12, 913–934, https://doi.org/10.1175/2011JHM1345.1, 2011. a
Dikshit, A., Sarkar, R., Pradhan, B., Acharya, S., and Dorji, K.: Estimating Rainfall Thresholds for Landslide Occurrence in the Bhutan Himalayas, Water, 11, 1616, https://doi.org/10.3390/w11081616, 2019. a, b
Duan, Q., Gupta, V., and Sorooshian, S.: Shuffled complex evolution approach for effective and efficient global minimization, J. Optimiz. Theory App., 76, 501–521, https://doi.org/10.1007/BF00939380, 1993. a
Fawcett, T.: An introduction to ROC analysis, Pattern Recogn. Lett., 27, 861–874, https://doi.org/10.1016/j.patrec.2005.10.010, 2006. a
Frattini, P., Crosta, G., and Carrara, A.: Techniques for evaluating the performance of landslide susceptibility models, Eng. Geol., 111, 62–72, https://doi.org/10.1016/j.enggeo.2009.12.004, 2010. a
Gariano, S. L., Brunetti, M. T., Iovine, G., Melillo, M., Peruccacci, S., Terranova, O., Vennari, C., and Guzzetti, F.: Calibration and validation of rainfall thresholds for shallow landslide forecasting in Sicily, southern Italy, Geomorphology, 228, 653–665, https://doi.org/10.1016/j.geomorph.2014.10.019, 2015. a, b, c
Gariano, S. L., Melillo, M., Peruccacci, S., and Brunetti, M. T.: How much does the rainfall temporal resolution affect rainfall thresholds for landslide triggering?, Nat. Hazards, 100, 655–670, https://doi.org/10.1007/s11069-019-03830-x, 2020. a, b
Guzzetti, F., Peruccacci, S., Rossi, M., and Stark, C. P.: Rainfall thresholds for the initiation of landslides in central and southern Europe, Meteorol. Atmos. Phys., 98, 239–267, https://doi.org/10.1007/s00703-007-0262-7, 2007. a, b
Guzzetti, F., Peruccacci, S., Rossi, M., and Stark, C. P.: The rainfall intensity-duration control of shallow landslides and debris flows: An update, Landslides, 5, 3–17, https://doi.org/10.1007/s10346-007-0112-1, 2008. a, b
Hanssen, A. W. and Kuipers, W. J. A.: On the relationship between the frequency of rain and various meteorological parameters, in: Mededelingen en verhandelingen – no. 81, edited by: Staatsdrukkerij- en Uitgeverijbedrijf, Koninklijk Nederlands Meteorologisch Instituut, Netherlands, 1965. a
Hirschberg, J., Badoux, A., McArdell, B. W., Leonarduzzi, E., and Molnar, P.: Evaluating methods for debris-flow prediction based on rainfall in an Alpine catchment, Nat. Hazards Earth Syst. Sci., 21, 2773–2789, https://doi.org/10.5194/nhess-21-2773-2021, 2021. a, b, c, d
Hosking, J. R. M. and Wallis, J. R.: Regional Frequency Analysis, Cambridge University Press, https://doi.org/10.1017/cbo9780511529443, 1997. a
Huerta, A., Aybar, C., and Lavado-Casimiro, W.: PISCO temperatura versión 1.1 (PISCOt v1.1), National Meteorology and Hydrology Service of Peru (SENAMHI) [data set], Lima, Peru https://iridl.ldeo.columbia.edu/SOURCES/.SENAMHI/.HSR/.PISCO/.Temp/ (last access: 16 December 2022), 2018. a
Huerta, A., Bonnesoeur, V., Cuadros-Adriazola, J., Gutierrez, L., Ochoa-Tocachi, B. F., Román-Dañobeytia, F., and Lavado-Casimiro, W.: PISCOeo_pm, a reference evapotranspiration gridded database based on FAO Penman-Monteith in Peru, Scientific Data, 9, 1–18, https://doi.org/10.1038/s41597-022-01373-8, 2022. a
INDECI: Compendio Estadístico Del INDECI 2019, En La Preparación, respuesta y rehabilitación de la GRD, Lima, 2019. a
Kirschbaum, D. and Stanley, T.: Satellite-Based Assessment of Rainfall-Triggered Landslide Hazard for Situational Awareness, Earth's Future, 6, 505–523, https://doi.org/10.1002/2017EF000715, 2018. a
Kirschbaum, D., Stanley, T., and Zhou, Y.: Spatial and temporal analysis of a global landslide catalog, Geomorphology, 249, 4–15, https://doi.org/10.1016/j.geomorph.2015.03.016, 2015a. a
Kirschbaum, D. B., Stanley, T., and Simmons, J.: A dynamic landslide hazard assessment system for Central America and Hispaniola, Nat. Hazards Earth Syst. Sci., 15, 2257–2272, https://doi.org/10.5194/nhess-15-2257-2015, 2015b. a, b
Lavado Casimiro, W. S., Labat, D., Guyot, J. L., and Ardoin-Bardin, S.: Assessment of climate change impacts on the hydrology of the Peruvian Amazon-Andes basin, Hydrol. Process., 25, 3721–3734, https://doi.org/10.1002/hyp.8097, 2011. a, b
Leonarduzzi, E. and Molnar, P.: Deriving rainfall thresholds for landsliding at the regional scale: daily and hourly resolutions, normalisation, and antecedent rainfall, Nat. Hazards Earth Syst. Sci., 20, 2905–2919, https://doi.org/10.5194/nhess-20-2905-2020, 2020. a
Leonarduzzi, E., Molnar, P., and McArdell, B. W.: Predictive performance of rainfall thresholds for shallow landslides in Switzerland from gridded daily data, Water Resour. Res., 53, 6612–6625, https://doi.org/10.1002/2017WR021044, 2017. a, b, c, d, e, f, g, h
Llauca, H., Lavado-Casimiro, W., Montesinos, C., Santini, W., and Rau, P.: PISCO_HyM_GR2M: A model of monthly water balance in Peru (1981–2020), Water, 13, 1–19, https://doi.org/10.3390/w13081048, 2021. a, b
Lozano, J. S., Bustamante, G. R., Hales, R. C., Nelson, E. J., Williams, G. P., Ames, D. P., and Jones, N. L.: A streamflow bias correction and performance evaluation web application for geoglows ecmwf streamflow services, Hydrology, 8, 71, https://doi.org/10.3390/HYDROLOGY8020071, 2021. a
Marra, F.: Rainfall thresholds for landslide occurrence: systematic underestimation using coarse temporal resolution data, Nat. Hazards, 95, 883–890, https://doi.org/10.1007/s11069-018-3508-4, 2019. a
Millan, C.: Sistema de Monitoreo de movimientos en masa potenciales generados por lluvias intensas del SENAMHI (SILVIA), in: Estudios Hidrológicos del SENAMHI Resúmenes Ejecutivos - 2020, edited by: Lavado-Casimiro, W., Lima, 1st edn., National Meteorology and Hydrology Service of Peru (SENAMHI), 17–21, https://www.researchgate.net/publication/344242328_Estudios_Hidrologicos_del_SENAMHI_Resumenes_Ejecutivos_-_2020 (last access: 16 December 2022), 2020. a
Millan-Arancibia, C. and Lavado-Casimiro, W.: Source code for: Rainfall thresholds estimation for shallow landslides in Peru from gridded daily data, HydroShare [code and data set], https://doi.org/10.4211/hs.1b0db50d8e4c40199ba841d8640c568a, 2023. a
Millan, C., Lavado, W., Vega, F., Felipe, O., Acuña, J., and Takahashi, K.: SILVIA: An operational system to monitoring landslides forced by heavy precipitations at national scale in Peru, EGU General Assembly 2020, Online, 4–8 May 2020, EGU2020-10970, https://doi.org/10.5194/egusphere-egu2020-10970, 2021. a
Mirus, B. B., Morphew, M. D., and Smith, J. B.: Developing Hydro-Meteorological Thresholds for Shallow Landslide Initiation and Early Warning, Water, 10, 1274, https://doi.org/10.3390/w10091274, 2018. a
Naidu, S., Sajinkumar, K. S., Oommen, T., Anuja, V. J., Samuel, R. A., and Muraleedharan, C.: Early warning system for shallow landslides using rainfall threshold and slope stability analysis, Geosci. Front., 9, 1871–1882, https://doi.org/10.1016/j.gsf.2017.10.008, 2018. a, b
Peirce, C.: The Numerical Measure of Success in Predictions, Science, ns-4, 453–454, https://doi.org/10.1126/science.ns-4.93.453.b, 1884. a
Peruccacci, S., Brunetti, M. T., Luciani, S., Vennari, C., and Guzzetti, F.: Lithological and seasonal control on rainfall thresholds for the possible initiation of landslides in central Italy, Geomorphology, 139–140, 79–90, https://doi.org/10.1016/j.geomorph.2011.10.005, 2012. a, b, c
Peruccacci, S., Brunetti, M. T., Gariano, S. L., Melillo, M., Rossi, M., and Guzzetti, F.: Rainfall thresholds for possible landslide occurrence in Italy, Geomorphology, 290, 39–57, https://doi.org/10.1016/j.geomorph.2017.03.031, 2017. a, b, c
Petley, D.: Global patterns of loss of life from landslides, Geology, 40, 927–930, https://doi.org/10.1130/G33217.1, 2012. a
Postance, B., Hillier, J., Dijkstra, T., and Dixon, N.: Comparing threshold definition techniques for rainfall-induced landslides: A national assessment using radar rainfall, Earth Surf. Proc. Land., 43, 553–560, https://doi.org/10.1002/esp.4202, 2018. a
Poveda, G., Jaramillo, L., and Vallejo, L. F.: Seasonal precipitation patterns along pathways of South American low-level jets and aerial rivers, Water Resour. Res., 50, 98–118, https://doi.org/10.1002/2013WR014087, 2014. a
Prenner, D., Kaitna, R., Mostbauer, K., and Hrachowitz, M.: The Value of Using Multiple Hydrometeorological Variables to Predict Temporal Debris Flow Susceptibility in an Alpine Environment, Water Resour. Res., 54, 6822–6843, https://doi.org/10.1029/2018WR022985, 2018. a, b
Qiao, X., Nelson, E. J., Ames, D. P., Li, Z., David, C. H., Williams, G. P., Roberts, W., Sánchez Lozano, J. L., Edwards, C., Souffront, M., and Matin, M. A.: A systems approach to routing global gridded runoff through local high-resolution stream networks for flood early warning systems, Environ. Modell. Softw., 120, 104501, https://doi.org/10.1016/j.envsoft.2019.104501, 2019. a
Rosi, A., Segoni, S., Catani, F., and Casagli, N.: Statistical and environmental analyses for the definition of a regional rainfall threshold system for landslide triggering in Tuscany (Italy), J. Geogr. Sci., 22, 617–629, https://doi.org/10.1007/s11442-012-0951-0, 2012. a, b
Segoni, S., Rosi, A., Rossi, G., Catani, F., and Casagli, N.: Analysing the relationship between rainfalls and landslides to define a mosaic of triggering thresholds for regional-scale warning systems, Nat. Hazards Earth Syst. Sci., 14, 2637–2648, https://doi.org/10.5194/nhess-14-2637-2014, 2014. a, b, c, d, e, f
Segoni, S., Piciullo, L., and Gariano, S. L.: A review of the recent literature on rainfall thresholds for landslide occurrence, Landslides, 15, 1483–1501, https://doi.org/10.1007/s10346-018-0966-4, 2018. a, b, c, d, e, f, g
Shen, Z., Yong, B., Gourley, J. J., and Qi, W.: Real-time bias adjustment for satellite-based precipitation estimates over Mainland China, J. Hydrol., 596, 126133, https://doi.org/10.1016/j.jhydrol.2021.126133, 2021. a
Souffront Alcantara, M. A., Nelson, E. J., Shakya, K., Edwards, C., Roberts, W., Krewson, C., Ames, D. P., Jones, N. L., and Gutierrez, A.: Hydrologic Modeling as a Service (HMaaS): A New Approach to Address Hydroinformatic Challenges in Developing Countries, Frontiers in Environmental Science, 7, 158, https://doi.org/10.3389/fenvs.2019.00158, 2019. a
Staley, D. M., Kean, J. W., Cannon, S. H., Schmidt, K. M., and Laber, J. L.: Objective definition of rainfall intensity-duration thresholds for the initiation of post-fire debris flows in southern California, Landslides, 10, 547–562, https://doi.org/10.1007/s10346-012-0341-9, 2013. a
Tang, H., McGuire, L. A., Rengers, F. K., Kean, J. W., Staley, D. M., and Smith, J. B.: Developing and Testing Physically Based Triggering Thresholds for Runoff-Generated Debris Flows, Geophys. Res. Lett., 46, 8830–8839, https://doi.org/10.1029/2019GL083623, 2019. a
Tian, Y., Peters-Lidard, C. D., Choudhury, B. J., and Garcia, M.: Multitemporal Analysis of TRMM-Based Satellite Precipitation Products for Land Data Assimilation Applications, Hydrometeorology, 8, 1165–1183, https://doi.org/10.1175/2007JHM859.1, 2007. a
Uwihirwe, J., Hrachowitz, M., and Bogaard, T. A.: Landslide precipitation thresholds in Rwanda, Landslides, 17, 2469–2481, https://doi.org/10.1007/s10346-020-01457-9, 2020. a, b, c
van Osnabrugge, B., Weerts, A. H., and Uijlenhoet, R.: genRE: A Method to Extend Gridded Precipitation Climatology Data Sets in Near Real-Time for Hydrological Forecasting Purposes, Water Resour. Res., 53, 9284–9303, https://doi.org/10.1002/2017WR021201, 2017. a
Villacorta, S., Fidel, L., and Zavala Carrión, B.: Mapa de susceptibilidad por movimientos en masa del Perú, Revista de la Asociacion Geologica Argentina, 69, 393–399, http://ppct.caicyt.gov.ar/index.php/raga/article/view/1263 (last access: 15 February 2022), 2012. a
Yong, B., Ren, L.-L., Hong, Y., Wang, J.-H., Gourley, J. J., Jiang, S.-H., Chen, X., and Wang, W.: Hydrologic evaluation of Multisatellite Precipitation Analysis standard precipitation products in basins beyond its inclined latitude band: A case study in Laohahe basin, China, Water Resour. Res., 46, W07542, https://doi.org/10.1029/2009WR008965, 2010. a
Youden, W. J.: Index for rating diagnostic tests, Cancer, 3, 32–35, https://doi.org/10.1002/1097-0142(1950)3:1<32::AID-CNCR2820030106>3.0.CO;2-3, 1950. a
Yupanqui, R. S., Lavado-Casimiro, W. S., and Felipe-Obando, O. S.: Regionalización de las precipitaciones máximas en el Perú, Servicio Nacional de Meteorología e Hidrología del Perú (SENAMHI), https://hdl.handle.net/20.500.12542/239 (last access: 16 December 2022), 2017. a
Zhou, J. and Lau, K. M.: Does a monsoon climate exist over South America?, J. Climate, 11, 1020–1040, https://doi.org/10.1175/1520-0442(1998)011<1020:DAMCEO>2.0.CO;2, 1998. a


