the Creative Commons Attribution 4.0 License.
the Creative Commons Attribution 4.0 License.
 | 22 Mar 2022
The Cambodian Mekong floodplain under future development plans and climate change
Alexander J. Horton
Nguyen V. K. Triet
Long P. Hoang
Sokchhay Heng
Panha Hok
Sarit Chung
Jorma Koponen
Water infrastructure development is considered necessary to drive economic growth in the Mekong region of mainland Southeast Asia. Yet the current understanding of hydrological and flood pattern changes associated with infrastructural development still contains several knowledge gaps, such as the interactions between multiple drivers, which may have serious implications for water management, agricultural production, and ecosystem services. This research attempts to conduct a cumulative assessment of basin-wide hydropower dam construction and irrigation expansion, as well as climate change, implications on discharge, and flood changes in the Cambodian Mekong floodplain. These floodplains offer important livelihoods for a considerable part of the 6.4 million people living on them, as they are among the most productive ecosystems in the world – driven by the annual flood pulse. To assess the potential future impacts, we used an innovative combination of three models: Mekong basin-wide distributed hydrological model IWRM-VMod, with the Mekong delta 1D flood propagation model MIKE-11 and 2D flood duration and extent model IWRM-Sub enabling detail floodplain modelling. We then ran scenarios to approximate possible conditions expected by around 2050. Our results show that the monthly and seasonal hydrological regimes (discharges, water levels, and flood dynamics) will be subject to substantial alterations under future development scenarios. Projected climate change impacts are expected to decrease dry season flows and increase wet season flows, which is in opposition to the expected alterations under development scenarios that consider both hydropower and irrigation. The likely impact of decreasing water discharge in the early wet season (up to −30 %) will pose a critical challenge to rice production, whereas the likely increase in water discharge in the mid-dry season (up to +140 %) indicates improved water availability for coping with drought stresses and sustaining environmental flows. At the same time, these changes would have drastic impacts on total flood extent, which is projected to decline by around 20 %, having potentially negative impacts on floodplain productivity and aquaculture, whilst reducing the flood risk to more densely populated areas. Our findings demonstrate the substantial changes that planned infrastructural development will have on the area, potentially impacting important ecosystems and people's livelihoods, calling for actions to mitigate these changes as well as planning potential adaptation strategies.
- Article
(3881 KB) - Full-text XML
-
Supplement
(1477 KB) - BibTeX
- EndNote


-
We study the impact of future scenarios on floods in the Cambodian Mekong floodplain.
-
The full combined development scenario alters flows up to −30 % in the wet season and +140 % in the dry season.
-
Hydropower developments alone reduce total flood extents by more than 20 %.
-
Prey Veng and Takéo are the provinces most susceptible to climate-change-induced flood risks.
The Mekong River basin is the largest river basin in the Southeast Asian mainland. Historically, cyclones and severe tropical storms have generated the most significant Mekong flooding events, the largest of which was recorded in 1966, when tropical storm Phyllis struck the Upper Mekong Basin (Adamson et al., 2009). At the downstream end of the basin (Fig. 1), severe floods have most commonly been recorded in the area around Stung Treng Province, at the confluence of the Mekong and Tonle Sap rivers, and within the Vietnamese Mekong Delta. The last severe flood occurred in 2011, and it is ranked among the highest discharges recorded in the Lower Mekong Basin (LMB) (MRC, 2011).
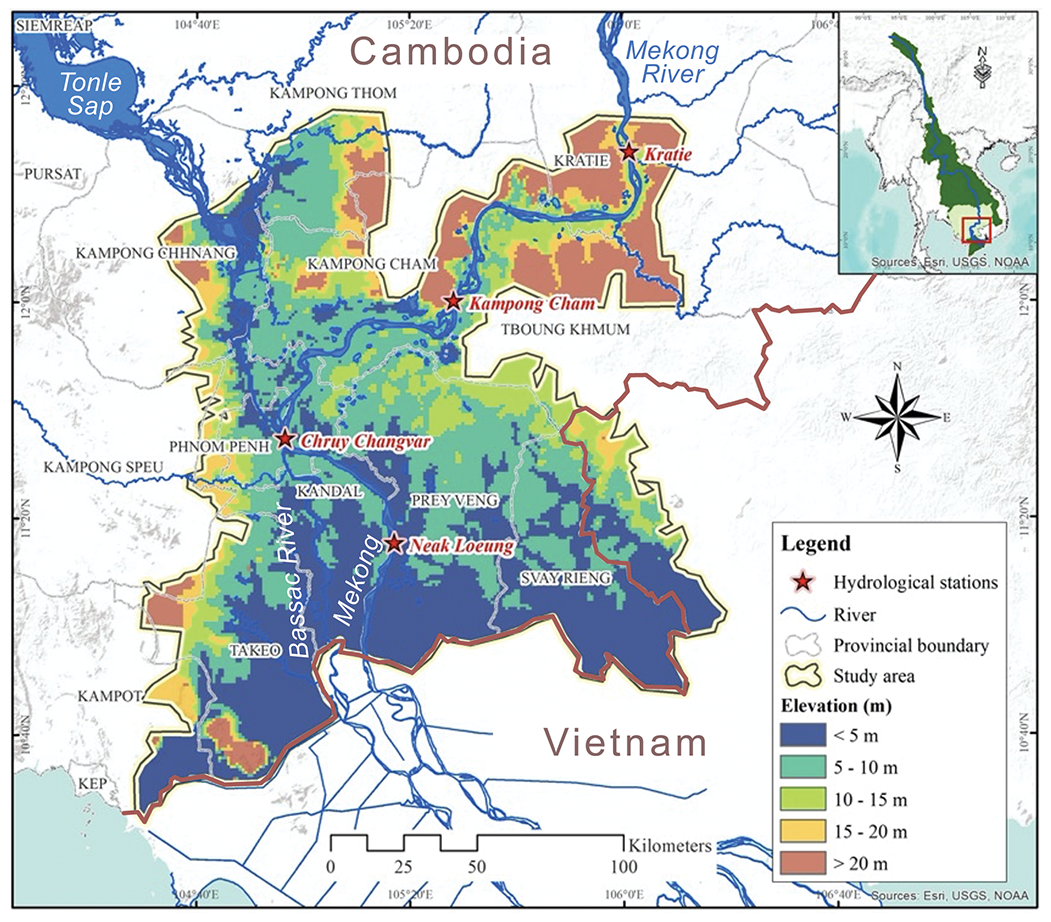
Figure 1Map of the study area, the Cambodian Mekong floodplain. Elevation of 90 m grid cell was extracted from the SRTM database, and river lines were obtained from the MRC database.
Whilst flooding damages infrastructure, crops and floodplain vegetation, and the fertile land, seasonal flooding is a vital hydrological characteristic of the Mekong River basin, as it improves water availability during the dry season and maintains and increases the high productivity of ecosystems and biodiversity (Arias et al., 2012, 2014; Boretti, 2020; Kondolf et al., 2018; Kummu et al., 2010; Kummu and Sarkkula, 2008; Lamberts, 2008; Schmitt et al., 2018; Schmitt et al., 2017; Västilä et al., 2010; Ziv et al., 2012). As part of the annual flood cycle, floodwaters play an important role in the recharging of aquifers and ensuring the hydrological connectivity of the floodplain, which is essential to maintaining ground water resources for use during the dry season (Kazama et al., 2007; May et al., 2011). Floodwaters also transport essential sediments and nutrients from the river channel into the floodplain and distribute them across a wide area, which fertilizes agricultural lands and enhances floodplain productivity (Arias et al., 2014; Kummu and Sarkkula, 2008; Lamberts, 2008). In addition, the wider the flood extent, the larger the area of interaction between aquatic and terrestrial phases, which increases the potential transfer of floodplain terrestrial organic matter into the aquatic phase. Under the combined impacts of hydropower infrastructure and climate change, the flooded area in Cambodia's Tonle Sap Lake basin is projected to decline by up to 11 % by around 2050, which may lead to a decline in the net sedimentation and the aquatic net primary production of up to 59 % and 38 % respectively (Arias et al., 2014; Lamberts, 2008).
Existing hydrological and flood regimes will likely be altered due to climate change and infrastructure developments; but the degree of alterations vary with different drivers, location, and time (Piman et al., 2013; Try et al., 2020a). Hoang et al. (2016) project that the Mekong's discharge under climate change conditions by 2050 under RCP8.5 will decrease in the wet season (up to −7 % at Stung Treng) and increase in the dry season (up to +33 % at Chiang Saen), equivalent to an annual increase between +5 % and +15 %. Lauri et al. (2012) show that hydrological conditions of the Mekong River basin were highly dependent upon the global climate model (GCM) being used, with projections of water discharge at Kratie station (Fig. 1), Cambodia, ranging from −11 % to +15 % for the wet season and from −10 % to +13 % for the dry season for projections around 2050. The study also concludes that the impact on water discharge due to planned reservoirs was much larger than those simulated due to climate change, with water discharge during the dry and early wet season being primarily determined by reservoir operation. Hoang et al. (2019) find that for the same period under RCP8.5 hydropower development plans in the Mekong River basin are expected to increase dry season flows up to +133 % and decrease wet season flows up to –16 %. The future expansion of irrigated lands in the wider Mekong region is expected to reduce river flows up to −9 % in the driest month (Hoang et al., 2019).
Changes to the Mekong mainstream flows will have direct impacts on flooding in the LMB floodplains in Cambodia and Vietnam. Try et al. (2020a) considered the impact of future climate change (around 2100 under RCP8.5) in isolation on the flood dynamics of the LMB, projecting an increased flood extent area of 19 %–43 %. Infrastructure development, in contrast, is expected to cause a decline in the Tonle Sap's flood extent by up to 1200 km2 (Arias et al., 2012), as dam development alone is expected to reduce flooded area in the Vietnamese Mekong Delta by 6 % in the wet year and by 3 % in the dry year (Dang et al., 2018). Flood extent in the Vietnamese Mekong Delta is projected to increase by 20 % under the cumulative impacts of climate change and infrastructure development, bringing prolonged submergences of 1–2 months (Triet et al., 2020).
The impacts described above may eventually lead to a new hydrological and flood regime in the Mekong region and would likely endanger the riverine ecology and endemic aquatic species of the Mekong floodplain (Arias et al., 2012; Dang et al., 2018; Kummu and Sarkkula, 2008; Räsänen et al., 2012). To effectively manage and overcome these pressures and challenges in any floodplain, there is an urgent need to evaluate the combined impacts of climate change and infrastructure operations basin-wide (Hoang et al., 2019; Hoanh et al., 2010; Lauri et al., 2012; Västilä et al., 2010). However, the existing studies have either focused on the basin-scale flow changes (Dang et al., 2018; Hoang et al., 2016, 2019; Hoanh et al., 2010; Lauri et al., 2012; Pokhrel et al., 2018; Try et al., 2020a) or assessed the impacts on flooding for either the Tonle Sap (Arias et al., 2012; Chen et al., 2021; Ji et al., 2018; Yu et al., 2019) or the Vietnamese Mekong Delta (Dang et al., 2018; Duc Tran et al., 2018; Triet et al., 2020). Very little is known how basin-wide development and climate change would impact the Cambodian Mekong floodplain other than the Tonle Sap (Fig. 1), despite them being important agricultural lands and home to more than 6.4 million people (2008 population census).
Therefore, we have attempted to quantify the cumulative impacts of water resource development plans and climate change on hydrological and flood conditions localized in the Cambodian Mekong floodplain (Fig. 1) by using an innovative combination of state-of-the-art hydrological and hydrodynamic models. In concentrating on the provincial level, using an extended time series for the calibration period, validating the flood extent against satellite imagery, and incorporating a larger set of driving factors within our analysis, the present study is a novel contribution to the work being done to understand the potential for future changes to the complex hydrology of the floodplains in general and specifically the Cambodian Mekong floodplain. The results of this study may contribute to formulating adaptation and mitigation strategies to flood-prone areas that balance the need for flood prevention and water resource allocation against the ecological functioning of the floodplain.
2.1 Study area
The study area is located in the downstream part of the Cambodian Mekong River basin (excluding the Tonle Sap Lake region), also known as the “Cambodian Mekong floodplain” (Fig. 1). The area is about 27 760 km2 and extends along the Mekong mainstream from Kratie Province to the Cambodia–Vietnam border. It covers parts of 12 provinces in Cambodia and one province in Vietnam (Tay Ninh) but does not extend into the Vietnamese Mekong Delta region (see division in Fig. 1).
A major part of the Cambodian Mekong floodplain is characterized by a flat terrace and low-lying grounds with gentle slopes that contain many depressions and lakes, except for the upper parts of the Prek Thnot and Prek Chhlong tributaries, which contain steeper terrain. Hydrological conditions within the area are dominated by the seasonality and year-to-year variability of the Mekong flow regimes. The wet season runs from June to October, and the dry season runs from November to May. During the wet season, the characteristics of the floodplain and Tonle Sap Lake play a vital role in flood peak attenuation and regulation, temporarily storing and later conveying water across the vast low-lying areas. During the wet season, water flows from the Mekong main stream into the Tonle Sap Lake, but this flow is then reversed in the dry season. This illustrates the highly complex hydrological system at play throughout the region and the seasonal variations that characterize the ecological and agricultural landscape.
Within our historic baseline period of 1971–2000, the annual average temperature across the study area varies from 26.9 to 28.2 ∘C, with mean monthly temperatures between 30 ∘C during the hottest months (April and/or May) and 26 ∘C in the coldest month (January). Average annual rainfall across the study area during the same period varies between 1100 and 1850 mm, with mean monthly rainfall ranging between 250 mm in the wettest months (May–June) and 10 mm in the driest (February).
2.2 Modelling structure and datasets
We used a hydrological–floodplain model combination (Fig. 2), consisting of the distributed hydrological model IWRM-VMod (Lauri et al., 2006), the floodplain propagation model MIKE 11 (Dung et al., 2011), and the flood extent and duration model IWRM-Sub (MRC, 2018a) (Fig. 2). First, the IWRM-VMod model with a resolution of 5 km × 5 km (see extent and hydrological processes in Fig. 2a) was used to simulate the entire Mekong basin's flow response to hydropower developments, irrigation expansion, and climate change impacts around the year 2050. We used the model runs, both baseline and scenarios, from Hoang et al. (2019). From the hydrological model we derived the boundary condition discharges that were used to drive the 1D flood propagation model MIKE 11 (as constructed and employed in Triet et al., 2017, 2020) in order to obtain the initial floodplain conditions, water levels, and fluctuating discharge of the Tonle Sap River. MIKE 11 extends over the entire Mekong Delta down to the South China Sea, where sea level is used as another boundary condition. MIKE 11 also includes a detailed description of the channels, canals, and sluice gates in the delta (Triet et al., 2020). The results from MIKE 11 in turn were used as boundary conditions to the detail-scale (1 km × 1 km) floodplain hydrodynamic IWRM-Sub model. The IWRM-Sub model is a flood model that also has hydrological processes (i.e. precipitation, evaporation) in it, making it ideal for large floodplain modelling in monsoon climate. It uses the 2D depth-averaged Navier–Stokes and St. Venant equations to propagate a flood wave out into the floodplain from the water level points passed as boundary conditions (MRC, 2018a).

Figure 2Schematic illustration of the modelling setup. (a) Mekong basin hydrological model IWRM-VMod models the hydrology of the entire Mekong basin with 5 km × 5 km resolution (Hoang et al., 2019). (b) Flood propagation model MIKE 11 models the hydrodynamics of the entire Mekong floodplain using the discharges from IWRM-VMod and sea level in South China Sea as boundary conditions (Triet et al., 2017). (c) Flood extent and duration model IWRM-Sub is a detailed 2D floodplain model using the output from two other models as an input.
The IWRM-Sub model was applied to Cambodian floodplains for the Mekong River Commission's (MRC) Council Study (MRC, 2018a). It is based on the SRTM 90 m topographical map (Jarvis et al., 2008), a soil type map (FAO, 2009), and a land use map (GLC2000, 2003), all aggregated to 1 km × 1 km resolution (Table 1). Geospatial data and river cross-section data were retrieved and added from the Mekong River Commission (MRC). The future climate scenarios are based on an ensemble of five GCM projections of precipitation and temperature taken from the CMIP5 suite of models (ACCESS, CCSM, CSIRO, HadGEM2, and MPI). Whilst the CMIP6 collection has now superseded the CMIP5 model results, an analysis of the differences between model collections shows consistent mean values for both precipitation and temperature across our study area for both wet and dry seasons (Supplement Table S1).
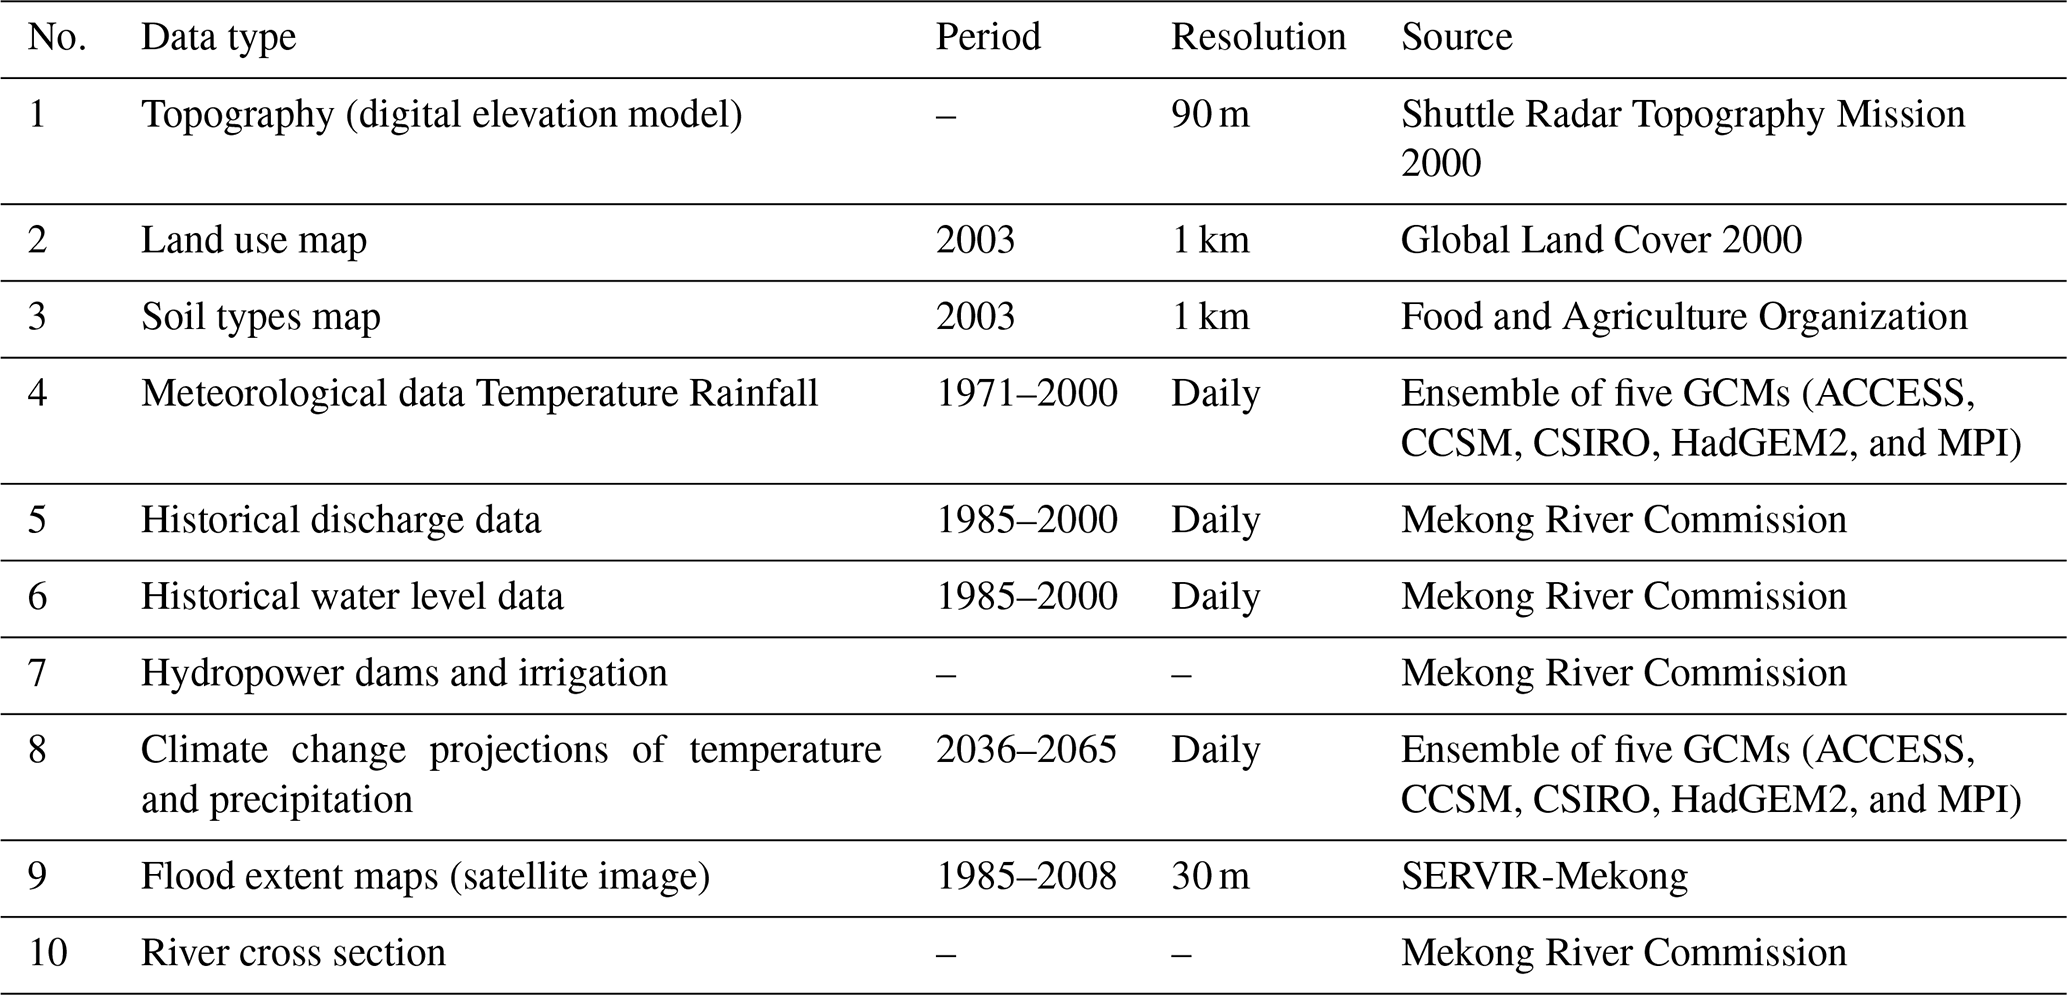
Flood extent maps for calibration and validation were derived from Landsat images using a sophisticated water detection algorithm developed and optimized for the Lower Mekong region (Donchyts et al., 2016). All IWRM-Sub model inputs and their brief description are presented in Table 1, while input data for IWRM-VMod are detailed in Hoang et al (2019) and MIKE 11 in Triet et al. (2020).
2.3 Modelling methodology
We adapted and applied the existing IWRM-VMod (Hoang et al., 2019), MIKE11 (Triet et al., 2017), and IWRM-Sub (MRC, 2018a) models to assess the smaller-scale cumulative impacts of future development plans and climate change on the Cambodian Mekong floodplain. Here we enhanced the reliability of these existing models, particularly in the Cambodian Mekong floodplain, by advancing the predictive accuracy of the hydrology (recalibration), accounting for multiple calibration stations (four stations), and validating flood extents against satellite imagery, as described below.
Our initial model setup describes the current state of the floodplain for the historic baseline period of 1971–2000, which we further calibrated and validated against observations of water discharge and water level taken at Kratie, Kampong Cham, Chroy Changvar, and Neak Loeung hydrological stations (see locations in Fig. 1). The model performance was systematically quantified and evaluated based upon the Nash–Sutcliffe efficiency (NSE), percent bias (PBIAS), ratio of the root mean square error to the standard deviation of observed data (RSR), and coefficient of determination (R2).
The use of 1971–2000 as our baseline represents the hydrological state of the basin before major alterations were introduced well (Soukhaphon et al., 2021). Including years after 2000 in our baseline would introduce significant hydrological and irrigation influences that would prohibit a thorough examination of these in isolation as part of our simulations.
Flood extent maps generated from the IWRM-Sub model were validated for the same period against satellite-based flood extent maps generated by the Surface Water Mapping Tool (SWMT). The SWMT is a Google Appspot-based online application developed by Donchyts et al. (2016). A stack of Landsat (4 and 5) data were generated using SWMT from 1984–2000. This stack of images were then used to generate a water index map using the modified normalized difference water index (MNDWI) (Xu, 2006) to distinguish between water and non-water areas, which were then adjusted to account for dark vegetation and hill shadows using a height above nearest drainage (HAND) map (Rennó et al., 2008). Figure S1 in the Supplement illustrates all procedures of the Surface Water Mapping Tool.
To evaluate the model performance for flood inundation maps, we applied three indices: recall, precision, and the ratio between simulated and observed flood extent areas. Recall evaluates what proportion (0–1) of the flood derived from remote sensing images is identified by the simulation. Precision evaluates what proportion of the simulated extent agrees with the remote sensing data. If the simulated extent overlaps the observed extent area perfectly, recall, precision, and the ratio of extents become 1.
Once the IWRM-Sub model was successfully calibrated and validated, we modulated the inflow at Kratie and at the confluence of the Tonle Sap River with the main Mekong channel to represent the upstream impacts of multiple development and climate change scenarios (see Sect. 2.4). We then simulated the Cambodian Mekong floodplain's hydrological and flood conditions (flood extent, flood depth, and flood duration) for each scenario.
2.4 Analytical scenario descriptions
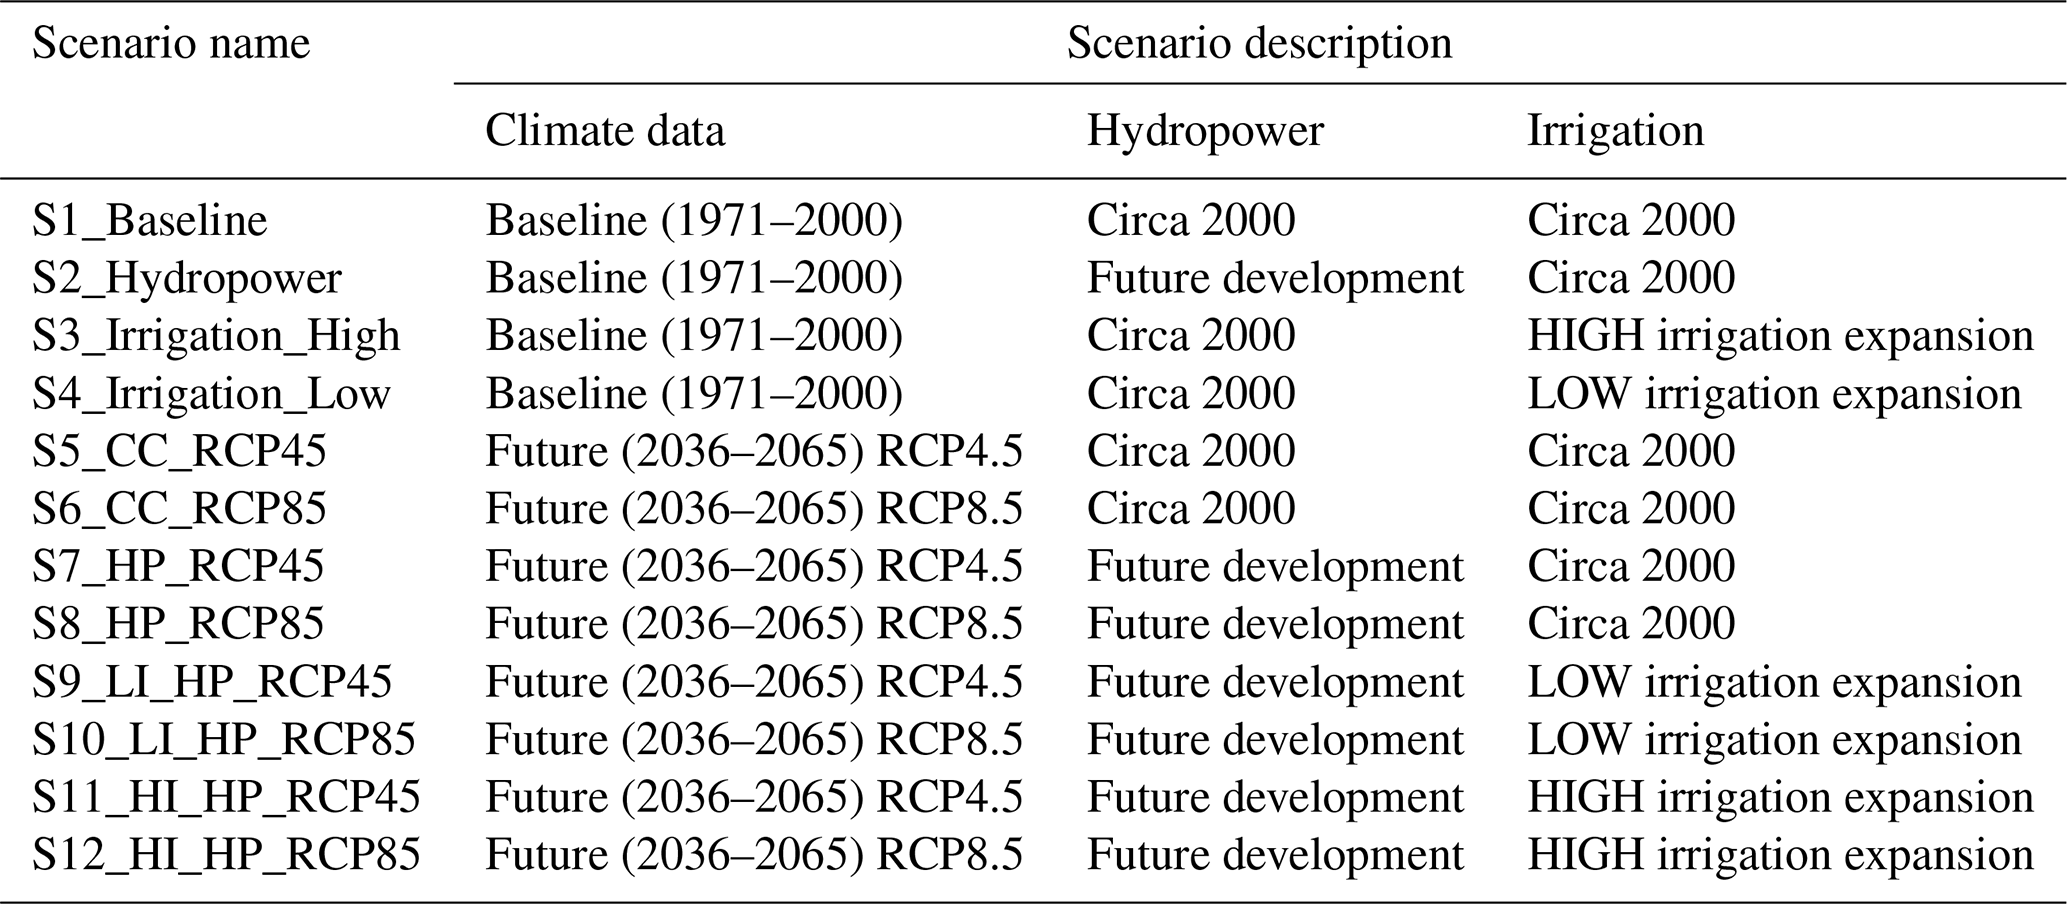
The scenario setup that we adopted for our study is the same as that described in Hoang et al. (2019). The baseline (1971–2000) represents the Mekong basin at a time before significant alterations to the hydrological functioning of the catchment have occurred through infrastructural development. We then defined 11 development scenarios that cover each of the three main drivers of hydrological change in isolation (hydropower, irrigation, and climate change), as well as combinations of these together. For future scenarios, we used climate data from an ensemble of five GCMs (ACCESS, CCSM, CSIRO, HadGEM2, and MPI) for the years 2036–2065 and considered Representative Concentration Pathway (RCP) levels 4.5 and 8.5. These GCMs were selected based on their performance in reproducing historic temperature, seasonal precipitation, and climate extremes in the Mekong region. The GCM data were downscaled using bilinear interpolation and statistically bias corrected using a quantile mapping method. For full details see Hoang et al. (2016, 2019). The sea level boundary condition was adjusted by 43 cm for future scenarios to account for the combined effects of sea level rise and deltaic subsidence, taken as the average of the range estimated by Manh et al. (2015), i.e. 22–63 cm. This value was used for both RCP4.5 and RCP8.5 as the climate change component of sea level rise for our study period taken from IPCC (2014) is relatively consistent across RCP scenarios (RCP4.5: 19–33 cm; RCP8.5: 22–38 cm). Our hydropower development scenario includes 126 dams on both main streams (N= 16) and tributaries (N= 110) of the Mekong, equivalent to a total active storage of 108 km3, all of which is planned to be active between 2036 and 2065. Dam simulation was based on the optimization scheme developed by Lauri et al. (2012), which calculates each dam's operating rules separately in a cascade, aiming to maximize productive outflows (i.e. outflows through the turbines), thus maximizing hydro-power production. The optimized dam operation rules were later validated against observations by Räsänen et al. (2017). We also included two irrigation scenarios, a high- and low-expansion version, using the global projected irrigation expansion scenarios by Fischer et al. (2007) applied to the baseline irrigation extent taken from the MIRCA – “Global Dataset of Monthly Irrigated and Rain-fed Crop Areas around the Year 2000” (Portmann et al., 2010). A list of scenarios and their notation are presented in Table 2, and a thorough description and justification for these scenarios can be found in Hoang et al. (2019).
Table 2Summary of scenario names, driving climate data, and development inclusion descriptions. See Sect. 2.4 for data description.
3.1 Predictive accuracy of the models
The Mekong-basin-wide IWRM-VMod hydrological model was calibrated and validated against discharges in various stations, with very good performance: validation period NSE at Nakhon Phanom station of 0.74 and at Stung Treng station of 0.64 (Hoang et al., 2019). MIKE 11 application to the entire Mekong delta was, in turn, validated against two flood events in 2000 and 2011 in Triet et al. (2017), also with good correspondence to the observations, achieving NSE of observed water levels of between 0.72 and 0.97 across 19 different gauging stations.
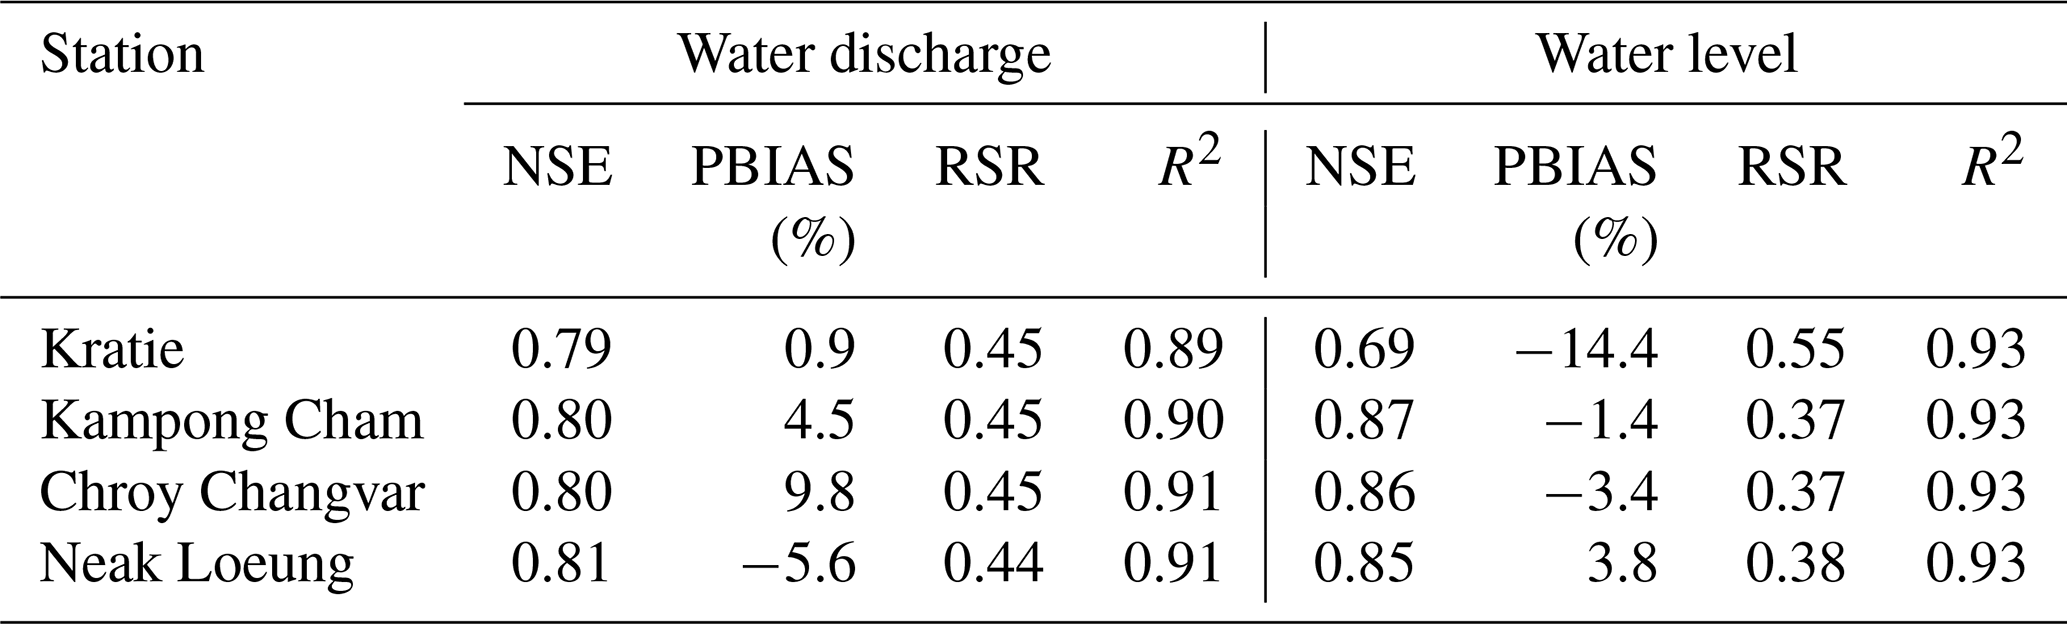
Here we validated the IWRM-Sub model for the Cambodian Mekong floodplain against water levels and discharge in four stations and flood extent based on Landsat imagery (see Methods). Based on the validation measures (Table 3), a good model performance is obtained at all stations (both water discharge and water level) with the values of NSE between 0.69 and 0.87, PBIAS between −14.4 % and +9.8 %, RSR between 0.37 and 0.55, and R2 between 0.89 and 0.93. It should be noted that the statistical model performance with NSE and R2 greater than 0.5, PBIAS between ±25 %, and RSR less than 0.7 is indicated as the decision guideline for hydrologic model studies (Benaman et al., 2005; Setegn et al., 2010). A time series comparison between the simulated and observed water discharge and water level (1985–2000) at four hydrological stations can be found in Figs. S2 and S3. It is apparent that the simulated water discharge among these stations is in line with the observed data throughout the 15-year hydrological record available for comparison.
Table 3Model performance at four hydrological stations (1985–2000) evaluated with daily values. See station locations in Fig. 1. Note: the statistical model performance with Nash–Sutcliffe efficiency (NSE) and the coefficient of determination (R2) greater than 0.5, percentage bias (PBIAS) between ±25 %, and ratio of the root mean square error to the standard deviation (RSR) less than 0.7 is indicated as the decision guideline for hydrologic model studies (Benaman et al., 2005; Setegn et al., 2010).
Results of the flood extent comparison between the IWRM-Sub model and SWMT observations over the time horizon 1985–2000 show an equally good agreement. The model underestimates the total flooded area by just 0.1 % as the ratio of simulated to observed flooded extent areas is 0.99. However, the overlapping flooded area only constituted 71 % of the observed (SWMT) extent (which constitutes the recall) and 72 % of the simulated (IWRM-sub) extent (which is the precision) (Fig. 3). Part of this discrepancy may be accounted for by the inclusion of rivers and lakes in the extent of the simulation, yet not in the SWMT-derived extents. Using multiple models in succession can have the negative effect of compounding errors; however these results demonstrate that this has not unduly impacted our methodology as our estimations closely match the observations of flood extent.
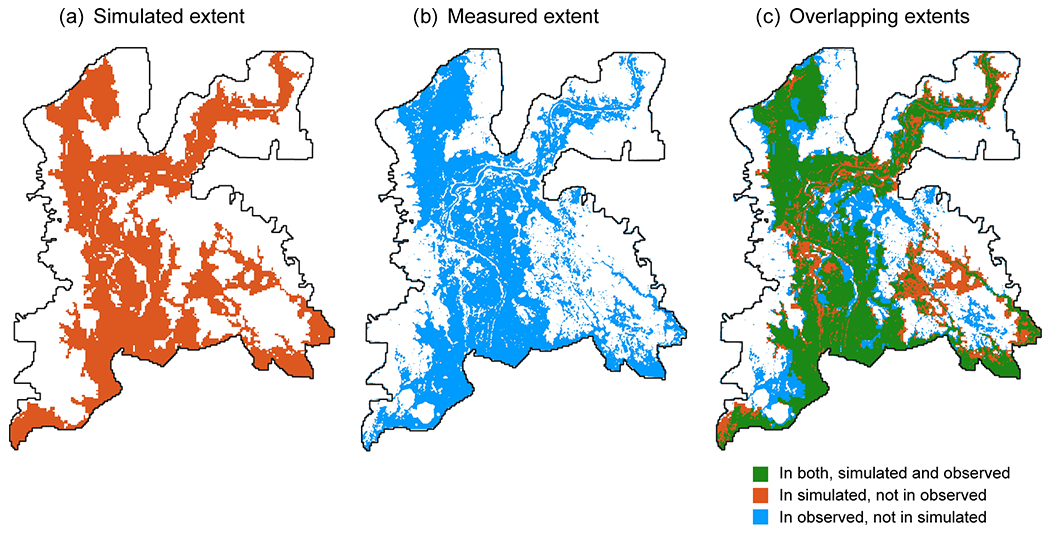
Figure 3Comparison of maximum flood extent resulting from the model and measured from satellite images.
3.2 Impacts on hydrological conditions
Having run the model for each of the development scenarios (S1–S12; see Table 2), we obtained the corresponding daily time series of water discharge and water level at each station and compared them with the baseline scenario. We then calculated the mean monthly water discharge and water level across the study period. Finally, we computed the percentage change in mean monthly water discharge and water level for each scenario at each station. The results at Kratie, Kampong Cham, and Chroy Changvar were virtually indistinguishable from one another, so to avoid unnecessary repetition, we have presented results from only Kampong Cham (as the midway station) and Neak Loeung, which differs significantly from the other stations for being downstream of the Tonle Sap River confluence (Fig. 1) and the Bassac River distributary (Fig. 4).
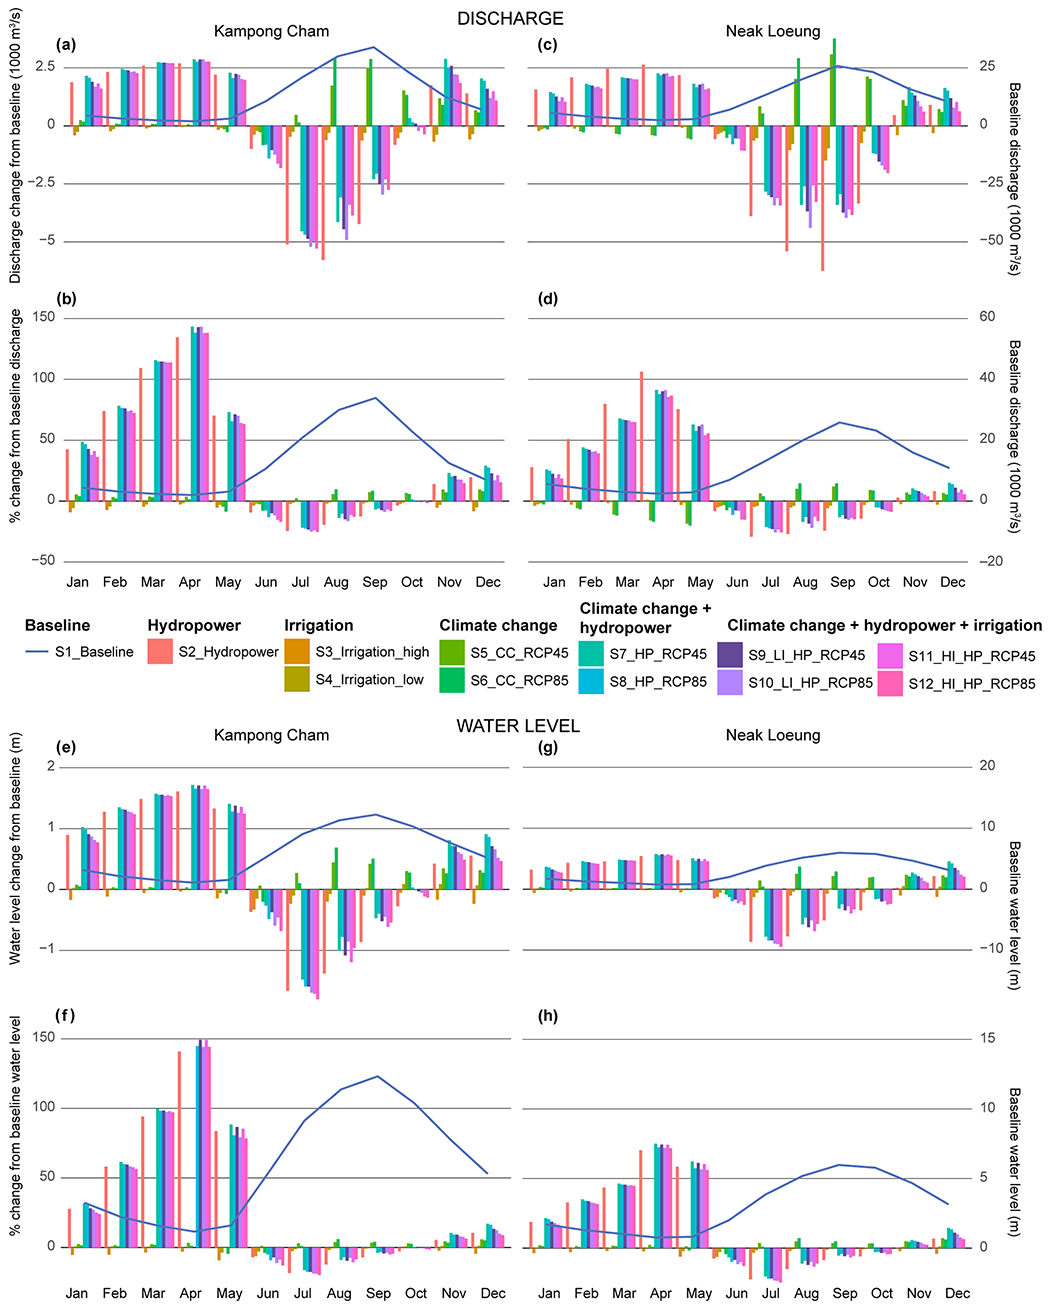
Figure 4Changes in monthly water discharge and water level at Kampong Cham (left-hand side) and Neak Loeung (right-hand side); the blue line indicates the baseline monthly discharge and water level, and the colour bar charts indicate both the magnitude (a, c, e, g) and the percentage (b, d, f, h) change under different scenarios in comparison with the baseline (1971–2000). (See location of stations in Fig. 1.)
All scenarios that contain an element of hydropower development follow the same pattern of increasing both water discharge and water level during the dry season (November–May), whilst reducing water discharge and water level during the early and middle wet season (June–September) (Fig. 4). The impact of climate change appears to fluctuate during the months of January to June between Kampong Cham (and Kratie and Chroy Changvar) and Neak Loeung, as there is a slight increase in discharge and water levels at the upstream stations yet a slight decrease at the downstream station, though the magnitude of any alteration is only small. From July to December, however, the climate change impact is much stronger and increases discharge and water levels at all stations. The larger magnitude of the climate change impacts during the wetter months counteracts the impact of hydropower and irrigation (which slightly reduces flows and water levels in all months), which can be seen in the difference between scenario S2 (hydropower solo) and scenarios S7–S12 that incorporate multiple drivers (Fig. 4; scenario description in Table 2). This is most evident at Kampong Cham station in October, where climate change impacts are large enough to offset hydropower impacts, so that only those scenarios that incorporate the additional impact of irrigation are strong enough to reduce flows and water levels. Whilst the largest magnitude impacts are in the wetter months of July to September, the proportional impacts are far larger in the dry season, where the impact of hydropower development dominates the flow regime and increases water levels up to 150 % in April at Kampong Cham, compared to a maximum decrease of < 25 % in July.
Comparing results from upstream stations with those at Neak Loeung, we see that the magnitude of climate change impacts is larger downstream both absolutely and proportionally. This is evident in the greater differences between the solo hydropower scenario (S2) and the combined hydropower and climate change scenarios (S7–S12) here than observed at the upstream stations. Nevertheless, hydropower impacts still dominate the flow regime, especially during the drier months where discharges increase > 100 % in April.
Our results suggest that planned hydropower developments will drastically alter the hydrology of the Mekong main channel and far outweigh the effects of irrigation or climate change impacts in either counteracting or enhancing these alterations.
3.3 Impacts on flood conditions
Here we present the quantitative results together with the spatial analysis of flood conditions throughout the entire study area. The comparisons between each scenario and their justifications are described in the analysis at the provincial level because of the similarity in patterns. Under the baseline scenario (S1), the modelling results between 1971 and 2000 show that the yearly flooded area ranges from 7785 to 11 525 km2. Its mean annual value is estimated at 9370 km2, about 34 % of the whole study area.
We compared year to year the impact of each development scenario against the S1_baseline (1971–2000) on the total flooded area across the study area (Fig. 5). Scenarios S2–S4 use the same driving climate data as the baseline scenario (S1), and so the variability in the impact shown is significantly reduced to produce consistent impacts for all years. Conversely scenarios S5–S12 are driven by future climate data projections, so that the variability in comparing year to year is significant. Nevertheless, there is a clear pattern that emerges, once again showing the dominance of hydropower development in significantly reducing the yearly flooded area. The impacts of both irrigation development scenarios (S3 and S4) also reduce the yearly flooded area, though to a lesser extent. Climate change impacts in isolation (S5 and S6) increase the flooded area overall, though there are some years in which the area is reduced compared to the baseline. The proportional magnitude of these effects is most evident in the solo hydropower development, with a median reduction of > 20 % year on year, yet the combined impact of irrigation, hydropower, and climate change did reduce flooded areas by up to 40 % in some years (Fig. 5).
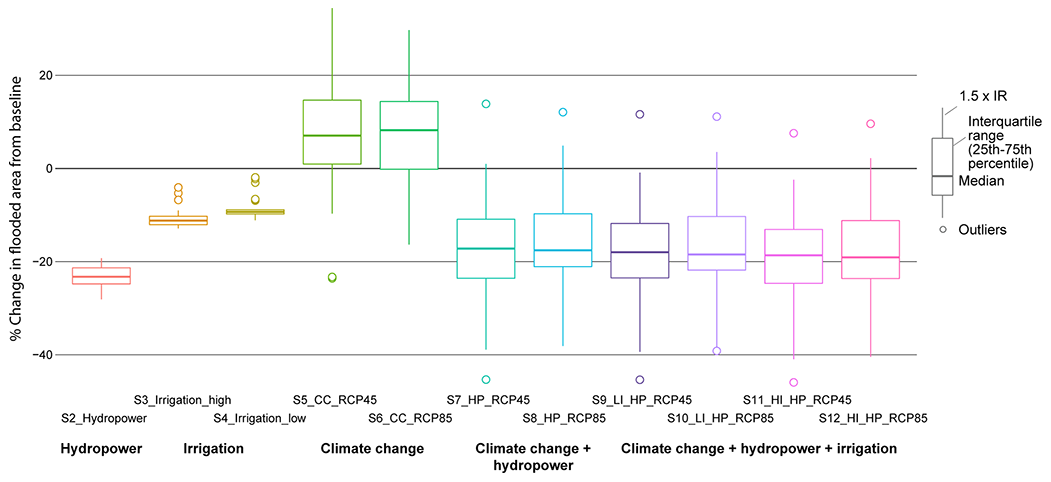
Figure 5Changes in total flooded area compared to the baseline period 1971–2000; the graph shows the range of changes due to interannual variation (box and whiskers), the median change (horizontal line), and outliers that were exceptional years (circles).
The spatial distribution of flood inundation and depth across the Cambodian Mekong floodplain varies greatly between scenarios of planned developments and climate change (Fig. 6). The floodplain is characterized spatially by a high fluctuation of flood depth and flood duration alteration of over ±100 % in almost all scenarios, especially in the southeast and the southwest parts of the study area. Whilst the magnitude of these fluctuations is large across all scenarios, it is most evident in hydropower (S2) (reductions of depth and duration) and climate change RCP8.5 (S6) scenarios (increase in depth and duration). Though even in these most extreme cases, there are areas that run contrary to the general pattern of change, highlighting the hydrological complexity of the region. The low-irrigation scenario (S4) has the least impact (Fig. 6), though even this level of development may significantly impact the lower-lying regions in the southwest and southeast where much of the rice cultivation is concentrated. Our results suggest that all scenarios will cause heterogeneous impacts across the region that may effectively shift flood impacts from one area to another rather than completely dispel the associated risks.
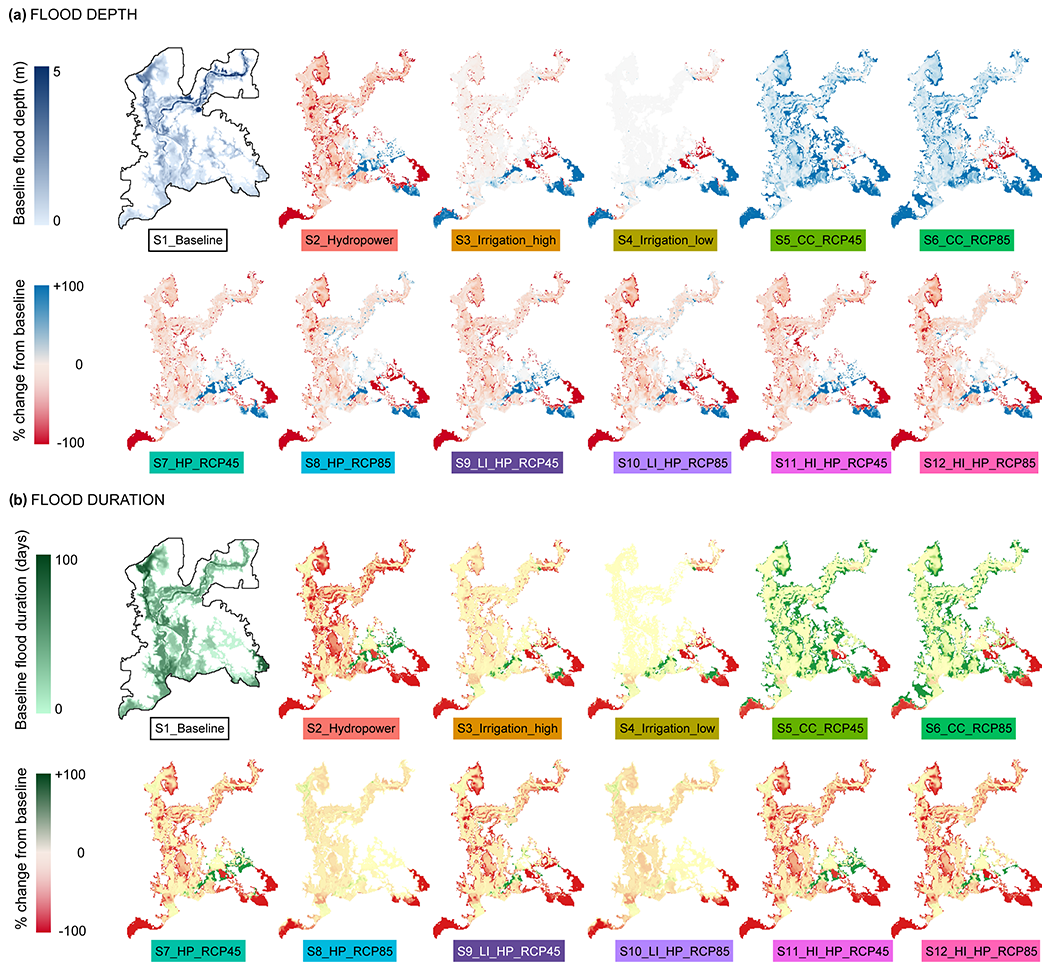
Figure 6Spatial distribution of changes in flood depth and duration. (a) Flood depth; (b) flood duration. Results are shown over the baseline period 1971–2000 and all scenarios (see description in Table 2).
3.4 Provincial level analysis
We examined the change in flooded area, flood depth, and flood duration for 10 provinces that have a considerable part of their area within the study area (Kampong Speu and Kampot provinces and Tay Ninh Province in Vietnam were not included; see Fig. 1). Each scenario was compared to the baseline period at the provincial level (Fig. 7). Under the baseline scenario (S1), the modelling results show that the average flooded area ranges from a minimum of 188 km2 in Phnom Penh Province to a maximum of 2308 km2 in Prey Veng Province, which represents 43 % of the provincial territory. Whilst the average flood depth ranges from 0.54 m in Svay Rieng Province to 2.4 m in Kratie Province, the average flood duration ranges from 10 d in Svay Rieng Province to 79 d in Kampong Chhnang Province.
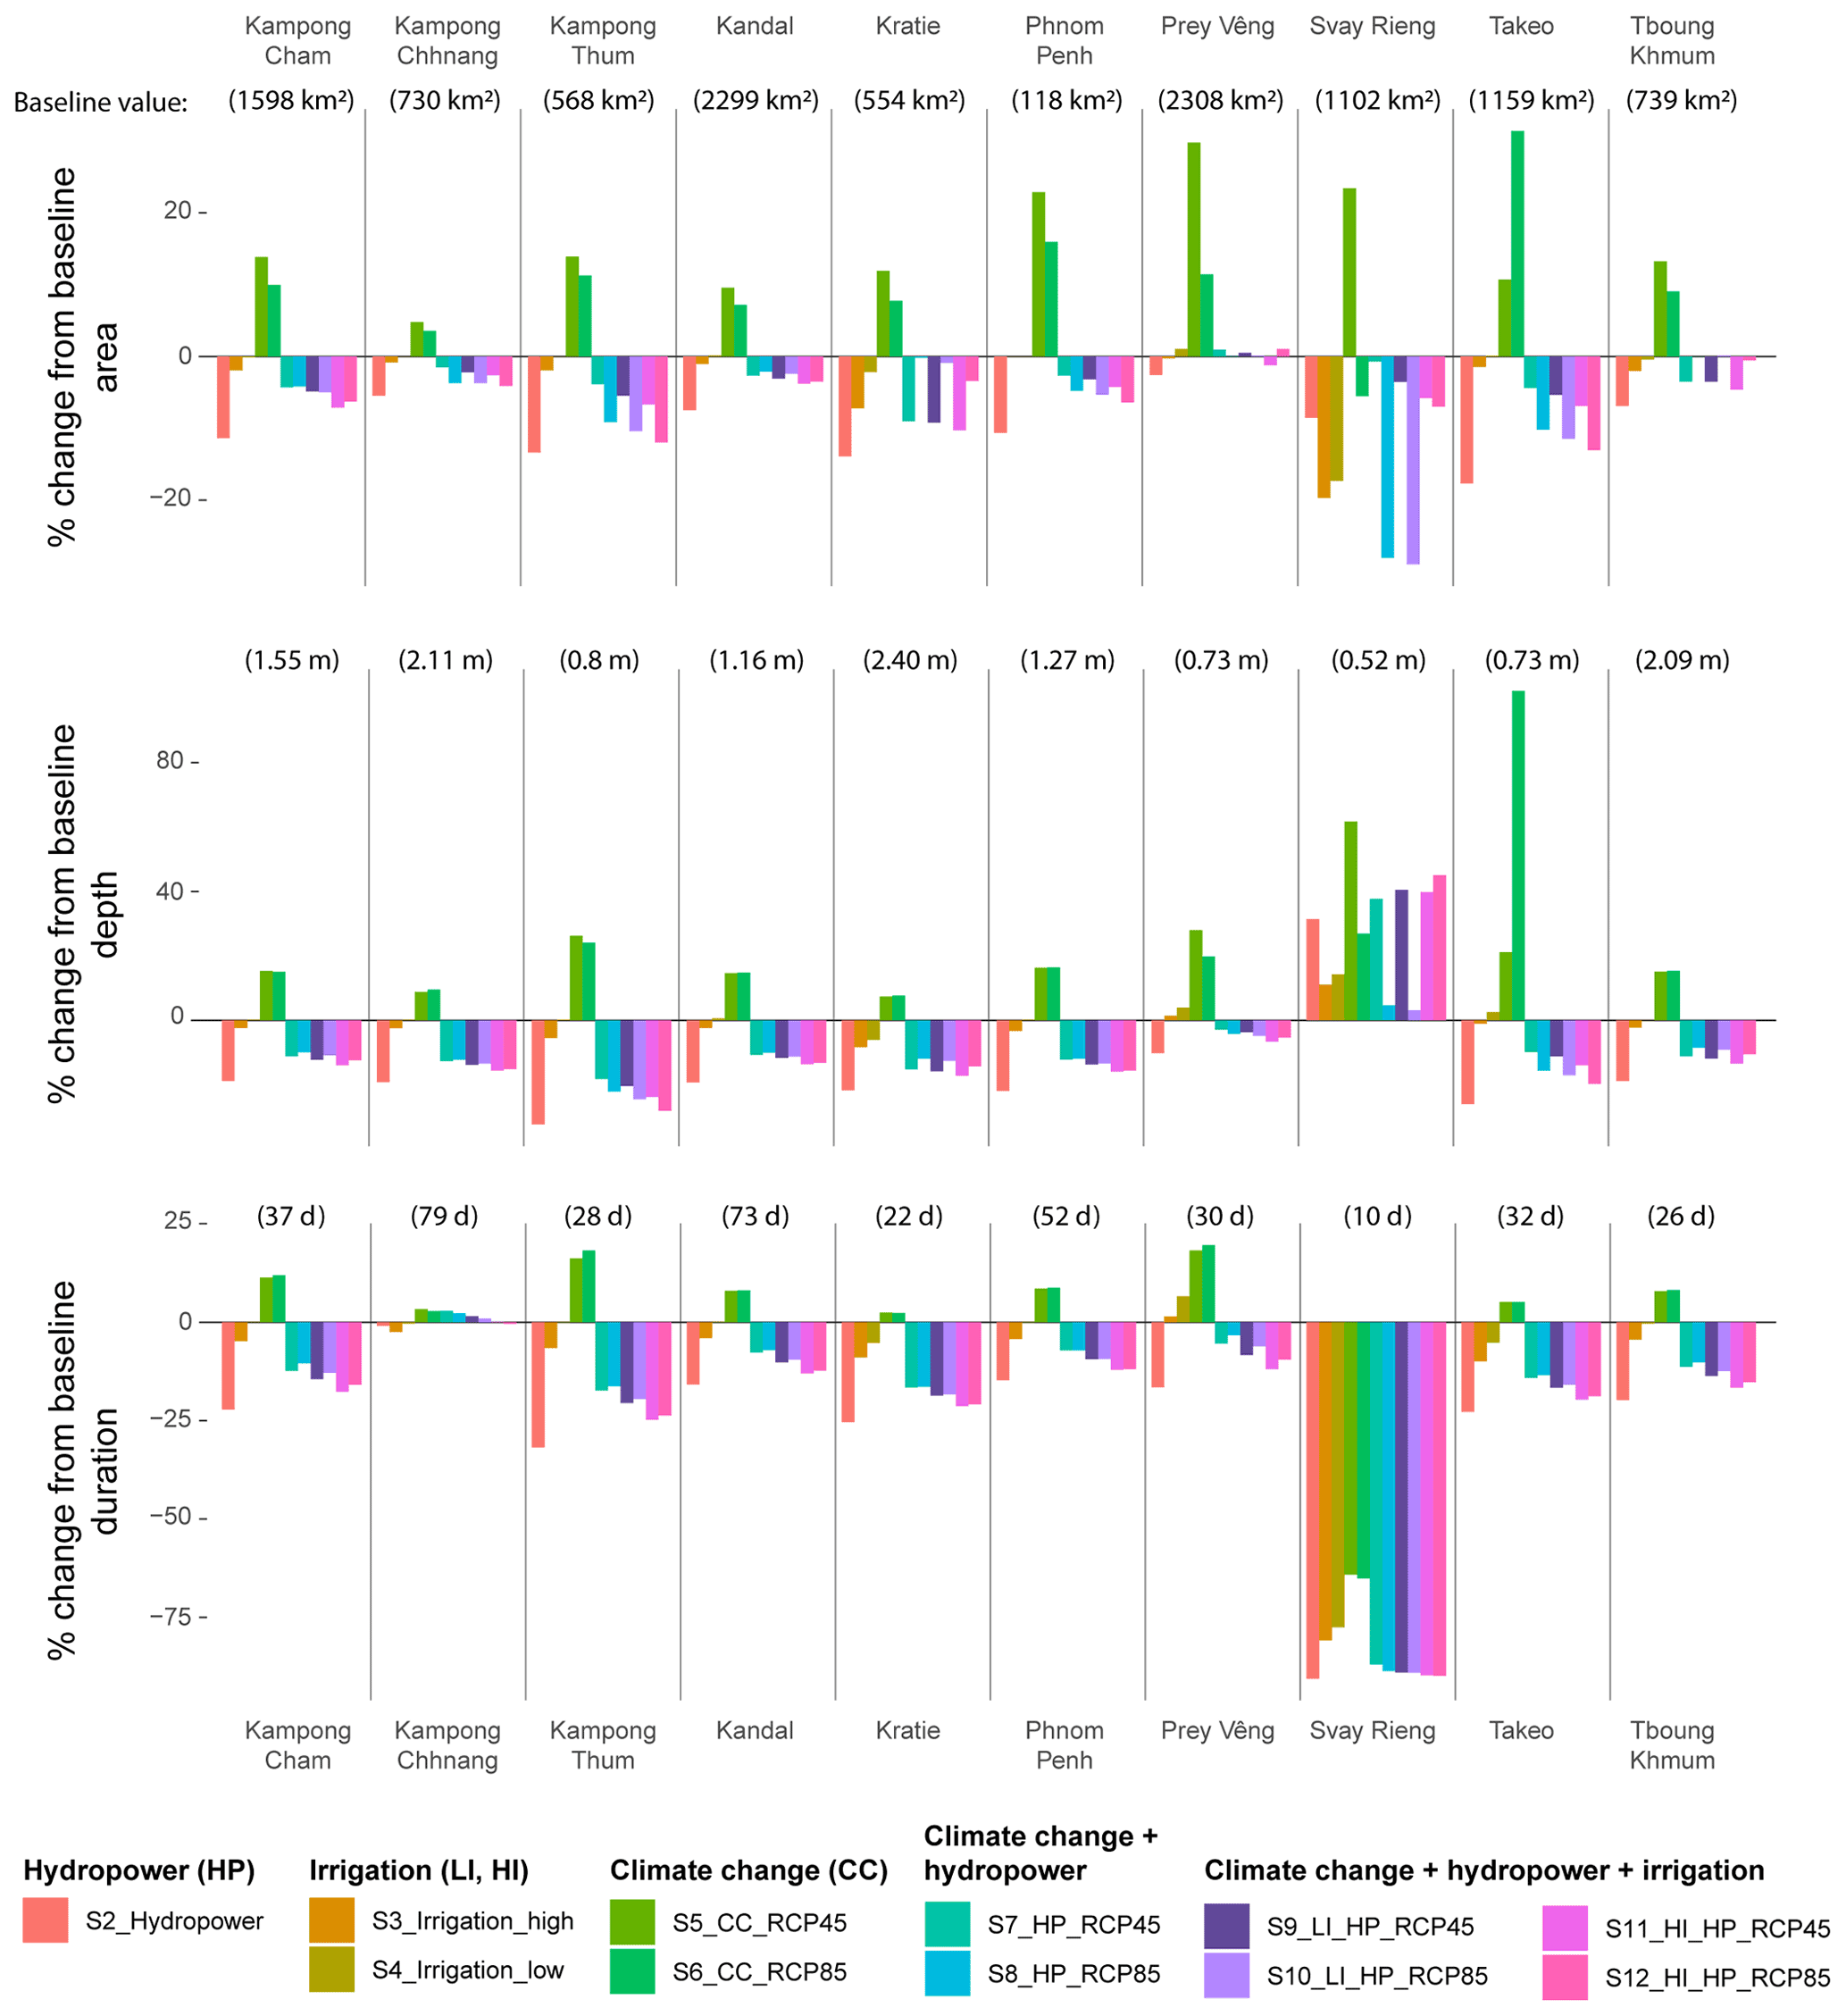
Figure 7Changes in annual mean flooded area, flood depth, and flood duration compared to the baseline period (1971–2000) for all scenarios at the provincial level. See province location in Fig. 1.
Except for the Svay Rieng region, which appears anomalous, Kampong Chhnang and Kratie are least affected by the impacts of climate change, whilst Prey Veng and Takéo are most affected (Fig. 7). The development scenarios have the least effect in Prey Veng, where flood area and depths are almost unaffected in comparison to the other provinces.
Svay Rieng displays an extreme reduction in flood duration for all scenarios, including climate change scenarios, which is also true of the flooded area except for the RCP4.5 climate impact scenario (S5). Depths, however, increase in all scenarios, suggesting that flooding in this province is reduced in extent and duration to a shorter, more intense (and deep) flood event.
4.1 Key findings
The model performance metrics achieved by our hydrological simulation of water discharge and water level for the baseline period of 1971–2000 at all four monitoring stations (Kratie, Kampong Cham, Chroy Changvar, and Neak Loeung) exceed existing studies within the same region (Västilä et al., 2010), with the exception of Dang et al. (2018), who recorded an NSE value of 0.98 compared to our value of 0.80 at Kampong Cham station. Whilst there are studies of flood extent within our study area that only focus on a single event rather than a multi-year analysis that slightly surpass our own in terms of performance metrics (Fujii et al., 2003), our continual analysis of annual flood patterns comprising a 30-year time horizon is comparable to, and often exceeds, other such multi-year analyses done in the region (Try et al., 2020a, b). The relative success of our baseline simulations allows us to have a high degree of confidence in our future projections of the Cambodian Mekong floodplain's hydrological response to planned infrastructural development and future climate changes. All future projections of scenarios containing multiple drivers that we considered within our analysis followed the same generic pattern of alterations to both the expected discharge and river water level, increasing during the dry season (November–May) and decreasing during the early and middle wet season (June–September). Such a general pattern of alteration is due to the overwhelming dominance of the hydropower development impacts, which overcome any counteraction that might be applied by either irrigation development schemes (counteracts in dry season) or climate change impacts.
These general trends are in line with the majority of previous research in the region (Dang et al., 2018; Kallio and Kummu, 2021; Lauri et al., 2012; Piman et al., 2013; Räsänen et al., 2012; Västilä et al., 2010). The degree of alteration to these hydrological indicators is most pronounced in the upstream areas of Kratie, Kampong Cham, and Chroy Changvar stations and diminishes downstream of the confluence with the Tonle Sap River towards Neak Loeung station, which is also consistent with earlier findings (Dang et al., 2018).
Our findings clearly demonstrate the homogenizing effect that the planned hydropower developments would have on the Mekong River's hydrograph, which would go far beyond simply contracting the impacts of other drivers and would reshape the expected flow regime, massively increasing dry season low flows and significantly reducing wet season high flows.
The future projections of flood conditions suggest that most provinces will see an increase in depth, duration, and area under climate change scenarios but that these alterations are counteracted by the combined development scenarios reflecting the flood prevention benefit afforded by irrigation and hydropower scenarios. These findings are supported by other studies that look at the impact of isolated drivers of hydrological change in the region (Fujii et al., 2003; Try et al., 2020a) and studies that look at multiple drivers in nearby regions (Hoanh et al., 2010; Pokhrel et al., 2018).
Our provincial level assessment shows that Prey Veng Province is most vulnerable to the largest flooded area (Fig. 7), as its large territory is entirely located in the low-lying area adjacent to the Mekong River. Kampong Thom Province receives the largest flood prevention benefit provided by the planned hydropower developments, whilst Kampong Chhnang receives the least in terms of flooded area and flood duration, most likely because the flood regime is strongly controlled by the Tonle Sap Lake system and receives less influence from the upstream flow alterations. Svay Rieng Province is drastically impacted by all the scenarios. This is most likely due to the extremely low ground surface elevation (majority less than 8 m), meaning that slight alterations have proportionally large impacts. The region may also be affected by changes to the hydrological conditions on the Vietnamese Mekong Delta, some of which were represented in this study by means of the boundary conditions supplied by Triet et al. (2020) that considered the whole delta region.
4.2 Implications of hydrological and flood condition changes
Changes in hydrological and flood conditions in the Cambodian Mekong floodplain could imply both positive and negative consequences to various sectors such as water resource management, agricultural productions, and ecosystem services (Arias et al., 2012; Kummu and Sarkkula, 2008). In addition, the direction, magnitude, and frequency of impacts will be varied from one location to another.
The beneficial consequences associated with the impact of planned developments are derived from increased water availability in the dry season and reduced flood prevalence in the wet season. The reduction in flood risk due to the decline in the wet season flows and water levels would be a large socio-economic benefit of these development plans, potentially reducing the duration and extent of affected regions by more than 20 % (Fig. 5). In addition, increased dry season flow would greatly enhance agricultural productivity, enhance water security, and minimize conflicts between consumers. Environmental flow could also be secured, which may help some aspects of ecosystem productivity. Increases in water levels might also reduce energy costs associated with water pumping and better facilitate dry season navigation.
However, there are many negative consequences to the reduction in flood extent and duration associated with the planned development scenarios. Hydropower projects in the Mekong are projected to trap considerable parts of the sediments and the nutrients it contains in the reservoir behind the dam wall, reducing their transportation downstream and subsequent distribution across the floodplain (Kondolf et al., 2018; Kummu et al., 2010; Schmitt et al., 2017, 2018). The reduction in sediment transport rates associated with reduced wet season flows and sediment trapping upstream inevitably leads to sediment-starved water flow downstream. This in turn leads to increased rates of channel incision and accelerating riverbank erosion as river waters gain in situ material for transportation up to carrying capacity (Darby et al., 2013; Morris, 2014). The drop in soil fertility (nutrient bound to sediment) throughout the downstream floodplains would result in a great challenge for ecosystem productivity (Arias et al., 2014), rice production (Boretti, 2020), and the sustainability of flooded forests (rich habitats for fish and other species) (Arias et al., 2014). Dams also act as barriers disturbing fish migration between upstream and downstream sections essential for feeding and breeding, resulting in fishery losses (Ziv et al., 2012). In addition, the increasing dry season water levels will disturb various river works – for instance, the low-water-level condition is favourable to river channel maintenance (dredging) and constructions of water infrastructure, usually starting and very active during the dry season months.
Whilst higher economic damages from flood disasters are proportional to extended flooded areas, intensifying flood depths, and prolonging flood durations, there are counteracting positive impacts associated with floods, including the transport of nutrients and increased fishery productivity. Increasing flood extents widen the coverage of fertile agricultural land (Lamberts, 2008), which implies a more extensive production of rice – the most important agricultural activity in the Cambodian Mekong floodplain. In contrast, a substantial reduction in flooded area would lead to a fall in flooded forest, a rich habitat for fish and other species (Arias et al., 2014; Kummu and Sarkkula, 2008), leading to a decline in fishery and ecosystem productivity in general. These benefits from an extended flood extent need to be balanced against the detrimental impacts of deep flood depths and long flood durations, which can be catastrophic to crop yields across the floodplains. Therefore, suitable flood conditions should be well determined for a better trade-off with the developmental impacts.
4.3 Limitations and perspectives for future research
Several studies have been conducted to understand hydrologic processes within the Cambodian Mekong floodplain, Tonle Sap Lake basin, and Vietnamese Mekong Delta. Different considerations have been taken into account for the analysis in previous research; they include but are not limited to (1) water infrastructure development, (2) climate change, (3) sea level rise, (4) land use and land cover change, (5) population growth, and (6) climate-related phenomena. However, the present study is targeted to gain insight into how the combination of upstream hydropower development, irrigation expansion, and climate change will affect the Cambodian Mekong floodplain in terms of hydrological and flood patterns. Under climate change scenarios, the future rainfall and temperature were assumed to respectively be wetter and warmer.
Future research should employ finer-resolution climate models and newer CMIP6 scenarios, although according to our analysis, basin-wide mean precipitation and temperature do not differ greatly between these two climate change modelling phases (Table S1). In addition, a small-scale decision support tool, as well as satellite-based image analysis, was set up to assist in evaluating a comprehensive study of the flood vulnerability in the Cambodian Mekong floodplain or the wider implications for the water–energy–food nexus for present and future conditions.
Another relevant research direction is the prediction of future land use and river morphological changes. This could generate a key input for a more realistic assessment of hydrological and flood alterations. River sand mining has been very active in the Cambodian Mekong River and its main tributaries as rapid and on-going urbanization requires a massive amount of sand, which is an important material not only for construction but also for backfill (Boretti, 2020; Hackney et al., 2020). Riverbank collapses, directly or indirectly associated with excessive sand extraction, have been very severe. Moreover, many floodplains and wetlands have been filled by sand and transformed into urban areas, resulting in a critical change in river morphology and landscape along the river channels and throughout the floodplains. More importantly, these alterations are still being perpetuated without the full impact of their occurrence being understood or accounted for.
Floods are an essential component of the landscape for both the people and the ecosystem of the Mekong Basin, but they also pose significant hazards and losses when the magnitude is too great to handle effectively. As the development of water infrastructure could cause a decrease in flood conditions and climate change may reverse such impacts, it is still unknown what the desired flood water level and flood duration should be. This has led to a great difficulty in proposing optimum flood protection measures while maximizing dam benefits. Therefore, another potential research topic is the determination of the ideal flood conditions for maximum productivity from both the agricultural and ecosystem perspectives.
The intended purpose of this future research is to provide valuable information and assist governments, policymakers, and water resource engineers in foreseeing future threats of different intensities. Moreover, their results would be helpful in formulating better water resource management strategies and in elevating all living things' resilience to the future challenges for the sustainability of resources within the floodplain.
By combining the effects of development activities and climate change, this research uses a novel setup of three different models to assess the potential impacts of hydropower development, irrigation expansion, and climate change on the Cambodian Mekong floodplain. We show through model validation that the developed modelling setup performs well in the study area and could therefore potentially be used for future studies in the Mekong, as well as in the floodplains of other large rivers. Our findings contribute to the delivery of more precise information about the expected changes to flooding regimes in the area and highlight the importance of properly characterizing the directions and magnitudes of these changes. The combined development scenarios that we analysed exhibited the same pattern of decreasing hydrological conditions during the wet season, whilst increasing water discharge and water levels in the dry season. The degree of hydrological alteration under hydropower development and irrigation expansion is counteracted to a limited degree by the impact of future climate change, which is projected to intensify the onset of wet season months and exacerbate water deficiencies in the dry season months.
Our findings assist in strategic plan formulation and decision-making processes in the dynamic Mekong region. The positive and negative implications of developmental impacts on water availability, flow alterations, and particularly flood regime alterations should be carefully considered when determining the level of investment to place in counteracting measures. Reduced flooding during the wet season has flood protection benefits, whereas increases in the dry season flows have the benefit of increased water availability for irrigation. However, the negative impacts should also be considered: a reduction in fishery productivity, sediment trapping and a decline in nutrient supply to the floodplain, and a reduction in floodplain ecosystem productivity. Balancing these trade-offs will be an essential component of any successful floodplain management strategy put in place to address future climate change and uncertainty in a sustainable manner. Timely preparedness will be essential to avoid future economic and environmental damages, as well as safeguarding the well-being of vulnerable communities living throughout the Cambodian Mekong floodplain.
All of the modelling packages used for our analysis are freely available from the sources cited in the paper.
All of the data used for our analysis are freely available from the sources cited in the manuscript. In addition, we have placed time series results of scenario discharges and water levels for all gauging stations as well as flood depth and duration maps in the following repository: https://doi.org/10.5281/zenodo.6341785 (Horton et al., 2022).
The supplement related to this article is available online at: https://doi.org/10.5194/nhess-22-967-2022-supplement.
AJH contributed to the original conceptualization, formal analysis, writing – both original draft and the revisions, and the visualizations. NVKT contributed to the methodology, formal analysis, and writing – reviews and editing. LPH contributed to the methodology, formal analysis, and writing – reviews and editing. SH contributed to the original conceptualization, formal analysis, and writing – original draft. PH contributed to the formal analysis. SC contributed to the formal analysis. JK contributed to the methodology and the formal analysis. MK contributed to the original conceptualization, writing – both the original draft and the reviews and editing, visualization, supervision, project administration, and funding acquisition.
The contact author has declared that neither they nor their co-authors have any competing interests.
Publisher’s note: Copernicus Publications remains neutral with regard to jurisdictional claims in published maps and institutional affiliations.
The authors are sincerely thankful to all relevant organizations for the supporting information and data needed to conduct this study. The study has been greatly improved by the careful consideration and comments made by the two anonymous reviewers.
This research has been supported by the Academy of Finland (grant no. 305471) and the European Research Council (ERC) Horizon 2020 programme (grant no. 819202).
This paper was edited by Daniela Molinari and reviewed by two anonymous referees.
Adamson, P. T., Rutherfurd, I. D., Peel, M. C., and Conlan, I. A.: The Hydrology of the Mekong River, chap. 4, edited by: Campbell, I. C., The Mekong Academic Press, San Diego, 53–76, 2009.
Arias, M. E., Cochrane, T. A., Piman, T., Kummu, M., Caruso, B. S., and Killeen, T. J.: Quantifying changes in flooding and habitats in the Tonle Sap Lake (Cambodia) caused by water infrastructure development and climate change in the Mekong Basin, Environ. Manage., 112, 53–66, https://doi.org/10.1016/j.jenvman.2012.07.003, 2012.
Arias, M. E., Cochrane, T. A., Kummu, M., Lauri, H., Holtgrieve, G. W., Koponen, J., and Piman, T.: Impacts of hydropower and climate change on drivers of ecological productivity of Southeast Asia's most important wetland, Ecol. Modell., 272, 252–263, https://doi.org/10.1016/j.ecolmodel.2013.10.015, 2014.
Benaman, J., Shoemaker, C. A., and Haith, D. A.: Calibration and Validation of Soil and Water Assessment Tool on an Agricultural Watershed in Upstate New York, J. Hydrol. Eng., 10, 363–374, https://doi.org/10.1061/(ASCE)1084-0699(2005)10:5(363), 2005.
Boretti, A.: Implications on food production of the changing water cycle in the Vietnamese Mekong Delta, Glob. Ecol. Conserv., 22, e00989, https://doi.org/10.1016/j.gecco.2020.e00989, 2020.
Chen, A., Liu, J., Kummu, M., Varis, O., Tang, Q., Mao, G., Wang, J., and Chen, D.: Multidecadal variability of the Tonle Sap Lake flood pulse regime, Hydrol. Process., 35, e14327, https://doi.org/10.1002/hyp.14327, 2021.
Dang, T. D., Cochrane, T. A., Arias, M. E., and Tri, V. P. D.: Future hydrological alterations in the Mekong Delta under the impact of water resources development, land subsidence and sea level rise, J. Hydrol. Reg. Stud. 15, 119–133, https://doi.org/10.1016/j.ejrh.2017.12.002, 2018.
Darby, S. E., Leyland, J., Kummu, M., Räsänen, T. A., and Lauri, H.: Decoding the drivers of bank erosion on the Mekong river: The roles of the Asian monsoon, tropical storms, and snowmelt, Water Resour. Res., 49, 2146–2163, https://doi.org/10.1002/wrcr.20205, 2013.
Donchyts, G., Schellekens, J., Winsemius, H., Eisemann, E., and Van de Giesen, N.: A 30 m Resolution Surface Water Mask Including Estimation of Positional and Thematic Differences Using Landsat 8, SRTM and OpenStreetMap: A Case Study in the Murray-Darling Basin, Australia, Remote Sens., 8, 386, https://doi.org/10.3390/rs8050386, 2016.
Duc Tran, D., van Halsema, G., Hellegers, P. J. G. J., Phi Hoang, L., Quang Tran, T., Kummu, M., and Ludwig, F.: Assessing impacts of dike construction on the flood dynamics of the Mekong Delta, Hydrol. Earth Syst. Sci., 22, 1875–1896, https://doi.org/10.5194/hess-22-1875-2018, 2018.
Dung, N. V., Merz, B., Bárdossy, A., Thang, T. D., and Apel, H.: Multi-objective automatic calibration of hydrodynamic models utilizing inundation maps and gauge data, Hydrol. Earth Syst. Sci., 15, 1339–1354, https://doi.org/10.5194/hess-15-1339-2011, 2011.
FAO, IIASA: Harmonized World Soil Database (version 1.1), Food and Agriculture Organization of United Nations (FAO), Rome, Italy and The international Institute for Applied Systems Analysis (IIASA) [data set], Laxenburg, Austria, https://webarchive.iiasa.ac.at/Research/LUC/External-World-soil-database/HTML/HWSD_Data.html?sb=4 (last access: 1 December 2011), 2009.
Fischer, G., Tubiello, F. N., van Velthuizen, H., and Wiberg, D. A.: Climate change impacts on irrigation water requirements: Effects of mitigation, 1990–2080, Technol. Forecast. Soc., 74, 1083–1107, https://doi.org/10.1016/j.techfore.2006.05.021, 2007.
Fujii, H., Garsdal, H., Ward, P., Ishii, M., Morishita, K., and Boivin, T.: Hydrological roles of the Cambodian floodplain of the Mekong River, Int. J. River Basin Manag., 1, 253–266, https://doi.org/10.1080/15715124.2003.9635211, 2003.
GLC2000: The Global Land Cover Map for the Year 2000, European Commision Joint Research Centre [data set], https://www.un-spider.org/links-and-resources/data-sources/land-cover-map-glc2000-jrc (last access: 1 December 2011), 2003.
Hackney, C. R., Darby, S. E., Parsons, D. R., Leyland, J., Best, J. L., Aalto, R., Nicholas, A. P., and Houseago, R. C.: River bank instability from unsustainable sand mining in the lower Mekong River, Nat. Sustain., 3, 217–225, https://doi.org/10.1038/s41893-019-0455-3, 2020.
Hoang, L. P., Lauri, H., Kummu, M., Koponen, J., van Vliet, M. T. H., Supit, I., Leemans, R., Kabat, P., and Ludwig, F.: Mekong River flow and hydrological extremes under climate change, Hydrol. Earth Syst. Sci., 20, 3027–3041, https://doi.org/10.5194/hess-20-3027-2016, 2016.
Hoang, L. P., van Vliet, M. T. H., Kummu, M., Lauri, H., Koponen, J., Supit, I., Leemans, R., Kabat, P., and Ludwig, F.: The Mekong's future flows under multiple drivers: How climate change, hydropower developments and irrigation expansions drive hydrological changes, Sci. Total Environ., 649, 601–609, https://doi.org/10.1016/j.scitotenv.2018.08.160, 2019.
Hoanh, C. T., Jirayoot, K., Lacombe, G., and Srinetr, V.: Impacts of climate change and development on Mekong flow regimes. First assessment-2009, MRC Technical Paper No. 29, International Water Management Institute and Mekong River Commission, Vientiane, Lao PDR, 2010.
Horton, A. J., Kummu, M., Triet, N. V. K., and Hoang, L. P.: Future water level, discharge, and flood maps under climate change and infrastructure impacts along the Cambodian Mekong, Zenodo [data set], https://doi.org/10.5281/zenodo.6341785, 2022.
IPCC: Climate Change 2014: Synthesis Report. Contribution of Working Groups I, II and III to the Fifth Assessment Report of the Intergovernmental Panel on Climate Change, edited by: core writing team, Pachauri, R. K. and Meyer, L. A., IPCC, Geneva, Switzerland, 151 pp., ISBN 978-92-9169-143-2, 2014.
Jarvis, A., Reuter, H. I., Nelson, A., and Guevara, E.: Hole-filled SRTM for the globe version 4: data grid, http://srtm.csi.cgiar.org/ (last access: February 2020), 2008.
Ji, X., Li, Y., Luo, X., and He, D.: Changes in the Lake Area of Tonle Sap: Possible Linkage to Runoff Alterations in the Lancang River?, Remote Sens., 10, 866, https://doi.org/10.3390/rs10060866, 2018.
Kallio, M. and Kummu, M.: Comment on “Changes of inundation area and water turbidity of Tonle Sap Lake: Responses to climate changes or upstream dam construction?”, Environ. Res. Lett., 16, 058001, https://doi.org/10.1088/1748-9326/abf3da, 2021.
Kazama, S., Hagiwara, T., Ranjan, P., and Sawamoto, M.: Evaluation of groundwater resources in wide inundation areas of the Mekong River basin, J. Hydrol., 340, 233–243, https://doi.org/10.1016/j.jhydrol.2007.04.017, 2007.
Kondolf, G. M., Schmitt, R. J. P., Carling, P., Darby, S., Arias, M., Bizzi, S., Castelletti, A., Cochrane, T. A., Gibson, S., Kummu, M., Oeurng, C., Rubin, Z., and Wild, T.: Changing sediment budget of the Mekong: Cumulative threats and management strategies for a large river basin, Sci. Total Environ., 625, 114–134, https://doi.org/10.1016/j.scitotenv.2017.11.361, 2018.
Kummu, M. and Sarkkula, J.: Impact of the Mekong River Flow Alteration on the Tonle Sap Flood Pulse, Ambio, 37, 185–192, https://doi.org/10.1579/0044-7447(2008)37[185:IOTMRF]2.0.CO;2, 2008.
Kummu, M., Lu, X. X., Wang, J. J., and Varis, O.: Basin-wide sediment trapping efficiency of emerging reservoirs along the Mekong, Geomorphology, 119, 181–197, https://doi.org/10.1016/j.geomorph.2010.03.018, 2010.
Lamberts, D.: Little impact, much damage: the consequences of Mekong River flow alterations for the Tonle Sap ecosystem, in: Modern Myths of the Mekong. A critical review of water and development concepts, principles and policies Water & Development Publications, edited by: Kummu, M., Keskinen, M., and Varis, O., Helsinki University of Technology, Helsinki, Finland, 3–18, ISBN 978-951-22-9102-1, 2008.
Lauri, H., Veijalainen, N., Kummu, M., Koponen, J., Virtanen, M., Inkala, A., and Sark, J.: VMod Hydrological Model Manual, Finnish Environment Institute, EIA Ltd., Helsinki University of Technology, 2006.
Lauri, H., de Moel, H., Ward, P. J., Räsänen, T. A., Keskinen, M., and Kummu, M.: Future changes in Mekong River hydrology: impact of climate change and reservoir operation on discharge, Hydrol. Earth Syst. Sci., 16, 4603–4619, https://doi.org/10.5194/hess-16-4603-2012, 2012.
Manh, N. V., Dung, N. V., Hung, N. N., Kummu, M., Merz, B., and Apel, H.: Future sediment dynamics in the Mekong Delta floodplains: Impacts of hydropower development, climate change and sea level rise, Global Planet. Change, 127, 22–33, https://doi.org/10.1016/j.gloplacha.2015.01.001, 2015.
May, R., Jinno, K., and Tsutsumi, A.: Influence of flooding on groundwater flow in central Cambodia, Environ. Earth Sci., 63, 151–161, https://doi.org/10.1007/s12665-010-0679-z, 2011.
Morris, G. L.: Sediment Management and Sustainable Use of Reservoirs, in: Modern Water Resources Engineering Humana Press, edited by: Wang, L. K. and Yang, C. T., Totowa, New Jersey, 279–337, https://doi.org/10.1007/978-1-62703-595-8_5, 2014.
MRC: Annual Mekong Flood Report 2010, Mekong River Commission, Vientiane, Lao PDR, 76 pp., ISSN 1728-3248, 2011.
MRC: THE COUNCIL STUDY: WUP-FIN IWRM Scenario Modelling Report, Mekong River Commission, Vientiane, Lao PDR, https://www.mrcmekong.org/assets/Publications/Council-Study/IWRM-scenario-modelling-report_Council-Study-SM.pdf (last accessed: 15 October 2021), 2018.
Piman, T., Cochrane, T., Arias, M., Green, A., and Dat, N.: Assessment of Flow Changes from Hydropower Development and Operations in Sekong, Sesan, and Srepok Rivers of the Mekong Basin, J. Water Res. Plan. Man., 139, 723–732, https://doi.org/10.1061/(ASCE)WR.1943-5452.0000286, 2013.
Pokhrel, Y., Shin, S., Lin, Z., Yamazaki, D., and Qi, J.: Potential Disruption of Flood Dynamics in the Lower Mekong River Basin Due to Upstream Flow Regulation, Sci. Rep.-UK, 8, 17767, https://doi.org/10.1038/s41598-018-35823-4, 2018.
Portmann, F. T., Siebert, S., and Döll, P.: MIRCA2000-Global monthly irrigated and rainfed crop areas around the year 2000: A new high-resolution data set for agricultural and hydrological modeling, Global Biogeochem. Cy., 24, GB1011, https://doi.org/10.1029/2008GB003435, 2010.
Räsänen, T. A., Koponen, J., Lauri, H., and Kummu, M.: Downstream Hydrological Impacts of Hydropower Development in the Upper Mekong Basin, Water Resour. Manag., 26, 3495–3513, https://doi.org/10.1007/s11269-012-0087-0, 2012.
Räsänen, T. A., Someth, P., Lauri, H., Koponen, J., Sarkkula, J., and Kummu, M.: Observed river discharge changes due to hydropower operations in the Upper Mekong Basin, J. Hydrol., 545, 28–41, https://doi.org/10.1016/j.jhydrol.2016.12.023, 2017.
Rennó, C. D., Nobre, A. D., Cuartas, L. A., Soares, J. V., Hodnett, M. G., Tomasella, J., and Waterloo, M. J.: HAND, a new terrain descriptor using SRTM-DEM: Mapping terra-firme rainforest environments in Amazonia, Remote Sens. Environ., 112, 3469–3481, https://doi.org/10.1016/j.rse.2008.03.018, 2008.
Schmitt, R. J. P., Rubin, Z., and Kondolf, G. M.: Losing ground – scenarios of land loss as consequence of shifting sediment budgets in the Mekong Delta, Geomorphology, 294, 58–69, https://doi.org/10.1016/j.geomorph.2017.04.029, 2017.
Schmitt, R. J. P., Bizzi, S., Castelletti, A., and Kondolf, G. M.: Improved trade-offs of hydropower and sand connectivity by strategic dam planning in the Mekong, Nat. Sustain., 1, 96–104, https://doi.org/10.1038/s41893-018-0022-3, 2018.
Setegn, S. G., Dargahi, B., Srinivasan, R., and Melesse, A. M.: Modeling of Sediment Yield From Anjeni-Gauged Watershed, Ethiopia Using SWAT Model, J. Am. Water Resour. As., 46, 514–526, https://doi.org/10.1111/j.1752-1688.2010.00431.x, 2010.
Soukhaphon, A., Baird, I. G., and Hogan, Z. S.: The Impacts of Hydropower Dams in the Mekong River Basin: A Review, Water, 13, 265, https://doi.org/10.3390/w13030265, 2021.
Triet, N. V. K., Dung, N. V., Fujii, H., Kummu, M., Merz, B., and Apel, H.: Has dyke development in the Vietnamese Mekong Delta shifted flood hazard downstream?, Hydrol. Earth Syst. Sci., 21, 3991–4010, https://doi.org/10.5194/hess-21-3991-2017, 2017.
Triet, N. V. K., Dung, N. V., Hoang, L. P., Duy, N. L., Tran, D. D., Anh, T. T., Kummu, M., Merz, B., and Apel, H.: Future projections of flood dynamics in the Vietnamese Mekong Delta, Sci. Total Environ., 742, 140596, https://doi.org/10.1016/j.scitotenv.2020.140596, 2020.
Try, S., Tanaka, S., Tanaka, K., Sayama, T., Lee, G., and Oeurng, C.: Assessing the effects of climate change on flood inundation in the lower Mekong Basin using high-resolution AGCM outputs, Prog. Earth Planet. Sci., 7, 34, https://doi.org/10.1186/s40645-020-00353-z, 2020a.
Try, S., Tanaka, S., Tanaka, K., Sayama, T., Oeurng, C., Uk, S., Takara, K., Hu, M., and Han, D.: Comparison of gridded precipitation datasets for rainfall-runoff and inundation modeling in the Mekong River Basin, PLoS One, 15, e0226814, https://doi.org/10.1371/journal.pone.0226814, 2020b.
Västilä, K., Kummu, M., Sangmanee, C., and Chinvanno, S.: Modelling climate change impacts on the flood pulse in the Lower Mekong floodplains, J. Water Clim. Change, 1, 67–86, https://doi.org/10.2166/wcc.2010.008, 2010.
Xu, H.: Modification of normalised difference water index (NDWI) to enhance open water features in remotely sensed imagery, Int. J. Remote Sens., 27, 3025–3033, https://doi.org/10.1080/01431160600589179, 2006.
Yu, W., Kim, Y., Lee, D., and Lee, G.: Hydrological assessment of basin development scenarios: Impacts on the Tonle Sap Lake in Cambodia, Quatern. Int., 503, 115–127, https://doi.org/10.1016/j.quaint.2018.09.023, 2019.
Ziv, G., Baran, E., Nam, S., Rodríguez-Iturbe, I., and Levin, S. A.: Trading-off fish biodiversity, food security, and hydropower in the Mekong River Basin, P. Natl. Acad. Sci. USA, 109, 5609–5614, https://doi.org/10.1073/pnas.1201423109, 2012.