the Creative Commons Attribution 4.0 License.
the Creative Commons Attribution 4.0 License.
 | 25 Feb 2022
An approach to identify the best climate models for the assessment of climate change impacts on meteorological and hydrological droughts
Antonio-Juan Collados-Lara
Juan-de-Dios Gómez-Gómez
David Pulido-Velazquez
Eulogio Pardo-Igúzquiza
This paper describes the benefits of using more reliable local climate scenarios to analyse hydrological responses. It assumes that Regional Climate Model (RCM) simulations are more reliable when they provide better approximations to the historical basic and drought statistics after applying a bias correction to them. We have investigated whether the best solutions in terms of their approximation to the local meteorology may also provide the best hydrological assessments. We have carried out a classification of the corrected RCM simulations used for both approximations. This has been applied in the Cenajo basin (south-eastern Spain), where we show that the best approximations of the historical meteorological statistics also provide the best approximations for the hydrological statistics. The selected RCMs were used to generate future (2071–2100) local scenarios under the RCP8.5 emission scenario. The two selected RCMs predict significant changes in mean precipitation (−31.6 % and −44.0 %) and mean temperature (+26.0 % and +32.2 %). They also predict higher frequency (from 5 events in the historical period to 20 and 22 in the future), length (4.8 to 7.4 and 10.5 months), magnitude (2.53 to 6.56 and 9.62 SPI) and intensity (0.48 to 1.00 and 0.94 SPI) of extreme meteorological droughts. These two RCMs also predict higher changes in mean streamflow (−43.5 % and −57.2 %) and hydrological droughts. The two RCMs also predict worrying changes in streamflow (−43.5 % and −57.2 %) and hydrologically extreme droughts: frequency (from 3 to 11 for the first model and 8 events for the second model), length (8.3 to 15.4 and 29.6 months), magnitude (from 3.98 to 11.84 and 31.72 SSI), and intensity (0.63 to 0.90 and 1.52 SSI).
- Article
(10897 KB) - Full-text XML
- BibTeX
- EndNote


During the last few decades large-scale intensive droughts have been observed on all the continents around the globe (Kogan and Guo, 2016). In Europe the 2003 and 2015 droughts may be regarded as the most extreme droughts over the last 250 years (Hanel et al., 2018). In Spain the 2005 drought was the most severe since records began (Vicente-Serrano et al., 2017).
Since 1950 several indices have been proposed in the literature to assess different types of droughts by studying different climatic and hydrological variables (Heim, 2002; Mishra and Singh, 2010; Pedro-Monzonís et al., 2015). For instance, we have the Palmer Drought Severity Index (PDSI) (Palmer, 1965), the Crop Moisture Index (CMI) (Palmer, 1968), the Standardized Precipitation Index (SPI) (McKee et al., 1993), the Soil Moisture Drought Index (SMDI) (Hollinger et al., 1993), the Vegetation Condition Index (VCI) (Liu and Kogan, 1996) and the Standardized Precipitation Evapotranspiration Index (SPEI) (Vicente-Serrano et al., 2010). From their names we can deduce that some of them were defined to analyse specific characteristics, such as length, magnitude and intensity, and different types of droughts (meteorological, agricultural or hydrological droughts). Some of these indices can be generalised to analyse most of the characteristics of the different types of droughts (for example, the SPI, McKee et al., 1993, 1995) and their propagation.
In most of the scarce water areas droughts will become intensified in the future owing to global change, which is associated with an increment in the occurrence of extreme events. The impact of global change on droughts is a major concern of climate change. The Mediterranean basin is one of the areas that will be most affected by droughts in the future (Tramblay et al., 2020). In addition, the latest climate change studies expect significant decreases in resources in the Mediterranean basins, which will cause a significant environmental, economic and social impact (Cramer et al., 2018). Although in recent years the number of papers related to this issue has increased (Marcos-Garcia et al., 2017; Collados-Lara et al., 2018), we still need to make advances on the assessment (through appropriate indices and techniques) of this important social issue (Mishra and Singh, 2011). Some authors directly use Regional Climate Model (RCM) simulations to assess future droughts (e.g. Lloyd-Hughes et al., 2013; Zhang et al., 2017) in water resource systems; other studies show cases with significant bias between the historical and the modelled values (Cook et al., 2008; Seager et al., 2008), which requires further analysis and corrections.
Different approaches (e.g. delta change; Pulido-Velazquez et al., 2018a) or bias correction; Collados-Lara et al., 2019) can be used to downscale RCM simulations according to the local historical climatology (Collados-Lara et al., 2018). They use different statistical correction techniques (e.g. first and second moment correction, regression; Collados-Lara et al., 2020 or quantile mapping; Gudmundsson et al., 2012). The different approaches produce different approximations of the statistics of the historical period depending on the RCM simulations. They also show a wide range of future corrected simulations that reveal the uncertainty related to the climate models and their propagation (Pardo-Igúzquiza et al., 2019; Pulido-Velazquez et al., 2018a). Hence, the use of several RCMs is recommended to assess the impact of climate change.
The generated scenarios can be used to define a set of individual local projections, which take into account the uncertainty, or to create ensembles of them, which define more robust climate scenarios than those based on a single projection (AEMET, 2009). In both cases a classification of RCM simulations according to their reliability in terms of their capacity to approximate historical meteorological statistics is needed. Depending on the objective of the study the reliability classification should consider different statistics. For drought assessment, in addition to the basic statistics (mean, standard deviation and skew coefficient), drought statistics (e.g. frequency, duration, magnitude and intensity) should be studied (Collados-Lara et al., 2018). In the literature there are few studies that analyse the reliability of RCMs for considering meteorological droughts (Peres et al., 2020; Aryal and Zhu, 2021). In this study we also analyse the propagation of meteorological droughts to hydrological droughts. To the best of our knowledge, no studies have analysed whether climate models that provide the best approximations of the local historical meteorology might also provide better assessments of the hydrological impact. In these cases, the generated local climate scenarios have to be propagated by using hydrological models (Senent-Aparicio et al., 2018; Pardo-Igúzquiza et al., 2017).
The main objective of this paper is to answer the following question: do climate models that allow better approximations of local meteorology improve the assessment of hydrological responses? It is a question that will be answered by a novel approach based on the analyses of basic and drought statistics. We propose a classification method for RCM simulations according to their capacity to generate local climate scenarios that reproduce the historical period (in terms of basic and drought statistics). The classification has been made and compared for both meteorological and hydrological scenarios, considering basic and drought statistics, in order to compare the results for both types of droughts. Based on these analyses, an integrated statistical method is proposed to generate “more reliable” potential future climate scenarios from RCM simulations and historical data. Our aim is to contribute to a better assessment of future meteorological and hydrological droughts and is applicable to any case study.
The paper is structured as follows. In Sect. 2 we describe the proposed method. Section 3 is focused on the description of the case study and the available data, including historical and climate simulations. In Sect. 4 the results are presented and in Sect. 5 the discussion. Finally, Sect. 6 summarises the main conclusions of this study.
The steps that define the proposed method are represented in the flow chart shown in Fig. 1. It requires compilation of the monthly information about historical precipitation, temperature and streamflow within the system, as well as RCM simulations. Long historical series are needed in order to perform an appropriate statistical analysis of the proposed approaches. Periods of analyses that cover 30 years or even longer are recommended. A statistical analysis is proposed in order to assess the bias between the statistics of the RCM control simulations and the historical scenarios in the case study. If there are significant differences between them, the RCM simulations for the future horizon cannot be directly used to define the future local climate scenarios of the system, and we need to apply some statistical corrections to them.
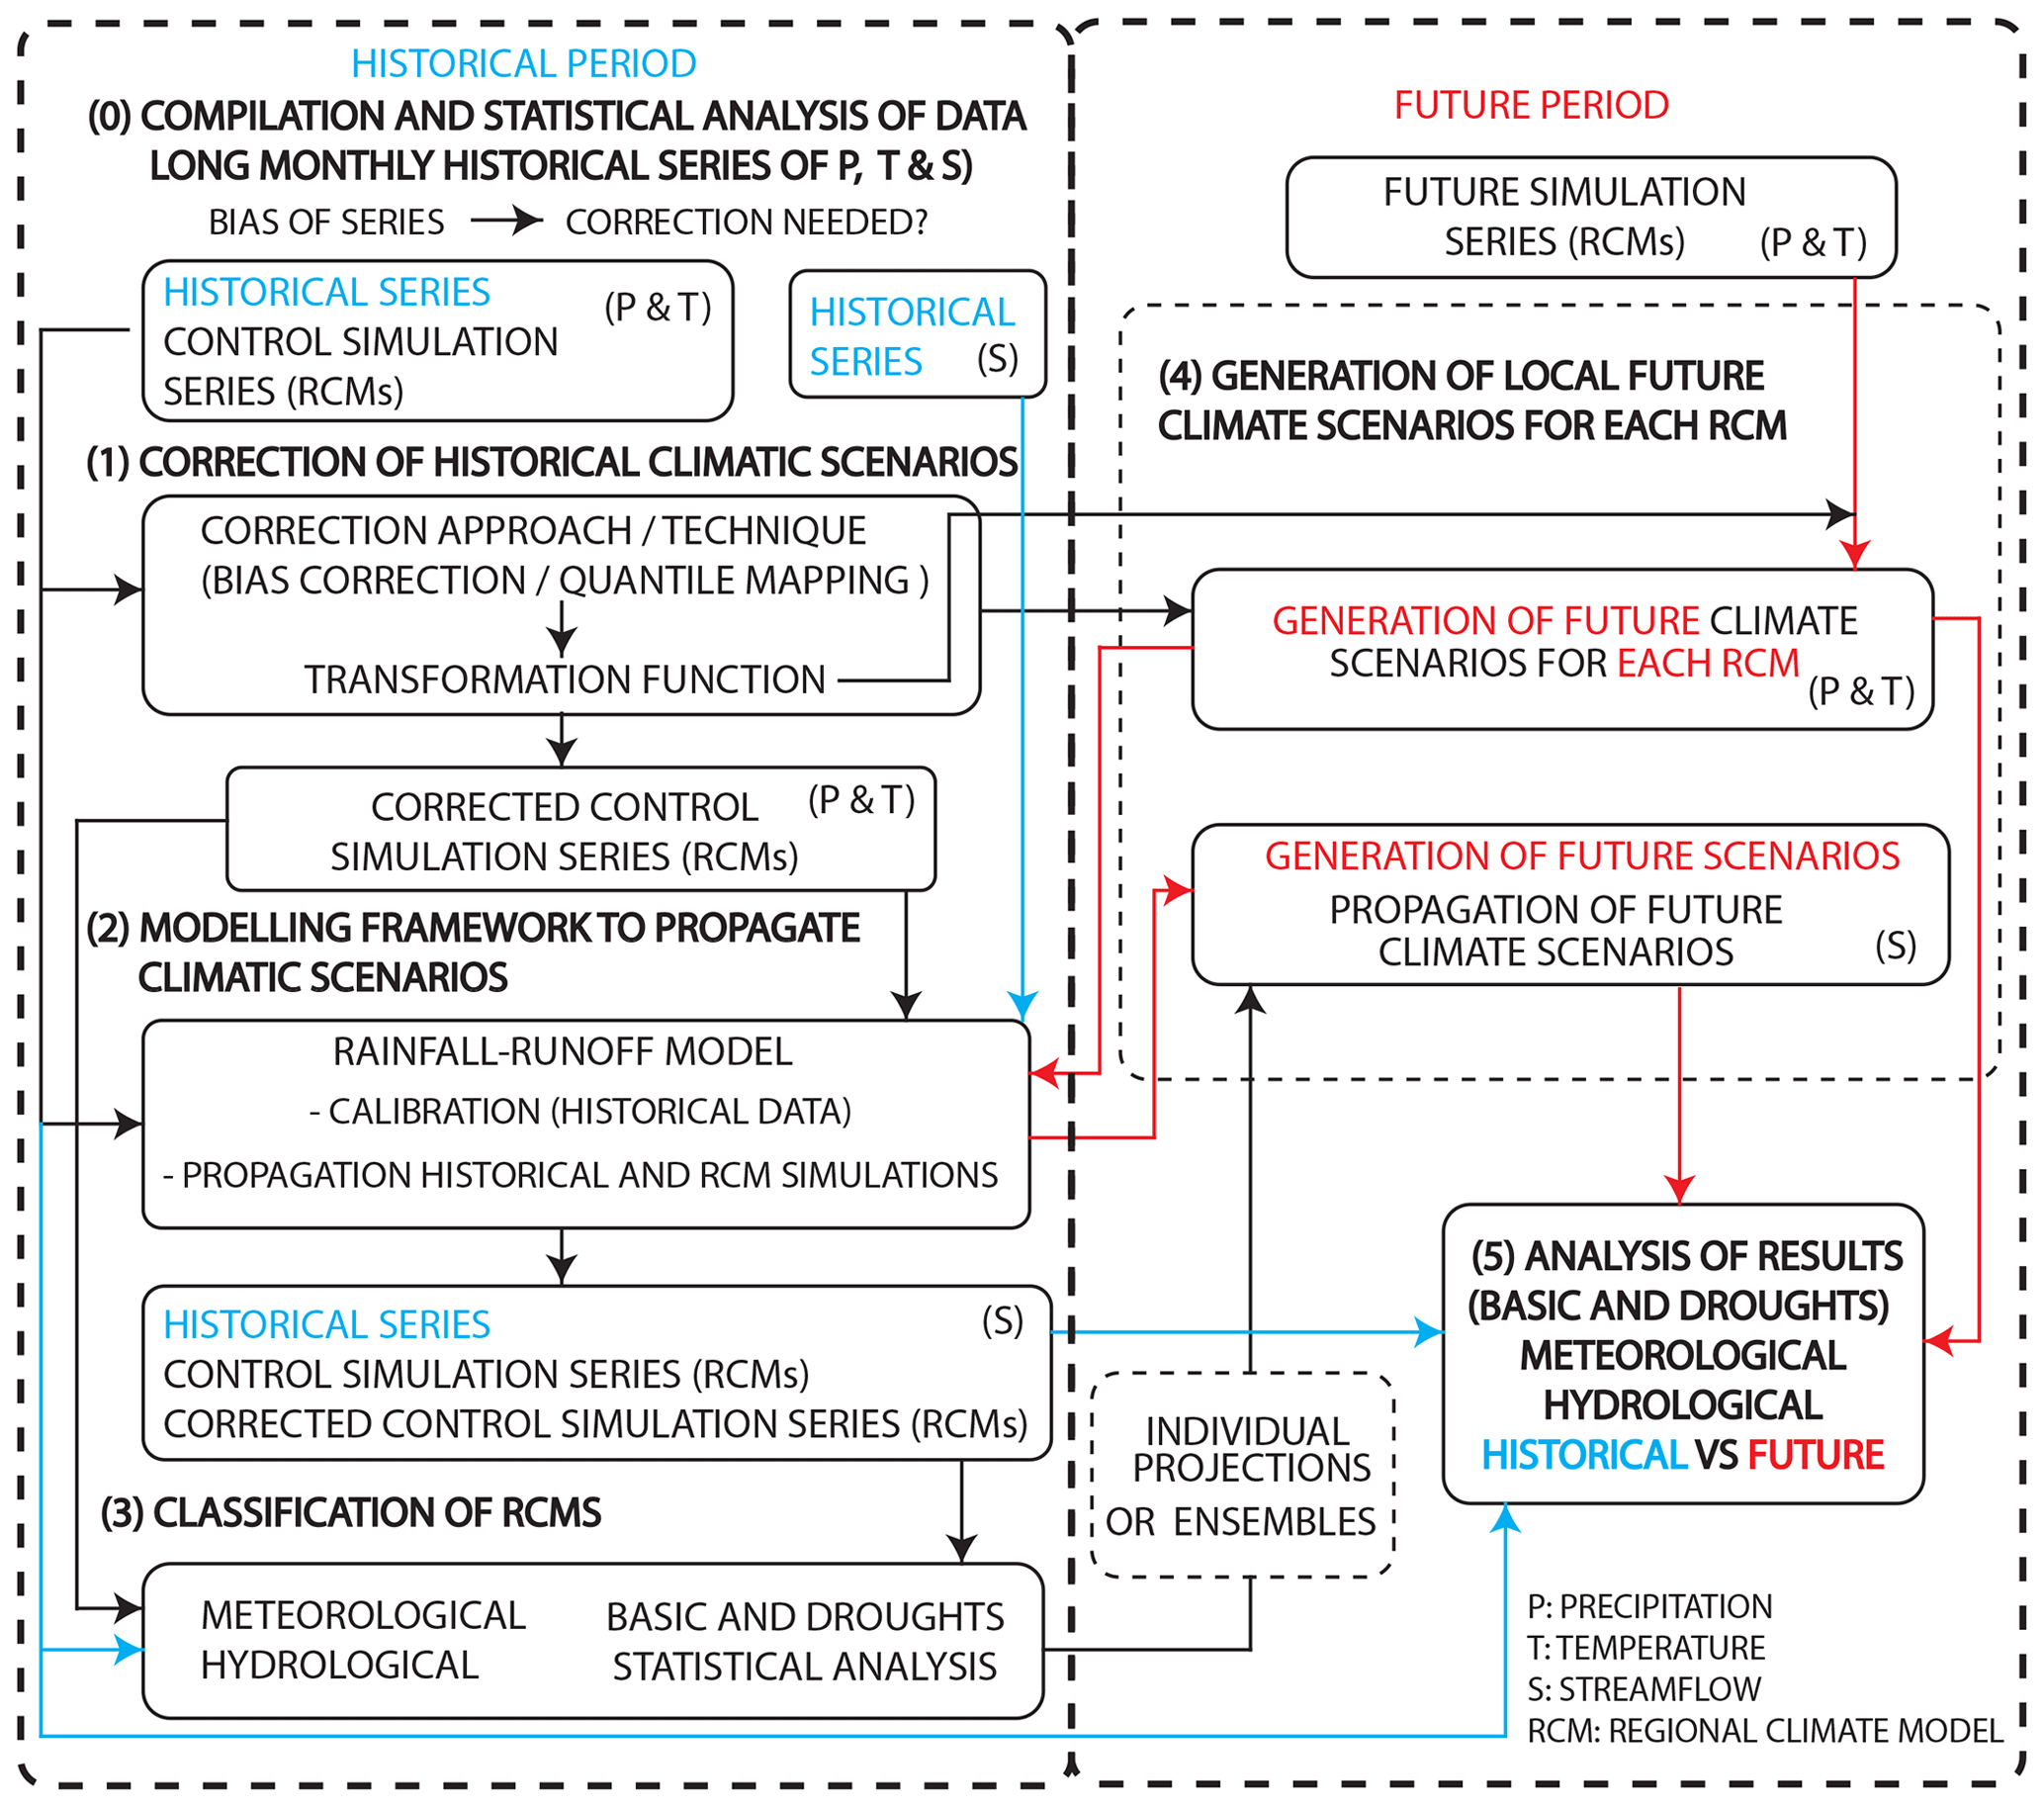
Figure 1Flow chart of the proposed methodology for the assessment of future meteorological and hydrological droughts.
2.1 Correction of historical climate scenarios
We have corrected the RCM control simulations by applying a bias correction approach. It is based on a transformation function that minimises the differences between the statistics of the control simulations and the historical scenarios (Shrestha et al., 2017). The statistical transformation was defined by a quantile mapping technique based on empirical quantiles. We used the open-source R package qmap (Gudmundsson et al., 2012). Quantile mapping with empirical quantiles uses a non-parametric transformation function. In this approach the empirical cumulative distribution functions (CDFs) are approximated using tables of empirical quantiles. It estimates the values of the empirical CDFs of observed and simulated time series for regularly spaced quantiles to create the table that relates the observed and simulated time series (Enayati et al., 2021). The values between the percentiles are approximated by using linear interpolation. These interpolations are used to adjust a datum with unavailable quantile values. We have used its table of empirical quantiles for each month of the year. These tables (which are obtained by using the CDF of the observed and simulated values from RCMs) are also used to correct future simulations (from RCMs). If the RCM values are greater than the historical ones used to estimate the empirical CDF, the correction found for the highest quantile of the historical period is used (Gudmundsson et al., 2012). This technique has been demonstrated to be better than other, simpler, techniques (first and second moment correction, regression, as well as quantile mapping using parametric distributions) to correct basic statistics (mean, standard deviation and skew coefficient) (see Collados-Lara et al., 2018). This is why we have chosen quantile mapping (using empirical quantiles) for this study.
2.2 Definition of the rainfall-runoff model
A hydrological balance model is defined to propagate different climate scenarios (historical, control, corrected control and futures) in order to assess hydrological series (streamflow series) and their basic and drought statistics. A rainfall-runoff model was calibrated and validated (by minimising the sum of the squared errors for each month) with the available historical data (Pulido-Velazquez et al., 2008). In this study we have applied a Téemez model (Témez, 1977) to assess inflow scenarios in the natural flow regime in the basin. It is a lumped conceptual hydrological model frequently used in Spanish basins (Escriva-Bou et al., 2017; Péréz-Sánchez et al., 2019). It is formulated by balance and transfer equations using just four parameters and two storage tanks (representing the soil or unsaturated zone and the aquifer). The potential evapotranspiration, which is required for this model, has been estimated by applying the Thornthwaite method (Thornthwaite, 1948) from temperature data.
2.3 Classification of the RCMs
An analysis of the performance for each RCM simulation after applying the statistical correction was performed for both the meteorological series and the hydrological simulations. The accuracy of the model was analysed in terms of basic (mean, standard deviation and skew coefficient) and drought statistics (frequency, duration, magnitude and intensity). The meteorological and hydrological drought analysis was developed by applying the Standard Precipitation index (SPI) (Bonaccorso et al., 2003; Livada and Assimakopoulos, 2007) and Standard Streamflow index (SSI) (Salimi et al., 2021), respectively. They were estimated for periods of aggregation equal to 12 months. The calculation method requires the transformation of a gamma frequency distribution function to a normal standardised frequency distribution function. The statistics of the SPI/SSI series are obtained by applying the run theory (González and Valdés, 2006; Mishra et al., 2009) for different SPI/SSI thresholds from the lower SPI/SSI to 0. The frequency is defined as the number of drought events for each SPI threshold. We have assessed the duration of each drought event as the number of months that the SPI is below a given threshold, its magnitude as the summation of the SPI values for each month of the event and its intensity as the minimum SPI value. For each threshold we have estimated the mean duration, magnitude and intensity as the mean values of the cited variables for all the drought events. The probability of the occurrence of precipitation or streamflow for the SPI/SSI calculation, in the corrected control and future simulations, was obtained by using the parameters calibrated from the observed series, in order to perform an appropriate comparison (Marcos-Garcia et al., 2017). In order to analyse the benefit of the proposed method to select future climate scenarios in the assessment of basic and drought statistics, we checked whether the local climate scenarios from RCM simulations that allow better approximations of the meteorology did provide better assessments of the hydrological statistics.
We assessed the performance for each RCM in the reference period by applying the following error index (SE):
where S is the statistic being considered, N is 12 in the case of basic statistics (number of months in a year) and the number of SPI thresholds considered in the case of drought statistics, c is the corrected control scenario and h is the historical scenario. Note that this index is a mean squared error of the corrected control with respect to the historical values. It is divided by the square of the mean historical value in order to make the results comparable for different statistics.
This error index was calculated for each basic (mean, standard deviation and skew coefficient) and drought (frequency, length, magnitude and intensity) statistic and used to classify RCMs according to their reliability for the assessment of meteorological and hydrological impact. For each statistic we classified the RCMs according to the following criteria. The RCMs that have an SE lower than 0.0009 (equivalent to a 3 % of relative error) are not penalised. The rest of RCMs are penalised proportionally from 1 to 10 with 1 being the lowest SE and 10 the highest SE. Finally, we carried out the classification of the RCMs for the meteorological and hydrological analyses by calculating the average of the penalisation for all the statistics (basic and drought). The penalisation approach allows us to define an index (SE) threshold below which the RCMs are not penalised. It also allows us to give similar weight to all the statistics in the final classification. Note that the skew coefficient and drought statistics have higher SE values. If we add up the SE values for all the statistics and we classify RCMs in accordance with this total, the mean or standard deviation statistics will not influence the final classification.
2.4 Generation of local future climate scenarios and statistical analysis of the results
The classification of local climate scenarios from RCM simulations allows us to identify approaches with higher reliability for both meteorological and hydrological statistics. For these RCM simulations we can generate local future climate scenarios by applying the same transformation function used to correct the control simulation to the future simulation series. These scenarios can be used as individual projections that allow us to take into account the uncertainty by considering a set of different RCM simulations. An ensemble of scenarios could also be applied to produce more robust climate scenarios than those based on a single projection. Finally, these future scenarios were analysed in terms of basic and drought statistics, and compared with the historical scenarios to assess the impact of climate change on meteorology and hydrology.
The proposed methodology was applied to the Cenajo basin. It is located in south-eastern Spain (Fig. 2), within the basin headwaters of the Segura River, which is the main stream of the Segura basin. The main cities of the system are Murcia, with a population of around 440 000, and Alicante, with a population of more than 330 000. These cities are partially supplied by the Segura River system. The Segura River is also important for agriculture. The main socioeconomic activity is irrigated agriculture, traditionally concentrated in the alluvial and coastal plains. The main crops are citrus and fruit trees, and also green and other vegetables. This coastal basin is an example of a Mediterranean area with a significant water demand, mainly for irrigation but also for urban supply (with an important seasonal component for the tourist sector), and low availability of resources. In fact, it is a system with significant deficits that needs water transfers from the Tagus basin and additional supplies from desalination plants to meet the existing demands. The Cenajo basin has a Mediterranean climate. In the period 1972–2001, the mean annual precipitation was 623.6 mm and the mean temperature 14.0 ∘C. In the same period the mean annual streamflow was 443.6 Mm3. This is a critical area where climate change will exacerbate these problems by reducing the availability of resources and increasing irrigation requirements. It will also cause an increase in the magnitude and frequency of extreme events, such as droughts.
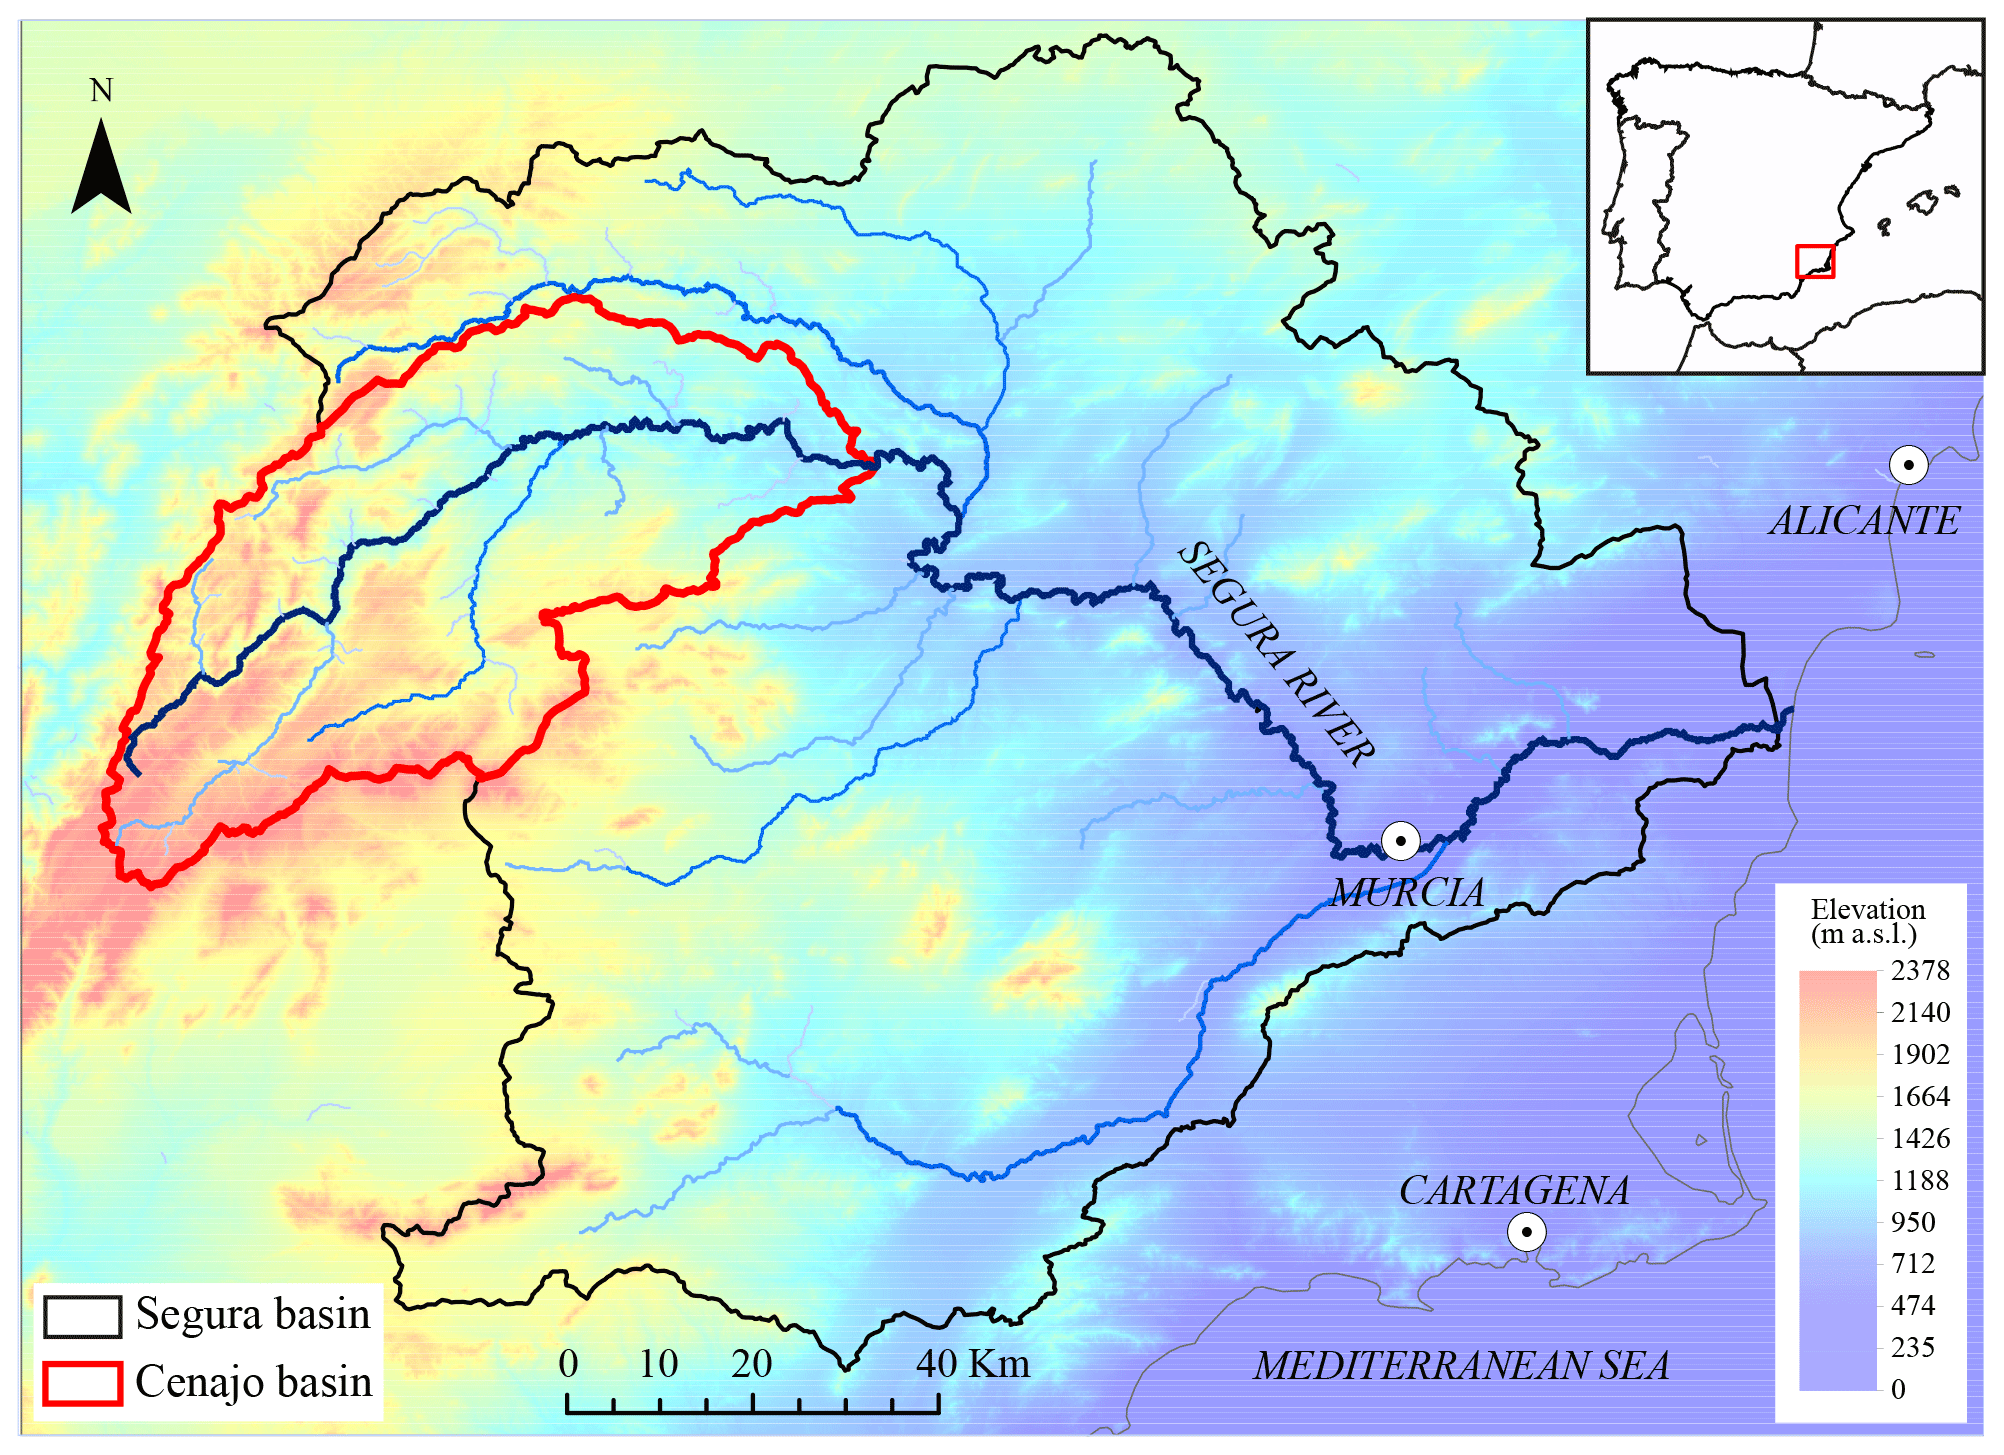
Figure 2Location of the case study.
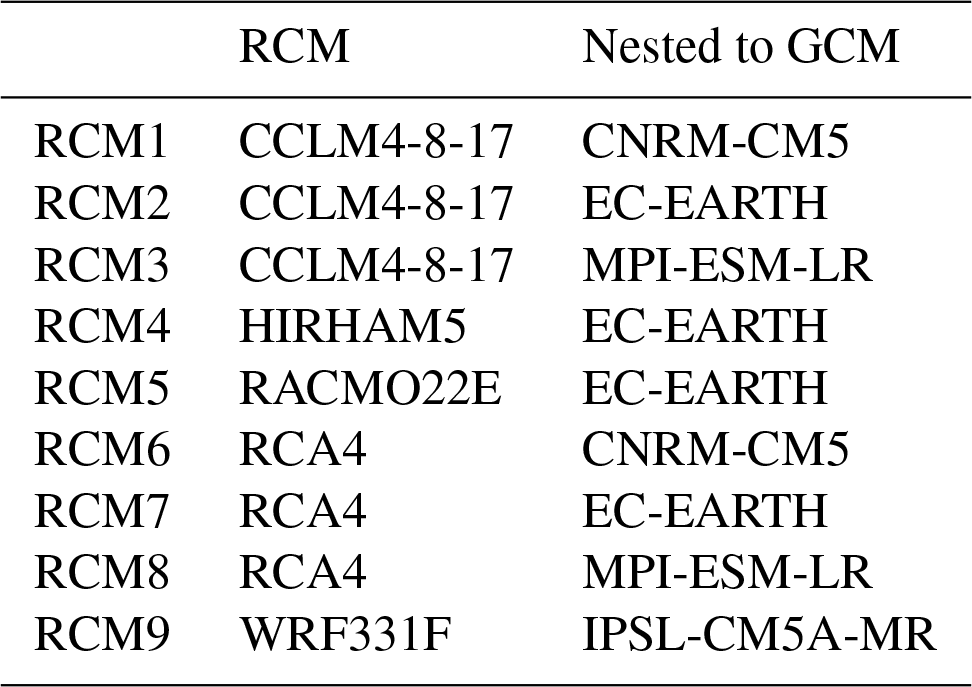
We used historical climate data (precipitation and temperature) provided by the Spain02 v2 dataset (Herrera et al., 2012) for the period 1972–2001. In this study we have carried out a lumped analysis in the Cenajo basin. The RCMs were retrieved from the CORDEX project (CORDEX PROJECT, 2013), with a spatial resolution of 0.11∘ (approximately 12.5 km). Note that the Spain02 dataset uses the same reference grids as the CORDEX project. The most pessimistic emission scenario (RCP8.5) for the future horizon 2071–2100 was selected for the future projections. For this scenario we analysed nine RCMs corresponding to four different General Circulation Models (GCMs) (see Table 1). In our case study 33 cells of the grid mesh fall within the basin. The historical and simulated (from RCMs) precipitation and temperature were aggregated at the basin scale considering a weighted average value according to the area of each grid mesh inside the basin. We also used official monthly natural streamflow data within the Cenajo basin for the historical period 1972–2001 (adopted as reference). The SIMPA model streamflow series (Alvarez et al., 2005) were used as historical data for calibration, owing to the highly altered flow regime measured in gauge stations within this basin. Note that in the studied basin there are several dams. SIMPA is the model used by the water authorities in Spain for water planning. It was calibrated previously by restoring the gauge stations to the natural regime. Therefore, we assessed inflow scenarios in the natural flow regime in the basin. These data were taken from the available information from the Spanish Ministry for Agrarian Development and Irrigation.
4.1 Rainfall-runoff model
The rainfall-runoff model for the Cenajo basin was calibrated and validated using the available monthly climate data (precipitation, temperature and potential evapotranspiration) and streamflow data for the period October 1971 to September 2007. We divided the series with available data into two periods to perform calibration (from October 1971 to September 1989) and validation (October 1989 to September 2007) of the model. The performance of the model was assessed by using the Nash–Sutcliffe efficiency (NSE) coefficient, the correlation coefficient (R2) and the root mean squared error (RMSE). These statistics and the historical and simulated streamflow series are shown in Fig. 3a. For the entire period (October 1971 to September 2007) the performance is also good (NSE = 0.94) and it is higher (NSE = 0.96) if we focus on the monthly mean within the mean year for the entire period (Fig. 3b). The model was used to propagate the impact of climate variables on the streamflow between 2071 and 2100, a 30-year horizon, which is a period of time usually used in climate change analysis.
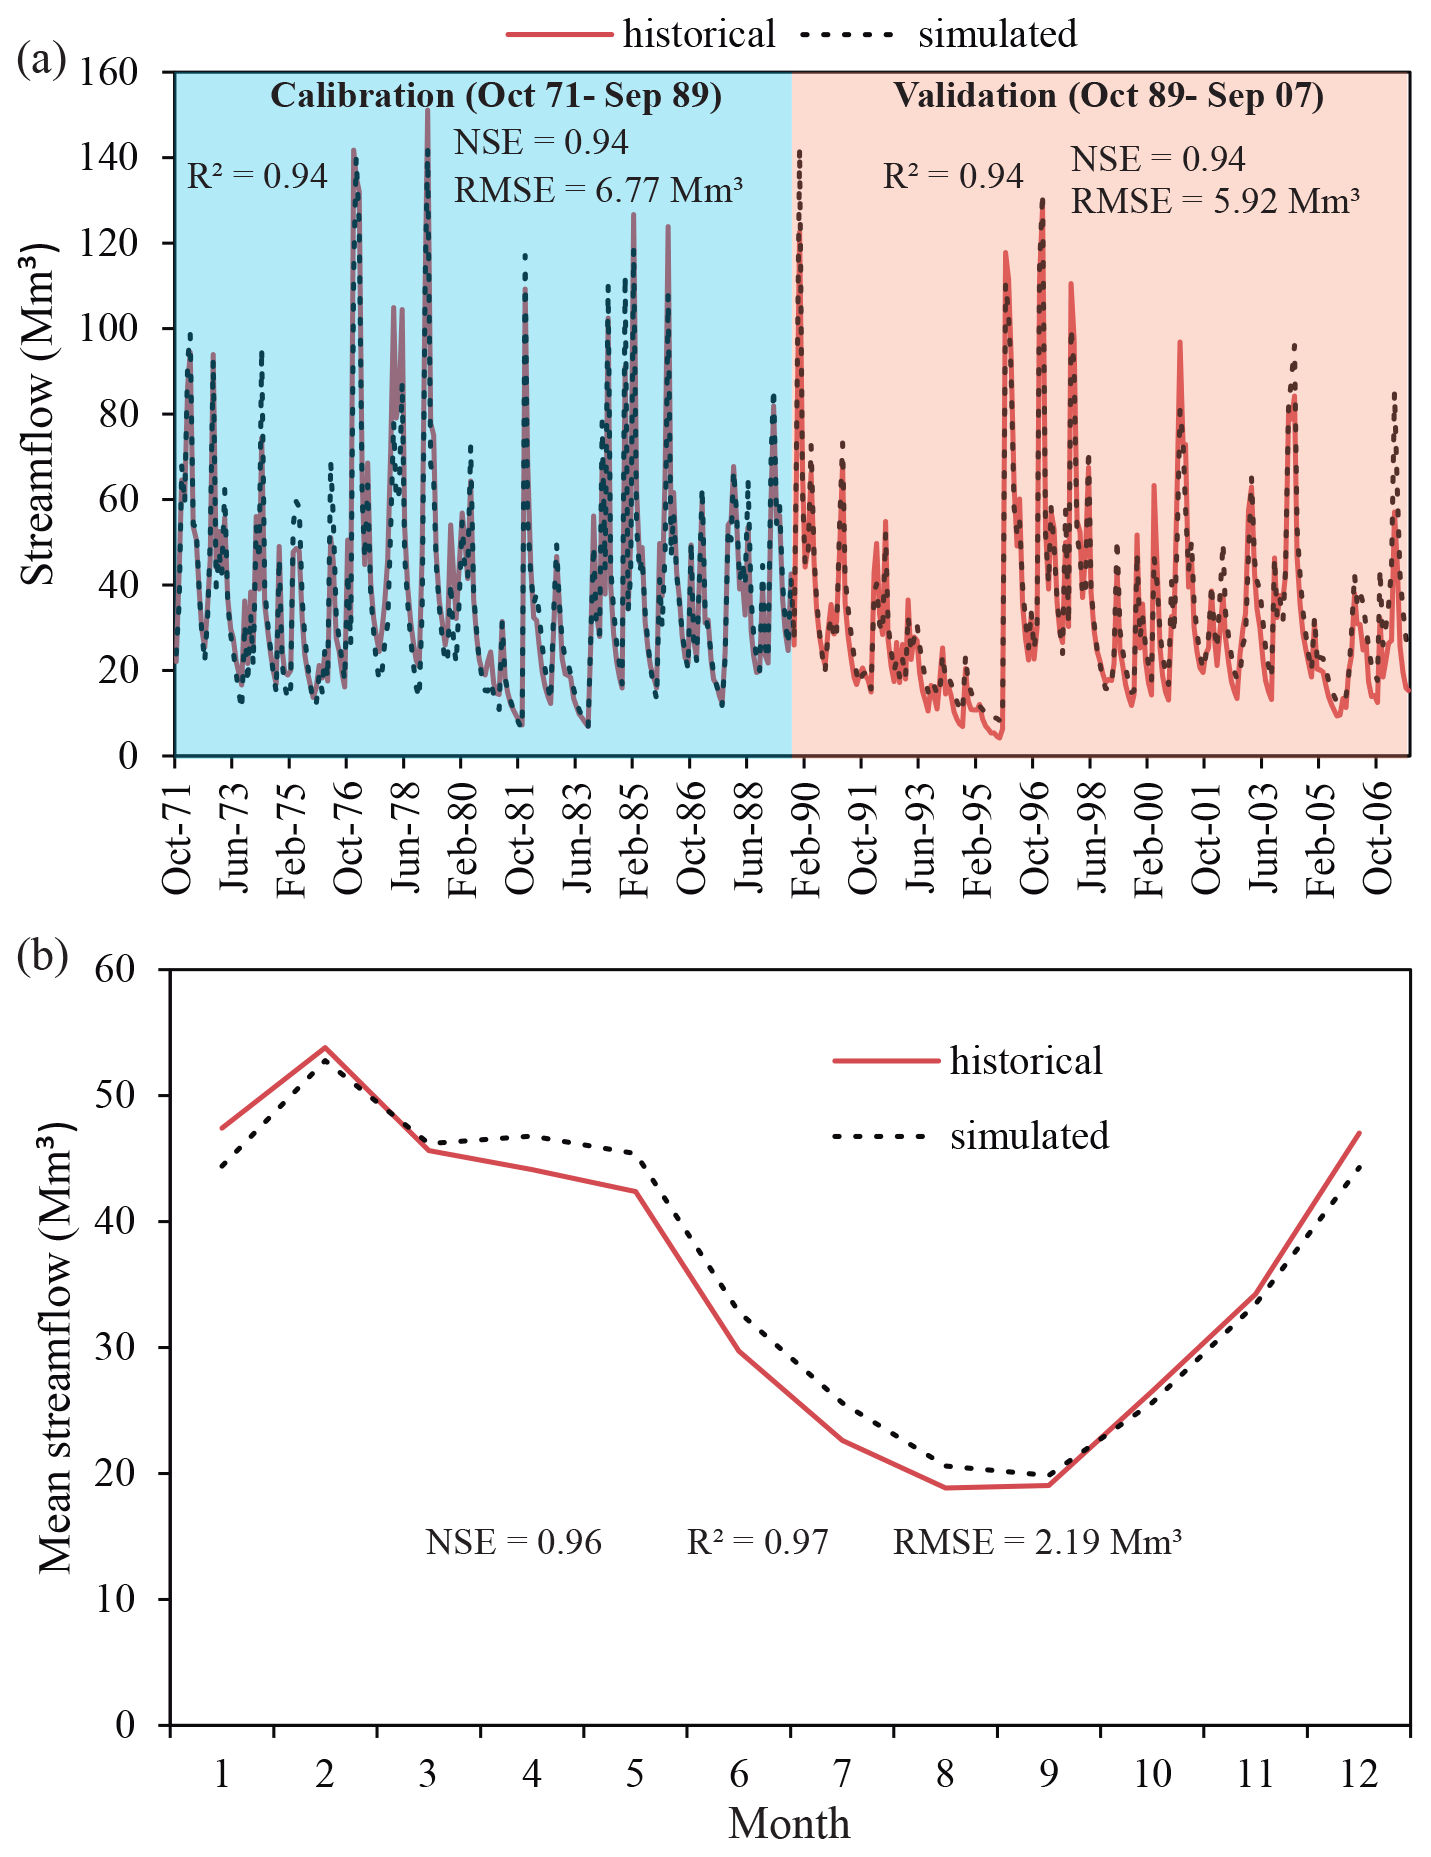
Figure 3Historical and simulated monthly streamflow series in the Cenajo basin for the calibration period (October 1971 to September 1989) and the validation period (October 1989 to September 2007) (a) and mean monthly values within the mean year of the entire period (October 1971 to September 2007) (b).
4.2 Corrected historical simulations
The observed differences between the historical series and the control simulation series of precipitation and temperature for the reference period (1972–2001) in terms of basic statistics are significant (see Table 2). The relative differences between the historical and the control simulations for the mean yearly precipitation (Fig. 4a) vary from −5.6 % for RCM5 and 52.8 % for RCM8. In the same way, the distances in the standard deviation (Fig. 4c) and skew coefficient (Fig. 4e) are also great. The relative differences between the historical temperature and the control simulations for the mean year values (Fig. 5a) vary from −6.2 % for RCM3 and −39.4 % for RCM5. The differences in the temperature standard deviation (Fig. 5c) and skew coefficient (Fig. 5e) are also remarkable. These differences force us to apply the correction approach defined in Sect. 2.1 for all the RCMs considered. It uses the CDF (quantiles) of the historical series and the control series obtained from the RCM simulations to perform the correction. The precipitation and temperature quantiles of the observed and control simulation series of RCM1 in the reference period are shown in Fig. 6. The same information was generated for all the RCM simulations and used to correct the RCM outputs. The corrected control simulation series presents a very good fit with respect to the historical series in terms of basic statistics for precipitation – mean (Fig. 4b), standard deviation (Fig. 4d) and skew coefficient (Fig. 4f) – and for temperature – mean (Fig. 5b), standard deviation (Fig. 5d) and skew coefficient (Fig. 5f). The differences between the historical series and the corrected control simulation for the basic statistics are close to zero. The differences in mean annual values are negligible (see Table 2). This confirms the results obtained by Collados-Lara et al. (2018) when they compared different statistical correction techniques. The quantile mapping (with empirical quantiles) technique shows very good results in terms of the basic statistics when the RCMs are corrected.
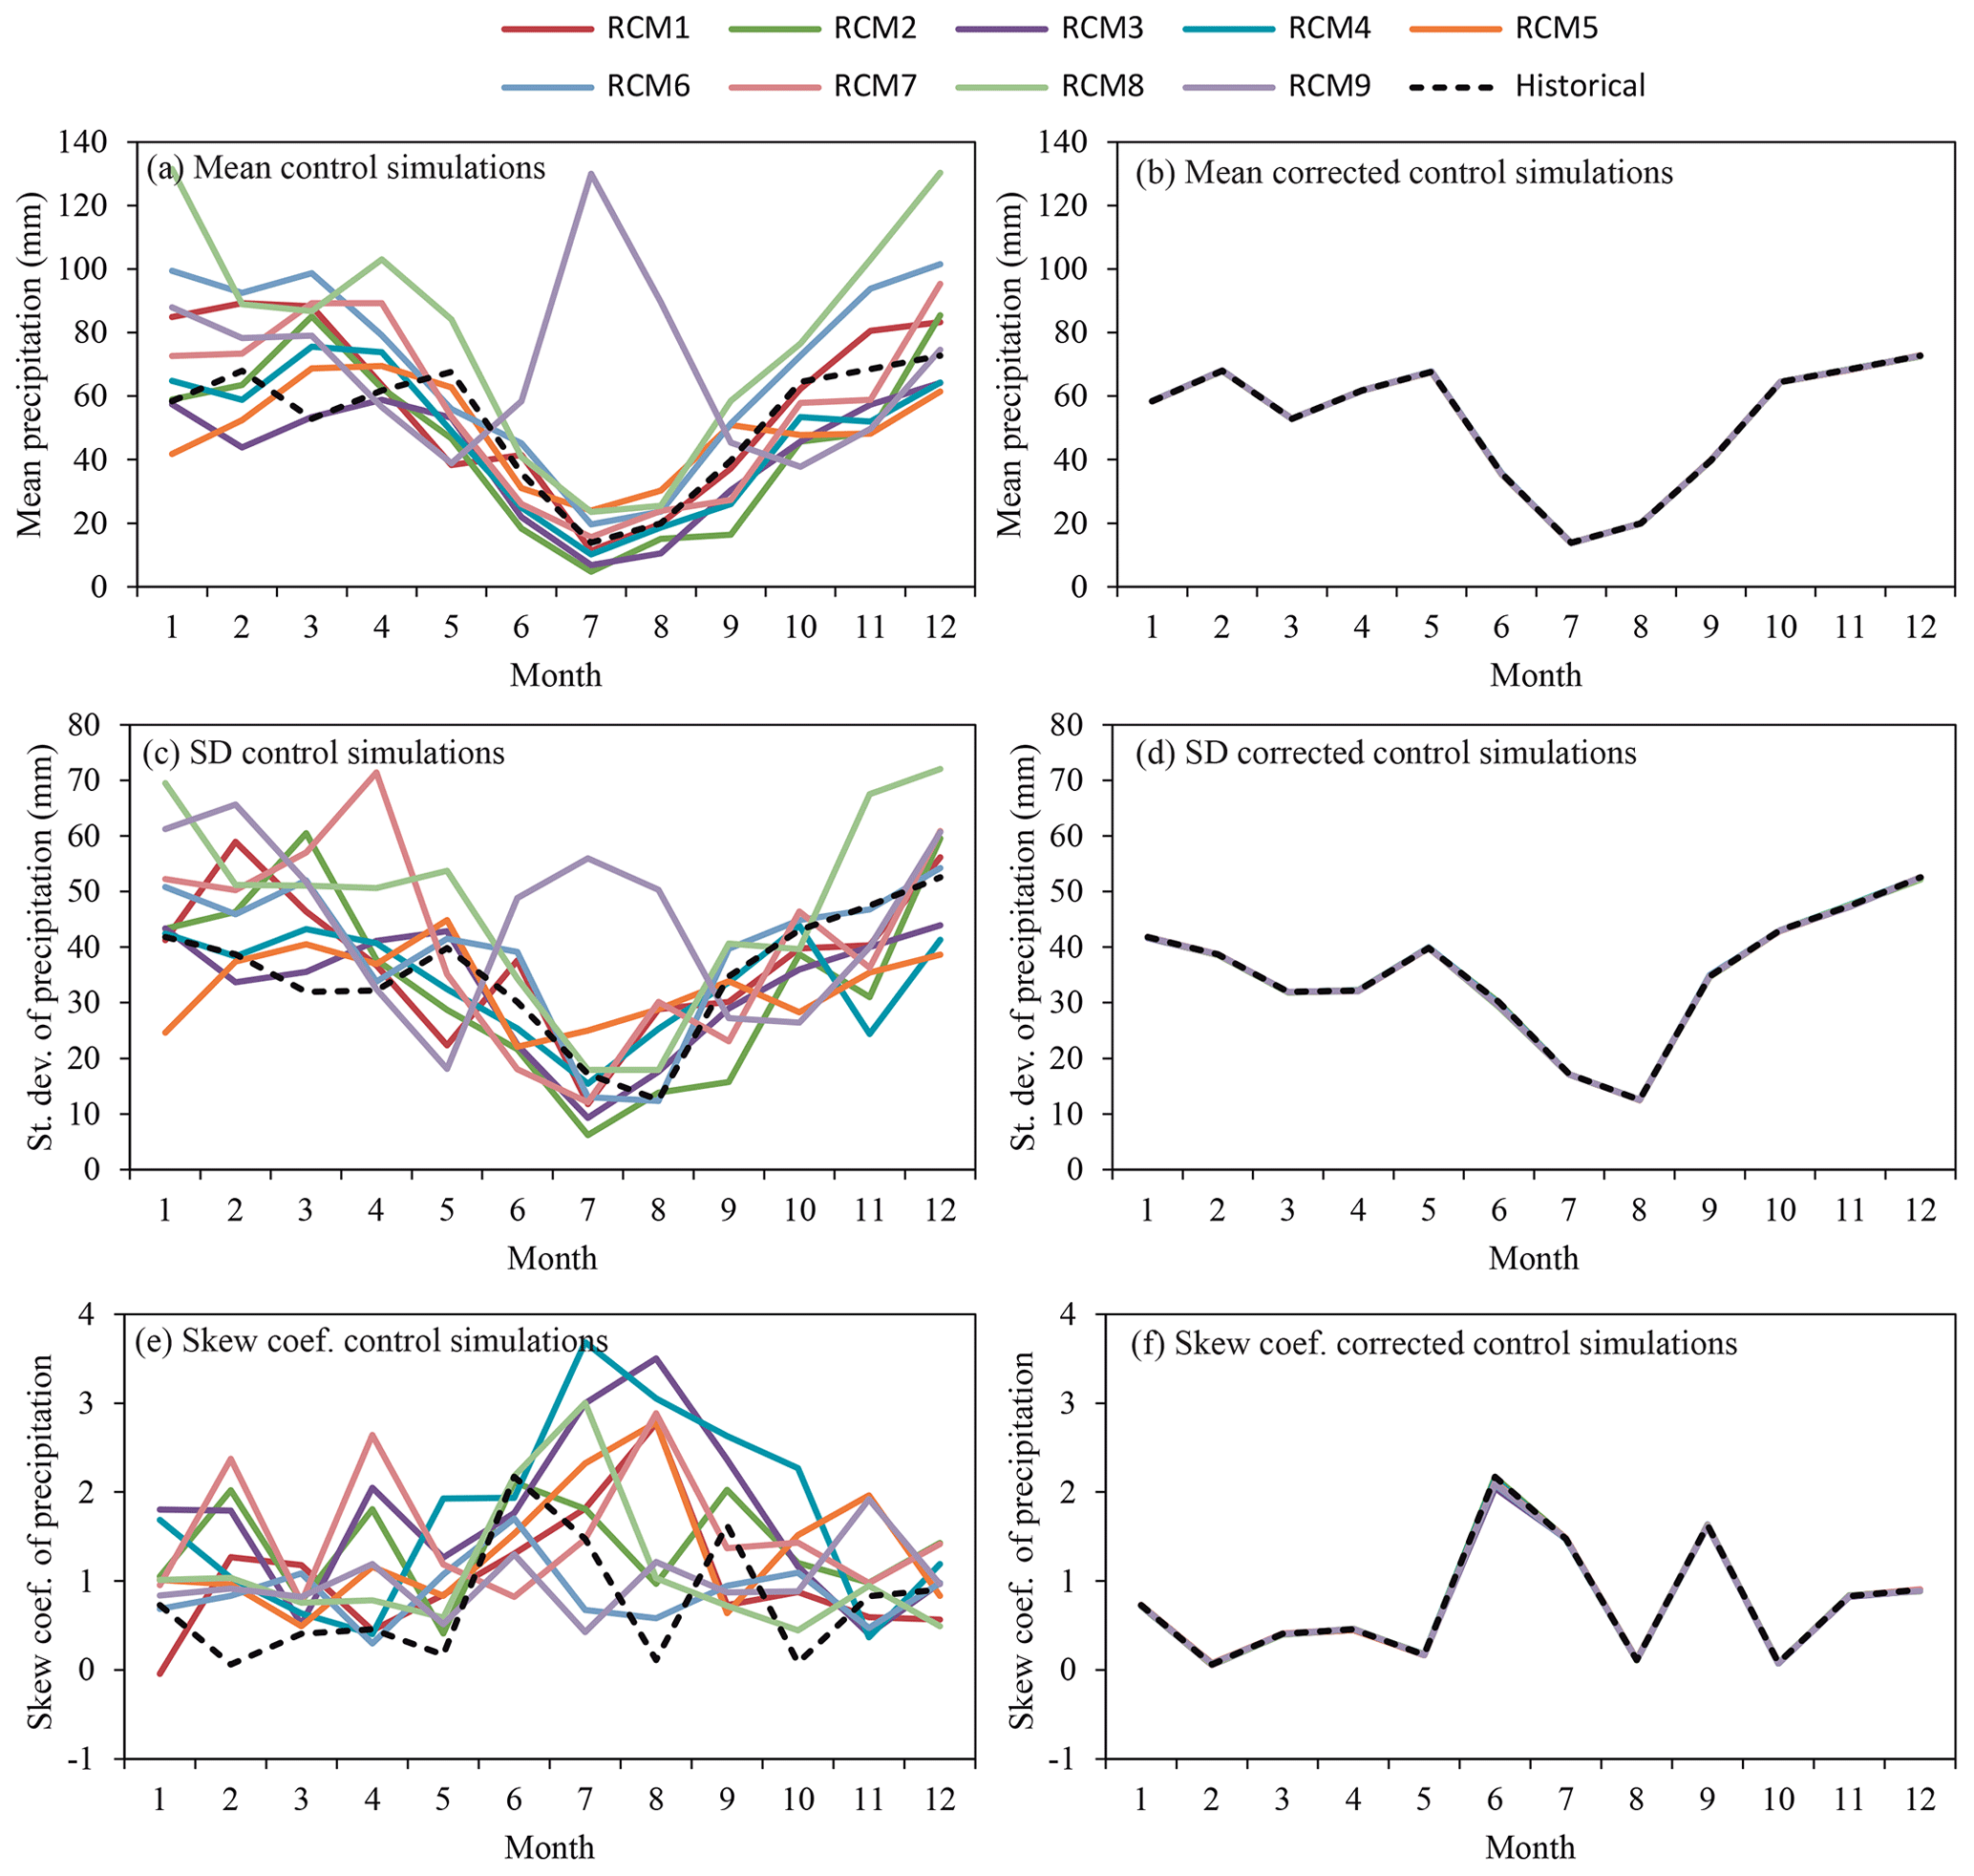
Figure 4Monthly mean, standard deviation and skew coefficient of precipitation within the mean year of the period (1972–2001) for the historical and control simulation series (a, c, e) and historical and corrected control simulation series (b, d, f).
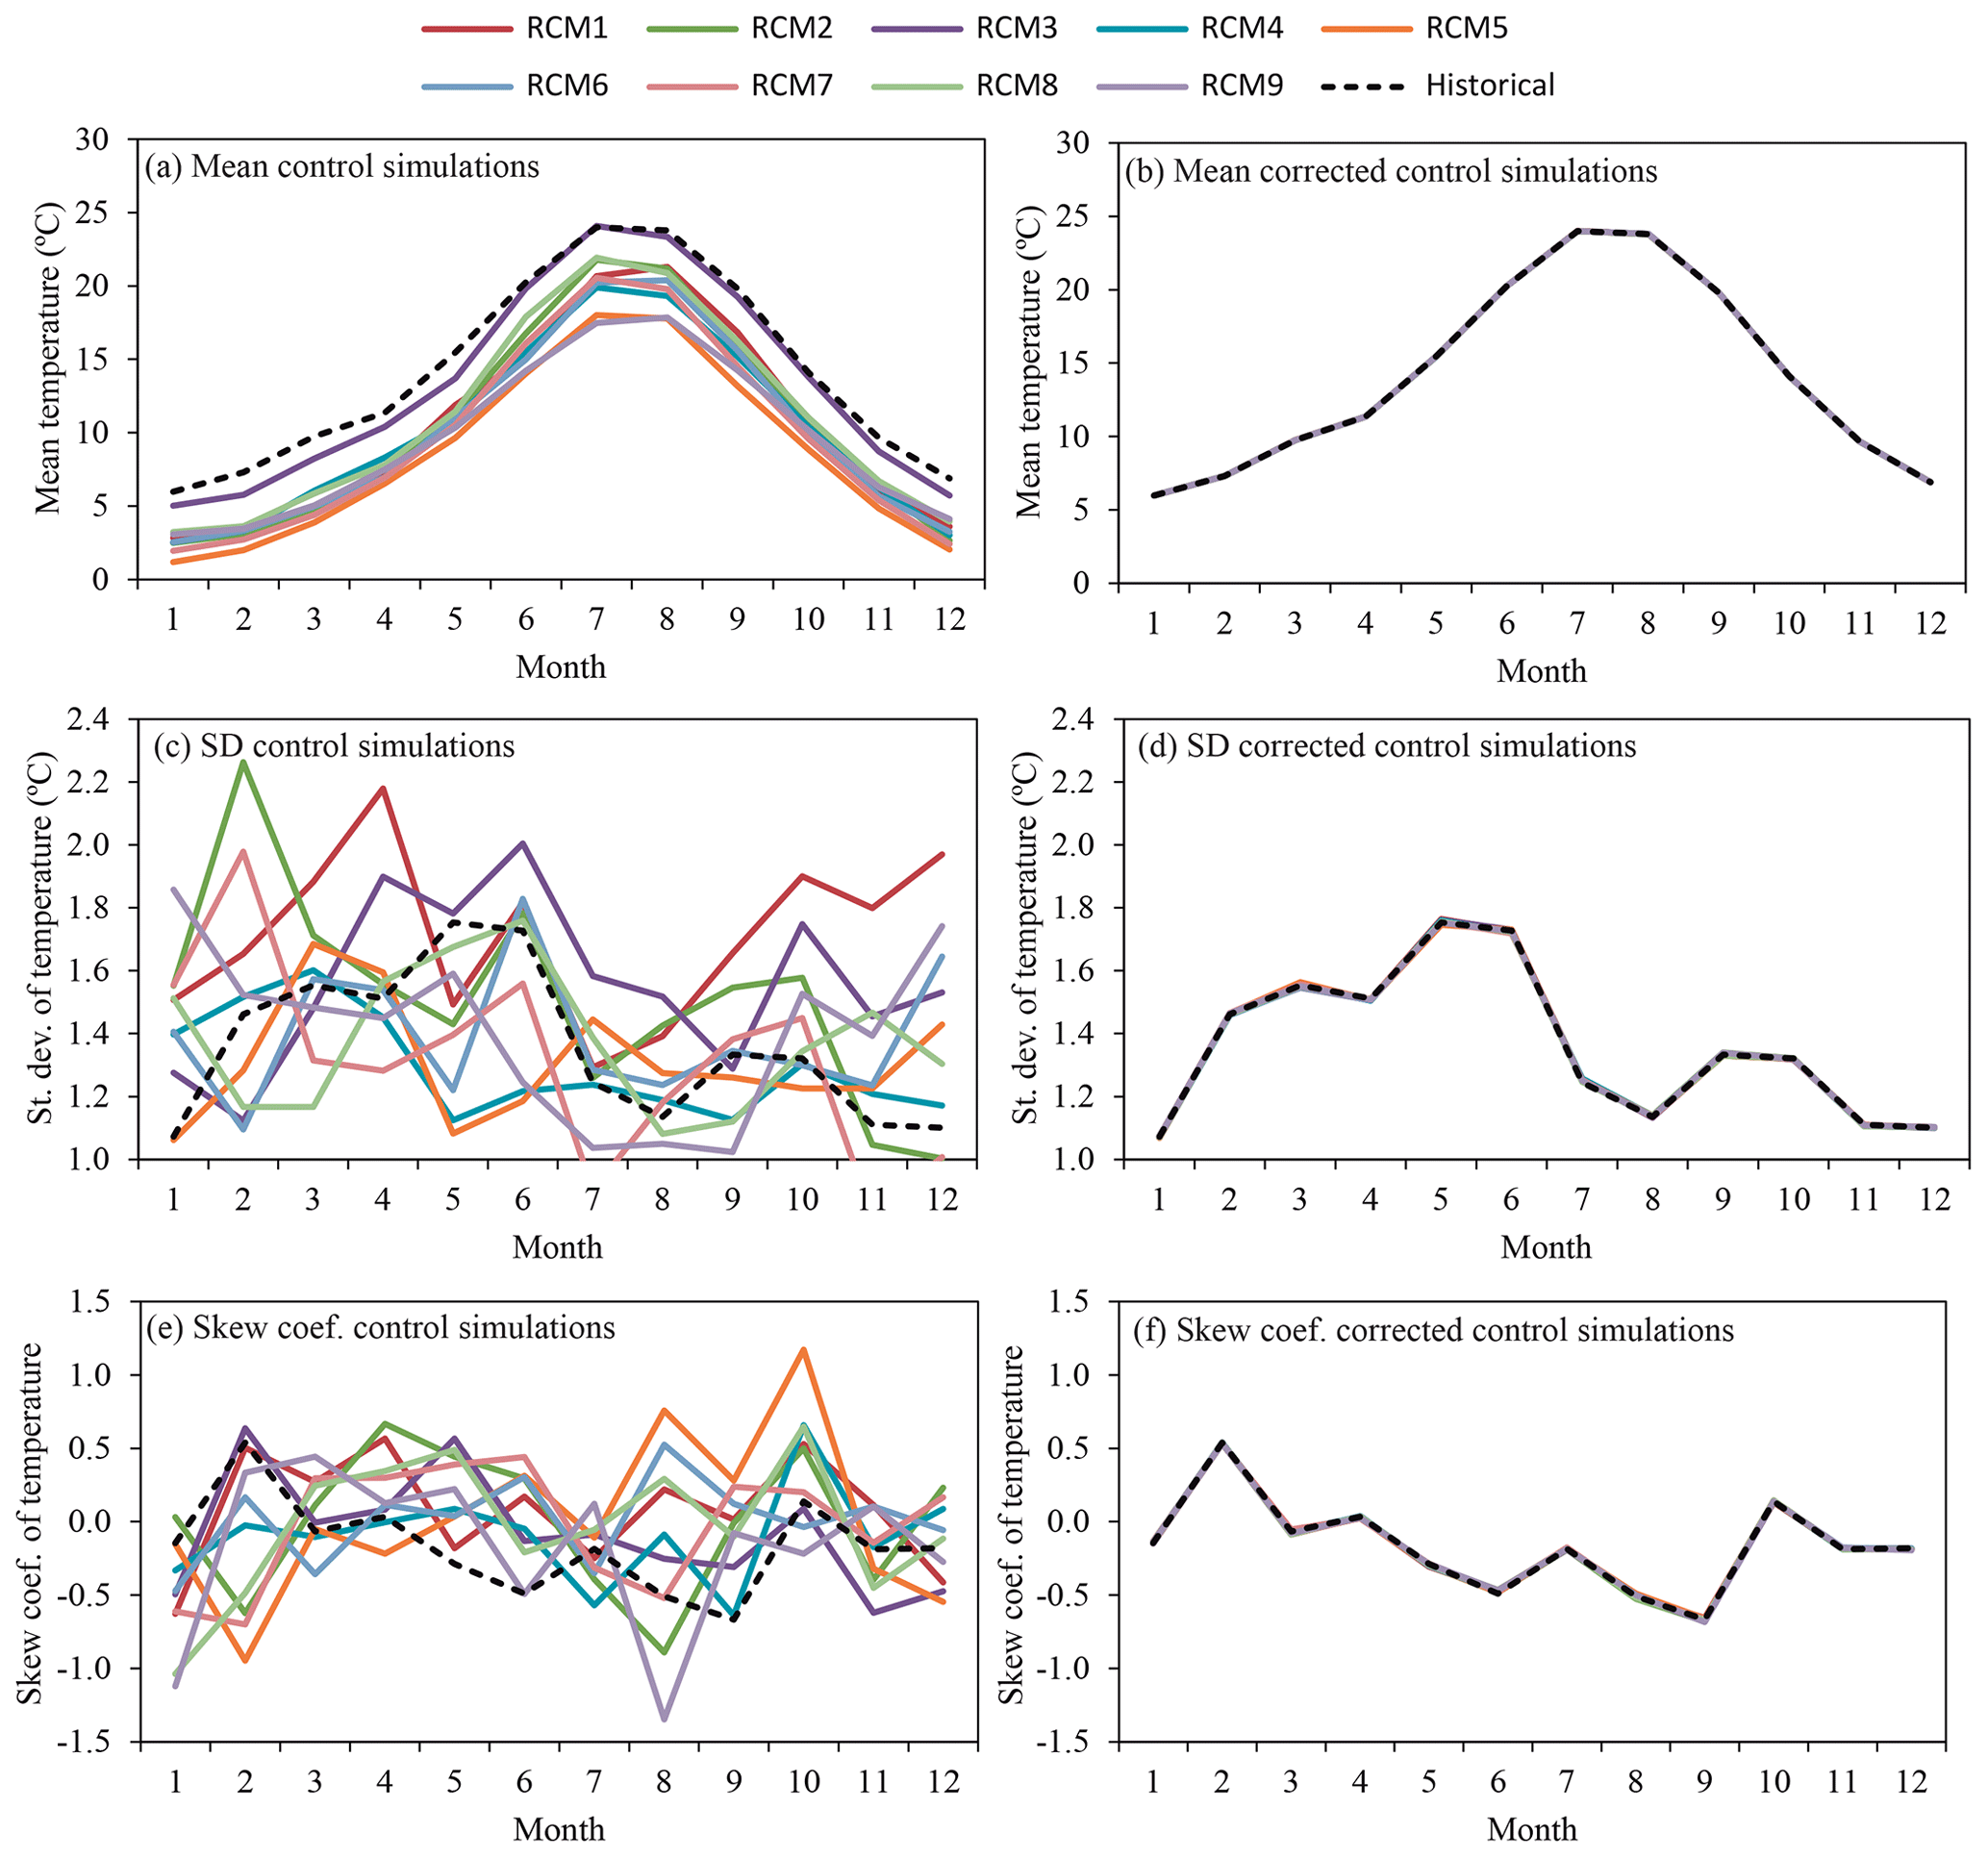
Figure 5Monthly mean temperature, standard deviation, and skew coefficient of temperature within the mean year of the period (1972–2001) for the historical and control simulation series (a, c, e) and historical and corrected control simulation series (b, d, f).
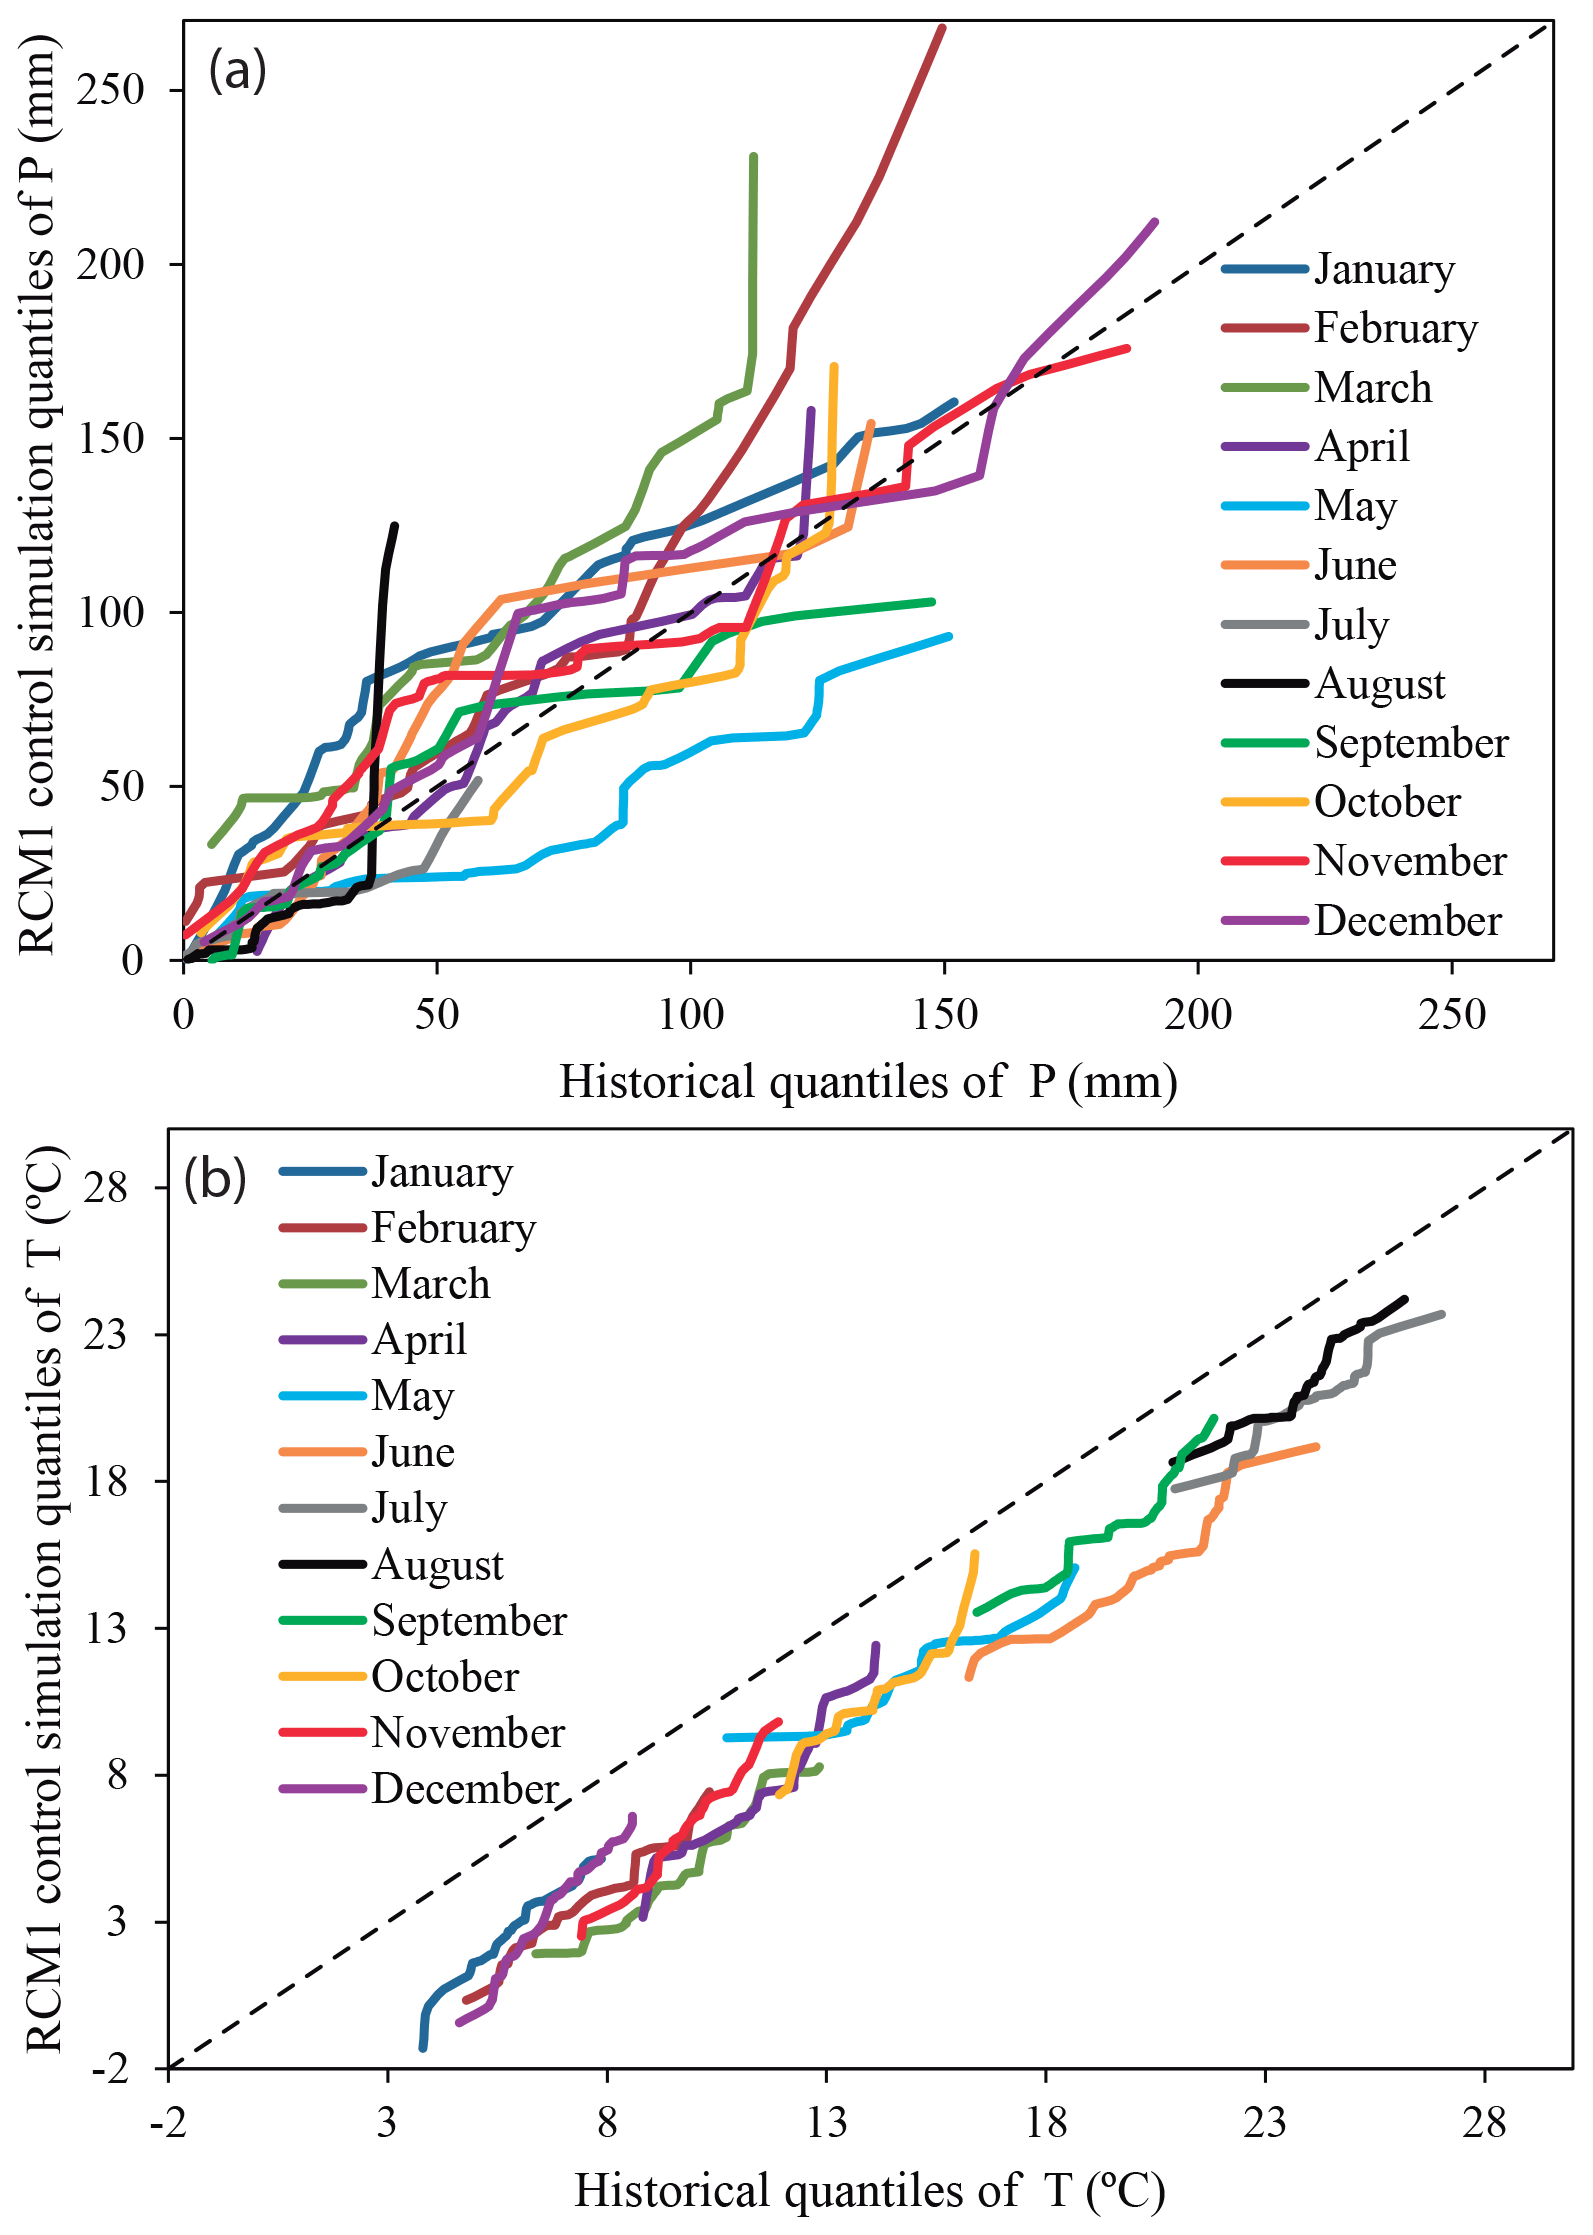
Figure 6Precipitation (a) and temperature (b) quantiles of the observed and control series of the RCM1 simulations for each month of the year in the reference period (1972–2001).
Table 2Mean annual values of precipitation and temperature for the historical and the RCM simulations (and corrected RCM simulations) in the reference period (1972–2001).

The same analysis of basic statistics was done for the streamflow (Fig. 7). The relative differences between the historical and the control simulations for the mean yearly streamflow (Fig. 7a) vary from −4.9 % for RCM5 and 125.5 % for RCM8. It also shows very large differences for the standard deviation (Fig. 7c) and the skew coefficient (Fig. 7e). The fit of the corrected control simulation series of streamflow to the historical series is not as good as for precipitation and temperature, but a remarkable improvement is observed. The reason could be that we are neglecting the inter-variable dependence of climate variables and not taking into account the dependence between precipitation and temperature when the bias correction is applied. Therefore, some differences might appear in the streamflow that depend on the combined interaction of the two variables. The relative differences for the mean streamflow in the case of the corrected control simulation (Fig. 7b) vary from −1.8 % for RCM2 and −4.6 % for RCM8. Similar improvements are observed for standard deviation (Fig. 7d) and skew coefficient (Fig. 7f).
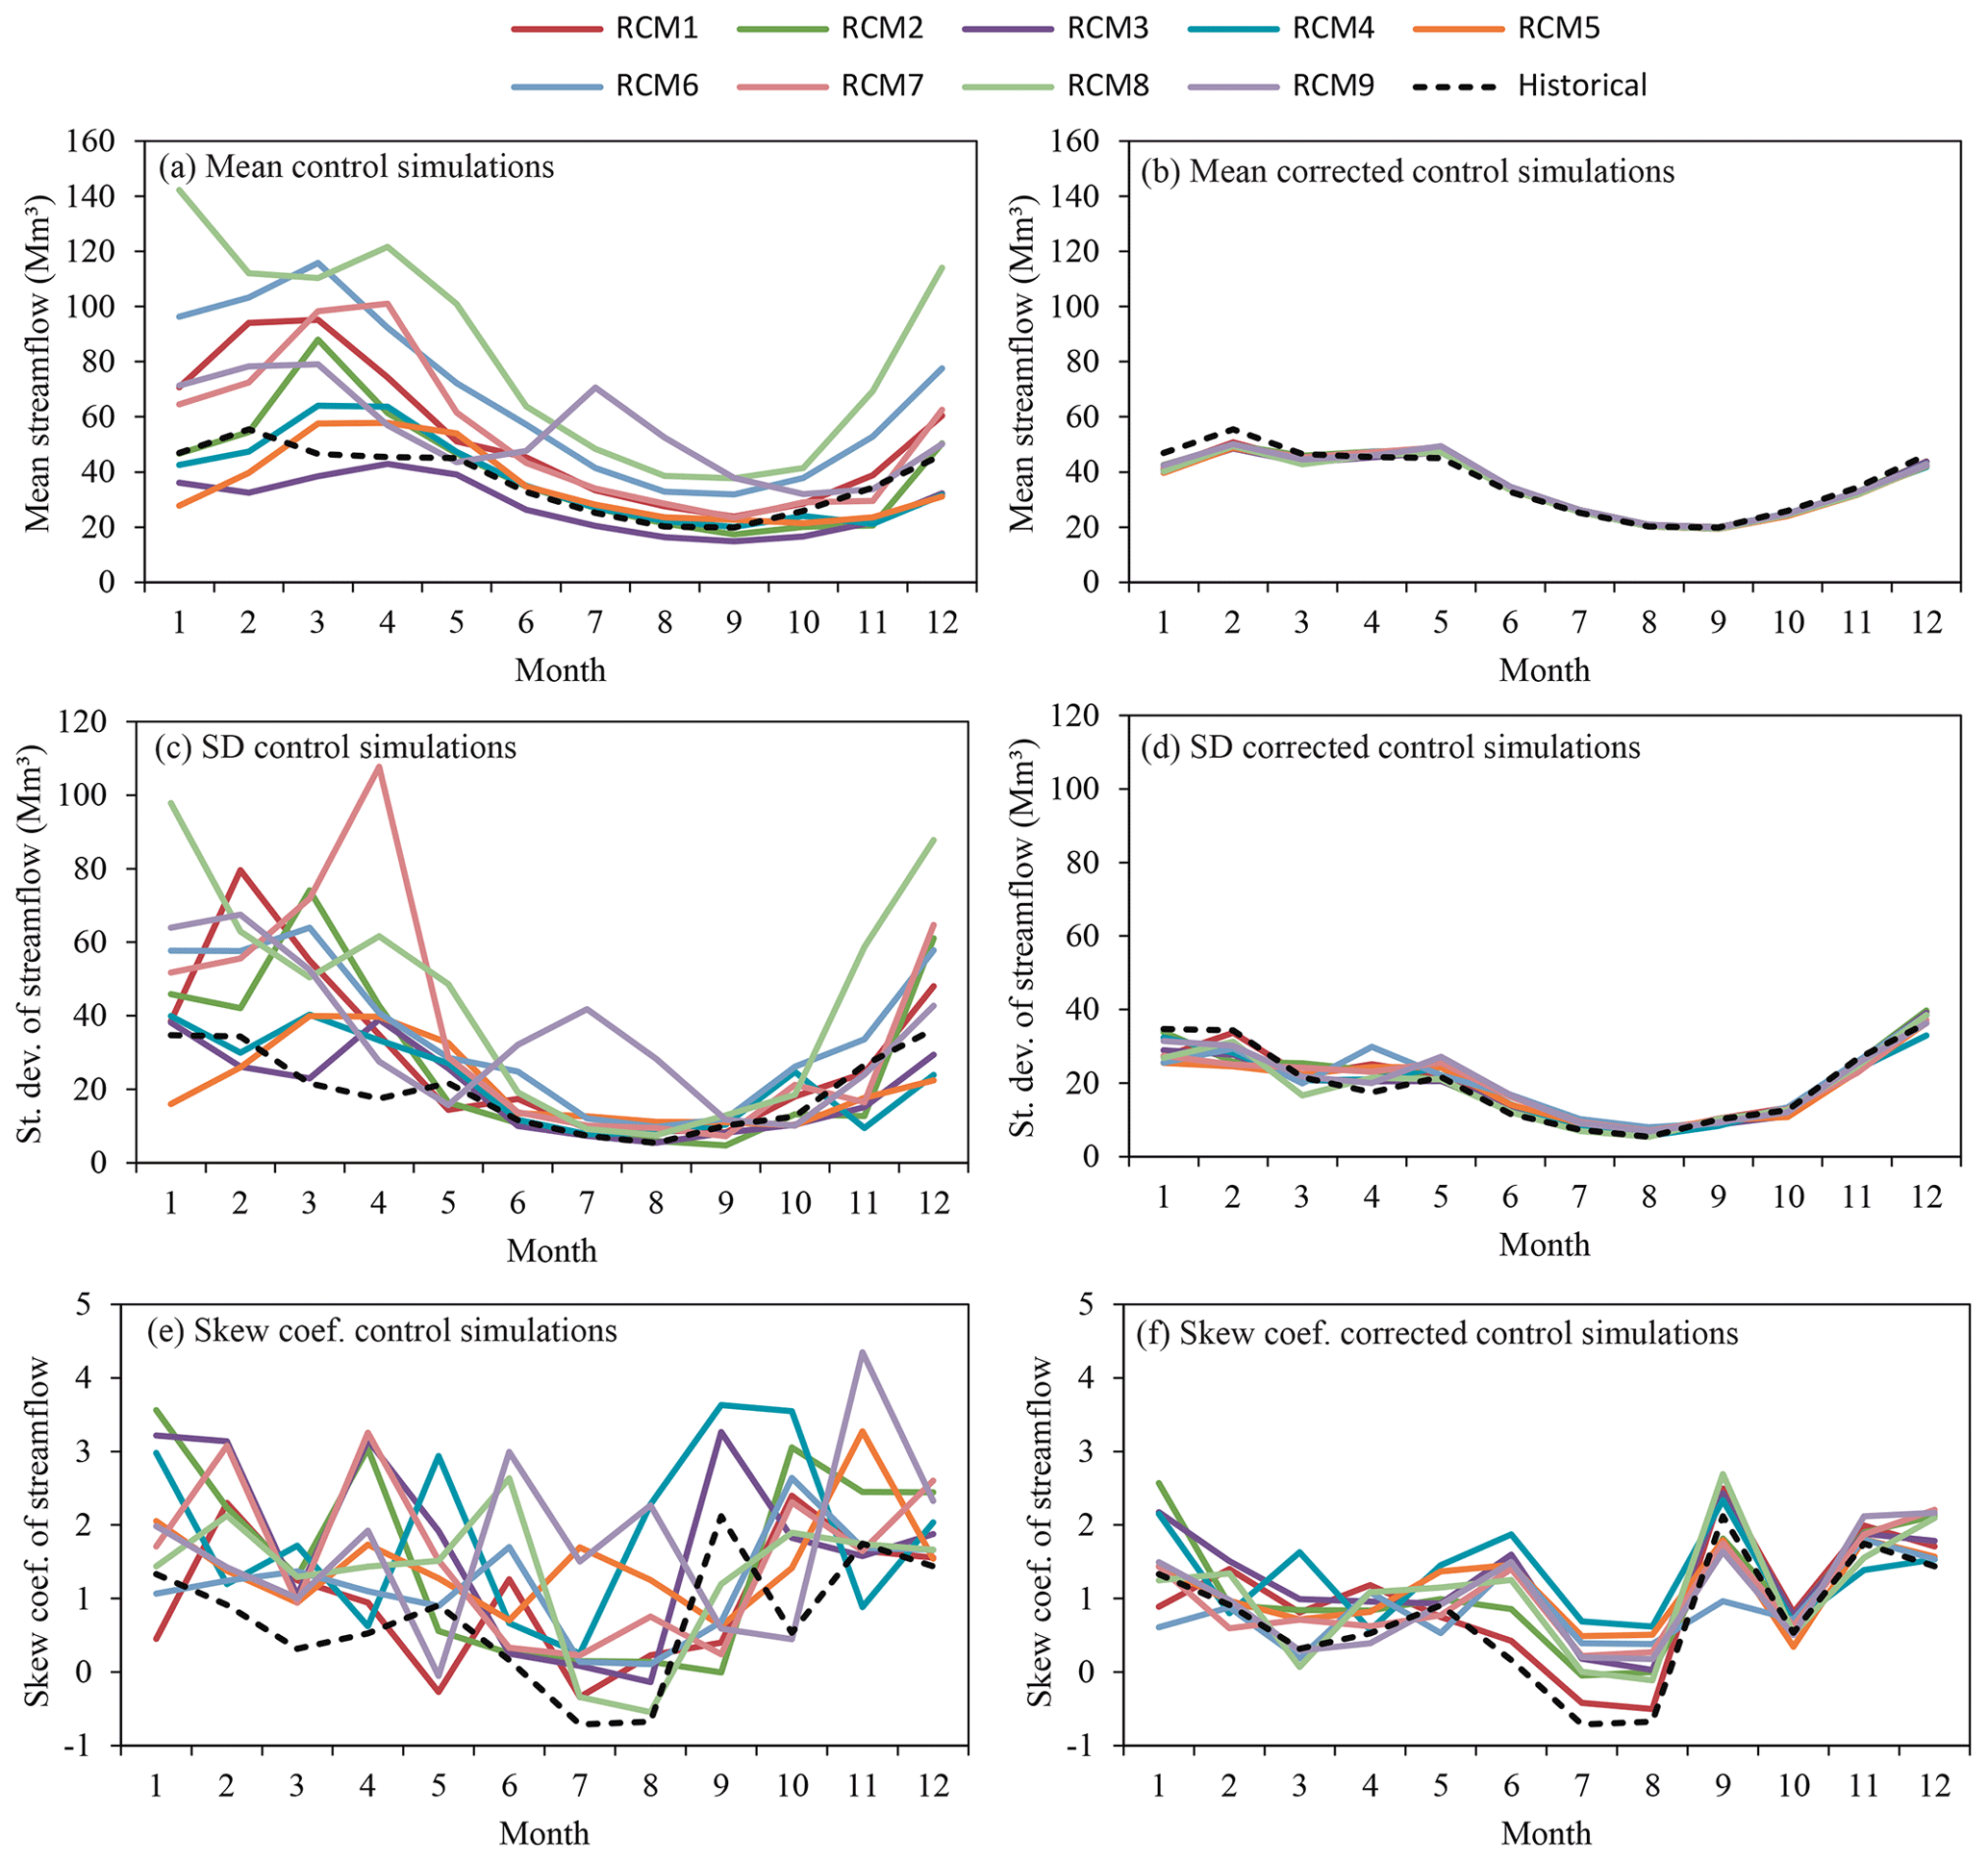
Figure 7Monthly mean, standard deviation and skew coefficient of streamflow within the mean year of the period (1972–2001) for the historical and control simulation series (a, c, e) and historical and corrected control simulation series (b, d, f).
In the case of the meteorological droughts (calculated from the SPI) the bias correction approach clearly improves the fit of the RCM simulation series to the historical series for the four considered statistics (frequency, duration, magnitude and intensity). Note the differences between the left-hand panel of Fig. 8 (control simulation and historical series) and the right-hand panel of Fig. 8 (corrected control simulation and historical series). For frequency the mean of SE for all the RCMs before the correction is 0.69 and after the correction it is 0.23. For duration, magnitude and intensity these values are respectively 0.51 versus 0.17, 0.88 versus 0.30 and 0.38 versus 0.13. In the same way, hydrological droughts were studied considering the SSI. Significant improvements are also observed for hydrological droughts (Fig. 9) after the bias correction procedure: frequency (mean SE of 0.63 versus 0.34), duration (mean SE of 0.50 versus 0.23), magnitude (mean SE of 0.83 versus 0.51), and intensity (mean SE of 0.48 versus 0.15). The left-hand panel represents the drought statistics of the historical and control series before the bias correction technique was applied and the right-hand panel after a bias correction approach.
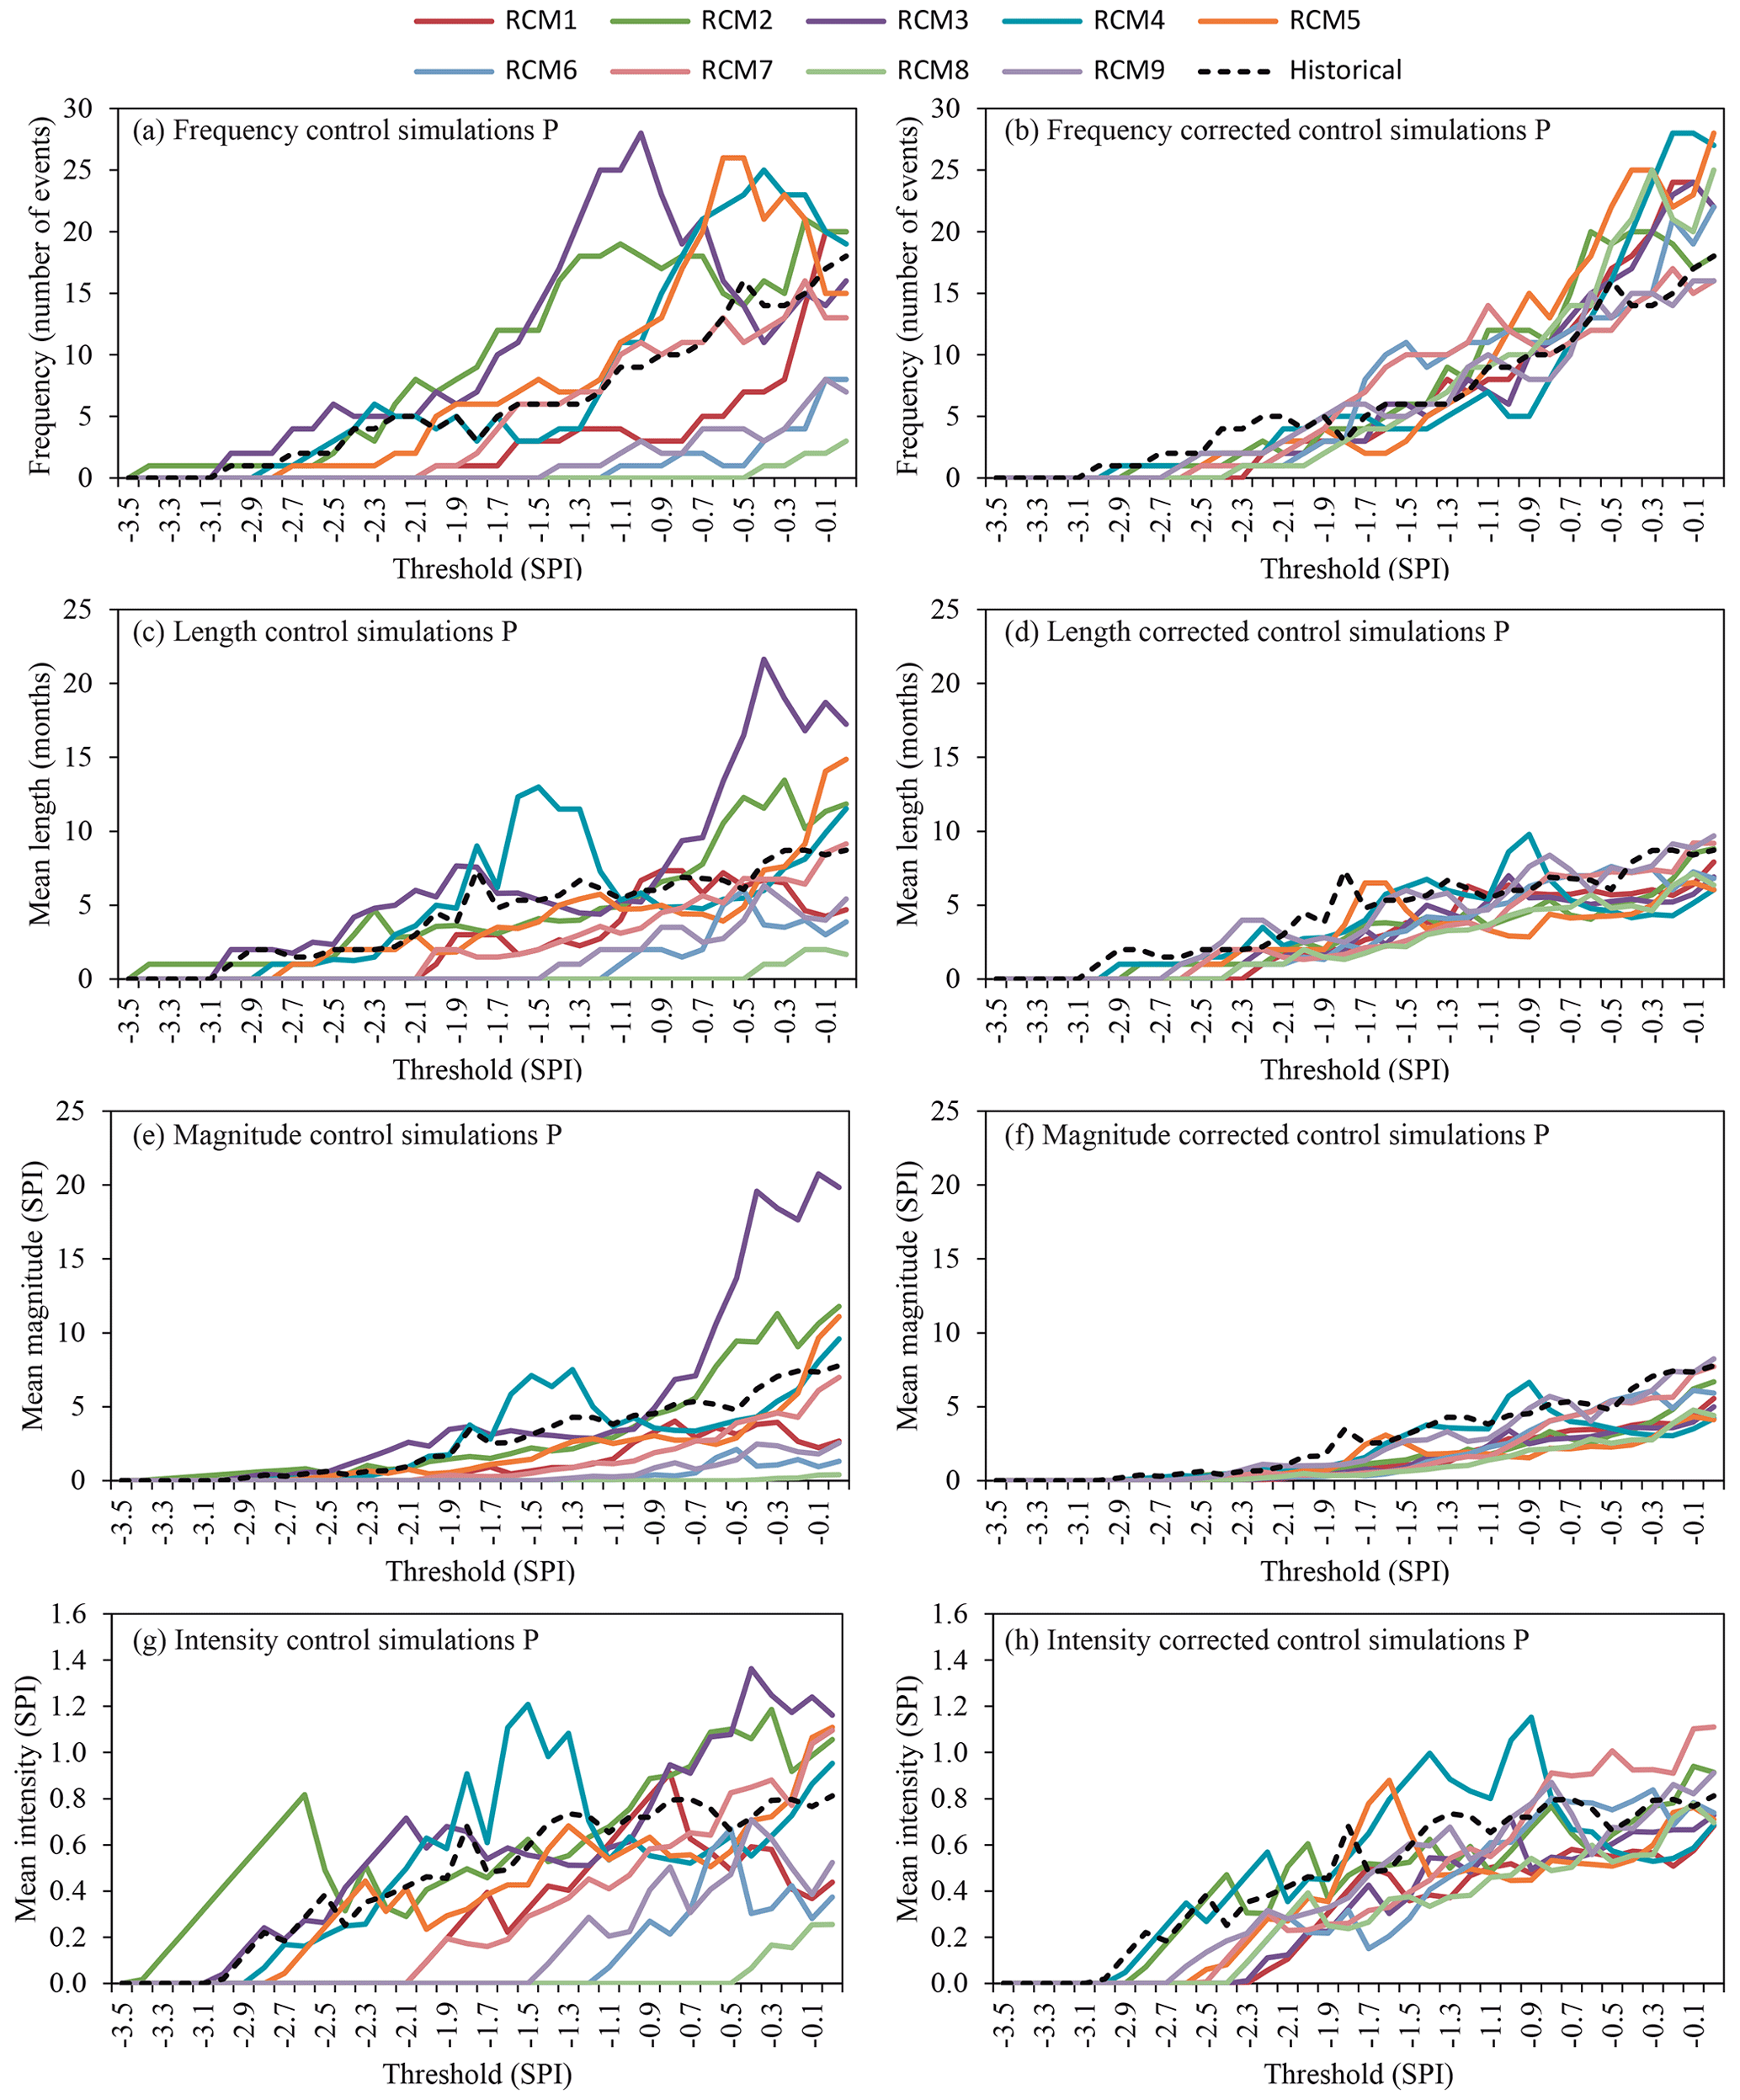
Figure 8Drought statistics (frequency, length, magnitude and intensity) of the period (1972–2001) for the historical and control simulation series (a, c, e, g) and historical and corrected control simulation series (b, d, f, h) for precipitation (meteorological droughts).
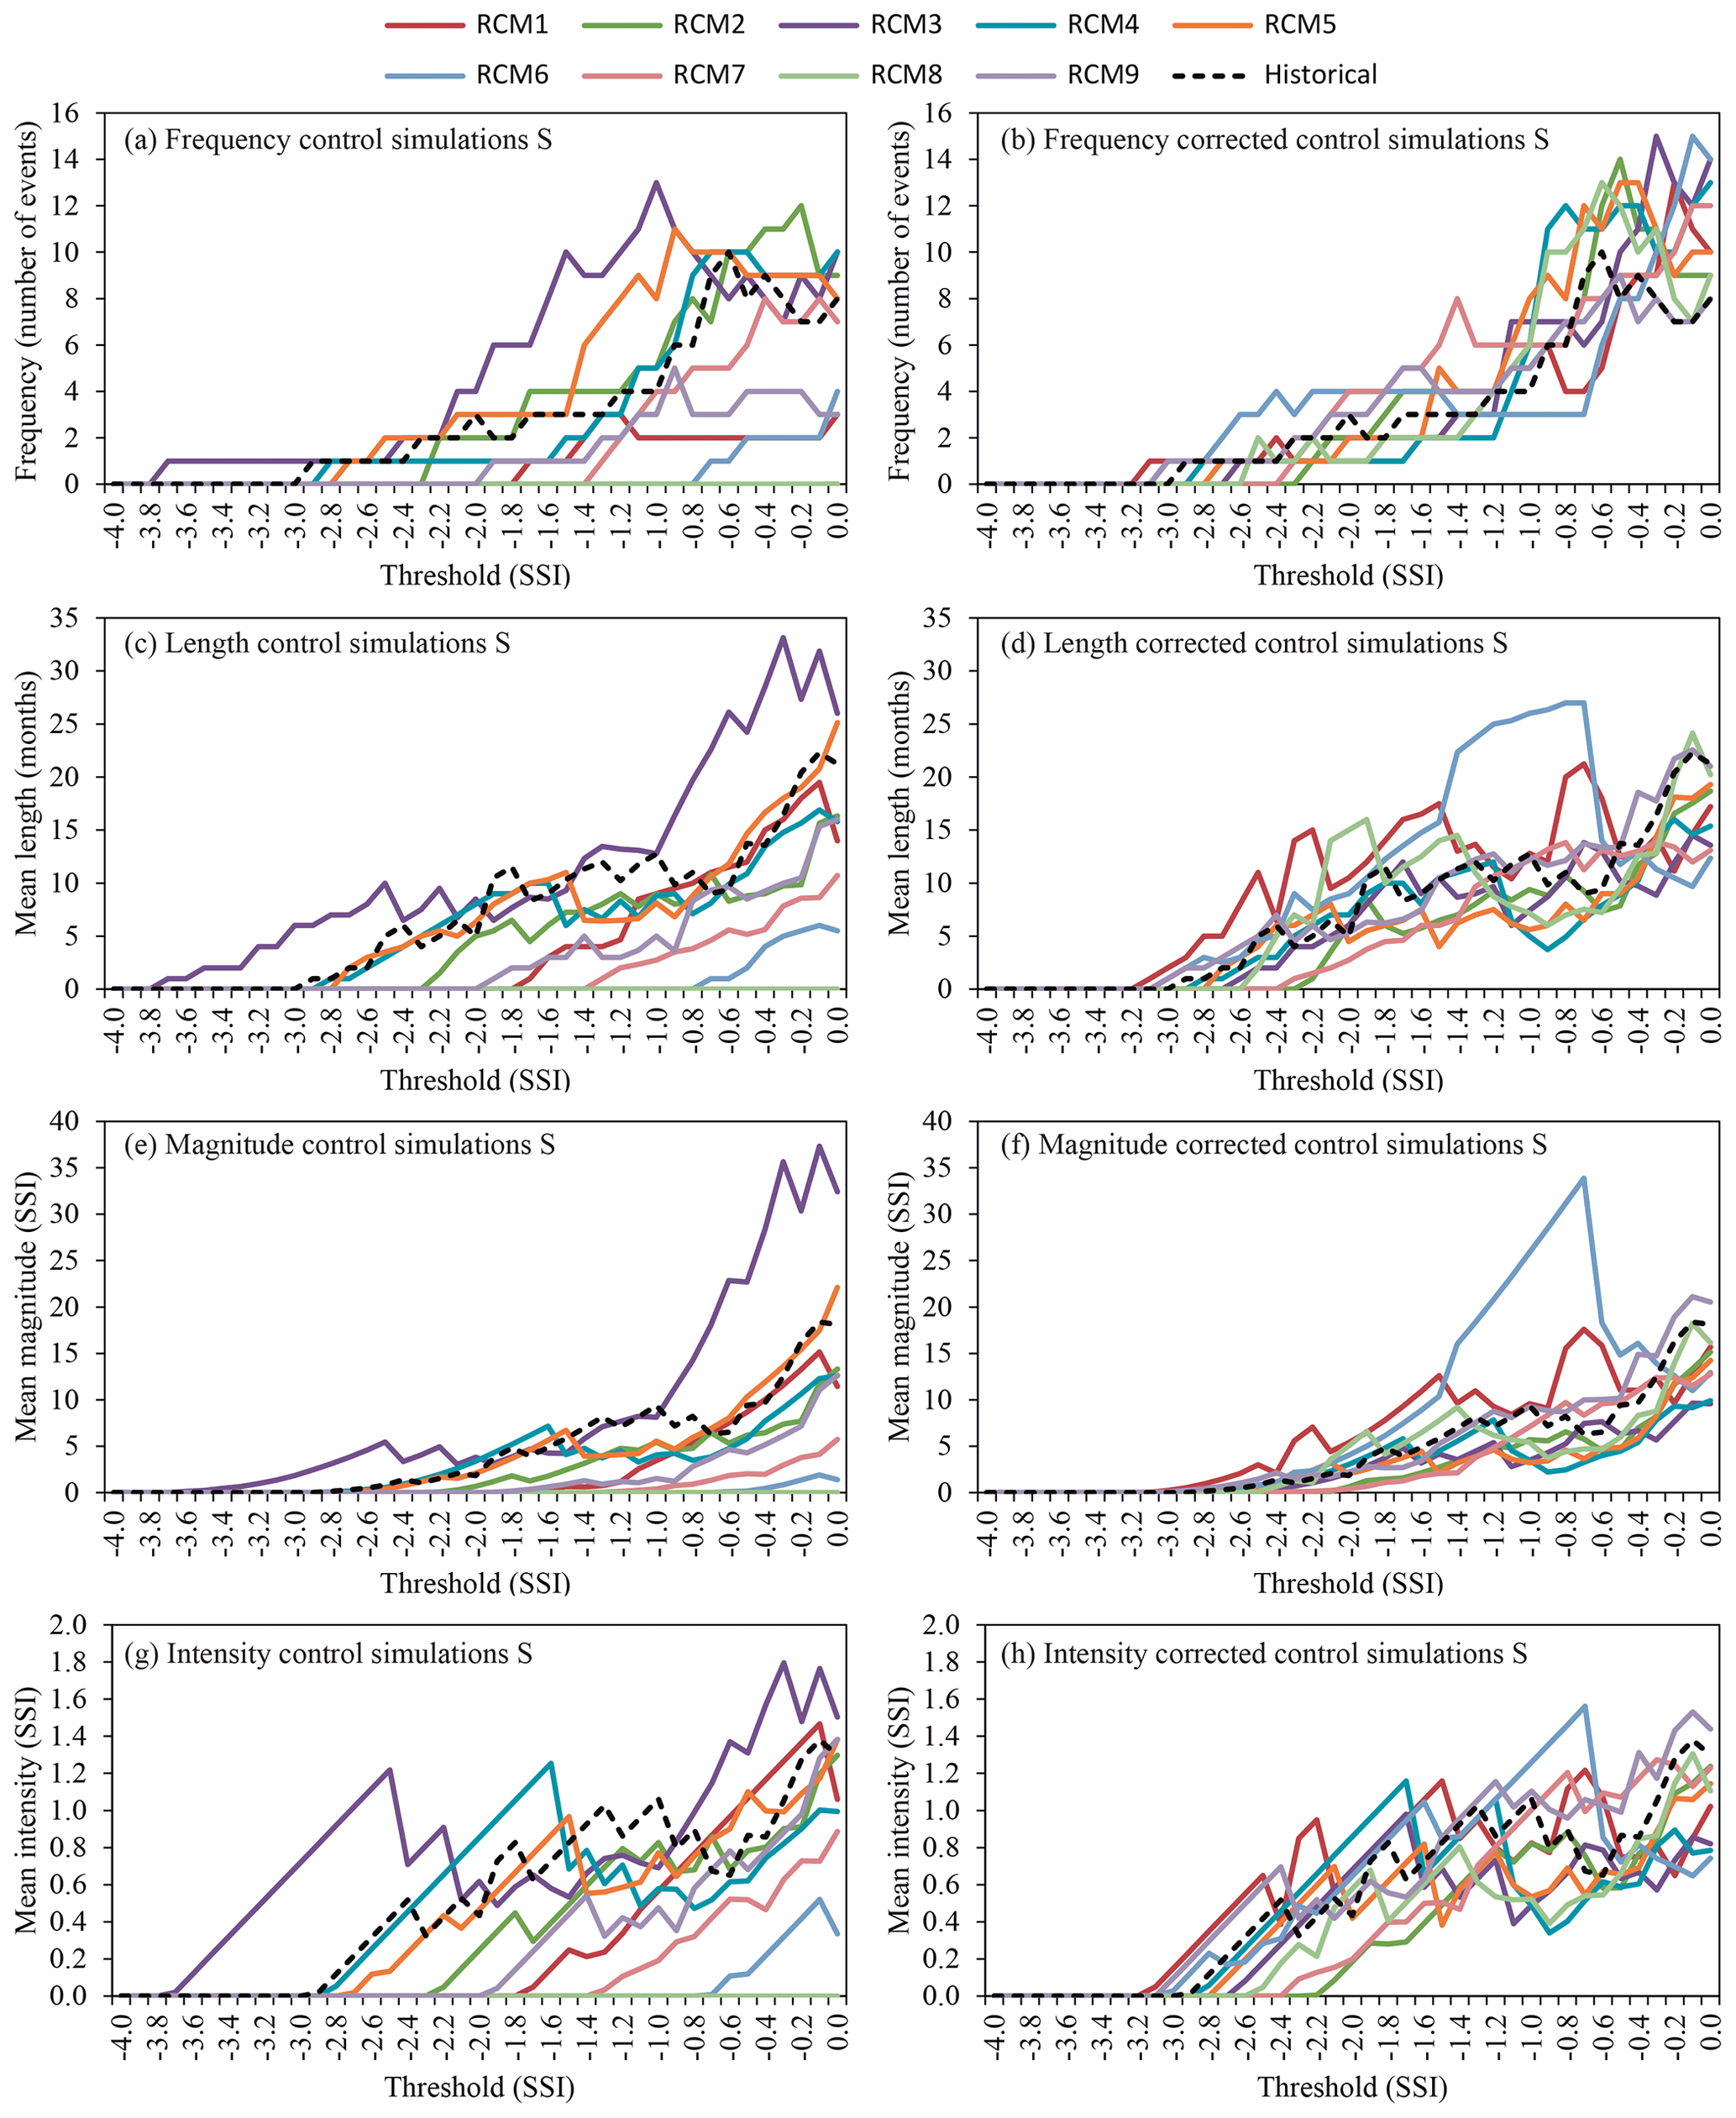
Figure 9Drought statistics (frequency, length, magnitude and intensity) of the period (1972–2001) for the historical and control simulation series (a, c, e, g) and the historical and corrected control simulation series (b, d, f, h) for streamflow (hydrological droughts).
4.3 Classification of RCMs
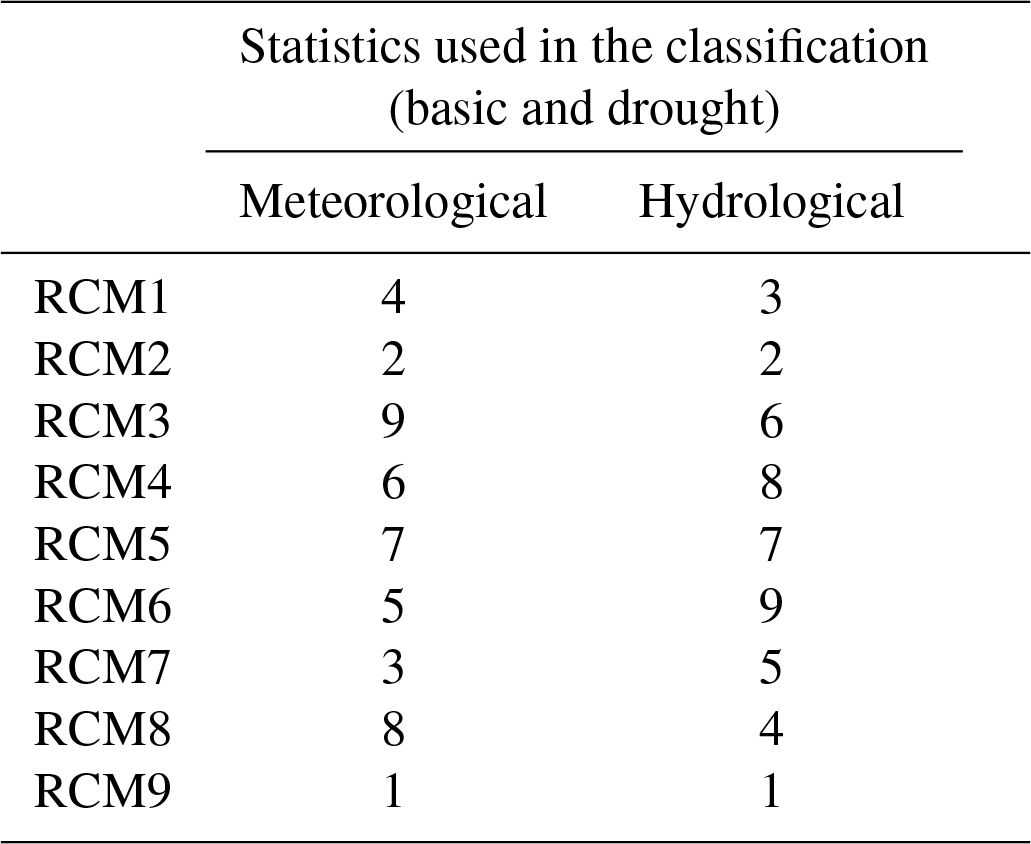
The classification of RCMs (after the bias correction of the simulations) is based on the approximation of the meteorological and hydrological statistics (basic and drought statistics) by applying the procedure described in Sect. 2.3 and is included in Table 3. The two best-corrected RCMs for meteorology (RCM2 and RCM9) are also the best models for hydrological assessment (maintaining the first and second position in both cases). Nevertheless, the third “best” model for meteorology is the fifth in hydrological assessment, the fourth in meteorology and the third in the hydrological assessment. Although they are still in the group of the best approaches, it demonstrates that there is not a cause–effect relationship; a better meteorological approximation does not always mean better hydrological assessments. We have only demonstrated that, in our case study, the RCMs that provide the best approximations of the meteorology also provide the best assessments of the hydrological impact.
Table 3Classification of corrected RCMs according to their reliability considering basic (mean, standard deviation and skew coefficient) and drought statistics (frequency, length, magnitude and intensity) for the meteorological and hydrological analyses. Lower numbers represent a higher reliability.
4.4 Corrected future local scenarios
The corrected RCM2 and RCM9, which are the best climate models for reproducing historical meteorology and hydrology, were used to generate local potential scenarios of precipitation and temperature. The rainfall-runoff model was used to propagate the impact of climate variables on streamflow. In order to compare the historical and the future scenarios basic and drought statistics were analysed for the horizon 2071–2100. The considered RCMs predict significant reductions of mean precipitation (−31.6 % and −44.0 % for RCM2 and RCM9, respectively) and an increase in mean temperature (26.0 % and 32.2 % for RCM2 and RCM9, respectively) (see Fig. 10a and b respectively). The average change in monthly standard deviation of precipitation is −6.2 % and −32.3 % for RCM2 and RCM9, respectively. In the case of temperature these changes are 23.9 % and 4.8 %. Both RCMs predict a decrease in the standard deviation in precipitation and an increase in the standard deviation of temperature in the future (see Fig. 10c and d, respectively). However, the expected values of the changes are significantly different. Both RCMs also predict significantly different changes in the skew coefficient of series (Fig. 10e and f). With respect to the hydrology analysis, both RCMs predict significant decreases in mean streamflow (−43.5 % and −57.2 % for RCM2 and RCM9, respectively) (Fig. 11a). In the case of the standard deviation, the RCMs predict a reduction (Fig. 11b). The average change in monthly standard deviation is −26.2 % and −57.5 % for RCM2 and RCM9, respectively. In the case of the skew coefficient both RCMs show an increment with respect to the historical scenario (Fig. 11c). We also analysed the coefficient of variation (ratio of the standard deviation to the mean) of historical and future series of precipitation, temperature and streamflow (Table 4). Both RCMs predict an increase in the precipitation and streamflow variability, and a reduction in temperature variability. This increment in precipitation variability is also described in other climate change impact studies (Pendergrass et al., 2017; Polade et al., 2017).
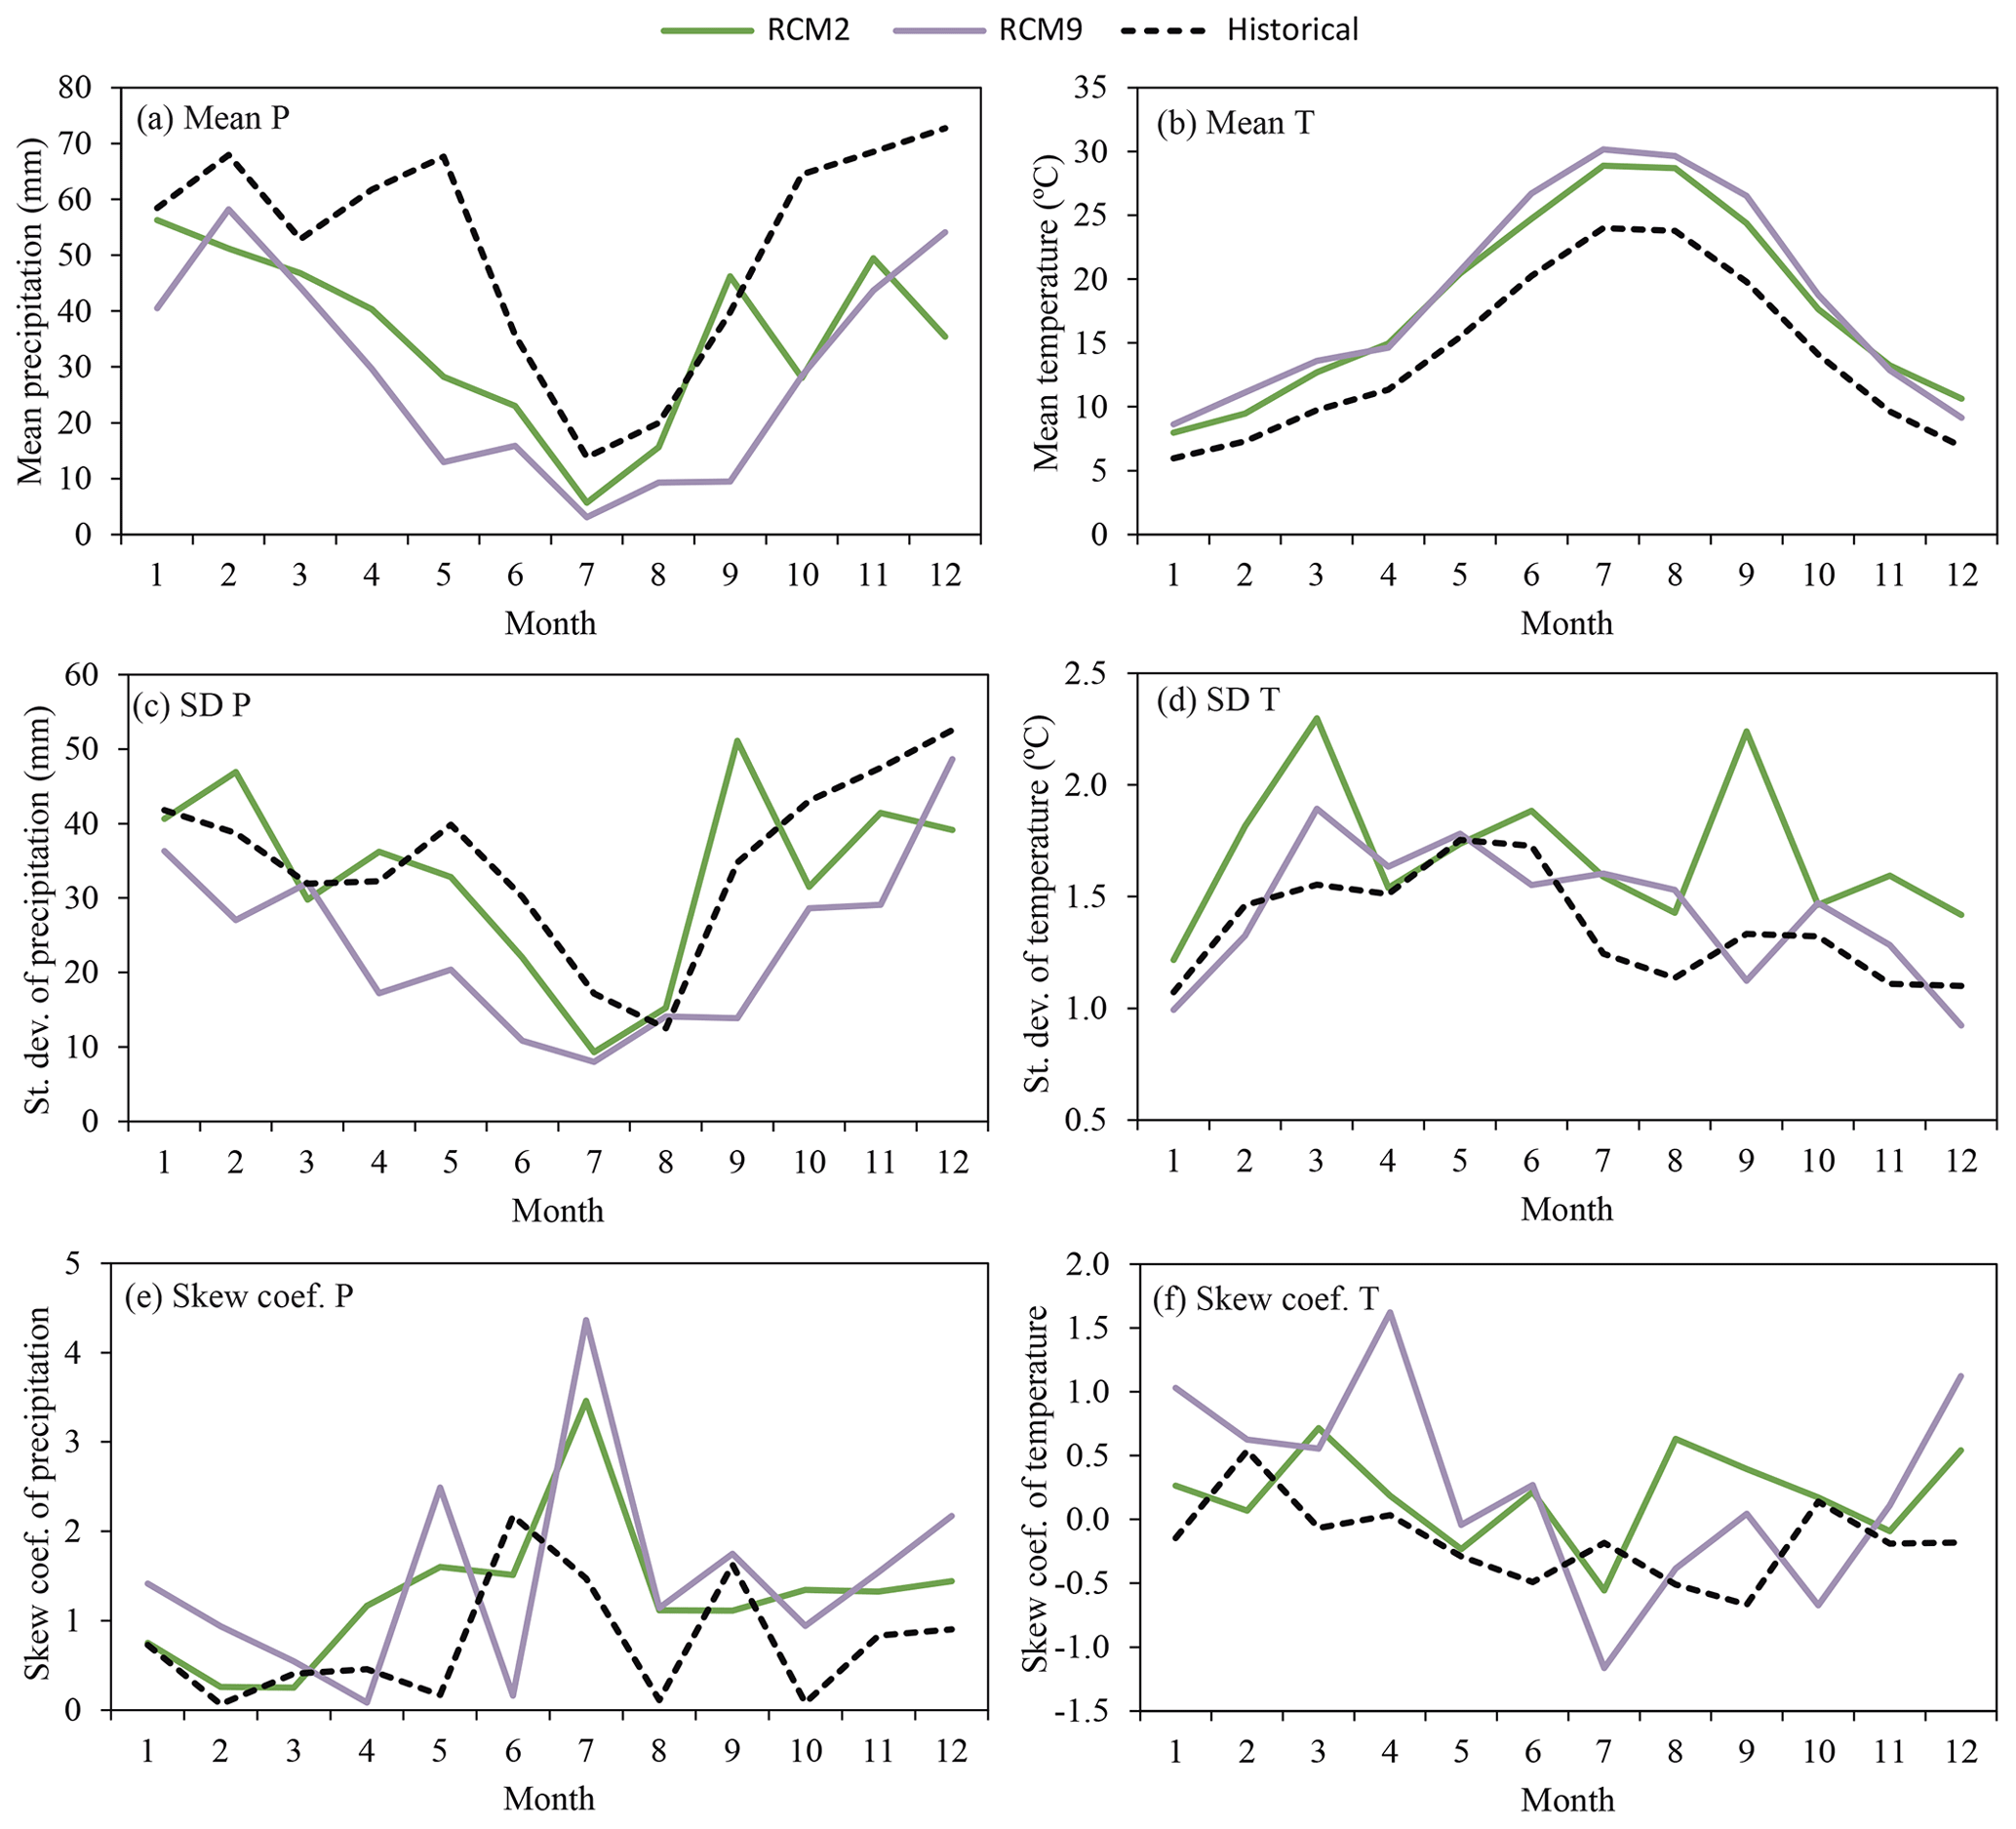
Figure 10Monthly mean, standard deviation and skew coefficient within the mean year of the historical period (1972–2002) and future horizon (2071–2100) series (RCM2 and 9) for precipitation (a, c, e) and temperature (b, d, f).

Figure 11Monthly mean (a), standard deviation (b) and skew coefficient (c) within the mean year of the historical period (1972–2002) and future horizon (2071–2100) series (RCM2 and RCM9) for streamflow.
Table 4Coefficient of variation of the historical and future series of precipitation, temperature and streamflow generated from RCM2 and RCM9.

Significant changes are also expected for droughts. In the case of the meteorological droughts the first SPI threshold for which drought periods are detected in the historical scenario is −3.0. In the future scenarios this value is −5.2 and −4.6 for RCM2 and RCM9, respectively (Fig. 12). In order to perform an appropriate analysis of the future droughts with respect to the historical, the future SPI calculation was estimated by using the parameters of the gamma distribution obtained in the historical period (Collados-Lara et al., 2018). If the parameters of the gamma distribution were adjusted to the future series of values, the changes in the parameters would be significant. For RCM2 we would obtain α=19.9 and β=2.6 (instead of the historical values α=16.1 and β=3.2) and for RCM9 α=19.0 and β=2.7 (instead of the historical values α=16.1 and β=3.2). The maximum frequency of meteorological droughts in the historical period is obtained for the SPI threshold of 0 whereas in the case of the future scenarios this is obtained for −1.1 and −1.9 for the RCM2 and RCM9, respectively. For the threshold of −1.7 of SPI (considered to define extreme droughts in the Droughts Plan of the Segura River basin authority) in the historical period five drought events are detected with a mean length of 4.8 months. The mean magnitude and intensity of these events are 2.53 and 0.48 SPI. In the case of the RCM2 future scenario 20 drought events are detected with a mean length, magnitude and intensity of 7.4 months, 6.56 and 1.00 SPI. The case of the future scenario of RCM9 is even more worrying, with 22 extreme drought events that have a mean length, magnitude and intensity of 10.5 months, 9.62 and 0.94 SPI, respectively.

Figure 12Drought statistics – (a) frequency, (b) length, (c) magnitude, (d) intensity – of the historical period (1972–2002) and future horizon (2071–2100) series (RCM2 and RCM9) for precipitation (meteorological droughts).
In the case of the hydrological droughts the first SSI threshold in which we detected droughts is −2.9 (similar to the meteorological droughts). In the future scenarios this value is −3.9 and −4.2 for RCM2 and RCM9, respectively (Fig. 13). For the SSI threshold −1.7 significant changes are expected for both RCMs with respect to the historical period: frequency (from 3 to 11 and 8 events), length (8.3 to 15.4 and 29.6 months), magnitude (from 3.98 to 11.84 and 31.72 SSI) and intensity (0.63 to 0.90 and 1.52 SSI). Note that in the case of the hydrological droughts the minimum SSI in the future scenario is obtained for RCM9 and in the case of the meteorological droughts the minimum SPI is obtained for RCM2. However, in both cases (meteorological and hydrological) the RCM9 shows a higher impact on the mean length, magnitude and intensity of the drought events.

Figure 13Drought statistics – (a) frequency, (b) length, (c) magnitude, (d) intensity – of the historical period (1972–2002) and future horizon (2071–2100) series (RCM2 and 9) for streamflow (hydrological droughts).
The selected RCM simulations cannot be used directly for the case studied owing to the detected biases. The relative differences vary in the range −5.6 % to 52.8 % for precipitation and −6.2 % to −39.4 % for temperature. It is accepted in the scientific community that RCMs must be corrected to adapt them to the local climate conditions (Teutschbein and Seibert, 2012).
In this study we have used quantile mapping based on the empirical quantile technique to perform the bias correction of the RCMs. A previous comparative analysis of different correction techniques (first moment correction, first and second moment correction, regression, and quantile mapping using distribution and empirical quantiles) demonstrated the higher accuracy of the empirical quantile mapping (Collados-Lara et al., 2018). This technique provides very good results for correcting basic statistics (mean, standard deviation and skew coefficient) as we have confirmed in this study. However, some authors argue that using simple techniques such as linear scaling is sufficient for hydrological analysis at a monthly resolution (Shrestha et al., 2017). Other authors assumed that a first and second moment correction is sufficient for hydrological applications (Collados-Lara et al., 2019). This topic is still open to discussion in the scientific community and authors are even developing and testing new techniques – e.g. TIN-Copula; Lazoglou et al., 2020, Markov chains; Liu et al., 2020).
Another aspect brought up in this paper in the generation of local future scenarios is the selection of the RCMs. In this study we have proposed a method of classifying the RCM simulations based on basic and drought statistics of the corrected series. Collados-Lara et al. (2018) proposed a multi-criteria analysis to rule out the worse approximations. In this paper our aim has been to classify all the corrected RCM simulations according to their capacity to reproduce the historical statistics. On the other hand, the proposed method also considers hydrological statistics, including droughts. We have shown in a case study that the corrected RCM simulations that provide the best approximations of the meteorological statistics also provide the best approximations for hydrology.
Finally, we have also shown that the best corrected RCMs for reproducing the climate and hydrological conditions in the reference period may provide significant differences in the assessment of the impact of future climate change, owing to the high uncertainty related to the RCM simulations of future potential scenarios (Sørland et al., 2018). Depending on the case study, the proposed analyses and classification (based on the reference period) can be used to identify the more reliable individual projections for the future period. It will allow us to define sets of selected individual projections to take into account future impact uncertainty by considering the most “reliable” corrected RCMs (Pardo-Igúzquiza et al., 2019). It also allows us to define an ensemble of scenarios defined by the selected corrected RCM simulations, which could produce more robust climate scenarios than those based on single projections (Fowler et al., 2007).
5.1 Assumed hypotheses, limitations and future research
Although we have demonstrated the utility of the proposed approach to assess the future impact on meteorological and hydrological droughts, we want to highlight some assumed hypotheses and limitations and to identify potential future research aligned with this study:
-
We have used a bias correction method based on the assumption of bias stationarity of climate model outputs. However, this assumption may not be valid for studying some problems owing to the significance of the influence of climate variability on them. Other approaches should be explored to take into account the non-stationarity bias of RCM simulations (e.g. Hui et al., 2020).
-
We have applied the same bias correction procedure for all the range values in accordance with the climate variable distribution function. We have not considered the impact of bias correction techniques on the tails of the distribution, which could be important for analysing extremes (Volosciuk et al., 2017).
-
In this study a univariate bias correction method is used. It does not consider the dependence between precipitation and temperature, which could be explored in future assessments. Meyer et al. (2019) found that incorporating or ignoring inter-variable relationships between temperature and precipitation could have an impact on the conclusions drawn in hydrological climate change impact studies in alpine catchments.
-
The streamflow information available for this case study cannot be divided into two series that were long enough (e.g. 30 years) representative of the climate/hydrology to explicitly perform a validation of the bias correction models (Chen et al., 2021). We have assumed that the statistics of any periods that were long enough remain invariant. In this case the calibration could implicitly be considered validated, owing to the fact that the same results would be obtained under this hypothesis for any other period representative of the climate/hydrology conditions.
-
In our case study the influence of temperature was considered only in the hydrological assessment by using rainfall-runoff models. However, other meteorological drought indices that consider temperature could be included in the analysis – e.g. the SPEI (García-Valdecasas Ojeda et al., 2021).
-
The corrected control simulation series obtained by using a quantile mapping bias correction presents a very good performance with respect to the historical series in terms of basic statistics. In the case of droughts (calculated from the SPI/SSI) the bias correction approach clearly improves the fit of the RCM simulation series to the historical series, but the performance is worse than for the basic statistics. Other bias correction procedures should be explored to improve the performance of drought statistics.
-
The proposed method has not been tested in other typologies of basin, such as in Alpine basins, where the snow melt component may have a significant influence on the results.
In this study we have proposed a method of classifying the corrected RCM simulations according to their capacity to reproduce the historical statistic. It considers basic (mean, standard deviation and skew coefficient) and drought statistics (frequency, length, magnitude and intensity) of the meteorological and hydrological series, and could be applied to any case study. We have also shown that the corrected RCM simulations that provide the best approximations of the meteorology also provide the best assessments of the hydrological impact.
The two best classified corrected RCM simulations were used to generate potential local scenarios of precipitation, temperature and streamflow by using a lumped hydrological model. These projections were used to assess the impact of climate change on local meteorology and hydrology within the Cenajo basin (south-eastern Spain). We analysed the change in basic and drought statistics. The selection of corrected RCM simulations predict a significant future impact on mean precipitation (−31.6 % and −44.0 %) and an increase in mean temperature (26.0 % and 32.2 %). They also predict a higher frequency (from 5 to 20 and 22 events of droughts), length (from 4.8 to 7.4 and 10.5 months), magnitude (from 2.53 to 6.56 and 9.62 SPI) and intensity (from 0.48 to 1.00 and 0.94 SPI) of extreme meteorological droughts. These changes are also propagated to the hydrological droughts. The studied area is located in the headwaters of the Segura River where the basin is an example of a Mediterranean area with a significant water demand, mainly for irrigation but also for urban supply, and low availability or resources. In these places the methodologies for assessing the impact of climate change on droughts are useful tools for water resource policy and decision makers.
The historical climate data are available on the web site of the Spain02 project, the RCMs are available on the web site of the CORDEX project, and the SIMPA model streamflow series were taken from the available information from the Spanish Ministry for Agrarian Development and Irrigation.
The codes used in this study are available from the corresponding author upon reasonable request.
AJCL, JDGG and DPV designed and conducted the research under the supervision of EPI. AJCL and JDGG performed the calculations and prepared the figures under the supervision of DPV and EPI. All authors wrote the paper and prepared the revisions. DPV obtained the funding. The final version has been approved by all co-authors.
The contact author has declared that neither they nor their co-authors has any competing interests.
Publisher's note: Copernicus Publications remains neutral with regard to jurisdictional claims in published maps and institutional affiliations.
This article is part of the special issue “Drought vulnerability, risk, and impact assessments: bridging the science-policy gap”. It is not associated with a conference.
We would like to thank the Spain02 and CORDEX projects for the data provided and the open-source R package qmap.
This research was partially supported by the research projects SIGLO-AN (RTI2018-101397-B-I00) from the Spanish Ministry of Science, Innovation and Universities (Programa Estatal de I+D+I orientado a los Retos de la Sociedad) and GeoE.171.008-TACTIC and GeoE.171.008-RESOURCE from GeoERA organisation funded by European Union's Horizon 2020 research and innovation programme.
This paper was edited by Joaquim G. Pinto and reviewed by Brunella Bonaccorso, David Santillán Sanchez, and two anonymous referees.
AEMET – Spanish Meteorological Agency: Generación de Escenarios Regionalizados de Cambio Climático Para España, Agencia Estatal de Meteorología, Ministerio de Medio Ambiente y Medio Rural y Marino, Madrid, Spain, http://www.aemet.es/es/idi/clima/escenarios_CC (last access: 23 February 2022), 2009.
Alvarez, J., Sánchez, A., and Quintas, L.: SIMPA, a GRASS based Tool for Hydrological Studies, Int. J. Geoinform., 1, 2005.
Aryal, Y. and Zhu, J.: Evaluating the performance of regional climate models to simulate the US drought and its connection with El Nino Southern Oscillation, Theor. Appl. Climatol., https://doi.org/10.1007/s00704-021-03704-y, in press, 2021.
Bonaccorso, B., Bordi, I., Cancelliere, A., Rossi, G., and Sutera, A.: Spatial variability of drought: An analysis of the SPI in Sicily, Water Resour. Manage., 17, 273–296, https://doi.org/10.1023/A:1024716530289, 2003.
Chen, J., Arsenault, R., Brissette, F. P., and Zhang, S.: Climate Change Impact Studies: Should We Bias Correct Climate Model Outputs or Post-Process Impact Model Outputs?, Water Resour. Res., https://doi.org/10.1029/2020WR028638, in press, 2021.
Collados-Lara, A. J., Pulido-Velazquez, D., and Pardo-Igúzquiza, E.: An integrated statistical method to generate potential future climate scenarios to analyse droughts, Water, 10, 1224, https://doi.org/10.3390/w10091224, 2018.
Collados-Lara, A. J., Pardo-Igúzquiza, E., and Pulido-Velazquez, D.: A distributed cellular automata model to simulate potential future impacts of climate change on snow cover area, Adv. Water Resour., 124, 106–119, https://doi.org/10.1016/j.advwatres.2018.12.010, 2019.
Collados-Lara, A. J., Pulido-Velazquez, D., and Pardo-Iguzquiza, E.: A Statistical Tool to Generate Potential Future Climate Scenarios for Hydrology Applications, Sci. Program., 2020, 8847571, https://doi.org/10.1155/2020/8847571, 2020.
Cook, B. I., Miller, R. L., and Seager, R.: Dust and sea surface temperature forcing of the 1930s “Dust Bowl” drought, Geophys. Res. Lett., 35, L08710, https://doi.org/10.1029/2008GL033486, 2008.
CORDEX PROJECT: The Coordinated Regional Climate Downscaling Experiment CORDEX, Program Sponsored byWorld Climate Research Program (WCRP), http://www.cordex.org/ (last access: 10 September 2020), 2013.
Cramer, W., Guiot, J., Fader, M., Garrabou, J., Gattuso, J. P., Iglesias, A., Lange, M. A., Lionello, P., Llasat, M. C., Paz, S., Peñuelas, J., Snoussi, M., Toreti, A., Tsimplis, M. N., and Xoplaki, E.: Climate change and interconnected risks to sustainable development in the Mediterranean, Nat. Clim. Change, 8, 972–980, https://doi.org/10.1038/s41558-018-0299-2, 2018.
Enayati, M., Bozorg-Haddad, O., Bazrafshan, J., Hejabi, S., and Chu, X.: Bias correction capabilities of quantile mapping methods for rainfall and temperature variables, J. Water Clim. Change, 12, 401–419, https://doi.org/10.2166/wcc.2020.261, 2021.
Escriva-Bou, A., Pulido-Velazquez, M., and Pulido-Velazquez, D.: The economic value of adaptive strategies to global change for water management in Spain's Jucar Basin, J. Water Resour. Pl. Manage., 143, 04017005, https://doi.org/10.1061/(ASCE)WR.1943-5452.0000735, 2017.
Fowler, H. J., Ekström, M., Blenkinsop, S., and Smith, A. P.: Estimating change in extreme European precipitation using a multimodel ensemble, J. Geophys. Res., 112, D18104, https://doi.org/10.1029/2007JD008619, 2007.
García-Valdecasas Ojeda, M., Gámiz-Fortis, S. R., Romero-Jiménez, E., Rosa-Cánovas, J. J., Yeste, P., Castro-Díez, Y., and Esteban-Parra, M. J.: Projected changes in the Iberian Peninsula drought characteristics, Sci. Total Environ., 757, 143702, https://doi.org/10.1016/j.scitotenv.2020.143702, 2021.
González, J. and Valdés, J. B.: New drought frequency index: Definition and comparative performance analysis, Water Resour. Res., 42, W11421, https://doi.org/10.1029/2005WR004308, 2006.
Gudmundsson, L., Bremnes, J. B., Haugen, J. E., and Engen-Skaugen, T.: Technical Note: Downscaling RCM precipitation to the station scale using statistical transformations – a comparison of methods, Hydrol. Earth Syst. Sci., 16, 3383–3390, https://doi.org/10.5194/hess-16-3383-2012, 2012.
Hanel, M., Rakovec, O., Markonis, Y., Máca, P., Samaniego, L., Kyselý, J., and Kumar, R.: Revisiting the recent European droughts from a long-term perspective, Scient. Rep., 8, 9499, https://doi.org/10.1038/s41598-018-27464-4, 2018.
Heim, R. R.: A review of twentieth-century drought indices used in the United States, B. Am. Meteorol. Soc., 83, 1149–1166, https://doi.org/10.1175/1520-0477-83.8.1149, 2002.
Herrera, S., Gutiérrez, J. M., Ancell, R., Pons, M. R., Frías, M. D., and Fernández, J.: Development and analysis of a 50-year high-resolution daily gridded precipitation dataset over Spain (Spain02), Int. J. Climatol., 32, 74–85, https://doi.org/10.1002/joc.2256, 2012.
Hollinger , S. E., Isard, S. A., and Welford, M. R. A new soil moisture drought index (SMDI) for predicting crop yields. Preprints Eight Conference on Applied Climatology, American Meteorological Society's Preprints, Anaheim, CA, 187–190, 1993.
Hui, Y., Xu, Y., Chen, J., Xu, C. Y., and Chen, H.: Impacts of bias nonstationarity of climate model outputs on hydrological simulations, Hydrol. Res., 51, 925–941, https://doi.org/10.2166/nh.2020.254, 2020.
Kogan, F. and Guo, W.: Early twenty-first-century droughts during the warmest climate, Geomat. Nat. Hazards Risk, 7, 127–137, https://doi.org/10.1080/19475705.2013.878399, 2016.
Lazoglou, G., Angnostopoulou, C., Tolika, K., and Benedikt, G.: Evaluation of a new statistical method-TIN-copula-for the bias correction of climate models' extreme parameters, Atmosphere, 11, 243, https://doi.org/10.3390/atmos11030243, 2020.
Liu, H., Chen, J., Zhang, X. C., Xu, C. Y., and Hui, Y.: A Markov chain-based bias correction method for simulating the temporal sequence of daily precipitation, Atmosphere, 11, 109, https://doi.org/10.3390/atmos11010109, 2020.
Liu, W. T. and Kogan, F. N.: Monitoring regional drought using the vegetation condition index, Remote Sens., 17, 2761–2782, https://doi.org/10.1080/01431169608949106, 1996.
Livada, I. and Assimakopoulos, V. D.: Spatial and temporal analysis of drought in Greece using the Standardized Precipitation Index (SPI), Theor. Appl. Climatol., 89, 143–153, https://doi.org/10.1007/s00704-005-0227-z, 2007.
Lloyd-Hughes, B., Shaffrey, L. C., Vidale, P. L., and Arnell, N. W.: An evaluation of the spatiotemporal structure of large-scale European drought within the HiGEM climate model, Int. J. Climatol., 33, 2024–2035, https://doi.org/10.1002/joc.3570, 2013.
Marcos-Garcia, P., Lopez-Nicolas, A., and Pulido-Velazquez, M.: Combined use of relative drought indices to analyze climate change impact on meteorological and hydrological droughts in a Mediterranean basin, J. Hydrol., 554, 292–305, https://doi.org/10.1016/j.jhydrol.2017.09.028, 2017.
McKee, T. B., Nolan, J., and Kleist, J.: The relationship of drought frequency and duration to time scales, in: Prepr. Eighth Conf. Appl. Climatol. Amer. Meteor, Soc., https://www.droughtmanagement.info/literature/AMS_Relationship_Drought_Frequency_Duration_Time_Scales_1993.pdf (last access: 23 February 2022), 1993.
McKee, T. B., Doesken, N. J., and Kleist, J.: Drought monitoring with multiple time scales, in: Proc. 9th Conf. Appl. Climatol., 1995.
Meyer, J., Kohn, I., Stahl, K., Hakala, K., Seibert, J., and Cannon, A. J.: Effects of univariate and multivariate bias correction on hydrological impact projections in alpine catchments, Hydrol. Earth Syst. Sci., 23, 1339–1354, https://doi.org/10.5194/hess-23-1339-2019, 2019.
Mishra, A. K. and Singh, V. P.: A review of drought concepts, J. Hydrol., 391, 202–216, https://doi.org/10.1016/j.jhydrol.2010.07.012, 2010.
Mishra, A. K. and Singh, V. P.: Drought modeling – A review, J. Hydrol., 403, 157–175, https://doi.org/10.1016/j.jhydrol.2011.03.049, 2011.
Mishra, A. K., Singh, V. P., and Desai, V. R.: Drought characterization: A probabilistic approach, Stoch. Environ. Res. Risk Assess., 23, 41–55, https://doi.org/10.1007/s00477-007-0194-2, 2009.
Palmer, W. C.: Meteorological Drought, Office of Climatology, US Weather Bureau, https://www.fws.gov/southwest/es/documents/R2ES/LitCited/LPC_2012/Palmer_1965.pdf (last access: 22 February 2022), 1965.
Palmer, W. C.: Keeping Track of Crop Moisture Conditions, Nationwide: The New Crop Moisture Index, Weatherwise, 21, 156–161, https://doi.org/10.1080/00431672.1968.9932814, 1968.
Pardo-Igúzquiza, E., Collados-Lara, A. J., and Pulido-Velazquez, D.: Estimation of the spatiotemporal dynamics of snow covered area by using cellular automata models, J. Hydrol., 550, 230–238, https://doi.org/10.1016/j.jhydrol.2017.04.058, 2017.
Pardo-Igúzquiza, E., Collados-Lara, A. J., and Pulido-Velazquez, D.: Potential future impact of climate change on recharge in the Sierra de las Nieves (southern Spain) high-relief karst aquifer using regional climate models and statistical corrections, Environ. Earth Sci., 78, 598, https://doi.org/10.1007/s12665-019-8594-4, 2019.
Pedro-Monzonís, M., Solera, A., Ferrer, J., Estrela, T., and Paredes-Arquiola, J.: A review of water scarcity and drought indexes in water resources planning and management, J. Hydrol., 527, 482–493, https://doi.org/10.1016/j.jhydrol.2015.05.003, 2015.
Pendergrass, A. G., Knutti, R., Lehner, F., Deser, C., and Sanderson, B. M.: Precipitation variability increases in a warmer climate, Sci. Rep., 7, 17966, https://doi.org/10.1038/s41598-017-17966-y, 2017.
Peres, D. J., Senatore, A., Nanni, P., Cancelliere, A., Mendicino, G., and Bonaccorso, B.: Evaluation of EURO-CORDEX (Coordinated Regional Climate Downscaling Experiment for the Euro-Mediterranean area) historical simulations by high-quality observational datasets in southern Italy: insights on drought assessment, Nat. Hazards Earth Syst. Sci., 20, 3057–3082, https://doi.org/10.5194/nhess-20-3057-2020, 2020.
Pérez-Sánchez, J., Senent-Aparicio, J., Segura-Méndez, F., Pulido-Velazquez, D., and Srinivasan, R.: Evaluating hydrological models for deriving water resources in peninsular Spain, Sustainabilty, 11, 2872, https://doi.org/10.3390/su11102872, 2019.
Polade, S. D., Gershunov, A., Cayan, D. R., Dettinger, M. D., and Pierce, D. W.: Precipitation in a warming world: Assessing projected hydro-climate changes in California and other Mediterranean climate regions, Sci. Rep., 7, 10783, https://doi.org/10.1038/s41598-017-11285-y, 2017.
Pulido-Velazquez, D., Ahlfeld, D., Andreu, J., and Sahuquillo, A.: Reducing the computational cost of unconfined groundwater flow in conjunctive-use models at basin scale assuming linear behaviour: The case of Adra-Campo de Dalías, J. Hydrol., 353, 159–174, https://doi.org/10.1016/j.jhydrol.2008.02.006, 2008.
Pulido-Velazquez, D., Collados-Lara, A. J., and Alcalá, F. J.: Assessing impacts of future potential climate change scenarios on aquifer recharge in continental Spain, J. Hydrol., 567, 803–819, https://doi.org/10.1016/j.jhydrol.2017.10.077, 2018a.
Pulido-Velazquez, D., Renau-Pruñonosa, A., Llopis-Albert, C., Morell, I., Collados-Lara, A.-J., Senent-Aparicio, J., and Baena-Ruiz, L.: Integrated assessment of future potential global change scenarios and their hydrological impacts in coastal aquifers – a new tool to analyse management alternatives in the Plana Oropesa-Torreblanca aquifer, Hydrol. Earth Syst. Sci., 22, 3053–3074, https://doi.org/10.5194/hess-22-3053-2018, 2018b.
Salimi, H., Asadi, E., and Darbandi, S.: Meteorological and hydrological drought monitoring using several drought indices, Appl. Water Sci., 11, 11, https://doi.org/10.1007/s13201-020-01345-6, 2021.
Seager, R., Burgman, R., Kushnir, Y., Clement, A., Cook, E., Naik, N., and Miller, J.: Tropical pacific forcing of North American medieval megadroughts: Testing the concept with an atmosphere model forced by coral-reconstructed SSTs, J. Climate, 21, 6175–6190, https://doi.org/10.1175/2008JCLI2170.1, 2008.
Senent-Aparicio, J., López-Ballesteros, A., Pérez-Sánchez, J., Segura-Mééndez, F. J., and Pulido-Velazquez, D.: Using multiple monthly water balance models to evaluate gridded precipitation products over peninsular Spain, Remote Sens., 10, 922, https://doi.org/10.3390/rs10060922, 2018.
Shrestha, M., Acharya, S. C., and Shrestha, P. K.: Bias correction of climate models for hydrological modelling – are simple methods still useful?, Meteorol. Appl., 24, 531–539, https://doi.org/10.1002/met.1655, 2017.
Sørland, S. L., Schär, C., Lüthi, D., and Kjellström, E.: Bias patterns and climate change signals in GCM-RCM model chains, Environ. Res. Lett., 13, 074017, https://doi.org/10.1088/1748-9326/aacc77, 2018.
Témez, J. R.: Modelo Matemático de Transformación “Precipitación-Aportación”, Asociación de Investigación Industrial Eléctrica (ASINEL), Madrid, Spain, 1977.
Teutschbein, C. and Seibert, J.: Bias correction of regional climate model simulations for hydrological climate-change impact studies: Review and evaluation of different methods, J. Hydrol., 456–457, 12–29, https://doi.org/10.1016/j.jhydrol.2012.05.052, 2012.
Thornthwaite, C. W.: An approach towards a rational classification of climate, Geogr. Rev., 38, 55–94, 1948.
Tramblay, Y., Koutroulis, A., Samaniego, L., Vicente-Serrano, S. M., Volaire, F., Boone, A., Le Page, M., Llasat, M. C., Albergel, C., Burak, S., Cailleret, M., Kalin, K. C., Davi, H., Dupuy, J. L., Greve, P., Grillakis, M., Hanich, L., Jarlan, L., Martin-StPaul, N., Martínez-Vilalta, J., Mouillot, F., Pulido-Velazquez, D., Quintana-Seguí, P., Renard, D., Turco, M., Türkeş, M., Trigo, R., Vidal, J. P., Vilagrosa, A., Zribi, M., and Polcher, J.: Challenges for drought assessment in the Mediterranean region under future climate scenarios, Earth-Sci. Rev., 210, 103348, https://doi.org/10.1016/j.earscirev.2020.103348, 2020.
Vicente-Serrano, S. M., Beguería, S., and López-Moreno, J. I.: A multiscalar drought index sensitive to global warming: The standardized precipitation evapotranspiration index, J. Climate, 23, 1696–1718, https://doi.org/10.1175/2009JCLI2909.1, 2010.
Vicente-Serrano, S. M., Tomas-Burguera, M., Beguería, S., Reig, F., Latorre, B., Peña-Gallardo, M., Luna, M. Y., Morata, A., and González-Hidalgo, J. C.: A high resolution dataset of drought indices for Spain, Data, 2, 22, , https://doi.org/10.3390/data2030022, 2017.
Volosciuk, C., Maraun, D., Vrac, M., and Widmann, M.: A combined statistical bias correction and stochastic downscaling method for precipitation, Hydrol. Earth Syst. Sci., 21, 1693–1719, https://doi.org/10.5194/hess-21-1693-2017, 2017.
Zhang, X., Tang, Q., Liu, X., Leng, G., and Li, Z.: Soil moisture drought monitoring and forecasting using satellite and climate model data over southwestern China, J. Hydrometeorol., 18, 5–23, https://doi.org/10.1175/JHM-D-16-0045.1, 2017.