the Creative Commons Attribution 4.0 License.
the Creative Commons Attribution 4.0 License.
 | 12 Dec 2022
Multiscale flood risk assessment under climate change: the case of the Miño River in the city of Ourense, Spain
Diego Fernández-Nóvoa
Orlando García-Feal
José González-Cao
Maite deCastro
Moncho Gómez-Gesteira
River floods, which are one of the most dangerous natural hazards worldwide, have increased in intensity and frequency in recent decades as a result of climate change, and the future scenario is expected to be even worse. Therefore, their knowledge, predictability, and mitigation represent a key challenge for the scientific community in the coming decades, especially in those local areas that are most vulnerable to these extreme events. In this sense, a multiscale analysis is essential to obtain detailed maps of the future evolution of floods. In the multiscale analysis, the historical and future precipitation data from the CORDEX (Coordinated Regional Downscaling Experiment) project are used as input in a hydrological model (HEC-HMS) which, in turn, feeds a 2D hydraulic model (Iber+). This integration allows knowing the projected future changes in the flow pattern of the river, as well as analyzing the impact of floods in vulnerable areas through the flood hazard maps obtained with hydraulic simulations. The multiscale analysis is applied to the case of the Miño-Sil basin (NW Spain), specifically to the city of Ourense. The results show a delay in the flood season and an increase in the frequency and intensity of extreme river flows in the Miño-Sil basin, which will cause more situations of flooding in many areas frequented by pedestrians and in important infrastructure of the city of Ourense. In addition, an increase in water depths associated with future floods was also detected, confirming the trend for future floods to be not only more frequent but also more intense. Detailed maps of the future evolution of floods also provide key information to decision-makers to take effective measures in advance in those areas most vulnerable to flooding in the coming decades. Although the methodology presented is applied to a particular area, its strength lies in the fact that its implementation in other basins and cities is simple, also taking into account that all the models used are freely accessible.
- Article
(6677 KB) - Full-text XML
- BibTeX
- EndNote


A large number of studies focused on the analysis and understanding of river floods have been developed in the last years (Benito et al., 2015; Portugués-Mollá et al., 2016; Zhu et al., 2017; Munoz et al., 2018; Areu-Rangel et al., 2019; Stoleriu et al., 2020; Mel et al., 2020; Di Sante et al., 2021). This prolific field of study is related to the fact that floods are considered as one of the most dangerous natural hazards occurring on the planet (Noji, 2000; Paprotny et al., 2018). In fact, several reports stated the potential of flood events to cause important damage in critical human infrastructure even putting at risk the integrity of people (Alderman et al., 2012; Fekete et al., 2017). Good indicators of the danger associated with floods are the estimated 100 000 deaths and the 1.4 billion people affected in the last decade of the 20th century (Jonkman, 2005) or the billions of dollars in losses due to the damage in infrastructure (Wallemacq et al., 2018). Despite the incredible damage associated with flooding in the past, the future is expected to be worse. In fact, one of the most disturbing implications associated with climate change is the general increase in river flood hazard in the following decades (Dankers and Feyen, 2008; Arnell and Gosling, 2016; Alfieri et al., 2017; Jongman, 2018). However, these authors also indicate that there is considerable uncertainty regarding the magnitude of future flood risks on regional and local scales. In this sense, climate reports highlight that climate extremes, such as floods, occur first at the local level, affecting the local population and local places (Cutter et al., 2012). This also reveals the need to know and understand the future implications of these events on a regional and local scale, especially in vulnerable areas. In fact, mitigating the impact of floods represents one of the most important challenges facing the scientific community worldwide in the coming decades (IPCC, 2012). The Iberian Peninsula is not foreign to disasters provoked by river floods, especially over its western area (Zêzere at al., 2014; Pereira et al., 2016). This risk was demonstrated in several studies that analyze the dramatic consequences suffered due to overflow of the Iberian Rivers debouching into the Atlantic Ocean (Benito et al., 1996, 2003; Ortega and Garzón, 2009; Trigo et al., 2014, 2016; Pereira et al., 2016; Rebelo et al., 2018; González-Cao et al., 2021). The special synoptic conditions of the Iberian Peninsula, where the storm tracks in the Northern Hemisphere can transport heat and moisture, are able to promote extreme weather conditions over this area (Peixoto and Oort, 1992; Trigo, 2006). In particular, although the hydrological cycle regimes in the Iberian Peninsula are conditioned by several atmospheric variability modes (deCastro et al., 2006), the timing and position of winter storms are highly dependent on the North Atlantic Oscillation (NAO) phase, whose negative mode favors that the western Iberian Peninsula can be subjected to continuous intense large-scale precipitation during winter months, the main cause of the floods developed in the major rivers of this area (Lavers et al., 2011; Trigo et al., 2004). In this sense, some studies analyzing the future evolution of precipitation over Spain have shown an increase in extreme precipitation events (Lorenzo and Alvarez, 2020; Des et al., 2021), which reinforces the need to analyze and understand how this increase will condition the flooding of rivers in vulnerable areas.
For all the above mentioned, the main aim of this study is focused on the analysis of the future evolution of the risk of extreme river flows in the regional domain delimited by the international Miño-Sil basin (NW Spain) and, specifically, on the associated floods caused in the city of Ourense. Ourense is the local domain where flooding of the Miño river can cause significant damage (Fernández-Nóvoa et al., 2020). For that, the integration of hydrological–hydraulic models, together with specific information on flood thresholds in the area under scope, will allow a detailed analysis of those particular events capable of causing a significant impact in the study area. In this sense, most of the previous studies dealing with flood projections analyzed the expected changes in extreme flows and floods associated with different probabilities or return periods (te Linde et al., 2011; Huang et al., 2013; Arnell and Gosling, 2016; Alfieri et al., 2017; Padulano et al., 2021). Here, the particular flows that effectively cause damage in Ourense city, not necessarily associated with characteristic return periods, as well as the specific areas that will be most affected by the associated floods will be analyzed. This approach allows the analysis to be adapted to the particular characteristics of the area under scope, thus contributing to addressing one of the most important challenges facing the scientific community for the coming decades: assessing the implications of climate change on extreme events at the local level. To achieve these objectives, the river flows in the Miño-Sil basin will be simulated for an entire historical period of 30 years and also for an entire future period of 30 years using data provided by climate models, analyzing not only the changes in the probability of risk flow situations but also the evolution of flood risk in particular areas of the city. The results will provide detailed information to decision-makers to help them take accurate and effective measures to mitigate the damage associated with future extreme events. In addition, it is important to highlight that although the methodology developed is focused on the Miño-Sil river basin it can be generalized to any basin and location, showing its potential in future applications.
This section describes the area under study, as well as the data used and the methodology carried out to analyze the future evolution of extreme river flows and flood events in the city of Ourense, inside the Miño-Sil basin.
2.1 Area of study
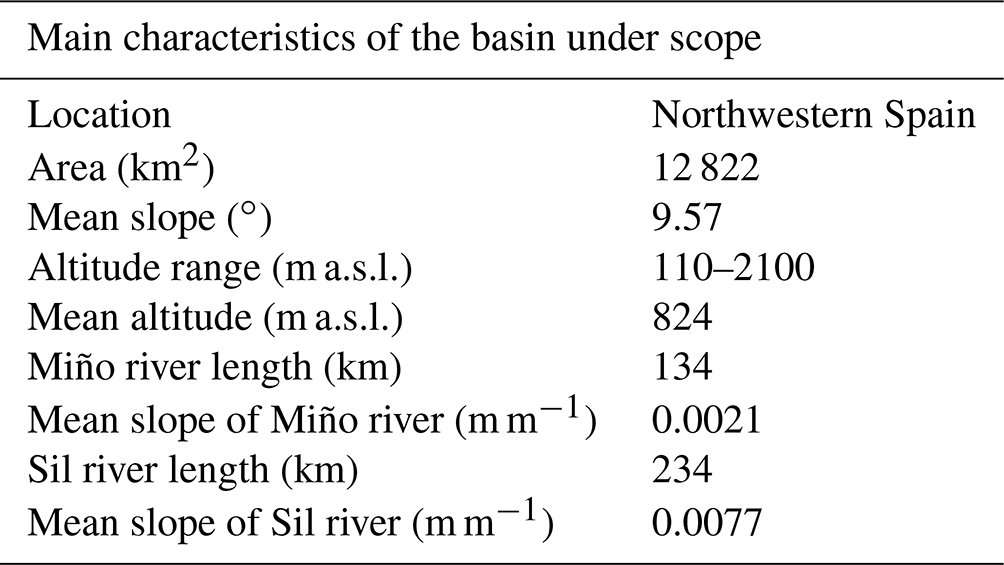
The area under scope is located on the northwestern Iberian Peninsula (Fig. 1a). It corresponds to the international Miño-Sil basin upstream of Ourense city, encompassing more than 70 % of the entire catchment and occupying near to 13 000 km2 (Fig. 1b). The basin under analysis ranges in altitude from approximately 110 to 2100 m a.s.l., with an average slope of around 9.57∘ (Table 1). The basin presents an important variability of land uses, although it is mainly characterized by moors and heathland (25 %), broad-leaved forest (23 %) and complex cultivation patterns (17 %), according to the criteria provided by CORINE Land Cover data (CLC, 2018) (Fig. 2). Special attention is focused on Ourense city, where Miño river floods can cause important damage (Fig. 1c). The Miño river, which has an approximate length of 134 km to Ourense, presents a pluvial regime, with an annual hydrologic cycle characterized by minimum river flows during summer months and maximum flows at the end of autumn and winter, when the extreme flood events can occur (Fernández-Nóvoa et al., 2017, 2020). This river flow cycle is promoted by the precipitation pattern of the study area, the seasonal variability of which depends on the position of the Azores High and the Icelandic Low, which determine the occurrence of most of the rainy events during the late autumn and winter (deCastro et al., 2006). When the Miño river flow surpasses a certain level at Ourense city a risk is generated in areas frequented by pedestrians and in some important infrastructure (Fernández-Nóvoa et al., 2020).

Figure 1(a) Location of the Miño-Sil basin upstream of Ourense city. (b) Map of elevations of the catchment under the scope. The channel that flows from north to south represents the Miño river and the channel that flows from east to west its main tributary, the Sil river. (c) Area of study in Ourense city (PNOA courtesy of © Instituto Geográfico Nacional).
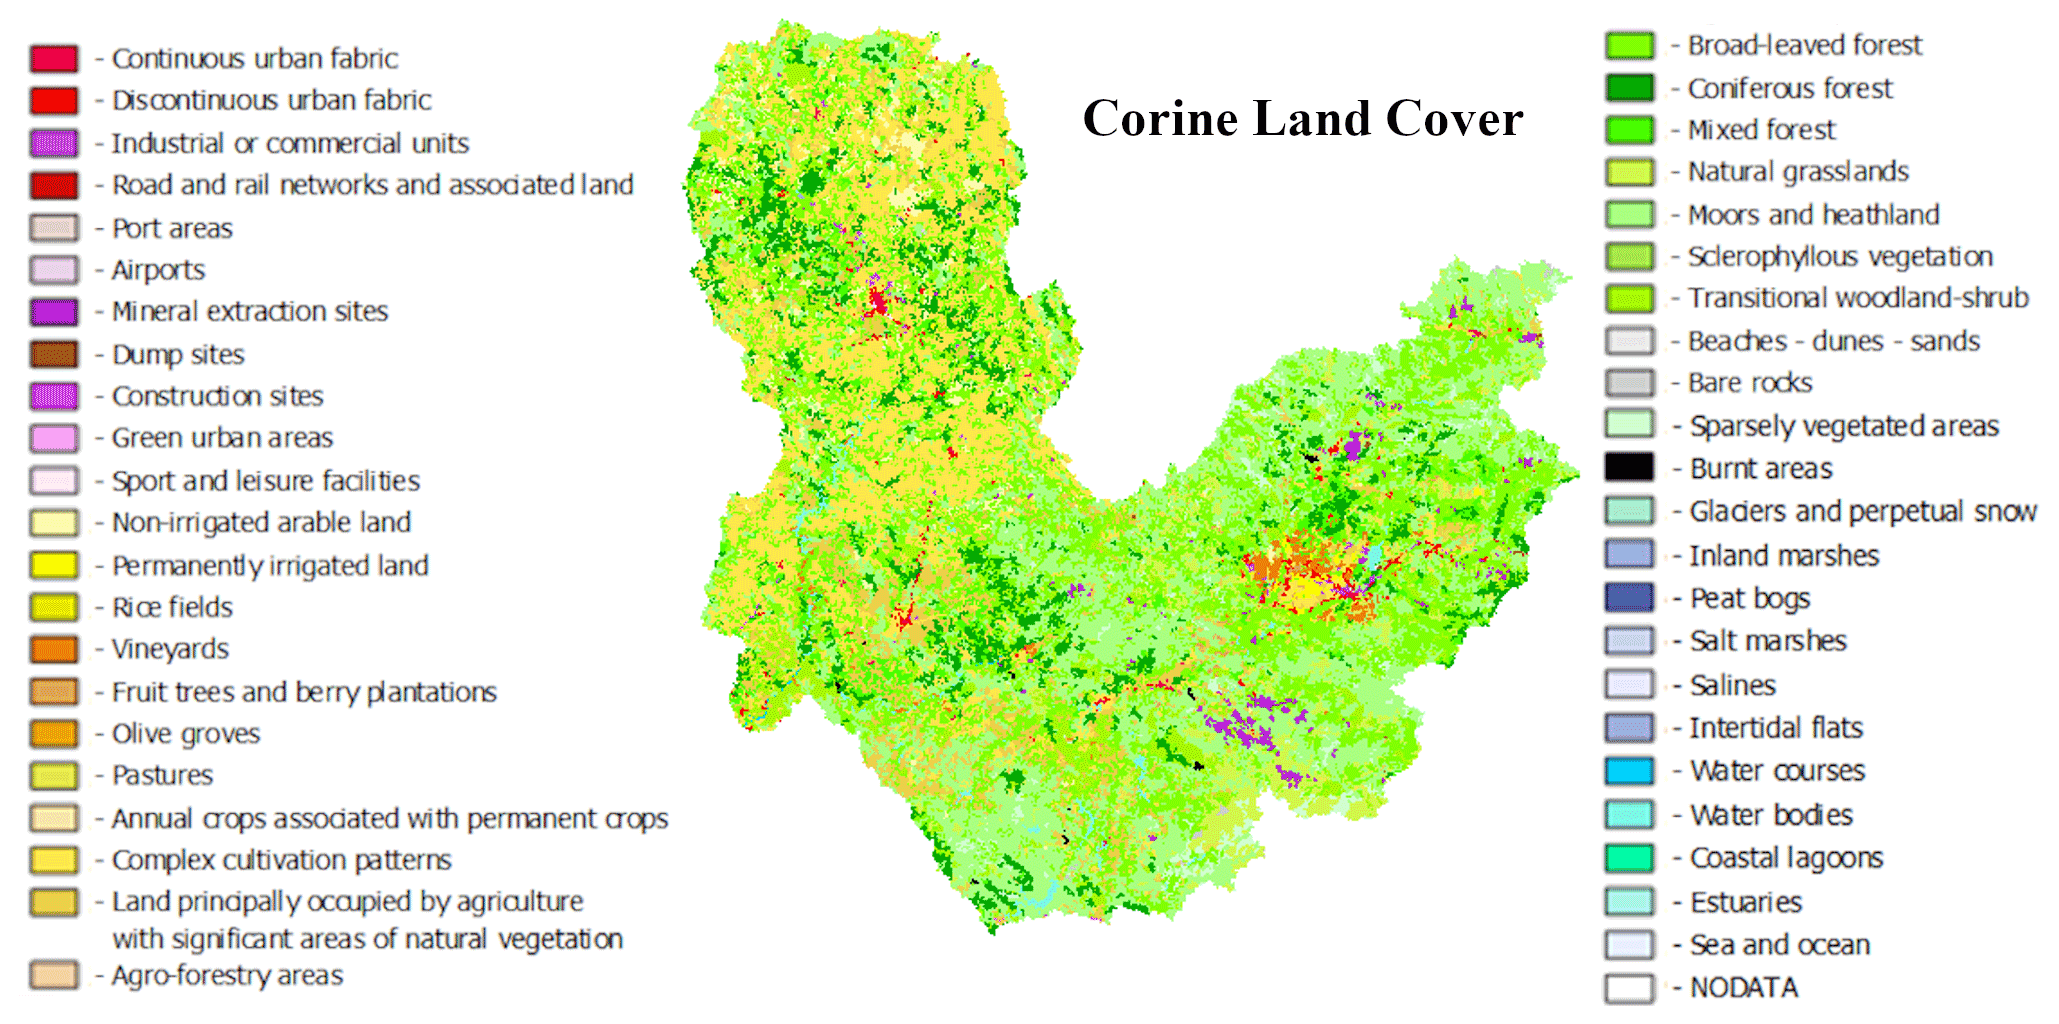
Figure 2General land uses defined by CORINE Land Cover and their distribution for the area under scope.
Table 1Main characteristics of the basin under scope (Miño–Sil basin to Ourense city), including the Miño river and its main tributary, the Sil river.
2.2 Precipitation data
Historical (1990–2019) and future (2070–2099) daily precipitation data for the area under scope were retrieved from the regional climate model (RCM) simulations carried out in the framework of the CORDEX (Coordinated Regional Downscaling Experiment) project (http://www.euro-cordex.net/, last access: March 2022). The EURO-CORDEX initiative offers simulations over the European continent considering global climate data from the Coupled Model Intercomparison Project Phase 5 (CMIP5) up to the year 2100, with more than 30 RCMs corresponding to the RCP8.5 greenhouse gas emission scenario. In this sense, some studies have detected that greenhouse gas emissions in recent years have tracked most closely with those projected under RCP 8.5, so this emission scenario seems to be highly realistic and a useful tool to assess future climate risks (Schwalm et al., 2020). EURO-CORDEX models provide daily data with sufficient spatial resolution (0.11∘ × 0.11∘) to adequately address the hydrological procedures of the area of scope (Garijo and Mediero, 2018; Lorenzo and Alvarez, 2020; Des et al., 2021).
Daily measured precipitation data were obtained from the pluviometers managed by MeteoGalicia (the regional meteorological agency of Galicia, https://www.meteogalicia.gal, last access: March 2022) to validate the CORDEX models for the study area. The measured precipitation was downloaded for the period 2008–2020, which is available for most of the pluviometers located in the area under scope.
2.3 Hydrological and hydraulic models
The transformation of precipitation into the corresponding river flow was carried out using the semi-distributed model HEC-HMS (Feldman, 2000; Scharffenberg et al., 2018; U.S. Army Corps of Engineers, 2018). This hydrological model was selected for being one of the most robust and widely adopted for hydrological procedures worldwide. In addition, this model has shown accurate results for the basin under scope as well as other nearby basins (Cea and Fraga, 2018; González-Cao et al., 2019; Fraga et al., 2020; Fernández-Nóvoa et al., 2020). In particular, Fernández-Nóvoa et al. (2020) show an effective hydrological procedure for the area under scope using HEC-HMS and considering (i) the Soil Conservation Service (SCS) curve number for the rainfall infiltration calculations; (ii) the SCS unit hydrograph to convert the rainfall excess in surface runoff; (iii) the linear reservoir methodology to simulate the corresponding baseflow; (iv) the Muskingum–Cunge method to deal with runoff propagation along the main channels. HEC-HMS is freely available on its official website (https://www.hec.usace.army.mil/software/hec-hms/, last access: March 2022).
The hydraulic model Iber+ was used to evaluate floods in Ourense city. Iber+ is a numerical tool that solves the 2D depth-averaged shallow-water equations by applying the finite volume method (García-Feal et al., 2018), and it is freely available on its official website (http://iberaula.es, last access: March 2022). In particular, the equations resolved by Iber+ model can be written as follows:
where h is the water depth, Ux and Uy represent the averaged horizontal velocities, g refers to the acceleration of gravity, ρ is the density of the water, vt is the turbulent viscosity, Zb is the bed elevation and τb represents the bed friction. The bed friction is computed with the Manning formulation as
Iber+ is an implementation in C and CUDA of the Iber model (Bladé et al., 2014). This new and optimized code achieves a 2 orders of magnitude speed-up by using a graphical processing unit (GPU) and high-performance computing (HPC) techniques. These improvements allow it to overcome the time constrained limitations of these types of climatological studies which require a large number of simulations. Iber+ has been shown to provide accurate results in several studies conducted in the area under the scope and in nearby areas (González-Cao et al., 2019; Fraga et al., 2020; Fernández-Nóvoa et al., 2020).
The good performance of both models to resolve hydrological and hydraulic procedures for the study area allowed their integration for the development of an early warning system over the Miño–Sil basin with a good capability to reproduce real events (Fernández-Nóvoa et al., 2020). Therefore, attending to the results obtained in this previous study, where both models were calibrated and successfully validated for the study area, the same configuration of both models detailed in Fernández-Nóvoa et al. (2020) was maintained to develop the present study. The catchment schematization followed is presented in Fig. 3.

Figure 3Map with the hydrological characterization of the basin under the scope attending to its topographical features. Subbasin refers to the divisions of the basin under scope, Junction refers to the points in the flow network where multiple inflows combine, Downstream refers to the point in the main river channel where each subbasin flows, and Reach represents the main river channels.
2.4 Methodology
The capability of each of the more than 30 RCMs to represent precipitation over the area under the scope was tested by comparing RCM precipitation data and field data from pluviometers managed by MeteoGalicia for the common period 2008–2020. Although there are several valid approaches to validating CORDEX models (Perkins et al., 2007; Peres et al., 2020; Des et al., 2021) the present analysis is focused on testing both the entire distribution of precipitation data, the so-called Perkins test (Perkins et al., 2007) and also the extreme precipitation values (those above the 99th percentile (P99) test). One of the main advantages of the Perkins test, based on probability density functions and developed on a daily scale, is that the good fit between the measured and simulated data proves the capability of the model to detect extreme values that can be unusual in the historical period but more common in the future due to the implications of climate change (Perkins et al., 2007). This allows selecting the most appropriate models according to the scope of this study, since the extreme precipitation events are usually behind the most important river floods. In addition, the complementary analysis focused on evaluating the deviation of the models in relation to the extreme precipitation values reinforces the validation process. In this sense, only those models surpassing 90 % in the Perkins test and with a deviation less than 25 % in the extreme values were considered. In addition, in order to reinforce the detection of those models especially suitable for representing extreme events in the area under scope, the comparison was carried out over the wet season (November–March) when the flood events take place (Fernández-Nóvoa et al., 2020).
Once the models that provide a good characterization of the precipitation for the study area have been selected, the precipitation provided by each one is used as an input in the hydrological model to simulate the river flow in the entire Miño–Sil basin. Thus, a hydrological simulation was carried out for each valid CORDEX model considering both historical (1990–2019) and future (2070–2099) periods. Although the precipitation data from CORDEX are on a daily scale, it was added to the hydrological model on an hourly scale (dividing the daily data by 24) in order to obtain river flows at this scale. Although other precipitation distributions could be applied to obtain hourly resolution, we opted to use this approach in order to maintain CORDEX information without modifications, taking into account the climatological perspective of this study and also considering that the area under scope is affected by relatively slow floods where the distribution of precipitation has limited impact. Therefore, the historical and future flows of the river were obtained on an hourly scale. It is important to point out that a day in a flood alert situation is considered to be when the hourly river flow at the city of Ourense surpasses the 2000 m3 s−1 at some moment. According to previous research (Fernández-Nóvoa et al., 2020), this threshold marks the limits above which the Miño river can cause dangerous flooding in areas frequented by pedestrians and serious damage to infrastructure. Changes in flood alert situations between historical and future periods were evaluated for each valid model. This analysis was carried out considering the total number of days under flood risk situation detected throughout the historical period (1990–2019) and the changes expected in the future period (2070–2099). The possible variation in the seasonality of the floods has also been evaluated. In addition, the river flow series obtained for the entire historical and future periods considered also allow the analysis of the expected changes in the general variability of river flow. Finally, taking advantage of the Iber+ model, an in-depth analysis of the dynamic evolution of future floods in different areas of the city has also been developed, which adds detailed knowledge of the future impact of floods in critical areas of the city. Some of the results will also be shown by averaging the individual results obtained after forcing the hydrological–hydraulic models with the data provided by each valid CORDEX model (multi-model), which minimizes the biases and uncertainties of each model (Pierce et al., 2009; Jacob et al., 2014).
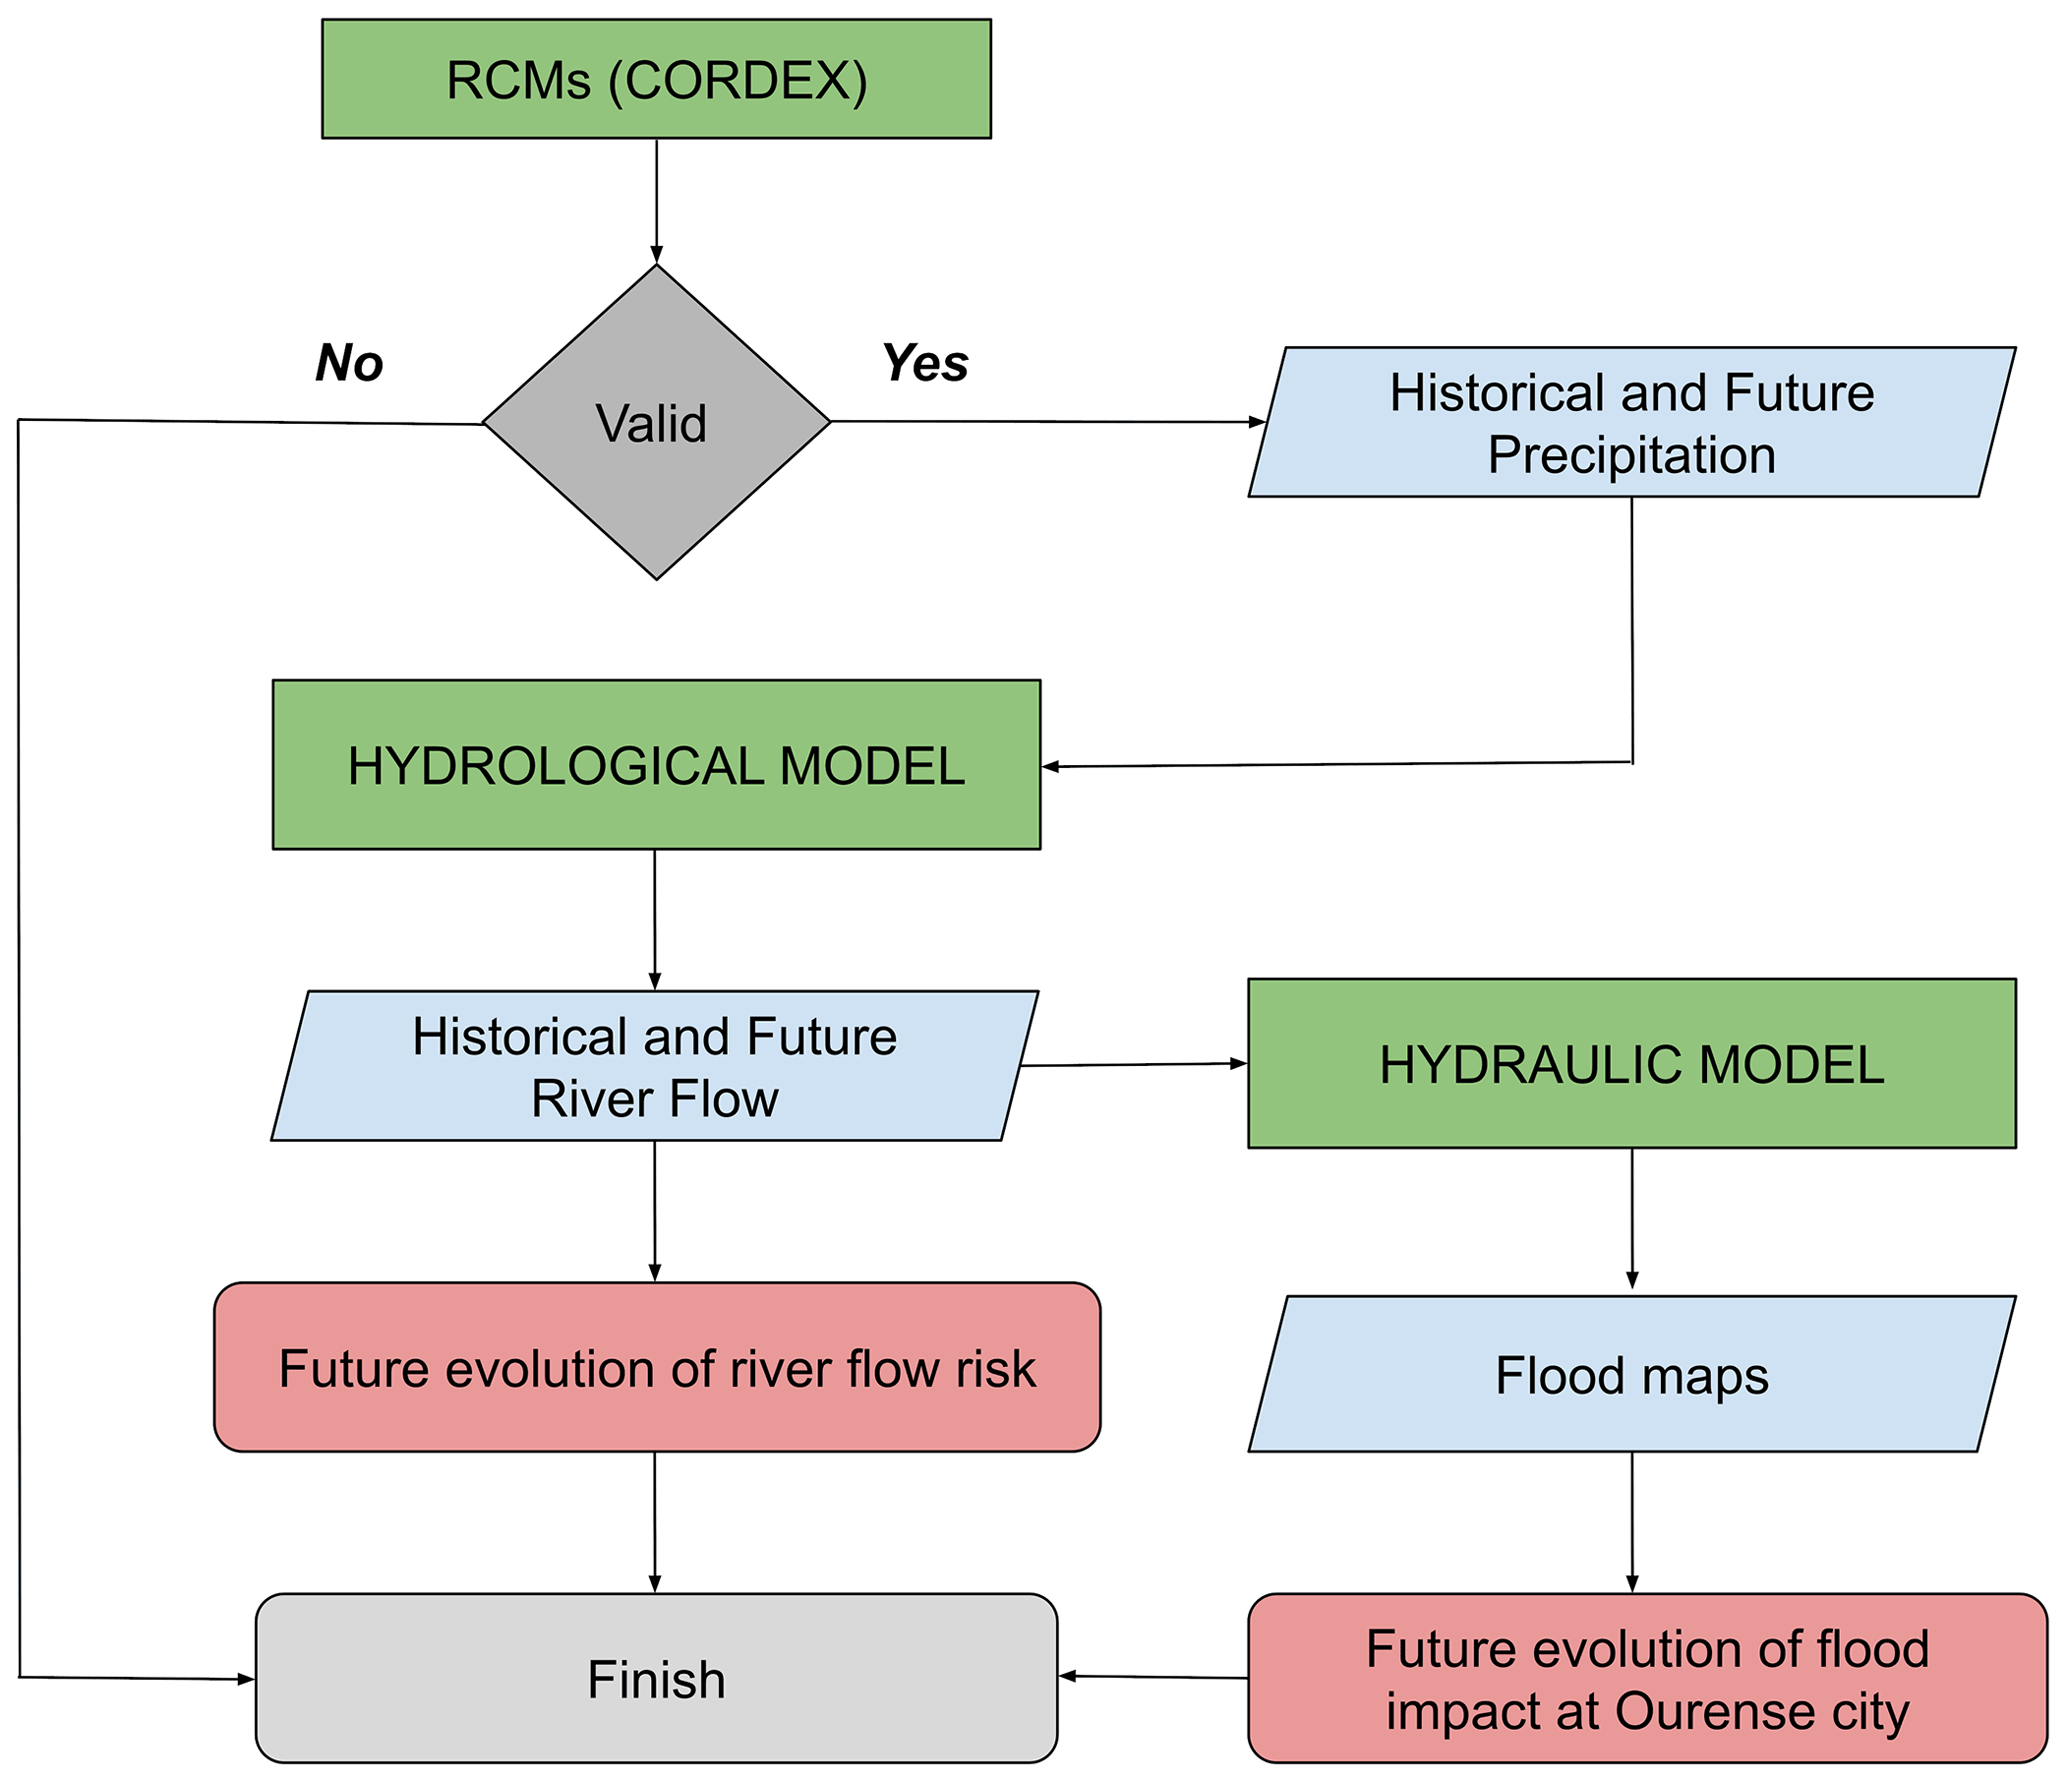
The general architecture of the methodology developed is schematized in Fig. 4. The developed procedure takes between 2–3 weeks to execute each model despite the improvements in the numerical procedures mentioned above (with the simulations executed on a computer with an AMD Ryzen 7 2700X processor, 32 GB of RAM and a Nvidia RTX 3080 ti GPU). However, this execution supposes an important added value in relation to this type of study. Most of the previous works that analyze changes in flood risk as a consequence of climate change are limited to the hydrological analysis, showing in a general way the expected future changes in high flows of the river generally associated with different return periods. However, it is necessary to assess the particular impacts of future flooding in vulnerable areas. In this work, the methodology presented allows a more detailed analysis of those flows that effectively cause flooding in a particular area, evaluating the expected changes as a result of climate change as well as the risk associated with future flooding in especially important and vulnerable areas of the cities.
3.1 RCM precipitation validation
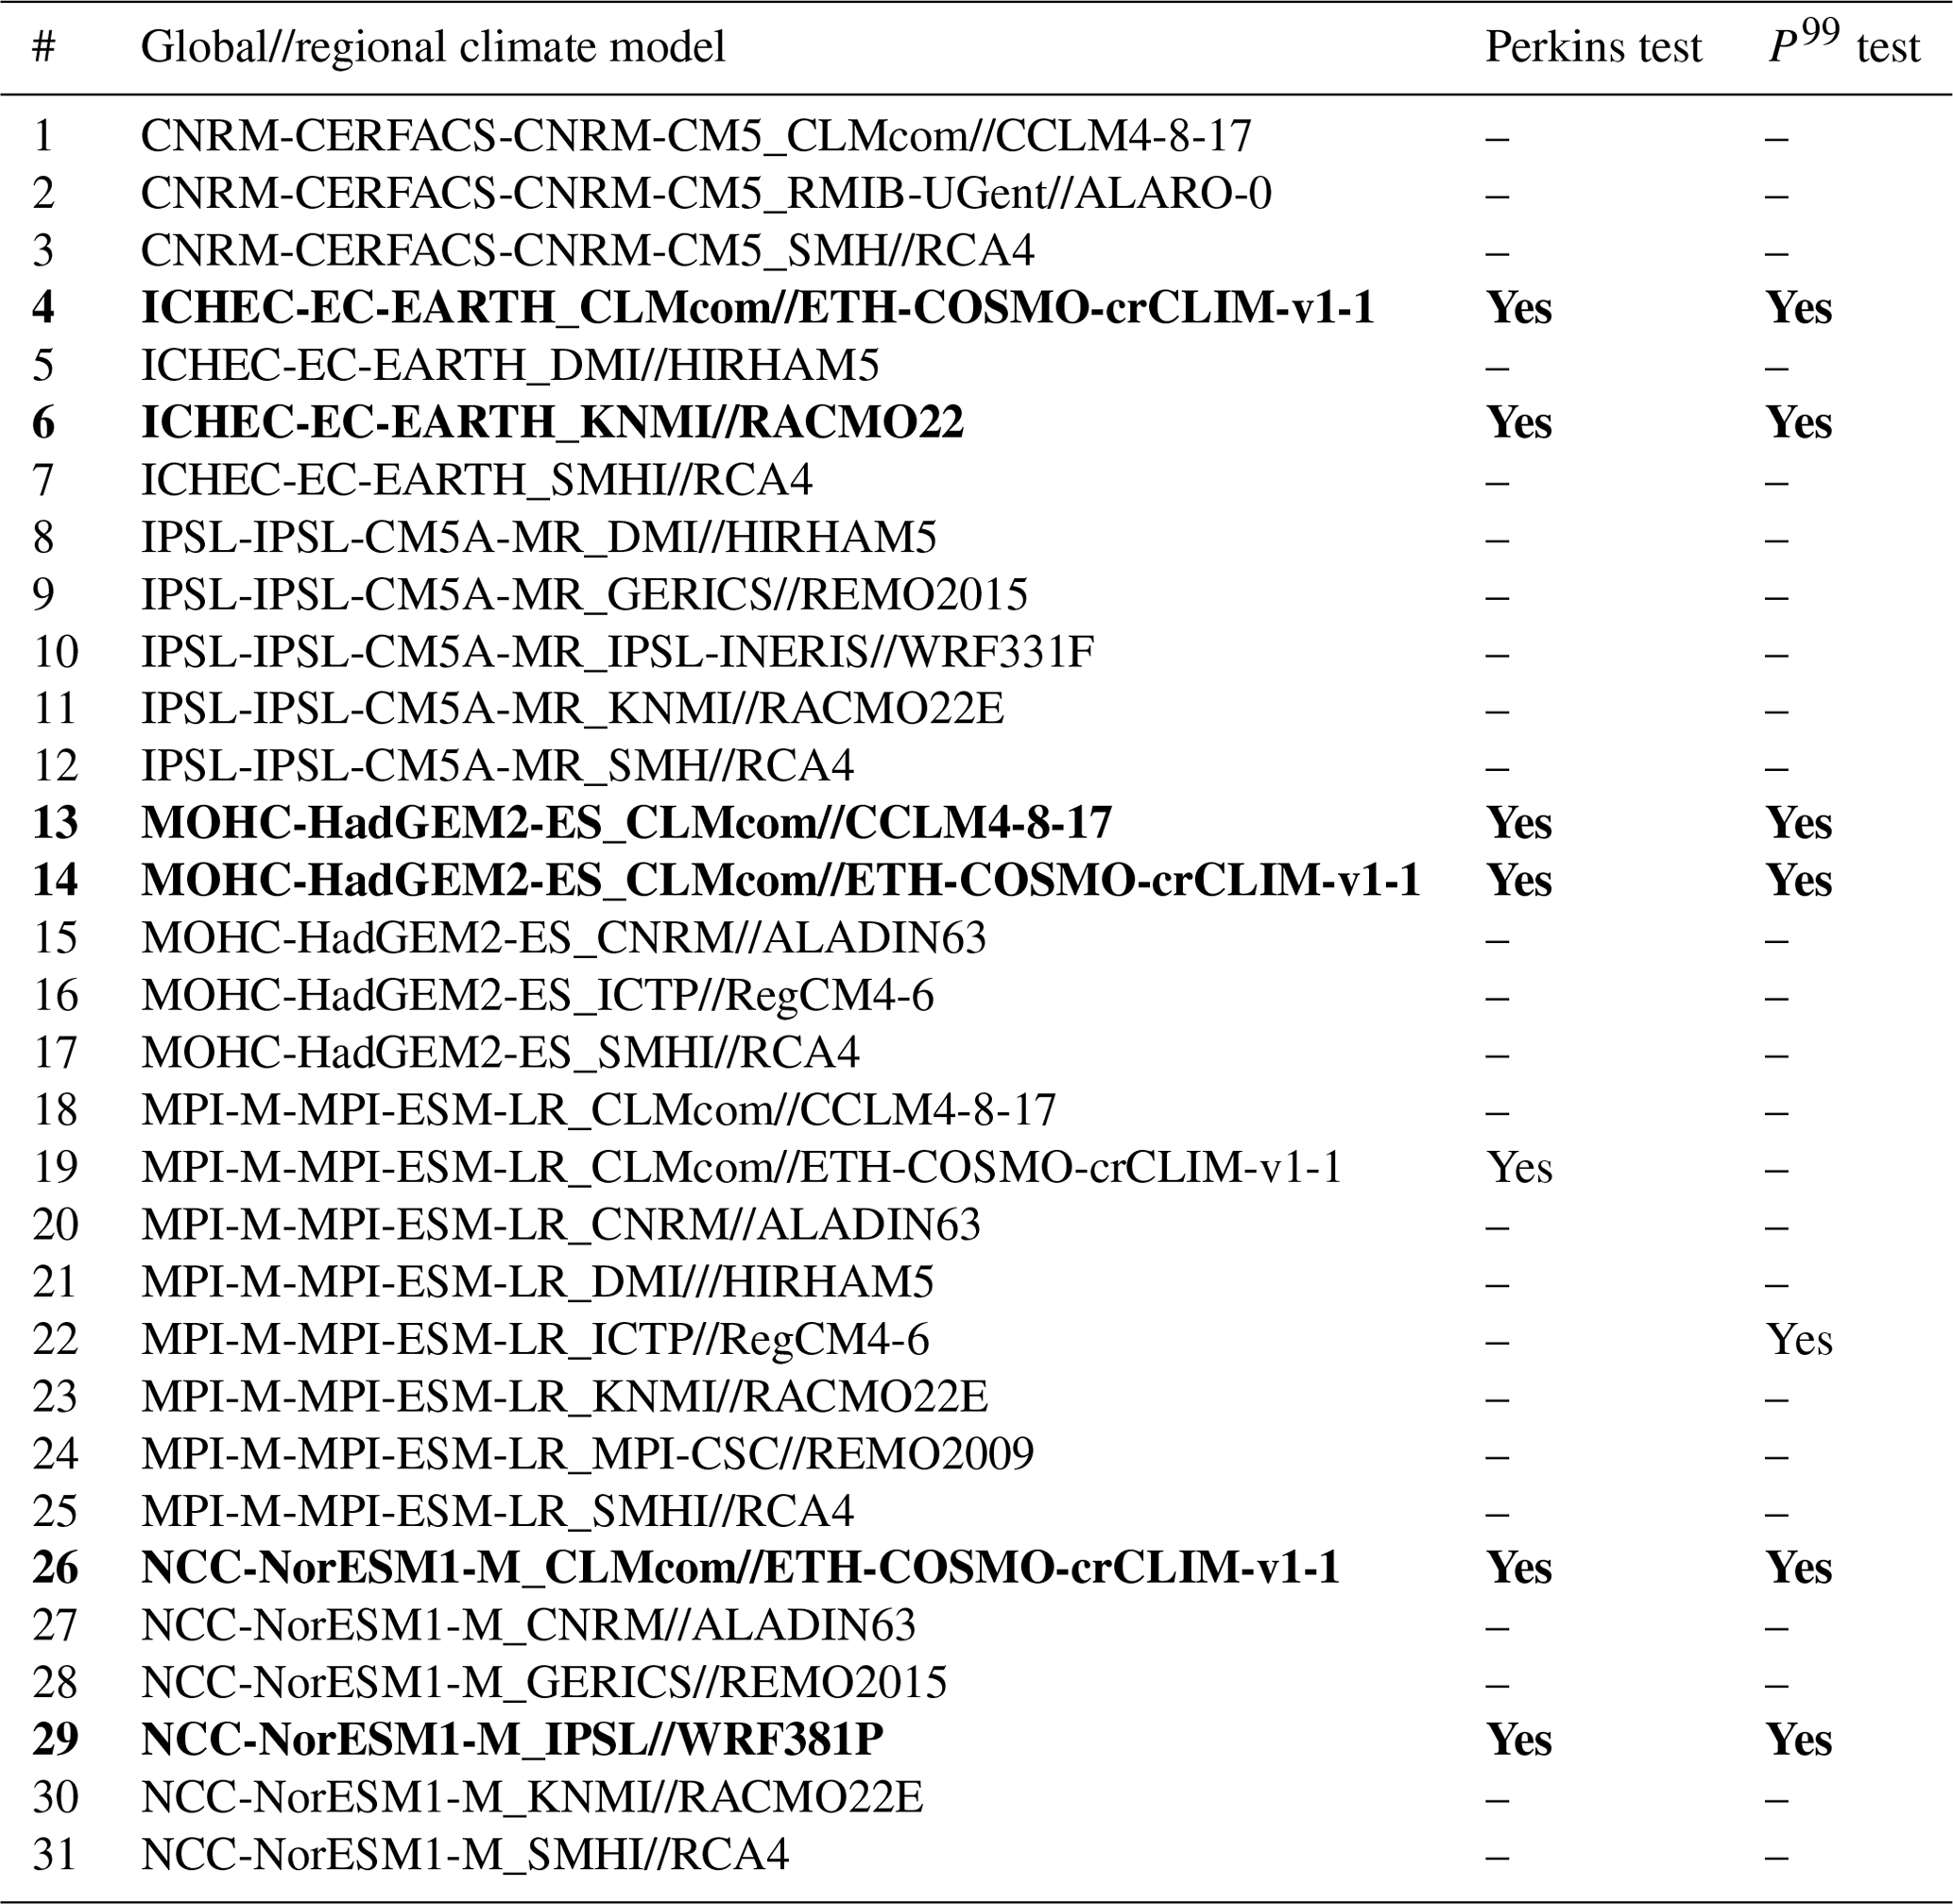
Precipitation data of the available RCMs were evaluated in order to select those models whose precipitation represents accurately the characteristics of the area under the scope. Table 2 shows the performance of models when Perkins and P99 tests were applied. Only those models surpassing both conditions were taken into account (for the sake of clarity a number was assigned to each model). Six models met both conditions and were selected to develop the study (models 4, 6, 13, 14, 26 and 29. See Table 2). The precipitation associated with each of these models was used to feed the hydrological model in order to obtain river flows for historical and future periods.
Table 2Regional climate models (RCMs) driven by global climate models (GCMs) from the EURO-CORDEX project. The Perkins test indicates those models with skills above 90 % to reproduce measured values over the wet season (NDJFM). Twenty bins were considered in the Perkins analysis. The P99 test indicates those models with a deviation of below 25 % when extreme values (above the 99th percentile) were compared with measured data over the wet season. Models fulfilling both conditions are highlighted in bold.
3.2 Future variability in river flow pattern
The future evolution in the river flow distribution was characterized for each valid model by the percentage of change in the frequency of the river flow ranges with respect to the historical period (Figs. 5 and 6). For this, the river flow data were distributed in ranges of 200 m3 s−1, considering in the last range those situations that surpassed the alert threshold. The number of cases within each range was counted both for the historical and future periods, and the percentage of change for each range was calculated according to the following equation:
where r is the respective range, F is the number of cases in the future period and H is the number of cases in the historical period. Positive (negative) values indicate an increase (decrease) in the number of cases in each flow range in the future.
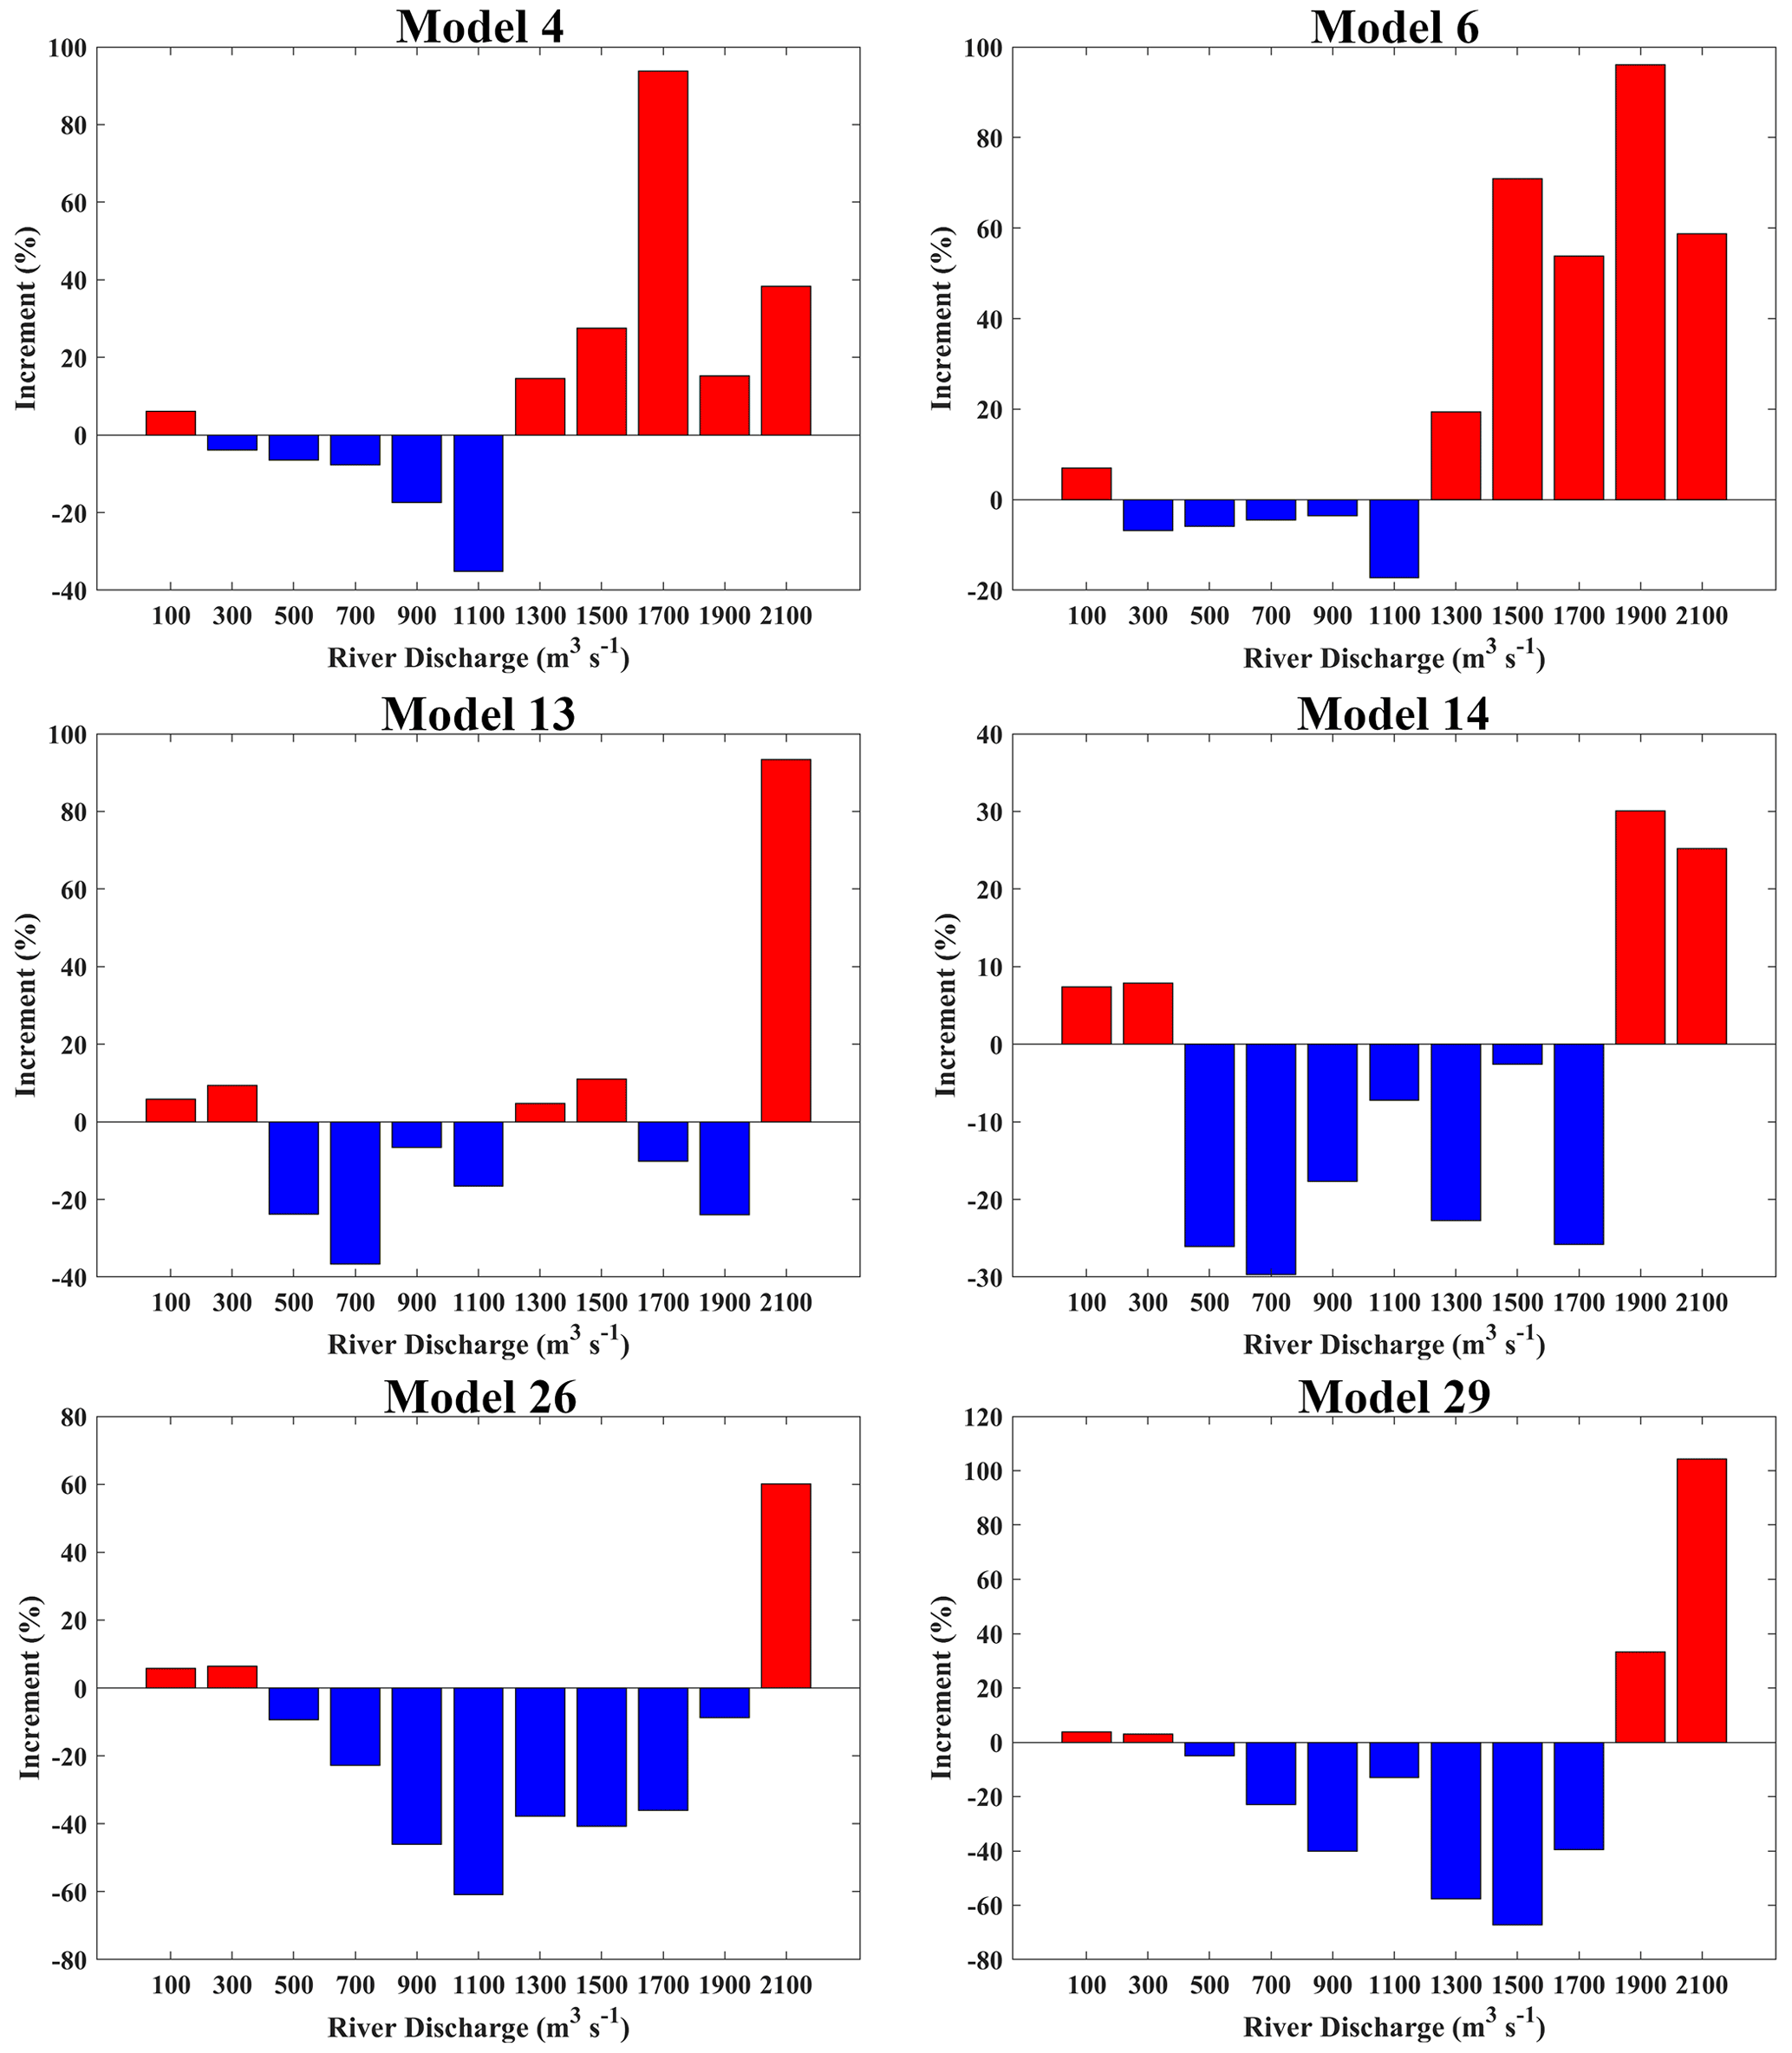
Figure 5Percentage of change in the frequency of river flow ranges in the future with respect to the historical period for each valid model. The river flow data were distributed in ranges of 200 m3 s−1. Each value of the river discharge indicates the mean of the corresponding range (100 m3 s−1 corresponds to the range of 0–200 m3 s−1). In the last range (2100 m3 s−1), the river flows surpassing the alert threshold (2000 m3 s−1) are included. Positive (negative) values indicate increase (decrease) in the future.
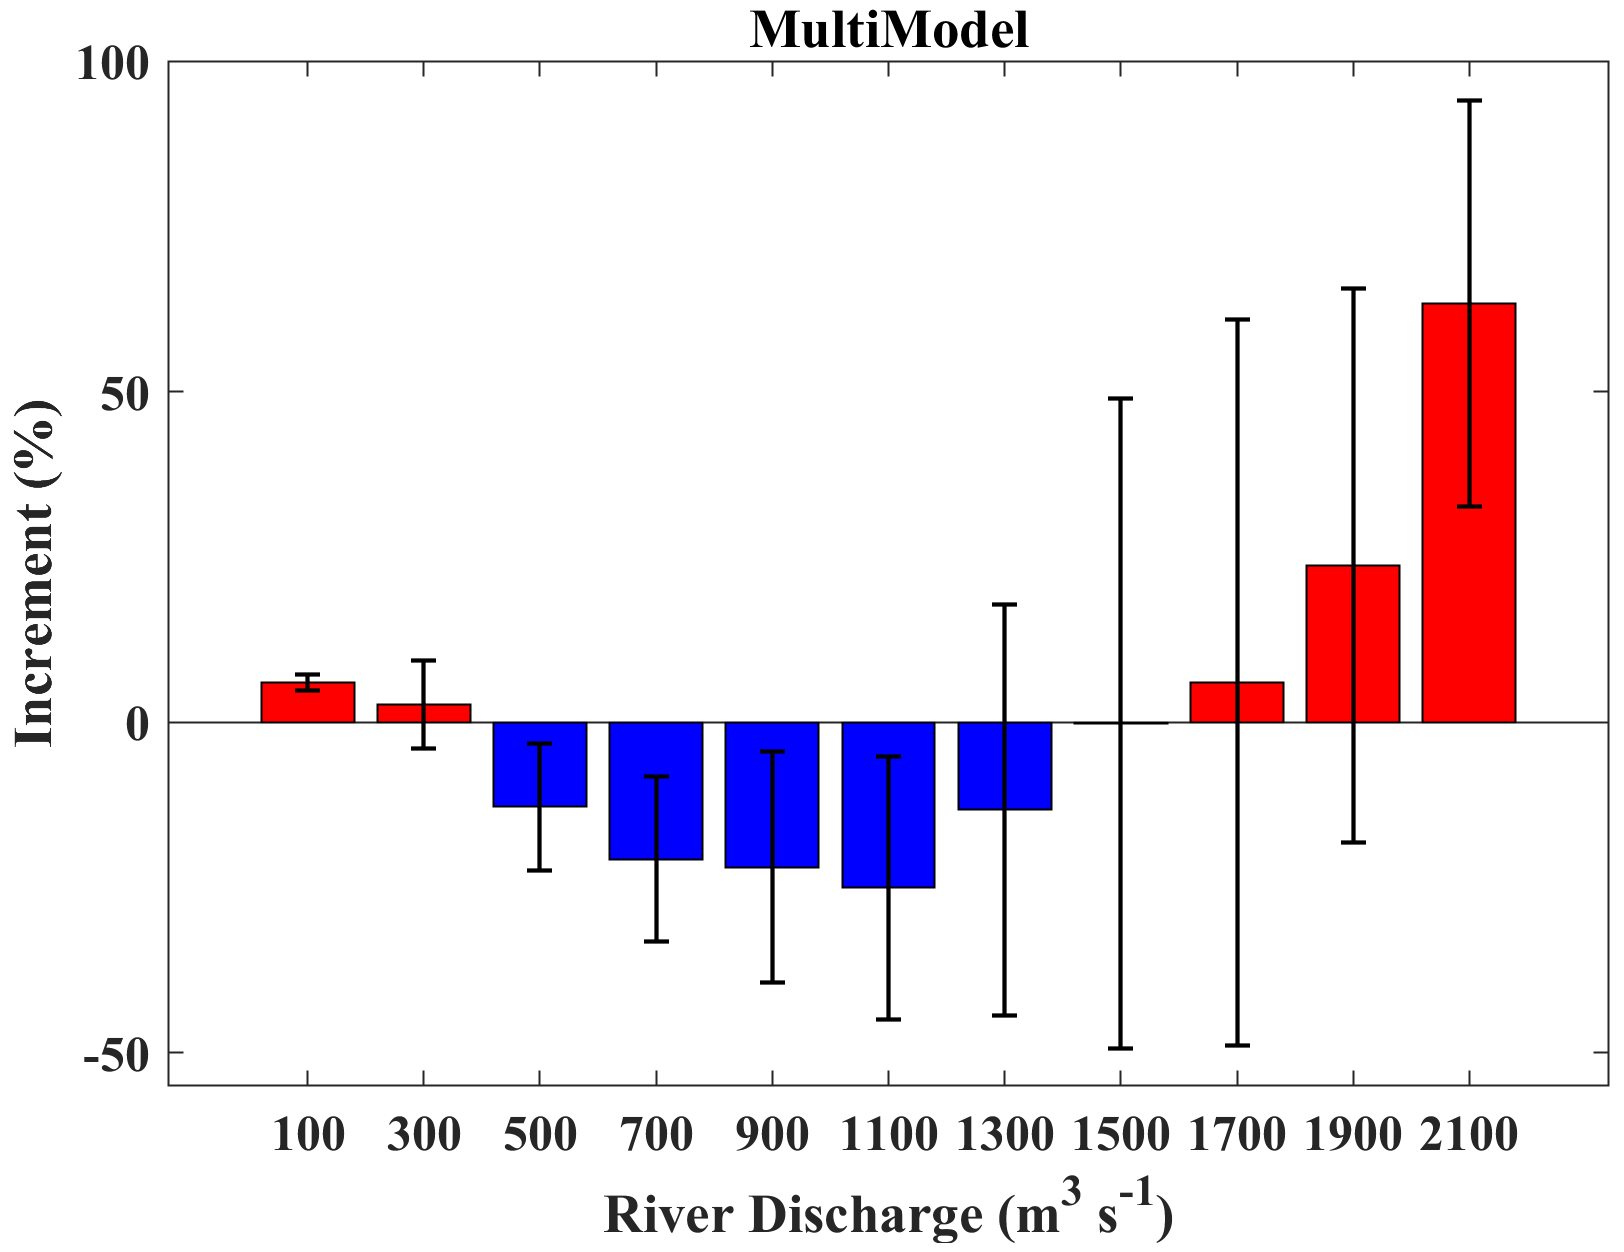
Figure 6Percentage change in the frequency of river flow ranges in the future with respect to the historical period considering the average of valid models (multi-model). The river flow data were distributed in ranges of 200 m3 s−1. Each value of the river discharge indicates the mean of the corresponding range (100 m3 s−1 corresponds to the range of 0–200 m3 s−1). In the last range (2100 m3 s−1), the river flows surpassing the alert threshold (2000 m3 s−1) are included. Positive (negative) values indicate increase (decrease) in the future. Black bars represent the multi-model deviation.
Multimodel mean shows that the frequency of the low (<400 m3 s−1) and high (>1600 m3 s−1) river flows will be increased in the future, whereas the intermediate flows will tend to decrease (Fig. 6). In particular, models 4 and 6 show a future increase in the frequency of river flows above 1200 m3 s−1, while in models 14 and 29 this increase is observed from 1800 m3 s−1, and in models 13 and 26 an increase is only detected for the most extreme range, those values above the flood alert limit of 2000 m3 s−1 (Fig. 5). With respect to lower flows, the models indicate an increase in the frequency of flows below 400 m3 s−1, except in models 4 and 6 where the only river flows that will increase their frequency are those below to 200 m3 s−1 (Fig. 5). In any case, this supposes an intensification of the hydrological cycle with a possible increase in both the drought and flood situations, an effect that has been also detected in other river basins around the world (Déry et al., 2009; Gloor et al., 2013; Davis et al., 2015; Gouveia et al., 2019). This future distribution of the river flow regime would suppose, for the area of study, more situations of water deficit during the dry season and a greater risk of flood situations during the wet season.
The river discharge, both for the historical and future periods, was also analyzed for different percentiles of flow (Table 3). A general decrease in the river discharge values associated with the different percentiles is observed in all models for the future, except for the highest percentiles (>95th). At this point, it is important to keep in mind that the 50th percentile represents river flows of the order of 200 m3 s−1, and all the models presented a future increase in the frequency of flows below this value, as can be seen in Figs. 5 and 6. This explains the general decrease of river discharge in these percentiles and supports the idea that low flows will be more frequent in the future, which could condition the water availability. On average, the models indicate a decrease of about 10 % in the 50th percentile. The opposite situation occurs when the highest river flows are analyzed. In fact, only the highest percentiles present an increase in river discharge in the future. Thus, the flow rate at the 99.9th percentile increases in all models. This means that the extreme flows of the river, those capable of causing floods, will be intensified in the future, which corroborates the results presented in Figs. 5 and 6. On average, the models indicate an increase in the flow of about 15 % at this extreme percentile. In addition, model 14 shows an increase in flow from the 99.5th percentile and some models even present an increase from the 99th (models 4, 6, and 13, Table 3). In any case, taking into account that floods in Ourense begin to be critical from 2000 m3 s−1, all the models indicate an increase of these extreme flows, corroborating the increase in the intensity and frequency of critical flows in Ourense in the future.
Table 3Historical (H) and future (F) percentile values of river discharge (m3 s−1) at Ourense city simulated for the RCMs marked in bold in Table 2. Italic formatting indicates the expected future values.

3.3 Future evolution of flood alerts
The evolution of flood alerts in Ourense was evaluated considering the number of days in a flood alert situation (river flow surpassing 2000 m3 s−1 at some moment of the day) for the historical and future periods (Table 4). All models indicate an increase in the number of days under a flood alert situation in the future. Particularly, models 6 and 13 show especially remarkable results, as they indicate an increase of above 60 % in the number of days under flood alert for the future. At the opposite extreme, models 4 and 29 indicate a more moderate increment of about 10 %. On average, the models indicate 22 ± 7 d in a flood alert situation in the historical period and that in the future, the alert situations will be increased to 30 ± 11 d. This means an average increase of more than 35 % in the number of days under flood risk situations in the future as a consequence of the changes in precipitation patterns caused by climate change. In addition, the intensity of extreme flood events seems to also be increased. The mean flood discharge value, calculated by averaging only those flows surpassing the alert threshold, was evaluated for the historical and future periods. On average, models have shown a mean flood discharge value of 2536 ± 198 m3 s−1 for the historical period incremented by a 7 % to reach 2713 ± 234 m3 s−1 in the future. The same procedure was carried out considering the maximum values reached in each model. On average the maximum peak value for the historical period was 3743 ± 864 m3 s−1, increasing to 4765 ± 1233 m3 s−1 in the future period, which supposes an increment of approximately 27 %. These results imply an increase in both the frequency and intensity of floods in the city of Ourense, which is consistent with previous studies of a more global nature. Alfieri et al. (2017) stated an increase in the risk of flooding in most of the world as a consequence of global warming. Furthermore, Kundzewicz et al. (2010) concluded that larger floods will be more common in the future over a large part of the European continent. However, as pointed out in the Introduction, the development of regional and local studies is necessary to confirm the global and general trends in regions and cities particularly vulnerable to flood risks.
Table 4Number of days in a flood alert situation detected numerically for the historical (1990–2019) and future (2070–2099) periods in Ourense city. A day is considered to be under an alert situation when the river flow surpasses 2000 m3 s−1 at some moment, following Fernández-Nóvoa et al. (2020). The percentage increase is calculated using the following equation: Percentage_Increase = 100 × (Future_Alert-Historical_Alert)/Historical_Alert. Italic formatting indicates the expected future values and future increase.

3.4 Future flood seasonality
The impact of climate change on the seasonality of the river floods in Ourense was evaluated through the monthly analysis of the multi-model frequency of the floods for the historical and future periods and by the difference between both periods (Fig. 7). In the historical period, 75 % of flood events occur in the December (51 %) and January (24 %) months (Fig. 7a). On the contrary, a significant decrease in the occurrence of floods is detected in December in the future (Fig. 7b and c), while January and February will present a significant increase in the frequency of floods. This means that the flood season will be delayed in the future. January will be the month in which more floods will occur (40 %) followed by February with 25 % and December with 24 %. Furthermore, floods are absent between April and October in both the historical and future periods. Similar results were obtained in previous works analyzing floods in the Iberian Peninsula (Blöschl et al., 2017). Likewise, Garijo and Mediero (2018) detected a future delay in the flooding season in some sub-basins of the Ebro river. This means that climate change will not only increase the frequency and intensity of floods in the Miño–Sil basin but will also produce changes in the flood season, which will be delayed in the future.
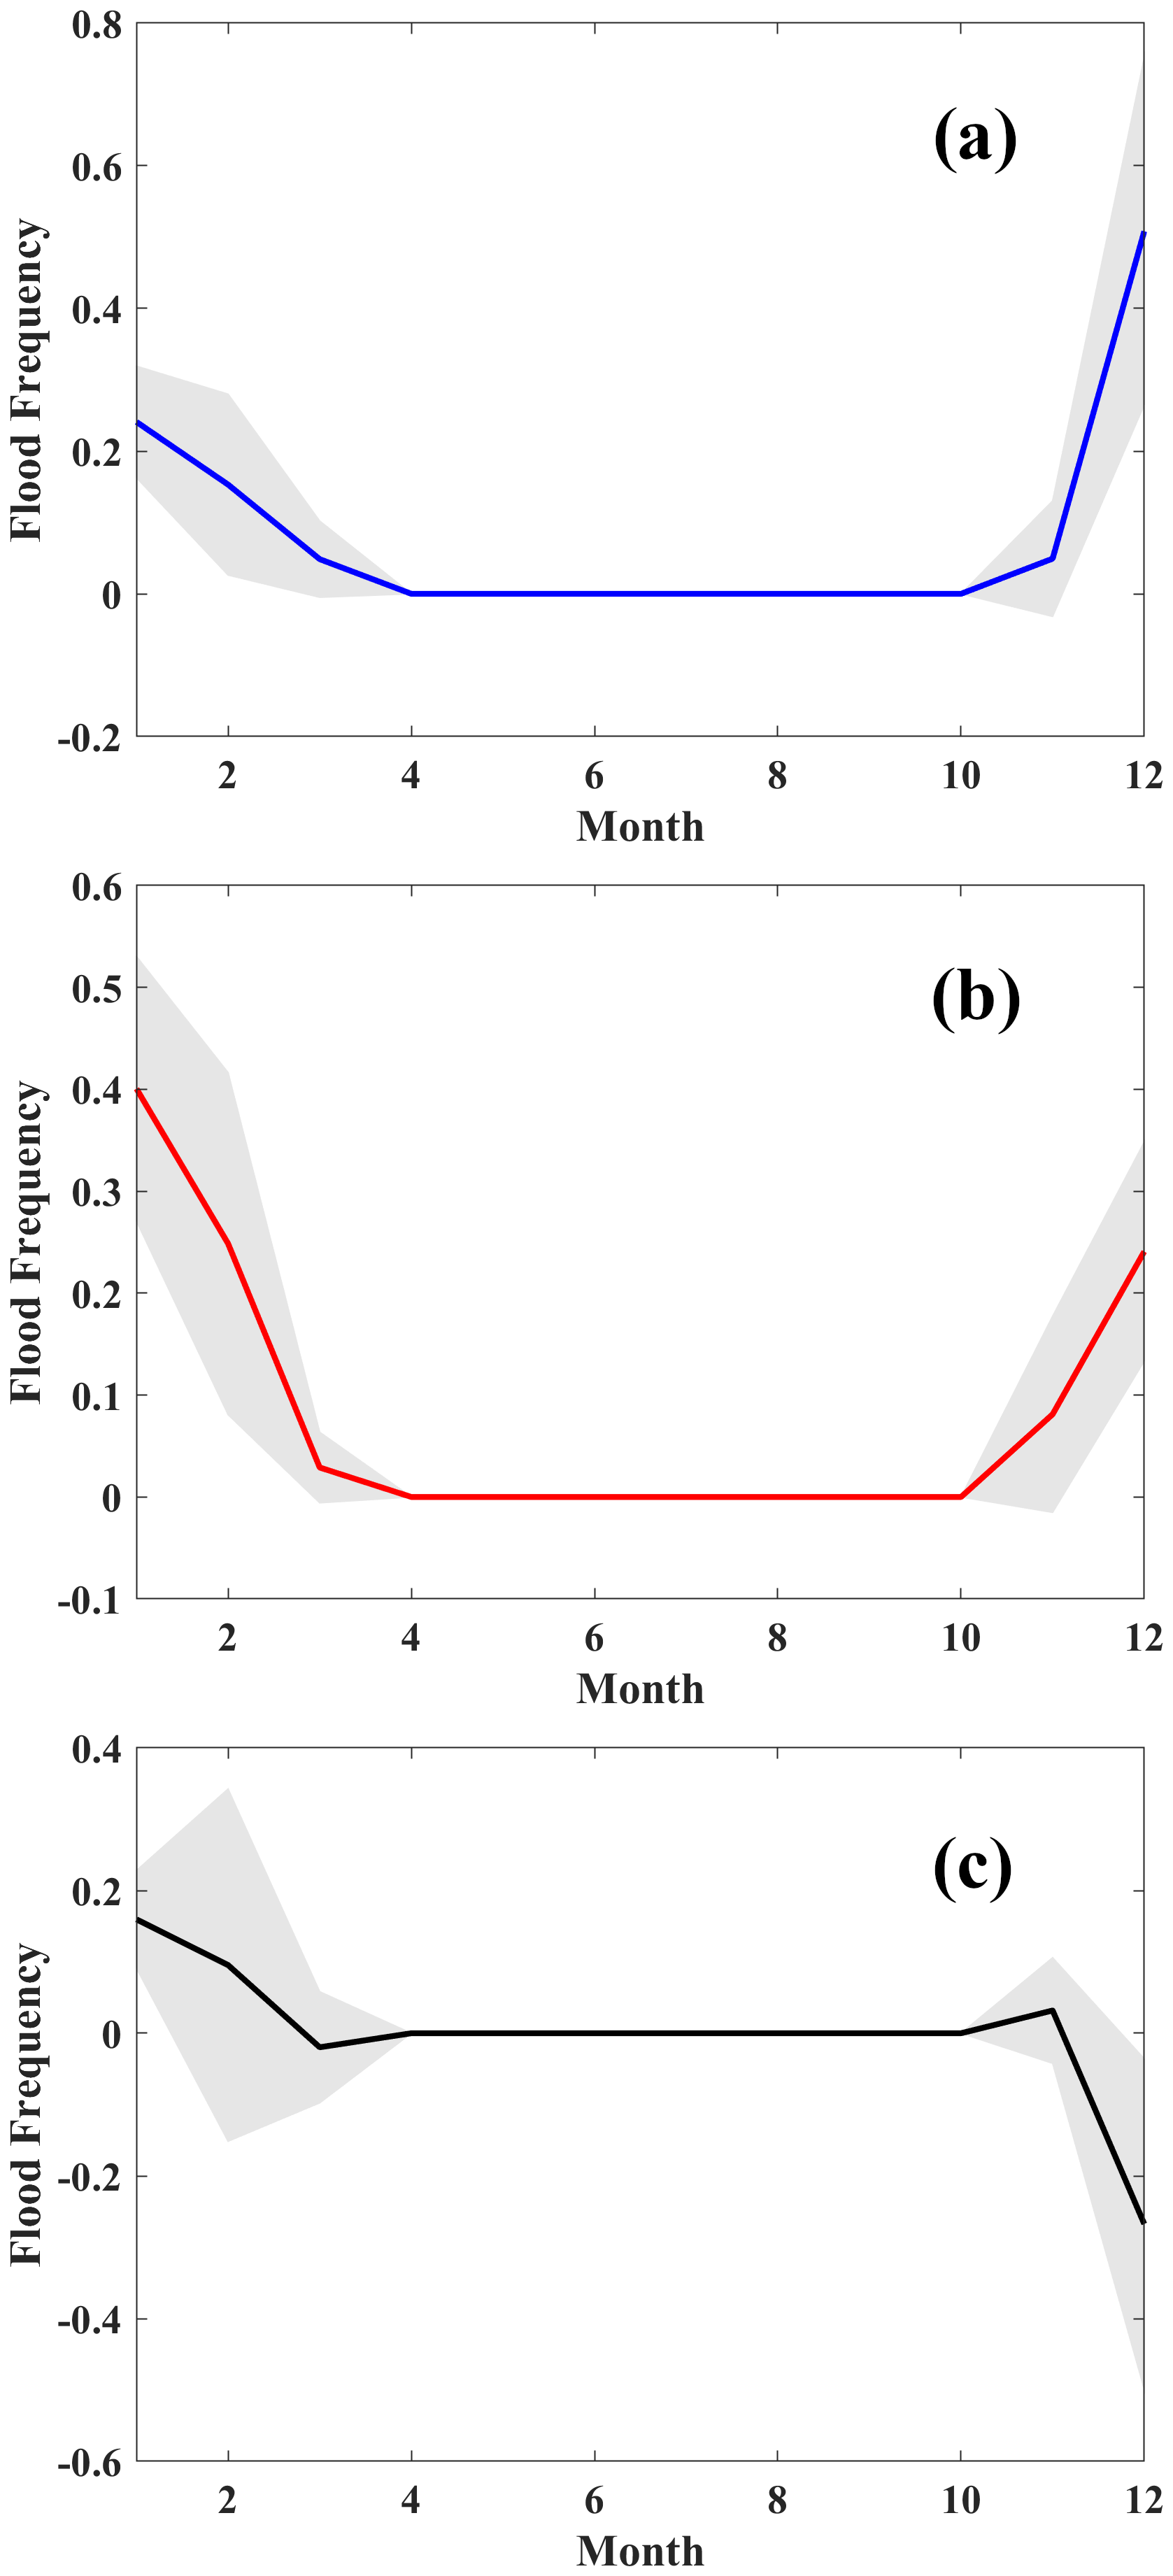
Figure 7Multi-model mean of the monthly flood frequencies for the (a) historical and (b) future periods. Frequencies were calculated by dividing the flood alerts detected in each month by the total number of alerts. Thus, the sum of the frequencies of all months is equal to 1. (c) Differences in flood frequency between historical and future periods. Positive (negative) values indicate an increasing (decreasing) of flood frequency in the future. Gray shadow areas represent multi-model deviation.
3.5 Future flood impacts in Ourense city
The delimitation of those areas of the cities most vulnerable to floods under the future scenario is essential when taking adequate and precise measures to mitigate the impacts of floods at the local level. In the particular case of the city of Ourense, every day that surpasses the pre-alert threshold (1253 m3 s−1, following Fernández-Nóvoa et al., 2020) was simulated with Iber+ for each precipitation valid model both for historical and future periods. This implies performing more than 1000 hydraulic simulations of 24 h events in the area of the city of Ourense. In order to execute this large number of simulations in a reasonable time, the GPU parallelization of Iber+ was fundamental, as commented above. This flow threshold was selected for hydraulic simulations because some areas outside the riverbed can be reached by water when this limit is surpassed, thus providing a better representation of all flooded areas, which facilitates and improves the visual analysis of the hydraulic results. In this sense, the multi-model mean of the days under hazard by flood is calculated for each pixel of the domain (excluding the riverbed) for the historical period (Fig. 8). The criteria for defining flood hazard situations were established following Cox et al. (2010). As expected, the areas closest to the riverbed present a higher frequency of flood hazards. However, the areas farthest from the riverbed, where there is some important infrastructure such as roads, parks, or thermal baths, are also threatened by floods, although less frequently. Changes in hazard flood situations between historical and future periods were evaluated in Ourense (Fig. 9). This analysis was performed by subtracting the multi-model mean of the number of days in a hazard flood situation obtained in the historical period from those expected in the future. In the future, there will be a general increase in the hazard (red colors) in all areas affected by floods, which corroborates the results presented above (Fig. 9a).
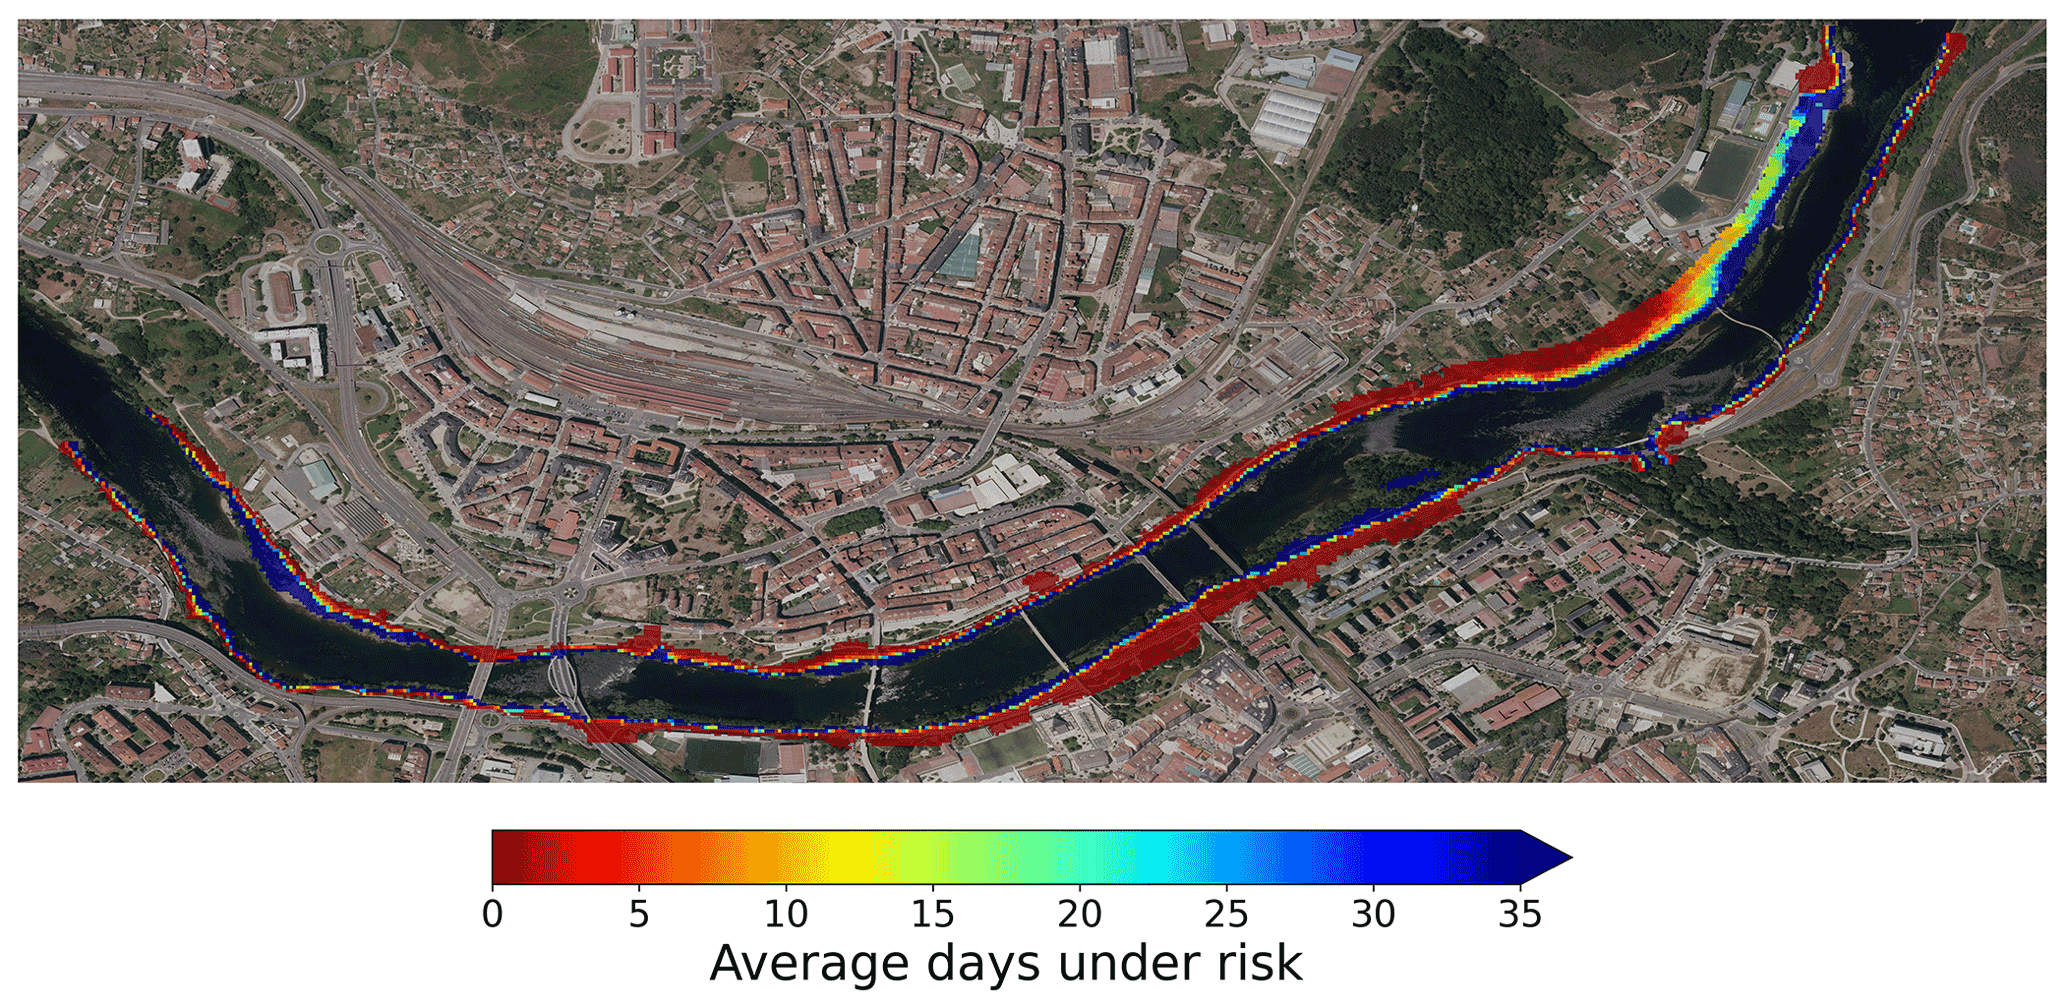
Figure 8Multi-model mean of the number of days under hazard by floods for each pixel of the domain in the historical period. Only the area outside the riverbed was considered for the flood risk analysis (aerial picture courtesy of PNOA © Instituto Geográfico Nacional).
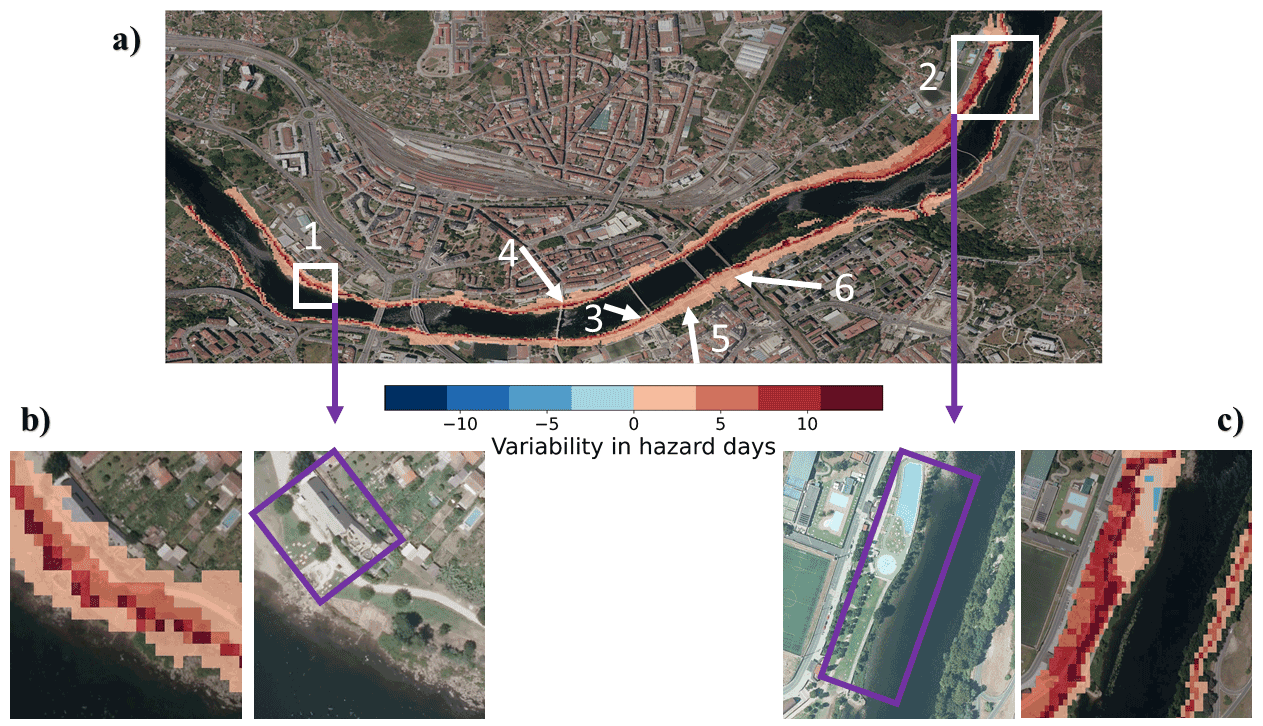
Figure 9(a) Future variability in the number of days under hazard by floods in Ourense city. The increase (decrease) in the number of cases is obtained for each pixel of the domain by subtracting the number of days under flood hazard situation in the historical period from the number of hazard cases in the future period. Thus, red (blue) colors represent the increase (decrease) in the flood hazard considering the average of all models. Only the area outside the riverbed was taken into account for the flood risk analysis. In the lower panels two important areas of the city are shown in detail, (b) Chavasqueira thermal baths and (c) Oira park (aerial pictures courtesy of PNOA © Instituto Geográfico Nacional).
The area of most concern is the one marked in dark red, which shows a significant increase in the threat of flooding in highly frequented leisure areas. This area will be flooded due to extreme events. Although the areas closest to and farthest from the riverbed present a moderate increase (light red color) in the threat of flooding, in the latter the importance lies in the fact that the flooding is due to highly extreme events, corroborating the increase of these extreme flood situations. The light red color of the farthest area from the riverbed indicates a moderate increase in absolute days but a significant proportional increase in frequency and also in severity, since the area affected by floods is increased compared to the historical one. These results are in agreement with the previous analysis of the flow patterns of the river.
Two of the most sensitive places in the city are analyzed in greater detail, showing the potential of the hydraulic model to delimit the vulnerable areas to flooding (1 and 2 in Fig. 9a). Thus, an important increase in future hazard situations was detected in the Chavasqueira thermal baths, one of the most visited places of the city (Fig. 9b). This implies that the thermal baths will be closed during more days in the future as a result of flooding. This, along with an increase in costs associated with repairs due to flood damage, will have a negative socio-economic impact on the city. A similar analysis was made for Oira park, one of the most important places of recreation in the city (Fig. 9c). This area presents the greatest flood risk increase of the city in the future.
The multi-model mean of the maximum water depth reached during the floods in significant areas of Ourense was also calculated both for the historical period and for the future (Fig. 10). For this analysis, the maximum value reached by water depth in each area for each day under flood conditions was determined, and the mean of these maxima (Fig. 10a) and the supremum (Fig. 10b) were calculated for each model and then averaged over all models. Apart from the Chavasqueira thermal baths (1) and Oira park (2), other important recreational areas such as Antena beach (3), Ribeira de Canedo (4) and Miño (5) parks were considered. Furthermore, the N-120 road (6) was also included since it is one of the most important transport routes of the city. An increase both in the average of maxima and supremum of the water depths was obtained at all locations in the future, which means that floods will tend to worsen in Ourense since in addition to the increase in the number of events, these will be the most severe. The increase in the maximum (supremum) water depth will be of around 8 % (17 %) for the first four areas. The Miño park and the N-120 road deserve a separate analysis since the increase in the water depth is proportionally more pronounced. Future flooding in these locations will have associated water depths more than twice that of the historical period. It should be noted that the values of the water depth reached in Miño park and the N-120 road are much lower than those of the rest of the areas considered because these locations are far from the riverbed and water only reaches them under very extreme conditions of river flow. Therefore, small increments in water depth can imply a larger increase in terms of percentage. This important increase in the farthest areas is a good indicator that future floods will be more extreme. The changes predicted for the N-120 road are especially remarkable due to their importance in relation to transport, as commented above. In this area the maximum average depth of water detected for the historical period is about 15 cm, which can cause a moderate effect on traffic, but it is expected to increase in the future to a value of about 35 cm on average. This implies that future floods in this area could affect traffic, which would have serious consequences.
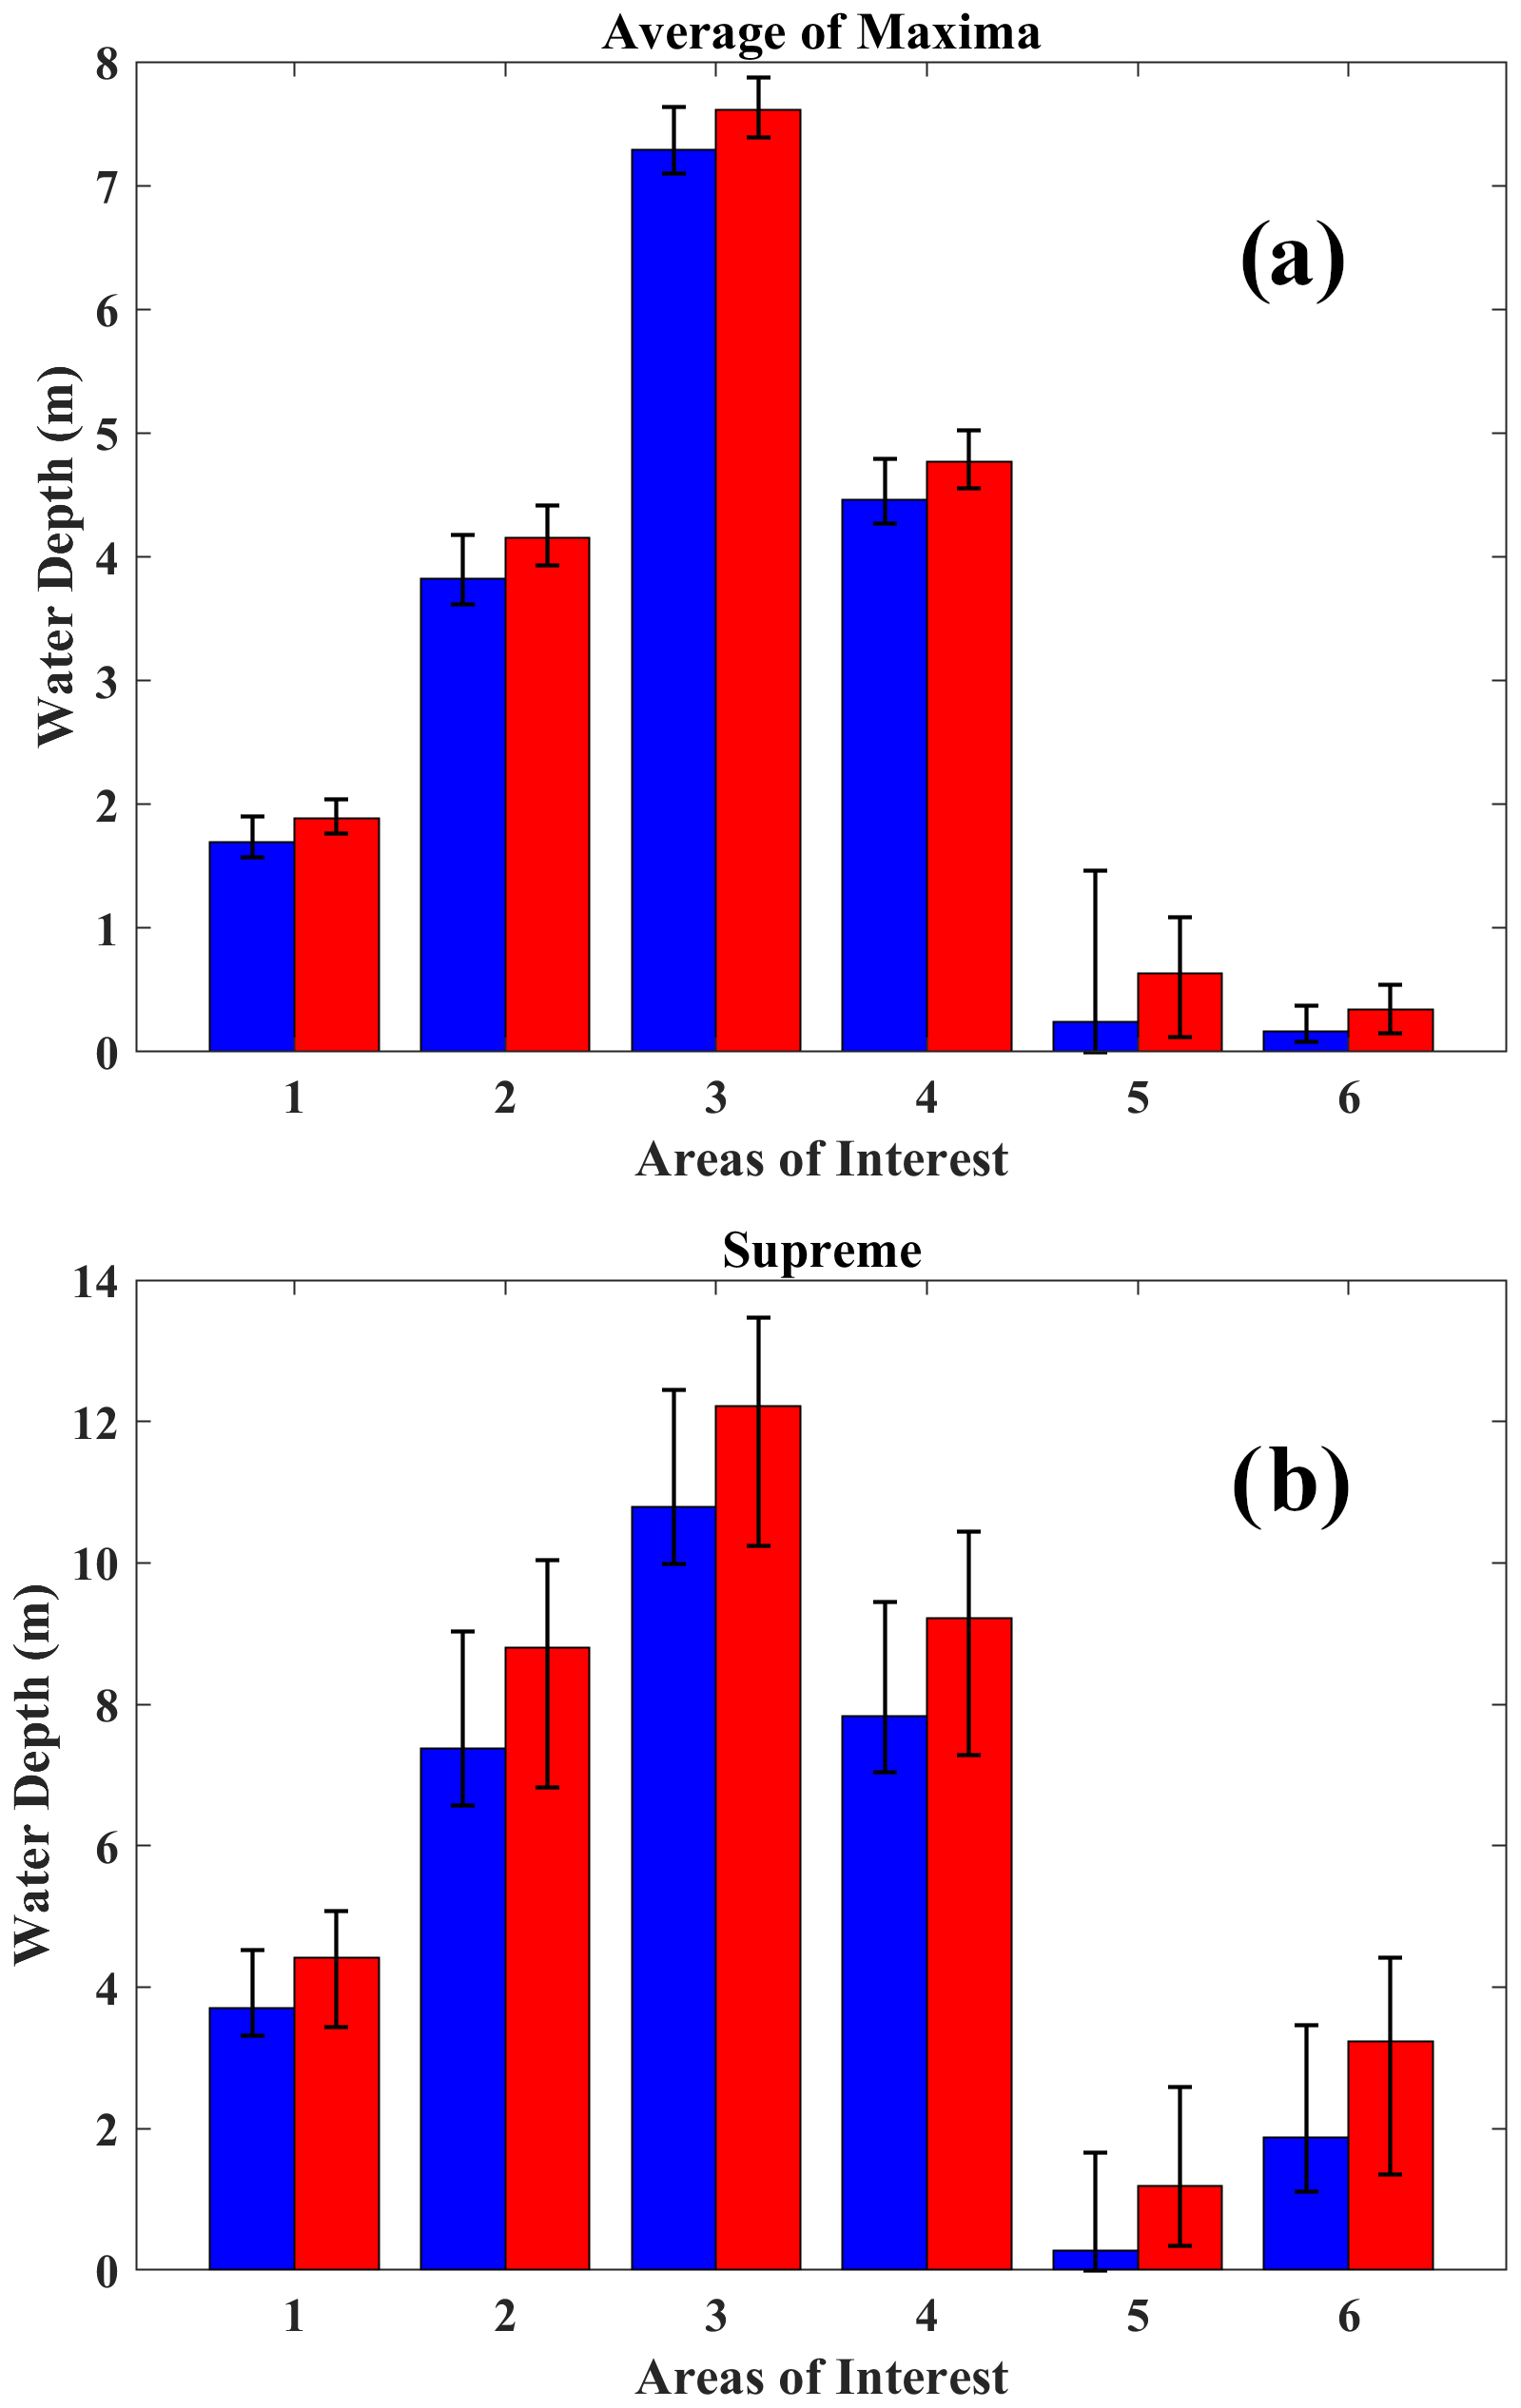
Figure 10(a) Mean of maxima and (b) supremum water depths in important areas of Ourense for the historical (blue) and future (red) periods considering the average of all models. Areas under analysis are named from 1 to 6: Chavasqueira thermal baths, Oira Park, Antena fluvial beach, Ribeira de Canedo park, Miño park, and the N-120 road. Black bars represent the multi-model deviation.
Several global studies have confirmed the increased risk of river flooding in recent decades as a consequence of changes in precipitation patterns promoted by climate change, and a worsening of floods is expected in the future. However, it is necessary to transfer this general view to regional and local areas under potential risk in order to provide detailed information that helps the respective authorities to take effective measures to reduce the impacts of floods. In this sense, a multiscale analysis like the one described in this study is essential to be able to obtain detailed flood hazard maps for the future with very high spatial resolution from RCM precipitation. In this study, the changes in the risk of floods expected in the future as a consequence of climate change for the Miño–Sil basin, and in particular over the city of Ourense, have been analyzed using precipitation data from the CORDEX project together with hydrological and hydraulic models. Results showed that changes in future precipitation patterns over the Miño–Sil river basin will lead to an increase in the frequency and intensity of extreme river flows, which can affect many localities near the river. In the particular case of Ourense, the city will suffer an increase of around 35 % in the frequency of flood events in the future. In addition, future flood events will also present higher peak flows, which indicate an increase in their intensity. The changes also affect the seasonality of floods that will be delayed in the future. In any case, in the future there will be more critical situations in many areas frequented by pedestrians and in important infrastructure, as shown by the flood hazard maps obtained with 2D hydraulic simulations. The detailed analysis carried out in the most important areas of the city affected by floods also concludes that in addition to being affected by a greater number of hazard situations in the future, these flood events will be more intense since the associated water depths will also be greater. All of these translate into negative socio-economic impact on the city.
The knowledge of the risk of floods in the most vulnerable areas of the city in the future allows the anticipation necessary to take effective measures focused on mitigating the negative effects of these events. Finally, it is important to remark that, despite the fact that the methodology presented here is applied to a target area, the Miño–Sil river basin and the city of Ourense, its implementation in other basins and cities is straightforward, taking also into account that all the models implemented are freely available, which shows the potential in future applications.
The present work has some caveats, namely that the river flow can also be dependent on other interactions. In this sense, the present study tries to represent and analyze the evolution of the natural river flow based on the expected changes in precipitation patterns, as well as the implications in terms of future floods. However, river flow is also influenced by man-made interactions, such as changes in river margins, soil characteristics, water use or hydroelectric management, among others. These factors, which are not easily predictable, can also have influence on flood evolution. In this sense, the present study can suppose a basis to following works dealing with the analysis and inclusion, to some extent, of the influence of these other interactions on flood dynamics.
Freely available data and software (precipitation data from CORDEX (https://www.euro-cordex.net/060378/index.php.en, EURO-CORDEX, 2022) and MeteoGalicia (https://www.meteogalicia.gal/observacion/estacions/estacions.action?request_locale=e, MeteoGalicia, 2022), and HEC-HMS (https://www.hec.usace.army.mil/software/hec-hms/downloads.aspx, U.S. Army Corps of Engineers, 2022) and Iber+ models (https://iberaula.es/space/54/downloads, last access: March 2022) were used for this work.
DFN and OGF designed the research and conducted the analysis. DFN, OGF and JGC developed the methodology. MdC and MGG supervised the research. DFN wrote the original draft of the manuscript. All authors were involved in the conceptualization of the work, participated in data processing, and contributed to reviewing and editing the manuscript.
The contact author has declared that none of the authors has any competing interests.
Publisher’s note: Copernicus Publications remains neutral with regard to jurisdictional claims in published maps and institutional affiliations.
The authors thank the WCRP's Working Group on Regional Climate, and the Working Group on Coupled Modelling, the former coordinating body of CORDEX and responsible panel for CMIP5. We also thank the climate modeling groups for producing and making available their models' outputs that can be downloaded at http://www.cordex.org (last access: March 2022). The authors also thank MeteoGalicia for the precipitation data provided.
The aerial pictures used in this work are courtesy of the Spanish IGN (Instituto Geográfico Nacional) and part of the PNOA (Plan Nacional de Ortografía Aérea) program.
This research has been partially supported by the European Regional Development Fund under the INTERREG-POCTEP project RISC_ML (Code: 0034_RISC_ML_6_E). This research has also been partially supported by Xunta de Galicia, Consellería de Cultura, Educación e Universidade, under Project “Programa de Consolidación e Estructuración de Unidades de Investigación Competitivas” (ED431C 2021/44).
Diego Fernández-Nóvoa was supported by Xunta de Galicia through a post-doctoral grant (ED481B-2021-108).
Orlando García-Feal was supported by Spanish “Ministerio de Universidades” and the European Union – NextGenerationEU through the “Margarita Salas” post-doctoral grant.
This paper was edited by Paolo Tarolli and reviewed by two anonymous referees.
Alderman, K., Turner, L. R., and Tong, S.: Floods and human health: a systematic review, Environ. Int., 47, 37–47, https://doi.org/10.1016/j.envint.2012.06.003, 2012.
Alfieri, L., Bisselink, B., Dottori, F., Naumann, G., de Roo, A., Salamon, P., Wyser, K., and Feyen, L.: Global projections of river flood risk in a warmer world, Earth's Future, 5, 171–182. https://doi.org/10.1002/2016EF000485, 2017.
Areu-Rangel, O. S., Cea, L., Bonasia, R., and Espinosa-Echavarria, V. J.: Impact of urban growth and changes in land use on river flood hazard in Villahermosa, Tabasco (Mexico), Water, 11, 304, https://doi.org/10.3390/w11020304, 2019.
Arnell, N. W. and Gosling, S. N.: The impacts of climate change on river flood risk at the global scale, Climatic Change, 134, 387–401, https://doi.org/10.1007/s10584-014-1084-5, 2016.
Benito, G., Machado, M. J., and Pérez González, A.: Climate change and flood sensivity in Spain, in: Global continental Changes: the context of palaeohydrology, edited by: Brarndson, J., Brown, A. G. and Gregory, K. L., Geological Society Special Publication no. 115, 85–98, Londres, https://doi.org/10.1144/GSL.SP.1996.115.01.08, 1996.
Benito, G., Díez-Herrero, A., and de Villalta, M.: Magnitude and frequency of flooding in the Tagus Basin (Central Spain) over the last millennium, Climatic Change, 58, 171–192, 2003.
Benito, G., Brázdil, R., Herget, J., and Machado, M. J.: Quantitative historical hydrology in Europe, Hydrol. Earth Syst. Sci., 19, 3517–3539, https://doi.org/10.5194/hess-19-3517-2015, 2015.
Bladé, E., Cea, L., Corestein, G., Escolano, E., Puertas, J., Vázquez-Cendón, E., Dolz, J., and Coll, A.: Iber – River modelling simulation tool, Rev. Int. Métod. Numér., 30, 1–10, https://doi.org/10.1016/j.rimni.2012.07.004, 2014.
Blöschl, G., Hall, J., Parajka, J., Perdigão, R. A. P., Merz, B., Arheimer, B., Aronica, G. T., Bilibashi, A., Bonacci, O., Borga, M., Čanjevac, I., Castellarin, A., Chirico, G. B., Claps, P., Fiala, K., Frolova, N., Gorbachova, L., Gül, A., Hannaford, J., Harrigan, S., Kireeva, M., Kiss, A., Kjeldsen, T. R., Kohnová, S., Koskela, J. J., Ledvinka, O., Macdonald, N., Mavrova-Guirguinova, M., Mediero, L., Merz, R., Molnar, P., Montanari, A., Murphy, C., Osuch, M., Ovcharuk, V., Radevski, I., Rogger, M., Salinas, J. L., Sauquet, E., Šraj, M., Szolgay, J., Viglione, A., Volpi, E., Wilson, D., Zaimi, K., and Živković, N.: Changing climate shifts timing of European floods, Science, 357, 588–590, https://doi.org/10.1126/science.aan2506#con16, 2017.
Cea, L. and Fraga, I.: Incorporating antecedent moisture conditions and intraevent variability of rainfall on flood frequency analysis in poorly gauged basins, Water Resour. Res., 54, 8774–8791, https://doi.org/10.1029/2018WR023194, 2018.
CLC: CORINE Land Cover, European Union, Copernicus Land Monitoring Service, European Environment Agency (EEA), https://land.copernicus.eu/ (last access: March 2022), 2018.
Cox, R. J., Shand, T. D., and Blacka, M. J.: Australian Rainfall and Runoff revision project 10: appropriate safety criteria for people, Water Research Laboratory, P10/S1/006, ISBN 978-085825-9454, 2010.
Cutter, S., Osman-Elasha, B., Campbell, J., Cheong, S.-M., McCormick, S., Pulwarty, R., Supratid, S., and Ziervogel, G.: Managing the risks from climate extremes at the local level. In: Managing the Risks of Extreme Events and Disasters to Advance Climate Change Adaptation, A Special Report of Working Groups I and II of the Intergovernmental Panel on Climate Change (IPCC), edited by: Field, C. B., Barros, V., Stocker, T. F., Qin, D., Dokken, D. J., Ebi, K. L., Mastrandrea, M. D., Mach, K. J., Plattner, G.-K., Allen, S. K., Tignor, M., and Midgley, P.M., Cambridge University Press, Cambridge, UK, and New York, NY, USA, 291–338, 2012.
Dankers, R. and Feyen, L.: Climate change impact on flood hazard in Europe: An assessment based on high-resolution climate simulations, J. Geophys. Res.-Atmos., 113, D19105, https://doi.org/10.1029/2007JD009719, 2008.
Davis, J., O'Grady, A. P., Dale, A., Arthington, A. H., Gell, P. A., Driver, P. D., Bond, N., Casanova, M., Finalyson, M., Watts, R. J., Capon, S. J., Nagelkerken, I., Tingley, R., Fry, B., Page, T. J., and Specht, A.: When trends intersect: The challenge of protecting freshwater ecosystems under multiple land use and hydrological intensification scenarios, Sci. Total Environ., 534, 65–78, https://doi.org/10.1016/j.scitotenv.2015.03.127, 2015.
deCastro, M., Lorenzo, N., Taboada, J. J., Sarmiento, M., Alvarez, I., and Gomez-Gesteira, M.: Influence of teleconnection patterns on precipitation variability and on river flow regimes in the Miño River basin (NW Iberian Peninsula), Clim. Res., 32, 63–73, https://doi.org/10.3354/cr032063, 2006.
Déry, S. J., Hernández-Henríquez, M. A., Burford, J. E., and Wood, E. F.: Observational evidence of an intensifying hydrological cycle in northern Canada, Geophys. Res. Lett., 36, L31402, https://doi.org/10.1029/2009GL038852, 2009.
Des, M., Fernández-Nóvoa, D., deCastro, M., Gómez-Gesteira, J. L., Sousa, M. C., and Gómez-Gesteira, M.: Modeling salinity drop in estuarine areas under extreme precipitation events within a context of climate change: Effect on bibalve mortality in Galician Rias Baixas, Sci. Total Environ., 790, 148147, https://doi.org/10.1016/j.scitotenv.2021.148147, 2021.
Di Sante, F., Coppola, F., and Giorgi, F.: Projections of river floods in Europe using EURO-CORDEX, CMIP5 and CMIP6 simulations, Int. J. Climatol., 41, 3203–3221, https://doi.org/10.1002/joc.7014, 2021.
EURO-CORDEX: Coordinated Downscaling Experiment – European Domain, World Climate Research Program (WCRP) [data set], https://www.euro-cordex.net/060378/index.php.en, last access: March 2022.
Fekete, A., Tzavella, K., and Baumhauer, R.: Spatial exposure aspects contributing to vulnerability and resilience assessments of urban critical infrastructure in a flood and blackout context, Nat. Hazards, 86, 151–176, https://doi.org/10.1007/s11069-016-2720-3, 2017.
Feldman, A. D.: Hydrologic Modeling System HEC-HMS: Technical Reference Manual, USA Army Corps of Engineers, Washington, DC, USA, Hydrologic Engineering Center, Davis, CA, USA, https://www.hec.usace.army.mil/software/hec-hms/documentation/HEC-HMS_Technical Reference Manual_(CPD-74B).pdf (last access: March 2022), 2000.
Fernández-Nóvoa, D., deCastro, M., Des, M., Costoya, X., Mendes, R., and Gómez-Gesteira, M.: Characterization of Iberian turbid plumes by means of synoptic patterns obtained through MODIS imagery, J. Sea Res., 126, 12–25, https://doi.org/10.1016/j.seares.2017.06.013, 2017.
Fernández-Nóvoa, D., García-Feal, O., González-Cao, J., de Gonzalo, C., Rodríguez-Suárez, J. A., Ruiz del Portal, C., and Gómez Gesteira, M.: MIDAS: A New Integrated Flood Early Warning System for the Miño River, Water, 12, 2319, https://doi.org/10.3390/w12092319, 2020.
Fraga, I., Cea, L., and Puertas, J.: MERLIN: a flood hazard forecasting system for coastal river reaches, Nat. Hazards, 100, 1171–1193. https://doi.org/10.3390/w12092319, 2020.
García-Feal, O., González-Cao, J., Gomez-Gesteira, M., Cea, L., Domínguez, J. M., and Formella, A.: An accelerated tool for flood modelling based on Iber, Water 10, 1459, https://doi.org/10.3390/w10101459, 2018.
Garijo, C. and Mediero, L.: Influence of climate change on flood magnitude and seasonality in the Arga River catchment in Spain, Acta Geophys., 66, 769–790, https://doi.org/10.1007/s11600-018-0143-0, 2018.
Gloor, M., Brienen, R. J. W., Galbraith, D., Feldpausch, T. R., Schöngart, J., Guyot, J.-L., Espinoza, J. C., Lloyd, J., and Phillips, O. L.: Intensification of the amazon hydrological cycle over the last two decades, Geophys. Res. Lett., 40, 1729–1733, https://doi.org/10.1002/grl.50377, 2013.
González-Cao, J., García-Feal, O., Fernández-Nóvoa, D., Domínguez-Alonso, J. M., and Gómez-Gesteira, M.: Towards an automatic early warning system of flood hazards based on precipitation forecast: the case of the Miño River (NW Spain), Nat. Hazards Earth Syst. Sci., 19, 2583–2595, https://doi.org/10.5194/nhess-19-2583-2019, 2019.
González-Cao, J., Fernández-Nóvoa, D., García-Feal, O., Figueira, J. R., Vaquero, J. M., Trigo, R. M., and Gómez-Gesteira, M.: Numerical reconstruction of historical extreme floods: The Guadiana event of 1876, J. Hydrol., 599, 126292, https://doi.org/10.1016/j.jhydrol.2021.126292, 2021.
Gouveia, N. A., Gherardi, D. F. M., and Aragao, L. E. O. C.: The Role of the Amazon River Plume on the Intensification of the Hydrological Cycle, Geophys. Res. Lett., 46, 12221–12229, https://doi.org/10.1029/2019GL084302, 2019.
Huang, S., Hattermann, F. F., Krysanova, V., Bronstert, A.: Projections of climate change impacts on river flood conditions in Germany by combining three different RCMs with a regional eco-hydrological model, Climatic Change, 116, 631–663, https://doi.org/10.1007/s10584-012-0586-2, 2013.
IPCC: Managing the Risks of Extreme Events and Disasters to Advance Climate Change Adaptation, A Special Report of Working Groups I and II of the Intergovernmental Panel on Climate Change, edited by: Field, C. B., Barros, V., Stocker, T. F., Qin, D., Dokken, D. J., Ebi, K. L., Mastrandrea, M. D., Mach, K. J., Plattner, G.-K., Allen, S. K., Tignor, M., Midgley, P. M., Cambridge University Press, Cambridge, UK, and New York, NY, USA, 582 pp., 2012.
Jacob, D., Petersen J., Eggert, B., Alias, A., Christensen, O. B., Bouwer, L. M., Braun, A., Colette, A., Déqué, M., Georgievski, G., Georgopoulou, E., Gobiet, A., Menut, L., Nikulin, G., Haensler, A., Hempelmann, N., Jones, C., Keuler, K., Kovats, S., Kröner, N., Kotlarski, S., Kriegsmann, A., Martin, E., van Meijgaard, E., Moseley, C., Pfeifer, S., Preuschmann, S., Radermacher, C., Kadtke, K., Rechid, D., Rounsevell, M., Samuelsson, P., Somot, S., Soussana, J. F., Teichmann, C., Valentini, R., Vautard, R., Weber, B., and Yiou, P.: EURO-CORDEX: new high-resolution climate change projections for European impact research, Reg. Environ. Change, 14, 563–578, 2014.
Jongman, B.: Effective adaptation to rising flood risk, Nat. Commun., 9, 1986, https://doi.org/10.1038/s41467-018-04396-1, 2018.
Jonkman, S. N.: Global perspectives on loss of human life caused by floods, Nat. Hazards, 34, 151–175, https://doi.org/10.1007/s11069-004-8891-3, 2005.
Kundzewicz, Z. W., Lugeri, N., Dankers, R., Hirabayashi, Y., Döll, P., Pińskwar, I., Dusarz, T., Hochrainer, S., and Matczak, P.: Assessing river flood risk and adaptation in Europe – review of projections for the future, Mitig. Adapt. Strat. Gl., 15, 641–656, https://doi.org/10.1007/s11027-010-9213-6, 2010.
Lavers, D. A., Allan, R. P., Wood, E. F., Villarini, G., Brayshaw, D. J., and Wade, A. J.: Winter floods in Britain are connected to atmospheric rivers, Geophys. Res. Lett., 38, L23803, https://doi.org/10.1029/2011GL049783, 2011.
Lorenzo, M. N. and Alvarez, I.: Climate change patterns in precipitation over Spain using CORDEX projections for 2021–2050, Sci. Total Environ., 723, 138024, https://doi.org/10.1016/j.scitotenv.2020.138024, 2020.
Mel, R. A., Viero, D. P., Carniello, L., and D'Alpaos, L.: Optimal floodgate operation for river flood management: The case study of Padova (Italy), J. Hydrol. Reg. Stud., 30, 100702, https://doi.org/10.1016/j.ejrh.2020.100702, 2020.
MeteoGalicia: The Regional Meteorological Agency of Galicia, MeteoGalicia [data set], https://www.meteogalicia.gal/observacion/estacions/estacions.action?request_locale=e last access: March 2022.
Munoz, S. E., Giosa, L., Therrell, M. D., Remo, J. W. F., Shen, Z., Sullivan, R. M., Wiman, C., O'Donnell, M., and Donnelly, J. P.: Climatic control of Mississippi River flood hazard amplified by river engineering, Nature, 556, 95–98, https://doi.org/10.1038/nature26145, 2018.
Noji, E. K.: The public health consequences of disasters, Prehospital and Disaster Medicine, 15, 147–157, 2000.
Ortega, J. A. and Garzón, G.: A contribution to improved flood magnitude estimation in base of palaeoflood record and climatic implications – Guadiana River (Iberian Peninsula), Nat. Hazards Earth Syst. Sci., 9, 229–239, https://doi.org/10.5194/nhess-9-229-2009, 2009.
Padulano, R., Rianna, G., Costabile, P., Costanzo, C., Del Giudice, G., Mercogliano, P.: Propagation of variability in climate projections within urban flood modelling: A multi-purpose impact analysis, J. Hydrol., 602, 126756, https://doi.org/10.1016/j.jhydrol.2021.126756, 2021.
Paprotny, D., Sebastian, A., Morales-Nápoles, O., and Jonkman, S. N.: Trends in flood losses in Europe over the past 150 years, Nat. Commun., 9, 1985, https://doi.org/10.1038/s41467-018-04253-1, 2018.
Peixoto, J. P. and Oort, A. H.: Physics of Climate, American Institute of Physics, New York, NY, 412–433, ISBN 978-0-88318-712-8, 1992.
Pereira, S., Ramos, A. M., Zêzere, J. L., Trigo, R. M., and Vaquero, J. M.: Spatial impact and triggering conditions of the exceptional hydro-geomorphological event of December 1909 in Iberia, Nat. Hazards Earth Syst. Sci., 16, 371–390, https://doi.org/10.5194/nhess-16-371-2016, 2016.
Peres, D. J., Senatore, A., Nanni, P., Cancelliere, A., Mendicino, G., and Bonaccorso, B.: Evaluation of EURO-CORDEX (Coordinated Regional Climate Downscaling Experiment for the Euro-Mediterranean area) historical simulations by high-quality observational datasets in southern Italy: insights on drought assessment, Nat. Hazards Earth Syst. Sci., 20, 3057–3082, https://doi.org/10.5194/nhess-20-3057-2020, 2020.
Perkins, S. E., Pitman, A. J., Holbrook, N. J., and McAneney, J.: Evaluation of the AR4 Climate Models' Simulated Daily Maximum Temperature, Minimum Temperature, and Precipitation over Australia Using Probability Density Functions, J. Climate, 20, 4356–4376, https://doi.org/10.1175/JCLI4253.1, 2007.
Pierce, D. W., Barnett, T. P., Santer, B. D., and Gleckler, J.: Selecting global climate models for regional climate change studies, P. Natl. Acad. Sci. USA, 106, 8441–8446, https://doi.org/10.1073/pnas.0900094106, 2009.
Portugués-Mollá, I., Bonache-Felici, X., Mateu-Bellés, J., and Marco-Segura, J.: A GIS-Based Model for the analysis of an urban flash flood and its hydro-geomorphic response. The Valencia event of 1957, J. Hydrol., 541, 582–596, https://doi.org/10.1016/j.jhydrol.2016.05.048, 2016.
Rebelo, L., Ramos, A. M., Pereira, S., and Trigo, R. M.: Meteorological Driving Mechanisms and Human Impacts of the February 1979 Extreme Hydro-Geomorphological Event in Western Iberia, Water, 10, 454, https://doi.org/10.3390/w10040454, 2018.
Scharffenberg, B., Bartles, M., Brauer, T., Fleming, M., and Karlovits, G.: Hydrologic Modeling System (HEC-HMS), User's Manual, Version 4.3, USA Army Corps of Engineers, Washington, DC, USA, https://www.hec.usace.army.mil/software/hec-hms/documentation/HEC-HMS_Users_Manual_4.3.pdf, 2018.
Schwalm, C. R., Glendon, S., and Duffy, P. B.: RCP8.5 tracks cumulative CO2 emissions, P. Natl. Acad. Sci. USA, 117, 19656–19657, https://doi.org/10.1073/pnas.2007117117, 2020.
Stoleriu, C. C., Urzica, A., and Mihu-Pintilie, A.: Improving flood risk map accuracy using high-density LiDAR data and the HEC-RAS river analysis system: A case study from north-eastern Romania, J. Flood Risk Manag., 13, e12572, https://doi.org/10.1111/jfr3.12572, 2020.
te Linde, A. H., Bubeck, P., Dekkers, J. E. C., de Moel, H., and Aerts, J. C. J. H.: Future flood risk estimates along the river Rhine, Nat. Hazards Earth Syst. Sci., 11, 459–473, https://doi.org/10.5194/nhess-11-459-2011, 2011.
Trigo, I. F.: Climatology and interannual variability of storm-tracks in the Euro-Atlantic sector: a comparison between ERA-40 and NCEP/NCAR reanalyses, Clim. Dynam., 26, 127–143, https://doi.org/10.1007/s00382-005-0065-9, 2006.
Trigo, R. M., Pozo-Vázquez, D., Osborn, T. J., Castro-Díez, Y., Gámiz-Fortis, S., and Esteban-Parra, M. J.: North Atlantic Oscillation influence on precipitation, river flow and water resources in the Iberian Peninsula, Int. J. Climatol., 24, 925–944. https://doi.org/10.1002/joc.1048, 2004.
Trigo, R. M., Varino, F., Ramos, A. M., Valente, M. A., Zêzere, J. L., Vaquero, J. M., Gouveia, C. M., and Russo, A.: The record precipitation and flood event in Iberia in December 1876: description and synoptic analysis, Front. Earth Sci., 2, 3, https://doi.org/10.3389/feart.2014.00003, 2014.
Trigo, R. M., Ramos, C., Pereira, S. S., Ramos, A. M., Zêzere, J. L., and Liberato, M. L.: The deadliest storm of the 20th century striking Portugal: Flood impacts and atmospheric circulation, J. Hydrol., 541, 597–610, https://doi.org/10.1016/j.jhydrol.2015.10.036, 2016.
U.S. Army Corps of Engineers: Hydrologic Modeling System (HEC-HMS) User's Manual, Version 4.3, Institute for Water Resources Davis: Hydrologic Engineering Center, https://www.hec.usace.army.mil/software/hec-hms/documentation/ (last access: March 2022), 2018.
U.S. Army Corps of Engineers: HEC-HMS, U.S. Army Corps of Engineers [data set], https://www.hec.usace.army.mil/software/hec-hms/downloads.aspx, last access: March 2022.
Wallemacq, P., House, R., Below, R., and McLean, D.: Economic Losses, Poverty & Disasters: 1998–2017; Centre for Research on the Epidemiology of Disasters (CRED); United Nations Officce for Disaster Risk Reduction (UNISDR), Brussels, Belgium, https://www.undrr.org/publication/economic-losses-poverty-disasters-1998-2017 (last access: March 2022), 2018.
Zêzere, J. L., Pereira, S., Tavares, A. O., Bateira, C., Trigo, R. M., Quaresma, I., Santos, P. P., Santos, M., and Verde, J.: DISASTER: a GIS database on hydro-geomorphologic disasters in Portugal, N. Hazards, 72, 503–532, https://doi.org/10.1007/s11069-013-1018-y, 2014.
Zhu, Y., Lin, Z., Zhao, Y., Li, H., He, F., Zhai, J., Wang, L., and Wang, Q.: Flood simulations and uncertainty analysis for the Pearl River basin using the coupled land surface and hydrological model system, Water, 9, 391, https://doi.org/10.3390/w9060391, 2017.