the Creative Commons Attribution 4.0 License.
the Creative Commons Attribution 4.0 License.
 | 06 Dec 2022
Droughts in Germany: performance of regional climate models in reproducing observed characteristics
Benjamin Fersch
Harald Kunstmann
Droughts are among the most relevant natural disasters related to climate change. We evaluated different regional climate model outputs and their ability to reproduce observed drought indices in Germany and its near surroundings between 1980–2009. Both outputs of an ensemble of six EURO-CORDEX models of 12.5 km grid resolution and outputs from a high-resolution (5 km) Weather Research and Forecasting (WRF) run were employed. The latter model was especially tailored for the study region regarding the physics configuration. We investigated drought-related variables and derived the 3-month standardized precipitation evapotranspiration index (SPEI-3) to account for meteorological droughts. Based on that, we analyzed correlations, the 2003 event, trends and drought characteristics (frequency, duration and severity) and compared the results to E-OBS. Methods used include Taylor diagrams, the Mann–Kendall trend test and the spatial efficiency (SPAEF) metric to account for spatial agreement of patterns. Averaged over the domain, meteorological droughts were found to occur approximately 16 times in the study period with an average duration of 3.1 months and average severity of 1.47 SPEI units. WRF's resolution and setup were shown to be less important for the reproduction of the single drought event and overall drought characteristics. Depending on the specific goals of drought analyses, computation resources could therefore be saved, since a coarser resolution can provide similar results. Benefits of WRF were found in the correlation analysis. The greatest benefits were identified in the trend analysis: only WRF was able to reproduce the observed negative SPEI trends to a fairly high spatial accuracy, while the other regional climate models (RCMs) completely failed in this regard. This was mainly due to the WRF model settings, highlighting the importance of appropriate model configuration tailored to the target region. Our findings are especially relevant in the context of climate change studies, where the appropriate reproduction of trends is of high importance.
- Article
(4019 KB) - Full-text XML
-
Supplement
(2547 KB) - BibTeX
- EndNote


In the recent past, Germany and other parts of central Europe have been hit by dryness in the summer periods. Especially the severe drought events in 2015 (e.g., Hoy et al., 2017; Ionita et al., 2017; Laaha et al., 2017), 2018 (e.g., Bastos et al., 2020; Thompson et al., 2020) and 2019 (e.g., Boergens et al., 2020; Hari et al., 2020; Ziernicka-Wojtaszek, 2021), which occurred in combination with heat waves, have contributed to this. In addition, 2020 was also categorized as too dry, mainly in the spring and summer months (DWD, 2020; Umweltbundesamt, 2021). These events have contributed to increased awareness of climate extreme events in the affected regions.
There are studies that suggest an increasing trend (e.g., Dai, 2011, 2013; Sheffield et al., 2012; Trnka et al., 2016), a decreasing trend (e.g., Spinoni et al., 2014) and no trend (e.g., Spinoni et al., 2019; Oikonomou et al., 2020; Vicente-Serrano et al., 2021) for droughts for the past decades in the central European region. The discrepancies in the findings are due to the complex characteristics and several different ways of defining (Mishra and Singh, 2010; Lloyd-Hughes, 2014; Crausbay et al., 2017) and quantifying (Wilhite and Pulwarty, 2007; Vicente-Serrano, 2016) a drought event. Moreover, different analysis periods (Hannaford et al., 2013) and a broad range of usable meteorological variables (Vicente-Serrano et al., 2021) lead to uncertainty in drought trends. Economically, however, there has been a clear increase in the costs caused by drought events in the past in the EU (EEA, 2010).
In this study, we conduct a drought analysis for the time period 1980–2009 in Germany and its near surroundings by employing an ensemble of regional climate models (RCMs). We are constrained to that time period because of the data availability in the RCM runs.
For Europe, the availability and reliability of RCM simulations have evolved rapidly in the last few years (Štepánek et al., 2016). Concerted downscaling projects and initiatives like PRUDENCE (Christensen and Christensen, 2007), ENSEMBLES (van der Linden and Mitchell, 2009) and most recent CORDEX (Giorgi et al., 2009) have contributed to this development. Several studies using drought-related data from CORDEX outputs have been conducted in the past for different parts of the world, the majority with focus on future development of drought under climate change and some with focus on past events. For the EURO-CORDEX domain, there have been studies dealing with the evaluation of the EURO-CORDEX RCM's capability in historical drought reproduction in Italy (Peres et al., 2020); the comparison and evaluation of drought indices in Poland (Meresa et al., 2016); and the future development of drought conditions under different scenarios for the Czech Republic (Štepánek et al., 2016; Potopová et al., 2018), Romania (Dascălu et al., 2016), Poland (Meresa et al., 2016) and all of Europe (Spinoni et al., 2018). Regarding the rest of the globe, studies have been carried out focusing on the evaluation of the CORDEX RCM's ability in simulating historical droughts and their characteristics over West Africa (Diasso and Abiodun, 2017), East Asia (Um et al., 2017) and Bangladesh (Chowdhury and Jahan, 2018). Furthermore, there have been analyses of climate change impacts on droughts and their characteristics in the future for the Mediterranean region (Marcos-Garcia et al., 2017), India (Das and Umamahesh, 2018), Iran (Senatore et al., 2019) and Vietnam (Nguyen-Ngoc-Bich et al., 2021) as well as for the entire globe (Spinoni et al., 2020). In these studies, different drought indices have been used to identify droughts and describe their characteristics. Among the most common ones are the standardized precipitation index (SPI) and standardized precipitation evapotranspiration index (SPEI) (Meresa et al., 2016; Diasso and Abiodun, 2017; Marcos-Garcia et al., 2017; Um et al., 2017; Das and Umamahesh, 2018; Potopová et al., 2018; Spinoni et al., 2018, 2020), the Palmer drought severity index (PDSI) (Dascălu et al., 2016; Chowdhury and Jahan, 2018; Nguyen-Ngoc-Bich et al., 2021), and the self-calibrated PDSI (scPDSI) (Senatore et al., 2019). Additionally, some self-developed or less commonly used indices have been applied: the standardized runoff index (SRI) (Meresa et al., 2016), the standardized flow index (SFI) (Marcos-Garcia et al., 2017) and the reconnaissance drought indicator (RDI) (Spinoni et al., 2018).
So far, according to our knowledge, there has been no study that presents an evaluation of the capability of EURO-CORDEX RCMs to reproduce droughts and their characteristics with focus over Germany, which we therefore would like to address in this study. There are a large number of studies dealing with the performance of RCMs in terms of the correct reproduction of meteorological variables. Emphasis is often on temperature and precipitation, and effects of different model resolutions and physics parameterizations are investigated. There are different findings concerning the effects of increased model resolution on precipitation, the most important variable for droughts. They strongly depend on the season, precipitation amount and region. Regarding extreme events and summer precipitation, especially in complex terrain, higher model resolution usually seems to be beneficial (e.g., Rauscher et al., 2010; Tripathi and Dominguez, 2013; Lee and Hong, 2014; Olsson et al., 2015; Torma et al., 2015; Prein et al., 2016; Rauscher et al., 2016; Dieng et al., 2017; Vichot-Llano et al., 2021). In terms of winter precipitation and annual mean patterns, there are often no distinct differences between coarse and fine resolutions (e.g., Rauscher et al., 2010; Tripathi and Dominguez, 2013; Kotlarski et al., 2014; Casanueva et al., 2016; Dieng et al., 2017; Vichot-Llano et al., 2021). Compared to precipitation, there are fewer studies examining the effects of increased model resolution on simulated air temperature, the second most important variable for droughts. Vautard et al. (2013) employed an ERA-Interim-driven EURO-CORDEX ensemble of 12.5 and 50 km resolution for heat wave analysis over Europe between 1989 and 2008. Increased resolution was shown to induce 90th-percentile temperature warming and cooling for some models. It also led to reduced biases in heat wave reproduction. Zeng et al. (2016) and Vichot-Llano et al. (2021) found that temperature fields are better reproduced with higher resolution, while Di Luca et al. (2013) concluded a low potential for added value of increased resolution. They saw the highest added value mostly in regions with important surface forcing like complex topography or land–water contrasts.
Every model simulation requires a suitable setup regarding the domain configuration and physical parameterizations for the selected target region (e.g., Stoelinga et al., 2003; Kumar et al., 2010). To find appropriate settings, usually the skill of different parameterizations for temperature and precipitation is evaluated with respect to observations. Vautard et al. (2013) also analyzed possible sources of model spread. The simulation of hot temperatures was shown to be primarily sensitive to convection and microphysics schemes, which has effects on the incoming energy and the Bowen ratio. They further found that a large part of the model spread can be attributed to parameterizations and that parameterizations can have different impacts depending on the spatial resolution. Mooney et al. (2013) tested the effects of 12 combinations of physical parameterizations in the Weather Research and Forecasting (WRF) model over Europe on surface temperature, precipitation and mean sea level pressure. They utilized two longwave radiation schemes, two land surface models (LSMs), two microphysics schemes and two planetary boundary layer (PBL) schemes. They found that temperature shows the greatest sensitivity to the LSMs, some sensitivity to the radiation schemes in winter, and little sensitivity to the microphysics and PBL schemes. Precipitation showed sensitivity to the LSM especially in summer. This is also valid for the radiation and the microphysics schemes but to a lesser extent. There was only negligible sensitivity to the PBL schemes. They concluded there was a strong dependence on the region and season of the optimal parameterization combination. Kotlarski et al. (2014) emphasize the high importance of model configurations by describing that, in the case of temperature, the “bias spread across different configurations of one individual model can be of a similar magnitude as the spread across different models”.
In this study, we accordingly investigate the effects of increased model resolution and model settings on the reproduction of a drought index and thereby fill another research gap. For this reason, we analyze a variety of RCM simulations, i.e., a 5 km three-domain WRF run and an ensemble of six EURO-CORDEX realizations at 12.5 km horizontal resolution. Ideally, computational resources could be saved if RCMs with coarser grids were able to yield equivalent performance to their better-resolved counterparts. The WRF model setup was thoroughly determined for Germany. The physics combinations were chosen so that the combined biases of air temperature and precipitation are as small as possible (Wagner and Kunstmann, 2016; Warscher et al., 2019), while the configurations of the EURO-CORDEX RCMs were set up for the entire EUR-11 domain of CORDEX (Giorgi et al., 2009). Since the WRF run was concerted at the study region and has a higher resolution, one may expect better performance regarding the reproduction of air temperature and precipitation and thus likely also of drought indices compared to the EURO-CORDEX runs. To attribute possible better WRF performances to resolution or setting effects, we are able to use the second domain of the WRF run, which has 15 km resolution; hence it is slightly coarser than the EURO-CORDEX simulations. Thus, the main objectives of the study are as follows:
-
The first objective is to evaluate the performance of regional climate models in reproducing the SPEI drought index and related drought characteristics employing a six-member EURO-CORDEX ensemble and a high-resolution WRF run. The EURO-CORDEX RCMs and WRF differ in resolution (12.5 km vs. 5 km), while the model physics configurations differ among every single RCM.
-
The second objective is to gain insights into the meteorological drought course for Germany and its near surroundings between 1980–2009.
Therefore, the results are evaluated and compared to observations. Specifically, we analyze precipitation and temperature reproduction, SPEI correlations and trends, related drought characteristics, and additionally the drought event in summer 2003. The characteristics include frequency, duration and severity and are based on SPEI time series.
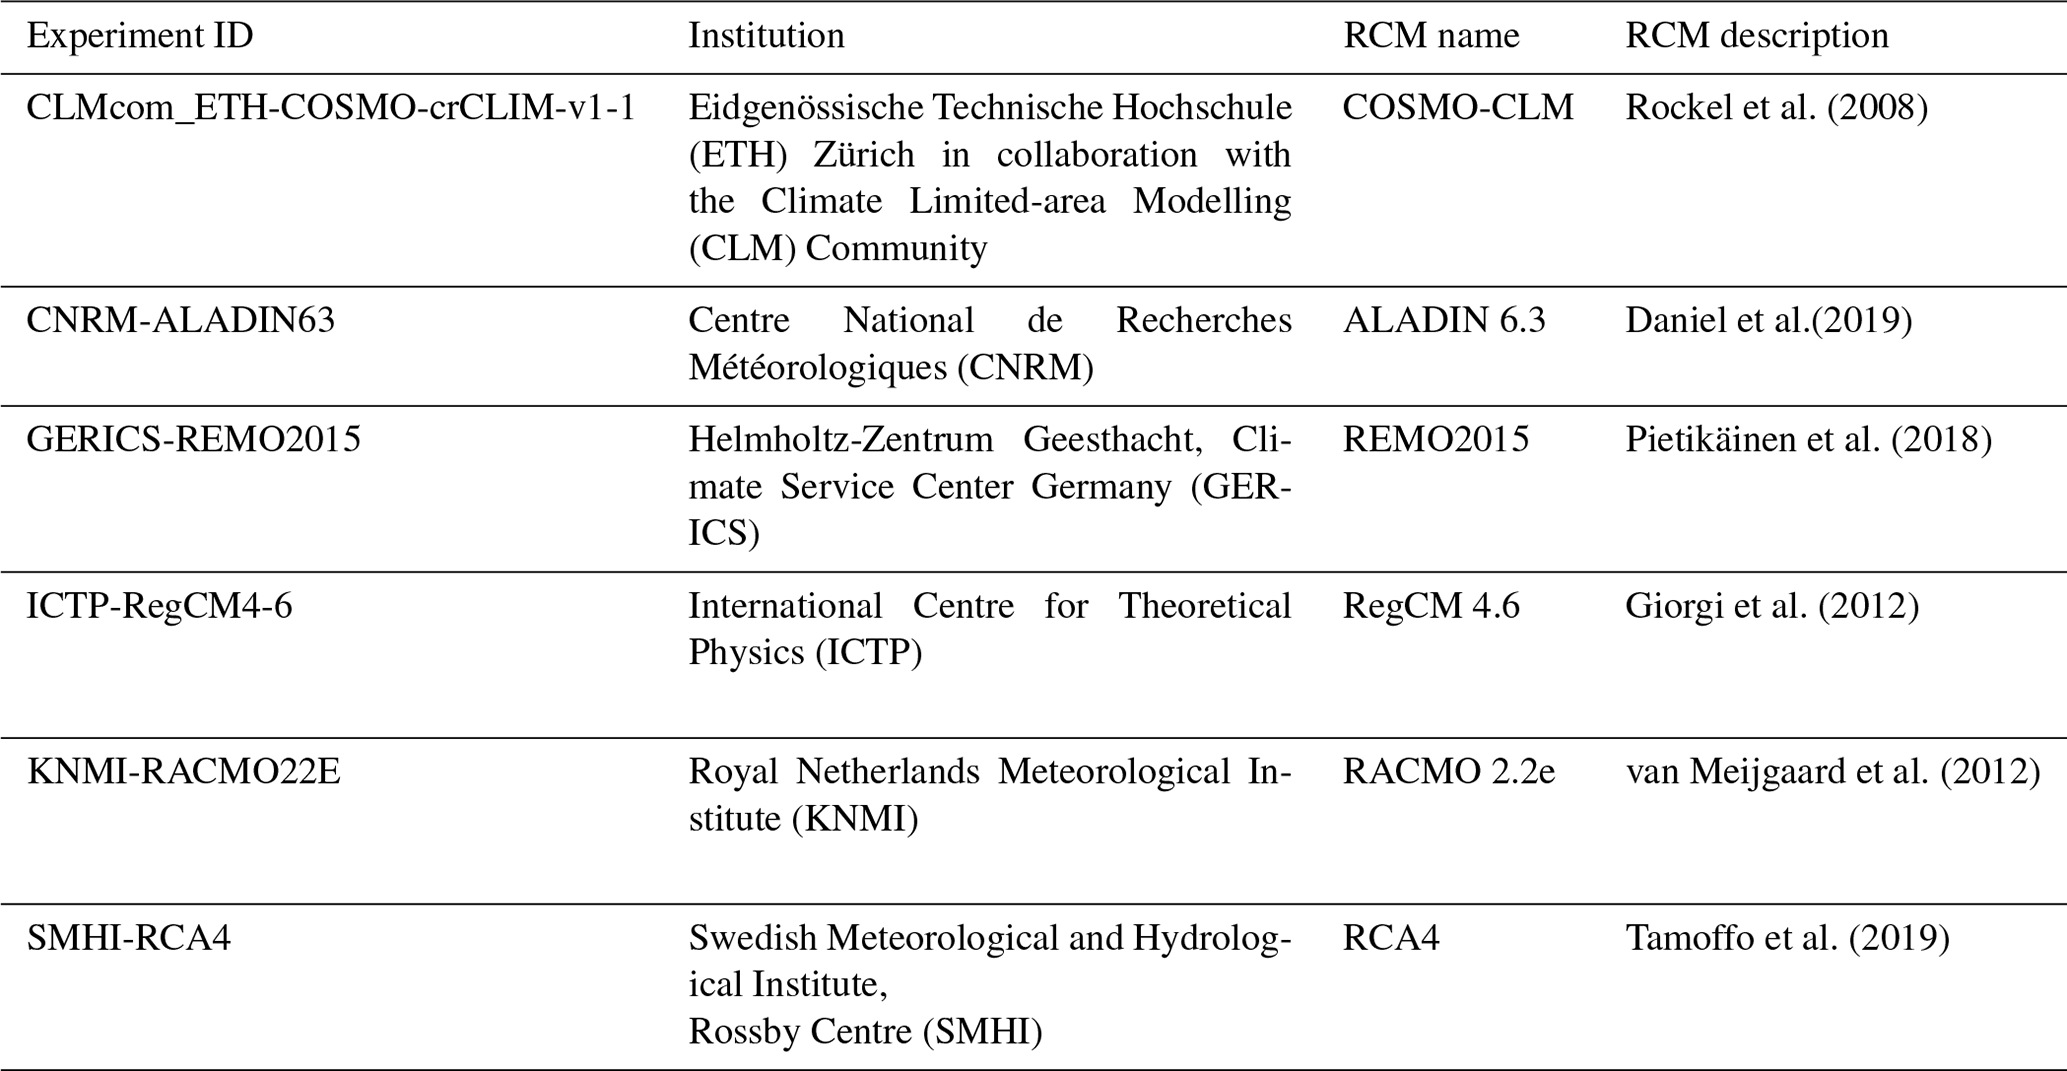
2.1 EURO-CORDEX model simulation data
We employed an ensemble of six EURO-CORDEX RCM simulations. The experiments were performed with 0.11∘ (≈ 12.5 km) horizontal grid resolution, covering the EUR-11 CORDEX domain. Data from the following RCMs were used: COSMO-CLM, ALADIN 6.3 (hereafter referred to as ALADIN in the text), REMO2015 (REMO), RegCM 4.6 (RegCM), RACMO 2.2e (RACMO) and RCA4 (see Table 1 for more information). At the time of selection, these were all available model runs that cover the study period 1980–2009 and contain the relevant meteorological variables needed for the analysis. All runs obtained their boundary conditions from the global ERA-Interim reanalysis (Dee et al., 2011).
2.2 WRF simulation data
Moreover, we incorporated simulation results from Warscher et al. (2019), who conducted simulations with the WRF model (Skamarock et al., 2008). These WRF simulation results are based on a comprehensive search and final identification of optimal model physics and parameterization configuration (Wagner and Kunstmann, 2016). They applied a three-domain nested approach with a parent–grid ratio of 1:3 and a horizontal grid resolution of 5 km for the innermost domain, which frames Germany and its near surroundings. The data used in this study are from their ERA-Interim-forced reanalysis run and cover the period 1980–2009. Table 2 gives an overview of the physics schemes used in this run as well as in the EURO-CORDEX runs and further information. For more details regarding the model setup, see Wagner and Kunstmann (2016) and Warscher et al. (2019). As mentioned above, we also used the data from the second domain, which are of 15 km grid spacing. For this reason, we will refer to WRF@5km and WRF@15km from here on to distinguish between the two domains.
Table 2Overview of the number of vertical levels and model physics schemes.

2.3 Observation data
As reference we used the gridded observational data set from E-OBS (Haylock et al., 2008), version 23.1e, with 0.1∘ (≈ 11.1 km) horizontal grid resolution. The data contain daily values of the relevant meteorological variables and cover the entire European land area.
We focused on Germany and its near surroundings as the study region from 47 to 55∘ N and 6 to 15∘ E. The WRF and E-OBS data sets were regridded using bilinear interpolation to adjust them to the horizontal grid resolution of the EURO-CORDEX RCMs.
3.1 Analysis of precipitation and temperature reproduction
Precipitation and temperature are the main meteorological variables determining droughts. Thus, prior to the drought index calculation, we analyzed these variables in every RCM and compared them to the reference using Taylor diagrams (Taylor, 2001). They provide a concise visual statistical summary regarding the agreement between patterns in terms of their correlation, their root-mean-square difference, and the ratio of their variances or standard deviations (Taylor, 2001). Moreover, we calculated the bias values from the spatially and temporally averaged monthly values of the three variables.
3.2 Drought index: SPEI
There are a variety of drought indices for analyzing different drought characteristics. For the proper selection of a drought index, its main features like the calculation procedure, input variables, advantages and weaknesses need to be considered (García-Valdecasas Ojeda et al., 2017). The standardized precipitation index (SPI), developed by McKee et al. (1993), is one of the most widely used drought indices and recommended by the World Meteorological Organization (WMO) because of its simplicity, robustness, easy interpretation and especially its multiscalar character. It is comparable across different regions and climates and therefore very suitable for drought detection around the globe (García-Valdecasas Ojeda et al., 2017). Since precipitation is the only input variable for the calculation, a high variability is assumed, while other variables like temperature, surface wind and potential evapotranspiration (PET) are considered temporally stationary. Thus, the SPI does not define droughts based on the water balance (Diasso and Abiodun, 2017).
The standardized precipitation evapotranspiration index (SPEI), introduced by Vicente-Serrano et al. (2010), overcomes this issue. Because of its dependence on the water balance (precipitation − PET), it incorporates the effects of hot temperatures. That is why it is considered very useful in terms of global warming (Diasso and Abiodun, 2017; Spinoni et al., 2018). In this context it should be emphasized that the SPEI (as well as SPI) has limitations regarding its practical relevance for climate change, when the focus is primarily on impacts. Apart from an implied lack of soil moisture (agricultural drought) and decline in streamflow, groundwater, reservoir and lake levels (hydrological drought) (Wilhite and Glantz, 1985), which completely rely on the degree of the dry anomaly over a certain time period, impacts going beyond this are not addressed. Due to the complete reliance on the dry anomaly, the effects of a warming world (e.g., longer vegetation period and thus modified transpiration behavior) cannot be included either or can be considered only indirectly. To date, the SPEI has been applied in a large number of studies as well (García-Valdecasas Ojeda et al., 2017). We also decided to use the SPEI for this study. In general, the patterns between the SPI and SPEI are usually similar, and we want to take account of the temperature effect, since droughts in the study region predominantly occur in the summer months.
Similarly to studies like Diasso and Abiodun (2017), García-Valdecasas Ojeda et al. (2017), and Potopová et al. (2018), the SPEI R package (Beguería and Vicente-Serrano, 2013) was used for the index calculation. As mentioned above, the SPEI needs PET as an input variable additionally to precipitation. PET was calculated based on the modified Hargreaves equation (Droogers and Allen, 2002). The method corrects the PET calculated by the Hargreaves equation by using the monthly rainfall amount as a proxy for insolation and applying the hypothesis that this amount can change the humidity levels (Vicente-Serrano et al., 2014). By using this method, the PET values are similar to those obtained from the Penman–Monteith method (Allen et al., 2006). The Penman–Monteith method is adopted and recommended by the Food and Agriculture Organization to approximate PET (García-Valdecasas Ojeda et al., 2017), but the variables required for this method are only included in a limited number of CORDEX simulations. The modified Hargreaves method only requires the maximum and minimum temperatures, so it is applicable to all data sets used in this study.
For the SPEI calculation, the monthly values of the water balance are used. The obtained time series are fitted to a log-logistic distribution. Then the quantiles of the distributions are transformed into standard normal variables. This ensures comparability of the index values across different regions. Negative values indicate drier-than-median and positive values wetter-than-median conditions (Meresa et al., 2016). To categorize droughts, we follow the most popular classification scheme of McKee et al. (1993) (Table 3).
Table 3Drought classification using SPI/SPEI according to McKee et al. (1993).
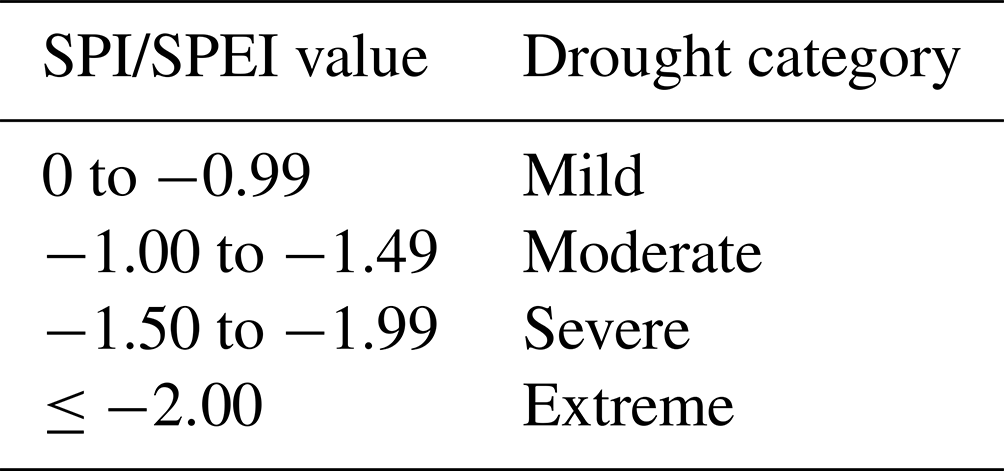
Different aggregation scales for the SPI/SPEI calculation are usually used to define the type of drought. Short timescales of up to 3 months are used for meteorological droughts, medium scales of around 6 months for agricultural droughts, and longer timescales of 12 months or more for hydrological droughts (Wilhite and Glantz, 1985; Heim, 2002; Spinoni et al., 2020). We selected the 3-month aggregation scale to focus on meteorological droughts. For this reason we will refer from here on to SPEI-3.
SPEI-3 time series were computed for each EURO-CORDEX simulation, the WRF output and the E-OBS reference data set for every grid cell. Correlation analysis between the RCM and reference time series has been conducted as well as a comparison of the index values for the drought event in 2003.
Several metrics are available to assess the spatial agreement between patterns of single RCMs and the reference. Here we used the spatial efficiency (SPAEF) metric (Demirel et al., 2018; Koch et al., 2018). The SPAEF is a multiple-component performance metric developed for the comparison of spatial patterns. While it was originally intended for hydrological studies, Koch et al. (2018) state that it is suitable and beneficial for other modeling disciplines too. The SPAEF is calculated as
with the following three components: α as the Pearson correlation coefficient between observed (obs) and simulated (sim) patterns;
as the fraction of the coefficient of variation representing spatial variability; and
as the overlap between the histograms of the observed (K) and simulated patterns (L), both containing the same number n of bins. For the calculation of γ, the z score of the patterns is used. This enables comparison of two variables with different units. For both histograms of K and L, the number of values in each bin i is counted. Then for each bin the lower (minimum) number of Ki or Li is picked, which indicates the number of shared values in the same bin. Afterwards these numbers are summed up and divided by the total number n of values in K or L. The SPAEF has a predefined range between −∞ and 1, where 1 corresponds to the ideal agreement between two patterns. The three components are independent of each other and usually equally weighted, so they complement each other in a useful way and provide holistic pattern information. In this way, global characteristics like distribution and variability instead of exact values at the grid scale are assessed (Koch et al., 2018). For more information regarding the SPAEF, see Demirel et al. (2018) and Koch et al. (2018). The metric was used to evaluate spatial agreement for the 2003 event and for the drought characteristics.
3.3 Drought trend analysis
To investigate the temporal characteristics of droughts, we used the non-parametric Mann–Kendall trend test approach (Mann, 1945; Kendall, 1975) to detect significant monotonic trends in the index time series at a significance level of 0.05. This approach is based on the correlation between the ranks of a time series and their time order and is commonly used in time series of environmental, climatological or hydrological data (Hamed, 2008; Alhaji et al., 2018). We only considered independent, non-overlapping data.
For a time series , the Mann–Kendall test statistic S is given by
with
where sign represents an indicator function, n the number of data points, and Ri and Rj their respective ranks. A positive S statistic indicates an increasing trend; a negative one indicates a decreasing trend.
3.4 Analysis of drought characteristics
Drought events and their characteristics have been defined in several ways in the past (Um et al., 2017). Using the SPEI time series values on the grid point scale, we detected drought events and their characteristics (frequency, duration and severity) by applying the run theory proposed by Yevjevich (1967), which has been widely employed in drought-related studies (e.g., Spinoni et al., 2014; Marcos-Garcia et al., 2017; Peres et al., 2020; Spinoni et al., 2020). A drought event starts when the SPEI value falls below −1 for at least 2 consecutive months. The event ends when the index value returns to positive values. Drought frequency then describes the number of drought events in a given time period. Drought duration corresponds to the number of months between the start and end of an event (last month not included). The drought severity of an event equals the sum, in absolute values, of all the monthly SPEI values during the event (Spinoni et al., 2020).
We determined the drought frequency for every grid cell for the whole study period 1980–2009. Drought frequencies between the single grid cells differ, and since drought duration and severity refer to every single drought event, we calculated the mean values for duration and severity for every grid cell to enable a comparison between the single data sets.
4.1 Precipitation and temperature
Figure 1 presents the Taylor diagrams of the grid-cell-based monthly values of precipitation and maximum (Tmax) and minimum (Tmin) temperature. We also added the information of the WRF@15km data set to check if potential WRF benefits are related to increased resolution or model settings. Regarding precipitation, the WRF@5km run has the highest correlation with the reference: it is the only one crossing the 0.75 threshold with a relatively small RMSE score, resulting in the best overall performance compared to the other RCMs. However, the lowest RMSE is found for RACMO, which also holds for the standard deviation, while WRF@5km, ALADIN and RCA4 deviate most. Interestingly, the WRF@15km run has the lowest correlation and highest RMSE values, while its standard deviation is among the closest to the observational one. This means that the increased resolution of WRF@5km leads to improvements in correlation and RMSE scores, but the temporal variability is better captured in the coarser resolution. The Tmax Taylor diagram clearly shows a benefit of both WRF runs, so we conclude the model setup is the determining factor for the better performance compared to the EURO-CORDEX RCMs. This is underlined by the fact that the WRF@15km run has a higher correlation, has a lower RMSE and matches the reference standard deviation compared to its 5 km counterpart. Only the two WRF runs reach correlation coefficients above 0.99. Here, all EURO-CORDEX RCMs perform on a similar level, which is high. They all reach correlation values above 0.95 and RMSEs below 5. RACMO stands out in this case because it has the most accurate standard deviation ratio with regard to the reference. In the Tmin Taylor diagram it is obvious that the 5 km WRF run performs best. It has the highest correlation value (above 0.98) and the lowest RMSE, and it is close to the reference standard deviation. Only the 15 km WRF run is closer in this regard. The 15 km WRF run and the EURO-CORDEX perform on a similar level. Similarly to Tmax, the main difference is the standard deviation ratio when compared to the reference. In this regard, RACMO has the biggest distance. For Tmin it seems the model setup of WRF leads to benefits compared to the other RCMs and that the increased resolution brings additional benefit.
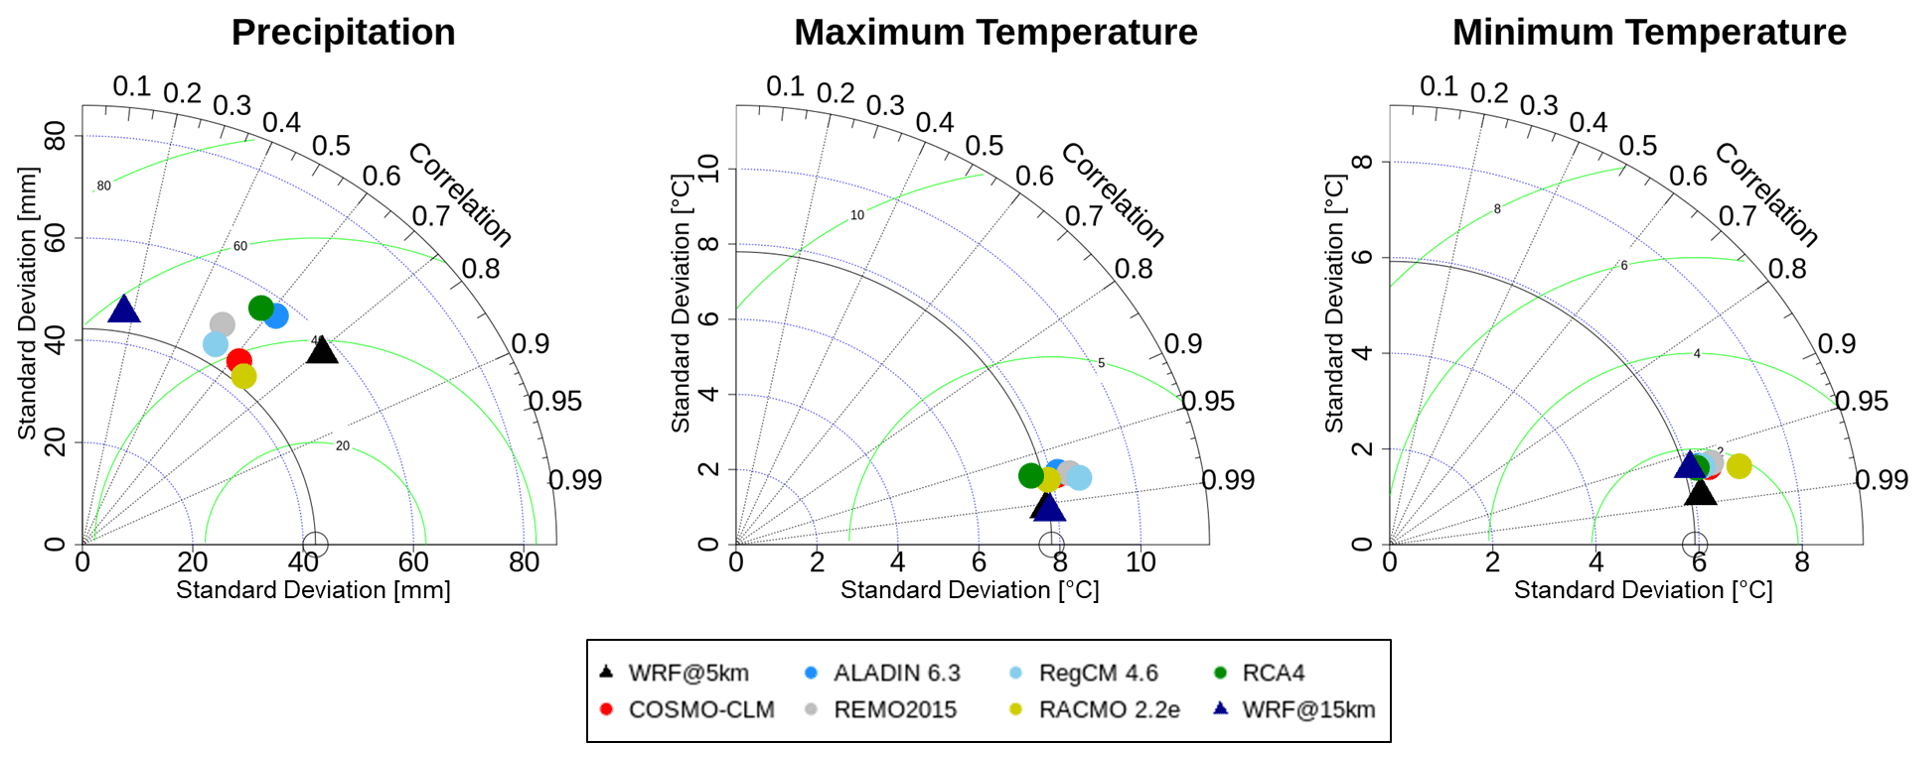
Figure 1Taylor diagrams comparing the model performances in reproducing the monthly values of the meteorological variables in relation to the E-OBS reference data for the study period 1980–2009 and the whole study area.
From the Taylor diagrams we can conclude that especially Tmax and Tmin are very well captured by all RCMs. There are benefits of increased resolution for precipitation and for Tmin, while for Tmax mainly the model setup of the WRF runs is beneficial. The WRF@5km run performs relatively well for all three variables.
Regarding the resolution effect on the precipitation reproduction, our results are in accordance with findings from, e.g., Tripathi and Dominguez (2013) and Prein et al. (2016), who found that higher resolution leads to better reproduction. Our results are in contrast to findings from, e.g., Rauscher et al. (2010), Casanueva et al. (2016) and Dieng et al. (2017), who could not identify a benefit of increased resolution both for a general pattern and on an annual mean basis. It must be noted though, that in all the studies mentioned, the differences between the two resolutions analyzed were much bigger than in our case, whereas both resolutions (12.5 and 5 km) are usually already considered high resolution in the literature. In the studies mentioned, there is always a resolution of 50 km compared to 25 km (Rauscher et al., 2010), 12.5 km (Casanueva et al., 2016; Prein et al., 2016; Dieng et al., 2017) and 10 km (Tripathi and Dominguez, 2013). From our results, we obtain that, if existent, the benefits of a resolution increase from 12.5 to 5 km are less distinct. One must also keep in mind that the studies were conducted in different regions, which certainly plays a role too, and that often different resolutions of the same RCM were compared. The results from this section further show that RCMs with reasonable performance in simulating one or both temperature variables do not necessarily reproduce precipitation equally well, which is in accordance to findings from Peres et al. (2020). They further found that COSMO-CLM and RACMO showed good performance in reproducing precipitation, while RCA4 and WRF struggled the most. Regarding mean temperature, COSMO-CLM and REMO showed the best performances and RCA4, ALADIN and RACMO the worst. This could in part be confirmed by the results here for the precipitation reproduction: COSMO-CLM and RACMO perform relatively well, while RCA4 showed a relatively poor performance. It must be noted that Peres et al. (2020) analyzed the mean temperature instead of Tmax and Tmin and that they looked at different temporal scales. Moreover, they employed EURO-CORDEX RCMs with different general circulation models (GCMs) as forcing, while here all RCMs had the same ERA-Interim forcing.
Table 4 shows the bias values from the spatially and temporally averaged monthly values of the three variables compared to E-OBS. The highest spread among the models is found for the precipitation, which was expectable due to the higher variability in this variable. COSMO-CLM is the only RCM with a dry bias and also holds the lowest mean bias value (−1.5 mm), while RCA4 has by far the highest bias value (32 mm). The WRF@5km bias value (16.1 mm) is almost twice as high as that of its 15 km counterpart (8.3 mm). For Tmax the highest mean bias value is held by RCA4 (−1.8 ∘C) and the lowest by REMO (0.2 ∘C). ALADIN, REMO and RegCM show a warm bias, while the other RCMs have a cold bias. Regarding Tmin, RACMO is the RCM with the highest mean bias value (−1.7 ∘C) and WRF@5km the one with the lowest (−0.2 ∘C). COSMO-CLM, ALADIN, REMO and RegCM show warm bias and the other RCMs a cold bias.
Table 4Spatially and temporally averaged bias values of the monthly values of the meteorological variables.

4.2 SPEI time series correlation
Figure 2 shows the grid-cell-based Pearson correlation coefficients of the SPEI-3 time series between the E-OBS reference data and the single RCMs along with the domain mean values. Here we show both the WRF@5km and the WRF@15km run. It is evident that the two WRF runs have higher correlation values all over the domain compared to the EURO-CORDEX RCMs. This could be expected from the results in the Taylor diagrams (Fig. 1) and is further corroborated by the domain mean values. Only the WRF runs cross the 0.7 threshold, while none of the other RCMs even exceed the 0.6 threshold. RegCM holds the lowest mean correlation value (0.48). Generally, there is a similarity in the spatial patterns of the EURO-CORDEX RCMs: most of the domains are covered by values between 0.4 and 0.6. Especially in REMO and RACMO, there are areas in the western part of the domain with higher values (0.6–0.8). Interestingly, this is also the case in the WRF@5km domain, here with values ranging between 0.8 and 1. It is clearly visible that the WRF@15km run outperforms the WRF@5km run and thereby has the overall best performance. Our findings indicate that the WRF benefits can be attributed to the WRF model settings and not to the increased resolution. The higher agreement of the WRF@15km run with E-OBS may be due to the relatively coarse resolution of E-OBS (12.5 km) compared to the 5 km of the innermost WRF domain. For certain aspects, the structures from E-OBS may be better represented in resolutions closer to it with otherwise the same settings.
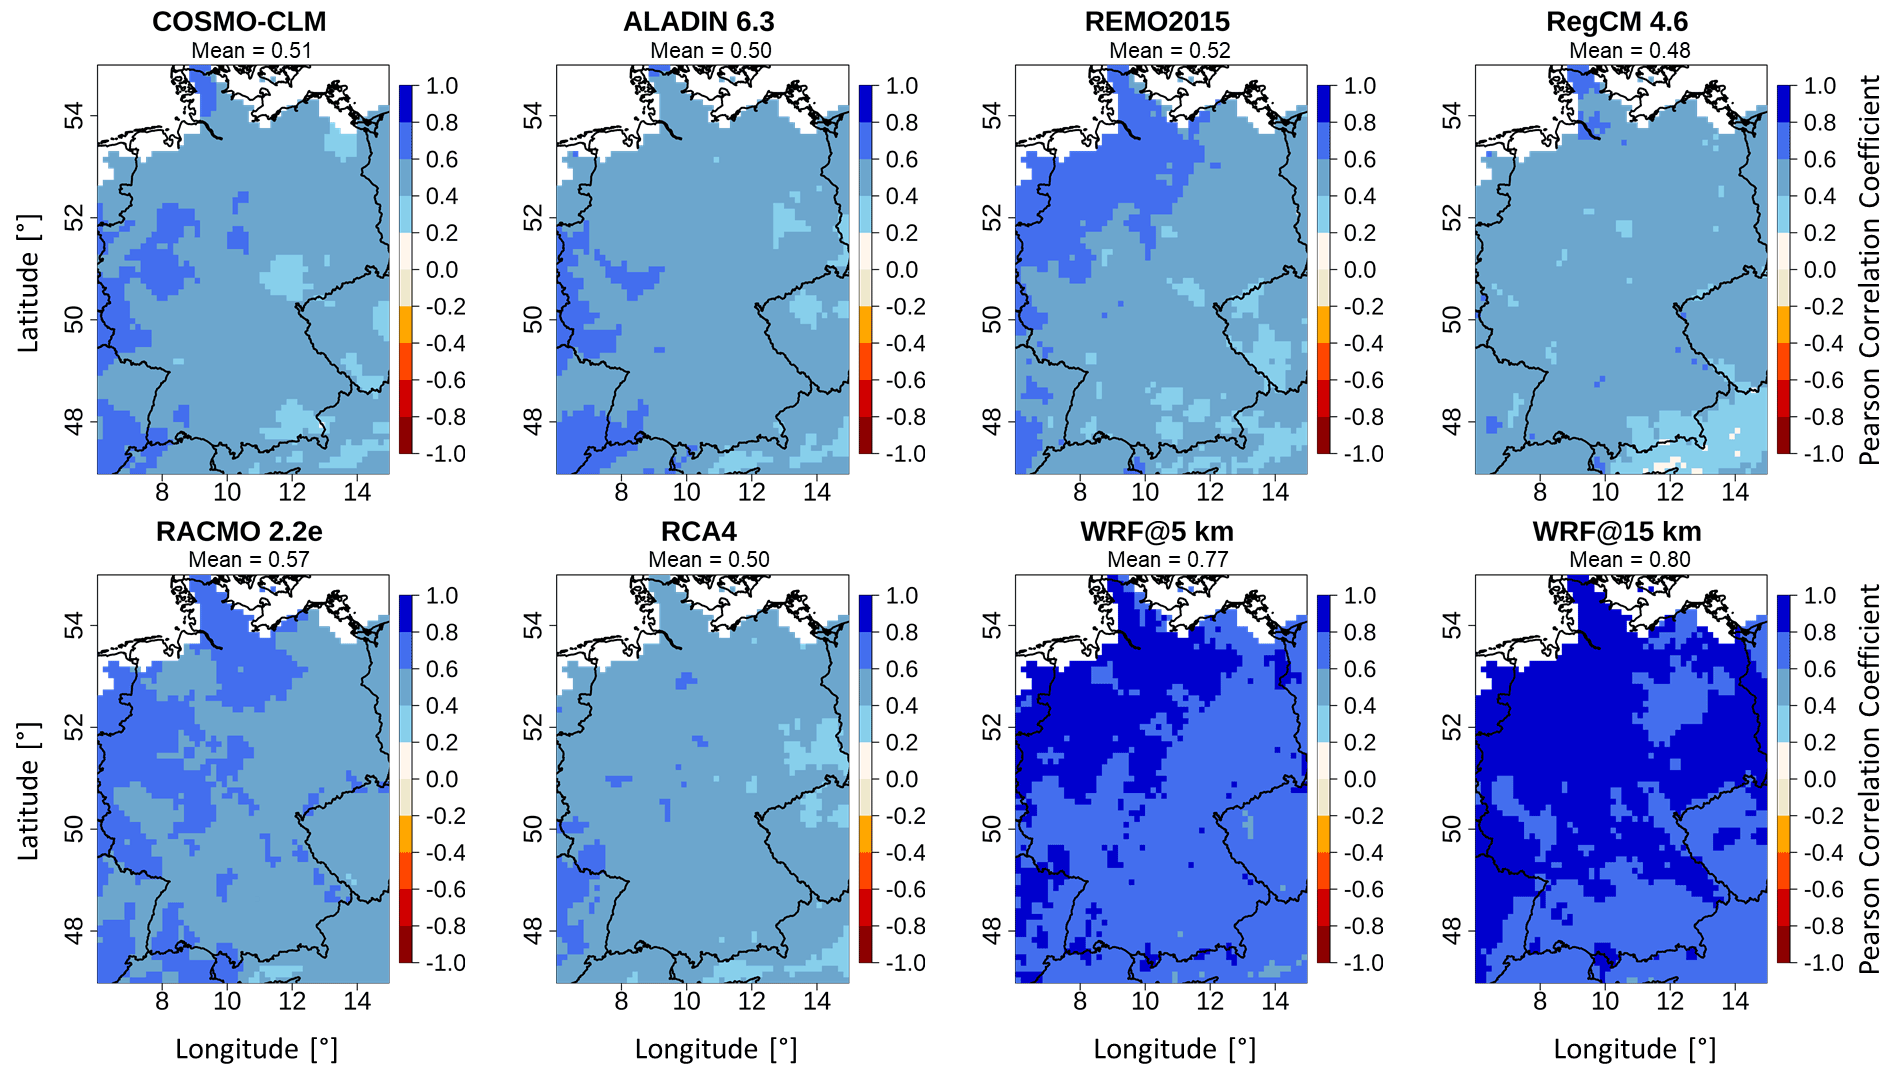
Figure 2Grid-cell-based Pearson correlation coefficients of the SPEI-3 time series for 1980–2009 between each RCM and E-OBS.
4.3 Drought event August 2003
In the following the SPEI-3 scores for the drought event in August 2003, one of the major drought events in central Europe in the last few decades (e.g., Fink et al., 2004; Rebetez et al., 2006; Ionita et al., 2021), are analyzed. Because of the results in the previous section, here we focus on the values from the two WRF runs in direct comparison to the reference values from E-OBS (Fig. 3). Relevant scores of the other RCM runs are given in Table 5.
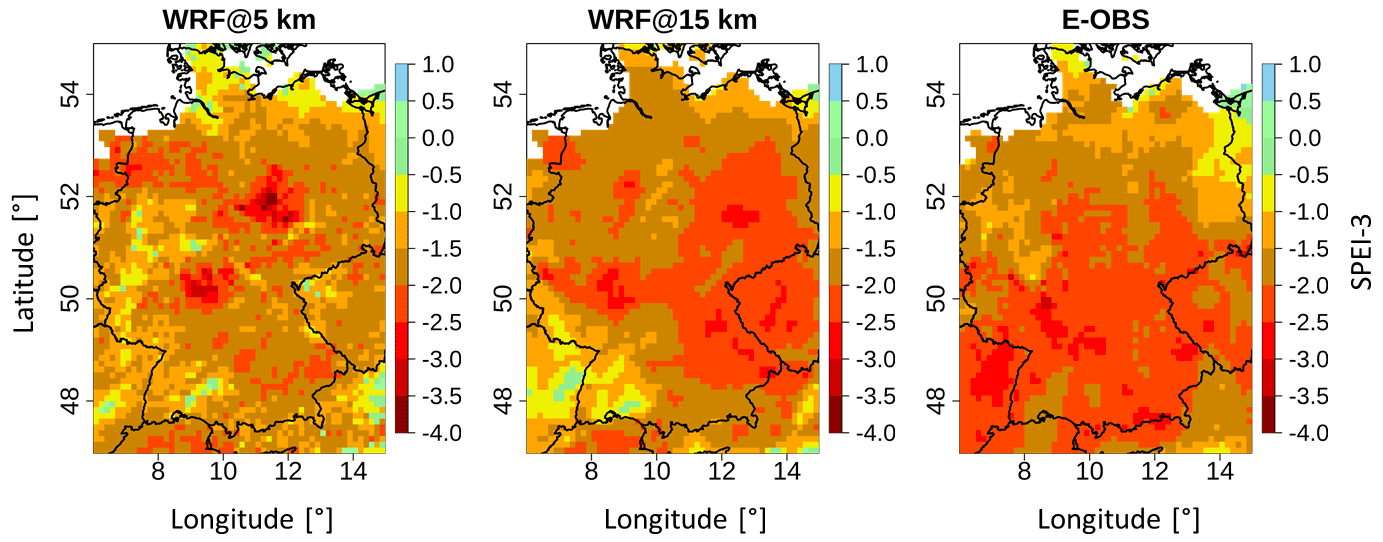
Figure 3SPEI-3 values for August 2003 from the two WRF domains and E-OBS.
Table 5Drought event August 2003 – SPEI-3 metrics including the spatial efficiency (SPAEF) scores for the spatial agreement between each RCM and E-OBS as reference.

The E-OBS spatial pattern reveals that especially the southern half of the domain was mostly under extreme (SPEI ; see Table 3) drought conditions, while in the northern half moderate to severe (−1 to −2) drought conditions were predominant. This pattern is not well reproduced by WRF@5km, which is also reflected by the low SPAEF value (0.21) in Table 5. Its domain is predominated by values between −1 and −2, so the biggest accordance with E-OBS can be found in the northern half. Some areas of the domain range between 0 and −1, indicating mild drought conditions. There are some spots with extreme drought values as well, though these do not match with E-OBS values. The WRF@15km domain shows more similarity with the E-OBS domain regarding the values, but the spatial distribution is different. This is underlined by the close SPEI-3 domain mean value (−1.81 compared to −1.90 of E-OBS), the almost exact area-under-drought (AUD) value (81.5 % compared to 81.7 %) and the lowest mean bias value (−0.08 SPEI units) but the low SPAEF value (0.10) in Table 5. In all three domains the entire area is covered nearly only with negative values, which underlines the distinct drought conditions of that period. The mean SPEI-3 values in Table 5, which are all negative, further confirm this. It is striking that E-OBS holds the lowest mean value (−1.90), which corresponds to severe drought conditions. The highest mean value is held by RACMO (−0.97), corresponding to mild drought conditions. This highlights the big differences among the RCMs. The AUD is defined as the percentage of grid cells with values of in relation to the total number of grid cells. Here we see distinct differences between the single RCMs and the reference. While E-OBS, RCA4 and WRF@15km have AUD values of more than 80 %, these values are even below 50 % in REMO and RACMO. These two RCMs also hold the two highest mean bias values (−1.03 and −0.93 SPEI units). All mean bias values are negative, which is a further indication of the drought underestimation of the RCMs. The SPAEF values are either negative or very low. The only exception is ALADIN with a maximum value of 0.55. REMO holds the lowest SPAEF value (−1.89), which completes the overall bad performance of this RCM in this regard.
It can be concluded that there are distinct differences between the single RCM performances regarding the reproduction of single drought events. None of the RCMs was able to satisfactorily reproduce the spatial patterns of the reference. Also, the correct representation of the mean drought index values and the AUD values turned out to be difficult in most cases. Thus, the results confirm findings from Um et al. (2017), who found that the spatial extents of droughts diverge among the RCMs and that the RCMs are not able to accurately capture drought events with large spatial scales. Since WRF@5km did not perform the best in any of the categories in this case, there does not seem to be any benefit of increased model resolution and model settings in this regard in our results. In fact, it is evident that the WRF@15km run performs better for all scores except the SPAEF value (Table 5), which indicates the higher relevance of the model settings in this respect. This shows that, in some aspects, a lower resolution can also lead to better agreement with the reference compared to the higher resolution of the same model run.
4.4 SPEI trend analysis
Figure 4 displays the results of the Mann–Kendall trend test for all RCMs and the reference for the SPEI-3 time series of each grid cell. It is important to note that the Mann–Kendall trend test gives information about whether there is a monotonic positive or negative trend or no trend in a time series at a certain level of significance (here 0.05). There is no information about exact trend values.
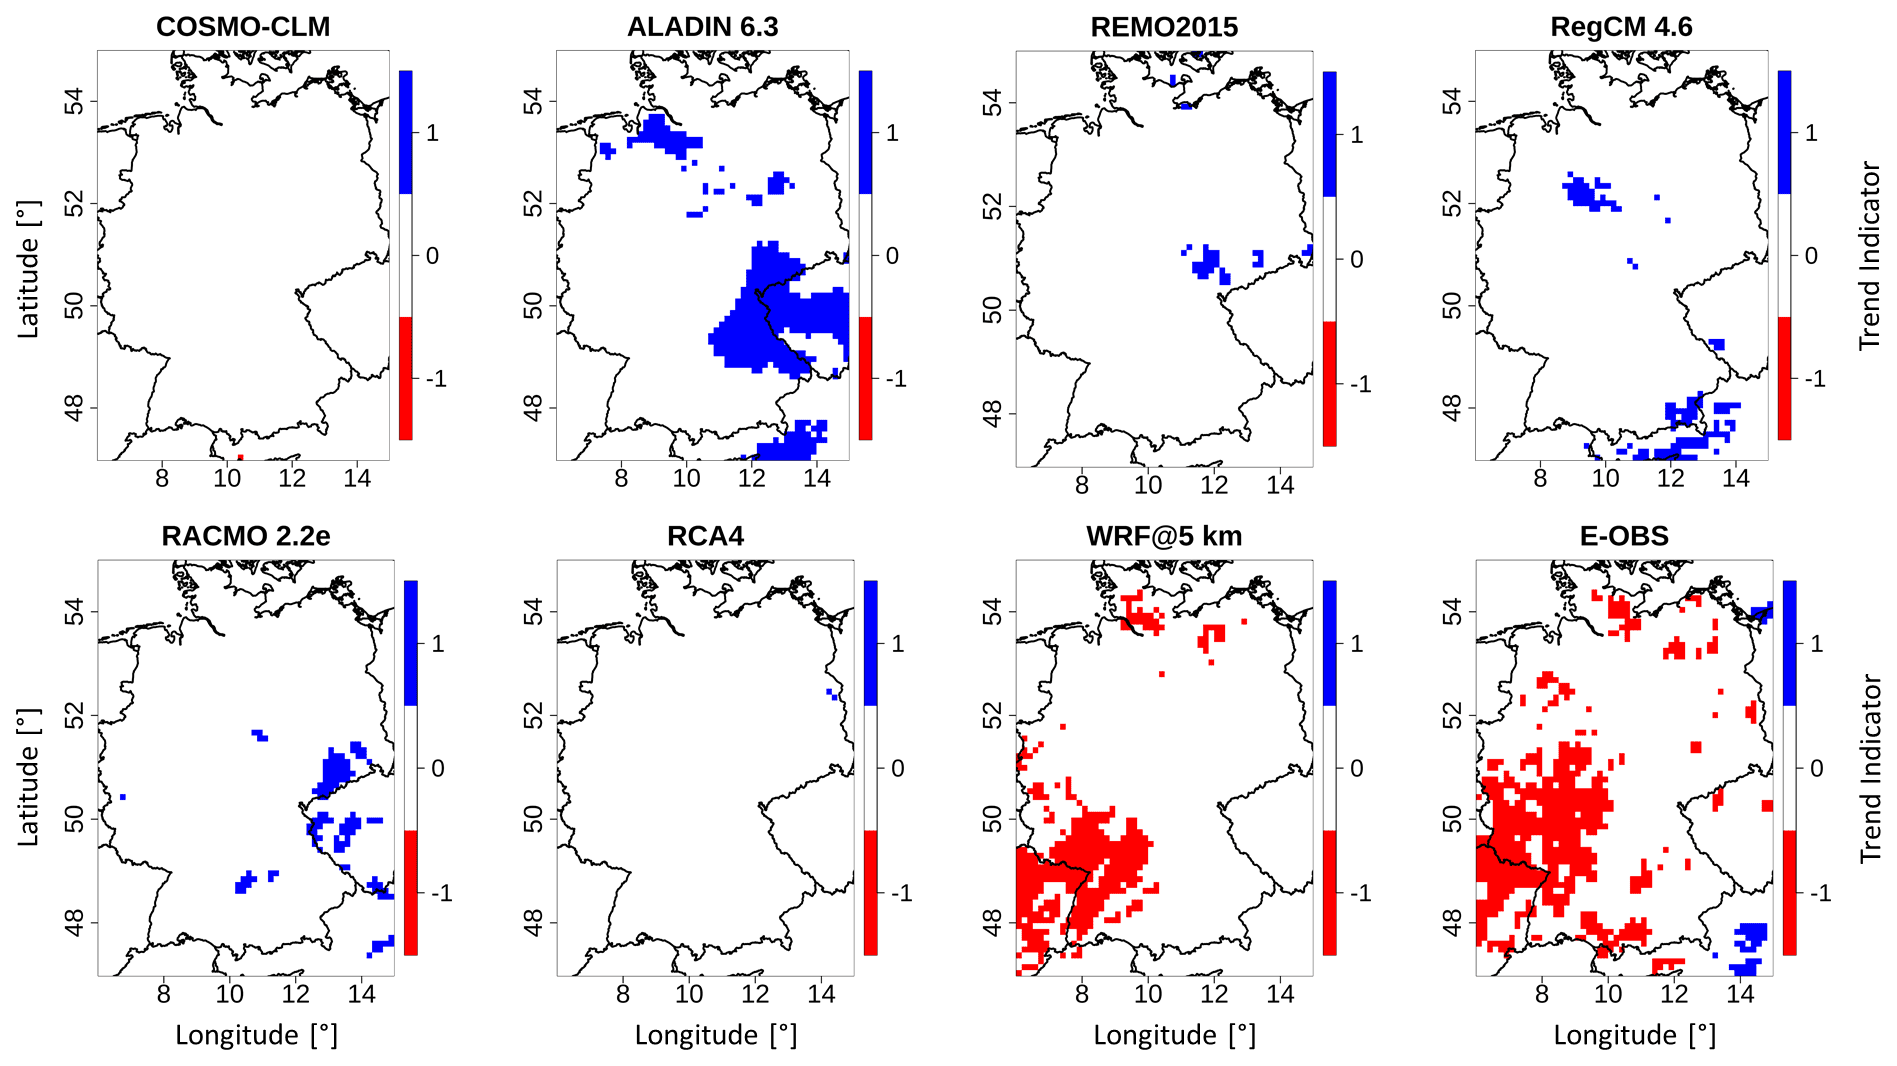
Figure 4Grid-cell-based SPEI-3 trends for 1980–2009 based on the Mann–Kendall test for each RCM and E-OBS.
It is striking that only WRF@5km is able to reproduce negative-trend signals which are also existent in the reference and indicate a drying trend. None of the EURO-CORDEX RCMs is able to reproduce this. In the WRF@5km domain, the locations of the negative trends are even locally represented accurately, concentrated mainly in the southwestern parts of the domain and partly in northern regions. These findings could be inferred from the results in Sect. 4.2. Most of the domain area of each RCM and the reference shows no trend (Table 6). If there is a trend in the EURO-CORDEX RCMs, it is always positive, indicating increasing SPEI-3 values and thus wetter conditions. This is the case for ALADIN, REMO, RegCM and RACMO. COSMO-CLM and RCA4 show almost entirely white domain areas. Interestingly, the E-OBS domain has only small parts of positive-trend areas, concentrated in the southeastern corner and partly in northeastern parts. There is only slight agreement in ALADIN, RegCM and RACMO in this respect. The WRF@5km domain shows no positive-trend grid cells at all (Table 6).
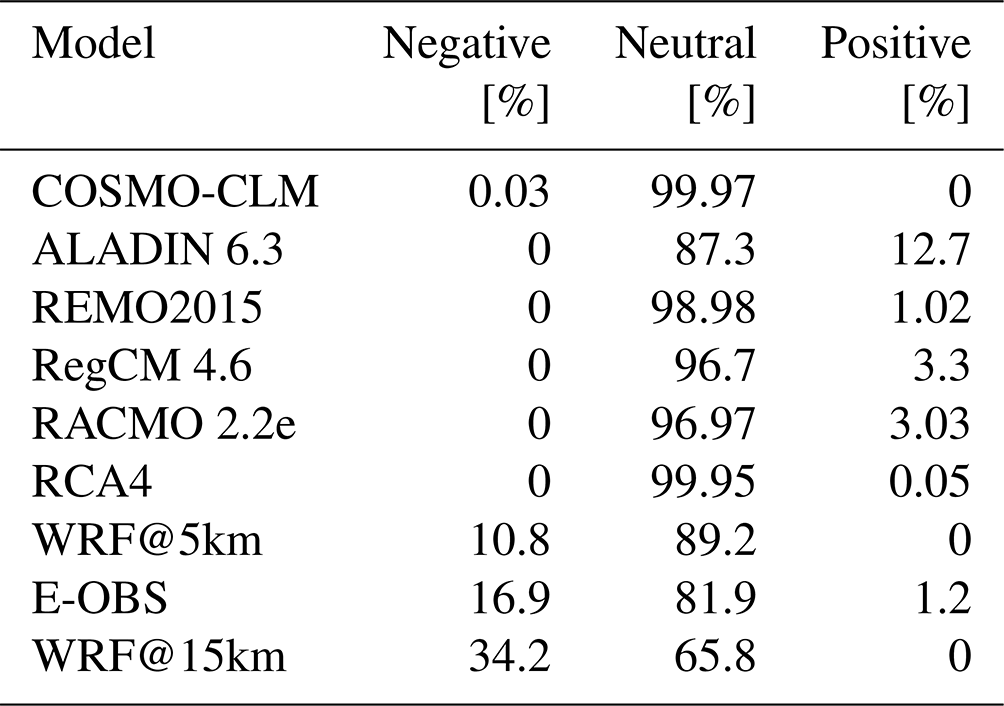
To answer the question of whether the agreement of WRF and E-OBS regarding the negative-trend areas is due to the increased resolution or to the model settings, we also applied the Mann–Kendall trend test to the WRF@15km run (Fig. 5). There is clear indication that the reproduction is not primarily linked with the increased resolution, since the negative trends are represented here too. Compared to the WRF@5km run, the negative-trend areas are much more spacious. This is also reflected in Table 6: more than one-third of the domain (34.2 %) is covered by negative index values, which is more than double compared to E-OBS (16.9 %) and more than 3 times compared to WRF@5km (10.8 %), underlining the big overestimation of negative-trend areas. There are no positive-trend values in the WRF@15km domain either.
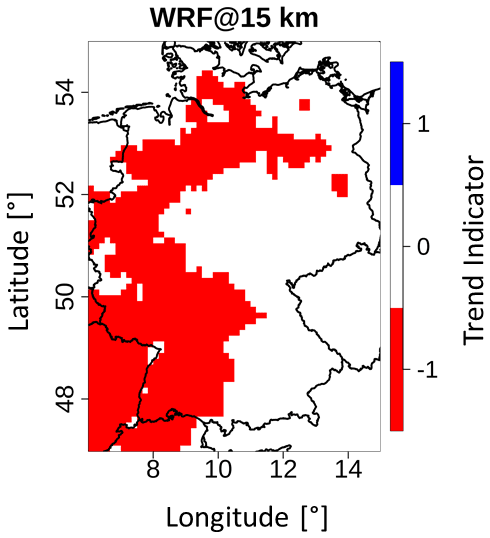
Figure 5Grid-cell-based SPEI-3 trends for 1980–2009 based on the Mann–Kendall test for WRF@15km.
From this section it is concluded that there are clear benefits of the WRF runs in the appropriate trend reproduction. As seen, these benefits are not primarily due to increased resolution but to the model settings, highlighting the high importance of model configurations tailored to the target region for our case. However, the increased resolution brings further benefits and leads to higher agreement with the reference. The EURO-CORDEX RCMs completely fail in this aspect. Nasrollahi et al. (2015) applied the Mann–Kendall trend test to the outputs of 41 CMIP5 models to evaluate their ability to replicate observed drought trends on the global scale between 1901–2005. They used the SPI-6 as drought index (and SPI-3 in the supporting material). Their results revealed that about 75 % of the models reproduce the global drying trend, but most models fail to reproduce regional wetting and drying trends (at most about 40 % with agreement). In most locations, less than 10 % of the models showed agreement with the observations. Greater agreement was found in higher latitudes. Um et al. (2017) also performed the Mann–Kendall trend test on grid-cell-based SPEI-12 time series from outputs of four (HadGEM3-RA, MM5, RegCM4 and RSM) RCMs from CORDEX East Asia and of their ensemble mean for the time period 1980–2005 over East Asia. They found distinct differences among the single model outputs regarding their capability to reproduce observed drying and wetting trends. While HadGEM3-RA and MM5 generally captured the proper trends, RegCM4 and RSM were only partially successful. This is why the ensemble mean showed relatively poor performance compared to the two former RCMs. These results highlight the spread in the models' capability in reproducing observed trends of wetting and drying, which is found in this study as well.
4.5 Drought characteristics analysis
4.5.1 Drought frequency
Figure 6 presents the E-OBS drought frequency pattern for the time period 1980–2009 based on SPEI-3 along with the grid-cell-based differences between each RCM and E-OBS. Table 7 gives more detailed information including the scores from the WRF@15km domain. The drought frequency gives the number of drought events in the given time period for each grid cell.
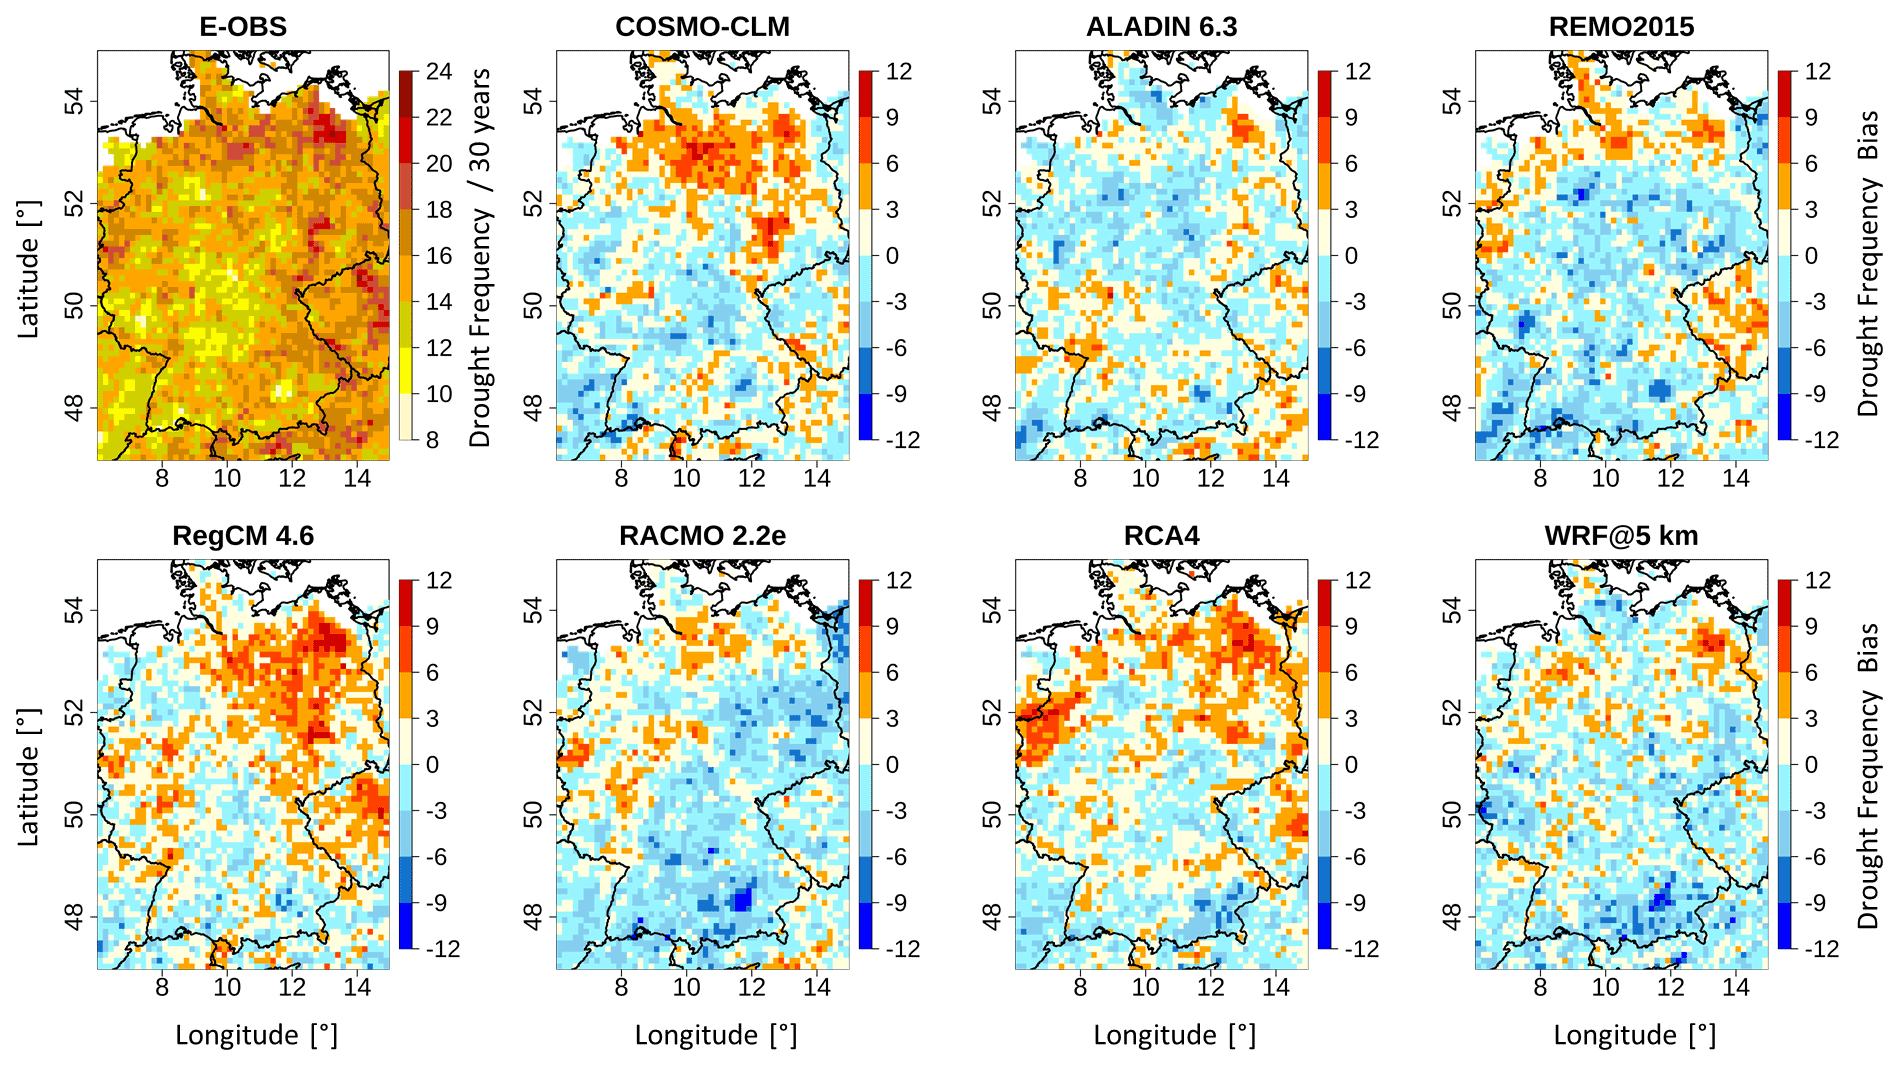
Figure 6Grid-cell-based E-OBS drought frequency pattern based on SPEI-3 between 1980–2009 and differences between each RCM and E-OBS.
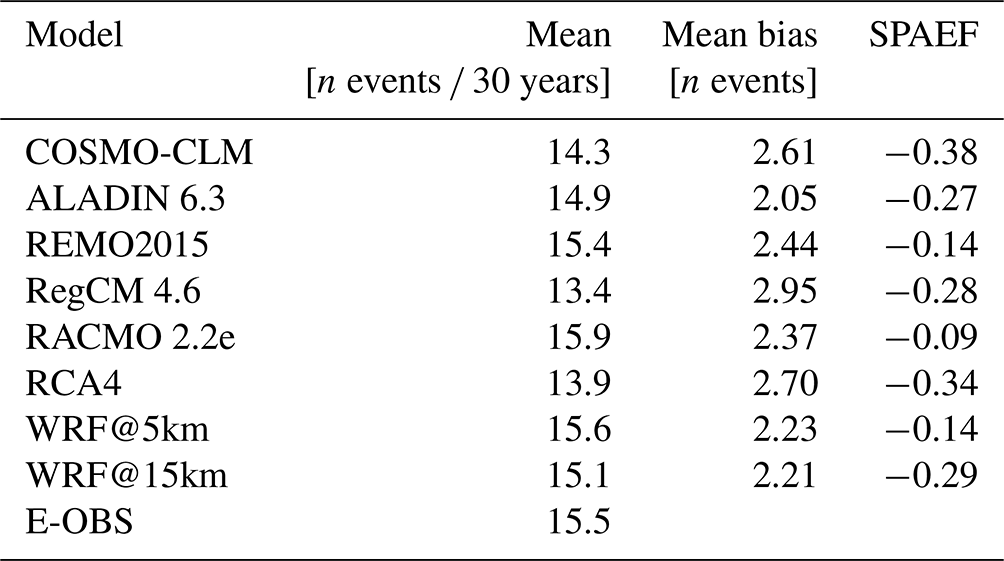
The meteorological drought frequency pattern in E-OBS shows that every single grid cell experienced at least eight drought events within the 30-year time span. The mean value for the whole domain is 15.5 (Table 7). The highest number of droughts occurred in the northeastern part with some grid cells reaching values of up to 24. This may appear relatively high at first. It needs to be kept in mind that events with an SPEI-3 value equal to or below −1 are already considered droughts (see Sect. 3.4), meaning that even moderate droughts (see Table 3) are taken into account. This does not necessarily imply drought events are severe or extreme. Due to the definition of the SPEI, this can also imply just a drier-than-normal period which is then considered a drought event. This can also happen in any season other than summer. Generally, the eastern half of the domain has higher values and towards the southwest the number of drought events decreases. The RCM difference patterns differ among each other. Relatively high positive bias values (between 3 and 12) are often found in the northern and northeastern parts of the domain, especially in COSMO-CLM, RegCM and RCA4. The southern half of the domain is rather predominated by negative bias values in all RCMs. There is a similarity between the patterns of ALADIN and WRF@5km. All in all, bias values of ±9 are rare in all RCMs; the major part of the RCM domains rather ranges between ±6. For the drought characteristics we used the mean absolute error (MAE) as a measure for the domain mean bias (third column in Table 7), since values with opposite signs can balance each other out, thus making the information less meaningful. ALADIN holds the smallest mean bias value (2.05) and RegCM the highest (2.95), which shows that all the values are relatively close to each other. A look at the domain mean number of drought events per 30 years shows that there is no big difference between the single values. They mainly range around 15, indicating that on average every second year in the considered time period a meteorological drought event took place. RegCM (13.4) has the biggest difference (2.1) to the reference and WRF@5km and REMO the smallest (0.1). This and the mean bias values speak for reasonable performances of the RCMs regarding the reproduction of the mean frequency conditions. The SPAEF values give information about the pattern agreement between the reference and the individual RCMs (not shown here). It is striking that all values are negative, which indicates there is no good overall spatial agreement at all. COSMO-CLM holds the lowest value (−0.38) and RACMO the highest (−0.09).
From this section it is concluded that there is no benefit of WRF's increased resolution and model setup regarding the reproduction of the drought frequency, since neither of the two WRF domains shows apparent benefits. The 5 km run's domain mean value is a little closer to the reference's one, and its SPAEF value (−0.14) is clearly higher compared to its 15 km counterpart (−0.29), while there is no big difference in the mean bias values. In fact, all the RCMs performed on a similar level. Furthermore, the mean conditions of the drought frequencies are sufficiently well reproduced. Focus should therefore be put on the information retrievable from the mean conditions and not on spatial accuracy.
4.5.2 Mean drought duration
Figure 7 shows the SPEI-3-based mean drought duration pattern for the period 1980–2009 from E-OBS and the grid-cell-based differences with the RCMs. Relevant scores, including for the WRF@15km run, are given in Table 8.
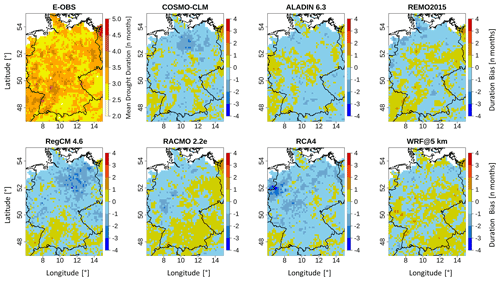
Figure 7Grid-cell-based E-OBS mean drought duration pattern based on SPEI-3 between 1980–2009 and differences between each RCM and E-OBS.
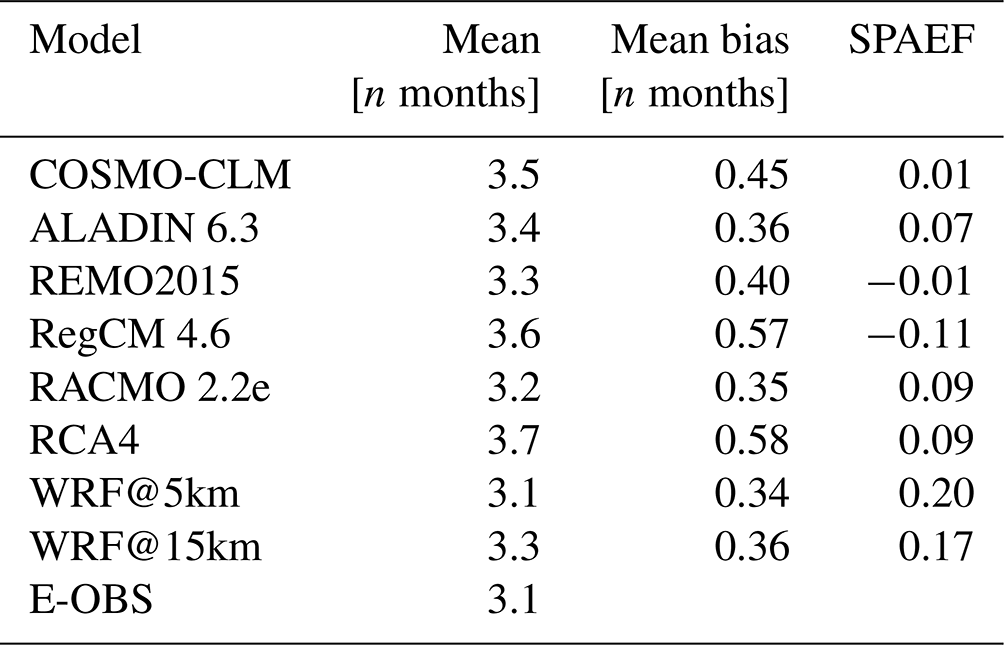
The E-OBS mean meteorological drought duration pattern is quite uniform: almost the entire domain is covered by values ranging between 2.5 and 3.5 months. The domain mean value (3.1 months) in Table 8 underlines this. The vast majority of the RCM bias domains is covered by values between 2 and −2 months, implying some similarities between single RCMs. One thing all RCMs have in common is that the northern parts are predominated by negative bias values. COSMO-CLM, RegCM and RCA4 are predominated by negative bias values almost all over their entire domains. Table 8 shows that all mean bias values are below 1 month, with WRF@5km holding the lowest value (0.34 months) and RCA4 the highest (0.58 months). The RCM domain mean drought durations are all equal to or higher than the reference value (3.1 months), with WRF@5km the closest to it and RCA4 the furthest from it (0.6 months). As inferred by the maps and mean values, the SPAEF values between the reference and the single RCM patterns (not shown) are higher compared to the drought frequency values (section above). Only REMO and RegCM hold negative values. WRF@5km has the highest value (0.20), followed by WRF@15km (0.17), which is still relatively low despite everything, while the other RCMs do not cross the 0.1 threshold. The WRF@5km run performs slightly better than its 15 km counterpart.
It is concluded that WRF has no real benefit due to increased resolution or model setup. The benefit is perhaps somewhat present regarding the spatial agreement with the reference, but although the SPAEF achieved by the WRF runs is distinctly higher than that from the EURO-CORDEX RCMs, it is still not reliable. Nevertheless, as for the drought frequencies in the section above, all RCMs provide a satisfying reproduction of the mean conditions. Here, there is also a lack of spatial accuracy, but this deficiency is less pronounced.
4.5.3 Mean drought severity
Figure 8 displays the E-OBS SPEI-3-based mean drought severity pattern for the time period 1980–2009 and the grid-cell-based differences with the RCMs. Relevant scores, including for the WRF@15km run, are given in Table 9.

Figure 8Grid-cell-based E-OBS mean drought severity pattern based on SPEI-3 between 1980–2009 and differences between each RCM and E-OBS.
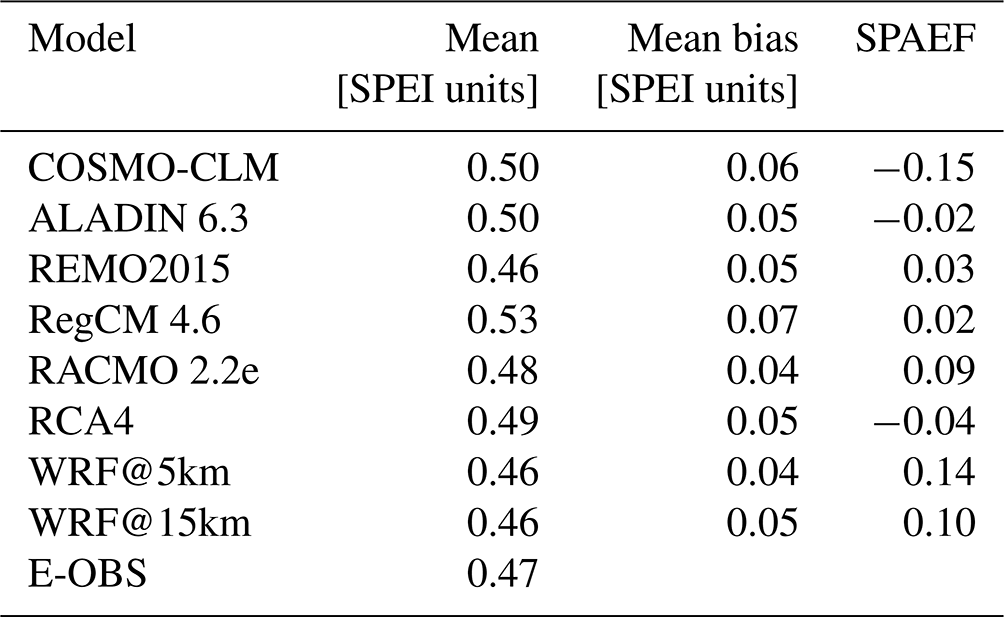
The E-OBS domain shows a pretty uniform pattern with the majority of the values ranging between 0.4 and 0.5 SPEI units. The domain mean value (0.47 SPEI units) in Table 9 confirms this. This value further implies that, if all droughts beginning from an SPEI value of −1 are considered, the mean severity is −1.47 SPEI units. This means that the mean drought severity can still be classified as moderate according to Table 3, but it is very close to the severe threshold. In general, all RCMs show overall low bias values, which is also displayed in the mean bias values in Table 9: the maximum mean bias value is 0.07 SPEI units and is held by RegCM. Especially RACMO and WRF@5km show domains with only a few dark-color-shaded areas, which is also reflected in the lowest mean bias values (0.04 SPEI units). Considering all RCM domains, it is not possible to determine areas of preferably positive or negative bias values as the same areas have different signs in different RCMs. Nor is it possible to determine regions of preferably high bias values across all RCMs. The domain mean severity values are very close to each other, all around 0.5±0.04 SPEI units with a range of 0.07 SPEI units between the maximum (RegCM) and minimum (REMO and WRF@5km). Regarding the spatial agreement between E-OBS and the single RCMs (not displayed here), there are again overall low SPAEF values, pointing towards a low level of agreement. WRF@5km holds the highest value (0.14), and WRF@15km is the only other one exceeding the 0.1 threshold. COSMO-CLM holds by far the lowest value (−0.15). The values of ALADIN and RCA4 are also negative.
Similarly to the two previous sections, it is concluded that the mean drought severity conditions are captured reasonably well by the RCMs in terms of domain mean values, while the spatial accuracy is overall not satisfying. Regarding the former, all RCMs perform on a similar level. This means that there is no benefit of WRF due to its increased resolution or model setup detectable in this regard here either. The results of the two WRF runs are very similar: the 5 km run performs slightly better regarding the mean bias and SPAEF. Peres et al. (2020) found that the RCMs with the best performance for precipitation mostly performed well regarding the reproduction of drought characteristics, too. This cannot really be confirmed here in our findings. As stated in Sect. 4.1, COSMO-CLM and RACMO perform overall especially well for precipitation. Regarding the drought characteristics, these two RCMs did not stand out overall. Only in some aspects were there marginal benefits. It must be noted that Peres et al. (2020) used another methodology regarding the definition and calculation of drought characteristics, since they worked with precipitation threshold values instead of drought indices.
From an overall perspective, it can be stated that no specific physics scheme of the RCMs (Table 2) considered on its own turned out to be superior to the others for the reproduction of the drought characteristics. Moreover, to corroborate our findings, we present additional results for the longer-timescale SPEI-6 and SPEI-12 indices in the Supplement (Figs. S1–S13 and Tables S1–S10) that lead us to the same conclusions as those found for SPEI-3.
A drought analysis for Germany and its near surroundings for the period 1980–2009 is conducted in this study. We address the influence of increased model resolution and appropriate model configuration on the reproduction of the SPEI drought index for the 3-month aggregation scale. For that purpose, an ensemble of six ERA-Interim-driven EURO-CORDEX RCMs of 12.5 km horizontal grid resolution and an ERA-Interim-driven high-resolution (5 km) WRF run, whose setup was tailored to the target area, are employed. The outputs are evaluated regarding their ability to reproduce precipitation, Tmax and Tmin as well as SPEI-3-based correlations and trends, the drought event in 2003, and overall drought characteristics (frequency, duration and severity). E-OBS data serve as reference.
WRF with its increased resolution and tailored model setup is shown to not be beneficial regarding the reproduction of the overall drought characteristics. In terms of reproducing the drought event in 2003, the model settings of WRF are determining for the highest agreement with the reference, since the 15 km run performs better than its 5 km counterpart. The event is not well captured by any of the other RCMs. As for the domain mean conditions of the overall characteristics, they are reasonably well reproduced in all cases. The spatial agreement with the reference, though, is not satisfactory for any RCM. This is especially the case for the drought frequencies. In general, despite the same forcing, the RCMs exhibit a large spread in their outputs. Meteorological droughts are found to occur approximately 16 times in the study period with an average duration of 3.1 months and average severity of 1.47 SPEI units. No specific physics scheme or configuration can be shown to be especially beneficial for the reproduction of the drought characteristics. Furthermore, there seems to be no correlation between the RCM bias values (Table 4) and the respective SPEI performances. These results suggest that, depending on the goal in drought analysis, a resolution of 12.5 km or even 15 km, as shown with the WRF@15km run, may be sufficient to reach similar findings to those obtained with higher resolutions. This can save computational resources. WRF's increased resolution and setup turn out to be beneficial in the analysis of the monthly values of the meteorological variables and the correlations of the SPEI time series. The latter can primarily be attributed to the model setup. However, the greatest benefit of WRF is found in the reproduction of the SPEI trends. It is the only RCM that captures the negative trends of the reference, while all EURO-CORDEX RCMs fail in this aspect. This is primarily due to the better model optimization for the area of interest compared to the larger-extent EURO-CORDEX runs, which highlights the importance of such tailored physics settings. Higher resolution additionally leads to greater spatial accuracy. These findings can be of high relevance, since appropriate reproduction of drought index trends is an important feature of RCMs, especially in the context of climate change analysis. Furthermore, the results may guide the selection of suitable RCMs for certain aspects of drought analysis in Germany and similar regions in a historical context and also for future projections.
EURO-CORDEX model data are freely available at the EURO-CORDEX website (https://www.euro-cordex.net/, EURO-CORDEX, 2022). E-OBS data are freely available at the ECA&D website (https://www.ecad.eu/, ECA&D, 2022). The WRF data and the associated configuration files can be obtained online from Petrovic (2022, https://doi.org/10.5281/zenodo.6577187).
The supplement related to this article is available online at: https://doi.org/10.5194/nhess-22-3875-2022-supplement.
DP, BF and HK developed the methodology for the study. DP carried out the data analysis and drafted the manuscript, with support of BF and HK. HK provided grant funding and supervised the research.
The contact author has declared that none of the authors has any competing interests.
Publisher’s note: Copernicus Publications remains neutral with regard to jurisdictional claims in published maps and institutional affiliations.
This article is part of the special issue “Past and future European atmospheric extreme events under climate change”. It is not associated with a conference.
The authors gratefully acknowledge the work of the WRF modeling community, the European Centre for Medium-Range Weather Forecasts for the reanalysis data ERA-Interim, the contributors to the EURO-CORDEX projects used in this study, the ECA&D group for the E-OBS data set and Warscher et al. (2019) for providing the WRF simulation data. Great thanks also to Gerhard Smiatek for his support. Moreover, big thanks to the two anonymous reviewers for their valuable feedback and comments.
This work is funded by the ClimXtreme project of the BMBF
(German Federal Ministry of Education and Research) under grant
“Förderkennzeichen 01LP1903J”.
The article processing charges for this open-access publication were covered by the Karlsruhe Institute of Technology (KIT).
This paper was edited by Jens Grieger and reviewed by two anonymous referees.
Alhaji, U. U., Yusuf, A. S., Edet, C. O., Oche, C. O., and Agbo, E. P.: Trend Analysis of Temperature in Gombe State Using Mann Kendall Trend Test, Journal of Scientific Research & Reports, 3, 1–9, https://doi.org/10.9734/JSRR/2018/42029, 2018.
Allen, R. G., Pruitt, W. O., Wright, J. L., Howell, T. A., Ventura, F., Snyder, R., Itenfisu, D., Steduto, P., Berengena, J., Yrisarry, J. B., Smith, M., Pereira, L. S., Raes, D., Perrier, A., Alves, I., Walter, I., and Elliott, R.: A recommendation on standardized surface resistance for hourly calculation of reference ETo by the FAO56 Penman-Monteith method, Agr. Water Manage., 1–2, 1–22, https://doi.org/10.1016/j.agwat.2005.03.007, 2006.
Balsamo, G., Beljaars, A., Scipal, K., Viterbo, P., v. d. Hurk, B., Hirschi, M., and Betts, A. K.: A Revised Hydrology for the ECMWF Model: Verification from Field Site to Terrestrial Water Storage and Impact in the Integrated Forecast System, J. Hydrometeorol., 10, 623–643, https://doi.org/10.1175/2008JHM1068.1, 2009.
Bastos, A., Ciais, P., Friedlingstein, P., Sitch, S., Pongratz, J., Fan, L., Wigneron, J. P., Weber, U., Reichstein, M., Fu, Z., Anthoni, P., Arneth, A., Haverd, V., Jain, A. K., Joetzjer, E., Knauer, J., Lienert, S., Loughran, T., McGuire, P. C., Tian, H., Viovy, N., and Zaehle, S.: Direct and seasonal legacy effects of the 2018 heat wave and drought on European ecosystem productivity, Science Advances, 24, eaba2724, https://doi.org/10.1126/sciadv.aba2724, 2020.
Bechtold, P., Bazile, E., Guichard, F., Mascart, P., and Richard, E.: A mass-flux convection scheme for regional and global models, Q. J. Roy. Meteor. Soc., 573, 869–886, https://doi.org/10.1002/qj.49712757309, 2001.
Beguería, S. and Vicente-Serrano, S. M.: SPEI: Calculation of Standardized Precipitation-Evapotranspiration Index, R package version 1.6., http://cran.r-project.org/package=SPEI (last access: 10 January 2022), 2013.
Boergens, E., Güntner, A., Dobslaw, H., and Dahle, C.: Quantifying the Central European Droughts in 2018 and 2019 With GRACE Follow-On, Geophys. Res. Lett., 47, e2020GL087285, https://doi.org/10.1029/2020GL087285, 2020.
Bretherton, C. S., McCaa, J. R., and Grenier, H.: A New Parameterization for Shallow Cumulus Convection and Its Application to Marine Subtropical Cloud-Topped Boundary Layers. Part I: Description and 1D Results, Mon. Weather Rev., 4, 864–882, https://doi.org/10.1175/1520-0493(2004)132<0864:ANPFSC>2.0.CO;2, 2004.
Casanueva, A., Kotlarski, S., Herrera, S., Fernández, J., Gutiérrez, J. M., Boberg, F., Colette, A., Christensen, O. B., Goergen, K., Jacob, D., Keuler, K., Nikulin, G., Teichmann, C., and Vautard, R.: Daily precipitation statistics in a EURO-CORDEX RCM ensemble: added value of raw and bias-corrected high-resolution simulations, Clim. Dynam., 3–4, 719–737, https://doi.org/10.1007/s00382-015-2865-x, 2016.
Chen, F. and Dudhia, J.: Coupling an Advanced Land Surface–Hydrology Model with the Penn State–NCAR MM5 Modeling System. Part I: Model Implementation and Sensitivity, Mon. Weather Rev., 4, 569–585, https://doi.org/10.1175/1520-0493(2001)129<0569:CAALSH>2.0.CO;2, 2001a.
Chen, F. and Dudhia, J.: Coupling an Advanced Land Surface–Hydrology Model with the Penn State–NCAR MM5 Modeling System. Part II: Preliminary Model Validation, Mon. Weather Rev., 4, 587–604, https://doi.org/10.1175/1520-0493(2001)129<0587:CAALSH>2.0.CO;2, 2001b.
Chowdhury, S. and Jahan, N.: Drought Analysis of Rajshahi of Bangladesh Using CORDEX data by Palmer Method, Journal of Modern Science and Technology, 2, 10–18, 2018.
Christensen, J. H. and Christensen, O. B.: A summary of the PRUDENCE model projections of changes in European climate by the end of this century, Climatic Change, S1, 7–30, https://doi.org/10.1007/s10584-006-9210-7, 2007.
Crausbay, S. D., Ramirez, A. R., Carter, S. L., Cross, M. S., Hall, K. R., Bathke, D. J., Betancourt, J. L., Colt, S., Cravens, A. E., Dalton, M. S., Dunham, J. B., Hay, L. E., Hayes, M. J., McEvoy, J., McNutt, C. A., Moritz, M. A., Nislow, K. H., Raheem, N., and Sanford, T.: Defining Ecological Drought for the Twenty-First Century, B. Am. Meteorol. Soc., 12, 2543–2550, https://doi.org/10.1175/BAMS-D-16-0292.1, 2017.
Cuxart, J., Bougeault, P., and Redelsperger, J.-L.: A turbulence scheme allowing for mesoscale and large-eddy simulations, Q. J. Roy. Meteor. Soc., 562, 1–30, https://doi.org/10.1002/qj.49712656202, 2000.
Dai, A.: Drought under global warming: a review, Wiley Interdisciplinary Reviews: Climate Change, 1, 45–65, https://doi.org/10.1002/wcc.81, 2011.
Dai, A.: Increasing drought under global warming in observations and models, Nat. Clim. Change, 1, 52–58, https://doi.org/10.1038/nclimate1633, 2013.
Daniel, M., Lemonsu, A., Déqué, M., Somot, S., Alias, A., and Masson, V.: Benefits of explicit urban parameterization in regional climate modeling to study climate and city interactions, Clim. Dynam., 5–6, 2745–2764, https://doi.org/10.1007/s00382-018-4289-x, 2019.
Das, J. and Umamahesh, N. V.: Spatio-Temporal Variation of Water Availability in a River Basin under CORDEX Simulated Future Projections, Water Resour. Manag., 4, 1399–1419, https://doi.org/10.1007/s11269-017-1876-2, 2018.
Dascălu, S. I., Gothard, M., Bojariu, R., Birsan, M.-V., Cică, R., Vintilă, R., Adler, M.-J., Chendeș, V., and Mic, R.-P.: Drought-related variables over the Bârlad basin (Eastern Romania) under climate change scenarios, CATENA, 141, 92–99, https://doi.org/10.1016/j.catena.2016.02.018, 2016.
Dee, D. P., Uppala, S. M., Simmons, A. J., Berrisford, P., Poli, P., Kobayashi, S., Andrae, U., Balmaseda, M. A., Balsamo, G., Bauer, P., Bechtold, P., Beljaars, A. C. M., van de Berg, L., Bidlot, J., Bormann, N., Delsol, C., Dragani, R., Fuentes, M., Geer, A. J., Haimberger, L., Healy, S. B., Hersbach, H., Hólm, E. V., Isaksen, L., Kållberg, P., Köhler, M., Matricardi, M., McNally, A. P., Monge-Sanz, B. M., Morcrette, J.-J., Park, B.-K., Peubey, C., Rosnay, P. de, Tavolato, C., Thépaut, J.-N., and Vitart, F.: The ERA-Interim reanalysis: configuration and performance of the data assimilation system, Q. J. Roy. Meteor. Soc., 656, 553–597, https://doi.org/10.1002/qj.828, 2011.
Demirel, M. C., Mai, J., Mendiguren, G., Koch, J., Samaniego, L., and Stisen, S.: Combining satellite data and appropriate objective functions for improved spatial pattern performance of a distributed hydrologic model, Hydrol. Earth Syst. Sci., 22, 1299–1315, https://doi.org/10.5194/hess-22-1299-2018, 2018.
DWD: Deutscher Wetterdienst (DWD) zur Trockenheit im Sommerhalbjahr 2020: https://www.dwd.de/DE/presse/pressemitteilungen/DE/2020/20201014_agrarwetter_sommer2020_news.html (last access: 25 May 2022), 2020.
Diasso, U. and Abiodun, B. J.: Drought modes in West Africa and how well CORDEX RCMs simulate them, Theor. Appl. Climatol., 1–2, 223–240, https://doi.org/10.1007/s00704-015-1705-6, 2017.
Dieng, D., Smiatek, G., Bliefernicht, J., Heinzeller, D., Sarr, A., Gaye, A. T., and Kunstmann, H.: Evaluation of the COSMO-CLM high-resolution climate simulations over West Africa, J. Geophys. Res.-Atmos., 3, 1437–1455, https://doi.org/10.1002/2016JD025457, 2017.
Di Luca, A., de Elía, R., and Laprise, R.: Potential for added value in temperature simulated by high-resolution nested RCMs in present climate and in the climate change signal, Clim. Dynam., 1–2, 443–464, https://doi.org/10.1007/s00382-012-1384-2, 2013.
Doms, G., Förstner, J., Heise, E., Herzog, H. J., Mironov, D., Raschendorfer, M., Reinhardt, T., Ritter, B., Schrodin, R., Schulz, J.-P., and Vofel, G.: A Description of the Nonhydrostatic Regional COSMO-Model – Part II: Physical Parameterizations, Deutscher Wetterdienst DWD, Offenbach, 2013.
Droogers, P. and Allen, R. G.: Estimating Reference Evapotranspiration Under Inaccurate Data Conditions, Irrigation and Drainage Systems, 1, 33–45, https://doi.org/10.1023/A:1015508322413, 2002.
ECA&D: European Climate Assessment & Dataset project, https://www.ecad.eu/, last access: 2 December 2022.
ECMWF: IFS Documentation CY31R1 – Part IV: Physical Processes, European Centre for Medium-Range Weather Forecasts, https://www.ecmwf.int/sites/default/files/elibrary/2012/9239-part-iv-physical-processes.pdf (last access; 15 February 2022), 2012.
EURO-CORDEX: EURO-CORDEX – Coordinated Downscaling Experiment – European Domain, https://www.euro-cordex.net/, last access: 2 December 2022.
European Environment Agency (EEA): Mapping the impacts of natural hazards and technological accidents in Europe: an overview of the last decade, Publications Office of the European Union, Luxembourg, 2010.
Fink, A. H., Brücher, T., Krüger, A., Leckebusch, G. C., Pinto, J. G., and Ulbrich, U.: The 2003 European summer heatwaves and drought-synoptic diagnosis and impacts, Weather, 8, 209–216, https://doi.org/10.1256/wea.73.04, 2004.
Fouquart, Y. and Bonnel, B.: Computations of solar heating of the earth's atmosphere – A new parameterization, Beitraege zur Physik der Atmosphaere, 53, 35–62, 1980.
García-Valdecasas Ojeda, M., Gámiz-Fortis, S. R., Castro-Díez, Y., and Esteban-Parra, M. J.: Evaluation of WRF capability to detect dry and wet periods in Spain using drought indices, J. Geophys. Res., 122, 1569–1594, 2017.
Giorgi, F., Colin Jones, and Ghassem R. Asrar: Addressing climate information needs at the regional level: the CORDEX framework, World Meteorological Organization (WMO) Bulletin, 3, 175–183, 2009.
Giorgi, F., Coppola, E., Solmon, F., Mariotti, L., Sylla, M. B., Bi, X., Elguindi, N., Diro, G. T., Nair, V., Giuliani, G., Turuncoglu, U. U., Cozzini, S., Güttler, I., O'Brien, T. A., Tawfik, A. B., Shalaby, A., Zakey, A. S., Steiner, A. L., Stordal, F., Sloan, L. C., and Brankovic, C.: RegCM4: model description and preliminary tests over multiple CORDEX domains, Clim. Res., 52, 7–29, https://doi.org/10.3354/cr01018, 2012.
Grell, G. A. and Freitas, S. R.: A scale and aerosol aware stochastic convective parameterization for weather and air quality modeling, Atmos. Chem. Phys., 14, 5233–5250, https://doi.org/10.5194/acp-14-5233-2014, 2014.
Grenier, H. and Bretherton, C. S.: A Moist PBL Parameterization for Large-Scale Models and Its Application to Subtropical Cloud-Topped Marine Boundary Layers, Mon. Weather Rev., 3, 357–377, https://doi.org/10.1175/1520-0493(2001)129<0357:AMPPFL>2.0.CO;2, 2001.
Guérémy, J. F.: A continuous buoyancy based convection scheme: one-and three-dimensional validation, Tellus A, 4, 687–706, https://doi.org/10.1111/j.1600-0870.2011.00521.x, 2011.
Hagemann, S.: An improved land surface parameter dataset for global and regional climate models, Max Planck Institute for Meteorology, Report No. 336, 2002.
Hamed, K. H.: Trend detection in hydrologic data: The Mann–Kendall trend test under the scaling hypothesis, J. Hydrol., 3–4, 350–363, https://doi.org/10.1016/j.jhydrol.2007.11.009, 2008.
Hannaford, J., Buys, G., Stahl, K., and Tallaksen, L. M.: The influence of decadal-scale variability on trends in long European streamflow records, Hydrol. Earth Syst. Sci., 17, 2717–2733, https://doi.org/10.5194/hess-17-2717-2013, 2013.
Hari, V., Rakovec, O., Markonis, Y., Hanel, M., and Kumar, R.: Increased future occurrences of the exceptional 2018–2019 Central European drought under global warming, Sci. Rep.-UK, 1, 12207, https://doi.org/10.1038/s41598-020-68872-9, 2020.
Haylock, M. R., Hofstra, N., Klein Tank, A. M. G., Klok, E. J., Jones, P. D., and New, M.: A European daily high-resolution gridded data set of surface temperature and precipitation for 1950–2006, J. Geophys. Res., 113, D20119, https://doi.org/10.1029/2008JD010201, 2008.
Heim, R. R.: A Review of Twentieth-Century Drought Indices Used in the United States, B. Am. Meteorol. Soc., 8, 1149–1166, https://doi.org/10.1175/1520-0477-83.8.1149, 2002.
Hong, S. Y. and Lim, J. O. J.: The WRF single-moment 6-class microphysics scheme (WSM6), Asia-Pac. J. Atmos. Sci., 42, 129–151, 2006.
Hong, S.-Y., Noh, Y., and Dudhia, J.: A New Vertical Diffusion Package with an Explicit Treatment of Entrainment Processes, Mon. Weather Rev., 9, 2318–2341, https://doi.org/10.1175/MWR3199.1, 2006.
Hoy, A., Hänsel, S., Skalak, P., Ustrnul, Z., and Bochníček, O.: The extreme European summer of 2015 in a long-term perspective, Int. J. Climatol., 2, 943–962, https://doi.org/10.1002/joc.4751, 2017.
Iacono, M. J., Delamere, J. S., Mlawer, E. J., Shephard, M. W., Clough, S. A., and Collins, W. D.: Radiative forcing by long-lived greenhouse gases: Calculations with the AER radiative transfer models, J. Geophys. Res., 113, D13103, https://doi.org/10.1029/2008JD009944, 2008.
Ionita, M., Tallaksen, L. M., Kingston, D. G., Stagge, J. H., Laaha, G., Van Lanen, H. A. J., Scholz, P., Chelcea, S. M., and Haslinger, K.: The European 2015 drought from a climatological perspective, Hydrol. Earth Syst. Sci., 21, 1397–1419, https://doi.org/10.5194/hess-21-1397-2017, 2017.
Ionita, M., Dima, M., Nagavciuc, V., Scholz, P., and Lohmann, G.: Past megadroughts in central Europe were longer, more severe and less warm than modern droughts, Commun. Earth Environ., 2, 61, https://doi.org/10.1038/s43247-021-00130-w, 2021.
Kendall, M. G.: Rank Correlation Methods, Griffin, London, 1975.
Kiehl, J. T., Hack, J. J., Bonan, G. B., Boville, B. A., and Briegleb, B. P.: Description of the NCAR community climate model (CCM3), Technical Note (No. PB-97-131528/XAB; NCAR/TN-420-STR), National Center for Atmospheric Research, Boulder, CO (United States), Climate and Global Dynamics Div., 1996.
Koch, J., Demirel, M. C., and Stisen, S.: The SPAtial EFficiency metric (SPAEF): multiple-component evaluation of spatial patterns for optimization of hydrological models, Geosci. Model Dev., 11, 1873–1886, https://doi.org/10.5194/gmd-11-1873-2018, 2018.
Kotlarski, S., Keuler, K., Christensen, O. B., Colette, A., Déqué, M., Gobiet, A., Goergen, K., Jacob, D., Lüthi, D., van Meijgaard, E., Nikulin, G., Schär, C., Teichmann, C., Vautard, R., Warrach-Sagi, K., and Wulfmeyer, V.: Regional climate modeling on European scales: a joint standard evaluation of the EURO-CORDEX RCM ensemble, Geosci. Model Dev., 7, 1297–1333, https://doi.org/10.5194/gmd-7-1297-2014, 2014.
Kumar, R., Samaniego, L., and Attinger, S.: The effects of spatial discretization and model parameterization on the prediction of extreme runoff characteristics, J. Hydrol., 1–2, 54–69, https://doi.org/10.1016/j.jhydrol.2010.07.047, 2010.
Laaha, G., Gauster, T., Tallaksen, L. M., Vidal, J.-P., Stahl, K., Prudhomme, C., Heudorfer, B., Vlnas, R., Ionita, M., Van Lanen, H. A. J., Adler, M.-J., Caillouet, L., Delus, C., Fendekova, M., Gailliez, S., Hannaford, J., Kingston, D., Van Loon, A. F., Mediero, L., Osuch, M., Romanowicz, R., Sauquet, E., Stagge, J. H., and Wong, W. K.: The European 2015 drought from a hydrological perspective, Hydrol. Earth Syst. Sci., 21, 3001–3024, https://doi.org/10.5194/hess-21-3001-2017, 2017.
Lee, J.-W. and Hong, S.-Y.: Potential for added value to downscaled climate extremes over Korea by increased resolution of a regional climate model, Theor. Appl. Climatol., 3–4, 667–677, https://doi.org/10.1007/s00704-013-1034-6, 2014.
Le Moigne, P., Boone, A., Belamari, S., Brun, E., Calvet, J.-C., Decharme, B., Faroux, S., Gibelin, A.-L., Giordani, H., Lafont, S., Lebeaupin, C., Mahfouf, J.-F., Martin, E., Masson, V., Mironov, D., Morin, S., Noilhan, J., Tulet, P., Van Den Hurk, B., and Vionnet, V.: SURFEX scientific documentation, Note de centre (CNRM/GMME), Météo-France, Toulouse, France, 2012.
Lenderink, G. and Holtslag, A.: An updated length-scale formulation for turbulent mixing in clear and cloudy boundary layers, Q. J. Roy. Meteor. Soc., 604, 3405–3427, https://doi.org/10.1256/qj.03.117, 2004.
Lloyd-Hughes, B.: The impracticality of a universal drought definition, Theor. Appl. Climatol., 3–4, 607–611, https://doi.org/10.1007/s00704-013-1025-7, 2014.
Lohmann, U. and Roeckner, E.: Design and performance of a new cloud microphysics scheme developed for the ECHAM general circulation model, Clim. Dynam., 8, 557–572, https://doi.org/10.1007/BF00207939, 1996.
Lopez, P.: Implementation and validation of a new prognostic large-scale cloud and precipitation scheme for climate and data-assimilation purposes, Q. J. Roy. Meteor. Soc., 579, 229–257, https://doi.org/10.1256/00359000260498879, 2002.
Louis, J.-F.: A parametric model of vertical eddy fluxes in the atmosphere, Bound.-Lay. Meteorol., 2, 187–202, https://doi.org/10.1007/BF00117978, 1979.
Mann, H. B.: Nonparametric Tests Against Trend, Econometrica, 3, 245, https://doi.org/10.2307/1907187, 1945.
Marcos-Garcia, P., Lopez-Nicolas, A., and Pulido-Velazquez, M.: Combined use of relative drought indices to analyze climate change impact on meteorological and hydrological droughts in a Mediterranean basin, J. Hydrol., 554, 292–305, 2017.
McKee, T. B., Doesken, N. J., and Kleist, J.: The relationship of drought frequency and duration of time scales, in: Eighth Conference on Applied Climatology, American Meteorological Society, 17–23 January, Anaheim CA, 179–186, 1993.
Meresa, H., Osuch, M., and Romanowicz, R.: Hydro-Meteorological Drought Projections into the 21-st Century for Selected Polish Catchments, Water, 5, 206, https://doi.org/10.3390/w8050206, 2016.
Mishra, A. K. and Singh, V. P.: A review of drought concepts, J. Hydrol., 1–2, 202–216, https://doi.org/10.1016/j.jhydrol.2010.07.012, 2010.
Mlawer, E. J., Taubman, S. J., Brown, P. D., Iacono, M. J., and Clough, S. A.: Radiative transfer for inhomogeneous atmospheres: RRTM, a validated correlated-k model for the longwave, J. Geophys. Res., 102, 16663–16682, https://doi.org/10.1029/97JD00237, 1997.
Mooney, P. A., Mulligan, F. J., and Fealy, R.: Evaluation of the Sensitivity of the Weather Research and Forecasting Model to Parameterization Schemes for Regional Climates of Europe over the Period 1990–95, J. Climate, 3, 1002–1017, https://doi.org/10.1175/JCLI-D-11-00676.1, 2013.
Nasrollahi, N., AghaKouchak, A., Cheng, L., Damberg, L., Phillips, T. J., Miao, C., Hsu, K., and Sorooshian, S.: How well do CMIP5 climate simulations replicate historical trends and patterns of meteorological droughts?, Water Resour. Res., 4, 2847–2864, https://doi.org/10.1002/2014WR016318, 2015.
Nguyen-Ngoc-Bich, P., Phan-Van, T., Ngo-Duc, T., Vu-Minh, T., Trinh-Tuan, L., Tangang, F. T., Juneng, L., Cruz, F., Santisirisomboon, J., Narisma, G., and Aldrian, E.: Projected evolution of drought characteristics in Vietnam based on CORDEX-SEA downscaled CMIP5 data, Int. J. Climatol., 41, 1–19, https://doi.org/10.1002/joc.7150, 2021.
Oikonomou, P. D., Karavitis, C. A., Tsesmelis, D. E., Kolokytha, E., and Maia, R.: Drought Characteristics Assessment in Europe over the Past 50 Years, Water Resour. Manag., 15, 4757–4772, https://doi.org/10.1007/s11269-020-02688-0, 2020.
Olsson, J., Berg, P., and Kawamura, A.: Impact of RCM Spatial Resolution on the Reproduction of Local, Subdaily Precipitation, J. Hydrometeorol., 2, 534–547, https://doi.org/10.1175/JHM-D-14-0007.1, 2015.
Pal, J. S., Small, E. E., and Eltahir, E. A. B.: Simulation of regional-scale water and energy budgets: Representation of subgrid cloud and precipitation processes within RegCM, J. Geophys. Res., 105, 29579–29594, https://doi.org/10.1029/2000JD900415, 2000.
Peres, D. J., Senatore, A., Nanni, P., Cancelliere, A., Mendicino, G., and Bonaccorso, B.: Evaluation of EURO-CORDEX (Coordinated Regional Climate Downscaling Experiment for the Euro-Mediterranean area) historical simulations by high-quality observational datasets in southern Italy: insights on drought assessment, Nat. Hazards Earth Syst. Sci., 20, 3057–3082, https://doi.org/10.5194/nhess-20-3057-2020, 2020.
Petrovic, D.: WRF model configuration and data used for the NHESS manuscript “Droughts in Germany: Performance of Regional Climate Models in reproducing observed characteristics”, Zenodo [data set], https://doi.org/10.5281/zenodo.6577187, 2022.
Pietikäinen, J.-P., Markkanen, T., Sieck, K., Jacob, D., Korhonen, J., Räisänen, P., Gao, Y., Ahola, J., Korhonen, H., Laaksonen, A., and Kaurola, J.: The regional climate model REMO (v2015) coupled with the 1-D freshwater lake model FLake (v1): Fenno-Scandinavian climate and lakes, Geosci. Model Dev., 11, 1321–1342, https://doi.org/10.5194/gmd-11-1321-2018, 2018.
Piriou, J. M., Redelsperger, J. L., Geleyn, J. F., Lafore, J. P., and Guichard, F.: An approach for convective parameterization with memory: Separating microphysics and transport in grid-scale equations, J. Atmos. Sci., 64, 4127–4139, https://doi.org/10.1175/2007JAS2144.1, 2007.
Potopová, V., Štěpánek, P., Zahradníček, P., Farda, A., Türkott, L., and Soukup, J.: Projected changes in the evolution of drought on various timescales over the Czech Republic according to Euro-CORDEX models, Int. J. Climatol., 38, e939–e954, https://doi.org/10.1002/joc.5421, 2018.
Prein, A. F., Gobiet, A., Truhetz, H., Keuler, K., Goergen, K., Teichmann, C., Fox Maule, C., van Meijgaard, E., Déqué, M., Nikulin, G., Vautard, R., Colette, A., Kjellström, E., and Jacob, D.: Precipitation in the EURO-CORDEX 0.11∘ and 0.44∘ simulations: high resolution, high benefits?, Clim. Dynam., 1–2, 383–412, https://doi.org/10.1007/s00382-015-2589-y, 2016.
Rasch, P. J. and Kristjánsson, J. E.: A Comparison of the CCM3 Model Climate Using Diagnosed and Predicted Condensate Parameterizations, J. Climate, 7, 1587–1614, https://doi.org/10.1175/1520-0442(1998)011<1587:ACOTCM>2.0.CO;2, 1998.
Rauscher, S. A., Coppola, E., Piani, C., and Giorgi, F.: Resolution effects on regional climate model simulations of seasonal precipitation over Europe, Clim. Dynam., 4, 685–711, https://doi.org/10.1007/s00382-009-0607-7, 2010.
Rauscher, S. A., O'Brien, T. A., Piani, C., Coppola, E., Giorgi, F., Collins, W. D., and Lawston, P. M.: A multimodel intercomparison of resolution effects on precipitation: simulations and theory, Clim. Dynam., 7–8, 2205–2218, https://doi.org/10.1007/s00382-015-2959-5, 2016.
Rebetez, M., Mayer, H., Dupont, O., Schindler, D., Gartner, K., Kropp, J. P., and Menzel, A.: Heat and drought 2003 in Europe: a climate synthesis, Ann. Forest Sci., 6, 569–577, https://doi.org/10.1051/forest:2006043, 2006.
Rechid, D., Hagemann, S., and Jacob, D.: Sensitivity of climate models to seasonal variability of snow-free land surface albedo, Theor. Appl. Climatol., 1–2, 197–221, https://doi.org/10.1007/s00704-007-0371-8, 2009.
Ritter, B. and Geleyn, J.-F.: A Comprehensive Radiation Scheme for Numerical Weather Prediction Models with Potential Applications in Climate Simulations, Mon. Weather Rev., 2, 303–325, https://doi.org/10.1175/1520-0493(1992)120<0303:ACRSFN>2.0.CO;2, 1992.
Rockel, B., Will, A., and Hense, A.: The Regional Climate Model COSMO-CLM (CCLM), Metz, 4, 347–348, https://doi.org/10.1127/0941-2948/2008/0309, 2008.
Samuelsson, P., Gollvik, S., Kupiainen, M., Kourzeneva, E., and van de Berg, W. J.: The surface processes of the Rossby Centre regional atmospheric climate model (RCA4), Swedish Meteorological and Hydrological Institute (SMHI), 2015.
Savijärvi, H.: Fast Radiation Parameterization Schemes for Mesoscale and Short-Range Forecast Models, J. Appl. Meteorol. Clim., 6, 437–447, https://doi.org/10.1175/1520-0450(1990)029<0437:FRPSFM>2.0.CO;2, 1990.
Senatore, A., Hejabi, S., Mendicino, G., Bazrafshan, J., and Irannejad, P.: Climate conditions and drought assessment with the Palmer Drought Severity Index in Iran: evaluation of CORDEX South Asia climate projections (2070–2099), Clim. Dynam., 1–2, 865–891, https://doi.org/10.1007/s00382-018-4171-x, 2019.
Sheffield, J., Wood, E. F., and Roderick, M. L.: Little change in global drought over the past 60 years, Nature, 7424, 435–438, https://doi.org/10.1038/nature11575, 2012.
Siebesma, A. P., Soares, P. M. M., and Teixeira, J.: A Combined Eddy-Diffusivity Mass-Flux Approach for the Convective Boundary Layer, J. Atmos. Sci., 4, 1230–1248, https://doi.org/10.1175/JAS3888.1, 2007.
Skamarock, W., Klemp, J., Dudhia, J., Gill, D., Barker, D., Duda, M., Huang, X., Wang, W., and Powers, J. A.: Description of the Advanced Research WRF Version 3; Tech. Rep. NCAR/TN-475+STR, NCAR TECHNICAL NOTE, University Corporation for Atmospheric Research: Boulder, CO, USA, p. 113, 2008.
Spinoni, J., Naumann, G., Carrao, H., Barbosa, P., and Vogt, J.: World drought frequency, duration, and severity for 1951–2010, Int. J. Climatol., 8, 2792–2804, https://doi.org/10.1002/joc.3875, 2014.
Spinoni, J., Vogt, J. V., Naumann, G., Barbosa, P., and Dosio, A.: Will drought events become more frequent and severe in Europe?, Int. J. Climatol, 4, 1718–1736, https://doi.org/10.1002/joc.5291, 2018.
Spinoni, J., Barbosa, P., Jager, A. de, McCormick, N., Naumann, G., Vogt, J. V., Magni, D., Masante, D., and Mazzeschi, M.: A new global database of meteorological drought events from 1951 to 2016, J. Hydrol.-Regional Studies, 22, 100593, https://doi.org/10.1016/j.ejrh.2019.100593, 2019.
Spinoni, J., Barbosa, P., Bucchignani, E., Cassano, J., Cavazos, T., Christensen, J. H., Christensen, O. B., Coppola, E., Evans, J., Geyer, B., Giorgi, F., Hadjinicolaou, P., Jacob, D., Katzfey, J., Koenigk, T., Laprise, R., Lennard, C. J., Kurnaz, M. L., Li, D., Llopart, M., McCormick, N., Naumann, G., Nikulin, G., Ozturk, T., Panitz, H.-J., Da Porfirio Rocha, R., Rockel, B., Solman, S. A., Syktus, J., Tangang, F., Teichmann, C., Vautard, R., Vogt, J. V., Winger, K., Zittis, G., and Dosio, A.: Future Global Meteorological Drought Hot Spots: A Study Based on CORDEX Data, J. Climate, 9, 3635–3661, https://doi.org/10.1175/JCLI-D-19-0084.1, 2020.
Steiner, A. L., Pal, J. S., Rauscher, S. A., Bell, J. L., Diffenbaugh, N. S., Boone, A., Sloan, L. C., and Giorgi, F.: Land surface coupling in regional climate simulations of the West African monsoon, Clim. Dynam., 6, 869–892, https://doi.org/10.1007/s00382-009-0543-6, 2009.
Štepánek, P., Zahradnícek, P., Farda, A., Skalák, P., Trnka, M., Meitner, J., and Rajdl, K.: Projection of drought-inducing climate conditions in the Czech Republic according to Euro-CORDEX models, Clim. Res., 2, 179–193, https://doi.org/10.3354/cr01424, 2016.
Stoelinga, M. T., Hobbs, P. V., Mass, C. F., Locatelli, J. D., Colle, B. A., Houze, R. A., Rangno, A. L., Bond, N. A., Smull, B. F., Rasmussen, R. M., Thompson, G., and Colman, B. R.: Improvement of Microphysical Parameterization through Observational Verification Experiment, B. Am. Meteorol. Soc., 12, 1807–1826, https://doi.org/10.1175/BAMS-84-12-1807, 2003.
Tamoffo, A. T., Moufouma-Okia, W., Dosio, A., James, R., Pokam, W. M., Vondou, D. A., Fotso-Nguemo, T. C., Guenang, G. M., Kamsu-Tamo, P. H., Nikulin, G., Longandjo, G.-N., Lennard, C. J., Bell, J.-P., Takong, R. R., Haensler, A., Tchotchou, L. A. D., and Nouayou, R.: Process-oriented assessment of RCA4 regional climate model projections over the Congo Basin under 1.5 ∘C and 2 ∘C global warming levels: influence of regional moisture fluxes, Clim. Dynam., 3–4, 1911–1935, https://doi.org/10.1007/s00382-019-04751-y, 2019.
Taylor, K. E.: Summarizing multiple aspects of model performance in a single diagram, J. Geophys. Res., 106, 7183–7192, 2001.
Thompson, R. L., Broquet, G., Gerbig, C., Koch, T., Lang, M., Monteil, G., Munassar, S., Nickless, A., Scholze, M., Ramonet, M., Karstens, U., van Schaik, E., Wu, Z., and Rödenbeck, C.: Changes in net ecosystem exchange over Europe during the 2018 drought based on atmospheric observations, Philos. T. R. Soc. B, 1810, 20190512, https://doi.org/10.1098/rstb.2019.0512, 2020.
Tiedtke, M.: A Comprehensive Mass Flux Scheme for Cumulus Parameterization in Large-Scale Models, Mon. Weather Rev., 8, 1779–1800, https://doi.org/10.1175/1520-0493(1989)117<1779:ACMFSF>2.0.CO;2, 1989.
Tiedtke, M.: Representation of Clouds in Large-Scale Models, Mon. Weather Rev., 11, 3040–3061, https://doi.org/10.1175/1520-0493(1993)121<3040:ROCILS>2.0.CO;2, 1993.
Tompkins, A. M., Gierens, K., and Rädel, G.: Ice supersaturation in the ECMWF integrated forecast system, Q. J. Roy. Meteor. Soc., 622, 53–63, https://doi.org/10.1002/qj.14, 2007.
Torma, C., Giorgi, F., and Coppola, E.: Added value of regional climate modeling over areas characterized by complex terrain-Precipitation over the Alps, J. Geophys. Res.-Atmos., 9, 3957–3972, https://doi.org/10.1002/2014JD022781, 2015.
Tripathi, O. P. and Dominguez, F.: Effects of spatial resolution in the simulation of daily and subdaily precipitation in the southwestern US, J. Geophys. Res.-Atmos., 14, 7591–7605, https://doi.org/10.1002/jgrd.50590, 2013.
Trnka, M., Balek, J., Štěpánek, P., Zahradníček, P., Možný, M., Eitzinger, J., Žalud, Z., Formayer, H., Turňa, M., Nejedlík, P., Semerádová, D., Hlavinka, P., and Brázdil, R.: Drought trends over part of Central Europe between 1961 and 2014, Clim. Res., 2, 143–160, https://doi.org/10.3354/cr01420, 2016.
Um, M.-J., Kim, Y., and Kim, J.: Evaluating historical drought characteristics simulated in CORDEX East Asia against observations, Int. J. Climatol., 13, 4643–4655, https://doi.org/10.1002/joc.5112, 2017.
Umweltbundesamt: Trockenheit – aktuelle Situation, https://www.umweltbundesamt.de/themen/trockenheit-in-deutschland-fragen-antworten (last access: 25 May 2022), 2021.
van der Linden, P., and Mitchell, J. F. B.: ENSEMBLES: climate change and its impacts: summary of research and results from the ENSEMBLES project, Tech Rep. Met Office Hadley Centre, Exeter, Exeter EX1 3PB, UK 160, 2009.
van Meijgaard, E., van Ulft, L. H., Lenderink, G., Roode, S. R. de, Wipfler, E. L., Boers, R. and van Timmermans, R. M. A.: Refinement and application of a regional atmospheric model for climate scenario calculations of Western Europe, KvR report number KvR 054/12, National Research Programme Climate changes Spatial Planning, 2012.
Vautard, R., Gobiet, A., Jacob, D., Belda, M., Colette, A., Déqué, M., Fernández, J., García-Díez, M., Goergen, K., Güttler, I., Halenka, T., Karacostas, T., Katragkou, E., Keuler, K., Kotlarski, S., Mayer, S., van Meijgaard, E., Nikulin, G., Patarčić, M., Scinocca, J., Sobolowski, S., Suklitsch, M., Teichmann, C., Warrach-Sagi, K., Wulfmeyer, V., and Yiou, P.: The simulation of European heat waves from an ensemble of regional climate models within the EURO-CORDEX project, Clim. Dynam., 9–10, 2555–2575, https://doi.org/10.1007/s00382-013-1714-z, 2013.
Vicente-Serrano, S. M., Beguería, S., and López-Moreno, J. I.: A Multiscalar Drought Index Sensitive to Global Warming: The Standardized Precipitation Evapotranspiration Index, J. Climate, 7, 1696–1718, https://doi.org/10.1175/2009JCLI2909.1, 2010.
Vicente-Serrano, S. M., Azorin-Molina, C., Sanchez-Lorenzo, A., Revuelto, J., Morán-Tejeda, E., López-Moreno, J. I., and Espejo, F.: Sensitivity of reference evapotranspiration to changes in meteorological parameters in Spain (1961–2011), Water Resour. Res., 11, 8458–8480, https://doi.org/10.1002/2014WR015427, 2014.
Vicente-Serrano, S. M.: Foreword: Drought complexity and assessment under climate change conditions, CIG, 1, 7–11, https://doi.org/10.18172/cig.2961, 2016.
Vicente-Serrano, S. M., Domínguez-Castro, F., Murphy, C., Hannaford, J., Reig, F., Peña-Angulo, D., Tramblay, Y., Trigo, R. M., Mac Donald, N., Luna, M. Y., Mc Carthy, M., van der Schrier, G., Turco, M., Camuffo, D., Noguera, I., García-Herrera, R., Becherini, F., Della Valle, A., Tomas-Burguera, M., and El Kenawy, A.: Long-term variability and trends in meteorological droughts in Western Europe (1851–2018), Int. J. Climatol., 41, 690–717, https://doi.org/10.1002/joc.6719, 2021.
Vichot-Llano, A., Martinez-Castro, D., Giorgi, F., Bezanilla-Morlot, A., and Centella-Artola, A.: Comparison of GCM and RCM simulated precipitation and temperature over Central America and the Caribbean, Theor. Appl. Climatol., 1–2, 389–402, https://doi.org/10.1007/s00704-020-03400-3, 2021.
Wagner, S. and Kunstmann, H.: High resolution precipitation fields for the planning of urban drainage systems using WRF, SCC Annual Report, 2016.
Warscher, M., Wagner, S., Marke, T., Laux, P., Smiatek, G., Strasser, U., and Kunstmann, H.: A 5 km Resolution Regional Climate Simulation for Central Europe: Performance in High Mountain Areas and Seasonal, Regional and Elevation-Dependent Variations, Atmosphere, 11, 682, https://doi.org/10.3390/atmos10110682, 2019.
Wilhite, D. A. and Glantz, M. H.: Understanding: the Drought Phenomenon: The Role of Definitions, Water Int., 3, 111–120, https://doi.org/10.1080/02508068508686328, 1985.
Wilhite, D. A. and Pulwarty, R. S.: Drought as hazard: understanding the natural and social context, in: Drought and Water Crises: Integrating Science, Management and Policy, Boca Raton, CRC Press, 3, ISBN 0-847-2771-1, 2017.
Yevjevich, V. M.: An objective approach to definitions and investigations of continental hydrologic droughts (Doctoral dissertation), Colorado State University. Libraries, 1967.
Zeng, X.-M., Wang, M., Zhang, Y., Wang, Y., and Zheng, Z.: Assessing the Effects of Spatial Resolution on Regional Climate Model Simulated Summer Temperature and Precipitation in China: A Case Study, Adv. Meteorol., 2016, 7639567, https://doi.org/10.1155/2016/7639567, 2016.
Ziernicka-Wojtaszek, A.: Summer Drought in 2019 on Polish Territory – A Case Study, Atmosphere, 11, 1475, https://doi.org/10.3390/atmos12111475, 2021.