the Creative Commons Attribution 4.0 License.
the Creative Commons Attribution 4.0 License.
 | 17 Nov 2022
Meteorological, impact and climate perspectives of the 29 June 2017 heavy precipitation event in the Berlin metropolitan area
Alberto Caldas-Alvarez
Markus Augenstein
Georgy Ayzel
Klemens Barfus
Ribu Cherian
Lisa Dillenardt
Felix Fauer
Hendrik Feldmann
Maik Heistermann
Alexia Karwat
Frank Kaspar
Heidi Kreibich
Etor Emanuel Lucio-Eceiza
Edmund P. Meredith
Susanna Mohr
Deborah Niermann
Stephan Pfahl
Florian Ruff
Henning W. Rust
Lukas Schoppa
Thomas Schwitalla
Stella Steidl
Annegret H. Thieken
Jordis S. Tradowsky
Volker Wulfmeyer
Extreme precipitation is a weather phenomenon with tremendous damaging potential for property and human life. As the intensity and frequency of such events is projected to increase in a warming climate, there is an urgent need to advance the existing knowledge on extreme precipitation processes, statistics and impacts across scales. To this end, a working group within the Germany-based project, ClimXtreme, has been established to carry out multidisciplinary analyses of high-impact events. In this work, we provide a comprehensive assessment of the 29 June 2017 heavy precipitation event (HPE) affecting the Berlin metropolitan region (Germany), from the meteorological, impacts and climate perspectives, including climate change attribution. Our analysis showed that this event occurred under the influence of a mid-tropospheric trough over western Europe and two shortwave surface lows over Britain and Poland (Rasmund and Rasmund II), inducing relevant low-level wind convergence along the German–Polish border. Over 11 000 convective cells were triggered, starting early morning 29 June, displacing northwards slowly under the influence of a weak tropospheric flow (10 m s−1 at 500 hPa). The quasi-stationary situation led to totals up to 196 mm d−1, making this event the 29 June most severe in the 1951–2021 climatology, ranked by means of a precipitation-based index. Regarding impacts, it incurred the largest insured losses in the period 2002 to 2017 (EUR 60 million) in the greater Berlin area. We provide further insights on flood attributes (inundation, depth, duration) based on a unique household-level survey data set. The major moisture source for this event was the Alpine–Slovenian region (63 % of identified sources) due to recycling of precipitation falling over that region 1 d earlier. Implementing three different generalised extreme value (GEV) models, we quantified the return periods for this case to be above 100 years for daily aggregated precipitation, and up to 100 and 10 years for 8 and 1 h aggregations, respectively. The conditional attribution demonstrated that warming since the pre-industrial era caused a small but significant increase of 4 % in total precipitation and 10 % for extreme intensities. The possibility that not just greenhouse-gas-induced warming, but also anthropogenic aerosols affected the intensity of precipitation is investigated through aerosol sensitivity experiments. Our multi-disciplinary approach allowed us to relate interconnected aspects of extreme precipitation. For instance, the link between the unique meteorological conditions of this case and its very large return periods, or the extent to which it is attributable to already-observed anthropogenic climate change.
- Article
(7471 KB) - Full-text XML
-
Supplement
(9388 KB) - BibTeX
- EndNote


According to the World Economic Forum Global Risks Perception Survey (Forum, 2020), extreme weather is the number one risk by likelihood and one of the top four risks by impact. One of the most impactful weather types is extreme precipitation, which yearly causes local ecosystems and urban areas to suffer important damages and casualties. The probability of occurrence and magnitude of this extreme weather is projected to increase in northern and central Europe in a warming climate, as assessed by the 6th Assessment Report of the Intergovernmental Panel on Climate Change (Douville et al., 2021).
The interaction of processes across scales hampers our comprehension and prediction of heavy precipitation events (HPEs). Extreme precipitation will occur only under favourable synoptic-scale conditions (Brieber and Hoy, 2018) with sufficient moisture transport (Davolio et al., 2020; Caldas-Alvarez et al., 2021), and atmospheric instability (Khodayar et al., 2021), fostered by propitious phases of climate modes (Ehmele et al., 2020). This complexity is further amplified if the impacts of heavy precipitation are to be addressed. In addition to the intensity of the hazard, the impact of an event depends on the exposure and vulnerability of the affected area (Alfieri et al., 2015). This is why multidisciplinary, forensic analysis is a powerful means to deal with the complex interactions underlying an HPE and its impacts. Forensic analysis consists of addressing different aspects of heavy precipitation jointly, so that the interconnections between different findings can be identified. For instance, Bronstert et al. (2018) investigated the Braunsbach flood in 2016, a flash flood event in a sparsely observed area, analysing the damages in the built-up area as well as its geomorphological impacts. Kunz et al. (2013) analysed Hurricane Sandy in 2012, combining an in-depth assessment of its impacts with the usage of information from social networks for event reconstruction. Gochis et al. (2015) and Milrad et al. (2015) presented detailed post-event analyses using measurements, operational data products and application of models especially suited for widespread events in well-observed areas for the Colorado and Alberta floods (2013), respectively. Finally, other studies (e.g. Eden et al., 2016) have complemented forensic studies with climate change attribution experiments.
The favourable synoptic conditions for HPE development in central Europe have been assessed in previous literature. Werner and Gerstengarbe (2010), using weather pattern classification, concluded that summer HPEs over central Europe are often caused by three synoptic situations, a trough over central Europe (Tr), low pressure over central Europe (TM) and a trough over West Europe (TrW), see also Wulfmeyer et al. (2011). Brieber and Hoy (2018) found the highest probabilities for heavy precipitation events in central Germany when a TrW pattern is present, favouring the development of large-scale systems such as Vb-like cyclones or heat lows and prefrontal convergence zones. Depending on the location of the small-scale disturbances, warm and moist air masses are transported from southern Europe towards Germany. When temperatures are already very high, the resulting increased CAPE (convective available potential energy) leads to localised extreme precipitation (Bronstert et al., 2018).
A full understanding of the meteorological drivers and (small-scale) physical processes of extreme precipitation can benefit from high-resolution observations and model simulations. Numerical models offer a robust tool to simulate extreme precipitation events with fine-scale spatio-temporal detail. Furthermore, numerical models can also be used to create climate time series long enough to capture multi-decadal variability and numerous extreme events (Ehmele et al., 2020; Pichelli et al., 2021). Over the last decade, increased computing power has seen the growing use of kilometre-scale “storm-resolving” or convection-permitting models (CPMs; Berg et al., 2012; Barthlott and Hoose, 2015; Schwitalla et al., 2020; Stevens et al., 2020; Lucas-Picher et al., 2021), in which spatial resolution is sufficiently high (Δx<3 km) to explicitly simulate deep convection. CPMs have thus shown added value for the simulation of sub-daily extreme precipitation intensities, their spatial extent and duration, as well as their diurnal cycles (Kendon et al., 2012; Warrach-Sagi et al., 2013; Fosser et al., 2014; Stevens et al., 2020; Meredith et al., 2021). This added value offers important utility for climate-change attribution studies since CPMs give a better representation of convective extremes and are thus more reliable for detecting their climate-change response (Prein et al., 2013, 2015; Ban et al., 2021).
The impacts of extreme precipitation and the resulting pluvial flooding on society can include the loss of life, physical damage to assets such as buildings or infrastructure, as well as intangible consequences such as health impacts or traffic disruptions (Merz et al., 2010; Rözer et al., 2016). The impacts depend on the hazard intensity, and the exposed assets and their vulnerability (Kron, 2005). The hazard level itself is a function of meteorological factors, e.g. precipitation intensity or affected area. The exposure and vulnerability depend on aspects such as the inundation depth, the topography, the degree of sealing of surfaces or the sewer system capacity (Kron, 2005; Smith et al., 2015).
To analyse the associated impacts, not only are meteorological data crucial, but also targeted information collected during or after an event, e.g. damage to buildings and contents. Such data can be collected, for example, through surveys of affected households or through assessments by loss surveyors during insurance claim validation (Spekkers et al., 2014, 2017; Van Ootegem et al., 2015, 2018; Rözer et al., 2019). However, when analysing damage records, it is important to consider that results depend on how the affected society understands, records and remembers those impacts (Kuhlicke et al., 2020). The case under study here, the 29 June 2017 HPE in the metropolitan Berlin area (Germany), has been investigated before based on survey data of affected households in Berlin–Brandenburg. Berghäuser et al. (2021) and Dillenardt et al. (2021) addressed the tangible and intangible consequences of extreme precipitation and associated pluvial flooding for households for this event, respectively, but a focused analysis comparing its impacts to those of similar HPEs in the climatology is still lacking.
From the climate perspective, information on how the frequency of HPEs has changed in the recent climate is demanded by interested stakeholders. This can be provided through estimation of probabilities of exceedance or return periods for specific events. Generalised extreme value (GEV) models can be fitted to a climate observational precipitation data set to derive this information (Wilks, 2006). Previous studies have provided estimations of return periods for similar events, finding extreme values of over 200 years for the Seine River flooding (France) in 2016 (Philip et al., 2018), the Braunsbach flooding (southern Germany) in 2016 (Piper et al., 2016) and the 3-week flooding in Germany in 2018 (Mohr et al., 2020). The flooding in July 2021 in the Ahr, Erft and Meuse rivers was analysed by Kreienkamp et al. (2021), who found that an event of similar meteorological characteristics can be expected in the present climate in central Europe once every 400 years.
Also at the climate scale, extreme event attribution has proven useful to estimate how the severity and/or likelihood of an event has been affected by anthropogenic influences (Allen, 2003; Stott et al., 2004; Otto, 2017). Anthropogenic influence typically refers to climate change, but could also include, e.g. land-use changes (Sebastian et al., 2019) or changes in atmospheric pollutants (Liu et al., 2020). To this end there are two mainly-used approaches. The first approach is probabilistic event attribution, which consists of simulating how the dynamics of the climate system evolve under climate change. It can therefore be used to detect significant changes in the severity and frequency of extreme events. This technique, however, is applicable to model data with a relatively coarse resolution, and is therefore best suited for attribution studies of large-scale events. The second approach is conditional event attribution (Trenberth et al., 2015), which evaluates to what extent observed climate change may have impacted the magnitude of an event. The attribution is thus conditional on the presence of a given dynamical situation, and implies that thermodynamic changes due to climate change have been demonstrated. However, a limitation of this approach is that changes in the probability of the event's underlying dynamical situation cannot be determined.
The research presented here has been carried out in the framework of the Germany-based project Climate change and eXtreme events (ClimXtreme), which brings together governmental and research institutions in the fields of atmospheric physics, statistics, impact studies and computing. This framework facilitates the multi-disciplinary approach of this study, where in addition to the usual communication and collaboration tools, the ClimXtreme Central Evaluation System (XCES) (Kadow et al., 2021) has allowed centralised consultation and analysis of all the data within the project.
The aim of this study is to provide a comprehensive assessment of the 29 June 2017 HPE in the area of Berlin (Germany) from the meteorological, impacts and climate perspectives, including climate change attribution. The paper is structured as follows: in Sect. 2 we present the observational and modelling data sets used, and in Sect. 3 the particular techniques and methodologies used are introduced. Section 4 shows the main analyses and outcome of our work ,and in Sect. 5 we present our conclusions and outlook.
2.1 Observations
2.1.1 REGionalisierte NIEederschlaege (REGNIE)
REGNIE is a gridded data set of 24 h totals (from 06:00 to 06:00 UTC) based on approximately 2000 rain gauges distributed across Germany. A post-processing is applied to station data for regridding to a 1×1 km2 mesh taking into account elevation, exposure and climatology, avoiding smoothing observed precipitation extremes (Rauthe et al., 2013; Hu and Franzke, 2020). The data are provided by the German Meteorological Service (Deutscher Wetterdienst, DWD) from 1951 for all of Germany (for the former West Germany, the daily values are available since 1931). The long-term availability of REGNIE is its main advantage for climate studies.
2.1.2 RADar KLIMatologie (RADKLIM)
RADKLIM is a precipitation climate data set derived from the C-band radar network (17 radar sites) operated by DWD. The data set comprises two products; the gauge-adjusted 1 h precipitation sum (RW) and the quasi gauge-adjusted 5 min precipitation rate (YW), with 1×1 km2 resolution. The data are post-processed using the Radar-Online-Aneichung (RADOLAN) method, correcting existing artifacts by adjusting precipitation sums from the radar with precipitation measurements from rain gauge stations (Bartels et al., 2004). Due to the dense spatial and temporal resolution, RADKLIM detects short-term, convective extreme intensities frequently missed by station data (Lengfeld et al., 2020; Winterrath et al., 2017).
2.1.3 Deutscher Wetterdienst (DWD) stations
Daily precipitation measurements from the DWD high-density network were used as reference. The data are quality controlled, but a continuous homogenization is not applied. Hence, the data could be subject to partial inhomogeneities, such as station relocations or changes in the instrumentation (Kaspar et al., 2013). The DWD high-density network has a high accuracy and resolution (Kaspar et al., 2013), and therefore we select it for validation. Nonetheless, this data set is used for deriving the REGNIE gridded product and for adjusting RADKLIM which makes these data sets dependent. We concede this dependency to profit from the best rain gauges product available in the region.
2.1.4 EUropean Cooperation for LIghtning Detection (EUCLID)
The lightning activity in and around Berlin is investigated with data from the ground-based low-frequency lightning detection system EUropean Cooperation for LIghtning Detection (EUCLID) network, which covers the whole European continent (Drüe et al., 2007; Schulz et al., 2016; Poelman et al., 2016). Cloud-to-ground strokes are used to illustrate the temporal development of convective activity during the extreme event, similar to Piper and Kunz (2017) and Wilhelm et al. (2021). The spatial resolution of EUCLID has been improved to less than 90 m in the year 2016 due to algorithm optimisations (Schulz et al., 2016).
2.1.5 CAtalogue of Radar-based heavy Rainfall Events (CatRaRE)
The RADKLIM data set at 1 h and 1×1 km2 km resolution (RW) was used as the basis to derive an HPE catalogue for Germany (CatRaRE) for the period 2001 to 2020. Here we use version 2017.002 (Lengfeld et al., 2021a, b), including precipitation sums with 11 different accumulation periods (1, 2, 3, 4, 6, 9, 12, 18, 24, 48 and 72 h). For each duration and timestep, extreme events are detected based on the DWD warning level (WL) 3 for severe weather, or if they have a return period of 5 years. The duration in hours, the affected area in km2, the location (county and community), the maximum and mean precipitation amount in mm, and affected residents in the event area, and further meta information is included.
2.2 Reanalyses
2.2.1 ERA5
ERA5 data are used to identify and track the low pressure systems, find moisture sources and force numerical simulations. This is the fifth generation of the European Center for Medium-range Weather Forecasts' (ECMWF) atmospheric reanalysis of the global climate (Hersbach et al., 2020). It has a spatial resolution of 31×31 km2 and is available from 1950 to present at hourly resolution. ERA5 is based on the Integrated Forecasting System (IFS) and uses a 4D-Var assimilation scheme, assimilating different observation types. ERA5 has demonstrated a good performance in representing heavy precipitation (Keller and Wahl, 2021).
2.2.2 COSMO-REA6
COSMO-REA6 is a regional reanalysis product for the European CORDEX domain, developed by University of Bonn and the Hans-Ertel-Centre for Weather Research. It has a 6×6 km horizontal resolution and is available from January 1995 to August 2019. It is based on the NWP-system COSMO and uses a nudging scheme for data assimilation. Subgrid-scale convection is parameterised with the Tiedtke scheme (Tiedtke, 1989) and precipitation from meteorological stations or radar is not assimilated (Bollmeyer et al., 2015). COSMO-REA6 has shown low biases for extreme precipitation compared to other reanalysis products (Keller and Wahl, 2021).
2.3 Convection-permitting models
2.3.1 Weather Research and Forecasting (WRF)
WRF model version 4.2.1 (Skamarock et al., 2021) at a convection-permitting resolution of 1.5 km with 100 vertical levels is used. The model domain covers central Europe (Fig. 1a) and the simulation was initialised with the operational ECMWF analysis at 00:00 UTC on 29 June 2017 (12 h before the event). Lateral boundary conditions were provided every 6 h. The setup of the physical parameterisations is similar to Schwitalla et al. (2021) except that (1) the Mellor–Yamada–Nakanishi–Niino (MYNN) planetary boundary layer parametrization (Nakanishi and Niino, 2006, 2009; Olson et al., 2019) is applied, and (2) the microphysics scheme of Thompson and Eidhammer (2014) is used. Land cover maps have been updated using the high-resolution European Space Agency Climate Change Initiative (ESA CCI) data set (ESA, 2017). In addition, the green vegetation fraction and leaf area index (LAI) have been adjusted for 2017 by means of the Copernicus Global Land Service portfolio 1 km resolution data sets (https://land.copernicus.eu/global/, last access: 15 November 2022). Finally, high-resolution soil texture data from Poggio et al. (2021) (https://soilgrids.org, last access: 15 November 2022) were used.
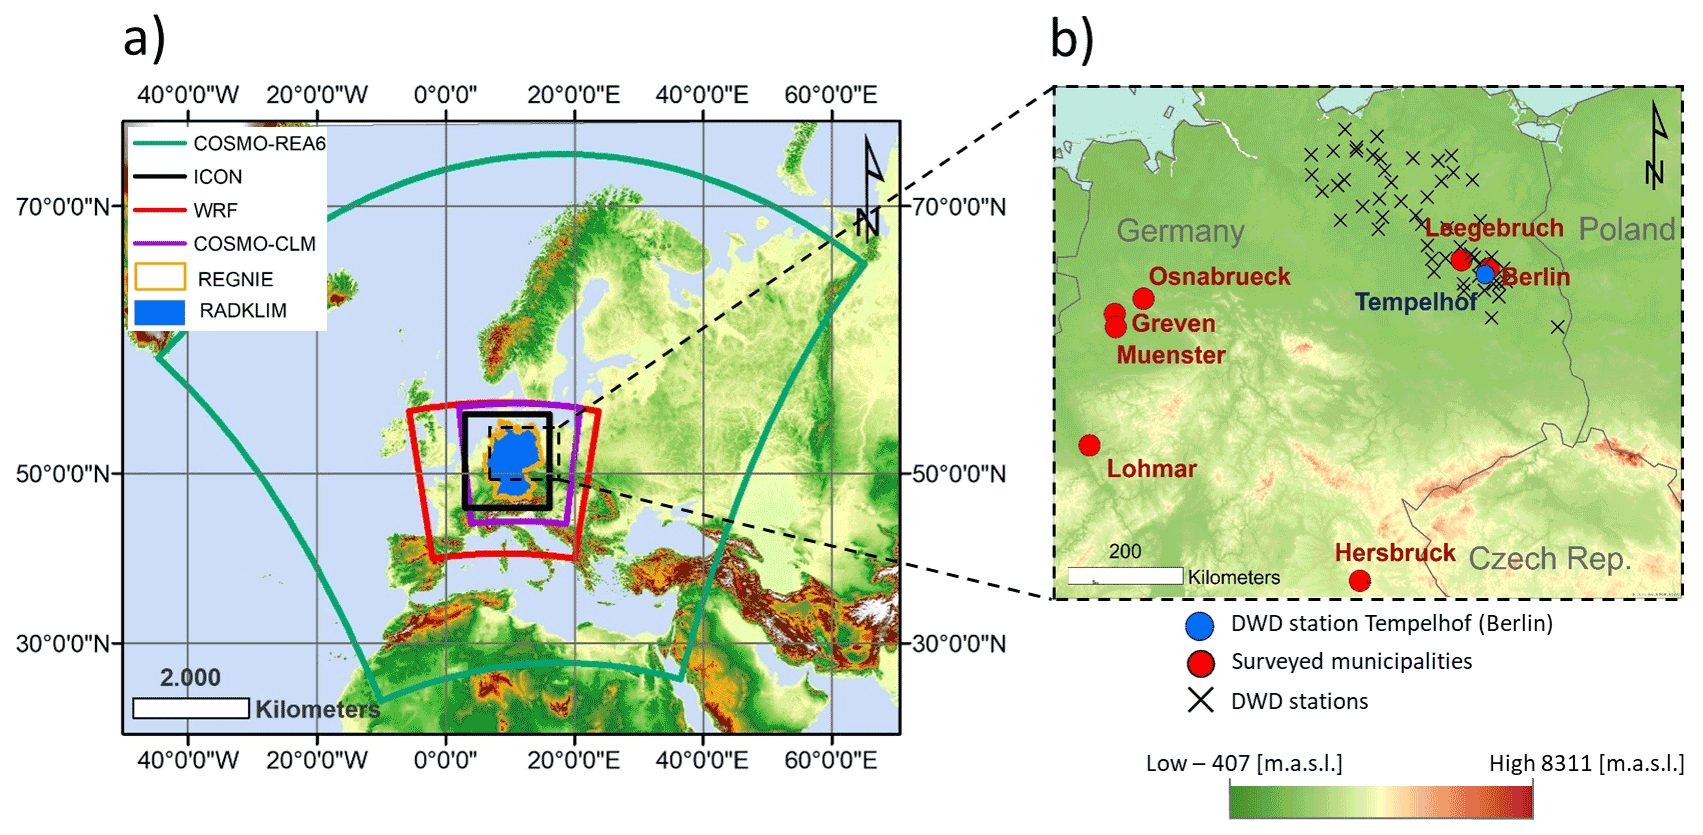
Figure 1(a) Spatial extent of the used data sets REGNIE, RADKLIM, COSMO-REA6, WRF-1.5 km, ICON-625 m and COSMO-CLM-2.8. (b) Close-up view of Berlin and surroundings, and the DWD stations used for validation (crosses), the location of surveyed events from Table 1 (red dots) and the Berlin–Tempelhof station analysed in Fig. 11 (blue dot), basemap: Global Land One-kilometer Base Elevation (GLOBE) (Hastings et al., 1999).
2.3.2 Consortium for Small-Scale Modelling in CLimate Mode (COSMO-CLM)
COSMO-CLM version 5.0_clm16 is run at a convection-permitting resolution of 0.025∘. The model has grid points (lat/lon/height), a model top at 22.7 km and a relaxation zone of 50 km. Hourly lateral boundary conditions include cloud ice, cloud water and cloud graupel, and are provided by ERA5-forced 0.11∘ simulations (Sect. 3.6). Deep convection is treated explicitly and shallow convection is parameterised with a modified Tiedtke scheme (Tiedtke, 1989). A full description of all model physics is found in Baldauf et al. (2011).
2.3.3 ICOsahedral Non-hydrostatic model (ICON)
The ICON simulations follow Costa-Surós et al. (2020) and were initialised with the operational ECMWF analysis (IFS data) at 00:00 UTC on 29 June 2017, and lateral boundary conditions are provided every 6 h. For analysis, the daytime period between 06:00 and 20:00 UTC is chosen.
This section introduces the methods used in the different aspects of the analysis.
3.1 The precipitation severity index (PSI)
We use the precipitation severity index (PSI; Caldas-Alvarez et al., 2022) to detect extreme precipitation events according to three different but complementary characteristics of heavy precipitation: intensity, spatial extent and persistence. The PSI in its current form is an adaptation of the storm severity index (SSI; Leckebusch et al., 2008; Pinto et al., 2012) and is a unitless index that indicates the degree of daily precipitation severity with respect to a predetermined climatological threshold (in our case the 80th percentile). Large PSI values represent high intensity, geographically extensive and temporally persistent precipitation events.
3.2 Lagrangian convective cell tracking
We perform Lagrangian convective cell tracking for the years 2001 to 2020 for a region of 200×200 km centered over Berlin. Pixels of YW RADKLIM radar data exceeding a threshold of 8.12 mm h−1 were identified as convective cells (Purr et al., 2021). The displacement of the cell is projected applying the 700 hPa wind of ERA5. If in the consecutive timestep a convective cell has been found in the area defined by a search radius around the projected position, both cells are assigned to the same cell track. If multiple cells are found within the search radius, the cell with the minimum distance is assigned to the cell track.
3.3 Lagrangian moisture backward trajectories
We calculate Lagrangian backward trajectories following Sodemann et al. (2008), based on ERA5 reanalysis data (Hersbach et al., 2020), in a mid-European region around the center of maximum precipitation (red box in Fig. 9). We start the trajectories from 1000 to 200 hPa in steps of 50 hPa for every hour of 29 June 2017, with a horizontal grid spacing 80 km and going back 240 h in time. From all trajectories, we selected those that have a relative humidity of at least 80 % in the target box and for which the specific humidity decreases during the last timestep (precipitation) (Sodemann et al., 2008; Grams et al., 2014). Along each selected trajectory, moisture uptake has been computed based on hourly specific humidity increases in the planetary boundary layer associated with evapotranspiration from the surface. The boundary layer height is available as a diagnostic model variable in the ERA5 data set and, again following Sodemann et al. (2008), is multiplied by a factor of 1.5 to account for potential uncertainties in this diagnostic estimate. These uptakes have been weighted according to their contribution to the precipitation (moisture loss) at the target location, taking into account that earlier moisture uptake may contribute less due to precipitation loss on their way to the target region.
3.4 Household surveys for impact evaluation
To assess the overall losses caused by the 29 June 2017 HPE, we review reports from the German Insurance Association (GDV), which published loss estimates for severe extreme precipitation events in Germany in the period 2002–2019 (GDV, 2018, 2020, 2021), and other technical reports (Hydrotec et al., 2008). At the household level, we use losses, flood-duration and flood-depth data derived from household surveys in Berlin and Brandenburg (Dillenardt et al., 2021). We furthermore use survey data from private households in Hersbruck (affected in 2005), Lohmar (affected in 2005), Osnabrueck (affected in 2010) (Rözer et al., 2016) and Muenster (affected in 2014) (Spekkers et al., 2017). In the surveys, affected households were asked, inter alia, when they were last affected by heavy rain and what impact they suffered. The results of the surveys are based on the responses of those households and are thus subjective.
3.5 Generalised extreme value (GEV) statistics
The standard GEV distribution applied to heavy precipitation in this work is given by Coles (2001)
where μ denotes the location parameter, σ the scale (σ>0) and ξ the shape parameter. A special case of the standard distribution (Eq. 1) is the Type I or Gumbel distribution (Gumbel, 1958) obtained in the limit ξ→0 used as well in previous works (e.g. Grieser et al., 2007; Svensson and Jones, 2010; Van den Besselaar et al., 2013; Maity, 2018; Piper et al., 2016):
This simplification allows estimation of the two free GEV parameters μ and σ by means of the method of moments, which is less computationally intensive and has been proven useful in the past (e.g. Svensson and Jones, 2010; DWA, 2012; Piper et al., 2016). Characteristic of the Gumbel distribution is an exponential decay of the probability density function, meaning that only two free parameters of the GEV fit have to be estimated. However, the Gumbel is not a heavy-tailed distribution and is characterised by constant skewness and kurtosis.
We fit block maxima series to Eqs. (1) and (2) obtained by splitting the sample into non-overlapping intervals of the same size and then taking the maximum value of each interval. Previous studies have demonstrated that the annual block maxima approach is suitable for mid-latitude precipitation series (Kharin and Zwiers, 2000; Rust, 2009). We specify the uncertainty of the models by using 95 % confidence intervals obtained from 1000-fold boot/strapping (re-sampling with replacement) from the maxima series of the original data set (Efron and Tibshirani, 1993), following the ordinary non-parametric bootstrap percentile method of Mélèse et al. (2018). From these 1000 samples the 2.5 % and 97.5 % quantiles of the wanted property (either return periods or return values) indicate their confidence boundaries.
We further implement a duration-dependent (d-GEV) model with seven parameters, which covers different durations to achieve a more efficient usage of observations. This way, information about short timescales (minutes to hours), can be derived, to a certain extent, from information of longer time scales (hours to days). Duration-dependency is incorporated into the GEV in order to reduce assumptions about the underlying distribution and have a free shape parameter ξ in the GEV (Coles, 2001). Another reason for using the GEV instead of one of their special cases is that Gumbel, and the other two GEV special cases Fréchet and Weibull, require large data sets to fulfil the limiting theorem for large block sizes (Papalexiou and Koutsoyiannis, 2013). The d-GEV includes all three types and is a good choice if block size does not reach the asymptotic regime required for Gumbel. A duration-dependent GEV (d-GEV) as suggested by Koutsoyiannis et al. (1998) and refined by Fauer et al. (2021) is introduced by varying the characteristic parameters of the GEV as follows:
where is the re-scaled location parameter, σ0 is the scale offset, θ is the duration offset, η1 and η2 are duration exponents and τ is the intensity offset. Parameters were estimated with maximum likelihood estimation (MLE), a flexible and efficient parameter estimation method which is known to provide asymptotically unbiased and smallest-possible variant estimates (Coles, 2001; Davison and Huser, 2015). However, MLE is more computationally expensive than the method of moments. Jurado et al. (2020) justified the use of the MLE for duration-dependent extreme precipitation studies as the explicit consideration of the dependence between durations in a model leads to only marginal differences in estimation. The d-GEV has been recently applied successfully by Ulrich et al. (2020).
3.6 Conditional event attribution with CPM
For the conditional climate-change attribution experiment (Sect. 4.5), high-resolution ensembles (17 members) of the event under present and pre-industrial conditions are simulated with the COSMO-CLM (Rockel et al., 2008). For the present climate, ERA5 reanalysis (Hersbach et al., 2020) is dynamically downscaled to 0.11∘ for 17 members (Fig. S3) using the domain-shift ensemble technique (e.g. Rezacova et al., 2009; Noyelle et al., 2019). All members are then further dynamically downscaled to a convection-permitting 0.025∘ resolution over a geographically fixed subdomain (see Sect. 2.3.2). To create the pre-industrial ensemble, the warming signal since the pre-industrial period, here taken as 1850–1859 versus 2007–2016 (over the 0.11∘ domain), is first computed from a subset of 17 Coupled Model Intercomparison Project Phase 6 (CMIP6) models (O'Neill et al., 2016). The warming signal (Fig. 12a) is then subtracted from the ERA5 initial and boundary conditions of the 0.11∘ simulations (surface temperatures are modified based on the warming signal at the lowest model level). A similar procedure is repeated for soil temperature. The atmospheric moisture content is adjusted based on the assumption that relative humidity remains constant. Pressure at the COSMO-CLM height levels is adjusted by numerically integrating the hydrostatic balance equation downwards from the model top (Kröner, 2016). The 0.11 and 0.025∘ simulations are initialised on 28 June at 12:00 and 23:00 UTC, respectively, giving sufficient spin-up and adjustment time prior to the analysis period of 07:00 to 22:00 UTC the following day (chosen based on the analysis in Fig. S4). The attribution analysis consists of comparing the precipitation between the 0.025∘ ensembles with the pre-industrial ensemble as the reference state. COSMO-CLM model settings are as described in Meredith et al. (2021). Further details of the simulations and the CMIP6 models can be found in the supplementary material.
3.7 Aerosol sensitivity experiments
Simulations with the ICOsahedral Non-hydrostatic (ICON) atmospheric model were conducted to examine the possible role of anthropogenic aerosols in the analysed event. The model domain covered central Europe (Fig. 1), for which one-way nested simulations at resolutions of 625 m and 1.25 km, respectively, are produced with 90 vertical levels. Two hectometer ICON simulations are carried out with two different imposed concentrations of cloud condensation nuclei, i.e. one with low concentrations, corresponding to current conditions (CLN), and one with elevated aerosol concentrations (POL), corresponding approximately to the peak aerosol concentrations over central Europe observed in the mid-1980s.
Provided our multi-disciplinary approach, we need to verify that there are no inconsistencies among the different data sets used. To reduce this uncertainty we need to ensure that all of them represent a similar climatology of heavy precipitation in the region. To this end, we provide a quantitative validation of the products REGNIE, RADKLIM, ERA5 and COSMO-REA6 for the period 2001–2018. We compare these data sets pointwise (by selecting the nearest neighbour grid cell) to observations made at 53 DWD stations (Sect. 2.1.3; Fig. 1). COSMO-REA6 is included in this comparison to provide a reference for ERA5 with another reanalysis product. We compute absolute frequencies, as the number of days with a specific amount of precipitation for each data set; the symmetric external dependency index (SEDI), estimating the dependency between an event in the given data set and the reference observations (Ferro and Stephenson, 2011); and the frequency bias as the ratio between the number of events in the data sets and the reference observations (Hogan et al., 2009). The evaluations are made for three precipitation intervals based on the warning levels used operationally by the DWD, namely WL2 (>30 mm), WL3 (>50 mm) and WL4 (>80 mm). The 29 June 2017 HPE falls into the WL4 category.
REGNIE, RADKLIM and COSMO-REA6 perform well in representing the climatology of extreme precipitation (WL4 category). In particular, REGNIE fits best the DWD station observations for absolute frequency (37 events in REGNIE, 34 in the DWD stations at WL4), followed by RADKLIM (24 events in WL4). ERA5 (Fig. 2a) only has 12 events (WL4). Regarding SEDI (Fig. 2b), REGNIE again compares best with station observations, also followed by RADKLIM (Fig. 2b) in contrast to the coarser resolution reanalysis products which show lower SEDI values. However their performance is better for extreme precipitation (WL4). Finally, for frequency bias, REGNIE shows no deviations, RADKLIM has a negative but acceptable bias, i.e. less events detected, and ERA5 performs poorly for all WLs.
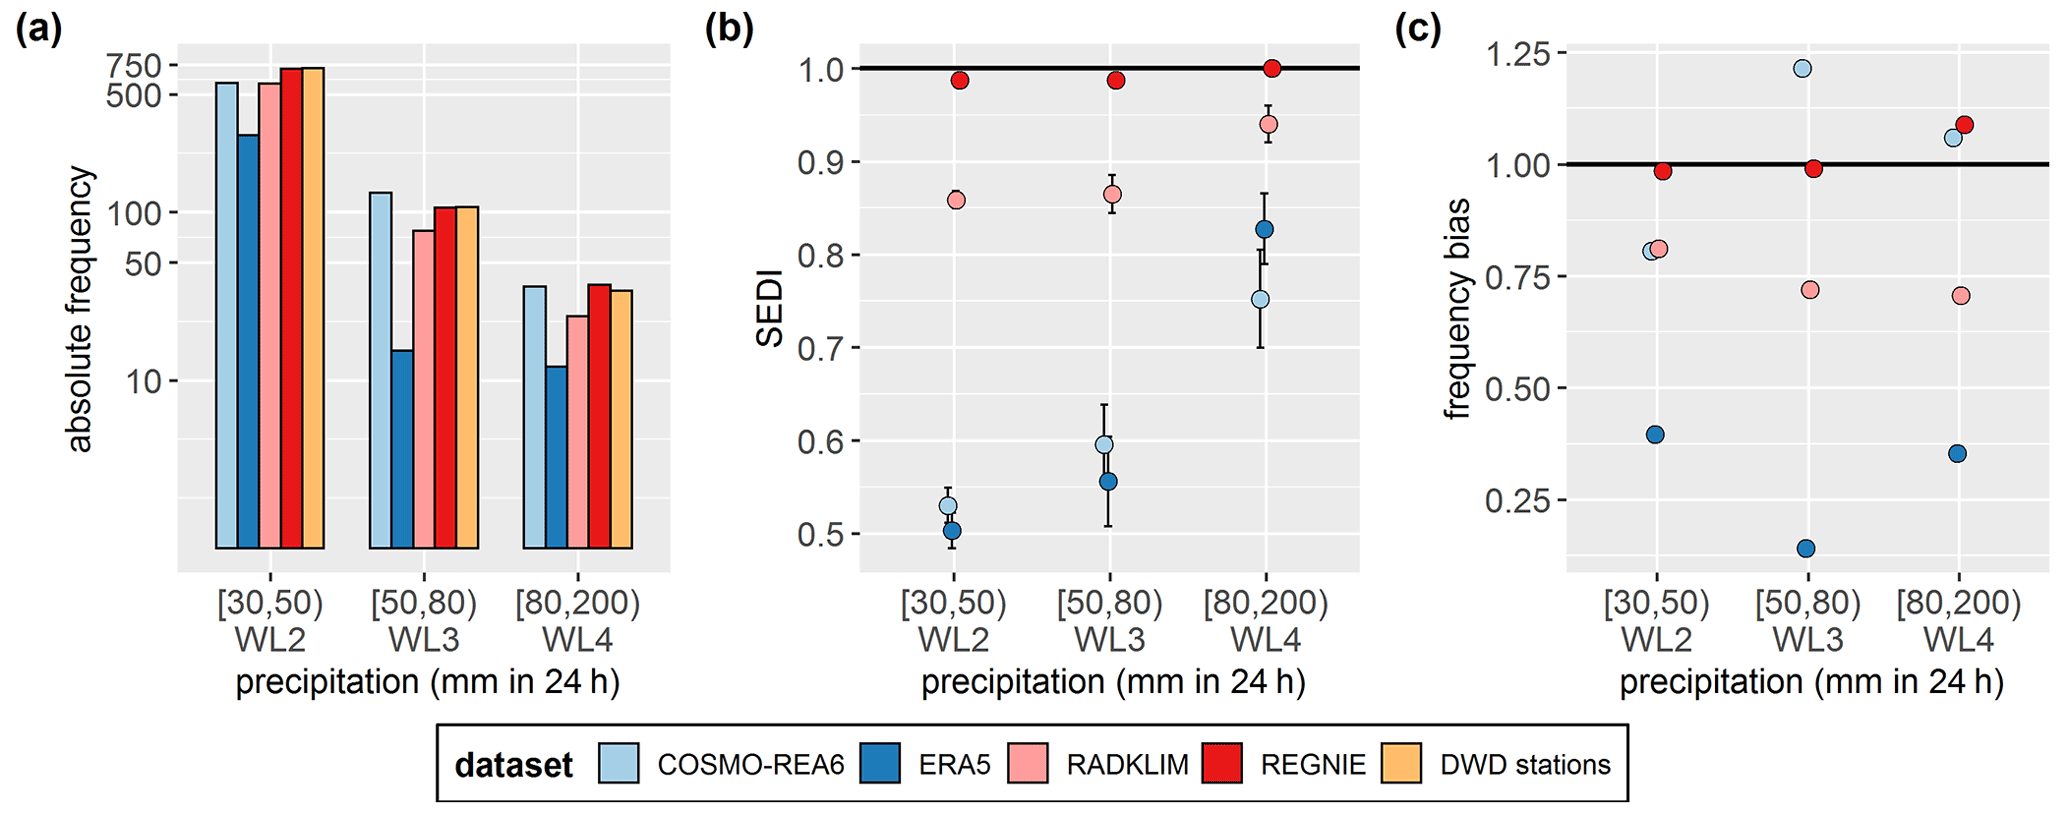
Figure 2Evaluation of daily precipitation estimates from REGNIE, RADKLIM, ERA5 and COSMO-REA6 compared with DWD station observations (see Fig. 1b). The selected period is 2001 to 2018 (concurrent period of data availability), using the nearest neighbour grid cells to the DWD stations. (a) Histogram showing the absolute occurrences of precipitation within WLs 2, 3 and 4, (b) symmetric extremal dependency index (SEDI) and (c) frequency bias. Positive (negative) frequency bias indicates an overestimation (underestimation) of events, the black horizontal line represents the optimum value.

Figure 3(a) 500 hPa geopotential height (dam; colour) and wind speed (m s−1) together with sea level pressure (hPa; contours) and (b) 850 hPa equivalent potential temperature (θe) and wind speed on 29 June 2017 12:00 UTC from the ECMWF analysis. The black dot denotes the city of Berlin.
To summarise, we find a good agreement of REGNIE and RADKLIM with the DWD station observations which gives us confidence that their representation of HPEs will be consistent. ERA5 however showed a bad performance for absolute and frequency bias and the moderate precipitation categories (WL2 and WL3) for SEDI. The performance of ERA5 was worse than the other reanalysis product, COSMO-REA6, possibly due to their difference in model resolution. For this reason ERA5 will not be used hereafter to study heavy precipitation fields. Its use will be restricted to other relevant large-scale atmospheric fields such as water vapour (Fig. 9) that are well constrained by the data assimilation.
4.1 Event analysis and climate context
The 29 June 2017 HPE occurred under the influence of an upper-level trough extending between the Iberian Peninsula and Poland (TrW pattern) between 28 June and 1 July. During this period, several shortwave surface lows developed on the northern side of the trough (Fig. 3a) inducing favourable conditions for convective development. Two small-wave surface lows caused most of the precipitation collected over Berlin during 29 June. The first system, named Rasmund, remained quasi-stationary east of the British Isles between 28 June and 1 July, reaching values of the pressure at the mean sea level (PMSL) of 994 hPa (Fig. 3a). The second surface low, Rasmund II, originated in the night from 28 to 29 June over central Europe (Czech Republic), displaced towards northern Poland over the course of 6 h, and showed PMSL of 990 hPa along the German–Polish border at 12:00 UTC.
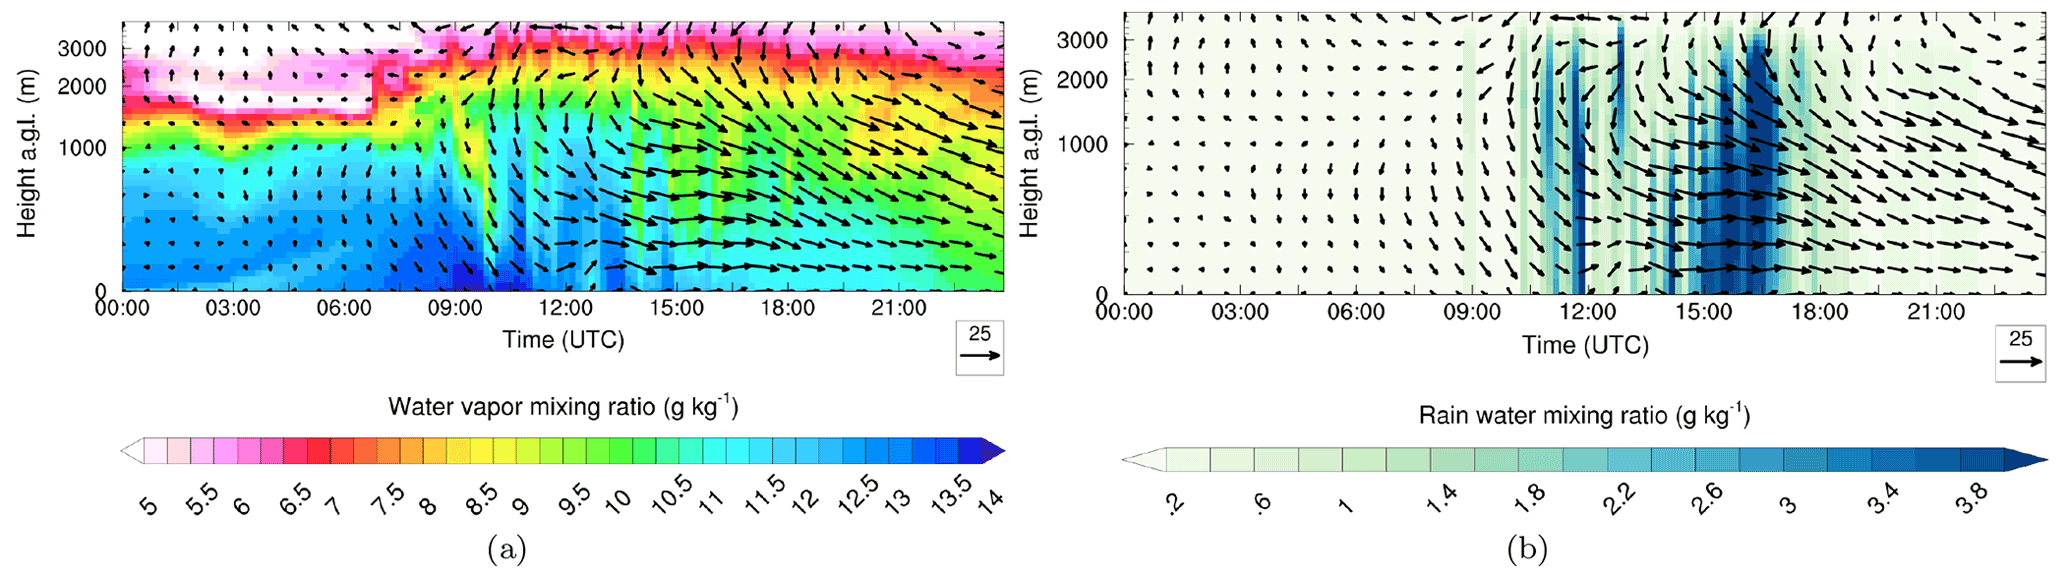
Figure 4Time–height cross section of (a) water vapour mixing ratio (g kg−1) and (b) rain water mixing ratio (g kg−1) at grid point 13.2∘ E and 52.85∘ N (close to the maximum heavy precipitation location, near black dot in Fig. 3) simulated by the WRF model. The displayed period is 00:00 until 23:45 UTC on 29 June 2017. Arrows denote the horizontal wind speed (m s−1, see lower right of the plots for a length indicating 25 m s−1) and direction at the different altitudes. Altitude is above ground level (AGL).
The mesoscale circulation associated with the mid-tropospheric low Rasmund II over northern Poland (550 dam; Fig. 3a) brought a warm and moist cyclonic inflow, crucial for the development of heavy precipitation over Berlin. The equivalent potential temperature (θe) at 850 hPa (Fig. 3b) showed values up to 305 K from the Mediterranean up to Poland and Berlin, indicative of a high moisture availability and optimal conditions for associated stationary deep–moist convection. Mixed-layer convective available potential energy (ML-CAPE) at the site was moderate, of approx. 250 J kg−1, while convective inhibition (CIN) was close to zero, as shown for the Lindenberg station (black dot in Fig. 3) at 06:00 UTC 29 June 2017.
The triggering mechanism was a low-level convergence line fostered by the counter circulations of Rasmund and Rasmund II over eastern Germany (Fig. 3), (Gebauer et al., 2017). The encountering circulations also imposed a weak southerly flow atop with ∼10 m s−1 at 500 hPa (not shown) and less than 5 m s−1 at 850 hPa (black arrows in Fig. 3b). The weak mid-tropospheric flow was responsible for the slow displacement of the convective systems.
Values of precipitable water vapour (PWV) up to 40 mm were measured at the Lindenberg station, near Berlin (Fig. S1 in the Supplement) at 11:30 UTC, and it is probable that water vapour mixing ratios of more than 6.5 g kg−1 were present at 2500 m a.g.l. (above ground level) over Berlin 3 h prior to precipitation initiation. This was shown by WRF 1.5 km simulations (Sect. 2.3.1) covering the greater Berlin area (Fig. 1). For a selected grid point located northwest of Berlin (black dot in Fig. 3a) WRF simulates water vapour mixing ratios of more than 13 g kg−1 in the lowest 100 m above ground between 10:00 and 19:00 UTC together with a strong low- to mid-level jet evolving after 13:00 UTC (Fig. 4a). This low-level jet is probably induced by the temperature gradient between the colder and drier air masses in southwest Germany and the warm and moist air masses over northeastern Germany (Fig. 3b). The simulated rain water mixing ratios exceeded 3.5 g kg−1 (Fig. 4b), potentially indicating a warm-rain type precipitation event (e.g. Song and Sohn, 2018) which is associated with a strong downdraft of ∼5 m s−1 (Fig. S2).
Thunderstorm activity in the border region between northeastern Germany and Poland was already active in the morning starting at 05:00 UTC, shaping up a convective line moving westward from Poland towards the city of Berlin, producing the first cloud-to-ground lightning (Fig. 5a). The system strengthened and hit Berlin mainly between 09:00 and 10:00 UTC. Afterwards, the system weakened and moved only slightly further west due to weak upper-level flow. The convective line remained relatively stationary over the greater Berlin area and west of it until noon (Fig. 5a). Upstream of the system, a second thunderstorm line followed, crossing the border between Poland and Germany between 14:00 and 15:00 UTC. In the late afternoon, the direction of the convective cells changed and they were transported northward affecting Mecklenburg–Western Pommerania and the Baltic Sea after 18:00 UTC.
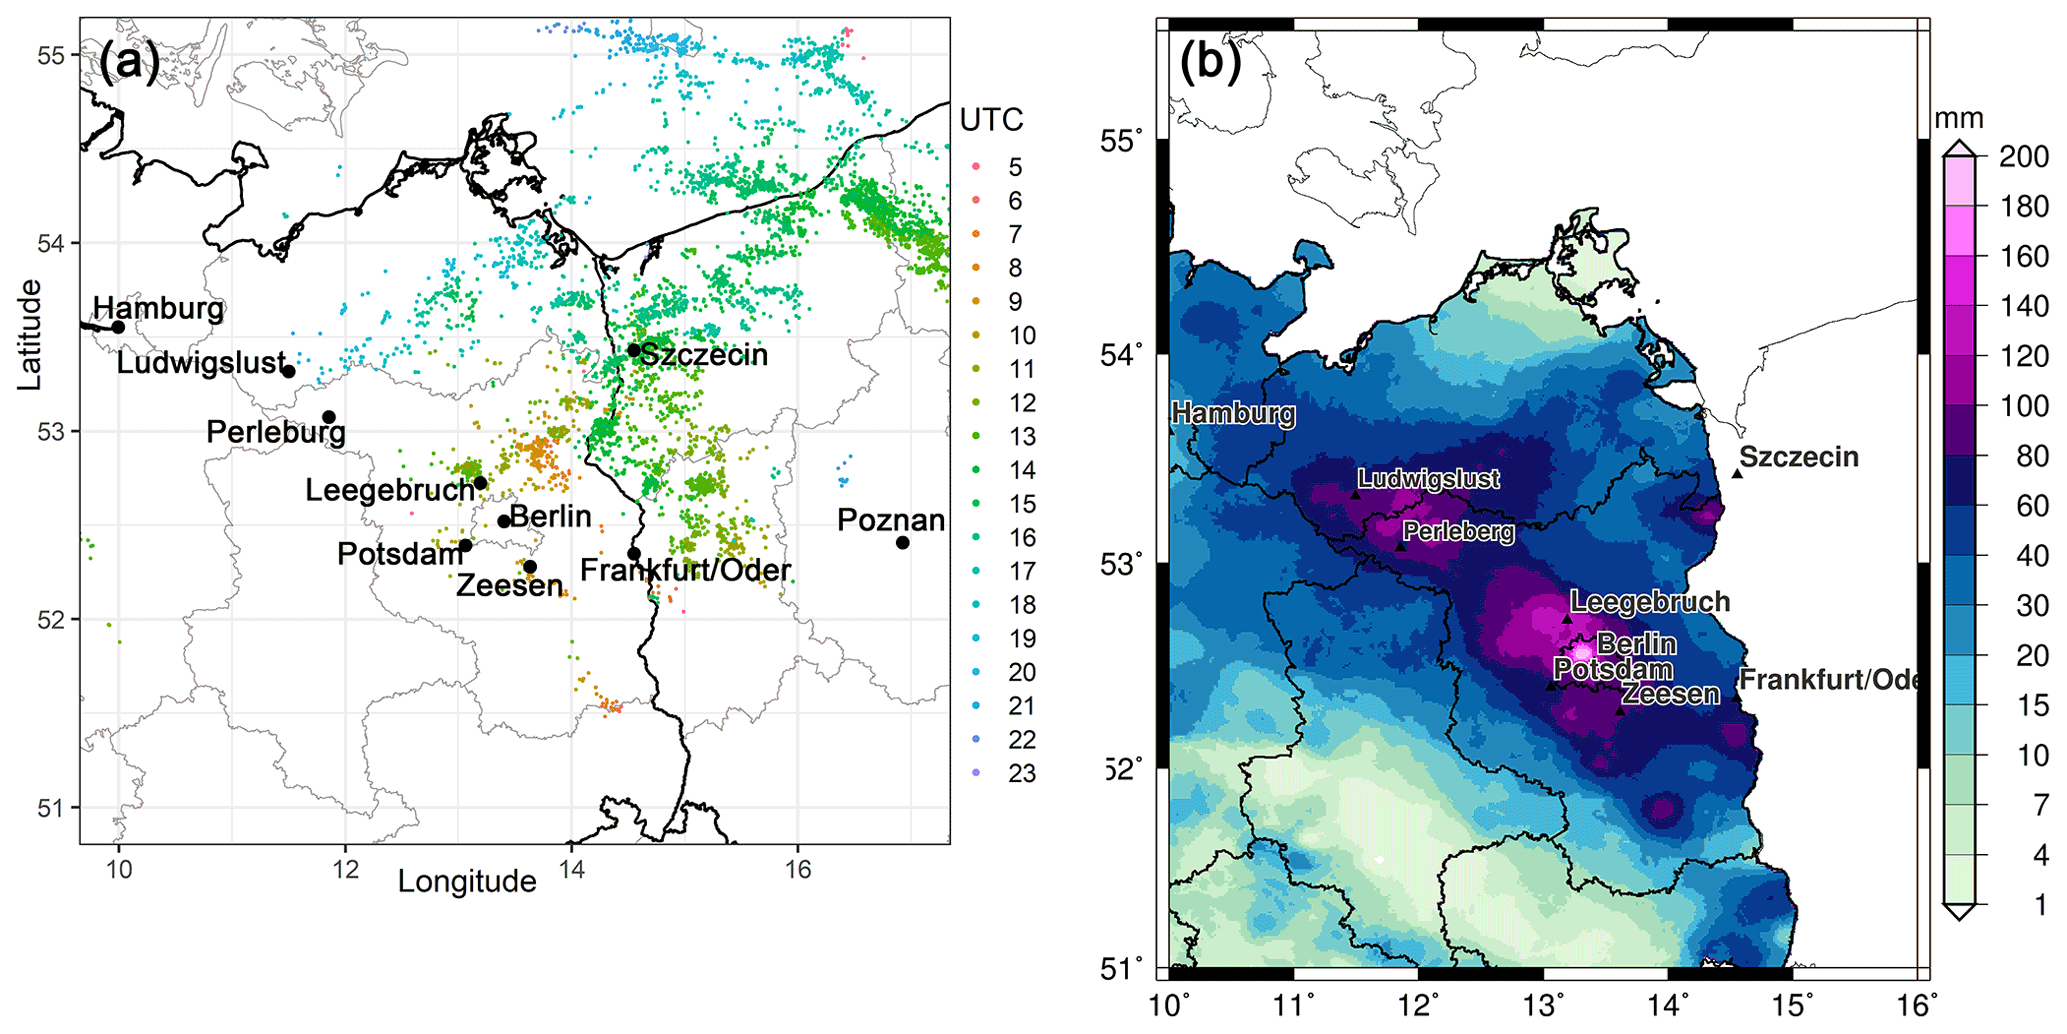
Figure 5(a) Cloud-to-ground strokes from the EUCLID data set, colour-coded according to the time of occurrence from 05:00 UTC on 29 June 2017 to 00:00 UTC on the following day, and (b) 24 h precipitation totals (mm) during the study period (29 June 2017 06:00 UTC to 30 June 2017 06:00 UTC) from REGNIE.
Due to the weak upper-level flow (Fig. 3a), the thunderstorms were associated with low propagation speeds leading to high local rain rates. Figure 5b shows daily precipitation totals with values up to 200 mm. The convectively enhanced precipitation fell mainly in the course of 12 h in the German states of Brandenburg (BB), Berlin (BE), and southern Mecklenburg–Western Pommerania (MV). Very high values above 100 mm were recorded in and northwest of the city of Berlin and in an area between Ludwigslust (MV) and Perleberg (BB). For example, Berlin–Tegel (BE) recorded 24 h precipitation of 196.9 mm, while Zeesen (BB) registered 149.9 mm (Fig. 5b and Table S1 in the Supplement). In many places, more precipitation was measured within 24 h than the climatological mean for the whole month of June (Wandel, 2017).

Figure 6Temporal evolution of the PSI (blue bars) for the time period 1951 to 2021. The results are based on REGNIE daily precipitation observations between January 1951 and September 2021. The 99th percentile and 90th percentile of daily PSI values are represented by the dashed blue horizontal lines. Numbered circles highlight nine events analysed in Table 1 or in Fig. 7 and other historical events. These are (1) the Saxony floodings on the 12 August 2002; (2) the 29 June 2005 event, affecting Hersbruch and Lohmar; (3) the 21 June 2007 and the (4) 22 July 2007 events affecting Germany in its totality; (5) the 26 August 2010 event in Osnabrueck; (6) the 29 July 2014 event in Muenster and Greven; (7) the 29 June 2017 HPE (red); (8) the 12 July 2018 causing flooding in Berlin; and (9) the Ahr flooding on 14 July 2021.
The unusual precipitation totals made the 29 June 2017 HPE one of the most extreme events in the climatology of the greater Berlin area. Based on the PSI method (Sect. 3.1; Caldas-Alvarez et al., 2021; Piper et al., 2016), the 29 June 2017 event around Berlin was the 29th most severe event in the 1951–2021 period (Fig. 6). This event showed a PSI value (1.71), well above the 99th percentile of the climatology indicating an extreme event. The PSI quantifies the severity of an event considering grid-point precipitation intensity, surface of affected area and persistence. The 29 June 2017 HPE showed a PSI value 2.3 and 1.8 times larger than the 29 June 2005 event in Hersbruch and Lohmar (Table 1; number 2 in Fig. 6) and the 29 July 2014 event in Muenster and Greven (Table 1; number 6 in Fig. 6), respectively. The 26 August 2010 event in Osnabrueck (Table 1; number 5 in Fig. 6) is the only event of those assessed in the household surveys with a similar meteorological severity and a similar extent of the damages (EUR 90 million) caused. Compared to other events, the 2002 event in Saxony (number 1 in Fig. 6) showed the most similar meteorological severity. The Ahr flooding in July 2021 (number 9 in Fig. 6) had a PSI value 2.1 lower than the 29 June 2017 HPE due to the weaker grid point intensity (131 mm compared to 196.9 mm) and, especially, to the lack of observations over affected areas in Belgium and the Netherlands in REGNIE.
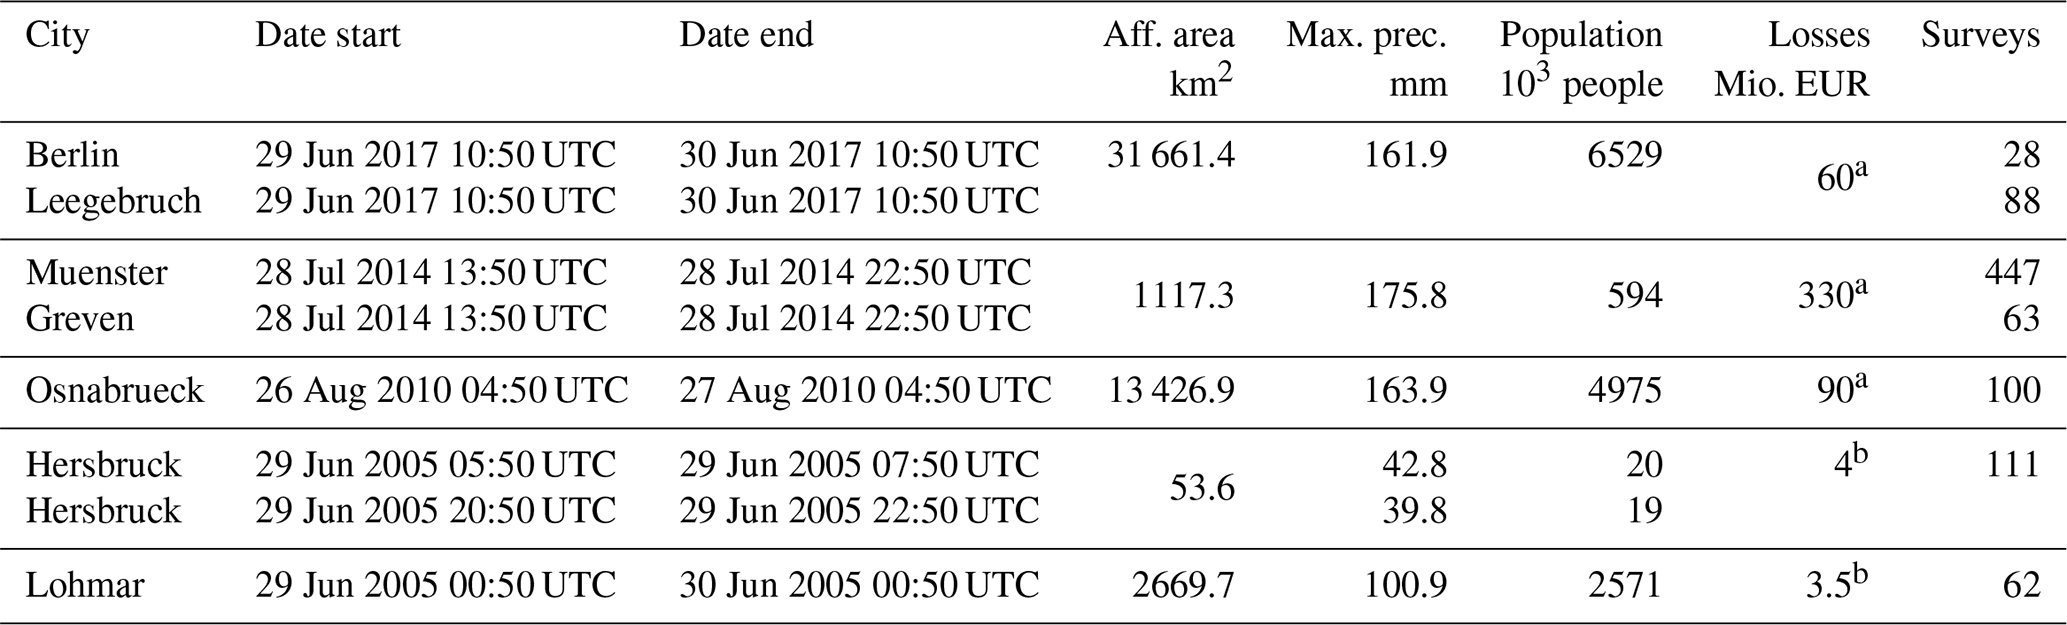
Table 1Pluvial flooding events where surveys were conducted at affected households. Five events were surveyed at seven locations. The start and end dates, the affected area, the maximum daily precipitation, and the affected population are obtained from the CatRaRe database (Sect. 2), based on RADKLIM precipitation data. The overall losses within the municipality (a) are from GDV (2020) and refer to insured losses, while loss values with a (b) are from Hydrotec et al. (2008) and refer to total losses (non-insured and insured losses). Losses are referred to by constant 2019 prices. Note that Hersbruck was hit by two events in close succession, which are listed separately.
The convective activity and number of cells triggered were also top ranked compared to other historical cases. Implementing a lagrangian cell tracking algorithm (Sect. 3.2) using 5 min, 1 km radar data (YW RADKLIM), for the period 2001 to 2020, we found that the only event with more cells triggered than the 29 June 2017 HPE was the Saxony 12 August 2002 event (Kreibich et al., 2007). Also outstanding with regard to the number of convective cells triggered were the events on 21 June 2007, 22 July 2007 and 12 July 2018, where flooding was reported for northern Bavaria, west and southwest Germany, and Berlin, respectively (e.g. Kaiser et al., 2021). The former two events showed a strong meteorological severity, with a PSI in the 99th percentile of the climatology and the latter showed a moderate severity with a PSI close to 0.6. Figure 7 also shows the inverse relationship between the length of the tracks and their number, i.e. the larger the number of cells triggered, the shorter their mean length.
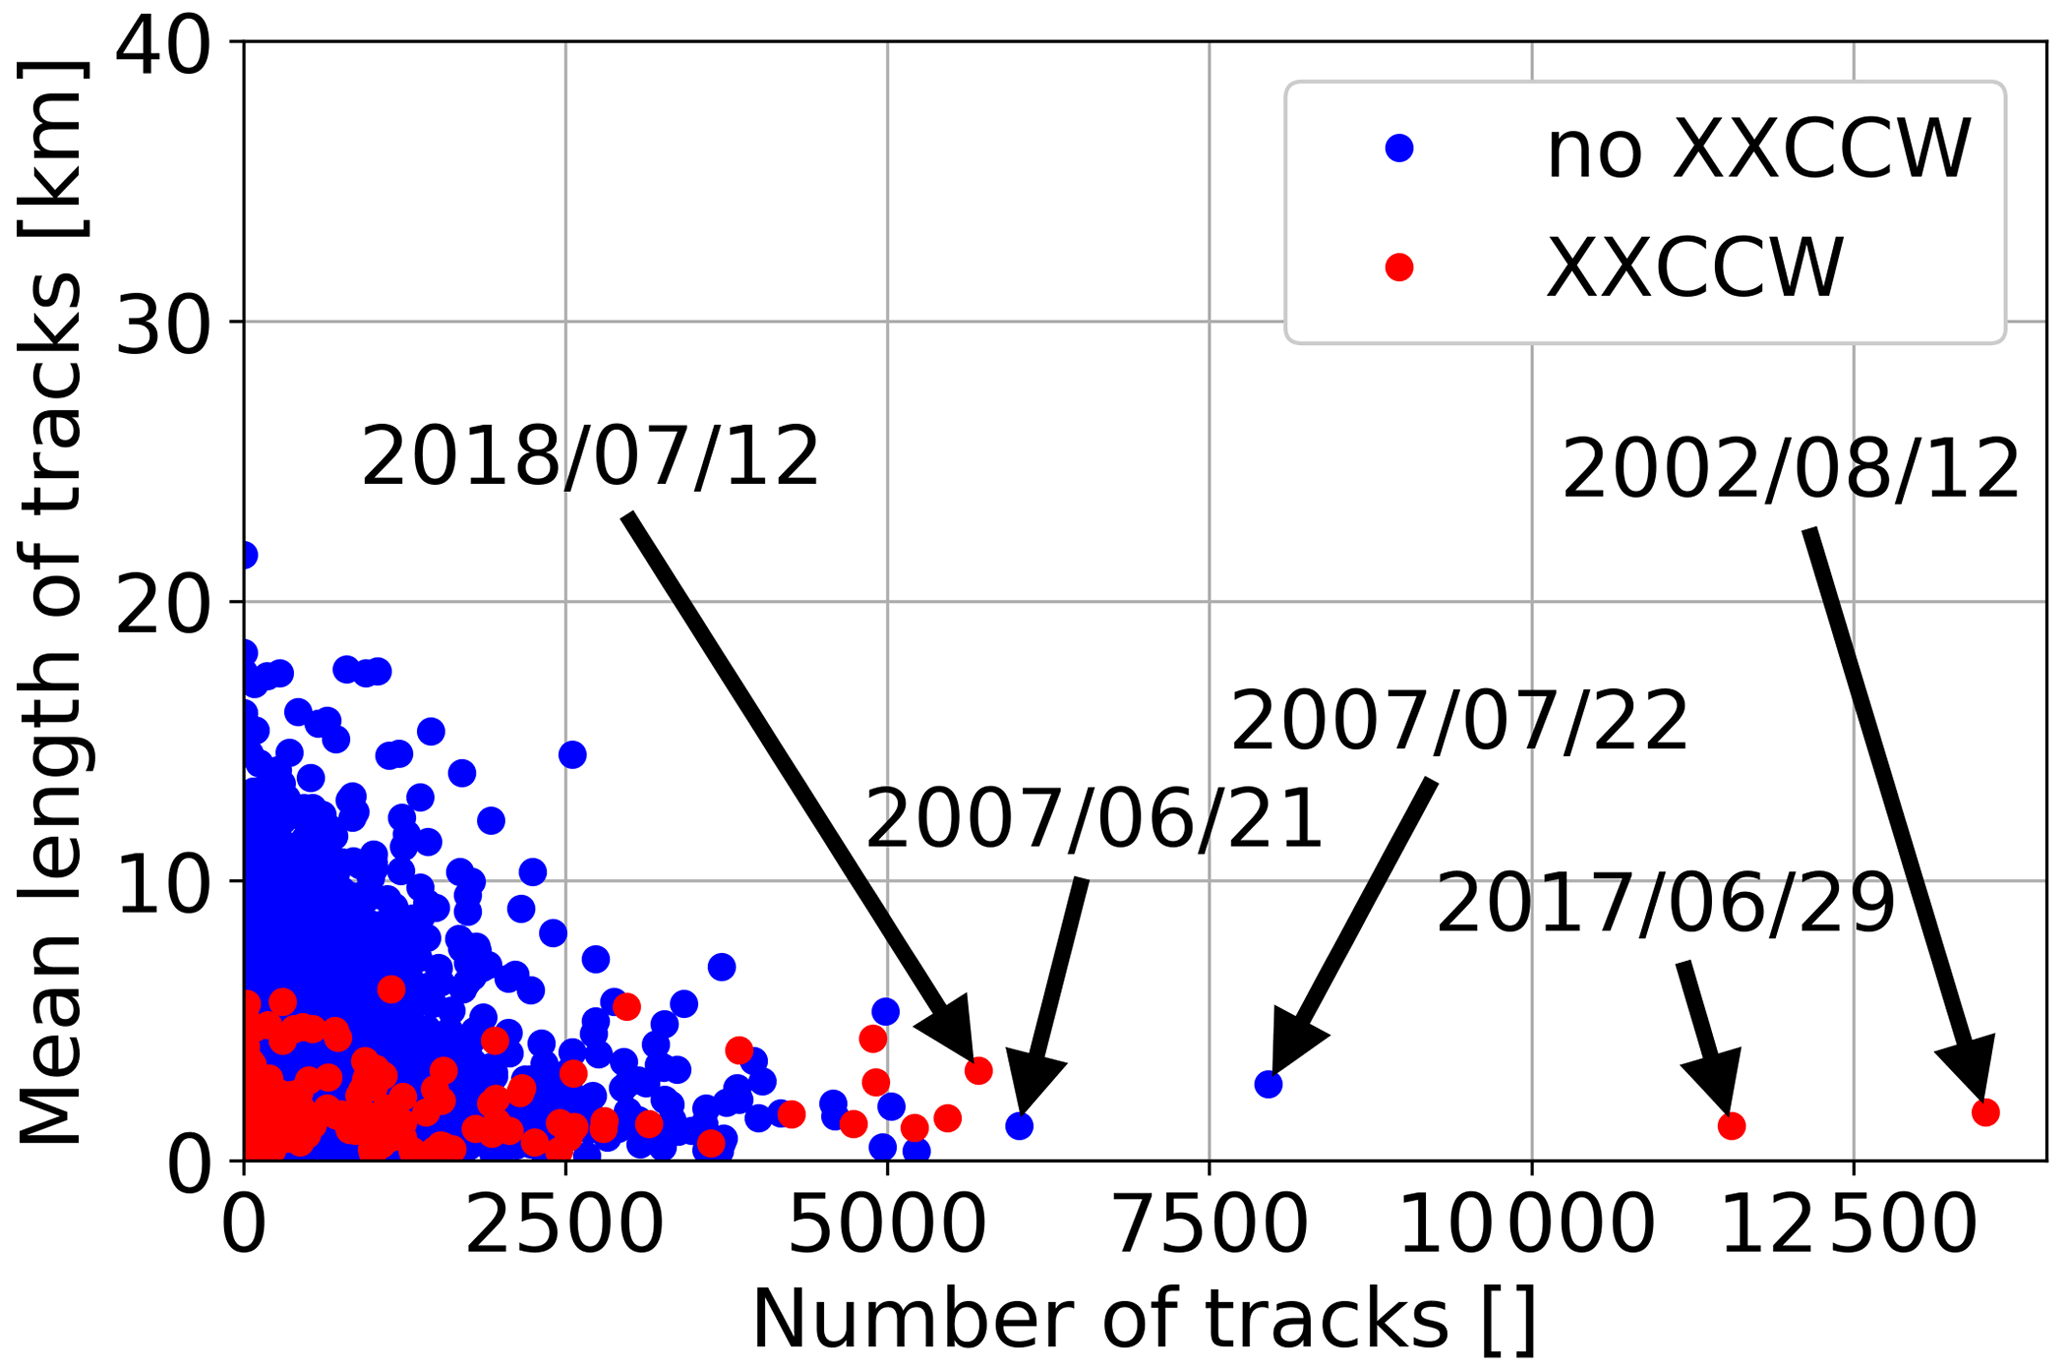
Figure 7Cell track characteristics (mean length and number of tracks) for the research area Berlin and surroundings for days from 2001 to 2020. Colour coding identifies if days have been classified as weather type “no prevailing wind direction, cyclonic circulation in 950 and 500 hPa and above-average humidity content of the troposphere – XXCCW” or another type – not XXCCW (Bissolli and Dittmann, 2001). Arrows indicate days with flooding events in Germany.
4.2 Impacts and monetary losses
Insured losses in the Berlin–Brandenburg area amounted to EUR 60 million (GDV, 2018) making the 29 June 2017 HPE the most damaging extreme event in Berlin and Brandenburg since 2002. Insurance data of the GDV showed that 1.8 % of the buildings in Berlin incurred damages during the event, with an average loss of EUR 6830. The Oberhavel district was more heavily affected, with 5.3 % of the buildings damaged and an average loss of EUR 10 550 (GDV, 2021). In Berlin, the long-lasting rainfall overloaded the sewer system, resulting in widespread inundation that caused disruption of traffic (i.e. blocked roads), flooded basements and underground stations, and intangible consequences including restrictions in daily routine and mental discomfort (GDV, 2018; Berghäuser et al., 2021). The high number of rainfall-related missions on these 2 d forced the Berlin fire brigade to declare an “exceptional weather situation status” (Kox and Lüder, 2021). The small municipality of Leegebruch (∼6800 inhabitants, located 40 km north of Berlin in the Oberhavel district) was even more severely affected due to its location in a topographical depression and a typically high groundwater table. The resulting inundation cut off the settlement from its surroundings, affected 40 % of the municipality and persisted for several weeks (GDV, 2018).
Table 1 compares the meteorological severity, the impacts and the number of surveyed households between the 29 June 2017 HPE in Berlin and Leegebruch event and the events in Muenster and Greven (2014), Osnabrueck (2010) and Hersbruck and Lohmar (2005). The meteorological indicators show that the Berlin–Leegebruch-2017 event was characterised by its large spatial extent and long rainfall duration. As shown in Sect. 4.1, the long rainfall duration was caused by the slow propagation of the convective system given the weak mid-tropospheric winds. The maximum accumulated precipitation in Berlin (Table 1) somewhat differs from the REGNIE observations (Fig. 5b) since the values of CatRaRe are based on the RADKLIM RW 1 h product that uses a different gridding method and data source.

Figure 8Comparison of (a) inundation depth, (b) inundation duration and (c) building loss between pluvial flood events in seven municipalities as reported in the surveys Berlin-2017 (ber), Leegebruch-2017 (lee), Muenster-2014 (mue), Greven-2014 (gre), Osnabrueck-2010 (osb), Hersbruck-2005 (her) and Lohmar-2005 (loh). Points indicate median values, while whiskers show 5 % and 95 % percentiles.
Figure 8 allows for a more detailed view of the impacts and related mechanisms by looking at the distributions of surveyed flood indicators and monetary losses at a household level. The results reveal that basements were inundated less severely in Leegebruch-2017 and Berlin-2017 than in the other events. Further, the inundation durations in Berlin-2017 and Leegebruch-2017 exceed the inundation durations of the other events. Monetary losses to buildings were particularly large in Leegebruch-2017, Muenster-2014 and Osnabrueck-2010, where approximately 75 % of the surveyed households reported a loss of EUR 1000 and more. In Leegebruch-2017, almost half of the surveyed households suffered building loss in the largest two categories (≥ EUR 10 000).
Altogether, a clear relationship between precipitation indices (intensity, duration, extent) and resulting losses across the group of study cases could not be found. Instead, flood characteristics at the affected buildings (inundation depth and duration) can explain much (although not all) of the incurred losses. Ultimately, flooding in urban areas is a complex process that depends not only on the meteorological nature of an event but also on the local characteristics of the terrain defined by topography, land use, sewer system capacity and operability, and hydro-geology, as well as on socioeconomic conditions such as settlement structure, building codes and private risk mitigation.
4.3 Lagrangian moisture trajectories
A sufficiently moist environment is needed for deep moist convection to develop (Markowski and Richardson, 2010). Section 4.1 showed how a very moist atmosphere with up to 40 mm of precipitable water vapour preconditioned the initiation of convection in the greater Berlin area. Now the question is where did the precipitating moisture originate? To this end, we use Lagrangian backward trajectories based on hourly ERA-5 data (Sect. 4.3).
We found that land masses were the main sources of moisture uptake. Out of the selected 15 074 trajectories fulfilling the selection criteria, 82.9 % originated over land areas, whereas only 17.1 % of the precipitating moisture evaporated over the ocean. With this method, about 49.8 % of the precipitating moisture for the day of 29 June could be traced back to its moisture source. The eastern European region (around 10 to 32∘ E and 37 to 60∘ N) was by far the main source of moisture uptake (63.0 %). Additionally, the moisture uptake in this region was relatively evenly distributed, ranging from Poland (east of the precipitation event) towards Croatia and Italy, with a maximum moisture uptake of about 4.6 mm per single grid point (Fig. 9). Other but less important land moisture sources were the western European region (around 12∘ W to 10∘ E and 37 to 60∘ N), with a contribution of 13.9 %, and the northern African region (around 20∘ W to 32∘ and 20 to 37∘ N), with a contribution of 5.9 %. The oceanic moisture sources were primarily the Mediterranean Sea (11.9 %) and Atlantic Ocean (4.6 %), but these played a minor role compared to the moisture uptake over land. A similarly important role of moisture recycling from land sources has been found previously for an extreme precipitation event in eastern Europe in May 2010 (Winschall et al., 2014) and for the central European floods in June 2013 (Grams et al., 2014; Kelemen et al., 2016). In the case of the 29 June 2017 HPE studied here, moisture recycling likely happened on relatively short timescales of 1–2 d, as June 2017 was generally dry, but northeastern Italy, Slovenia, Austria and southeastern Poland were affected by convective precipitation on 28 June. The moistening of the soil due to prior precipitation is thus hypothesised to be an important precondition for the Berlin event.
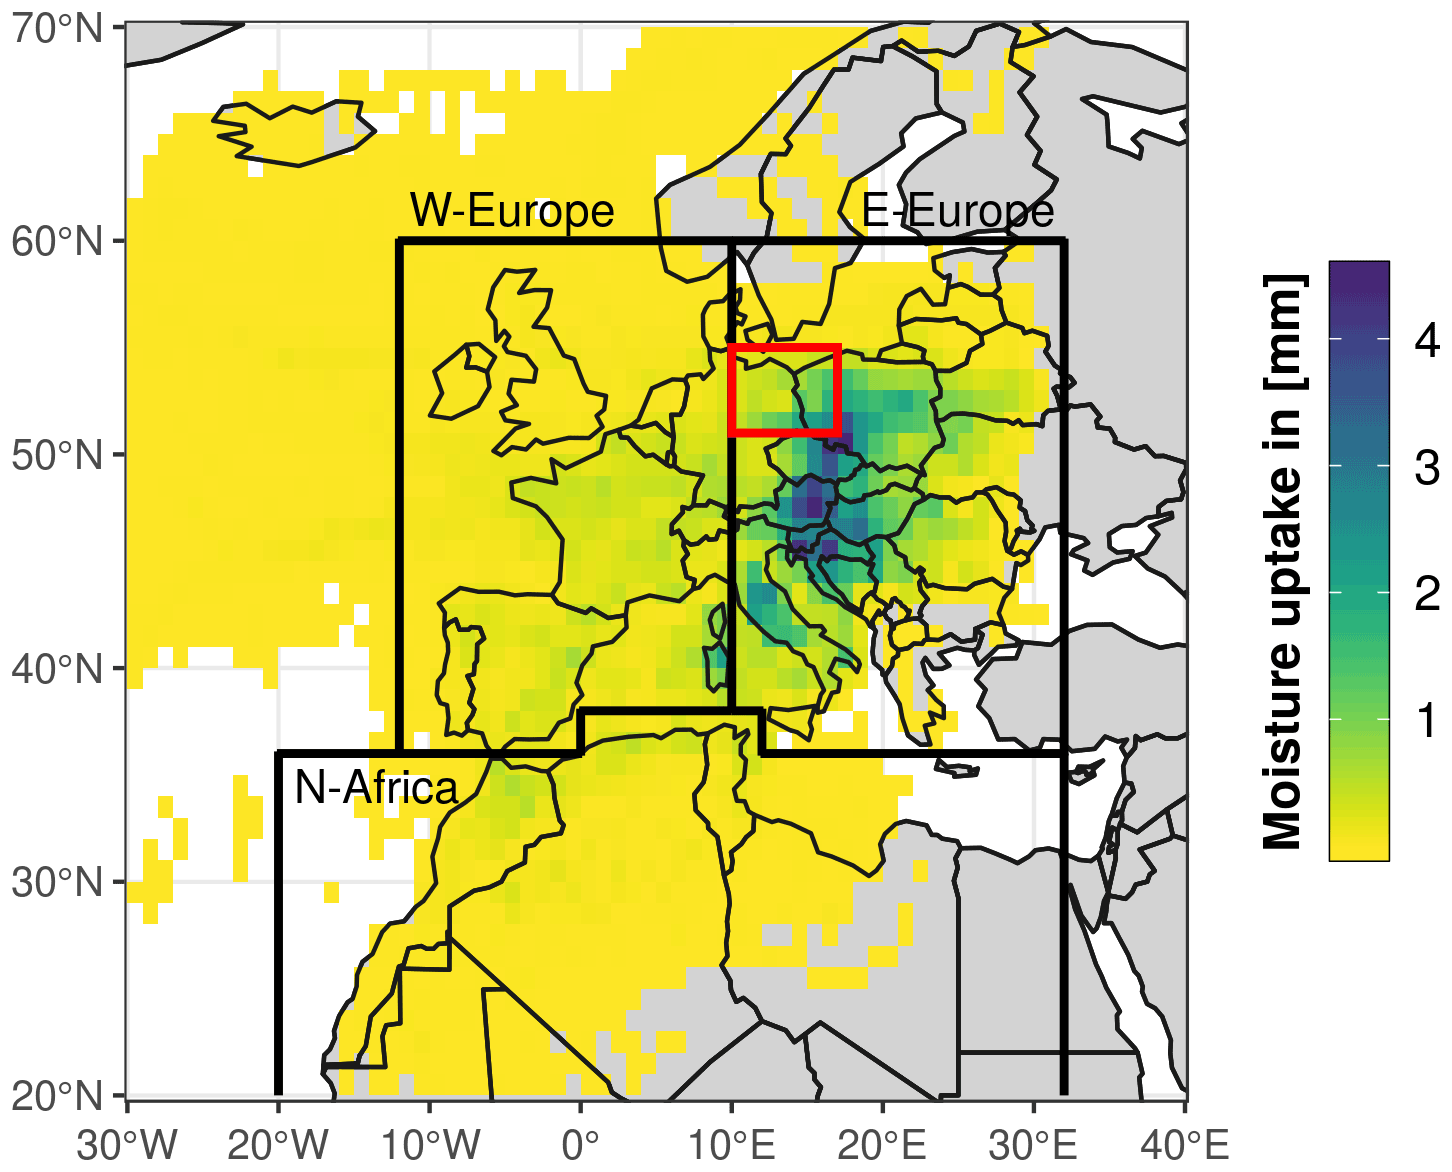
Figure 9Moisture uptake within the planetary boundary layer, calculated based on Lagrangian backward trajectories using ERA5 reanalysis data. Hourly initialised trajectories on 29 June 2017 (00:00 to 23:00 UTC) at the region of heavy precipitation (red box) from 1000 to 200 hPa in steps of 50 hPa and 80 km horizontal distances, going back 240 h in time, are used to compute moisture uptake based on humidity changes, if they are associated with precipitation in the target region.
4.4 GEV models and return periods
We provide an estimation on how rare the 29 June 2017 HPE was calculating probabilities of exceedance p and return periods tRP fitting observations of extreme precipitation to GEV models (Sect. 3.5). Return values RVRP (quantiles) and the associated return periods tRP, or directly the probability of exceedances p, are related to the GEV distribution as (Coles, 2001). For example, a probability of exceedance p=0.01 for annual data can be interpreted as on average 1 event in 100 years rare an event has been. This information is also used by reinsurance companies and hydrological studies.
We start by estimating return periods using the Gumbel distribution (Eq. 2) per grid point (1×1 km2) for 24 h precipitation totals in Germany based on a 70 year time series (REGNIE; Fig. 10). The results show return periods of more than 200 years between Ludwigslust (MV), Perleberg (BB) and Berlin, covering a total area of 8729 km2. Past work has shown how estimated return periods that are much longer than the observational record exhibit large uncertainty (Makkonen, 2006; Grieser et al., 2007). This is why we truncate all return periods above 200 years (Fig. 10), acknowledging that the 70 year observational record might be too short to provide accurate values for such long return periods.
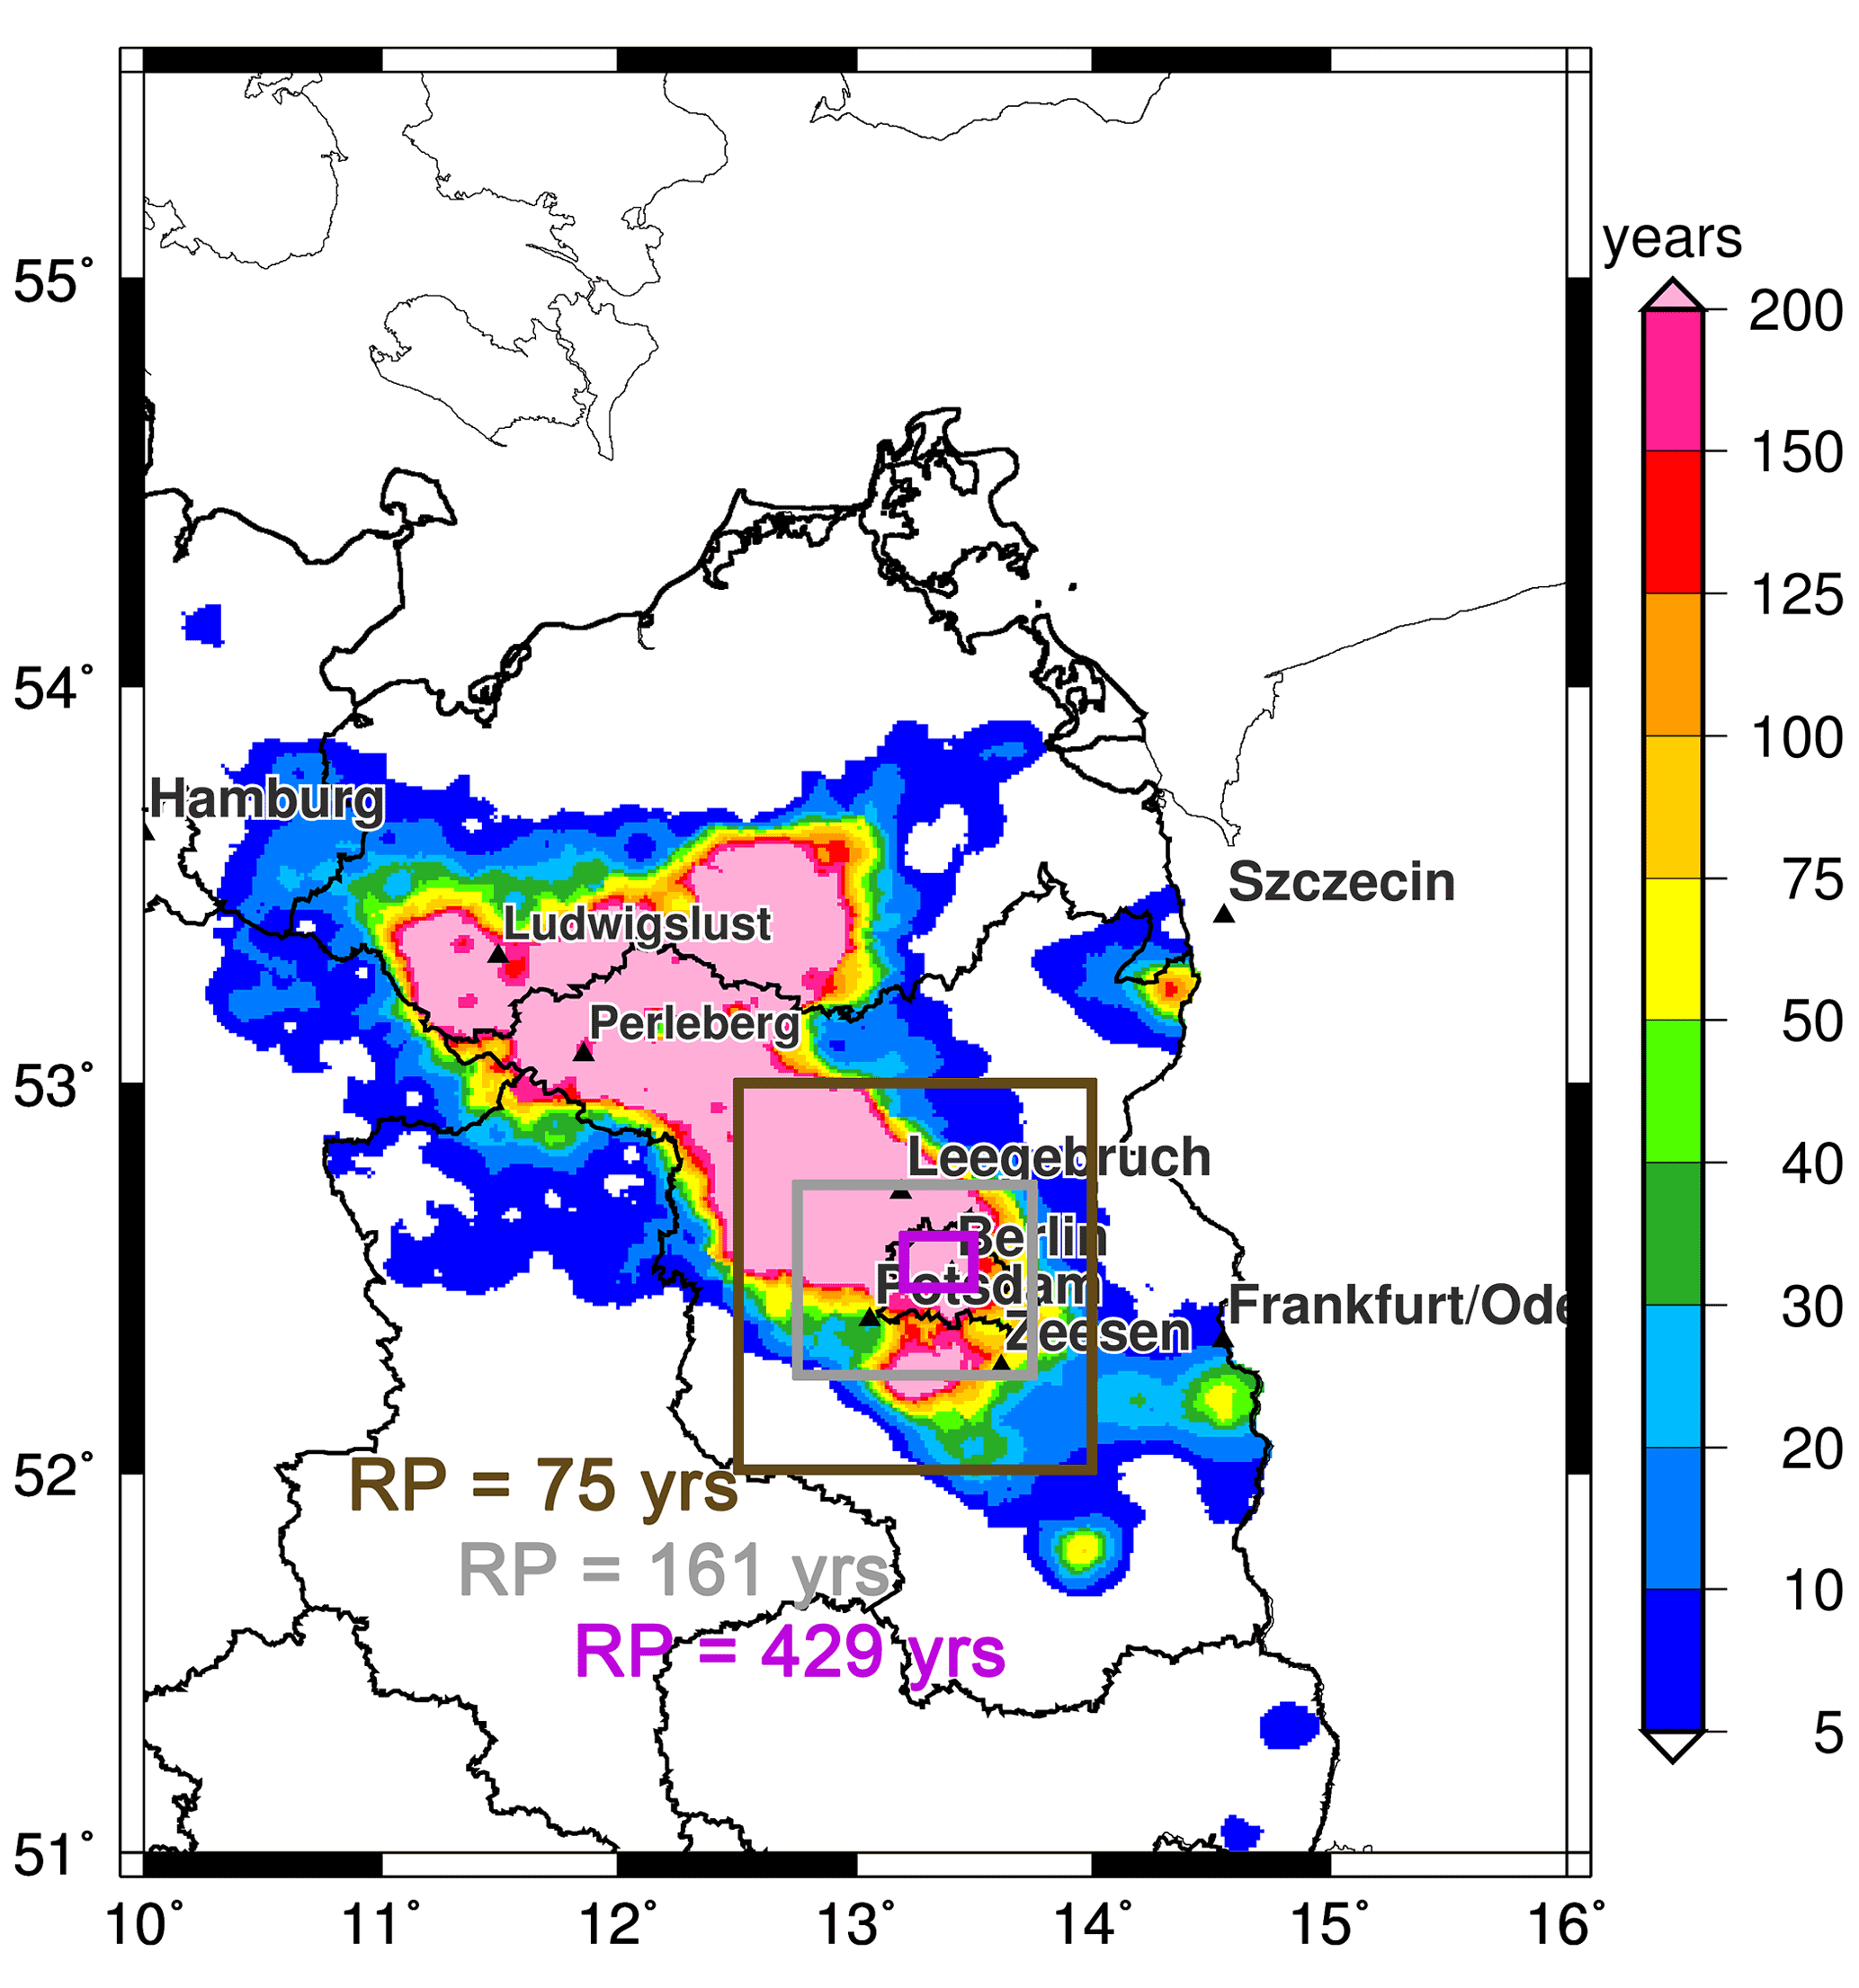
Figure 10Return periods of the 24 h precipitation totals based on REGNIE using a Gumbel distribution (extreme value type 1; reference period: 1951–2020). Note: all return periods above 200 years are shown uniformly in one colour due to statistical uncertainty (see text for more information). Coloured polygons (in pink, grey, brown) including the associated averaged return periods (RP) indicate three different-sized averaging areas explained in Table S2 and in the text.
The second approach, consisting of fitting a GEV distribution to spatial averages of different size, also showed very large return periods; however, decreasing with increasing size of the considered areas. The rationale behind this analysis is that return periods at individual grid points may not best characterise the event and its associated impacts since an event with a very long return period at a given site can have a small spatial extent. Such spatial averaging of observations is also required for validation of simulated return periods in climate models and assessment of the model biases (see e.g. Philip et al., 2020).
For this approach we fit a standard GEV distribution (Eq. 1) and estimate return periods of the yearly block maxima of REGNIE precipitation data from 1951 to 2020, spatially averaged over three boxes of different size (brown, grey and pink boxes in Fig. 10 and Table S2). The results show that the return period of the event decreases with increasing box size. At the finest analysed scale (340 km2; pink polygon in Fig. 10), the extreme event has a return period of over 420 years, which decreases to 75 years for the largest area (11 100 km2; brown polygon in Fig. 10). Compared to other historical events, the 29 June 2017 HPE was the most extreme in the time series when considering the smallest analysed region; however, an event with a larger spatially-averaged precipitation sum and thus a larger return period was detected on 8 August 1978 in the two larger areas (grey and brown boxes). In the supplementary material, the return period of the 29 June 2017 HPE is compared to the July 2021 heavy rainfall event impacting Western Europe.
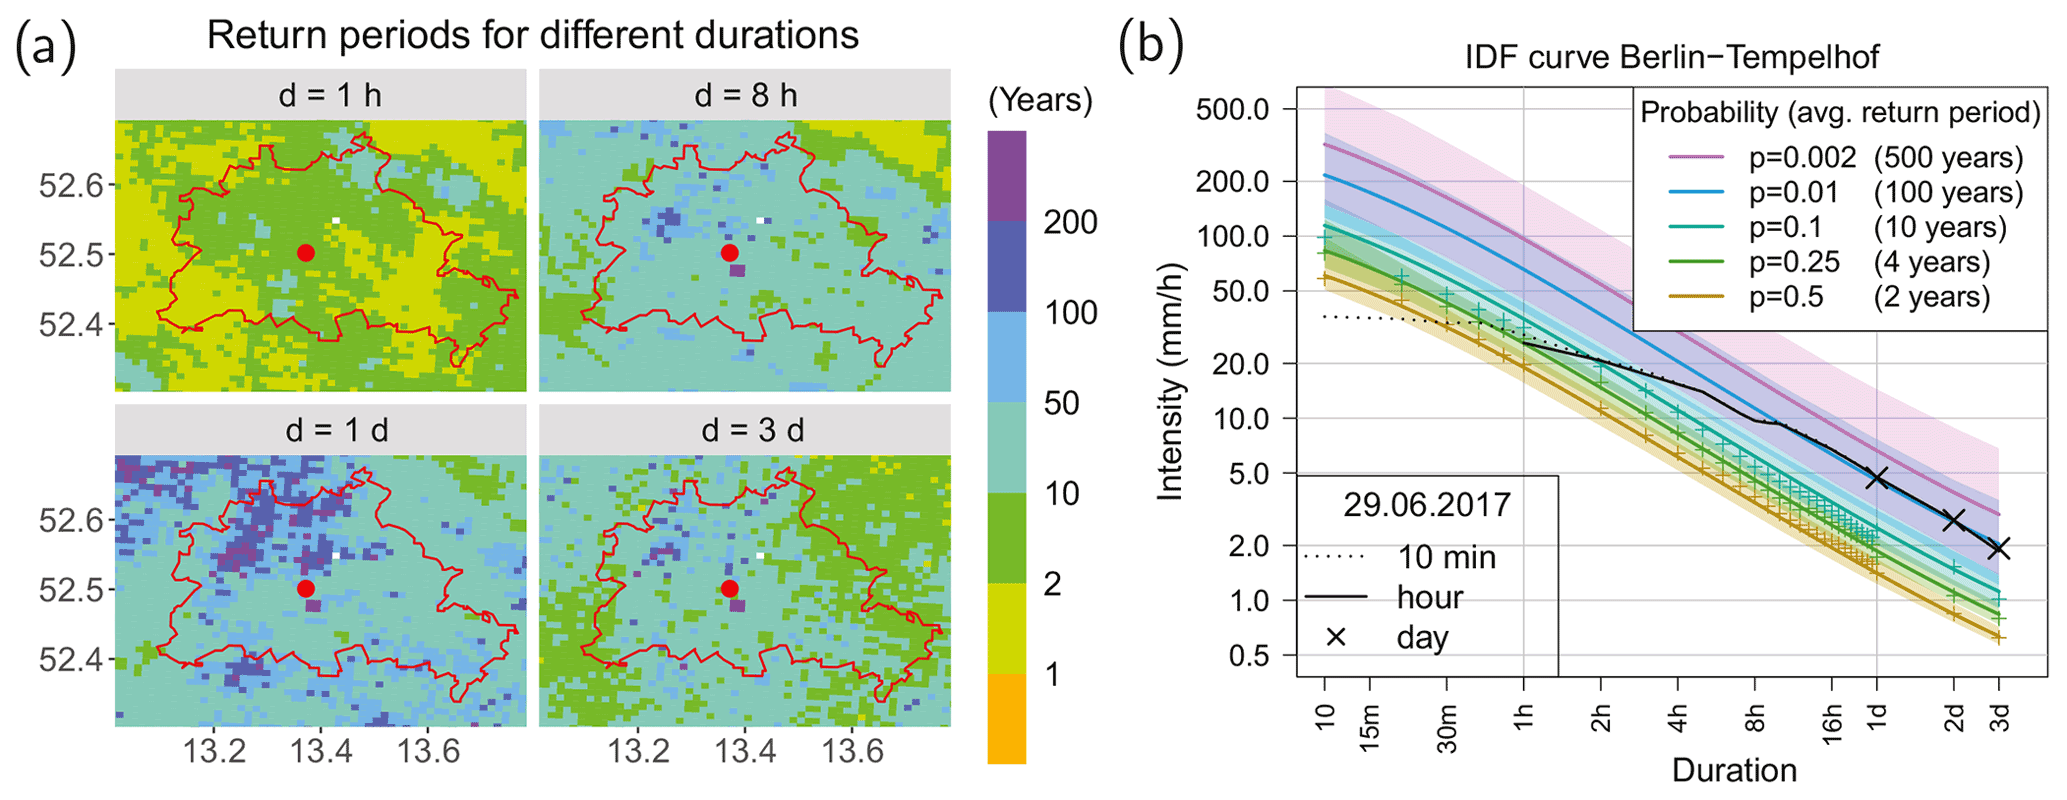
Figure 11(a) Return periods of this event's intensity from gridded RADKLIM (1 km × 1 km) data using a duration-dependent GEV distribution. Red dot: position of DWD weather station Tempelhof used to construct the IDF curve in (b). (b) IDF curves from station-based data. The coloured lines show return periods from the d-GEV model, the black line indicates intensity of the event on the 29 June for different temporal measurement resolutions. Empirical quantiles are denoted as coloured “+”. The 95 % confidence intervals come from 1000-fold bootstrapping.
One useful approach to reduce uncertainty in the estimation of return periods from temporally short observational records is using different accumulation durations between 1 h and 3 d (Eq. 3); however, at the expense of more demanding computing power. The d-GEV model (Eq. 3) is applied to grid point intensity from RADKLIM RW (2001–2020; Fig. 11a). For this data set, the estimated d-GEV shape parameter ξ has a median value of 0.24. Accumulations (duration d) of 1 d showed very high return periods (>800 years) for seven grid points in northwestern Berlin. Over this area, most grid points showed return periods between 50 and 200 years. The small grid box size of 1 km × 1 km could explain the very high return periods in cases of statistical outliers. On shorter timescales of 8 and 1 h, northwestern Berlin shows lower return periods, between 10 and 100 years for the two former temporal aggregations and between 2 and 10 for the latter (Fig. 11a). The short time range of historical RADKLIM data (20 years), however, limits the reliability of these spatially resolved return period estimates.
To overcome the short timespan of the RADKLIM data set, we implement a duration-dependent GEV model (Eq. 3) on DWD ground station data at Berlin–Tempelhof (Fig. 1). The return levels (quantiles) for any exceedance probability and timescale (duration d) are presented in intensity–duration–frequency (IDF) curves (Fig. 11). This station was chosen because data records are longer than the RADKLIM data. Aggregations of 10 min span 1995 to 2020 and daily aggregations cover the period 1948 to 2020. The longer time series lead to shorter and – due to the reduced uncertainty – potentially more plausible return periods. The analysis shows return periods of 100 years for durations above than 10 h, 114 years for daily aggregations. However, confidence intervals in the IDF curves also remain large (Fig. 11b).
All used approaches highlight that the analysed event was rare, with return periods longer than 100 years in the Berlin area. The efficient use of information from the observation data (accumulation periods from 10 min to 3 d) lead to more plausible return period estimation from the d-GEV model compared to Gumbel using daily accumulations. However, long data records with high measurement frequency and enough computing resources are not always available, in which case a non-duration-dependent model using daily data could be a better choice. Finally, including a climate change signal into the d-GEV estimation (Ganguli and Coulibaly, 2017) could improve the results, since the assumption of a non-changing climate leads to overestimated return periods for events that become more likely with climate change.
4.5 Conditional event attribution
A full understanding of an observed extreme event requires addressing the question of how the event relates to anthropogenic influences. This is particularly important with respect to climate-change communication with stakeholders and the general public.
For conditional attribution, the modelling approach involves simulating an event under present climate conditions and then repeating the simulation with modified boundary conditions. This modification consists of subtracting the vertical thermodynamical climate change signal (Lackmann, 2015; Pall et al., 2017), and is thus particularly amenable to high-resolution (convection-permitting) regional model experiments, which have many advantages for modelling extreme precipitation (Meredith et al., 2020, 2021; Stevens et al., 2020). The modelling approach is, in essence, an adaptation of the surrogate global-warming method (Schär et al., 1996; Hibino et al., 2018; Kröner et al., 2017). The results presented here are based on the model simulations described in Sect. 3.6, where the analysis is performed over an area of 81 520 km2 centred on the event location (Fig. S3). Model evaluation and technical details are found in the Supplement.

Figure 12(a) Vertical warming signal and (b) response of event precipitation to warming signal. The warming is based on a subset of 17 CMIP6 models. The x axis in (b) shows precipitation bins which are delineated by quantiles of the precipitation intensity distribution; the changes in area and volume represent the changes associated with precipitation in these bins. Based on the Wilcoxan–Mann–Whitney test, the total changes given within (b) are all statistically significant with at least p<0.02. Shading denotes the 95 % confidence intervals based on 1000 bootstrap resamples.
The thermodynamical climate change signal is vertically heterogeneous, with stronger warming in the mid and upper troposphere (Fig. 12a). Based on a mean tropospheric (1000–300 hPa) temperature of ∼269 K and warming of 1.36 K, this implies an increase in saturation vapour pressure of ∼10.5 % (Bolton, 1980), which exceeds the 7.5 % increase in precipitable water (time average; not shown) which we find over our eastern Germany analysis region (Fig. S3).
In our present climate simulations, we find a low, though statistically significant (p<0.02), increase in total precipitation volume of 4 %. This can be better understood by analysing both changes in the precipitation distribution and physical characteristics of the convective system (Fig. 12b). Changes in total precipitation volume associated with a given quantile of precipitation intensity increase as the quantiles become higher. Indeed, at the lowest intensity quantiles, the associated precipitation volumes are found to decrease, which partly offsets the volume increases associated with the higher intensity quantiles (Fig. 12b). By breaking the total precipitation volume into its area and depth components, it can be seen that the change in precipitation intensity shows a signal very similar to that of the total precipitation volume. The spatial extent of the precipitation, meanwhile, decreases (−2 %) in the warmer climate, in line with the results of Wasko et al. (2016) and Armon et al. (2022). It is thus clear that it is not changes in the spatial extent of the system but rather higher local intensities which drive the increase in total precipitation volume. The intensities increase for approximately the upper half of the precipitation distribution, peaking at a 10.4 % increase for the highest quantiles. This increase exceeds the increase in precipitable water (see above), implying that local moisture convergence was an important factor for the most extreme intensities.
It is worth noting that, based on the average tropospheric warming signal (see above), the intensification of the highest quantiles corresponds (almost exactly) to what would be expected from the Clausius–Clapeyron relation. Had the precipitation–temperature scaling been computed using the lower troposphere or the 2 m temperature instead, a super Clausius–Clapeyron increase would have been found. Currently, it is still a matter of debate as to which temperature is most appropriate to use when computing the scaling rate (Drobinski et al., 2016; Formayer and Fritz, 2017). It is plausible that the total precipitation would not have shown an attributable change but that the most intense quantiles would have. This insight is also of relevance for impact studies: the effect of climate change was found to be dependent on the spatial scale of interest. We conclude by stating that climate change since the pre-industrial era served to increase the magnitude and, in particular, the highest precipitation intensities of the event.
4.6 Sensitivity to aerosol loading
Another influence of anthropogenic activities, transport, industry, etc. on heavy precipitation is via cloud-active aerosols. Aerosols may affect deep convection in various ways (Rosenfeld et al., 2014; Fan et al., 2015) and thus exert an anthropogenic effect beyond the impact of global warming. For instance, an increased aerosol number reduces droplet size by increasing the condensation nucleal and the droplet concentration leading to enhanced precipitation (Guo et al., 2022).
We study the role of cloud-active aerosols within the 29 June 2017 HPE through sensitivity experiments with the ICON model at 625 m resolution, comparing two scenarios (Sect. 3.7). The first one has factual concentrations representative of the 29 June 2017 HPE, which is a comparatively clean situation (CLN). The second one, has aerosol concentrations representative of the peak aerosol conditions in the mid-1980s, or polluted scenario (POL). The simulated distribution of precipitation is compared with RADKLIM for the period from 06:00 UTC 29 June 2017 to 06:00 UTC 30 June 2017 (Fig. 13), in order to assess the importance of aerosols for this extreme event.
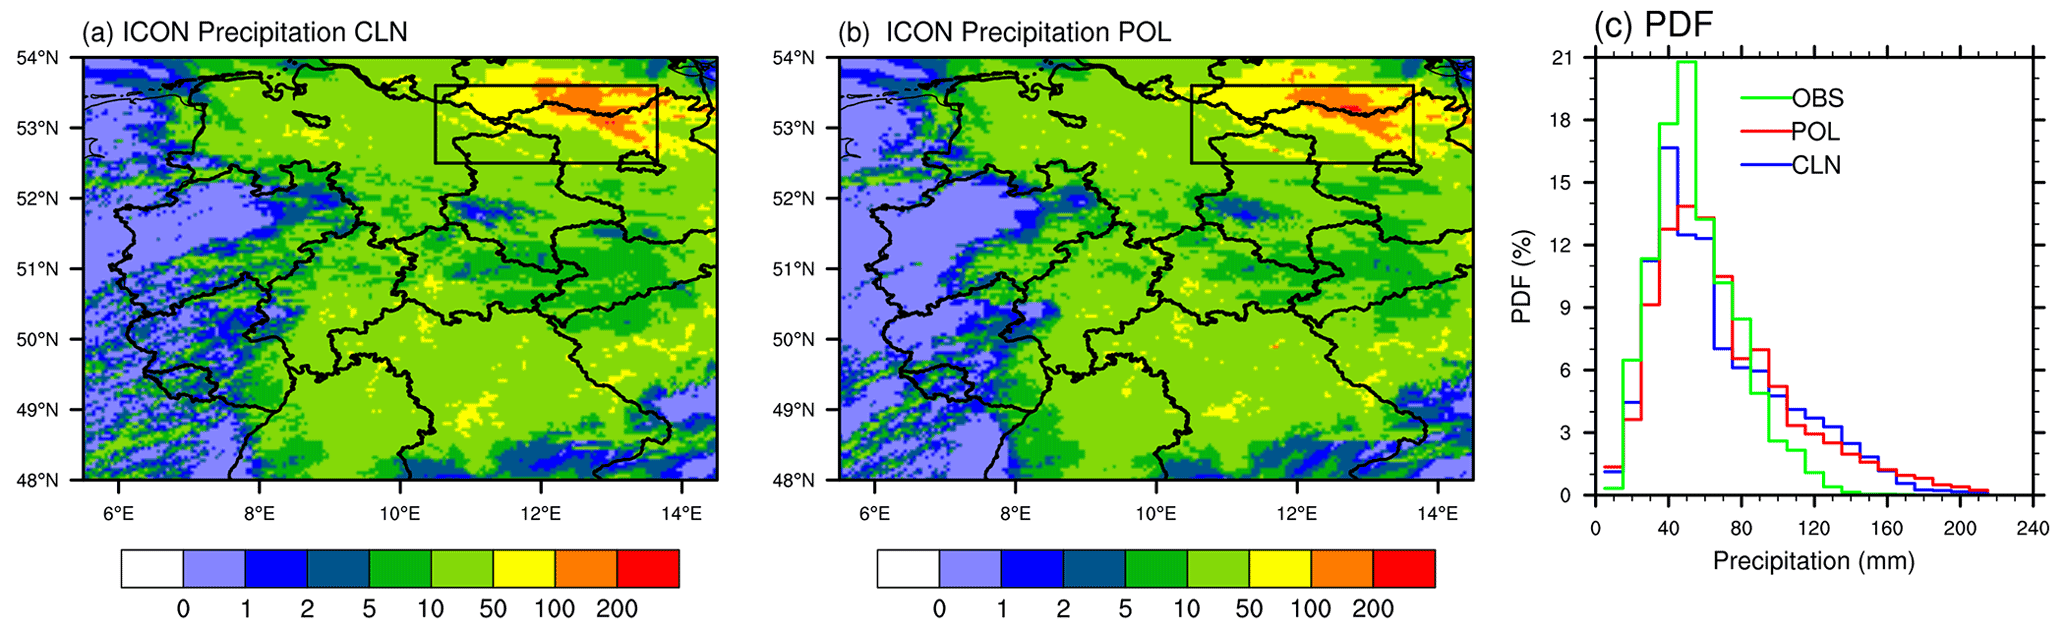
Figure 13Results from the 635 m ICON simulations. Distribution of precipitation (mm d−1) from (a) the factual CLN simulation and (b) the counterfactual POL simulation. (c) PDF of precipitation intensities in the region of interest denoted by the rectangle in (a) and (b), for the factual (CLN) and polluted (POL) simulations and the observations (OBS) from the RADKLIM precipitation observations.
The results show that POL simulates an increased cloud number and cloud mass due to the larger aerosol loading (not shown) with the corresponding heavy precipitation increase. This is especially so for intensities exceeding 150 mm d−1 (Fig. 13c). We quantified this increase in probability to be of 70 % in the high aerosol conditions in the 1980s compared to the factual case (CLN) during the 29 June 2017 HPE. In POL, 4.3 % of grid points exceeded 150 mm 24 d−1 in the high aerosol case compared to 2.3 % in the low aerosol simulation (CLN).
Multi-disciplinary analyses are a powerful means to gain full understanding of heavy precipitation events with high impact such as the Ahr flooding events in northern Europe in 2021 (Kreienkamp et al., 2021; Mohr et al., 2022). In this work we implemented analytical methods from impact, meteorological and climate sciences using state-of-art observational and modelling data sets to provide a comprehensive assessment of the 29 June 2017 HPE in the metropolitan area of Berlin (Germany).
The 29 June 2017 event occurred under the influence of a mid-tropospheric trough over western Europe (TrW pattern), with two principal shortwave surface lows located east of the British Isles (Rasmund) and over western Poland (Rasmund II) between 29 and 30 June. Rasmund II induced a southwesterly flow bringing warm and moist air ( K, IWV = 42 mm), accompanied by moderate ML-CAPE over the Berlin area. Low-level wind convergence along the German–Polish border initiated convection, inducing more than 11 000 convective cells and lightning, starting 05:00 UTC (29 June), displacing northwards slowly due to the weak tropospheric horizontal winds (10 m s−1 at 500 hPa). Total extreme precipitation amounted to 196 mm in 24 h, especially impacting the Berlin area and the southern limit of the Mecklenburg–Western Pomerania state. A climate index, based on precipitation intensity, coverage and persistence, classified this event as the 29th most severe on record since 1951 in Germany.
Total insured losses in properties amounted to EUR 60 million due to widespread inundation, traffic disruptions and basement flooding. This made the 29 June 2017 HPE the costliest event between 2002 and 2017 in the greater Berlin area. A set of unique surveys estimating the losses at the household level allowed us to compare the 2017 HPE in Berlin and Brandenburg with previous historical cases in Hersbruck and Lohmar in 2005, Osnabrueck in 2010 and Muenster in 2014. The 2017 HPE stands out in terms of median inundation duration, which was up to 100 h; 4 to 12 times longer than the other surveyed events. While surveyed flood attributes (inundation depth and duration) can be linked to household losses, it is difficult to establish a link between these attributes and the meteorological characteristics of the event. This is because the impact at the household level is not only caused by the meteorological characteristics but also by the conditions on the ground.
Lagrangian backward trajectories determined that land masses instead of water bodies were the main sources of atmospheric moisture feeding the systems, accounting for 82.9 % of the identified precipitating moisture. In particular, the continental region between southern Poland and northern Italy was the major moisture source, with uptakes up to 4.6 mm in 240 h. It is hypothesised that this moisture was recycled from an earlier event, impacting Slovenia, Austria and Poland on the 28 June.
Three different approaches using generalised extreme value (GEV) models (Gumbel, standard and duration-dependent) quantified the return period of this event to be over 100 years for daily precipitation aggregations. For higher temporal resolution observations, the return periods were reduced to intervals between 10 and 100 years for 8 h aggregations, and between 1 and 10 years for 1 h aggregations. For spatial averages over an area of the scale of the event (11 100 km2), return periods were of 75 years. While these techniques provided a good estimation of the probability of exceedance and return periods of such events, our analysis highlighted the large uncertainty of obtaining large return periods (>100 years) from temporally “short” databases (<70 years in our case). To overcome this problem, we suggested using station data, which are usually available for longer periods, at different temporal resolutions with a duration-dependent GEV model. Thereby we were able to increase the sample size and shrink the confidence intervals. Other interesting approaches to be tested in further research are considering the climate change signal for d-GEV estimation (Ganguli and Coulibaly, 2017), or using spatial models (Ulrich et al., 2020; Berghäuser et al., 2021) that combine information from several stations into one model using spatial covariates.
The attribution experiments for this case study showed that the thermodynamic climate change signal since the pre-industrial era caused a small but significant increase in heavy precipitation for this event. While total precipitation increased by 4 %, the heaviest precipitation rates showed an intensification of over 10 %. Moreover, in addition to the thermodynamical effect of climate change, anthropogenic aerosol emissions could increase the probability of heavy precipitation rates over 150 mm d−1 for this event as shown by hectometer-scale model sensitivity experiments with different aerosol loadings.
The combined use of impacts, meteorological and climate methods allowed us to relate diverse aspects of heavy precipitation. We found for the 29 June 2017 HPE that large amounts of moisture from continental evaporative sources added to the slow motion of the convective systems to cause one of the most extreme events to date. Furthermore, we related the meteorological extremeness to the impacts for this case, provided the event's large return periods and severity and the reported losses of up to (EUR 60 million). This relationship, however, should not be understood trivially, since precipitation severity is a necessary but not sufficient condition for high precipitation damages. For the 29 June 2017 event, the state of the ground conditions, i.e. blocking of the sewer system in Berlin and Leegebruch, was a determinant in inducing the high costs. Finally, the climate attribution experiments demonstrated that a part of the severity of one of the most extreme events of the last 70 years in Germany was attributable to the already observed changes in the thermodynamical environmental conditions.
Notwithstanding the advantages of multidisciplinary studies, they can suffer from methodological and data inconsistencies. An example of this is the use of different numerical models. We decided to use different models to profit from the techniques best known to the different working groups. Moreover, we are confident that our results are model-independent since all models showed a similar dynamical evolution of the event. Whereas discrepancies in the methods are to a large extent unavoidable as they are intrinsic to the synergistic approach used in this study, the validation of observations provides a powerful means to reduce uncertainty regarding data biases. Our validation of precipitation data sets in Sect. 2 showed a high degree of agreement and accuracy between the different products, providing confidence in the conclusions drawn. Among the used products, the accuracy was especially high for REGNIE, followed by RADKLIM.
Finally, the multidisciplinary collaboration has created powerful connections that will be exploited in upcoming research. For instance, the authors of this paper will form an expert task force in the framework of ClimXtreme to assess future precipitation events of high interest for the media and the general public, such as the Ahr event in 2021, shortly after their occurrence.
The COSMO-CLM model is accessible to members of the Climate Limited-area Modeling Community, and access is granted upon request. Parts of the model documentation are freely available at Rockel et al. (2008).
REGNIE, RADKLIM, German precipitation station and CatRaRe data from the DWD used in this paper are freely available for research under the Open Data Portal (DWD, 2021). Lightning EUCLID data are not freely available but can be requested from the Blitz-Informationsdienst von Siemens (https://new.siemens.com/de/de/produkte/services/blids.html; Siemens, 2022). ERA5 data are available via the Copernicus Climate Change Service (C3S; https://doi.org/10.24381/cds.adbb2d47; Hersbach et al., 2018). ECMWF analysis data can be obtained from https://apps.ecmwf.int/archive-catalogue/?type=an&class=od&stream=oper&expver=1 (ECMWF, 2021). The user's affiliation needs to belong to an ECMWF member state. The WRF model simulation data can be made available by Thomas Schwitalla upon request. The COSMO-CLM simulations have been deposited in an open-access repository at the World Data Centre for Climate (WDCC) under the permanent link http://hdl.handle.net/21.14106/482a1823901f009e5cd9dee67c4c374920b3a3a7 (Meredith et al., 2022). The survey data of the Lohmar (2005), Hersbruck (2005) and Osnabrück (2010) events are available via the German flood loss database HOWAS21 at https://doi.org/10.1594/GFZ.SDDB.HOWAS21 (GFZ, 2022). The data of the Münster (2014) event will be added to HOWAS21 by the end of 2023 and can currently be provided upon request. The Leegebruch (2017) and Berlin (2017) surveys are available upon request. ICON simulations (aerosol attribution) are archived in long-term storage at DKRZ and as redundant copy at Leipzig University, please send data requests to RibuCherian.
The supplement related to this article is available online at: https://doi.org/10.5194/nhess-22-3701-2022-supplement.
All authors collaborated and contributed to drafting, reviewing and editing the paper. In particular, ACA and JQ coordinated the effort and wrote the abstract and conclusions of the paper; KB, LD, MH, EPM, SM, JQ, LS, TS and JST wrote the introduction; SSt, DN and FK provided support for data management and precipitation data set validation; AK performed the Lagrangian cyclone analysis; MA, SM, TS and VW analysed the synoptic and mesoscale conditions; FR and SP performed moisture backward trajectory analysis; GA, LD, MH, HK, LS and AHT provided the impact analysis and household surveys; JST, SM and FF implemented the generalised extreme value models and estimated the return periods; HF, EELE and ACA implemented the precipitation severity index; KB implemented the Lagrangian cell tracking algorithm; EPM contributed the conditional event attribution experiment; and JQ and RC performed the aerosol sensitivity experiments.
At least one of the (co-)authors is a member of the editorial board of Natural Hazards and Earth System Sciences. The peer-review process was guided by an independent editor, and the authors also have no other competing interests to declare.
Publisher's note: Copernicus Publications remains neutral with regard to jurisdictional claims in published maps and institutional affiliations.
This article is part of the special issue “Past and future European atmospheric extreme events under climate change”. It is not associated with a conference.
This study is the outcome of collaborative work in the “ClimXtreme” project funded by the German Ministry of Education and Research (Bundesministerium für Bildung und Forschung, BMBF) in its strategy “Research for Sustainability” (FONA). We thank the CLM-Community for maintaining and providing the COSMO-CLM regional climate model. ECMWF is acknowledged for providing the operational IFS analysis data on model levels and for providing the ERA5 data. The ERA5 reanalysis data used in this study contain modified Copernicus Climate Change Service Information 2020. Neither The European Commission nor ECMWF is responsible for any use that may be made of the Copernicus Information or the data it contains. DWD is acknowledged for providing the RADKLIM and REGNIE data. Markus Augenstein and Susanna Mohr thank the Blitz-Informationsdienst von Siemens (BLIDS; namely Stephan Thern) for providing the lightning data. Klemens Barfus gratefully acknowledges the provision of computing time through the Center for Information Services and HPC (ZIH) at TU Dresden.
This research has been supported by the Bundesministerium für Bildung und Forschung (grant nos. 01LP1901A, 01LP1902D, 01LP1902H, 01LP1902C, 01LP1905A, 01LP1902F, 01LP1903E, 01LP1901C, 01LP1902H, 01LP1902B, 01LP1904C, 01LP1903B, 01LP1904A, 0330701C, 01LR1709A1, and 03G0846B), the Deutsche Forschungsgemeinschaft (grant nos. GRK 2043/2 and GRK 2043/2), the Deutsches Klimarechenzentrum (grant nos. bb1152 and bm1159), and the Universität Stuttgart (grant no. ipm12835).
The article processing charges for this open-access publication were covered by the Karlsruhe Institute of Technology (KIT).
This paper was edited by Ricardo Trigo and reviewed by two anonymous referees.
Alfieri, L., Feyen, L., Dottori, F., and Bianchi, A.: Ensemble flood risk assessment in Europe under high end climate scenarios, Global Environ. Change, 35, 199–212, https://doi.org/10.1016/j.gloenvcha.2015.09.004, 2015. a
Allen, M.: Liability for climate change, Nature, 421, 891–892, https://doi.org/10.1038/421891a, 2003. a
Armon, M., Marra, F., Enzel, Y., Rostkier-Edelstein, D., Garfinkel, C. I., Adam, O., Dayan, U., and Morin, E.: Reduced Rainfall in Future Heavy Precipitation Events Related to Contracted Rain Area Despite Increased Rain Rate, Earth's Future, 10, e2021EF002397, https://doi.org/10.1029/2021EF002397, 2022. a
Baldauf, M., Seifert, A., Förstner, J., Majewski, D., Raschendorfer, M., and Reinhardt, T.: Operational Convective-Scale Numerical Weather Prediction with the COSMO Model: Description and Sensitivities, Mon. Weather Rev., 139, 3887–3905, https://doi.org/10.1175/MWR-D-10-05013.1, 2011. a
Ban, N., Caillaud, C., Coppola, E., Pichelli, E., Sobolowski, S., Adinolfi, M., Ahrens, B., Alias, A., Anders, I., Bastin, S., Belušić, D., Berthou, S., Brisson, E., Cardoso, R., Chan, S., Christensen, O., Fernández, J., Fita, L., Frisius, T., Gašparac, G., Giorgi, F., Goergen, K., Haugen, J., Hodnebrog, Ø., Kartsios, S., Katragkou, E., Kendon, E., Keuler, K., Lavin-Gullon, A., Lenderink, G., Leutwyler, D., Lorenz, T., Maraun, D., Mercogliano, P., Milovac, J., Panitz, H.-J., Raffa, M., Remedio, A., Schär, C., Soares, P., Srnec, L., Steensen, B., Stocchi, P., Tölle, M., Truhetz, H., Vergara-Temprado, J., de Vries, H., Warrach-Sagi, K., Wulfmeyer, V., and Zander, M.: The first multi-model ensemble of regional climate simulations at kilometer-scale resolution, part I: evaluation of precipitation, Clim. Dynam., 57, 275–302, https://doi.org/10.1007/s00382-021-05708-w, 2021. a
Bartels, H., Weigl, E., Reich, T., Lang, P., Wagner, A., Kohler, O., and Gerlach, N.: Projekt RADOLAN: Routineverfahren zur Online-Aneichung der Radarniederschlagsdaten mit Hilfe von automatischen Bodenniederschlagsstationen (Ombrometer), Tech. rep., DWD– Deutscher Wetterdienst, http://www.dwd.de/RADOLAN (last access: 15 November 2022), 2004. a
Barthlott, C. and Hoose, C.: Spatial and temporal variability of clouds and precipitation over Germany: multiscale simulations across the gray zone, Atmos. Chem. Phys., 15, 12361–12384, https://doi.org/10.5194/acp-15-12361-2015, 2015. a
Berg, P., Wagner, S., Kunstmann, H., and Schädler, G.: High resolution regional climate model simulations for Germany: part I – validation, Clim. Dynam., 40, 401–414, https://doi.org/10.1007/s00382-012-1508-8, 2012. a
Berghäuser, L., Schoppa, L., Ulrich, J., Dillenardt, L., Jurado, O. E., Passow, C., Mohor, G. S., and Seleem, O.: Starkregen in Berlin – Meteorologische Ereignisrekonstruktion und Betroffenenbefragung, Tech. rep., University of Potsdam, Potsdam, https://doi.org/10.25932/publishup-50056, 2021. a, b, c
Bissolli, P. and Dittmann, E.: The objective weather type classification of the German Weather Service and its possibilities of application to environmental and meteorological investigations, Meteorol. Z., 10, 253–260, https://doi.org/10.1127/0941-2948/2001/0010-0253, 2001. a
Bollmeyer, C., Keller, J. D., Ohlwein, C., Wahl, S., Crewell, S., Friederichs, P., Hense, A., Keune, J., Kneifel, S., Pscheidt, I., Redl, S., and Steinke, S.: Towards a high-resolution regional reanalysis for the European CORDEX domain, Q. J. Roy. Meteorol. Soc., 141, 1–15, https://doi.org/10.1002/qj.2486, 2015. a
Bolton, D.: The computation of equivalent potential temperature, Mon. Weather Rev., 108, 1046–1053, https://doi.org/10.1175/1520-0493(1980)108<1046:TCOEPT>2.0.CO;2, 1980. a
Brieber, A. and Hoy, A.: Statistical analysis of very high-resolution precipitation data and relation to atmospheric circulation in Central Germany, Adv. Sci. Res., 16, 69–73, https://doi.org/10.24381/cds.adbb2d47, 2018. a, b
Bronstert, A., Agarwal, A., Boessenkool, B., Crisologo, I., Fischer, M., Heistermann, M., Köhn-Reich, L., López-Tarazón, J. A., Moran, T., Ozturk, U., Reinhardt-Imjela, C., and Wendi, D.: Forensic hydro-meteorological analysis of an extreme flash flood: The 2016-05-29 event in Braunsbach, SW Germany, Sci. Total Environ, 630, 977–991, https://doi.org/10.1016/j.scitotenv.2018.02.241, 2018. a, b
Caldas-Alvarez, A., Khodayar, S., and Knippertz, P.: The impact of GPS and high-resolution radiosonde nudging on the simulation of heavy precipitation during HyMeX IOP6, Weather Clim. Dynam., 2, 561–580, https://doi.org/10.5194/wcd-2-561-2021, 2021. a, b
Caldas-Alvarez, A., Feldmann, H., Lucio-Eceiza, E., and Pinto, J. G.: Scale-dependency of extreme precipitation processes in regional climate simulations of the greater Alpine region, Weather Clim. Dynam. Discuss. [preprint], https://doi.org/10.5194/wcd-2022-11, in review, 2022. a
Coles, S.: An introduction to statistical modeling of extreme values, Springer, London, UK, London, ISBN 978-1-4471-3675-0, 2001. a, b, c, d
Costa-Surós, M., Sourdeval, O., Acquistapace, C., Baars, H., Carbajal Henken, C., Genz, C., Hesemann, J., Jimenez, C., König, M., Kretzschmar, J., Madenach, N., Meyer, C. I., Schrödner, R., Seifert, P., Senf, F., Brueck, M., Cioni, G., Engels, J. F., Fieg, K., Gorges, K., Heinze, R., Siligam, P. K., Burkhardt, U., Crewell, S., Hoose, C., Seifert, A., Tegen, I., and Quaas, J.: Detection and attribution of aerosol-cloud interactions in large-domain large-eddy simulations with the ICOsahedral Non-hydrostatic model, Atmos. Chem. Phys., 20, 5657–5678, https://doi.org/10.5194/acp-20-5657-2020, 2020. a
Davison, A. and Huser, R.: Statistics of Extremes, Annu. Rev. Stat. Appl., 2, 203–235, https://doi.org/10.1146/annurev-statistics-010814-020133, 2015. a
Davolio, S., Fera, S. D., Laviola, S., Miglietta, M. M., and Levizzani, V.: Heavy Precipitation over Italy from the Mediterranean Storm “Vaia” in October 2018: Assessing the Role of an Atmospheric River, Mon. Weather Rev., 148, 3571–3588, https://doi.org/10.1175/mwr-d-20-0021.1, 2020. a
Dillenardt, L., Hudson, P., and Thieken, A. H.: Urban pluvial flood adaptation: Results of a household survey across four German municipalities, J. Flood Risk Manage., 15, e12748, https://doi.org/10.1111/jfr3.12748, 2021. a, b
Douville, H., Raghavan, K., Renwick, J., Allan, R., Arias, P., Barlow, M., Cerezo-Mota, R., Cherchi, A., Gan, T., Gergis, J., Jiang, D., Khan, A., Mba, W. P., Rosenfeld, D., Tierney, J., and Zolina, O.: Water Cycle Changes, in: Climate Change 2021: The Physical Science Basis, in: Contribution of Working Group I to the Sixth Assessment Report of the Intergovernmental Panel on Climate Change, chap. 8, edited by: Masson-Delmotte, V., Zhai, P., Pirani, A., Connors, S., Péan, C., Berger, S., Caud, N., Chen, Y., Goldfarb, L., Gomis, M., Huang, M., Leitzell, K., Lonnoy, E., Matthews, J., Maycock, T., Waterfield, T., Yelekçi, O., Yu, R., and Zhou, B., Cambridge University Press, Cambridge, UK and New York, NY, USA, https://doi.org/10.1017/9781009157896.010, 2021. a
Drobinski, P., Alonzo, B., Bastin, S., Silva, N. D., and Muller, C.: Scaling of precipitation extremes with temperature in the French Mediterranean region: What explains the hook shape?, J. Geophys. Res.-Atmos., 121, 3100–3119, https://doi.org/10.1002/2015JD023497, 2016. a
Drüe, C., Hauf, T., Finke, U., Keyn, S., and Kreyer, O.: Comparison of a SAFIR lightning detection network in northern Germany to the operational BLIDS network, J. Geophys. Res.-Atmos., 112, D18114, https://doi.org/10.1029/2006JD007680, 2007. a
DWA: DWA-Regelwerk: Merkblatt DWA-M 552 – Ermittlung von Hochwasserwahrscheinlichkeiten, Deutschen Vereinigung für Wasserwirtschaft, DWA – Abwasser und Abfall e.V., Hennef, Germany, ISBN 978-3-96862-402-0, 2012. a
DWD: OpenData, DWD – Deutscher Wetterdienst, https://opendata.dwd.de, last access: 1 November 2021. a
ECMWF: Archive Catalogue, https://apps.ecmwf.int/archive-catalogue/?type=an&class=od&stream=oper&expver=1, last access: 15 November 2022. a
Eden, J. M., Wolter, K., Otto, F. E., and Van Oldenborgh, G. J.: Multi-method attribution analysis of extreme precipitation in Boulder, Colorado, Environ. Res. Lett., 11, 124009, https://doi.org/10.1088/1748-9326/11/12/124009, 2016. a
Efron, B. and Tibshirani, R. J.: An introduction to the bootstrap, in: Monographs on Statistics and Applied Probability 57, Chapman and Hall, New York, USA, ISBN 978-0412042317, 1993. a
Ehmele, F., Kautz, L.-A., Feldmann, H., and Pinto, J. G.: Long-term variance of heavy precipitation across central Europe using a large ensemble of regional climate model simulations, Earth Syst. Dynam., 11, 469–490, https://doi.org/10.5194/esd-11-469-2020, 2020. a, b
ESA: Land Cover CCI Product User Guide Version 2, Tech. Rep., European Space Agency, http://maps.elie.ucl.ac.be/CCI/viewer/download/ESACCI-LC-Ph2-PUGv2_2.0.pdf (last access: 15 November 2022), 2017. a
Fan, J., Rosenfeld, D., Yang, Y., Zhao, C., Leung, L. R., and Li, Z.: Substantial contribution of anthropogenic air pollution to catastrophic floods in Southwest China, Geophys. Res. Lett., 42, 6066–6075, https://doi.org/10.1002/2015GL064479, 2015. a
Fauer, F. S., Ulrich, J., Jurado, O. E., and Rust, H. W.: Flexible and consistent quantile estimation for intensity–duration–frequency curves, Hydrol. Earth Syst. Sci., 25, 6479–6494, https://doi.org/10.5194/hess-25-6479-2021, 2021. a
Ferro, C. A. T. and Stephenson, D. B.: Extremal Dependence Indices: Improved Verification Measures for Deterministic Forecasts of Rare Binary Events, Weather Forecast., 26, 699–713, https://doi.org/10.1175/WAF-D-10-05030.1, 2011. a
Formayer, H. and Fritz, A.: Temperature dependency of hourly precipitation intensities–surface versus cloud layer temperature, Int. J. Climatol., 37, 1–10, https://doi.org/10.1002/joc.4678, 2017. a
Forum, W. E.: The Global Risks Report 2020, https://www3.weforum.org/docs/WEF_Global_Risk_Report_2020.pdf (last access: 15 November 2022), 2020. a
Fosser, G., Khodayar, S., and Berg, P.: Benefit of convection permitting climate model simulations in the representation of convective precipitation, Clim, Dynam., 44, 45–60, https://doi.org/10.1007/s00382-014-2242-1, 2014. a
Ganguli, P. and Coulibaly, P.: Does nonstationarity in rainfall require nonstationary intensity–duration–frequency curves?, Hydrol. Earth Syst. Sci., 21, 6461–6483, https://doi.org/10.5194/hess-21-6461-2017, 2017. a, b
GDV: Naturgefahrenreport 2018. Die Schaden-Chronik der deutschen Versicherer, Tech. rep., German Insurance Association, Berlin, https://www.gdv.de/resource/blob/36254/23ad47bd6746bc456849b5cd41f61516/naturgefahrenreport-2018---schaden-chronik-data.pdf (last access: 15 November 2022), 2018. a, b, c, d
GDV: Serviceteil zum Naturgefahrenreport 2020, Tech. rep., German Insurance Association, Berlin, https://www.gdv.de/resource/blob/63612/9bf0708f9a0017e98b878078894c7e52/naturgefahrenreport-2020---serviceteil-data.pdf (last access: 15 November 2022), 2020. a, b
GDV: Von 2002 bis 2017: Deutschlandweit 6,7 Milliarden Euro Starkregen-Schäden, https://www.gdv.de/de/themen/news/von-2002-bis-2017–deutschlandweit-6-7-milliarden-euro-starkregen (last access: 15 November 2022), 2021. a, b
Gebauer, P., Myrcik, G., and Schenk, F.: Beiträge zur Berliner Wetterkarte. Herausgegeben vom Verein BERLINER WETTERKARTE e.V., Tech. rep., Institut für Meteorologie der Freien Universität Berlin, Berlin, https://berliner-wetterkarte.de/Beilagen/2017/BWK_Beitraege_20170714_Berlin_unter_Wasser.pdf (last access: 15 November 2022), 2017. a
GFZ – German Research Centre for Geosciences: HOWAS 21 – Flood Damage Database, GFZ [data set], https://doi.org/10.1594/GFZ.SDDB.HOWAS21, 2022. a
Gochis, D., Schumacher, R., Friedrich, K., Doesken, N., Kelsch, M., Sun, J., Ikeda, K., Lindsey, D., Wood, A., Dolan, B., Matrosov, S., Newman, A., Mahoney, K., Rutledge, S., Johnson, R., Kucera, P., Kennedy, P., Sempere-Torres, D., Steiner, M., Roberts, R., Wilson, J., Yu, W., Chandrasekar, V., Rasmussen, R., Anderson, A., and Brown, B.: The great Colorado flood of September 2013, B. Am. Meteorol. Soc., 96, 1461–1487, 2015. a
Grams, C. M., Binder, H., Pfahl, S., Piaget, N., and Wernli, H.: Atmospheric processes triggering the central European floods in June 2013, Nat. Hazards Earth Syst. Sci., 14, 1691–1702, https://doi.org/10.5194/nhess-14-1691-2014, 2014. a, b
Grieser, J., Staeger, T., and Schonwiese, C.-D.: Estimates and uncertainties of return periods of extreme daily precipitation in Germany, Meteorol. Z., 16, 553–564, https://doi.org/10.1127/0941-2948/2007/0235, 2007. a, b
Gumbel, E. J.: Statistics of Extremes, Columbia University Press, New York, USA, ISBN 978-1626549876, 1958. a
Guo, J., Luo, Y., Yang, J., Furtado, K., and Lei, H.: Effects of anthropogenic and sea salt aerosols on a heavy rainfall event during the early-summer rainy season over coastal Southern China, Atmos. Res., 265, 105923, https://doi.org/10.1016/j.atmosres.2021.105923, 2022. a
Hastings, D. A., Dunbar, P. K., Elphingstone, G. M., Bootz, M., Murakami, H., Maruyama, H., Masaharu, H., Holland, P., Payne, J., Bryant, N. A., Logan, T. L., Muller, J.-P., Schreier, G., and MacDonald, J. S.: The Global Land One-kilometer Base Elevation (GLOBE) Digital Elevation Model, Version 1.0., NOAA, http://www.ngdc.noaa.gov/mgg/topo/globe.html (last access: 15 November 2022), 1999. a
Hersbach, H., Bell, B., Berrisford, P., Biavati, G., Horányi, A., Muñoz Sabater, J., Nicolas, J., Peubey, C., Radu, R., Rozum, I., Schepers, D., Simmons, A., Soci, C., Dee, D., and Thépaut, J.-N.: ERA5 hourly data on single levels from 1979 to present, CDS [data set], https://doi.org/10.24381/cds.adbb2d47, 2018. a
Hersbach, H., Bell, B., Berrisford, P., Hirahara, S., Horányi, A., Muñoz-Sabater, J., Nicolas, J., Peubey, C., Radu, R., Schepers, D., Simmons, A., Soci, C., Abdalla, S., Abellan, X., Balsamo, G., Bechtold, P., Biavati, G., Bidlot, J., Bonavita, M., De Chiara, G., Dahlgren, P., Dee, D., Diamantakis, M., Dragani, R., Flemming, J., Forbes, R., Fuentes, M., Geer, A., Haimberger, L., Healy, S., Hogan, R. J., Hólm, E., Janisková, M., Keeley, S., Laloyaux, P., Lopez, P., Lupu, C., Radnoti, G., de Rosnay, P., Rozum, I., Vamborg, F., Villaume, S., and Thépaut, J.-N.: The ERA5 global reanalysis, Q. J. Roy. Meteorol. Soc., 146, 1999–2049, https://doi.org/10.1002/qj.3803, 2020. a, b, c
Hibino, K., Takayabu, I., Wakazuki, Y., and Ogata, T.: Physical responses of convective heavy rainfall to future warming condition: Case study of the Hiroshima event, Front. Environ. Sci., 6, 35, https://doi.org/10.3389/feart.2018.00035, 2018. a
Hogan, R. J., O'Connor, E. J., and Illingworth, A. J.: Verification of cloud-fraction forecasts, Q. J. Roy. Meteorol. Soc., 135, 1494–1511, https://doi.org/10.1002/qj.481, 2009. a
Hu, G. and Franzke, C. L. E.: Evaluation of Daily Precipitation Extremes in Reanalysis and Gridded Observation-Based Data Sets Over Germany, Geophys. Res. Lett., 47, e2020GL089624, https://doi.org/10.1029/2020GL089624, 2020. a
Hydrotec, University of Applies Sciences Aachen, and DWD: Vorhersage und Management von Sturzfluten in urbanen Gebieten (URBAS), Tech. rep., Aachen, http://www.urbanesturzfluten.de/schlussbericht/fallstudien Hamburg bis Lohmar/view?set_language=en (last access: 15 November 2022), 2008. a, b
Jurado, O. E., Ulrich, J., Scheibel, M., and Rust, H. W.: Evaluating the performance of a max-stable process for estimating intensity-duration-frequency curves, Water, 12, 3314, https://doi.org/10.3390/w12123314, 2020. a
Kadow, C., Illing, S., Lucio-Eceiza, E. E., Bergemann, M., Ramadoss, M., Sommer, P. S., Kunst, O., Schartner, T., Pankatz, K., Grieger, J., Schuster, M., Richling, A., Thiemann, H., Kirchner, I., Rust, H. W., Ludwig, T., Cubasch, U., and Ulbrich, U.: Introduction to Freva – A Free Evaluation System Framework for Earth System Modeling, J. Open Res. Softw., 9, 1–13, https://doi.org/10.5334/jors.253, 2021. a
Kaiser, M., Günnemann, S., and Disse, M.: Spatiotemporal analysis of heavy rain-induced flood occurrences in Germany using a novel event database approach, J. Hydrol., 595, 125985, https://doi.org/10.1016/j.jhydrol.2021.125985, 2021. a
Kaspar, F., Müller-Westermeier, G., Penda, E., Mächel, H., Zimmermann, K., Kaiser-Weiss, A., and Deutschländer, T.: Monitoring of climate change in Germany – data, products and services of Germany's National Climate Data Centre, Adv. Sci. Res., 10, 99–106, https://doi.org/10.5194/asr-10-99-2013, 2013. a, b
Kelemen, F. D., Ludwig, P., Reyers, M., Ulbrich, S., and Pinto, J. G.: Evaluation of moisture sources for the Central European summer flood of May/June 2013 based on regional climate model simulations, Tellus A, 68, 29288, https://doi.org/10.3402/tellusa.v68.29288, 2016. a
Keller, J. D. and Wahl, S.: Representation of climate in reanalyses: An intercomparison for Europe and North America, J. Climate, 34, 1667–1684, https://doi.org/10.1175/JCLI-D-20-0609.1, 2021. a, b
Kendon, E. J., Roberts, N. M., Senior, C. A., and Roberts, M. J.: Realism of rainfall in a very high-resolution regional climate model, J. Climate, 25, 5791–5806, https://doi.org/10.1175/JCLI-D-11-00562.1, 2012. a
Kharin, V. V. and Zwiers, F. W.: Changes in the extremes in an ensemble of transient climate simulations with a coupled atmosphere-ocean GCM, J. Climate, 13, 3760–3788, https://doi.org/10.1175/1520-0442(2000)013<3760:CITEIA>2.0.CO;2, 2000. a
Khodayar, S., Davolio, S., Girolamo, P. D., Brossier, C. L., Flaounas, E., Fourrie, N., Lee, K.-O., Ricard, D., Vie, B., Bouttier, F., Caldas-Alvarez, A., and Ducrocq, V.: Overview towards improved understanding of the mechanisms leading to heavy precipitation in the western Mediterranean: lessons learned from HyMeX, Atmos. Chem. Phys., 21, 17051–17078, https://doi.org/10.5194/acp-21-17051-2021, 2021. a
Koutsoyiannis, D., Kozonis, D., and Manetas, A.: A mathematical framework for studying rainfall intensity-duration-frequency relationships, J. Hydrol., 206, 118–135, https://doi.org/10.1016/S0022-1694(98)00097-3, 1998. a
Kox, T. and Lüder, C.: Impacts as triggers for weather-related decision making: Observations at the Berlin Fire Brigade Control and Dispatch Center, Int. J. Disast. Risk Sci., 12, 610–615, https://doi.org/10.1007/s13753-021-00356-4, 2021. a
Kreibich, H., Müller, M., Thieken, A. H., and Merz, B.: Flood precaution of companies and their ability to cope with the flood in August 2002 in Saxony, Germany, Water Resour. Res., 43, W03408, https://doi.org/10.1029/2005WR004691, 2007. a
Kreienkamp, F., Philip, S. Y., Tradowsky, J. S., Kew, S. F., Lorenz, P., Arrighi, J., Belleflamme, A., Bettmann, T., Caluwaerts, S., Chan, S. C., Ciavarella, A., De Cruz, L., de Vries, H., Demuth, N., Ferrone, A., Fischer, E. M., Fowler, H. J., Goergen, K., Heinrich, D., Henrichs, Y., Lenderink, G., Kaspar, F., Nilson, E., Otto, F. E. L., Ragone, F., Seneviratne, S. I., Singh, R. K., Skålevåg, A., Termonia, P., Thalheimer, L., van Aalst, M., Van den Bergh, J., Van de Vyver, H., Vannitsem, S., van Oldenborgh, G. J., Van Schaeybroeck, B., Vautard, R., Vonk, D., and Wanders, N.: Rapid attribution of heavy rainfall events leading to the severe flooding in Western Europe during July 2021, Tech. rep., World Weather Attribution, https://www.worldweatherattribution.org/wp-content/uploads/Scientific-report-Western-Europe-floods-2021-attribution.pdf (last access: 15 November 2022), 2021. a, b
Kron, W.: Flood Risk = Hazard ⋅ Values ⋅ Vulnerability, Water Int., 30, 58–68, https://doi.org/10.1080/02508060508691837, 2005. a, b
Kröner, N.: Identifying and quantifying large-scale drivers of European climate change, PhD thesis, ETH Zurich, Zurich, https://doi.org/10.3929/ethz-a-010793497, 2016. a
Kröner, N., Kotlarski, S., Fischer, E., Lüthi, D., Zubler, E., and Schär, C.: Separating climate change signals into thermodynamic, lapse-rate and circulation effects: theory and application to the European summer climate, Clim. Dynam., 48, 3425–3440, https://doi.org/10.1007/s00382-016-3276-3, 2017. a
Kuhlicke, C., Seebauer, S., Hudson, P., Begg, C., Bubeck, P., Dittmer, C., Grothmann, T., Heidenreich, A., Kreibich, H., Lorenz, D. F., Masson, T., Reiter, J., Thaler, T., Thieken, A. H., and Bamberg, S.: The behavioral turn in flood risk management, its assumptions and potential implications, WIREs Water, 7, 1–22, https://doi.org/10.1002/wat2.1418, 2020. a
Kunz, M., Mühr, B., Kunz-Plapp, T., Daniell, J. E., Khazai, B., Wenzel, F., Vannieuwenhuyse, M., Comes, T., Elmer, F., Schröter, K., Fohringer, J., Münzberg, T., Lucas, C., and Zschau, J.: Investigation of superstorm Sandy 2012 in a multi-disciplinary approach, Nat. Hazards Earth Syst. Sci., 13, 2579–2598, https://doi.org/10.5194/nhess-13-2579-2013, 2013. a
Lackmann, G. M.: Hurricane Sandy before 1900 and after 2100, B. Am. Meteorol. Soc., 96, 547–560, https://doi.org/10.1175/BAMS-D-14-00123.1, 2015. a
Leckebusch, G. C., Renggli, D., and Ulbrich, U.: Development and application of an objective storm severity measure for the Northeast Atlantic region, Meteorol. Z., 17, 575–587, https://doi.org/10.1127/0941-2948/2008/0323, 2008. a
Lengfeld, K., Kirstetter, P.-E., Fowler, H. J., Yu, J., Becker, A., Flamig, Z., and Gourley, J.: Use of radar data for characterizing extreme precipitation at fine scales and short durations, Environ. Res. Lett., 15, 085003, https://doi.org/10.1088/1748-9326/ab98b4, 2020. a
Lengfeld, K., Walawender, E., Winterrath, T., and Becker, A.: CatRaRE: A Catalogue of radar-based heavy rainfall events in Germany derived from 20 years of data, Meteorol. Z., 30, 469–487, https://doi.org/10.1127/metz/2021/1088, 2021a. a
Lengfeld, K., Walawender, E., Winterrath, T., Weigl, E., and Becker, A.: Heavy precipitation events Version 2021.01 exceeding DWD warning level 3 for severe weather based on RADKLIM-RW Version 2017.002, DWD, https://doi.org/10.5676/DWD/CatRaRE_W3_Eta_v2021.01, 2021b. a
Liu, Z., Ming, Y., Zhao, C., Lau, N. C., Guo, J., Bollasina, M., and Yim, S. H. L.: Contribution of local and remote anthropogenic aerosols to a record-breaking torrential rainfall event in Guangdong Province, China, Atmos. Chem. Phys., 20, 223–241, https://doi.org/10.5194/acp-20-223-2020, 2020. a
Lucas-Picher, P., Argüeso, D., Brisson, E., Tramblay, Y., Berg, P., Lemonsu, A., Kotlarski, S., and Caillaud, C.: Convection-permitting modeling with regional climate models: Latest developments and next steps, WIREs Clim. Change, 12, e731, https://doi.org/10.1002/wcc.731, 2021. a
Maity, R.: Statistical methods in hydrology and hydroclimatology, Springer Nature Singapore Pte Ltd., Singapore, https://doi.org/10.1007/978-981-10-8779-0, 2018. a
Makkonen, L.: Plotting positions in extreme value analysis, J. Appl. Meteorol. Clim., 45, 334–340, https://doi.org/10.1175/JAM2349.1, 2006. a
Markowski, P. and Richardson, Y.: Mesoscale Convective Systems, in: chap. 9, John Wiley & Sons, Ltd, 245–272, https://doi.org/10.1002/9780470682104.ch9, 2010. a
Mélèse, V., Blanchet, J., and Molinié, G.: Uncertainty estimation of Intensity–Duration–Frequency relationships: A regional analysis, J. Hydrol., 558, 579–591, https://doi.org/10.1016/j.jhydrol.2017.07.054, 2018. a
Meredith, E. P., Ulbrich, U., and Rust, H. W.: Subhourly rainfall in a convection-permitting model, Environ. Res. Lett., 15, 034031, https://doi.org/10.1088/1748-9326/ab6787, 2020. a
Meredith, E. P., Ulbrich, U., Rust, H. W., and Truhetz, H.: Present and future diurnal hourly precipitation in 0.11∘ EURO-CORDEX models and at convection-permitting resolution, Environ. Res. Commun., 3, 055002, https://doi.org/10.1088/2515-7620/abf15e, 2021. a, b, c
Meredith, E. P., Ulbrich, U., and Rust, H. W.: Attribution of the 29.06.2017 precipitation extreme in the Berlin region, DKRZ [data set], http://hdl.handle.net/21.14106/482a1823901f009e5cd9dee67c4c374920b3a3a7, last access: 15 November 2022. a
Merz, B., Kreibich, H., Schwarze, R., and Thieken, A. H.: Review article “Assessment of economic flood damage”, Nat. Hazards Earth Syst. Sci., 10, 1697–1724, https://doi.org/10.5194/nhess-10-1697-2010, 2010. a
Milrad, S. M., Gyakum, J. R., and Atallah, E. H.: A meteorological analysis of the 2013 Alberta flood: Antecedent large-scale flow pattern and synoptic–dynamic characteristics, Mon. Weather Rev., 143, 2817–2841, 2015. a
Mohr, S., Wilhelm, J., Wandel, J., Kunz, M., Portmann, R., Punge, H. J., Schmidberger, M., Quinting, J. F., and Grams, C. M.: The role of large-scale dynamics in an exceptional sequence of severe thunderstorms in Europe May–June 2018, Weather Clim. Dynam., 1, 325–348, https://doi.org/10.5194/wcd-1-325-2020, 2020. a
Mohr, S., Ehret, U., Kunz, M., Ludwig, P., Caldas-Alvarez, A., Daniell, J. E., Ehmele, F., Feldmann, H., Franca, M. J., Gattke, C., Hundhausen, M., Knippertz, P., Küpfer, K., Mühr, B., Pinto, J. G., Quinting, J., Schäfer, A. M., Scheibel, M., Seidel, F., and Wisotzky, C.: A multi-disciplinary analysis of the exceptional flood event of July 2021 in central Europe. Part 1: Event description and analysis, Nat. Hazards Earth Syst. Sci. Discuss. [preprint], https://doi.org/10.5194/nhess-2022-137, in review, 2022. a
Nakanishi, M. and Niino, H.: An Improved Mellor Yamada Level-3 Model: Its Numerical Stability and Application to a Regional Prediction of Advection Fog, Bound.-Lay. Meteorol., 119, 397–407, https://doi.org/10.1007/s10546-005-9030-8, 2006. a
Nakanishi, M. and Niino, H.: Development of an Improved Turbulence Closure Model for the Atmospheric Boundary Layer, Japan, J. Meteorol. Soc. Jpn., 87, 895–912, https://doi.org/10.2151/jmsj.87.895, 2009. a
Noyelle, R., Ulbrich, U., Becker, N., and Meredith, E. P.: Assessing the impact of sea surface temperatures on a simulated medicane using ensemble simulations, Nat. Hazards Earth Syst. Sci., 19, 941–955, https://doi.org/10.5194/nhess-19-941-2019, 2019. a
Olson, J. B., Kenyon, J., Angevine, W., Brown, J., Pagowski, M., and Suselj, K.: A Description of the MYNN-EDMF Scheme and the Coupling to Other Components in WRF–ARW, NOAA Technical Memorandum OAR GSD 61, NOAA, Boulder, CO, https://repository.library.noaa.gov/view/noaa/19837 (last access: 15 November 2022), 2019. a
O'Neill, B. C., Tebaldi, C., van Vuuren, D. P., Eyring, V., Friedlingstein, P., Hurtt, G., Knutti, R., Kriegler, E., Lamarque, J.-F., Lowe, J., Meehl, G. A., Moss, R., Riahi, K., and Sanderson, B. M.: The Scenario Model Intercomparison Project (ScenarioMIP) for CMIP6, Geosci. Model Dev., 9, 3461–3482, https://doi.org/10.5194/gmd-9-3461-2016, 2016. a
Otto, F. E. L.: Attribution of weather and climate events, Annu. Rev. Environ. Res., 42, 627–646, https://doi.org/10.1146/annurev-environ-102016-060847, 2017. a
Pall, P., Patricola, C. M., Wehner, M. F., Stone, D. A., Paciorek, C. J., and Collins, W. D.: Diagnosing conditional anthropogenic contributions to heavy Colorado rainfall in September 2013, Weather Clim. Extrem., 17, 1–6, https://doi.org/10.1016/j.wace.2017.03.004, 2017. a
Papalexiou, S. M. and Koutsoyiannis, D.: Battle of extreme value distributions: A global survey on extreme daily rainfall, Water Resour. Res., 49, 187–201, https://doi.org/10.1029/2012WR012557, 2013. a
Philip, S., Kew, S. F., van Oldenborgh, G. J., Aalbers, E., Vautard, R., Otto, F., Haustein, K., Habets, F., and Singh, R.: Validation of a rapid attribution of the May/June 2016 flood-inducing precipitation in France to climate change, J. Hydrol., 19, 1881–1898, https://doi.org/10.1175/JHM-D-18-0074.1, 2018. a
Philip, S., Kew, S., van Oldenborgh, G. J., Otto, F., Vautard, R., van der Wiel, K., King, A., Lott, F., Arrighi, J., Singh, R., and van Aalst, M.: A protocol for probabilistic extreme event attribution analyses, Adv. Stat. Clim. Meteorol. Oceanogr., 6, 177–203, https://doi.org/10.5194/ascmo-6-177-2020, 2020. a
Pichelli, E., Coppola, E., Sobolowski, S., Ban, N., Giorgi, F., Stocchi, P., Alias, A., Belušić, D., Berthou, S., Caillaud, C., Cardoso, R. M., Chan, S., Christensen, O. B., Dobler, A., de Vries, H., Goergen, K., Kendon, E. J., Keuler, K., Lenderink, G., Lorenz, T., Mishra, A. N., Panitz, H.-J., Schär, C., Soares, P. M. M., Truhetz, H., and Vergara-Temprado, J.: The first multi-model ensemble of regional climate simulations at kilometer-scale resolution part 2: historical and future simulations of precipitation, Clim. Dynam., 56, 3581–3602, https://doi.org/10.1007/s00382-021-05657-4, 2021. a
Pinto, J. G., Karremann, M. K., Born, K., Della-Marta, P. M., and Klawa, M.: Loss potentials associated with European windstorms under future climate conditions, Clim. Res., 54, 1–20, https://doi.org/10.3354/cr01111, 2012. a
Piper, D. and Kunz, M.: Spatiotemporal variability of lightning activity in Europe and the relation to the North Atlantic Oscillation teleconnection pattern, Nat. Hazards Earth Syst. Sci., 17, 1319–1336, https://doi.org/10.5194/nhess-17-1319-2017, 2017. a
Piper, D., Kunz, M., Ehmele, F., Mohr, S., Mühr, B., Kron, A., and Daniell, J.: Exceptional sequence of severe thunderstorms and related flash floods in May and June 2016 in Germany. Part I: Meteorological background, Nat. Hazards Earth Syst. Sci., 16, 2835–2850, https://doi.org/10.5194/nhess-16-2835-2016, 2016. a, b, c, d
Poelman, D. R., Schulz, W., Diendorfer, G., and Bernardi, M.: The European lightning location system EUCLID – Part 2: Observations, Nat. Hazards Earth Syst. Sci., 16, 607–616, https://doi.org/10.5194/nhess-16-607-2016, 2016. a
Poggio, L., de Sousa, L. M., Batjes, N. H., Heuvelink, G. B. M., Kempen, B., Ribeiro, E., and Rossiter, D.: SoilGrids 2.0: producing soil information for the globe with quantified spatial uncertainty, Soil, 7, 217–240, https://doi.org/10.5194/soil-7-217-2021, 2021. a
Prein, A., Gobiet, A., Suklitsch, M., Truhetz, H., Awan, N., Keuler, K., and Georgievski, G.: Added value of convection permitting seasonal simulations, Clim. Dynam., 41, 2655–2677, https://doi.org/10.1007/s00382-013-1744-6, 2013. a
Prein, A. F., Langhans, W., Fosser, G., Ferrone, A., Ban, N., Goergen, K., Keller, M., Tölle, M., Gutjahr, O., Feser, F., Brisson, E., Kollet, S., Schmidli, J., van Lipzig, N. P. M., and Leung, R.: A review on regional convection-permitting climate modeling: Demonstrations, prospects, and challenges, Rev. Geophys., 53, 323–361, https://doi.org/10.1002/2014RG000475, 2015. a
Purr, C., Brisson, E., and Ahrens, B.: Convective rain cell characteristics and scaling in climate projections for Germany, Int. J. Climatol., 41, 3174–3185, https://doi.org/10.1002/joc.7012, 2021. a
Rauthe, M., Steiner, H., Riediger, U. A. M., and Gratzki, A.: A Central European precipitation climatology – Part I: Generation and validation of a high-resolution gridded daily data set (HYRAS), Meteorol. Z., 22, 235–256, https://doi.org/10.1127/0941-2948/2013/0436, 2013. a
Rezacova, D., Zacharov, P., and Sokol, Z.: Uncertainty in the area-related QPF for heavy convective precipitation, Atmos. Res., 93, 238–246, https://doi.org/10.1016/j.atmosres.2008.12.005, 2009. a
Rockel, B., Will, A., and Hense, A.: The regional climate model COSMO-CLM (CCLM), Meteorol. Z., 17, 347–348, https://doi.org/10.1127/0941-2948/2008/0309, 2008. a, b
Rosenfeld, D., Andreae, M. O., Asmi, A., Chin, M., de Leeuw, G., Donovan, D. P., Kahn, R., Kinne, S., Kivekäs, N., Kulmala, M., Lau, W., Schmidt, S., Suni, T., Wagner, T., Wild, M., and Quaas, J.: Global observations of aerosol-cloud-precipitation-climate interactions, Rev. Geophys., 52, 750–808, https://doi.org/10.1002/2013RG000441, 2014. a
Rözer, V., Müller, M., Bubeck, P., Kienzler, S., Thieken, A., Pech, I., Schröter, K., Buchholz, O., and Kreibich, H.: Coping with pluvial floods by private households, Water, 8, 304, https://doi.org/10.3390/W8070304, 2016. a, b
Rözer, V., Kreibich, H., Schröter, K., Müller, M., Sairam, N., Doss‐Gollin, J., Lall, U., and Merz, B.: Probabilistic Models Significantly Reduce Uncertainty in Hurricane Harvey Pluvial Flood Loss Estimates, Earth's Future, 7, 384–394, https://doi.org/10.1029/2018EF001074, 2019. a
Rust, H. W.: The effect of long-range dependence on modelling extremes with the generalised extreme value distribution, Eur. Phys. J. Spec. Top., 174, 91–97, https://doi.org/10.1140/epjst/e2009-01092-8, 2009. a
Schär, C., Frei, C., Lüthi, D., and Davies, H. C.: Surrogate climate-change scenarios for regional climate models, Geophys. Res. Lett., 23, 669–672, https://doi.org/10.1029/96GL00265, 1996. a
Schulz, W., Diendorfer, G., Pedeboy, S., and Poelman, D. R.: The European lightning location system EUCLID – Part 1: Performance analysis and validation, Nat. Hazards Earth Syst. Sci., 16, 595–605, https://doi.org/10.5194/nhess-16-595-2016, 2016. a, b
Schwitalla, T., Warrach-Sagi, K., Wulfmeyer, V., and Resch, M.: Near-global-scale high-resolution seasonal simulations with WRF-Noah-MP v.3.8.1, Geosci. Model Dev., 13, 1959–1974, https://doi.org/10.5194/gmd-13-1959-2020, 2020. a
Schwitalla, T., Bauer, H.-S., Warrach-Sagi, K., Bönisch, T., and Wulfmeyer, V.: Turbulence-permitting air pollution simulation for the Stuttgart metropolitan area, Atmos. Chem. Phys., 21, 4575–4597, https://doi.org/10.5194/acp-21-4575-2021, 2021. a
Sebastian, A., Gori, A., Blessing, R. B., van der Wiel, K., and Bass, B.: Disentangling the impacts of human and environmental change on catchment response during Hurricane Harvey, Environ. Res. Lett., 14, 124023, https://doi.org/10.1088/1748-9326/ab5234, 2019. a
Siemens: BLIDS, https://new.siemens.com/de/de/produkte/services/blids.html, last access: 15 November 2022. a
Skamarock, W. C., Klemp, J. B., Dudhia, J., Gill, D., Liu, Z., Berner, J., Wang, W., Duda, M. G., Powers, J. G., Barker, D., and Huang, X.-Y.: A Description of the Advanced Research WRF Version 4, NCAR Technical Note TN-556+STR, NCAR, Boulder, CO, https://doi.org/10.5065/1dfh-6p97, 2021. a
Smith, B. K., Smith, J. A., Baeck, M. L., and Miller, A. J.: Exploring storage and runoff generation processes for urban flooding through a physically based watershed model, Water Resour. Res., 51, 1552–1569, https://doi.org/10.1002/2014WR016085, 2015. a
Sodemann, H., Schwierz, C., and Wernli, H.: Interannual variability of Greenland winter precipitation sources: Lagrangian moisture diagnostic and North Atlantic Oscillation influence, J. Geophys. Res.-Atmos., 113, D03107, https://doi.org/10.1029/2007JD008503, 2008. a, b, c
Song, H. and Sohn, B.: An Evaluation of WRF Microphysics Schemes for Simulating the Warm-Type Heavy Rain over the Korean Peninsula, Asia-Pacif. J. Atmos. Sci., 54, 225–236, https://doi.org/10.1007/s13143-018-0006-2, 2018. a
Spekkers, M., Rözer, V., Thieken, A., Ten Veldhuis, M. C., and Kreibich, H.: A comparative survey of the impacts of extreme rainfall in two international case studies, Nat. Hazards Earth Syst. Sci., 17, 1337–1355, https://doi.org/10.5194/nhess-17-1337-2017, 2017. a, b
Spekkers, M. H., Kok, M., Clemens, F. H., and Ten Veldhuis, J. A.: Decision-tree analysis of factors influencing rainfall-related building structure and content damage, Nat. Hazards Earth Syst. Sci., 14, 2531–2547, https://doi.org/10.5194/nhess-14-2531-2014, 2014. a
Stevens, B., Acquistapace, C., Hansen, A., Heinze, R., Klinger, C., Klocke, D., Schubotz, W., Windmiller, J., Adamidis, P., Arka, I., Barlakas, V., Biercamp, J., Brueck, M., Brune, S., Buehler, S., Burkhardt, U., Cioni, G., Costa-Surós, M., Crewell, S., Crueger, T., Deneke, H., Friederichs, P., Cintia Carbajal, H., Hohenegger, C., Jacob, M., Jakub, F., Kalthoff, N., Köhler, M., Van Laar, T. W., Li, P., Löhnert, U., Macke, A., Madenach, N., Mayer, B., Nam, C., Naumann, A. K., Peters, K., Poll, S., Quaas, J., Röber, N., Rochetin, N., Rybka, H., Scheck, L., Schemann, V., Schnitt, S., Seifert, A., Senf, F., Shapkalijevski, M., Simmer, C., Singh, S., Sourdeval, O., Spickermann, D., Strandgren, J., Tessiot, O., Vercauteren, N., Vial, J., Voigt, A., and Zängl, G.: Large-eddy and storm resolving models for climate prediction – the added value for clouds and precipitation, J. Meteorol. Soc. Jpn., 98, 395–435, https://doi.org/10.2151/jmsj.2020-021, 2020. a, b, c
Stott, P. A., Stone, D. A., and Allen, M. R.: Human contribution to the European heatwave of 2003, Nature, 432, 610–614, https://doi.org/10.1038/nature03089, 2004. a
Svensson, C. and Jones, D. A.: Review of rainfall frequency estimation methods, J. Flood Risk Manage., 3, 296–313, https://doi.org/10.1111/j.1753-318X.2010.01079.x, 2010. a, b
Thompson, G. and Eidhammer, T.: A Study of Aerosol Impacts on Clouds and Precipitation Development in a Large Winter Cyclone, J. Atmos. Sci., 71, 3636–3658, https://doi.org/10.1175/JAS-D-13-0305.1, 2014. a
Tiedtke, M.: A comprehensive mass flux scheme for cumulus parameterization in large-scale models, Mon. Weather Rev., 117, 1779–1800, 1989. a, b
Trenberth, K. E., Fasullo, J. T., and Shepherd, T. G.: Attribution of climate extreme events, Nat. Clim. Change, 5, 725–730, https://doi.org/10.1038/nclimate2657, 2015. a
Ulrich, J., Jurado, O. E., Peter, M., Scheibel, M., and Rust, H. W.: Estimating IDF curves consistently over durations with spatial covariates, Water, 12, 3119, https://doi.org/10.3390/w12113119, 2020. a, b
Van den Besselaar, E. J. M., Klein Tank, A. M. G., and Buishand, T. A.: Trends in European precipitation extremes over 1951–2010, Int. J. Climatol., 33, 2682–2689, https://doi.org/10.1002/joc.3619, 2013. a
Van Ootegem, L., Verhofstadt, E., Van Herck, K., and Creten, T.: Multivariate pluvial flood damage models, Environ. Imp. Assess. Rev., 54, 91–100, https://doi.org/10.1016/j.eiar.2015.05.005, 2015. a
Van Ootegem, L., Van Herck, K., Creten, T., Verhofstadt, E., Foresti, L., Goudenhoofdt, E., Reyniers, M., Delobbe, L., Murla Tuyls, D., and Willems, P.: Exploring the potential of multivariate depth-damage and rainfall-damage models, J. Flood Risk Manage., 11, S916–S929, https://doi.org/10.1111/jfr3.12284, 2018. a
Wandel, J.: Starkregen, Deutschland, 29.06.2017, Wettergefahren-Frühwarnung, Center for Disaster Management and Risk Reduction Technology, Karlsruhe, Germany, http://www.wettergefahren-fruehwarnung.de/Ereignis/20170630_e.html (last access: 13 August 2021), 2017. a
Warrach-Sagi, K., Schwitalla, T., Wulfmeyer, V., and Bauer, H.-S.: Evaluation of a climate simulation in Europe based on the WRF–NOAH model system: precipitation in Germany, Clim. Dynam., 41, 755–774, https://doi.org/10.1007/s00382-013-1727-7, 2013. a
Wasko, C., Sharma, A., and Westra, S.: Reduced spatial extent of extreme storms at higher temperatures, Geophys. Res. Lett., 43, 4026–4032, https://doi.org/10.1002/2016GL068509, 2016. a
Werner, P. and Gerstengarbe, F.-W.: Catalog of the general weather situations of Europe, PIK – Potsdam Institute for Climate Impact Research, https://www.pik-potsdam.de/en/output/publications/pikreports/.files/pr119.pdf (last access: 10 November 2021), 2010. a
Wilhelm, J., Mohr, S., Punge, H. J., Mühr, B., Schmidberger, M., Daniell, J. E., Bedka, K. M., and Kunz, M.: Severe thunderstorms with large hail across Germany in June 2019, Weather, 76, 228–237, https://doi.org/10.1002/wea.3886, 2021. a
Wilks, D. S.: Statistical methods in the atmospheric sciences: An introduction – Second Edition, Academie Press, Elsevier, Burlington, USA, https://doi.org/10.1016/C2017-0-03921-6, 2006. a
Winschall, A., Pfahl, S., Sodemann, H., and Wernli, H.: Comparison of Eulerian and Lagrangian moisture source diagnostics – The flood event in eastern Europe in May 2010, Atmos. Chem. Phys., 14, 6605–6619, https://doi.org/10.5194/acp-14-6605-2014, 2014. a
Winterrath, T., Brendel, C., Hafer, M., Junghänel, T., Klameth, A., Walawender, E., Weigl, E., and Becker, A.: Erstellung einer radargestützten Niederschlagsklimatologie, Tech. rep., Berichte des Deutschen Wetterdienstes, Offenbach am Main, https://www.dwd.de/DE/leistungen/pbfb_verlag_berichte/pdf_einzelbaende/251_pdf.pdf?__blob=publicationFile&v=2 (last access: 15 November 2022), 2017. a
Wulfmeyer, V., Behrendt, A., Kottmeier, C., Corsmeier, U., Barthlott, C., Craig, G. C., Hagen, M., Althausen, D., Aoshima, F., Arpagaus, M., Bauer, H.-S., Bennett, L., Blyth, A., Brandau, C., Champollion, C., Crewell, S., Dick, G., Di Girolamo, P., Dorninger, M., Dufournet, Y., Eigenmann, R., Engelmann, R., Flamant, C., Foken, T., Gorgas, T., Grzeschik, M., Handwerker, J., Hauck, C., Höller, H., Junkermann, W., Kalthoff, N., Kiemle, C., Klink, S., König, M., Krauss, L., Long, C. N., Madonna, F., Mobbs, S., Neininger, B., Pal, S., Peters, G., Pigeon, G., Richard, E., Rotach, M. W., Russchenberg, H., Schwitalla, T., Smith, V., Steinacker, R., Trentmann, J., Turner, D. D., van Baelen, J., Vogt, S., Volkert, H., Weckwerth, T., Wernli, H., Wieser, A., and Wirth, M.: The Convective and Orographically-induced Precipitation Study (COPS): the scientific strategy, the field phase, and research highlights, Q. J. Roy. Meteorol. Soc., 137, 3–30, https://doi.org/10.1002/qj.752, 2011. a