the Creative Commons Attribution 4.0 License.
the Creative Commons Attribution 4.0 License.
 | 07 Nov 2022
Potential of satellite-derived hydro-meteorological information for landslide initiation thresholds in Rwanda
Alessia Riveros
Hellen Wanjala
Jaap Schellekens
Frederiek Sperna Weiland
Markus Hrachowitz
Thom A. Bogaard
Satellite and hydrological model-based technologies provide estimates of rainfall and soil moisture over larger spatial scales and now cover multiple decades, sufficient to explore their value for the development of landslide early warning systems in data-scarce regions. In this study, we used statistical metrics to compare gauge-based and satellite-based precipitation products and assess their performance in landslide hazard assessment and warning in Rwanda. Similarly, the value of high-resolution satellite and hydrological model-derived soil moisture was compared to in situ soil moisture observations at Rwandan weather station sites. Based on statistical indicators, rainfall data from Integrated Multi-Satellite Retrievals for Global Precipitation Measurement (GPM_IMERG) showed the highest skill in reproducing the main spatiotemporal precipitation patterns at the study sites in Rwanda. Similarly, the satellite- and model-derived soil moisture time series broadly reproduce the most important trends of in situ soil moisture observations. We evaluated two categories of landslide meteorological triggering conditions from IMERG satellite precipitation: first, the maximum rainfall amount during a multi-day rainfall event, and second, the cumulative rainfall over the past few day(s). For each category, the antecedent soil moisture recorded at three levels of soil depth, the top 5 cm by satellite-based technologies as well as the top 50 cm and 2 m by modelling approaches, was included in the statistical models to assess its potential for landslide hazard assessment and warning capabilities. The results reveal the cumulative 3 d rainfall to be the most effective predictor for landslide triggering. This was indicated not only by its highest discriminatory power to distinguish landslide from no-landslide conditions (AUC ∼ 0.72), but also the resulting true positive alarms (TPRs) of ∼80 %. The modelled antecedent soil moisture in the 50 cm root zone Seroot(t−3) was the most informative hydrological variable for landslide hazard assessment (AUC ∼ 0.74 and TPR 84 %). The hydro-meteorological threshold models that incorporate the Seroot(t−3) and following the cause–trigger concept in a bilinear framework reveal promising results with improved landslide warning capabilities in terms of reduced rate of false alarms by ∼20 % at the expense of a minor reduction in true alarms by ∼8 %.
- Article
(6482 KB) - Full-text XML
- BibTeX
- EndNote


Landslides are one of the most prevalent hazards in mountainous regions of the world, associated with high rates of fatalities, injuries and economic loss globally (Froude and Petley, 2018; Haque et al., 2016; Kirschbaum et al., 2015; Petley, 2012). According to a recent estimate (Froude and Petley, 2018), precipitation-induced landslides were responsible for a global total of ∼55 000 deaths over the 13-year period from 2004 to 2016. In landslide-prone regions, much effort is therefore put into the implementation of prevention and protection measures to control the most sensitive factors. Landslide early warning systems (LEWSs) are used as non-structural and cost-effective mitigation measures adopted to minimise landslide harm and loss of life and property (Calvello et al., 2020; Glade and Nadim, 2014). However, the global landslide research indicated a bias in the geographical distribution of LEWS and landslide research, with a major gap in Africa (Gariano and Guzzetti, 2016; Guzzetti et al., 2020; Kirschbaum et al., 2010, 2015). According to Guzzetti et al. (2020), there are no LEWSs in African countries, despite the high number of fatal landslides recorded and the high landslide susceptibility (Broeckx et al., 2018; Kirschbaum et al., 2015). Previous landslide susceptibility analysis revealed countries along the East African Rift region to be highly susceptible to landslides (Broeckx et al., 2018) despite only the most severe landslides often being reported, and thus a large number is missing. The East African Rift (EAR) was thus identified as a major hotspot of hazardous landslides in Africa, with a high rate of population exposure (Depicker et al., 2020, 2021a; Monsieurs et al., 2019a). In the long term, this is due to the active continental rifting caused by the persistent divergence of the Victoria and Nubia microplates (Glerum et al., 2020), while in the short term it is controlled by the interactions of prolonged and intense rainstorms in the region with hydrogeological and landscape processes. Rwanda is among the tropical countries located in the western branch of the East African Rift, threatened by landslide hazards (Bizimana and Sönmez, 2015; Nsengiyumva et al., 2018; Nsengiyumva and Valentino, 2020). About 43 % of its surface area is classified as having moderate to very high susceptibility to landslides, with 49 % of the local population exposed to landslide risks (Nsengiyumva et al., 2018). The long-term landslide-predisposing factors in Rwanda include its pronounced topographic profile, the inherent geological and lithological units, weathering processes, earthquakes, demographic pressure and the related anthropogenic activities such as deforestation, agriculture expansion and slope incision through road construction activities (Bizimana and Sönmez, 2015; Depicker et al., 2015, 2021b; Moeyersons, 1989; Monsieurs et al., 2018b; Nsengiyumva et al., 2018; Valentino et al., 2021). The development of mining sites and the connected feeder roads also changes the nature of the natural hillslope through excavation, thus exacerbating landslide susceptibility and risks of slope failures. In addition, urban expansion pushes settlements, industry and infrastructure into hazardous areas that are naturally unstable, thereby further increasing the number of elements at landslide risk. The short-term landslide-triggering factors include prolonged and intense rains in addition to the hydrological process that predisposes slopes to near failure. In the past 15-year period from January 2006 to May 2021, the landslide inventory in Rwanda indicated about 425 landslide deaths (∼0.6 % of global landslide deaths) and about 2000 injuries induced by the above-normal hydrological and meteorological factors (Uwihirwe et al., 2022). The lack of LEWSs is one of the important factors in the increasing number of landslide victims in Rwanda. The development of a robust LEWS hinges on the availability of hydro-meteorological data with sufficient spatiotemporal resolution and an accurate landslide inventory, both of which are scarce. Recently, numerous river catchments in Rwanda have been equipped with groundwater monitoring wells, river water-level gauges, soil moisture sensors as well as the automated weather stations. However, the available data records are frequently of insufficient length to build historical time series that overlap with the time periods of landslide inventories and that could be incorporated into landslide hazard assessment thresholds. As a first step towards LEWS development in Africa, Monsieurs et al. (2019a, b) used the Landslide Inventory for the central section of the Western branch of the East African Rift (LIWEAR) to define the landslide susceptibility–rainfall and antecedent soil moisture thresholds in the East African Rift region. In Rwanda, Uwihirwe et al. (2020) used a statistical approach to define gauge-based precipitation thresholds along with estimates of antecedent precipitation indices. Furthermore, Uwihirwe et al. (2022) incorporated regional groundwater-level measurements extended with a transfer function noise model to define the landslide hydro-meteorological thresholds for regional landslide hazard assessment. So far, these studies have relied exclusively on in situ observed precipitation and hydrological data constrained by the sparsely distributed recording equipment with point-scale resolution and gaps in the data record. There is a concern about the omission and/or overgeneralisation of information on the pre-wetting hydrological conditions at the locations of the landslides due to the sparsely distributed hydrological recording equipment (Uwihirwe et al., 2022). These pre-wetting conditions regulate the disposition of a slope to near failure (Bogaard and Greco, 2018; Sidle et al., 2019). Including this information in a LEWS may thus be a promising opportunity to decrease the rate of both false and missed alarms (Bogaard and Greco, 2018; Peres et al., 2018). Similarly to other hydrological variables, soil moisture exhibits high spatial variability, particularly in tropical areas (Dewitte et al., 2021; Kirschbaum et al., 2012; Sekaranom et al., 2020). This spatial variability is hardly covered by on-site monitoring equipment due to the sparse observation networks, themselves providing point-scale observations only. Alternative ways of incorporating such hydrological state information into landslide hydro-meteorological thresholds have been attempted and include the use of soil moisture estimates from satellite products (Marino et al., 2020; Thomas et al., 2020; Zhuo et al., 2019) as well as from distributed hydrological models (Mostbauer et al., 2018; Prenner et al., 2018, 2019; Wang et al., 2019; Zhao et al., 2020). In this study, we aimed to explore the usefulness of combining soil moisture from satellite products and from a distributed hydrological model with satellite-based precipitation for the estimation of landslide hazard assessment thresholds in Rwanda. We specifically (i) investigated the suitability of various satellite precipitation products as a substitute for rainfall data from a sparsely distributed gauge network in Rwanda, (ii) evaluated the added value of satellite- and model-derived soil moisture information recorded at various soil depths and (iii) assessed the potential of incorporating such information into empirical landslide hazard assessment threshold models and the warning capabilities in Rwanda.
Rwanda is an evergreen landlocked country geographically located between 1–3∘ S and 28–31∘ E in the great lakes region of central eastern Africa with a total area of 26 338 km2. It is topographically characterised by high elevation in the north-western regions reaching up to about 4500 m (Fig. 1) and steep slopes reaching up to 55 %. The geomorphology of Rwanda is characterised by angular hills, rounded hills and headlands, mountains and volcanoes (Fig. 2). The subtropical highland climate, with a long-term mean annual rainfall > 1200 mm yr−1 in the north-western highland regions and <1000 mm yr−1 in the eastern savannah region (Fig. 1) and a mean annual temperature of about 19 ∘C, prevails in the country. The north-western region of the country is located in a tectonic region with a seismically active volcanic chain and earthquakes being among the possible landslide triggers. The hydrology is characterised by dense networks of lakes and rivers, while the hydrogeology consists mainly of fractured aquifers of granite gneisses, schists, mica schists and complex aquifers in volcanic rocks of the northern and south-western parts of the country (Fig. 3). The main hydrogeological units in the landslide area include low- and semi-permeable fractured schist and mica schist and permeable fractured granites. The weathering products of granites are generally coarse-grained and tend to develop and preserve open-joint systems that increase their permeability and are thus prone to landslide hazards. The weathering products of schists include clay minerals that tend to fill up the fractures, thus slowing the permeability. However, mica schists are renowned as unstable due to rapid weathering, easy splitting along the joints and bedding planes and loss of strength induced by the high content of mica.
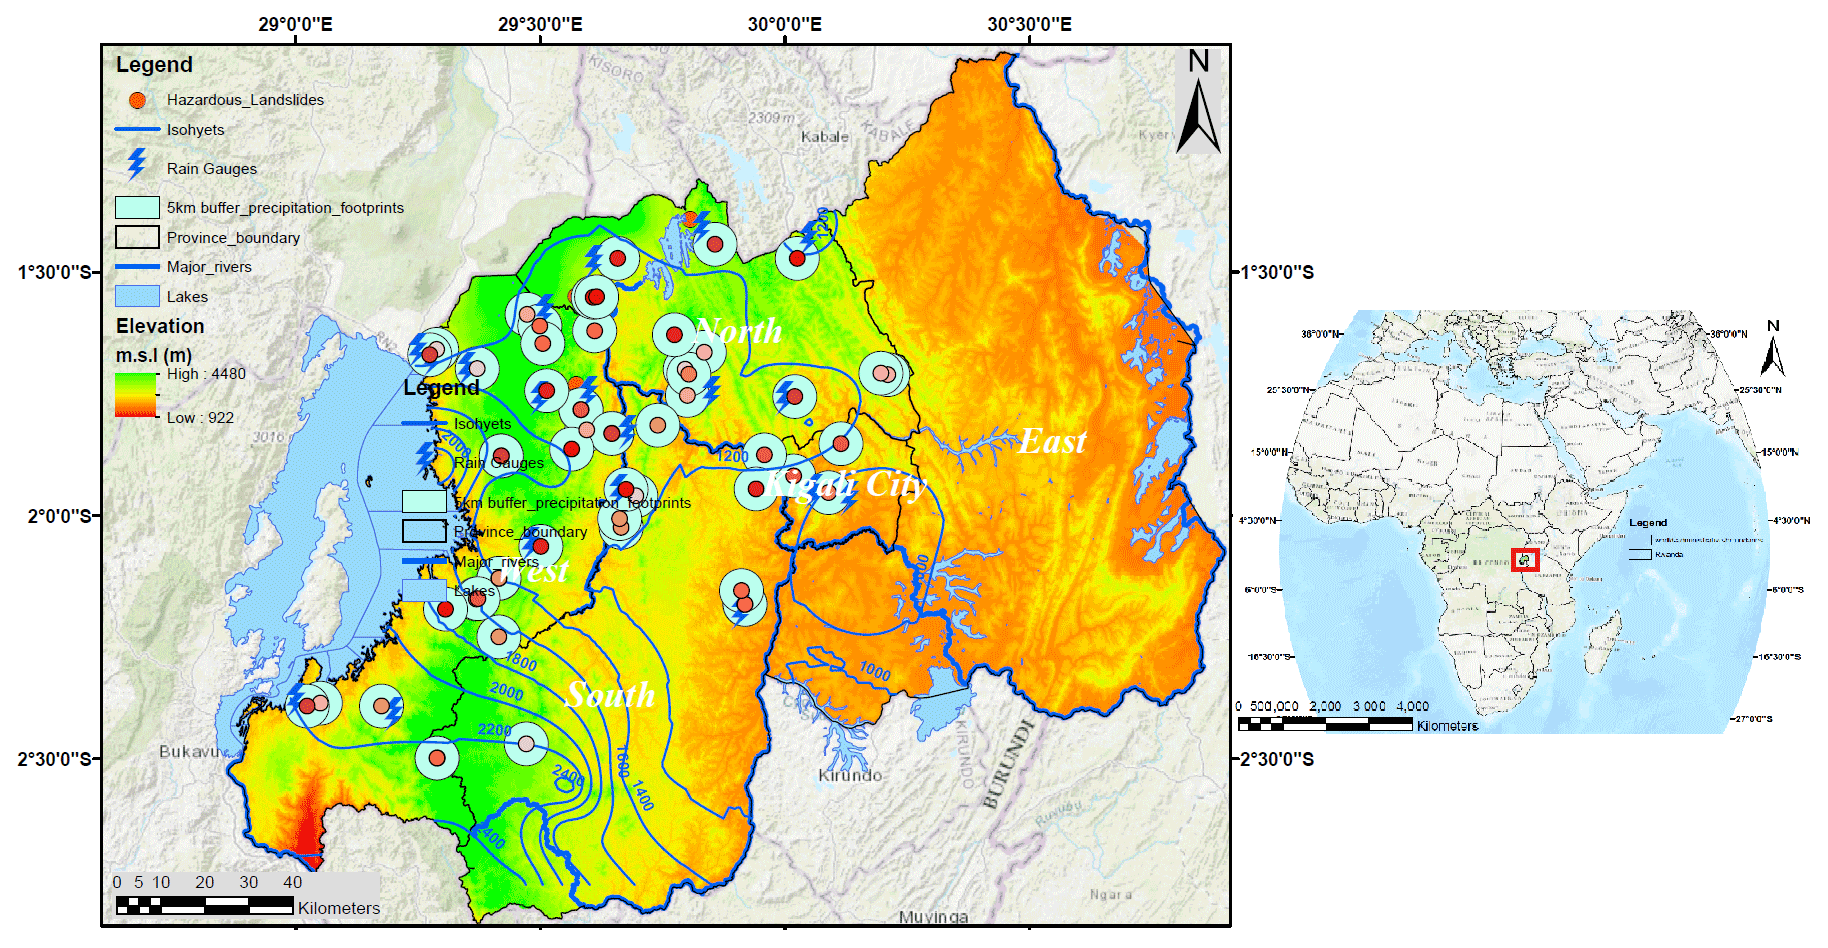
Figure 1Location of Rwanda in Africa, elevation, spatial and temporal distribution of hazardous landslides with light to dark red dots indicating old to new landslides recorded from 2007 to 2019, landslide representative rain gauges, rainfall distributions indicated by isohyets (sky blue lines) and precipitation footprint of the 5 km buffer around each landslide.
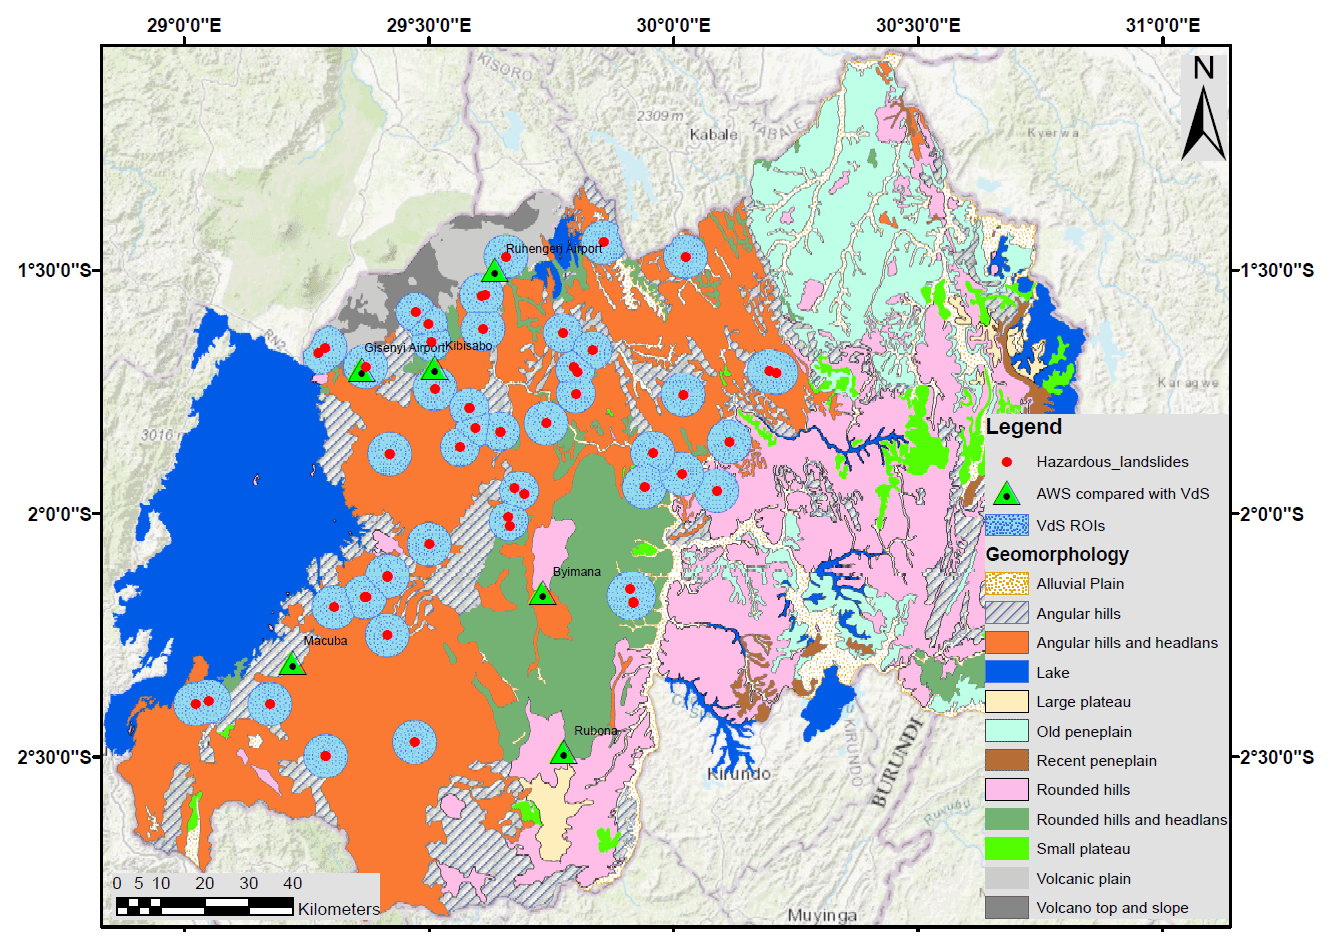
Figure 2Geomorphology of Rwanda, landslide representative AWSs (automated weather stations) with soil moisture sensors, landslides in red dots and 5 km buffer zones indicating the research area of interest (ROI) for areal soil moisture acquisition.
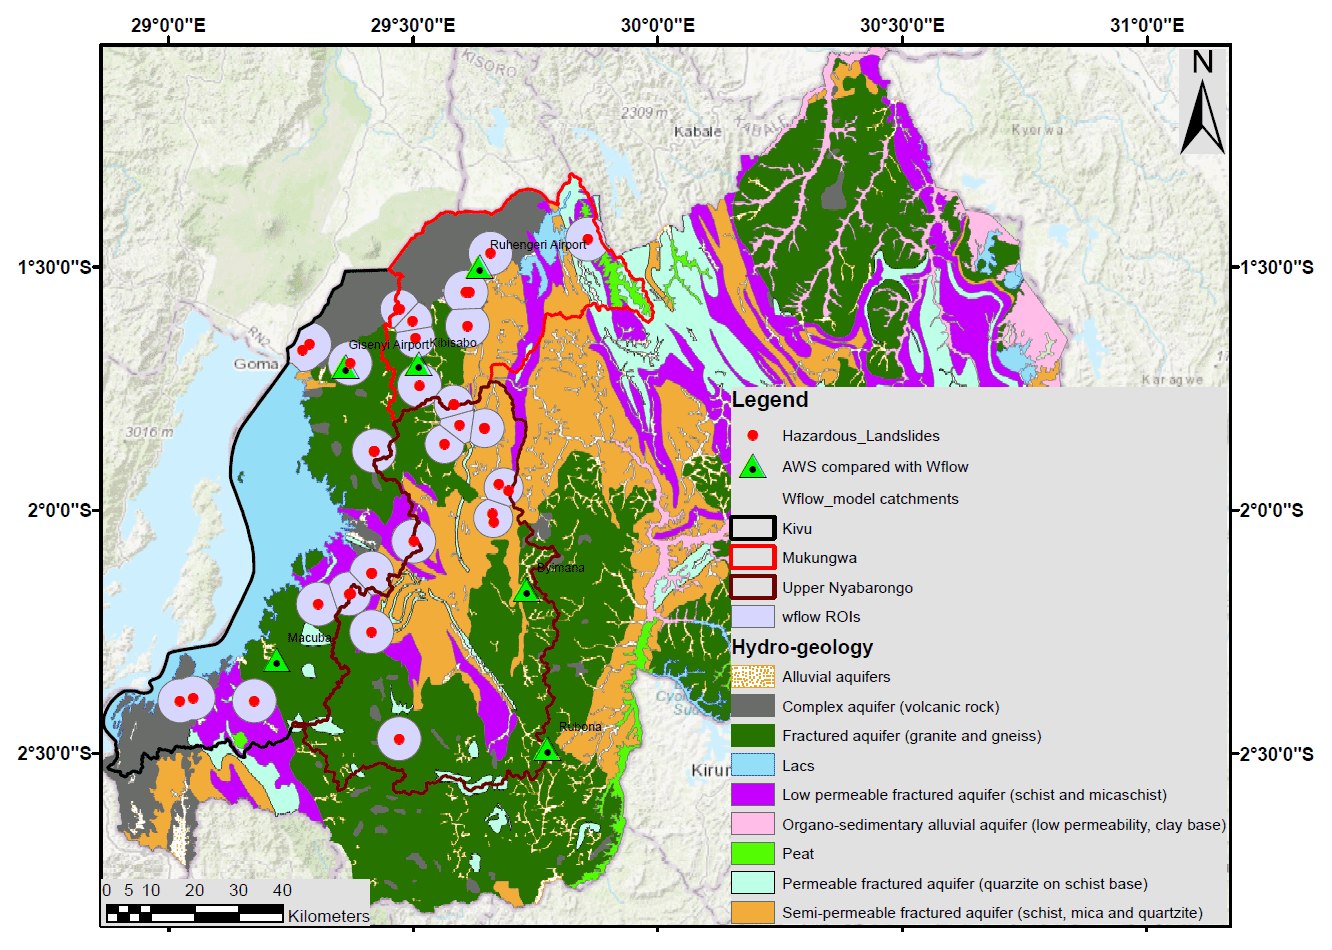
Figure 3Wflow model catchments (Kivu, upper Nyabarongo and Mukungwa) and hydrogeology, landslides in red dots and 5 km buffers indicating the ROIs for areal soil moisture acquisition from the Wflow model, and AWSs with soil moisture sensors for comparative performance evaluation of the Wflow-modelled soil moisture.
3.1 Landslide inventory
The inventory for this study contains landslides recorded from 2007 to 2019. It was accessed from a previous study in Rwanda (Uwihirwe et al., 2022) and was further extended and updated through compilation of additional rainfall-induced landslides as reported from local newspapers, blogs and government technical reports. This landslide inventory was compiled with respect to the methodology adopted by Kirschbaum et al. (2010, 2015) and Monsieurs et al. (2018b). Between 2007 and 2019, the inventory includes 55 accurately dated landslides, 32 of which are located in the catchments modelled for this study (Kivu, upper Nyabarongo and Mukungwa) (Fig. 3). However, it is important to note that this inventory is likely to miss the non-hazardous landslides, which are less reported upon than hazardous landslides that led to fatalities/injuries and considerable damages. The inventory provides the location of each recorded landslide but with a varying spatial accuracy of 5 to 25 km depending on the smallest administrative unit recorded by the landslide event reporters. Therefore, a buffer zone of 5 km, equivalent to the frequently recorded accuracy, was used around each landslide (Fig. 1) to support the choice of the landslide representative rain gauge. The same areal buffer was used as a footprint to avail the areal satellite precipitation and soil moisture as detailed in Sect. 3.2 and 3.3.
3.2 Precipitation products and performance evaluation
3.2.1 Gauge-based precipitation and selection of landslide representative data
We accessed daily precipitation data from 19 rain gauges operated by the Rwanda Meteorology Agency. These rain gauges were selected based on their location within the defined buffer of 5 km around each landslide location (Fig. 1). Once two or more rain gauges fall within the same buffer zone, the gauges are weighted (Melillo et al., 2018) to select the most representative rain gauge following Eq. (1):
The weight (W) is estimated based on the cumulated event rainfall E (mm) until the landslide day, the distance between rain gauge and landslide d (mm), and duration D (days). A similar procedure was used to select the representative rain gauge for landslides located far (>5 km) from any rain gauge. The selected gauge-based precipitation was used as a benchmark to assess the suitability of satellite precipitation products.
3.2.2 Satellite precipitation products and suitability analysis for LEWSs in Rwanda
With the gauge-based precipitation data as a reference, we assessed the performance of seven satellite precipitation products summarised in Table 1. These satellite precipitation products were preliminarily selected for analysis based on the criteria that their dataset (i) at least partially overlap with the landslide inventory period (2007–2019), (ii) have at least daily temporal resolution, and (iii) be available on the Google Earth Engine (GEE).
Table 1Pre-selected precipitation products and short descriptions.
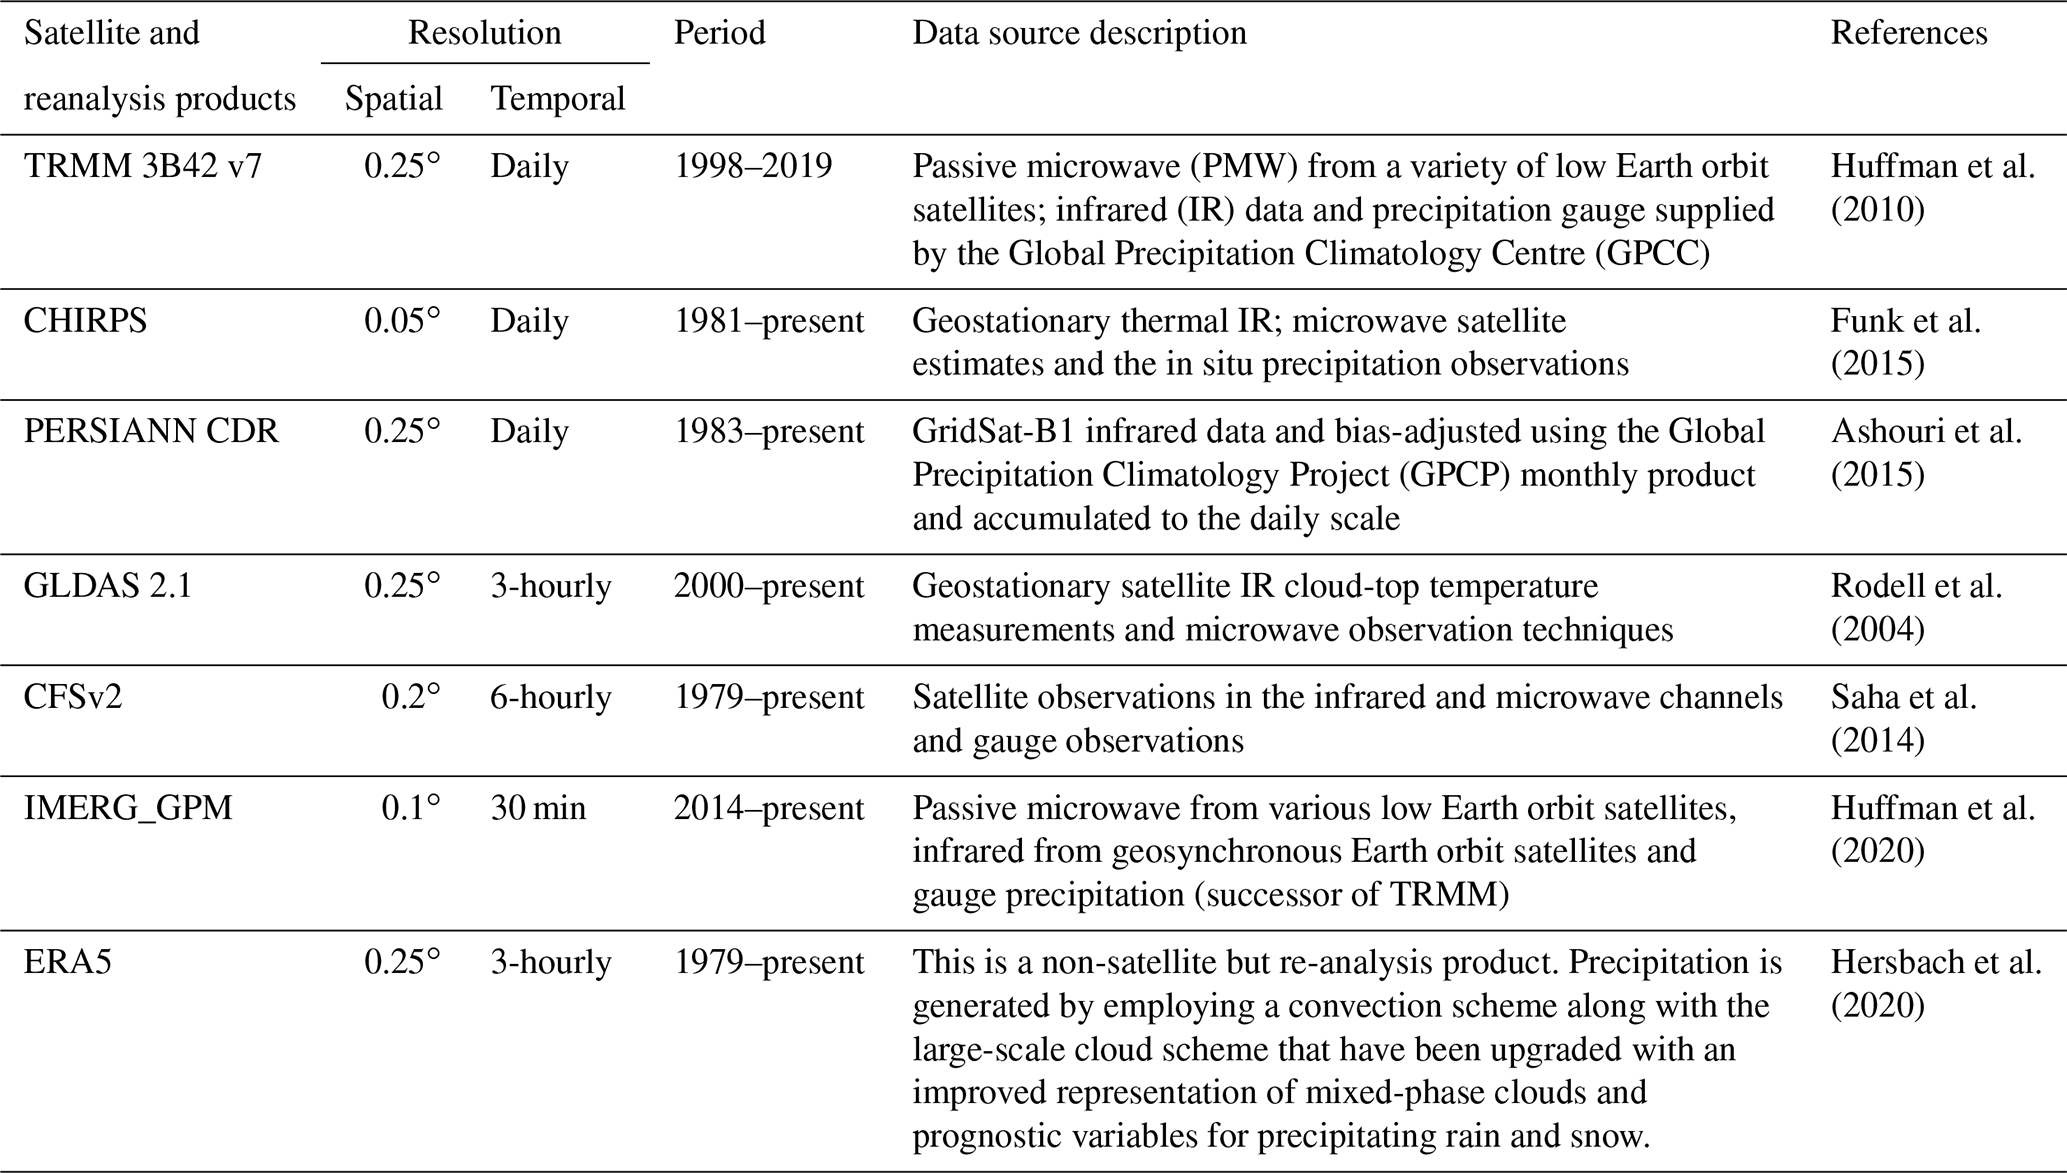
Among the pre-selected satellite products, we have chosen the most suitable product for landslide hazard assessment in Rwanda based on the relative comparison with gauge-based precipitation. This was achieved using a number of statistical approaches that include (i) the use of statistical metrics of goodness of fit, (ii) rainfall frequency indicators, and (iii) intensity comparisons. The statistical metrics of goodness of fit include the root mean square error (RMSE), Pearson correlation (CC), and long-term relative bias (RB) computed with Eqs. (2) to (4):
where Yi is the rain gauge observation at date i, Xi is the satellite estimate at the same date i, n is the total number of data pairs for each precipitation product considered, and Ymean and Xmean are the mean rainfall from rain gauge and satellite products respectively.
The rainfall frequency indicators specify the frequency of rainy days based on the predefined threshold indices (Joshi et al., 2014; Tank et al., 2009). We used five rainfall threshold indices that reflect the number of rainy days with >X mm of rain (). The predefined indices are , , , and , indicating the number of rainy days with >0 mm as rainy days, >10 mm as heavy rainy days, >20 mm as very heavy rainy days, >30 mm as even heavier rainy days and >50 mm as extremely heavy rainy days respectively. With intensity comparison, we compared the cumulative 30 d rainfall from the satellite precipitation products to the cumulative 30 d precipitation from rain gauges using scatter plots.
3.3 Soil moisture products and data acquisition
3.3.1 In situ soil moisture data from automatic weather stations
In situ soil moisture data, collected from the automatic weather stations (AWSs) equipped with soil moisture sensors, were accessed from the Rwanda Meteorological Agency for six AWSs as shown in Fig. 2. The AWSs recorded the soil moisture at 20 cm depth with a temporal resolution of 5–10 min from July 2018 to December 2019. Because the analysis focuses on a daily timescale, we computed and used the daily average soil moisture time series recorded from July 2018 to December 2019. The in situ AWS soil moisture data were used as a benchmark to comparatively get an insight into the quality of other sources of soil moisture products that include satellite- and model-derived soil moisture estimates described in Sect. 3.3.2 and 3.3.3.
3.3.2 Satellite soil moisture and variable of interest
We used a satellite-derived near-surface soil moisture product provided by Planet, formerly VanderSat (VdS) (https://vandersat.com/data/soil-moisture/, last access: 29 March 2022). The product relies on the Land Parameter Retrieval Model (LPRM) (de Jeu et al., 2014; Owe et al., 2001, 2008) to estimate the near-surface soil moisture by combining raw data from the Advanced Microwave Scanning Radiometer 2 (AMSR-2) and Soil Moisture Active Passive (SMAP) (Bouaziz et al., 2020). The satellite product estimates volumetric soil water content or soil moisture (m3 m−3) of the upper 5 cm of soil downscaled from a spatial resolution of 25 km × 25 km to 100 m × 100 m. From VdS, we accessed daily soil water content estimates from the top 5 cm of soil (θtop) for the 2007–2019 period for each of the defined regions of interest (ROIs) equivalent to the 5 km buffers shown in Fig. 3.
3.3.3 Hydrological model-derived soil moisture and variables of interest
We also used the soil moisture derived from Wflow, open-source software developed by the Deltares OpenStreams project (Schellekens, 2021; Schellekens et al., 2019). The Wflow-distributed hydrological model platform currently contains 13 models (Schellekens, 2021) that include the wflow_sbm model. The models consist of a set of python programs that are run on the PCRaster python framework to perform hydrological simulations (Karssenberg, 2014; Karssenberg et al., 2010). The Wflow_sbm uses the conceptual bucket model approach to derive the hydrological variables of interest (Imhoff et al., 2020; Schellekens et al., 2019). With Wflow_sbm, the soil is considered a bucket with a depth (Z) divided into two zones: the unsaturated store U and the saturated store S. The interface between U and S is a pseudo water table located at depth Zw. The values of unsaturated storage U and saturated storage S are computed as in Eqs. (5) and (6):
where θs (–) and θr (–) are saturated and residual water content respectively and Ud (–) is the soil water deficit.
The unsaturated store U was the variable of interest and was subdivided into two variables: the water content in the root zone θroot representing the unsaturated soil water storage of the top 50 cm and the part of the soil water capacity occupied θuz representing the unsaturated soil water storage of the upper 2 m. For this study, the model area consisted of three catchments (Kivu, upper Nyabarongo and Mukungwa) as highlighted in Fig. 3. As with all other hydrological models, the Wflow_sbm model calibration is needed for optimal performance. The model is calibrated based on the model parameters that are estimated a priori using pedotransfer functions and global or local datasets. The model was run from January 2001 till December 2020, with the first years corresponding to the model spin-up time. We obtained time series of θroot and θuz for 2007–2019, overlapping with the landslide inventory period, from a wflow_sbm simulation based on ERA5 re-analysis meteorological data. To increase the comparability with the satellite-based soil moisture, the same ROIs represented by the buffers of 5 km around each landslide location were used to interpolate the unsaturated water storage time series for each ROI located in the model catchment. Similarly, only the AWSs located in the model catchment (Fig. 3) were used for the comparative performance evaluation of the model-derived soil moisture products.
3.4 Landslide hazard assessment and threshold definition
3.4.1 Landslide meteorological and hydrological conditions and test variables
The daily rainfall data from the satellite product were used to define the landslide meteorological triggering conditions. We used two categories of landslide-triggering conditions. The first category defined a landslide trigger as the maximum probable rainfall event (MPRE), during which or after its end one or more landslides occurred. The MPREs were defined as individual periods of rainy days interrupted by dry periods of at least 2 d. Given the constraint of overestimation of the number of rainy days with 0–10 mm by satellites, a rainy day was objectively referred to as a day with ≥10 mm d−1, while a dry day was referred to as a day with <10 mm d−1. This threshold was objectively selected using the rainfall frequency indicator metric explained in Sect. 3.2.2. The landslide predictor variables in this category were therefore the cumulated event rainfall E (mm), event duration D (days) and rainfall mean intensity (mm d−1). The cumulated event rainfall E (mm) was computed as the cumulative rainfall during each MPRE of duration D (days). The event duration D equivalent to MPRE is the individual periods of days with recorded rain separated by an inter-event time (IET) of at least 2 dry days. The rainfall mean intensity is the ratio of event rainfall volume E and event duration D. The second category defined a landslide trigger as the recent cumulative rainfall , at the end of which one or more landslides occurred. This category considers the total cumulative rainfall over the last 3 d (), 2 d () and 1 d (), at the end of which one or more landslides occurred. While MPRE time series are interrupted by the IETs, the , and for each day during the 2007–2019 study period were computed regardless of a rainy or dry day, thus resulting in longer time series and more data points compared to the MPRE time series. The time series of the defined meteorological triggering conditions from each category and for all precipitation footprints were compiled in a single dataset for further statistical analysis. To provide a normalised comparison of the soil wetness, we transformed the satellite- and model-derived water content θ to effective soil moisture Se to define the landslide-predisposing hydrological conditions using Eq. (7):
where Se stands for the effective soil moisture (–), θ is the actual soil moisture and θmax and θmin are the maximum and minimum values of the recorded or modelled soil water content.
The normalisation of soil water content θ was made for easy comparison of the observed, model-derived and satellite-based soil moisture products. However, for all compared soil moisture products, the θmax and θmin were 1 and 0 respectively, which led to almost similar values of Se and θ.
The tested hydrological conditions therefore include the near-surface soil moisture Setop, representing the soil moisture of the upper 5 cm of soil, provided by the satellite techniques (VdS), the Seroot representing the root zone soil moisture of the upper 50 cm, acquired through a modelling approach (Wflow_sbm), and Seuz representing the soil moisture estimates from the upper 2 m of soil, obtained through a modelling approach (Wflow_sbm). To assess the contribution of the pre-wetting state of the soil prior to the landslide-triggering conditions, we have considered the antecedent soil moisture, i.e. recorded or modelled prior to the start of the triggering meteorological conditions. The antecedent soil moisture referred to the time interval before the start of each of the defined categories of the meteorological triggering conditions. We have therefore used the Setop(t−x), Seroot(t−x) and Seuz(t−x) with t (date) and x (days) expressing the end time and the duration of the triggering conditions respectively. However, due to the changes in the durations of the MPREs, x was hypothetically represented by a value of 1 standing for one entire MPRE, while values of 1, 2 and 3 represent the duration (days) of the triggering conditions. A binary classification of the defined hydrological and meteorological conditions was undertaken to classify the landslide and no-landslide conditions. The meteorological or hydrological conditions are referred to as landslide conditions, i.e. a positive class when at least one landslide occurs during its course or after its end, while they are referred to as no-landslide conditions, i.e. a negative class, when no landslides occurred during its course or after its end.
3.4.2 Discriminatory power of the landslide test variables and optimum thresholds for landslide initiation
The landslide test variables which include the predisposing hydrological conditions Setop(t−1), Setop(t−2), Setop(t−3), Seroot(t−1), Seroot(t−2), Seroot(t−3), Seuz(t−1), Seuz(t−2) and Seuz(t−3) as well as the triggering meteorological conditions E, D, , , and were tested for their relevance to landslide occurrence. We used receiver operating characteristic (ROC) and area under the curve (AUC) metrics to evaluate the discriminatory power of each of the landslide test variables. The ROC curve is defined as a graphical plot indicating the performance of the test variable at all threshold levels by providing the trade-off between the true positive rate (TPR) and false positive rate (FPR) at each level. The AUC is a statistical metric that indicates the discriminatory power of the test variable, i.e. the capacity of the test variable to correctly distinguish positive from negative classes, i.e. landslide from no-landslide conditions. It also compares the test variable to a random guess (AUC = 0.5) and thereby indicates the statistical significance where the perfect test variable would have an AUC equal to unity. The rates of correctly (TPR) and incorrectly predicted (FPR) landslides corresponding to each cut-off on the ROC curves are computed using Eqs. (8) and (9):
The rate of unpredicted landslides (FNRs, false negative rates) and the rate of correct predictions of no landslides (TNRs, true negative rates) are computed using Eqs. (10) and (11):
where TPs are true positives or true alarms, i.e. outcomes with correctly predicted landslides, FNs are false negatives or missed alarms, i.e. the number of landslides that occurred in reality but were not predicted, FPs are false positives or false alarms, i.e. predictions of landslide occurrence, while in reality there was no landslide reported, and TNs are true negatives, i.e. correct predictions of no-landslide occurrence.
Since the ROC curve only indicates all possible thresholds and their relative balance between TPRs and FPRs, one is free to choose the optimum threshold depending on whether to maximise the TPR or minimise the FPR. However, according to Postance and Hillier (2017), the optimum threshold is the one that maximises the TPR while minimising the FPR. Therefore, that optimum threshold levels above which landslides are highly likely to occur have been defined using two statistical metrics, i.e. the maximum true skill statistic (TSS) and the minimum radial distance (Rad). The TSS is expressed as a balance between the TPR and FPR as indicated in Eq. (12):
where the maximum value of TSS indicates the optimum threshold that maximises the TPR while minimising the FPR. For a perfect threshold, the TSS reaches a unity indicating a zero FPR. The Rad shows the relative distance from the defined threshold level on the curve to the perfect model or point whose TPR is a unit and zero FPR and is computed with Eq. (13):
3.4.3 Landslide hydro-meteorological thresholds and warning capabilities
The optimum thresholds defined based on the maximum TSS and/or minimum Rad were plotted in a 1D threshold space, here referred to as the single-variable threshold line, beyond which the probability of landslides is high. We also followed the cause–trigger concept (Bogaard and Greco, 2018) that reflects the hydro-meteorological thresholds and hypothetically plotted the optimum thresholds of the landslide-predisposing hydrological variables, i.e. the antecedent soil moisture on the x axis and the meteorological triggering variables on the y axis of a 2D space, here referred to as bilinear thresholds. The bilinear threshold models made of hydrological and meteorological variables are plotted in x, y pairs, i.e. antecedent soil moisture versus or . Furthermore, the bilinear threshold from a traditional landslide prediction model event–duration E−D (Peruccacci et al., 2017), which exclusively relies on precipitation, has also been defined to serve as a benchmark for comparative performance evaluation.
4.1 Performance of satellite precipitation products
The suitability of satellite precipitation products in the study region was assessed using three statistical indicators as summarised in Table 2 and Table 3 and illustrated in Fig. 4. From the statistical measures of fits (RMSE, CC, RB), it is generally observed that IMERG is consistently more suitable, while ERA5 was found to be the least suitable product as compared to other satellite precipitation products. The evaluation based on frequency indicators is summarised in Table 3. These indicators give an overview of whether a given satellite product would overestimate or underestimate the observed gauge precipitation based on the predefined threshold indices. The Integrated Multi-Satellite Retrievals for Global Precipitation Measurement (GPM_IMERG) displays the highest skill in estimating all ranges of rainfall from heavy to extremely heavy rainy days as recorded by the on-site gauges. CHIRPS and TRMM 3B42 v7 provide good estimates of precipitation, with a quite similar number of rainy days ( d) to gauge-based rainfall ( d). However, these satellites drastically underestimate the number of heavy to extremely heavy rainfall (, and ). For example, TRMM and CHIRPS estimated and 101 d respectively out of 132 d estimated by rain gauges (Table 3).
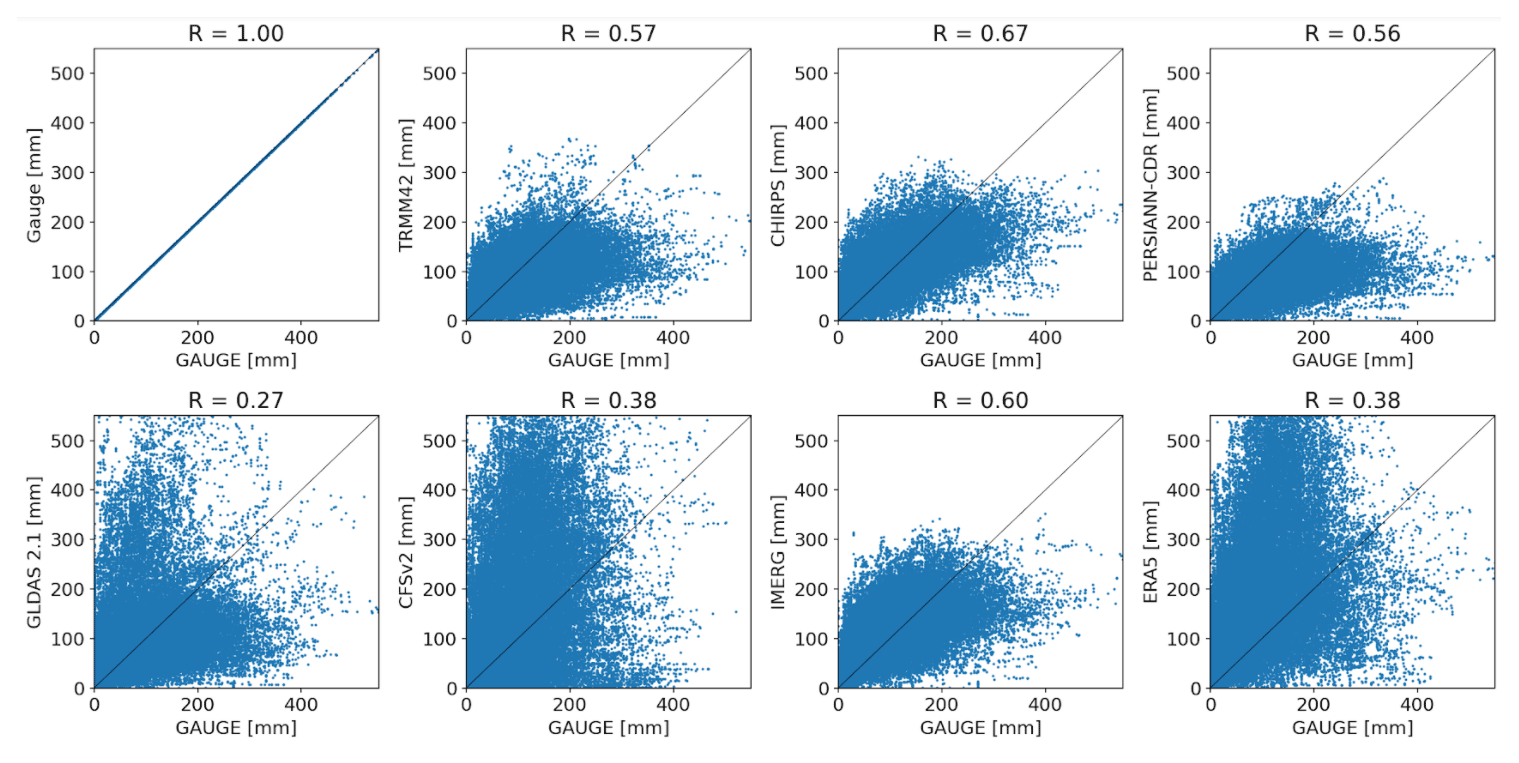
Figure 4Intensity comparison between satellite-based and gauge-based precipitation based on the cumulative 30 d rainfall.
Table 2Performance of satellite precipitation products based on statistical metrics.
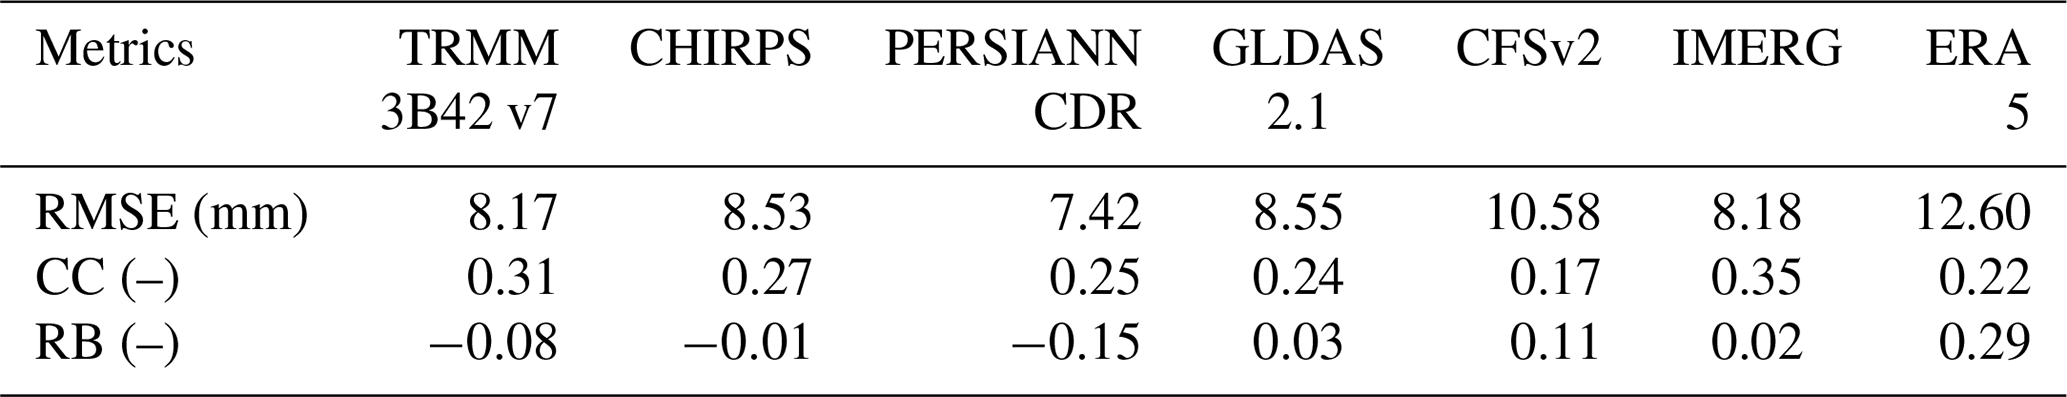
Table 3Performance of satellite precipitation products based on rainfall frequency indicators.
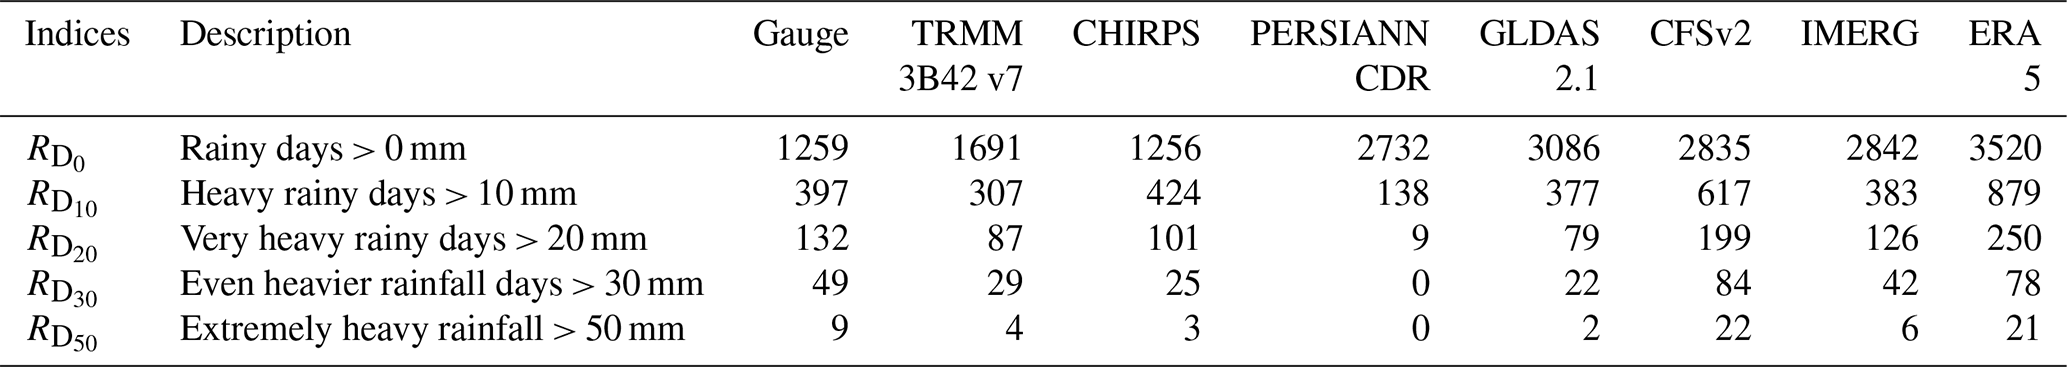
Table 4Event-based variable thresholds and prediction capabilities.
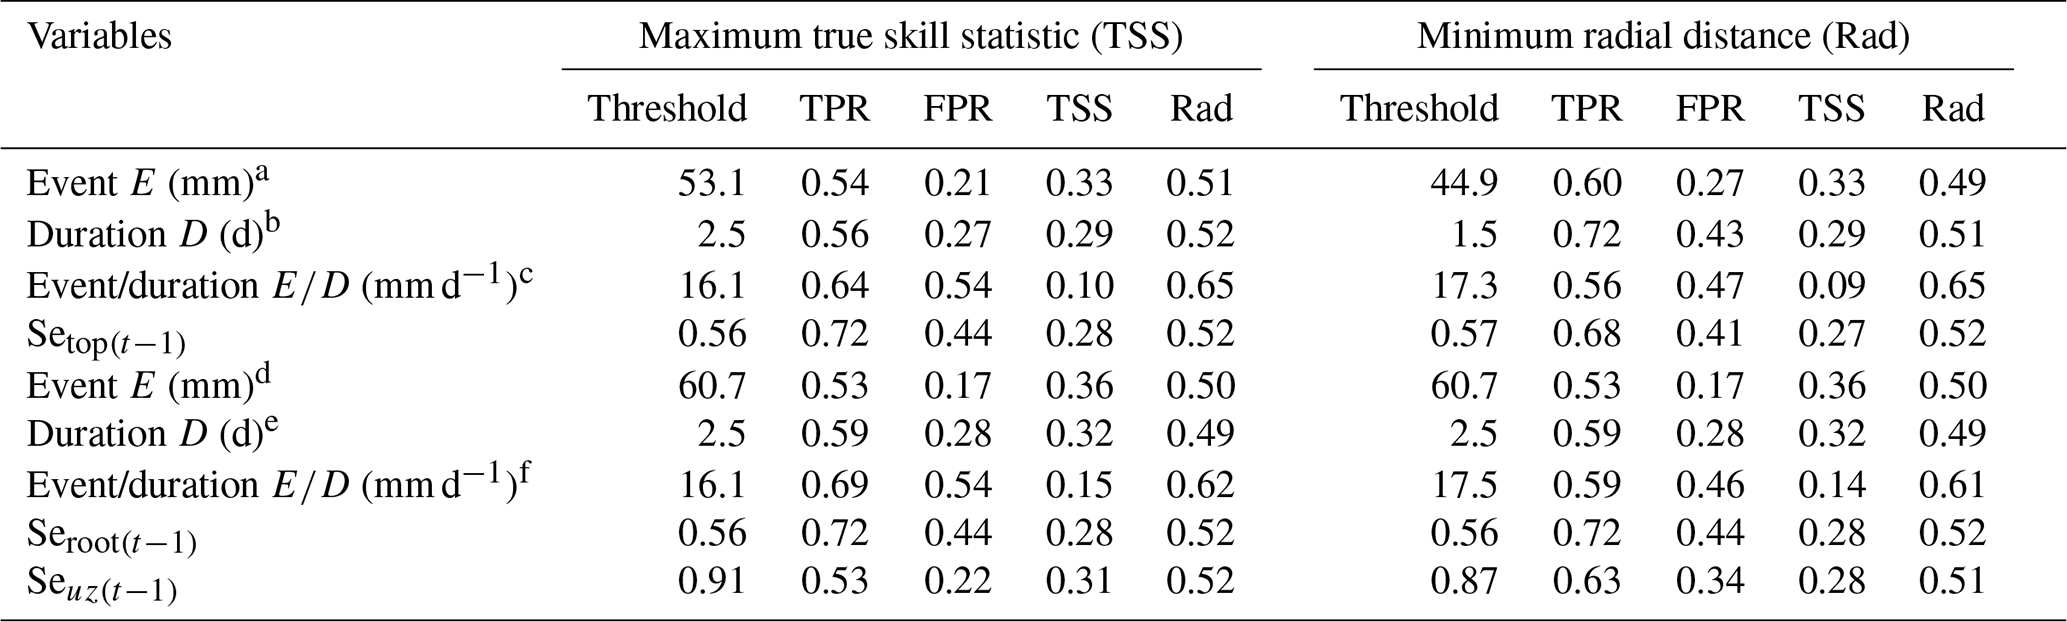
Cumulated event rainfall, event duration and mean rainfall intensity defined from all landslide representative precipitation footprints. Cumulated event rainfall, event duration and the mean event intensity defined using precipitation footprints located in the modelled catchments (Kivu, upper Nyabarongo and Mukungwa).
The suitability of satellite products was also assessed using an intensity comparison indicated by the density of the scatter points around the 1:1 line as shown in Fig. 4. The scatter plots compare 30 d cumulative rainfall from satellite precipitation products versus rain gauges. The scatter plots reveal that GLDAS, CFSv2 and ERA5 tend to overestimate rainfall, while underestimations are noticed from PERSIANN CDR as compared to the in situ gauge rainfall. Based on the closeness of the scatter points to the 1:1 line, CHIRPS and IMERG exhibit a higher resemblance to gauge data (Pearson correlation R=0.67 and 0.60 respectively) than other satellite products and could thus be used as alternatives to gauge-based precipitation. Overall, IMERG shows rainfall patterns that are most consistent with available gauge observations in Rwanda despite the overestimation of the number of rainy days with less than 10 mm (). According to Kimani et al. (2017), the overestimation of rainfall in areas with elevation > 2500 m and underestimation in areas with elevation < 2500 m were observed before and are attributed to satellite-inherent challenges to retrieve orographic rainfall. To overcome this constraint, 10 mm d−1 has been considered a threshold to define a satellite-based rainy day and thus is relevant for landslide hazard assessment in Rwandan conditions. Other researchers in the region also found CHIRPS and TRMM to be comparable to gauge-based precipitation in eastern Africa (Kimani et al., 2017; Monsieurs et al., 2018a). Monsieurs et al. (2018a) found the areal-averaged TMPA rainfall estimates, the predecessor of IMERG, to be more suitable for assessing landslide hazard thresholds than the sparsely distributed gauge data with limited representativeness in the context of high rainfall variability of the East African Rift.
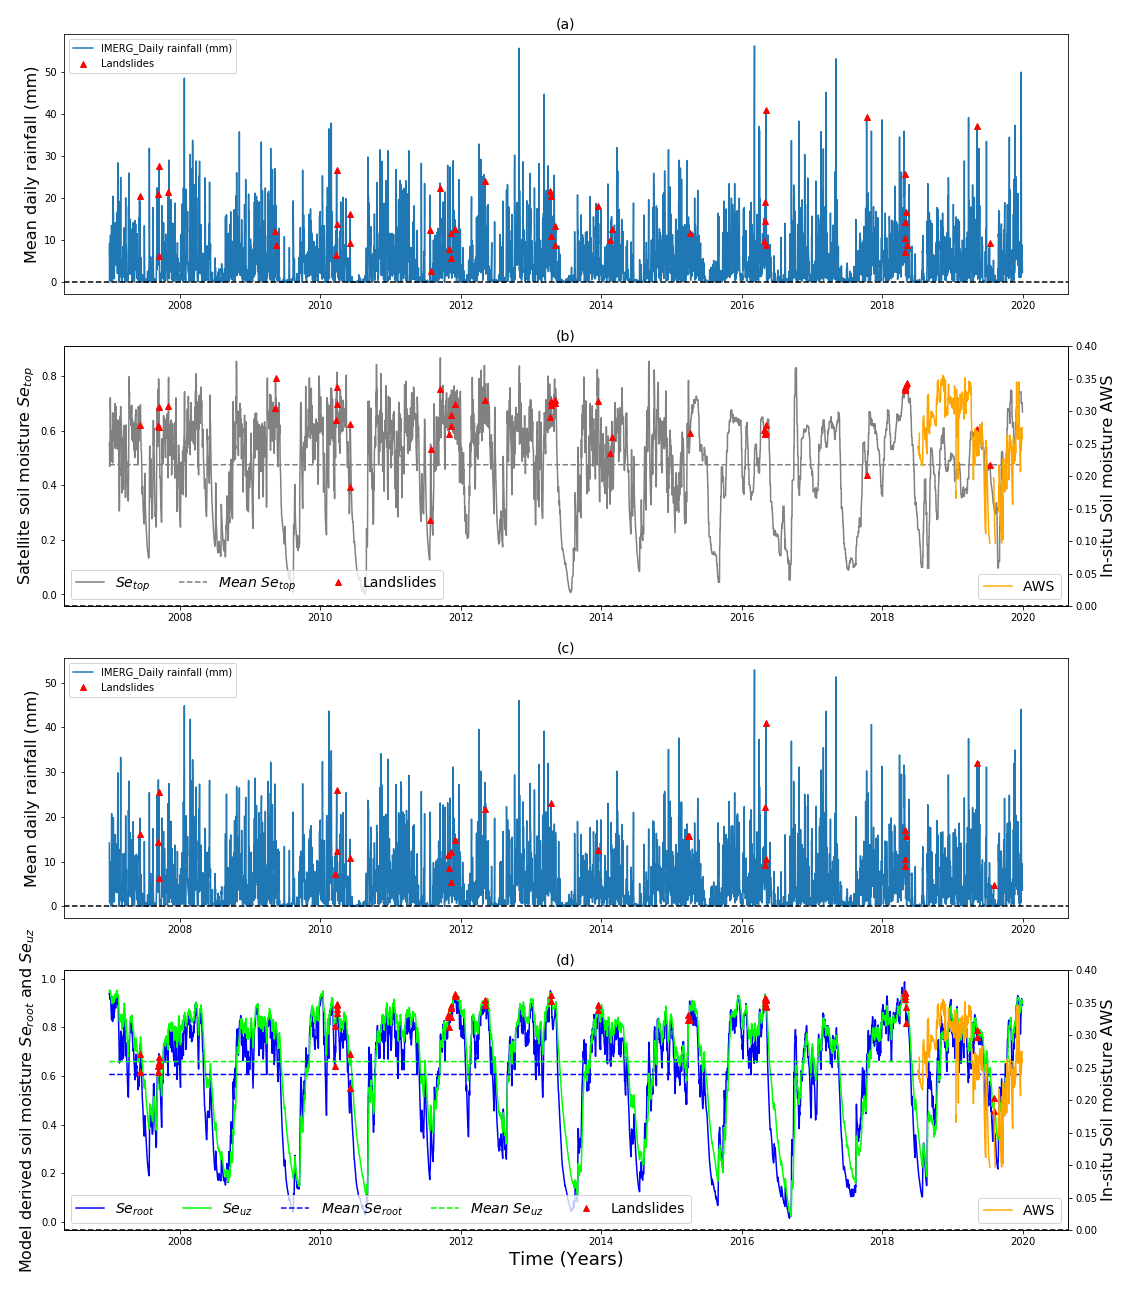
Figure 5Satellite- and model-derived information and landslide activities: (a) GPM-based IMERG precipitation (mm) spatially averaged over all landslide precipitation footprints; (b) satellite-derived soil moisture Setop (–) spatially averaged over all landslide ROIs and in situ soil moisture AWSs (–) on the secondary y axis; (c) GPM-based IMERG precipitation (mm) spatially averaged over the landslide precipitation footprints located in the modelled catchments; (d) modelled soil moisture at the root zone top 50 cm Seroot (–), modelled soil moisture top 2 m Seuz (–) and in situ soil moisture AWS (–) on the secondary y axis. The dashed horizontal lines represent the long-term mean soil moisture and the red triangles stand for the landslide events.
4.2 Prospective of satellite- and model-derived information in landslide hazard assessment
4.2.1 Mean soil moisture response to rainfall and landslide events
Figure 5 shows the GPM-based IMERG precipitation spatially averaged over all landslide precipitation footprints and over the modelled catchments. It also shows the temporal dynamic of the satellite-derived soil moisture Setop spatially averaged over all landslide ROIs and the modelled soil moisture at the root zone top 50 cm Seroot and top 2 m Seuz. The in situ soil moisture from AWSs is also rescaled (on the secondary axis) to be compared with modelled and satellite-derived soil moisture. Regardless of the difference in measuring depth (5 cm, 50 cm and 2 m), the time response to precipitation and overestimation of soil moisture, the satellite Setop and model-derived soil moisture time series Seroot and Seuz broadly reproduce the most important temporal variation as recorded by in situ soil moisture sensors (Figs. 5 and A1). This indicates their usefulness for landslide hazard assessment as an alternative to the sparse in situ AWSs. The spatial averaging of soil moisture across all ROIs was undertaken to have an insight into the critical ranges of soil moisture that induce landslides in Rwandan climate conditions. The spatially averaged Setop, Seroot and Seuz soil moisture dynamics and the linked landslide occurrence are presented in Fig. 5. The average Setop, Seroot and Seuz of all ROIs indicate general similarities in terms of landslide predisposition but also reveal systematic differences between response times influenced by the soil moisture recording depth. For example, it is obvious that the Setop (5 cm) responds faster than Seroot (50 cm) and Seuz (2 m). It is clear that the majority of landslides occur when the soil moisture levels positively deviate (by about 0.1) from the long-term mean up to a critical level for landslide initiation. It is also evident that the critical level for landslide occurrence is more or less fixed when other geological and geomorphological condition are kept constant, and it is reached more or less easily depending on the prior rainfall expressed in terms of antecedent soil moisture and the time lag between the landslide-triggering rainfall and the soil hydrological response.
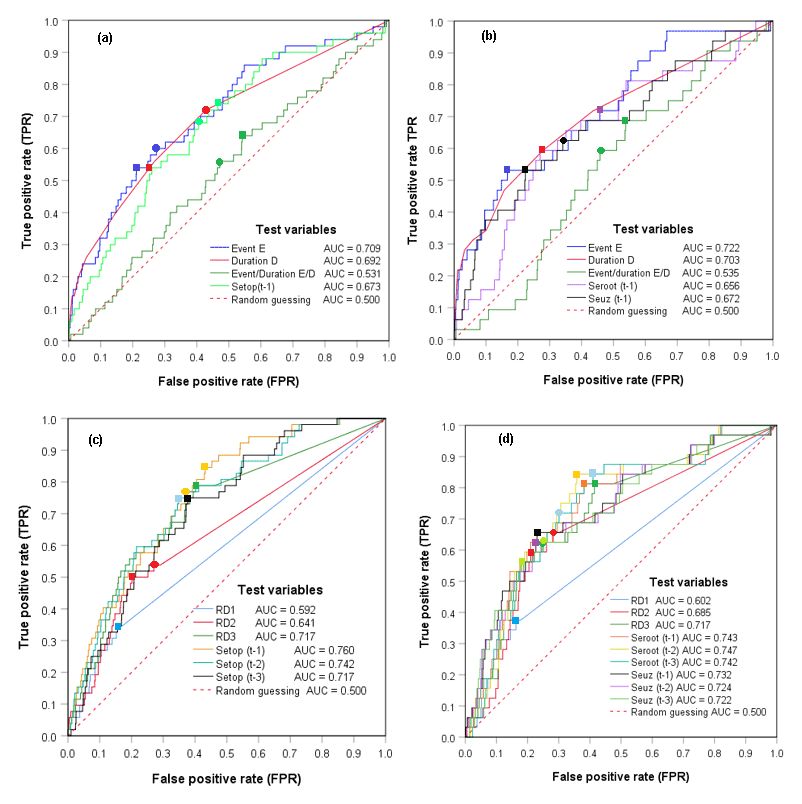
Figure 6Receiver operating characteristic (ROC) curves, area under the curves (AUC) and optimum landslide thresholds defined by the true skill statistic TSS (square-shaped marker) and radial distance Rad (cycle-shaped marker) using (a) event rainfall and Setop from all ROIs, (b) event rainfall, Seroot and Seuz from ROIs located in the Wflow model catchment, (c) cumulative 1, 2 and 3 d rainfall () and Setop from all ROIs and (d) cumulative 1, 2 and 3 d rainfall (), Seroot and Seuz from ROIs located in the Wflow model catchment.
4.2.2 Single-variable landslide meteorological and hydrological thresholds and prediction capabilities
Figure 6 and Table 4 show the derived landslide meteorological and hydrological thresholds and their predictive capabilities in terms of TPR and FPR. The discriminatory power of each of the tested variables was evaluated with a ROC curve and the AUC statistical metrics as shown in Fig. 6. Among the tested landslide-triggering meteorological variables E, D, , , and , the cumulative 3 d rainfall and event rainfall volume E showed the highest discriminatory power, with AUC ∼ 0.71, and hence the highest impact on landslide initiation. However, the event rainfall mean intensity indicated a low ability (AUC ∼ 0.53) to distinguish landslides from no landslides. This stresses the importance of using the recent cumulative rainfall with a fixed duration, thus highlighting the highest impact of on the landslide initiation process and its relevance for landslide hazard assessment and prediction compared to E that needs to be normalised. In contrast to the gauge-based cumulative rainfall thresholds (Uwihirwe et al., 2020), the satellite-based cumulative rainfall on the day of landslide was not impactful on landslide initiation (AUC = 0.35–0.38). This may be due to the inaccuracies between the landslide occurrence and the reporting time and additionally also due to the satellite revisiting time and/or period, which may introduce inaccuracies in timing.
Figure 6c and d indicate that the wetness state of soil prior to the cumulative rainfall have the most significant impact on landslide occurrence as indicated by their AUC = 0.72–0.76. Contrarily, Fig. 6a and b show that the wetness state of the soil prior to the landslide-triggering event E has no significant impact on landslide occurrence (AUC = 0.66–0.67). This is to say that the antecedent soil moisture conditions prior to the longer triggering rainfall event E are not relevant for landslide initiation in the study area conditions. Among other factors, the duration of the triggering condition plays a major role in determining the relevance of the antecedent soil moisture for landslide occurrence. The shorter the duration of the triggering conditions, the higher the relevance of the antecedent soil moisture for landslide initiation. Highly permeable soils are less sensitive to antecedent soil moisture conditions because of the high gravity-driven drainage and/or deep percolation. With a tropical climate, evaporation process may also rapidly take away the antecedent soil moisture content of the topsoil due to the longer timescale of the minimum IET and the landslide-triggering event E.

Figure 7Landslide hydro-meteorological thresholds and prediction capabilities: (a) event intensity antecedent 5 cm topsoil moisture thresholds (Se and mm d−1), (b) E−D thresholds (D>2.5 d and E>44.9 mm) defined using precipitation footprints from all landslide locations; (c) event intensity antecedent 50 cm topsoil moisture threshold (Se and mm); (d) event intensity antecedent 2 m topsoil moisture threshold (Se and mm d−1); (e) E−D thresholds (E>60.7 mm and D>2.5 d) defined using precipitation footprints and landslides located in Wflow-modelled catchments; (f) bilinear threshold values and prediction capabilities.
The threshold definition metrics, TSS and Rad, resulted in quite comparable landslide thresholds as summarised in Table 4. It was noticed that the defined satellite precipitation thresholds are similar to the ones defined using gauge-based precipitation. For example, the optimum landslide threshold event rainfall volume E defined from satellite precipitation varied between 44.7 and 60.7 mm (Table 4), while gauge-based threshold E varied from 46 to 67 mm (Uwihirwe et al., 2022). Similarly but with a quite minor differences, the defined satellite-based E−D thresholds 16–17.5 mm d−1 seemed quite similar to gauge-based thresholds of ∼7–13 mm d−1 found in Uwihirwe et al. (2020, 2022). Nevertheless, the single-variable threshold , being the most informative, showed quite low prediction capability in terms of TPR ∼ 56 %–60 %, with an elevated rate of false positive FPR ∼ 43 %–54 %, i.e. incorrect predictions of landslide, thus being less effective for a robust early warning system development. In contrast, the single-variable thresholds defined from the cumulative 3 d rainfall outperform other tested triggering conditions with highest prediction capability in terms of true positive rate TPR = 79 %–81 %. The same holds for the soil moisture in the root zone (50 cm deep) Seroot that consistently showed the highest performance. Nevertheless, despite the high true positive rate from these single-variable thresholds, the resulting elevated rate of false positives FPR = 36 %–42 % still constrains their use for the development of a robust landslide early warning system. It has to be noted that the threshold defined from the antecedent soil moisture specifies the critical levels below which the impact of pre-wetting state of the soil is considered unimportant for landslide occurrence. By contrast, once these thresholds are exceeded, the pre-wetting state of the soil has a significant impact on landslide occurrence and has to be considered while defining the landslide hydro-meteorological threshold models.
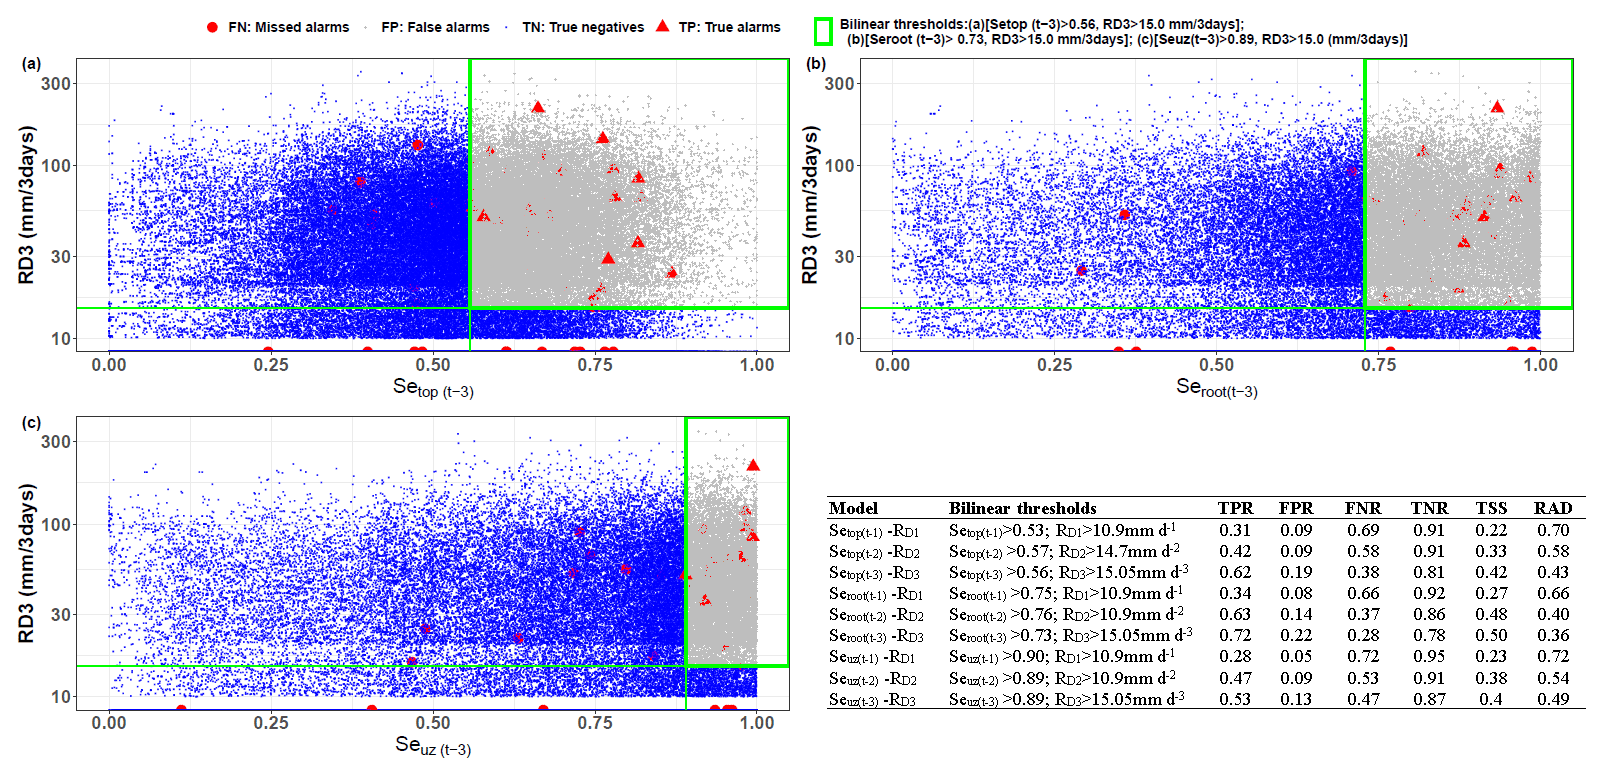
Figure 8Landslide hydro-meteorological thresholds and prediction capabilities: (a) cumulative 3 d rainfall and antecedent 5 cm topsoil moisture thresholds Setop(t−1) (Se and mm d−3) defined using precipitation footprints from all landslide locations; (b) cumulative 3 d rainfall and antecedent soil moisture of the root zone Seroot(t−3) (Se and mm d−3); (c) cumulative 3 d rainfall and antecedent soil moisture of the top 2 m Seuz(t−3) (Se and mm d−3) defined from the Wflow model catchment; (d) bilinear hydro-meteorological threshold values and prediction capabilities.
4.2.3 Landslide hydro-meteorological thresholds and implications for warning
With respect to the high rate of false positives resulting from the single-variable thresholds, we have tested whether the incorporation of antecedent soil moisture information into the rainfall-triggering conditions improves the landslide prediction capability. The optimum single-variable hydrological and meteorological thresholds have therefore been combined into hydro-meteorological thresholds following the cause–trigger concept in a bilinear framework as shown in Figs. 7 and 8. Figure 7 illustrates the first category of landslide hydro-meteorological thresholds defined based on the maximum possible rainfall event E combined with different variables of antecedent soil moisture. The derived thresholds resulted in a quite elevated rate of FPRs once used as single-variable thresholds (single lines).
In contrast to the classical precipitation thresholds, the combination of hydro-meteorological thresholds in a bilinear framework provides an improvement in terms of reduced rate of false alarms by about 30 % (Se), 13 % (Se), and 35 % (Se) respectively as compared to the ones obtained from the exclusive use of single-variable precipitation-based thresholds. The intention of adopting the bilinear hydro-meteorological threshold in spite of precipitation thresholds is to minimise the rate of incorrect prediction of landslides FPR while improving or at least keeping unchanged the TPR. This was only achieved by using the bilinear hydro-meteorological thresholds defined using antecedent soil moisture at the root zone (Se) that performs better (TPR = 66 %) than the traditional precipitation threshold E–D (TPR = 50 %). However, this category still suffers from the low landslide warning capability (maximum TPR = 66 %) and is thus not satisfactory for a robust early warning system development. The lower performance was attributed to the timescale of the triggering events. Apparently, the effect of the antecedent soil moisture lasts for a limited period of time and subsequently decays towards zero and below.
The IET and the timescale of the rainfall events E are not constant and vary in duration. They can be too long, thus implying the decay of the antecedent soil moisture and thus a negligible contribution to landslide initiation. Consequently, the incorporation of the wetness state of the soil prior to the landslide-triggering events E did not lead to a significant improvement in the landslide prediction in Rwandan conditions. We therefore explored other landslide hydro-meteorological thresholds that use the triggering meteorological conditions with short and constant timescales as shown in Fig. 8. These consider the cumulative 1, 2 and 3 d rainfall , , and while extending the timescale of the predisposing conditions up to 1, 2 or 3 d prior to the landslide-triggering conditions. Figure 8 portrays the optimum bilinear hydro-meteorological threshold models defined from this second category. The 3 d cumulative rainfall was the most impactful trigger of landslides, with an optimum threshold of ∼15.05 mm every 3 d as defined by both TSS and Rad, and resulted in 79 %–81 % of TPR (Table 5), much higher than predicted by the first category. Similarly, the antecedent soil moisture threshold Seroot(t−3) was able to predict ∼84 % of landslides. However, this true prediction, i.e true alarms, is also associated with a high rate of false alarms of ∼40 %–42 %. The combination into hydro-meteorological thresholds (Se) decreased the rate of false alarms to ∼22 %, with about 72 % of true alarms (Fig. 8b), thus being more satisfactory than other hydro-meteorological threshold models and much better than the traditional E–D model (TPR ∼ 50 %) that exclusively relies on precipitation.
Table 5Cumulative rainfall-based variable thresholds and prediction capabilities.
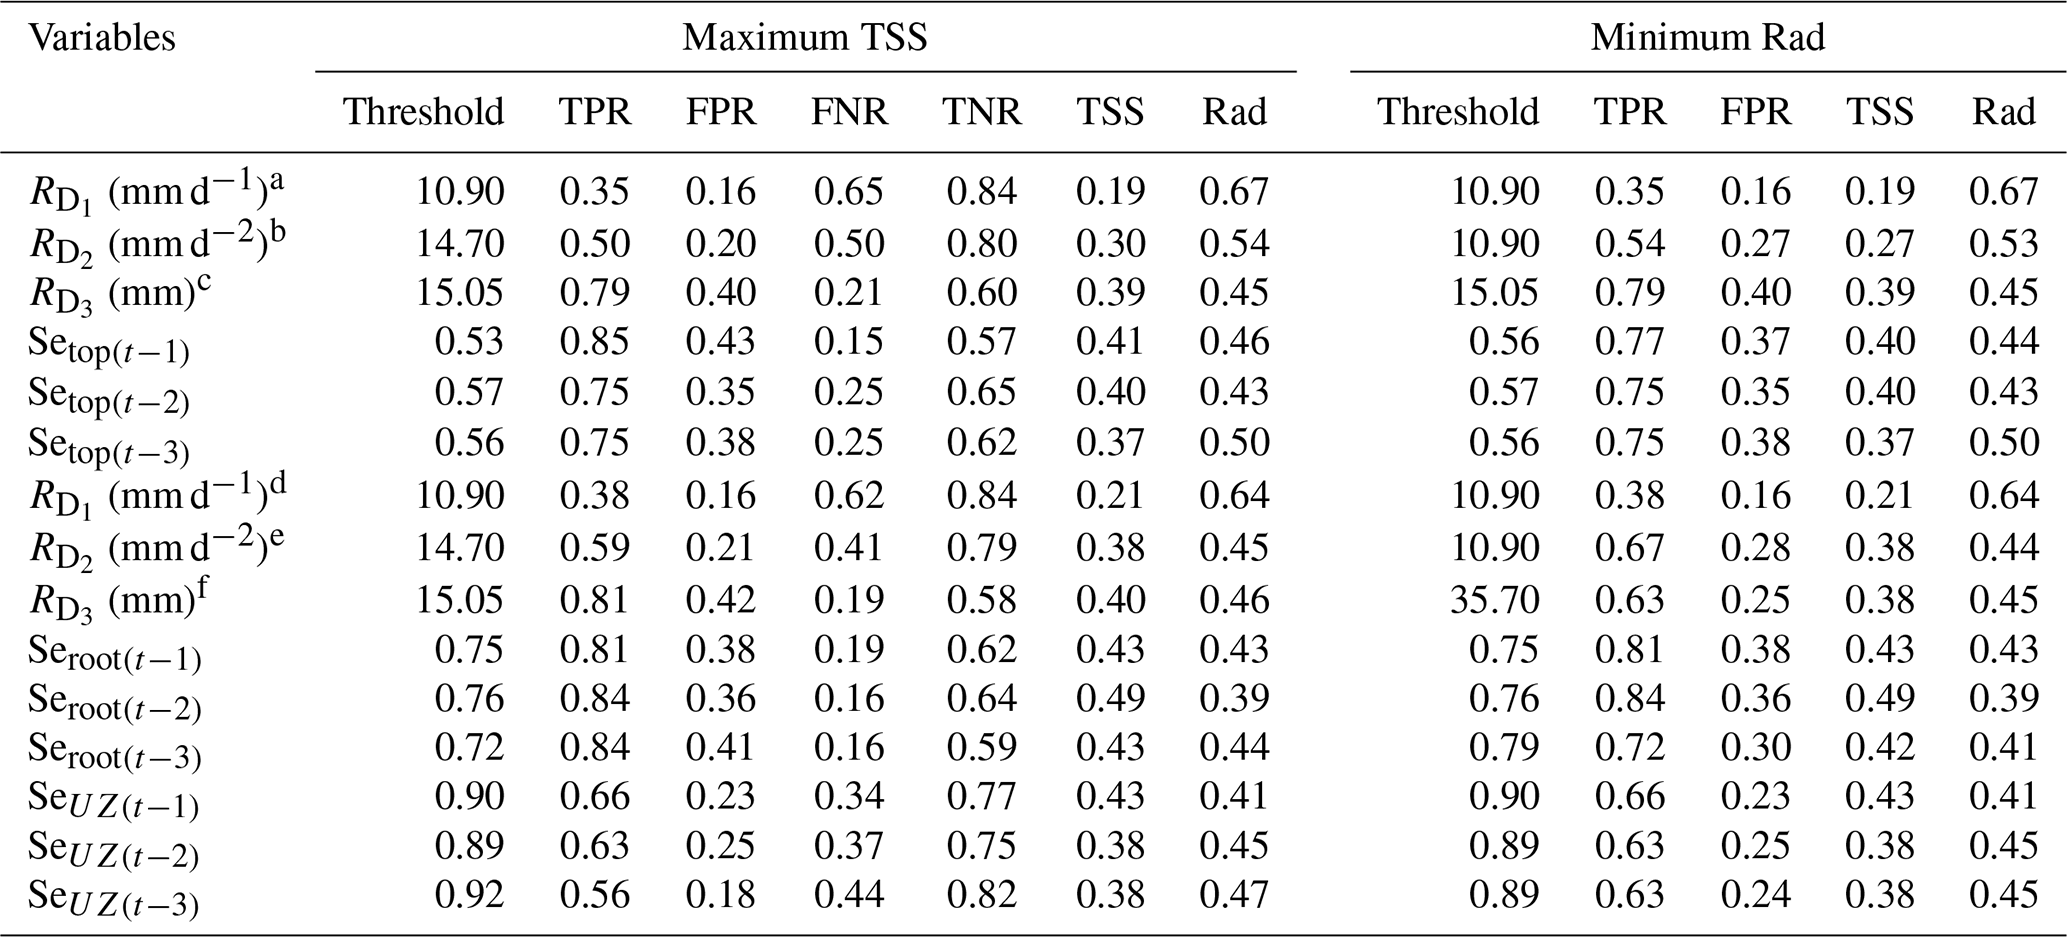
Cumulative 1, 2 and 3 d rainfall defined from all landslide-representative precipitation footprints. Cumulative 1, 2 and 3 d rainfall volume defined using precipitation footprints located in the model catchments (Kivu, upper Nyabarongo and Mukungwa).
4.2.4 Prospective of the satellite-based hydro-meteorological thresholds, advances and limitations
This study reveals the high capability of the NASA GPM-based IMERG product to reproduce rainfall patterns which are consistent with the gauge-based precipitation and thus more suitable for landslide hazard assessment thresholds than sparsely distributed rain gauges in Rwanda. However, this research also points out that the IMERG satellite-based product overestimates the number of rainy days whose daily rainfall is between 0 and 10 mm, and thus the mean annual totals. This may lead not only to differences between satellite- and gauge-based landslide thresholds defined under the same locations, but also to the statistical bias, especially when probabilistic methods are used for landslide threshold definition. To address this constraint and to be able to exploit the usefulness of IMERG precipitation in landslide hazard assessment thresholds, we objectively used 10 mm as a threshold to define a rainy day for IMERG precipitation data. This threshold was defined based on the frequency indicator metric adopted as one of the techniques of bias evaluation between ground and satellite-based rainfall. For gauge-based rainfall, 2 mm is generally considered a threshold to define a rainy day and has been defined based on the mean daily potential evaporation (Marino et al., 2020; Peres et al., 2018).
Although the threshold definition of a rainy day (10 mm) may have led to the omission of some rainfall information, thus shortening the event duration D, this approach improved the similarities between the satellite-based and gauge-based landslide hazard assessment thresholds and is thus used as a bias correction between the two sources of rainfall data. Similarly, other bias correction methods have been adopted by other researchers to ensure for the high accuracy between ground- and satellite-based rainfall data (Bhatti et al., 2016; Vernimmen et al., 2012). However, the defined satellite-based event/duration thresholds 16–17.5 mm d−1 were quite higher than previously defined gauge-based thresholds ∼7–13 mm d−1. Contrarily the defined thresholds from the recent cumulative 2 and 3 d rainfall were much smaller than defined from gauge-based data (Uwihirwe et al., 2020, 2022). These differences are probably due to the predefined threshold (10 mm) that could omit some rainy days. This also led to a shortened event duration D and hence a slightly higher . Nevertheless, the landslide-triggering conditions defined based on the reveals poor discriminatory power to distinguish landslides from no landslides (AUC ∼ 0.53) and thus is not impactful on landslide initiation. The linked landslide thresholds also underperform in terms of landslide prediction capabilities measured by the resulting low rate of true positives TPR ∼ 56 %–69 %. Similarly, the landslide hydro-meteorological thresholds that included the rainfall event as a trigger resulted in a poor landslide warning performance, TPR max ∼ 66 %.
It is agreed that the consequences of offering FPRs are less harmful in the short term than missed alarms (FNRs), which implies that the best threshold should maximise the TPRs while minimising the FNRs. However, the thresholds in Fig. 7b and e are classical thresholds E–D relying exclusively on rainfall (trigger), leading to the high rate of missed alarms, and are thus less important for a robust LEWS development. Similar to this study, previous studies (Bogaard and Greco, 2018; Marino et al., 2020; Mirus et al., 2018; Peres et al., 2018; Thomas et al., 2019; Uwihirwe et al., 2022) indicated that the consideration of the prior subsurface hydrological conditions reduce the number of FNRs as well as the number of FPRs relative to the exclusive use of rainfall-only thresholds. In Fig. 8a–c, we integrated the hydrological information (i.e. antecedent soil moisture) in landslide thresholds to improve the rate of TPR and reduce the rate of FNRs and FPRs. The main goal of hydro-meteorological thresholds (cause–trigger) is to maximise the TPRs, i.e. minimise the FNRs, but at the same time reduce the FPRs. The used statistical metrics (TSS and Rad) are also in line with this concept aiming at maximising the TPR while minimising the FPR. Once TPR is maximised, the FNR is also minimised, though it is difficult and/or impossible to have a perfect threshold model with zero FNR and FPR.
The poor performance of the rainfall event-based thresholds concept is due to uncertainties from multiple sources. We hypothetically used the rainfall events as landslide-triggering conditions, defined as individual periods of continuous rain interrupted by at least two dry day periods referred to as the minimum IET. Nevertheless, this definition needs further exploration to be standardised to avoid uncertainties. According to Adams et al. (1987) and Hong et al. (2017), the IET is defined as the minimum period of time that separates two consecutive rainfall events and is considered the period for which the effects of the antecedent soil moisture or precipitation index may last. This is to say that the antecedent soil moisture and/or antecedent precipitation index have no significant effect on landslide initiations once the rainfall events and IETs are well defined. However, the IET, the period during which the effect of antecedent soil moisture becomes null, depends on a number of site-specific factors (soil properties, land use/land cover, potential evaporation, etc.) and is thus difficult to be standardised. Another drawback associated with the use of rainfall event concept may be linked to the transient timescales of the triggering events that bring about difficulties to fix the appropriate time to give an alert or an early landslide warning to the threatened community.
Looking at the constraints associated with IET, rainy day and rainfall event definitions, we explored the shorter-scaled triggering rainfall conditions that include the cumulated rainfall with constant durations of 1, 2 and 3 d (, , ). The cumulative 3 d rainfall showed the highest impact on landslide initiation AUC ∼ 0.72 and true positive alarms TPR ∼ 79 %–81 %. Although the meteorological trigger-based thresholds have resulted in high rates of true alarms, they lack concrete physical significance and are also challenging for a robust landslide early warning system due to the linked high level of erroneous alarms, i.e. false positives FPR ∼ 40 %–42 %. To account for the pre-wetting state of the soil, the antecedent soil moisture conditions have been considered. These antecedent soil moisture conditions from the top 5 cm, 50 cm and 2 m, Setop, Seroot and Seuz respectively, showed a significant impact on landslide predisposal AUC = 0.71–0.76. Moreover, with the exception of the Seuz, the hydrological landslide thresholds 0.56 (Setop) and 0.73 (Seroot) defined from these soil moisture conditions revealed a high landslide warning capability with TPR ∼ 75 %–85 %. These hydrological thresholds indicate the critical pre-wetting state above which any additional amount of rainfall > 11–15 mm is highly likely to trigger landslides. We therefore combined both landslide hydrological predisposing and meteorological triggering conditions following the cause–trigger concept into a bilinear hydro-meteorological threshold framework. This approach improved the landslide prediction capabilities in terms of reduced rates of false alarms (FPR ∼ 22 %) and increased true alarms (TPR ∼ 72 %) as compared to the approaches that consider the maximum probable rainfall event (maximum TPR ∼ 66 % and FPR ∼ 41 %). In other words, once combined with the pre-wetting hydrological conditions, the cumulative few days of rainfall have a significant impact on landslide initiation and warning as compared to the longer and not constant triggering conditions. Furthermore, the incorporation of the antecedent wetness state of the terrain not only improved the landslide warning capabilities, but also provided accurate insights into landslide alert times as compared to the use of a transient timescale associated with the rainfall event concept.
Among the tested pre-wetting conditions, the incorporation of the antecedent soil moisture modelled at the root zone Seroot was the most impactful for landslide initiation and thus was the most useful in landslide hazard assessment thresholds in Rwanda. The finer spatial resolution of the hydrological model-derived soil moisture together with the consideration of the specific climate and hydrogeological characteristics of the model catchments could be a possible explanation for the positive impact of soil moisture assimilated at the root zone. This could also be explained by the lower exposure of the root zone to the solar heat and evaporation processes as compared to the near-surface Setop. The probable lower proneness to the gravity-driven drainage and deep percolation due to the soil texture, vegetation and organic matter at the root zone could also be an explanation. Moreover, the soil depth involved in shallow (0.5–2 m) and deep landslides (>2 m) (Greco et al., 2018) is much thicker than the Setop (5 cm) currently measured by the satellite-based soil moisture technologies, and this is more captured by the hydrological modelling approaches (Wflow). An overestimation of soil moisture by satellites (VdS) and the distributed hydrological model (Wflow) was also noted and attributed to the similar overestimation of satellite-based precipitation, an important element in soil moisture estimation. Therefore, more reliable algorithms that address the reliance between the satellite and in situ based information could improve the performance and enhance the data accuracy needed for landslide hazard assessment.
The adopted bilinear threshold framework, indicating the distribution of data points in a 2D space, reflects the relationship between the landslide causal and triggering conditions despite other linked constraints and limitations (Conrad et al., 2021). We objectively used the bilinear threshold framework because the majority of positive classes were clustered in the upper-right corner of the 2D threshold space. Although this format proved to be suitable for landslide hydro-meteorological threshold definition (Mirus et al., 2018; Thomas et al., 2019; Uwihirwe et al., 2020, 2022), other formats could also be useful, depending on the distribution of the positive classes in the 2D space. The adopted bilinear framework is in line with the goal of the hydro-meteorological cause–trigger-based threshold concept that prioritises the minimisation of false alarms while at least keeping unchanged the rate of true alarms. Additionally, in some cases, single-variable thresholds lead to high prediction capabilities in terms of elevated rates of true alarms and with quite low rates of false alarms and could be adopted especially for hydrologically based thresholds that consider the long-term wetting process of the soil until the landslide day.
Regardless of the good performance of soil moisture as a landslide hydro-meteorological threshold, the incorporation of the pre-wetting state of soil into landslide hazard assessment thresholds using groundwater levels, (TPR = 54 %–64 % and FPR = 6 %–11 %) (Uwihirwe et al., 2022), with low rates of false alarms, performed higher than using root zone soil moisture Se (TPR = 66 % and FPR = 44 %) due to the elevated rate of false alarms.
Ideally, one would have a landslide inventory of about 200 landslide events in order to have a precise estimation of threshold parameters (Peres and Cancelliere, 2021). However, the landslide inventory used for this study accounts for only 32 hazardous landslides. Although the reliance on this limited sample size is likely to lead to a bias towards the larger landslide events and those with impacts on society, this landslide inventory is the most comprehensive one currently available in the study area.
This research aimed to evaluate the potential of satellite-based measurements of precipitation and soil moisture as well as hydrological model-derived soil moisture information for landslide initiation thresholds in Rwanda. The GPM-based IMERG rainfall product was found to be a good spatially distributed source of rainfall data for landslide hazard assessment, especially in data-scarce areas like Rwanda. The satellite- and model-derived soil moisture time series broadly reproduce the most important trends of the in situ soil moisture. Regardless of different depths of data records and slight overestimation of soil moisture by satellite- and model-derived techniques, it was concluded that they follow the in situ observed temporal variation and are thus potentially useful for landslide initiation threshold definition. The purpose of incorporating the antecedent soil moisture into landslide hazard assessment was to account for the physical effect of the pre-wetness state of soil, responsible for the predisposal of the slopes to near failure, prior to the landslide-triggering conditions. Two categories of landslide-triggering conditions have been considered to assess the potential value of including the antecedent soil moisture information. The category that considers the cumulative 3 d rainfall was the most impactful and thus was more useful for landslide hazard assessment in Rwanda rather than the rainfall-event-based trigger. Although the area under the curve (AUC = 0.71–0.76) statistical metric indicated the significant impact of all tested antecedent soil moisture variables prior to the triggering conditions, the antecedent soil moisture modelled from the root zone Seroot performed best. The classical thresholds E–D relying exclusively on rainfall (trigger) performed lower, with a high rate of missed alarms (50 %), and thus were less important for robust early warning system development. In contrast, the hydro-meteorological thresholds that incorporate the antecedent soil moisture Seroot and the recent 3 d cumulative rainfall (Se) outperform other threshold models, with high rates of true alarms (72 %) and low rates of false alarms (20 %), and thus can be very useful for landslide early warning system development in Rwanda.
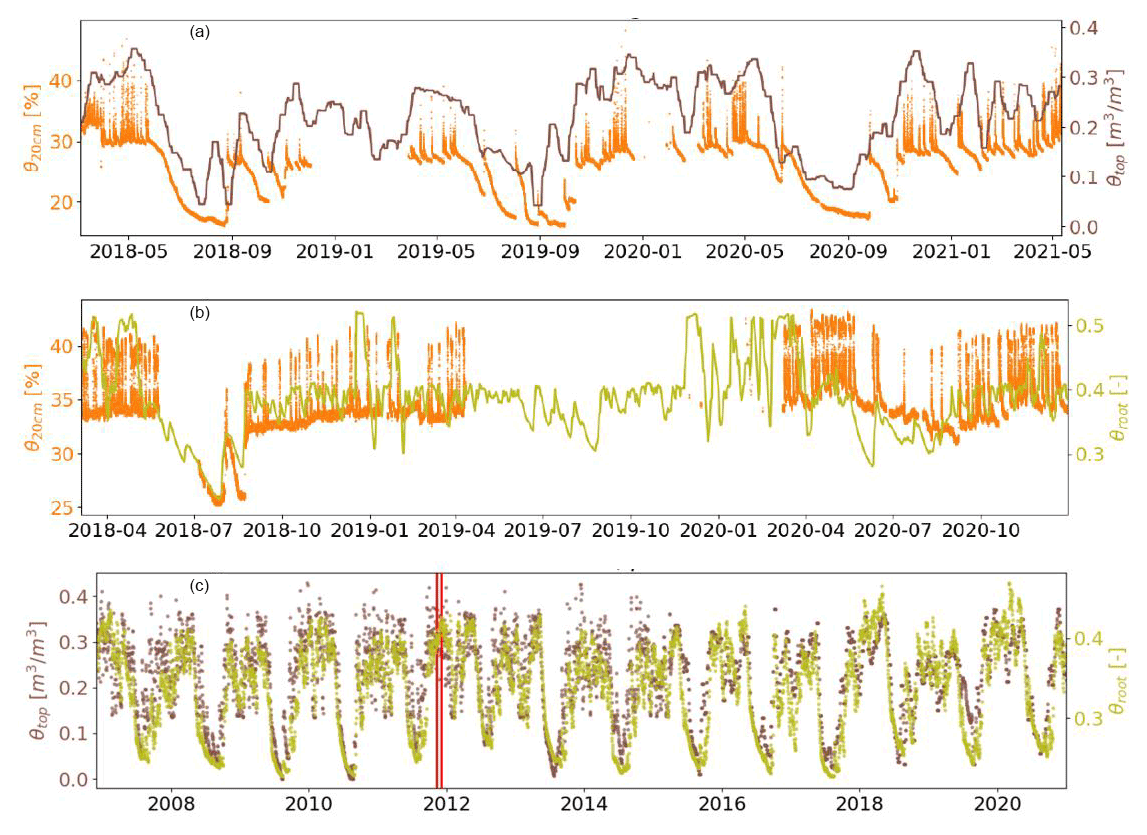
Figure A1Selected examples of satellite- and model-derived soil moisture compared to in situ recorded soil moisture at 20 cm soil depth (AWS): (a) θtop and in situ θ20 cm soil moisture time series at Gacurabwenge station; (b) model-derived soil moisture in the root zone θroot and in situ soil moisture θ20 cm at Kibisabo station; (c) satellite-derived θtop and model-derived soil moisture in the root zone θroot, with vertical red lines indicating the timing of the landslide occurrence time.
The landslide inventory used for this research can be accessed at https://doi.org/10.4121/15040446.v1 (Uwihirwe, 2021).
JU collected the in situ data, conducted the statistical analysis and conceptualised and prepared the manuscript storyline. ARP collected and prepared data from satellite precipitation products, organised the soil moisture data and conducted some statistical analysis. HW and JS prepared and made available the high-resolution satellite-based soil moisture data. FSW actively participated in hydrological modelling of soil moisture and greatly contributed to the correction and perfection of the manuscript. MS corrected the manuscript storyline, shaped the discussion and contributed to the perfection of the manuscript. TAB initiated the research idea, proposed the research approaches, created the research network and collaboration, verified the data preparation and statistical analysis, shaped the manuscript storyline and contributed to the perfection of the manuscript.
The contact author has declared that none of the authors has any competing interests.
Publisher's note: Copernicus Publications remains neutral with regard to jurisdictional claims in published maps and institutional affiliations.
This article is part of the special issue “Hydro-meteorological extremes and hazards: vulnerability, risk, impacts, and mitigation”. It is a result of the European Geosciences Union General Assembly 2022, Vienna, Austria, 23–27 May 2022.
We are so thankful to Elise Monsieur, Arthur Depicker and Olivier Dewitte for sharing part of the Landslide Inventory for Rwanda as part of the central section of the Western branch of the East African Rift (LIWEAR) project. We are thankful to the Rwanda Meteorological Agency for offering access to the in situ meteorological and hydrological datasets used for validation of other sources of data.
This paper was edited by Francesco Marra and reviewed by two anonymous referees.
Adams, B. B. J., Asce, M., Fraser, H. G., and Hanafy, M. S.: Meteorological data analysis for drainage system design, J. Environ. Eng., 112, 827–848, 1987.
Ashouri, H., Lin Hsu, K., Sorooshian, S., Braithwaite, D. K., Knapp, K. R., Cecil, D. L., Nelson, B. R., and Prat, O. P.: Daily Precipitation Climate Data Record from Multisatellite Observations for Hydrological and Climate Studies, Am. Meteorol. Soc., 69–84, https://doi.org/10.1175/BAMS-D-13-00068.1, 2015.
Bhatti, H. A., Rientjes, T., Haile, A. T., Habib, E., and Verhoef, W.: Evaluation of bias correction method for satellite-based rainfall data, Sensors, 16, 1–16, https://doi.org/10.3390/s16060884, 2016.
Bizimana, H. and Sönmez, O.: Landslide Occurrences in The Hilly Areas of Rwanda, Their Causes and Protection Measures, Disast. Sci. Eng., 1, 1–7, 2015.
Bogaard, T. and Greco, R.: Invited perspectives: Hydrological perspectives on precipitation intensity-duration thresholds for landslide initiation: proposing hydro-meteorological thresholds, Nat. Hazards Earth Syst. Sci., 18, 31–39, https://doi.org/10.5194/nhess-18-31-2018, 2018.
Bouaziz, L. J. E., Steele-dunne, S. C., and Schellekens, J.: Improved Understanding of the Link Between Catchment-Scale Vegetation Accessible Storage and Satellite-Derived Soil Water Index, Water Resour. Res., 56, 1–22, https://doi.org/10.1029/2019WR026365, 2020.
Broeckx, J., Vanmaercke, M., Duchateau, R., and Poesen, J.: Earth-Science Reviews A data-based landslide susceptibility map of Africa, Earth-Sci. Rev., 185, 102–121, https://doi.org/10.1016/j.earscirev.2018.05.002, 2018.
Calvello, M., Devoli, G., Freeborough, K., Gariano, S. L., Guzzetti, F., Stähli, Kirschbaum, D., Nakaya, J., and Robbins, M.: LandAware: a new international network on Landslide Early Warning Systems, Landslide, 17, 2699–2702, https://doi.org/10.1007/s10346-020-01548-7, 2020.
Conrad, J. L., Morphew, M. D., Baum, R. L., and Mirus, B. B.: Hydromet: A new code for automated objective optimization of hydrometeorological thresholds for landslide initiation, Water, 13, 1752, https://doi.org/10.3390/w13131752, 2021.
de Jeu, R. A. M., Holmes, T. R. H., Parinussa, R. M., and Owe, M.: A spatially coherent global soil moisture product with improved temporal resolution, J. Hydrol., 516, 284–296, https://doi.org/10.1016/j.jhydrol.2014.02.015, 2014.
Depicker, A., Jacobs, L., Mboga, N., Van Rompaey, A., Lennert, M., Wolff, E., Kervyn, F., Michellier, C., Dewitte, O., and Govers, G.: population and forest-cover changes in the Kivu Rift, Nat. Sustain., 4, 920, https://doi.org/10.1038/s41893-021-00757-9, 2015.
Depicker, A., Jacobs, L., Delvaux, D., Havenith, H. B., Maki Mateso, J. C., Govers, G., and Dewitte, O.: The added value of a regional landslide susceptibility assessment: The western branch of the East African Rift, Geomorphology, 353, 106886, https://doi.org/10.1016/j.geomorph.2019.106886, 2020.
Depicker, A., Jacobs, L., Mboga, N., Smets, B., Van Rompaey, A., Lennert, M., Wolff, E., Kervyn, F., Michellier, C., Dewitte, O., and Govers, G.: Historical dynamics of landslide risk from population and forest-cover changes in the Kivu Rift, Nat. Sustain., 4, 965–974, https://doi.org/10.1038/s41893-021-00757-9, 2021a.
Depicker, A., Govers, G., Jacobs, L., Campforts, B., Uwihirwe, J., and Dewitte, O.: Interactions between deforestation, landscape rejuvenation, and shallow landslides in the North Tanganyika – Kivu rift region, Africa, Earth Surf. Dynam., 9, 445–462, https://doi.org/10.5194/esurf-9-445, 2021b.
Dewitte, O., Depicker, A., Moeyersons, J., and Dille, A.: Mass Movements in Tropical Climates, in: 2nd Edn., Elsevier Inc., https://doi.org/10.1016/B978-0-12-818234-5.00118-8, 2021.
Froude, M. J. and Petley, D. N.: Global fatal landslide occurrence from 2004 to 2016, Nat. Hazards Earth Syst. Sci., 18, 2161–2181, https://doi.org/10.5194/nhess-18-2161-2018, 2018.
Funk, C., Peterson, P., Landsfeld, M., Pedreros, D., Verdin, J., Shukla, S., Husak, G., Rowland, J., Harrison, L., Hoell, A., and Michaelsen, J.: The climate hazards infrared precipitation with stations – a new environmental record for monitoring extremes, Scient. Data, 2, 1–21, https://doi.org/10.1038/sdata.2015.66, 2015.
Gariano, S. L. and Guzzetti, F.: Landslides in a changing climate, Earth-Sci. Rev., 162, 227–252, https://doi.org/10.1016/J.EARSCIREV.2016.08.011, 2016.
Glade, T. and Nadim, F.: Early warning systems for natural hazards and risks, Nat. Hazards, 70, 1669–1671, https://doi.org/10.1007/s11069-013-1000-8, 2014.
Glerum, A., Brune, S., Stamps, D. S. ,and Strecker, M. R.: Victoria continental microplate dynamics controlled by the lithospheric strength distribution of the East African Rift, Nat. Commun., 11, 1–15, https://doi.org/10.1038/s41467-020-16176-x, 2020.
Greco, R., Marino, P., Santonastaso, G. F., and Damiano, E.: Interaction between perched epikarst aquifer and unsaturated soil cover in the initiation of shallow landslides in pyroclastic soils, Water, 10, 948, https://doi.org/10.3390/w10070948, 2018.
Guzzetti, F., Gariano, S. L., Peruccacci, S., Brunetti, M. T., Marchesini, I., Rossi, M., and Melillo, M.: Geographical landslide early warning systems, Earth-Sci. Rev., 200, 102973, https://doi.org/10.1016/j.earscirev.2019.102973, 2020.
Haque, U., Blum, P., da Silva, P. F., Andersen, P., Pilz, J., Chalov, S. R., Malet, J. P., Aufliè, M. J., Andres, N., Poyiadji, E., Lamas, P. C., Zhang, W., Peshevski, I., Pétursson, H. G., Kurt, T., Dobrev, N., García-Davalillo, J. C., Halkia, M., Ferri, S., Gaprindashvili, G., Engström, J., and Keellings, D.: Fatal landslides in Europe, Landslides, 13, 1545–1554, https://doi.org/10.1007/s10346-016-0689-3, 2016.
Hersbach, H., Bell, B., Berrisford, P., Hirahara, S., Horányi, A., Nicolas, J., Peubey, C., Radu, R., Bonavita, M., Dee, D., Dragani, R., Flemming, J., Forbes, R., Geer, A., Hogan, R. J., Janisková, H. M., Keeley, S., Laloyaux, P., Cristina, P. L., and Thépaut, J.: The ERA5 global reanalysis, Q. J. Roy. Meteorol. Soc., 146, 1999–2049, https://doi.org/10.1002/qj.3803, 2020.
Hong, M., Kim, J., and Jeong, S.: Rainfall intensity-duration thresholds for landslide prediction in South Korea by considering the effects of antecedent rainfall, Landslides, 15, 523–534, https://doi.org/10.1007/s10346-017-0892-x, 2017.
Huffman, G. J., Adler, R. F., Bolvin, D. T., and Nelkin, E. J.: The TRMM multi-satellite precipitation analysis (TMPA), in: Satellite rainfall applications for surface hydrology, Springer, 3–22, https://doi.org/10.1007/978-90-481-2915-7_1, 2010.
Huffman, G. J., Gsfc, N., Bolvin, D. T., Braithwaite, D., Hsu, K., Joyce, R., Kidd, C., Nelkin, E. J., Sorooshian, S., and Tan, J.: Algorithm Theoretical Basis Document (ATBD) Version 06 NASA Global Precipitation Measurement (GPM) Integrated Multi-satellitE Retrievals for GPM (IMERG), NASA, Greenbelt, MD, USA, https://www.researchgate.net/publication/302970086_Algorithm_Theoretical_Basis_Document_ATBD_version_44_for_the_NASA_Global_Precipitation_Measurement_GPM_Integrated_Multi-satellitE_Retrievals_for_GPM_I-MERG (last access: 27 April 2022), 2020.
Imhoff, R. O., van Verseveld, W. J., van Osnabrugge, B., and Weerts, A. H.: Scaling Point-Scale (Pedo) transfer Functions to Seamless Large-Domain Parameter Estimates for High-Resolution Distributed Hydrologic Modeling: An Example for the Rhine River, Water Resour. Res., 56, 1–28, https://doi.org/10.1029/2019WR026807, 2020.
Joshi, S., Kumar, K., Joshi, V., and Pande, B.: Rainfall variability and indices of extreme rainfall-analysis and perception study for two stations over Central Himalaya, India, Nat. Hazards, 72, 361–374, https://doi.org/10.1007/s11069-013-1012-4, 2014.
Karssenberg, D.: Land surface process modelling with Python, http://karssenberg.geo.uu.nl/labsAnswers/ (last access: 15 May 2022), 2014.
Karssenberg, D., Schmitz, O., Salamon, P., de Jong, K., and Bierkens, M. F. P.: A software framework for construction of process-based stochastic spatio-temporal models and data assimilation, Environ. Model. Softw., 25, 489–502, https://doi.org/10.1016/j.envsoft.2009.10.004, 2010.
Kimani, M. W., Hoedjes, J. C. B., and Su, Z.: An assessment of satellite-derived rainfall products relative to ground observations over East Africa, Remote Sens., 9, 430, https://doi.org/10.3390/rs9050430, 2017.
Kirschbaum, D., Adler, R., Adler, D., Peters-Lidard, C., and Huffman, G.: Global Distribution of Extreme Precipitation and High-Impact Landslides in 2010 Relative to Previous Years, Hydrometeorology, 3, 1536–1551, https://doi.org/10.1175/JHM-D-12-02.1, 2012.
Kirschbaum, D., Stanley, T., and Zhou, Y.: Spatial and temporal analysis of a global landslide catalog, Geomorphology, 249, 4–15, https://doi.org/10.1016/j.geomorph.2015.03.016, 2015.
Kirschbaum, D. B., Adler, R., Yang, A. E., Ae, H., Ae, S. H., Lerner-Lam, A., Kirschbaum, D. B., Lerner-Lam, Á. A., Adler, R., Hong, Y., and Hill, S.: A global landslide catalog for hazard applications: method, results, and limitations, Nat. Hazards, 52, 561–575, https://doi.org/10.1007/s11069-009-9401-4, 2010.
Marino, P., Peres, D. J., Cancelliere, A., Greco, R., and Bogaard, T. A.: Soil moisture information can improve shallow landslide forecasting using the hydrometeorological threshold approach, Landslides, 17, 2041–2054, https://doi.org/10.1007/s10346-020-01420-8, 2020.
Melillo, M., Brunetti, M. T., Peruccacci, S., Gariano, S. L., Roccati, A., and Guzzetti, F.: A tool for the automatic calculation of rainfall thresholds for landslide occurrence, Environ. Model. Softw., 105, 230–243, https://doi.org/10.1016/j.envsoft.2018.03.024, 2018.
Mirus, B., Morphew, M., and Smith, J.: Developing Hydro-Meteorological Thresholds for Shallow Landslide Initiation and Early Warning, Water, 10, 1274, https://doi.org/10.3390/w10091274, 2018.
Moeyersons, J.: A possible causal relationship between creep and sliding on Rwaza Hill, southern Rwanda, Earth Surf. Proc. Land., 14, 597–614, https://doi.org/10.1002/esp.3290140615, 1989.
Monsieurs, E., Kirschbaum, D. B., Tan, J., Maki Mateso, J.-C., Jacobs, L., Plisnier, P.-D., Thiery, W., Umutoni, A., Musoni, D., Bibentyo, T. M., Ganza, G. B., Mawe, G. I., Bagalwa, L., Kankurize, C., Michellier, C., Stanley, T., Kervyn, F., Kervyn, M., Demoulin, A., and Dewitte, O.: Evaluating TMPA Rainfall over the Sparsely Gauged East African Rift, J. Hydrometeorol., 19, 1507–1528, https://doi.org/10.1175/JHM-D-18-0103.1, 2018a.
Monsieurs, E., Liesbet, J., Michellier, C., Tchangabo, B. J., Ganza, B. G., Bibentyo, M. T., Kervyn, M., Mateso, M. J.-C., Nkurunziza, P., Ndayisenga, A., Buzera, K. C., Nahimana, L., Wim, T., Demoulin, A., Kervyn, M., and Dewitte, O.: Landslide inventory for hazard assessment in a data – poor context: a regional-scale approach in a tropical African environment, Landslides, 15, 2195–2209, https://doi.org/10.1007/s10346-018-1008-y, 2018b.
Monsieurs, E., Dewitte, O., and Demoulin, A.: A susceptibility-based rainfall threshold approach for landslide occurrence, Nat. Hazards Earth Syst. Sci., 19, 775–789, https://doi.org/10.5194/nhess-19-775-2019, 2019a.
Monsieurs, E., Dewitte, O., Depicker, A., and Demoulin, A.: Towards a Transferable Antecedent Rainfall – Susceptibility Threshold Approach for Landsliding, Water, 11, 2202, https://doi.org/10.3390/W11112202, 2019b.
Mostbauer, K., Kaitna, R., Prenner, D., and Hrachowitz, M.: The temporally varying roles of rainfall, snowmelt and soil moisture for debris flow initiation in a snow-dominated system, Hydrol. Earth Syst. Sci., 22, 3493–3513, https://doi.org/10.5194/hess-22-3493-2018, 2018.
Nsengiyumva, J. B. and Valentino, R.: Predicting landslide susceptibility and risks using GIS-based machine learning simulations, case of upper Nyabarongo catchment, Geomatics, Nat. Hazards Risk, 11, 1250–1277, https://doi.org/10.1080/19475705.2020.1785555, 2020.
Nsengiyumva, J. B., Luo, G., Nahayo, L., Huang, X., and Cai, P.: Landslide susceptibility assessment using spatial multi-criteria evaluation model in Rwanda, Int. J. Environ. Res. Publ. Health, 15, 243, https://doi.org/10.3390/ijerph15020243, 2018.
Owe, M., de Jeu, R., and Walker, J.: A methodology for surface soil moisture and vegetation optical depth retrieval using the microwave polarization difference index, IEEE T. Geosci. Remote, 39, 1643–1654, https://doi.org/10.1109/36.942542, 2001.
Owe, M., de Jeu, R., and Holmes, T.: Multisensor historical climatology of satellite-derived global land surface moisture, J. Geophys. Res.-Earth, 113, 1–17, https://doi.org/10.1029/2007JF000769, 2008.
Peres, D. J. and Cancelliere, A.: Comparing methods for determining landslide early warning thresholds: potential use of non-triggering rainfall for locations with scarce landslide data availability, Landslides, 18, 3135–3147, https://doi.org/10.1007/s10346-021-01704-7, 2021.
Peres, D. J., Cancelliere, A., Greco, R., and Bogaard, T. A.: Influence of uncertain identification of triggering rainfall on the assessment of landslide early warning thresholds, Nat. Hazards Earth Syst. Sci., 18, 633–646, https://doi.org/10.5194/nhess-18-633-2018, 2018.
Peruccacci, S., Brunetti, M. T., Gariano, S. L., Melillo, M., Rossi, M., and Guzzetti, F.: Rainfall thresholds for possible landslide occurrence in Italy, Geomorphology, 290, 39–57, https://doi.org/10.1016/j.geomorph.2017.03.031, 2017.
Petley, D.: Global patterns of loss of life from landslides, Geology, 40, 927–930, https://doi.org/10.1130/G33217.1, 2012.
Postance, B. and Hillier, J.: Comparing threshold definition techniques for rainfall-induced landslides: A national assessment using radar rainfall, Earth Surf. Proc. Land., 560, 553–560, https://doi.org/10.1002/esp.4202, 2017.
Prenner, D., Kaitna, R., Mostbauer, K., and Hrachowitz, M.: The Value of Using Multiple Hydrometeorological Variables to Predict Temporal Debris Flow Susceptibility in an Alpine Environment, Water Resour. Res., 54, 6822–6843, https://doi.org/10.1029/2018WR022985, 2018.
Prenner, D., Hrachowitz, M., and Kaitna, R.: Trigger characteristics of torrential flows from high to low alpine regions in Austria, Sci. Total Environ., 658, 958–972, https://doi.org/10.1016/j.scitotenv.2018.12.206, 2019.
Rodell, M., Houser, P. R., Gottschalck, J., Cosgrove, B., Radakovich, J., Walker, J. P., Lohmann, D., and Toll, D.: The Global Land Data Assimilation System, Am. Meteorol. Soc., 85, 381–394, 2004.
Saha, S., Moorthi, S., Wu, X., Wang, J., Nadiga, S., Tripp, P., Behringer, D., Hou, Y.-T., Chuang, H., and Iredell, M.: The NCEP climate forecast system version 2, J. Climate, 27, 2185–2208, 2014.
Schellekens, J.: WFlow Documentation, OpenStreams, https://buildmedia.readthedocs.org/media/pdf/wflow/latest/wflow.pdf (last access: 5 May 2022), 2021.
Schellekens, J., Euser, T., Winsemius, H., Thiange, C., and Bouaziz, L.: Openstreams/wflow: Unstable-Master, https://github.com/openstreams/wflow (last access: 5 May 2022), 2019.
Sekaranom, A. B., Suarma, U., and Nurjani, E.: Climate extremes over the maritime continent and their associations with Madden-Jullian Oscillation, IOP Conf. Ser. Earth Environ. Sci., 451, https://doi.org/10.1088/1755-1315/451/1/012006, 2020.
Sidle, R. C., Greco, R., and Bogaard, T.: Overview of landslide hydrology, Water, 11, 11–13, https://doi.org/10.3390/w11010148, 2019.
Tank, A., Zwiers, F., and Zhang, X.: Guidelines on Analysis of extremes in a changing climate, World Meteorol. Organ., http://202.90.199.118/ID/documents/WCDMP_72_TD_1500_en_1.pdf (last access: 25 March 2022), 2009.
Thomas, M. A., Collins, B. D., and Mirus, B. B.: Assessing the Feasibility of Satellite-Based Thresholds for Hydrologically Driven Landsliding, Water Resour. Res., 55, 9006–9023, https://doi.org/10.1029/2019WR025577, 2019.
Thomas, M. A., Mirus, B. B., and Smith, J. B.: Hillslopes in humid-tropical climates aren't always wet: Implications for hydrologic response and landslide initiation in Puerto Rico, Hydrol. Process., 34, 4307–4318, https://doi.org/10.1002/hyp.13885, 2020.
Uwihirwe, J.: Data underlying the research of Integration of observed and model derived groundwater levels in landslide threshold models in Rwanda, TU Delft [data set], https://doi.org/10.4121/15040446.v1, 2021.
Uwihirwe, J., Hrachowitz, M., and Bogaard, T. A.: Landslide precipitation thresholds in Rwanda, Landslides, 17, 2469–2481, https://doi.org/10.1007/s10346-020-01457-9, 2020.
Uwihirwe, J., Hrachowitz, M., and Bogaard, T.: Integration of observed and model-derived groundwater levels in landslide threshold models in Rwanda, Nat. Hazards Earth Syst. Sci., 22, 1723–1742, https://doi.org/10.5194/nhess-22-1723-2022, 2022.
Valentino, R., Sobio, Y., Mizero, J., and Nsengiyumva, F.: Unstable road cut slopes and design of retaining structures in the Rwandan context, Arab. J. Geosci., 14, 1–17, https://doi.org/10.1007/s12517-021-07819-4, 2021.
Vernimmen, R. R. E., Hooijer, A., Mamenun, Aldrian, E., and van Dijk, A. I. J. M.: Evaluation and bias correction of satellite rainfall data for drought monitoring in Indonesia, Hydrol. Earth Syst. Sci., 16, 133–146, https://doi.org/10.5194/hess-16-133-2012, 2012.
Wang, S., Zhang, K., van Beek, L. P. H., Tian, X., and Bogaard, T. A.: Physically-based landslide prediction over a large region: Scaling low-resolution hydrological model results for high-resolution slope stability assessment, Environ. Model. Softw., 1675, 104607, https://doi.org/10.1016/j.envsoft.2019.104607, 2019.
Zhao, B., Dai, Q., Han, D., Zhang, J., Zhuo, L., and Berti, M.: Application of hydrological model simulations in landslide predictions, Landslides, 17, 877–891, https://doi.org/10.1007/s10346-019-01296-3, 2020.
Zhuo, L., Dai, Q., Han, D., Chen, N., Zhao, B., and Berti, M.: Evaluation of Remotely Sensed Soil Moisture for Landslide Hazard Assessment, IEEE J. Select. Top. Appl. Earth Obs. Remote Sens., 12, 162–173, https://doi.org/10.1109/JSTARS.2018.2883361, 2019.