the Creative Commons Attribution 4.0 License.
the Creative Commons Attribution 4.0 License.
 | 02 Nov 2022
Probabilistic fault displacement hazard analysis for the north Tabriz fault
Mohamadreza Hosseini
Habib Rahimi
The probabilistic fault displacement hazard analysis is one of the newest methods of estimating the amount of probabilistic displacement in fault surface rupture areas. Considering the strike-slip mechanism of the north Tabriz fault, Iran, using the earthquake method and historical earthquakes in 1721 and 1780, the surface displacement of the north Tabriz fault has been investigated, and the probabilistic displacement in different scenarios has been estimated. The north Tabriz fault's 50–60 km long section was selected as the source of possible surface rupture from its historical data. Two scenarios were considered according to probabilistic displacements, return periods, and magnitudes according to paleoseismic studies of the north Tabriz fault. For both scenarios, the probabilistic displacements for the exceedance rate of 5 % in 50, 475, and 2475 years for the probabilistic principle displacements (on the fault) of the north Tabriz fault have been estimated.
- Article
(25788 KB) - Full-text XML
- BibTeX
- EndNote


Earthquakes are a serious threat to many human activities, not only because of earth-shaking but also because of surface ruptures. Reducing earthquake losses and damage requires predicting the amplitude and location of ground movements and possible surface displacements in the future. Fault displacement hazard assessments are based on empirical relationships obtained using historical seismic rupture data. These relationships evaluate the probability of co-seismic surface slip of ruptures on the fault (primary) and outside the fault (distributed) for different magnitudes and distances to the causal fault. In addition, these relationships make it possible to predict the extent of fault slip on or near the active fault (Baize et al., 2020).
A way to reduce the effects of fault rupture hazards on a structure is to study the probability of fault displacement. This approach can consider the exceedance rate of different displacement levels of the event under construction with a displacement hazard curve (Youngs et al., 2003). So far, fault displacement data have been collected and analyzed by several researchers to evaluate the fault rupture properties. Investigation of fault displacement and extraction of experimental relationships are reported by Wells and Coppersmith (1994) and reviewed by Petersen and Wesnousky (1994). Each earthquake causes a superficial shaking at the site, but each earthquake does not cause a surface rupture in the area. Therefore, only the data of earthquakes that have caused the rupture in the region are used to obtain the attenuation relationships (Youngs et al., 2003).
A method for estimating the probabilistic fault displacement hazard for strike-slip faults in the world has been presented and mapped due to the impact of fault displacement hazard on the fault trace type and the complexity of this effect and hazard of fault displacement for strike-slip faults studied by Petersen et al. (2011). Principal displacements are considered primary ruptures that occur on or within a few meters of the active fault. Distributed displacements outside the fault are causative and usually appear as discontinuous ruptures or shears at distances of several meters to several hundred kilometers from the fault trace. The principal and distributed displacements are introduced as net displacements derived from horizontal and vertical displacements (Petersen et al., 2011).
To estimate the probabilistic fault displacement hazard, we used the Petersen et al. (2011) method, but recently some studies have been conducted with this approach. Katona et al. (2021) investigated the hazard of surface displacement due to faults in the design of nuclear power plants. Nurminen et al. (2020) concentrate on off-fault rupturing and developing an original probability model for the occurrence of distributed ruptures from 15 historical reverse earthquakes. Goda (2021) proposed an alternative approach based on stochastic source modeling and fault displacement analysis using Okada equations, and the developed method was applied to the Hector Mine earthquake (1999).
Numerical values are obtained from Petersen et al. (2011) codes, and this method has been performed in a case study in northwestern Iran. In this study, several input parameters such as maximum magnitude, return period, faulting mechanism, surface rupture length, mapping accuracy, sites located on trace, cell size, regression, and displacement models, according to Petersen et al. (2011), have been used to estimate the probabilistic displacement and exceedance rate of the north Tabriz fault, Iran, in different scenarios.
Based on the results of a paleoseismic study reported by Hessami et al. (2003) on the north Tabriz fault, a section with a length of 50–60 km was considered a source of possible rupture in the future. Sites at distances of 50 m from each other and cells with dimensions of 25×25 m on the fault trace were considered to estimate probability displacement. Also, according to the study by Petersen et al. (2011), the trace of the north Tabriz fault was considered a simple trace due to the absence of large instrumental earthquakes associated with surface rupture. Many studies have been done on the historical displacements of the north Tabriz fault. According to the paleoseismic studies reported by Hessami et al. (2003) and Ghassemi et al. (2016), the probabilistic displacement is between 0 to 4.5 m and 0 to 7.1 m, respectively. The magnitude and return period of large earthquakes (Mw∼7.7 within 645 years and Mw∼7.3 within 300 years), according to Mousavi-Bafrouei et al. (2014) and Djamour et al. (2011), respectively, are considered.
In the first step, probabilistic fault displacement and the annual exceedance rate of displacement for two given scenarios (Mw∼7.7 within 645 years and Mw∼7.3 within 300 years) by considering 5 % in 50, 475, and 2475 years at the site with geographical coordinates 38.096∘N, 46.349∘E have been obtained. In the second step, due to the passage of the north Tabriz fault through the city of Tabriz (Fig. 1), considering a 2 km long section from the north Tabriz fault, the probabilistic displacement has been estimated, and the probabilistic displacement 2D map is explored. Due to the Tabriz fault having a very high level of hazard in the future and due to the lack of instrumental data on this fault, there is increased uncertainty in the numerical calculations of this fault. The north Tabriz fault has a high level of danger because it passes through the fifth district of the city of Tabriz, and in the case of possible surface rupture, it might lead to much damage in this residential area. With 150 000 people and at 32 000 km2, this region has essential regions such as Baghmisheh, Elahieh, Rashidieh, etc. (Fig. 1). For the north Tabriz fault, due to the devastating large historical earthquakes and the possible rupture hazard of the north Tabriz fault in the future, using the probabilistic fault displacement hazard analysis (PFDHA) method is essential.
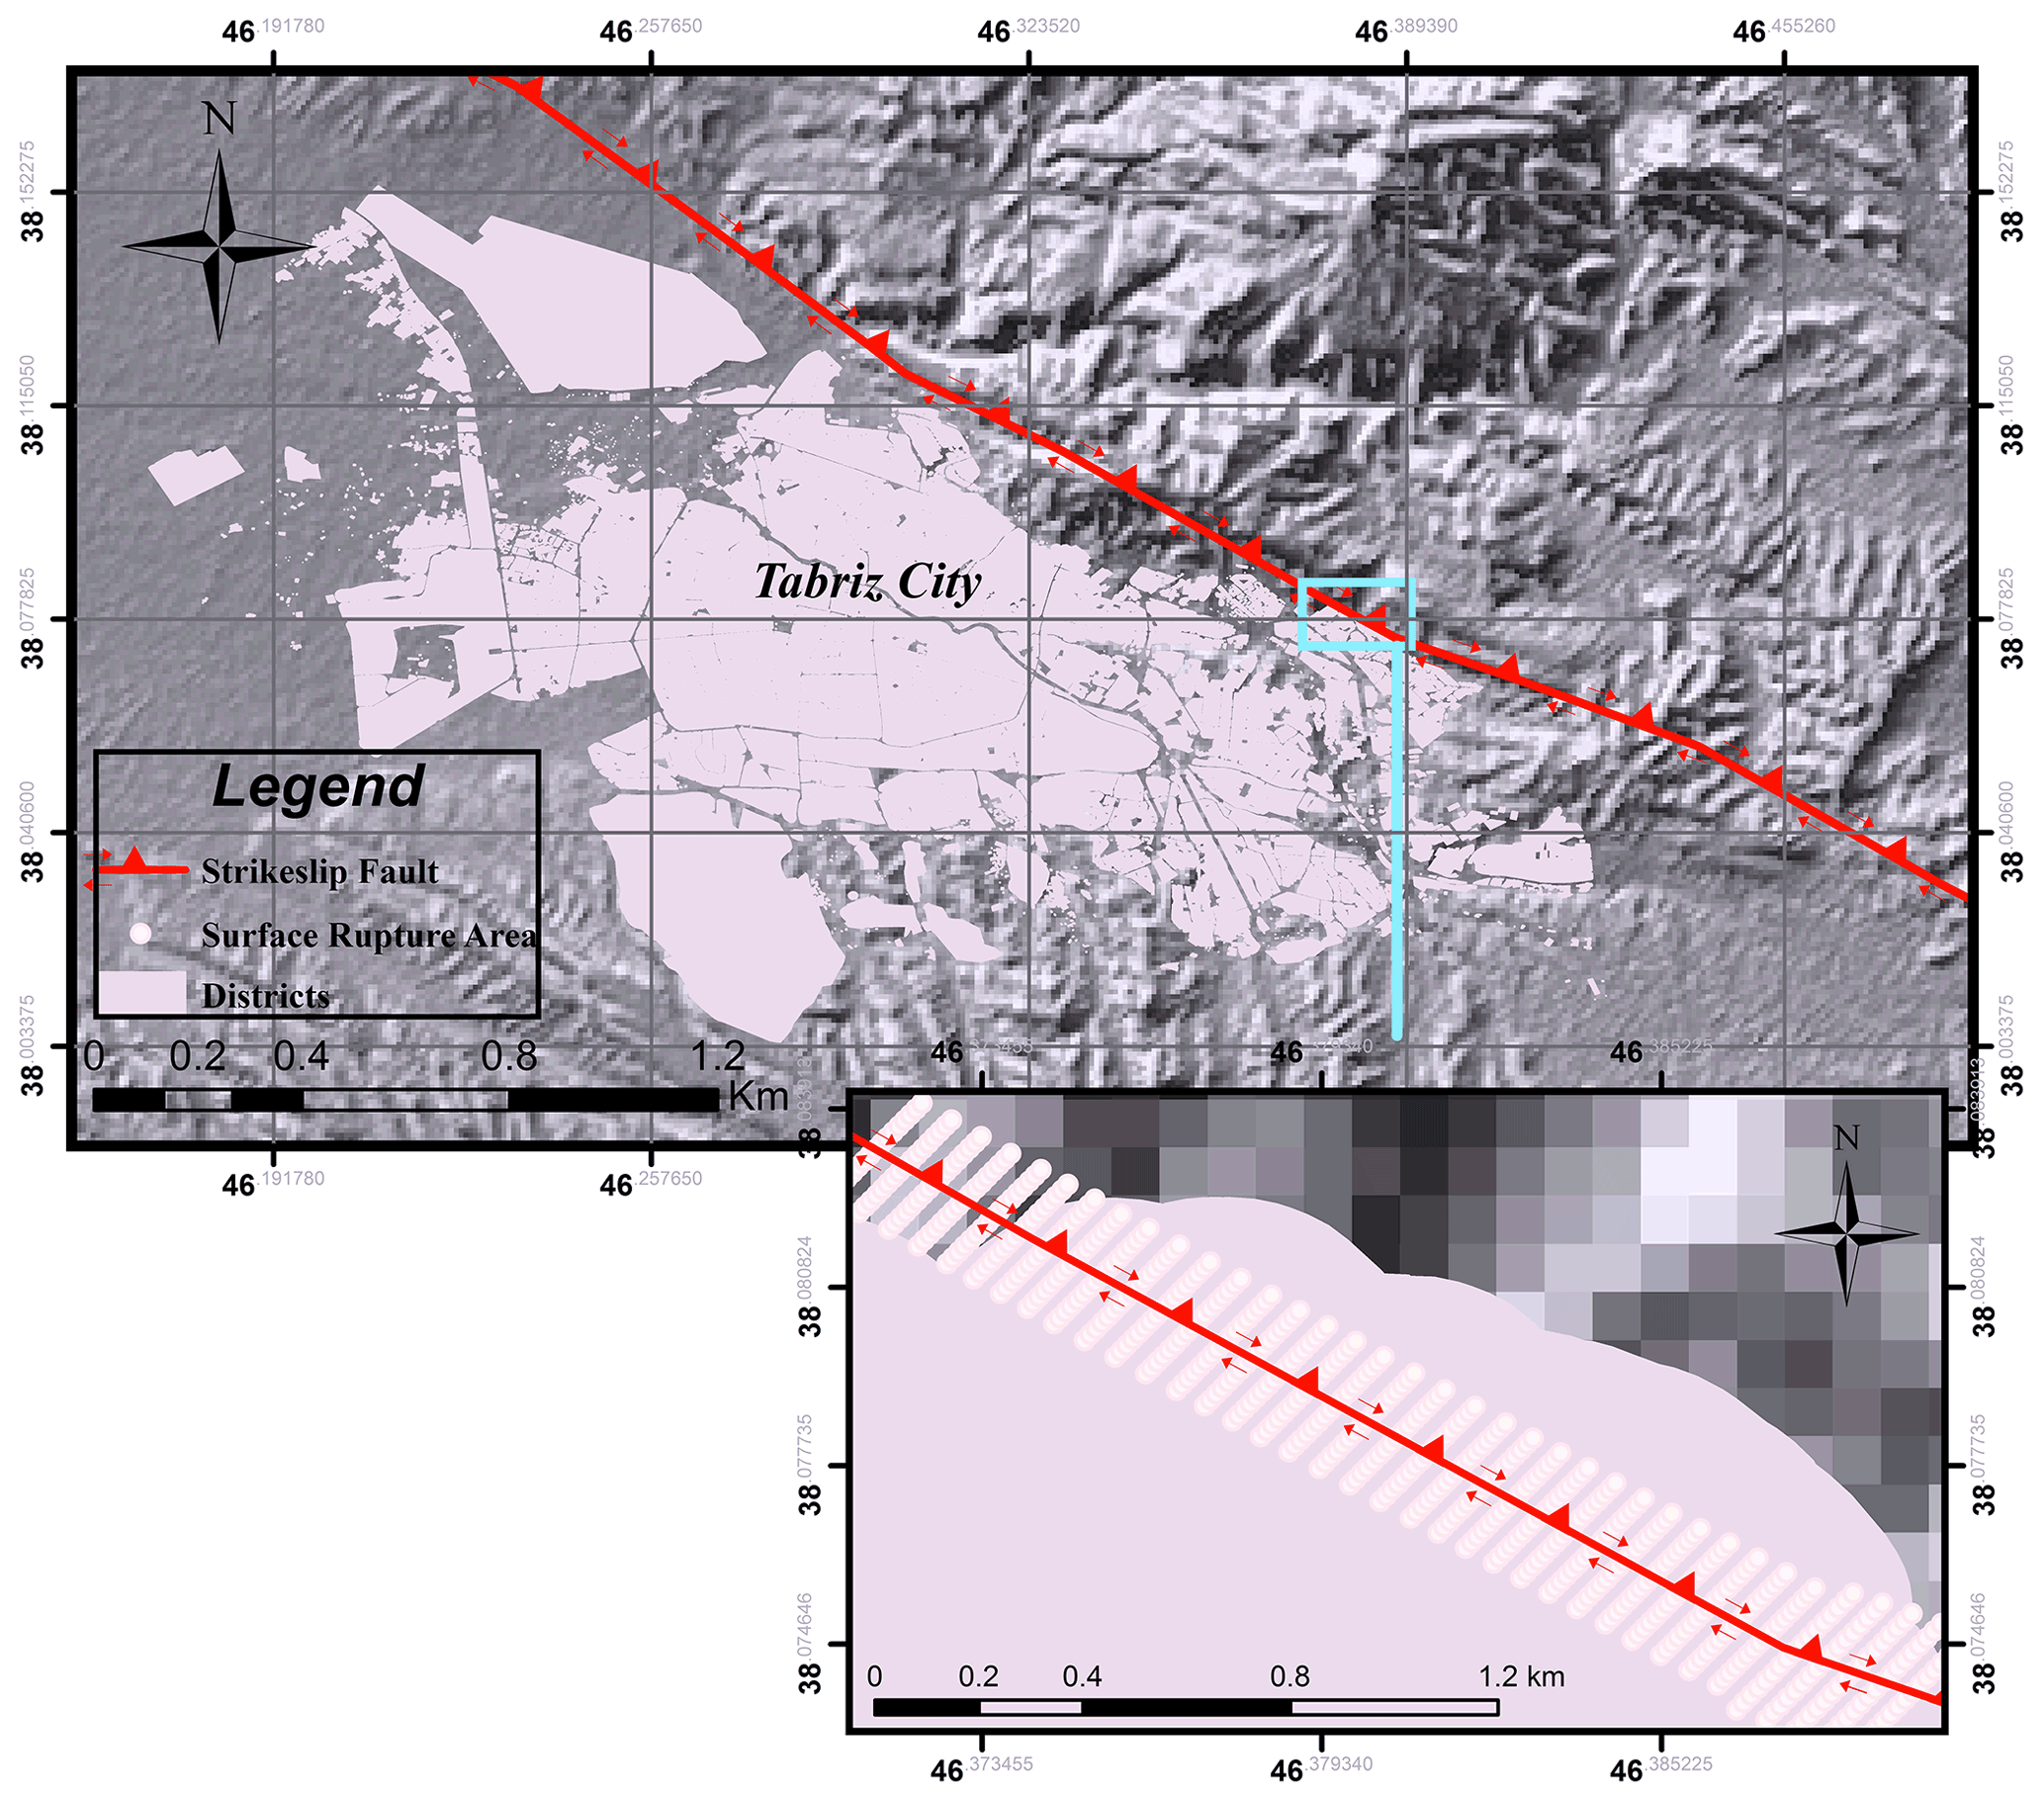
Figure 1The north Tabriz fault and its vicinity to the populated city of Tabriz with a part of this fault passing through the town. The probabilistic displacement area in the city of Tabriz is shown, assuming a simple fault trace (due to the lack of sufficient instrument data); these possible displacements can be seen up to a distance of ±150 m from the fault trace in the future. Figure 1 is generated using Google Earth with Digital Globe imagery (© Google Earth 2021).
With over 2 million people and an area of 167 km2 Tabriz, in northwestern Iran, is one of the most populated cities in the country that has experienced devastating earthquakes throughout history. One of the main problems of the city of Tabriz is the proximity of the city to the north Tabriz fault and the expansion of construction around it. Based on the reported historical earthquakes by Berberian and Arshadi (1976), since 858 CE, this city and the surrounding area have experienced several large and medium destructive earthquakes.
The focal mechanism of earthquakes in northwestern Iran and southeastern Turkey shows that the convergence between the Saudi and Eurasian plates becomes depreciable during right-lateral strike-slip faults. The strike-slip fault is the southeast continuation of the north Anatolian fault into Iran, consisting of discontinuous fault sections with a northwest–southeast extension (Jackson, 1992). Some of these fault fragments have been ruptured and left deformed from the earthquakes in 1930, 1966, and 1976 (Hessami et al., 2003).
Nevertheless, the north Tabriz fault is one of the components of this right-lateral strike-slip system, which has not had a major earthquake during the last two centuries. Among the many historical earthquakes in the Tabriz region, only two devastating earthquakes in 1042 and 1721 with a magnitude of Ms∼7.3 and one in 1780 with a magnitude of Ms∼7.4 were associated with a surface rupture along the north Tabriz fault (Hessami et al., 2003). The 1721 and 1780 AD earthquakes had at least 50 and 60 km of surface rupture (about 40 km overlap), respectively. Berberian (1997) believe that large earthquakes along the north Tabriz fault are concentrated at specific times and spatially related.
A more detailed study of the temporal distribution of earthquakes in Tabriz by Berberian and Yates (1999) also shows the cluster distribution of earthquakes over time. Due to the absence of seismic events for more than 200 years in the Tabriz area (decluttering period), the study area has passed the final stages of stress storage, and it is ready to release the stored energy. Therefore, Hessami et al. (2003) investigated the spatial-temporal concentration of earthquakes associated with the north Tabriz fault. Based on paleontological seismic studies on the western part of the north Tabriz fault, Hessami et al. (2003) introduced four earthquakes that occurred continuously on the western part of the north Tabriz fault. The return periods of these earthquakes were suggested to be 821±176 years. During each seismic event of the north Tabriz fault, the amount of right-lateral strike-slip displacement has been estimated at 3.5 to 4.5 m. In addition, Berberian (1997) considered the possibility of all parts of the north Tabriz fault fracturing at once and mentioned it as one of the critical issues in the earthquake hazard for the city of Tabriz in the northwestern region of Iran.
In this study, the method introduced by Petersen et al. (2011) has been used to estimate the probabilistic fault displacement hazard caused by the north Tabriz fault. Details of the mentioned method are provided in Petersen et al. (2011), and a summary of this approach is provided here.
Probabilistic seismic hazard analysis has been used since its development in the late 1960s and early 1970s to assess shaking hazards and establish seismic design parameters (Cornell, 1968). A method for analyzing the hazard of probabilistic fault displacement was introduced in two approaches of earthquake and displacement (Youngs et al., 2003). This method was first proposed to estimate the displacement of Yucca Mountain faults, which were the landfill of nuclear waste (Stepp et al., 2001). Then, the probabilistic fault displacement hazard analysis method was introduced for an environment with normal faults. The probability distributions obtained for each type of fault in the world can be used in areas with similar tectonics (Youngs et al., 2003).
The earthquake approach is similar to analyzing probabilistic seismic hazards related to displacement, features such as faults, partial shear, fracture, or unbroken ground at or near the ground surface. the attenuation relationships of the fault displacement replace the ground-shaking relationships. In the displacement approach, without examining the rupture mechanism, the displacement characteristics of the fault observed at the site are used to determine the hazard in that area.
The exceedance rate of displacements and the distribution of fault displacements are obtained directly from the fault characteristics of geological features (Youngs et al., 2003). To calculate the exceedance rate in the earthquake approach, relationships similar to probabilistic seismic hazard analysis were used. The rate of exceedance, vk(z), is calculated according to the Cornell relationship (Cornell, 1968) as follows (Youngs et al., 2003):
in which the ground motion parameter (Z) (maximum ground acceleration, maximum response spectral acceleration) exceeds the specified level (z) at the site (k). Considering Eq. (1) and calculating the exceedance rate of displacement (D) from a specific value (d), the displacement parameter replaces the parameters of ground motion (Youngs et al., 2003):
The expression P ( is the “attenuation function” of the fault displacement at or near the earth's surface. This displacement attenuation function is different from the usual ground motion attenuation function and includes the multiplication of the following two probabilities (Youngs et al., 2003):
where D and d are the displacements on the fault (principal fault) and displacement on the outside of the fault (distributed fault), respectively, and (x,y) are considered as coordinates of the site. r, I, L, and s are the vertical distance from the fault area, the distance of the site on the fault rupture to the nearest rupture, the total length of the fault surface rupture, and the rupture distance to the end of the fault, respectively. The definitions of these variables are shown in Fig. 2.

Figure 2Definition of the variables used in fault rupture analysis: x and y are site coordinates, z dimensions of the area intended to calculate the probability of fault rupture at the site (for example, dimensions of the building foundation), r the distance from the site to the fault trace, ratio the distance from the fault so that l is the measured distance from the nearest point on the rupture to the nearest end of the rupture, L the total length of the rupture, and s the distance from the end of the rupture to the end of the fault (Petersen et al., 2011).
The following equation has been used to obtain the exceedance rate of probabilistic displacement due to the principal fault (on the fault) (Petersen et al., 2011):
The magnitude of the earthquake is indicated by m in Eq. (4), and to assess the displacement hazard due to fault rupture, these probability density functions describe displacement potential due to earthquakes on or near a rupture (Petersen et al., 2011). In the following, each of the parameters for estimating probabilistic fault displacement hazard is described.
3.1 Probability density function
The probability density function determines the magnitude of the earthquake and the location of the ruptures on a fault. Since the magnitude and the rupture position on the causal fault are correlated, a probabilistic distribution is used to calculate these parameters. In the next step, the variability in the rupture location is considered. A probability density function fR(r) is considered to define the area of perpendicular distances (r) to the site to different potential ruptures (Petersen et al., 2011).
3.2 Probabilities
Probability is the ratio of cells with a rupture on the principal fault to the total number of cells considered. Therefore, the probability of surface rupture is considered due to a certain magnitude M due to faulting. According to Wells and Coppersmith's (1993) studies, due to empirical relationships between different fault parameters, probability has been obtained for different faults in the world, such as strike-slip, normal, and reverse. Therefore, in hazard analysis of fault displacement, it is necessary to investigate the possibility of surface rupture with magnitude (M) on the ground; so as a result, Eq. (5) introduced by Wells and Coppersmith (1993) can be used. According to this relation, the coefficients a and b are constant, and strike-slip faults with −12.51 and 2.553 have been reported. This relationship has a 10 % probability for the size of Mw∼5 and a 95 % probability of surface rupture for a magnitude of Mw∼7.5 (Paul C. Rizzo Associates, Inc., 2013).
This rupture probability was used to estimate the exceedance displacement rate because of earthquakes such as Loma Prieta in 1989 with a magnitude of Mw∼6.9 and Alaska in 2002 with a magnitude of Mw∼6.7. These earthquakes did not cause a rupture to reach the earth's surface. Therefore, these two earthquakes did not cause surface deformation and are considered non-tectonic phenomena (Petersen et al., 2011). The expression indicates the probability of non-zero displacement at a distance r from the rupture in an area of size z2 and the magnitude event m associated with the surface rupture. The probability for displacements more significant than or equal to the value given at this site is intended for the principal displacement (on the fault). This probability is obtained by integrating around a log-normal distribution (Petersen et al., 2011).
3.3 Rate parameter α(m)
When the potential magnitude of an earthquake of a certain magnitude is modeled, it is possible to estimate how often these ruptures occur. The α(m) rate parameter describes the frequency of repetition of these earthquakes in this model. This parameter is a function of magnitude and can only function as a single rupture function or a function of cumulative earthquakes above the magnitude of the minimum importance in engineering projects (Youngs et al., 2003). This parameter is usually based on slip rate, paleoseismic rate of large earthquakes, or historical fault rate earthquakes and is described in earthquake units per year. By removing the α(m) parameter from Eq. (4), the deterministic fault displacement hazard can be estimated (Petersen et al., 2011).
3.4 Cell size
In calculating the hazard of principal fault displacements, as shown in Eq. (4), the hazard level will not change by changing the cells' size. This parameter can be examined by the availability of principal displacement data in the study area. In calculating the hazard of distributed rupture (distributed displacement), considering the method of Youngs et al. (2003), the probability of surface rupture was investigated by modeling secondary displacements up to a distance of 12 km from the fault. According to studies by Petersen et al. (2011), the relationship between the calculations of the probability of rupture of the principal faults, Eq. (5), in calculating the probability of rupture of the distributed faults became the following relationship (Petersen et al., 2011):
The values of the coefficients used for the cell sizes of 25×25 m to 200×200 m in the above relationship are given in Table 1 (Petersen et al., 2011).
Table 1Probability of distributed rupture for different cell sizes (Petersen et al., 2011).

3.5 Surveying accuracy
The accuracy of fault location is a function of geological and geomorphic conditions that play an essential role in diagnosing and interpreting a geologist in converting this spatial information into geological maps and fault geographic information systems. A fault map is generated using aerial photography imagery, the interpretation of fault patterns from geomorphology, and the conversion of fault locations into a base map. In many cases, identifying the location and trace of the fault may be difficult because sediments and erosion may obscure or cover the fault surface, leading to more uncertainty in identifying the actual location of the fault. Therefore, trace-mapped faults are divided into four categories – accurate, approximate, inferred, and concealed – based on how clearly and precisely they are located (Petersen et al., 2011).
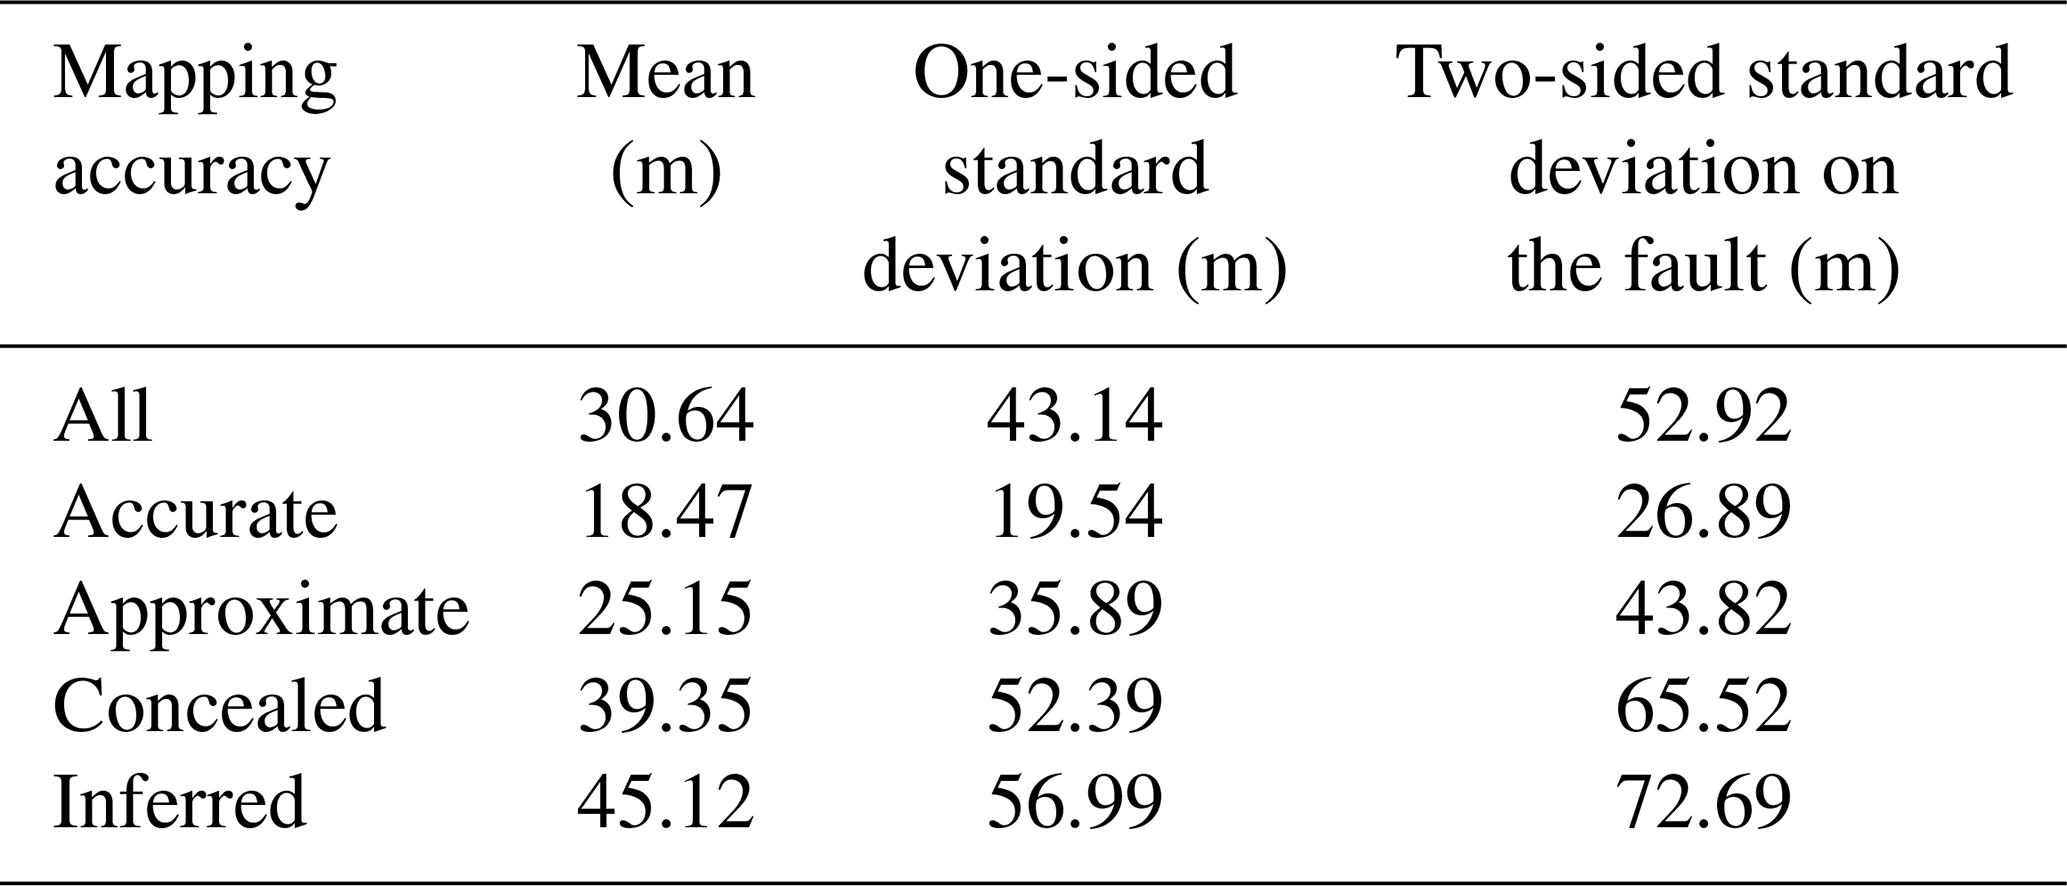
A practical example shows that for an active fault with large earthquakes repeated over several hundred years, fault rupture hazard analysis should be a critical topic for designing structures or pipelines close to this fault. If the fault has a complex or straightforward trace, construction within a distance of 150 and 300 m, respectively, from the fault should be avoided. Table 2 summarizes the standard deviations for the displacements observed in strike-slip earthquakes for different classifications of mapping accuracy (Petersen et al., 2011). The mean displacement will be obtained according to the exponential values obtained from these fitting equations. The following equation has been used to obtain the mean displacement (Petersen et al., 2011):
Table 2Summary of mapping accuracy: the measured distance from the mapped fault trace to the observed surface rupture (Petersen et al., 2011).
3.6 Epistemic and aleatory uncertainty
There are uncertainties about the quality of mapping and the complexity of the fault trace that lead to epistemic uncertainty at the site of future faults. The probability density function for r includes both epistemic and aleatory components. Displacements on and off the principal fault can include epistemic uncertainty and random variability. Epistemic uncertainty is related to displacement measurement errors along the fault rupture. Random variability is related to the natural variability in fault displacements between earthquakes. However, the measured rupture variability involves epistemic mapping uncertainties because there are currently no data to separate these uncertainties. In addition, epistemic uncertainty of location is introduced due to limitations in the accuracy of basic maps or images and the accuracy of the equipment used to transfer this information to the map or database (Petersen et al., 2011).
3.7 Attenuation relationship of strike-slip faults
In this study, to estimate the probabilistic displacement of the north Tabriz fault, the attenuation relationship of Petersen et al. (2011) has been used. The rupture displacement data obtained from the principal fault are scattered but are generally the most scattered near the fault rupture center and decrease rapidly toward the end of the rupture. In some earthquakes, including the Borgo Mountain earthquake in 1968, the most significant displacement was observed near the end of the fault surface rupture (Petersen et al., 2011). Many collected surface rupture data behave asymmetrically ruptured (Wesnousky, 2008).
However, there is no way to determine surface rupture areas with larger displacements. Thus, the distribution of asymmetric displacements along the length of a fault will define more considerable uncertainties, especially near the end of the fault rupture (Petersen et al., 2011). In studying the distribution and principle displacement, two different approaches are introduced by Petersen et al. (2011). In the first approach, the best-fit equations using the least-squares method related to the natural logarithm of magnitude and distance displacement ratio were developed in a multivariate analysis (Paul C. Rizzo Associates, Inc., 2013).
In the second approach, the average displacement normalizes the displacement data as a distance function. In normalized analysis, magnitude is not directly considered but influences calculations through the presence of magnitude in the mean displacement, calculated through Wells and Coppersmith's (1994) studies. Three models (bilinear, elliptical, and quadratic) were considered to provide the principal fault displacement in multivariate and normalized analysis (Petersen et al., 2011).
However, in multivariate analysis, the three models introduced have the same aleatory uncertainty, and there is no clear basis for preferring one model to the other models. As a result, in the probabilistic displacement hazard analysis, all three models with the same weights were used according to Table 3. The results obtained from the multivariate analysis were preferred over the normalized analysis because, in the normalized analysis, the stochastic uncertainty of calculating the mean displacement from the Wells and Coppersmith (1994) study is added to the stochastic uncertainty of the results of the Petersen attenuation relationships (Paul C. Rizzo Associates, Inc., 2013).
Table 3Different models used in principal fault attenuation relationships (Petersen et al., 2011).
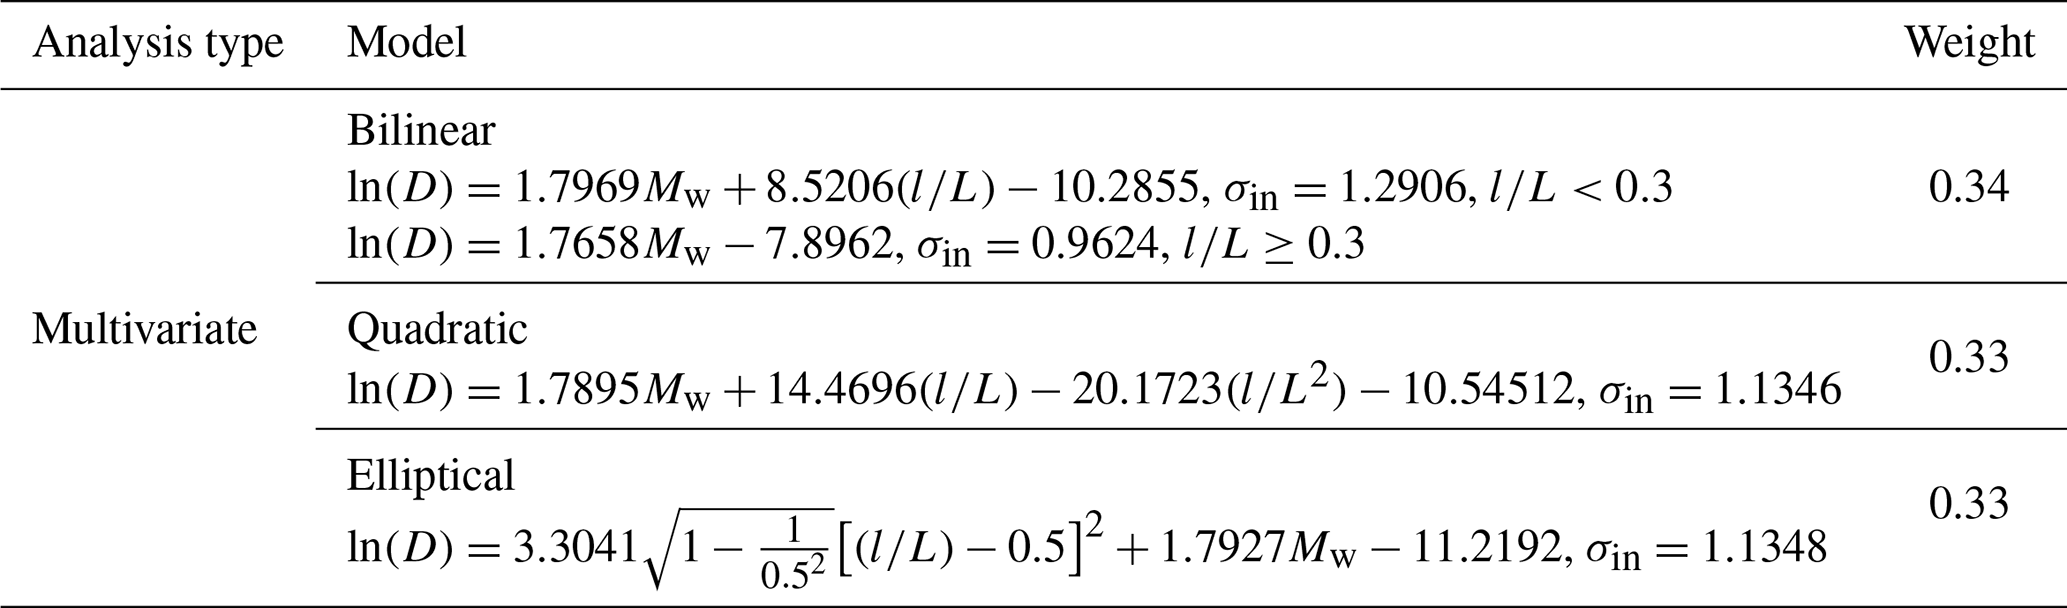
In this study, multivariate analysis and probabilistic displacement estimation have been used in the three models mentioned. The equation of the three models is obtained in the multivariate method as shown in Table 3, and 5 % uncertainty was considered in the modeling of the strike-slip displacement data (Petersen et al., 2011).
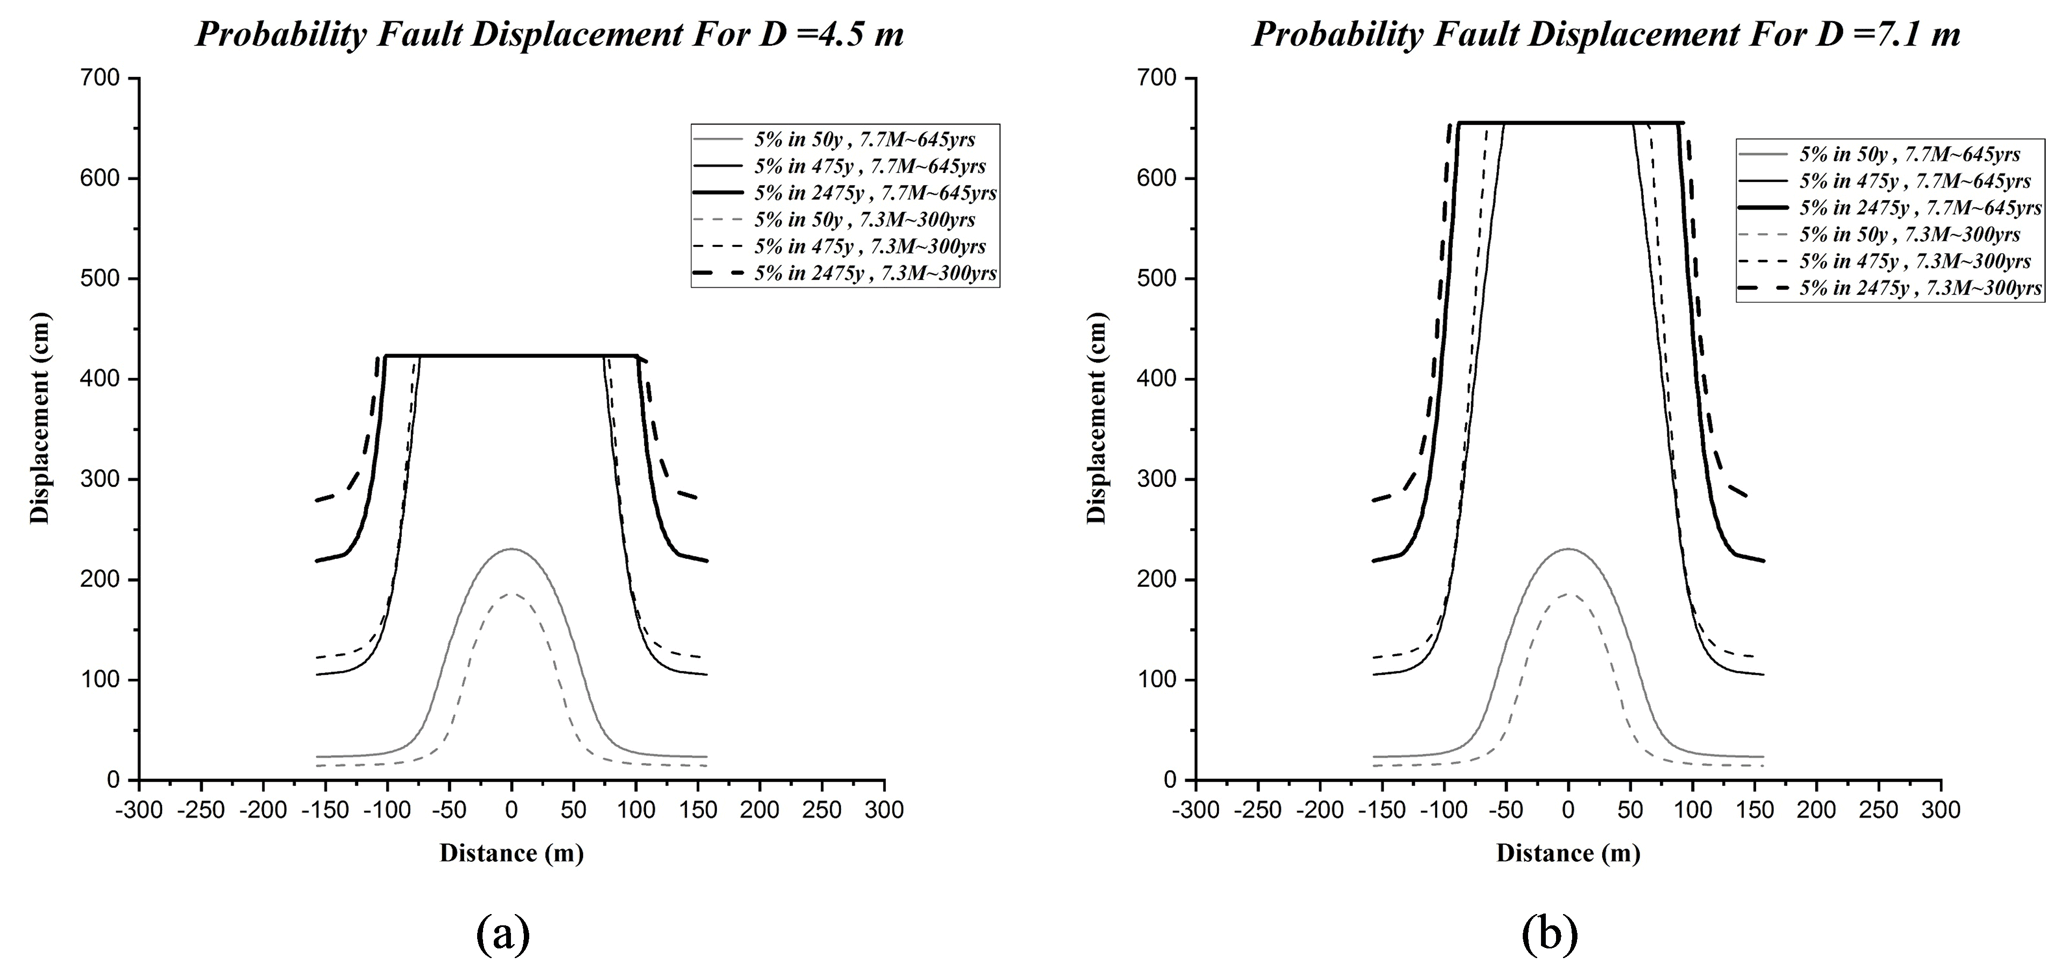
Figure 3Comparison of probability displacement: 5 % exceedance rate in 50, 475, and 2475 years for (a) D=4.5 m and (b) D=7.1 m.
4.1 Probabilistic displacement of north Tabriz fault
Assuming the mechanism of strike-slip and trace of the Tabriz fault as a simple trace (due to the lack of surface ruptures in instrumental data), as well as considering two scenarios (Mw∼7.7, 645 years, and Mw∼7.3, 300 years) and a fault section with a length of 50–60 km (as a probabilistic surface rupture in future), the probabilistic displacement and the annual exceedance rate are estimated by considering one of the sites located on the Tabriz fault trace related to the entire segment as shown in Fig. 1. Also, for each scenario, two values of displacement (0 to 4.5 m and 0 to 7.1 m) were considered according to Hessami et al. (2003) and Ghassemi et al. (2016), respectively. Furthermore, considering the reported method by Petersen et al. (2011), the probabilistic displacements for an exceedance rate of 5 % in 50, 475, and 2475 years for the principal probabilistic displacements (on the fault) of the north Tabriz fault have been explored. The obtained results in this study can be summarized as follows.
In the displacement of 4.5 m, maximum displacements for the first scenario (Mw∼7.7, 645 years) for 5 % in 50, 475, and 2475 years were estimated at 186, 469, and 469 cm. For the second scenario (Mw∼7.3, 300 years), the maximum displacements were calculated at 230, 469, and 469 cm, respectively, as shown in Fig. 3a. In the displacement of 7.1 m, the maximum displacements for the first scenario of Mw∼7.7 and 645 years for 5 % in 50, 475, and 2475 years were estimated at 186, 655, and 655 cm. For the second scenario (Mw∼7.3, 300 years), the maximum displacements were calculated at 230, 655, and 655 cm, respectively, as shown in Fig. 3b. According to the results shown in Fig. 3a and b, although the estimated maximum displacement values are equal at some distances, at farther distances perpendicular to the assumed site, these numerical values are different from each other.
For both scenarios (Mw∼7.7, 645 years, and Mw∼7.3, 300 years), maximum displacements for 5 % in 475 years were observed to a distance of 60 m perpendicular to the assumed site. For the first scenario (Mw∼7.7, 645 years), maximum displacements for 5 % in 2475 years using probability displacements of 0 to 4.5 m and 0 to 7.1 m were calculated up to 100 and 80 m perpendicular to the assumed site, respectively. For the second scenario (Mw∼7.3, 300 years), the maximum displacement for 5 % in 2475 years using probability displacement of 0 to 4.5 m and 0 to 7.1 m were observed to 80 m and 40 m perpendicular to the assumed site, respectively.
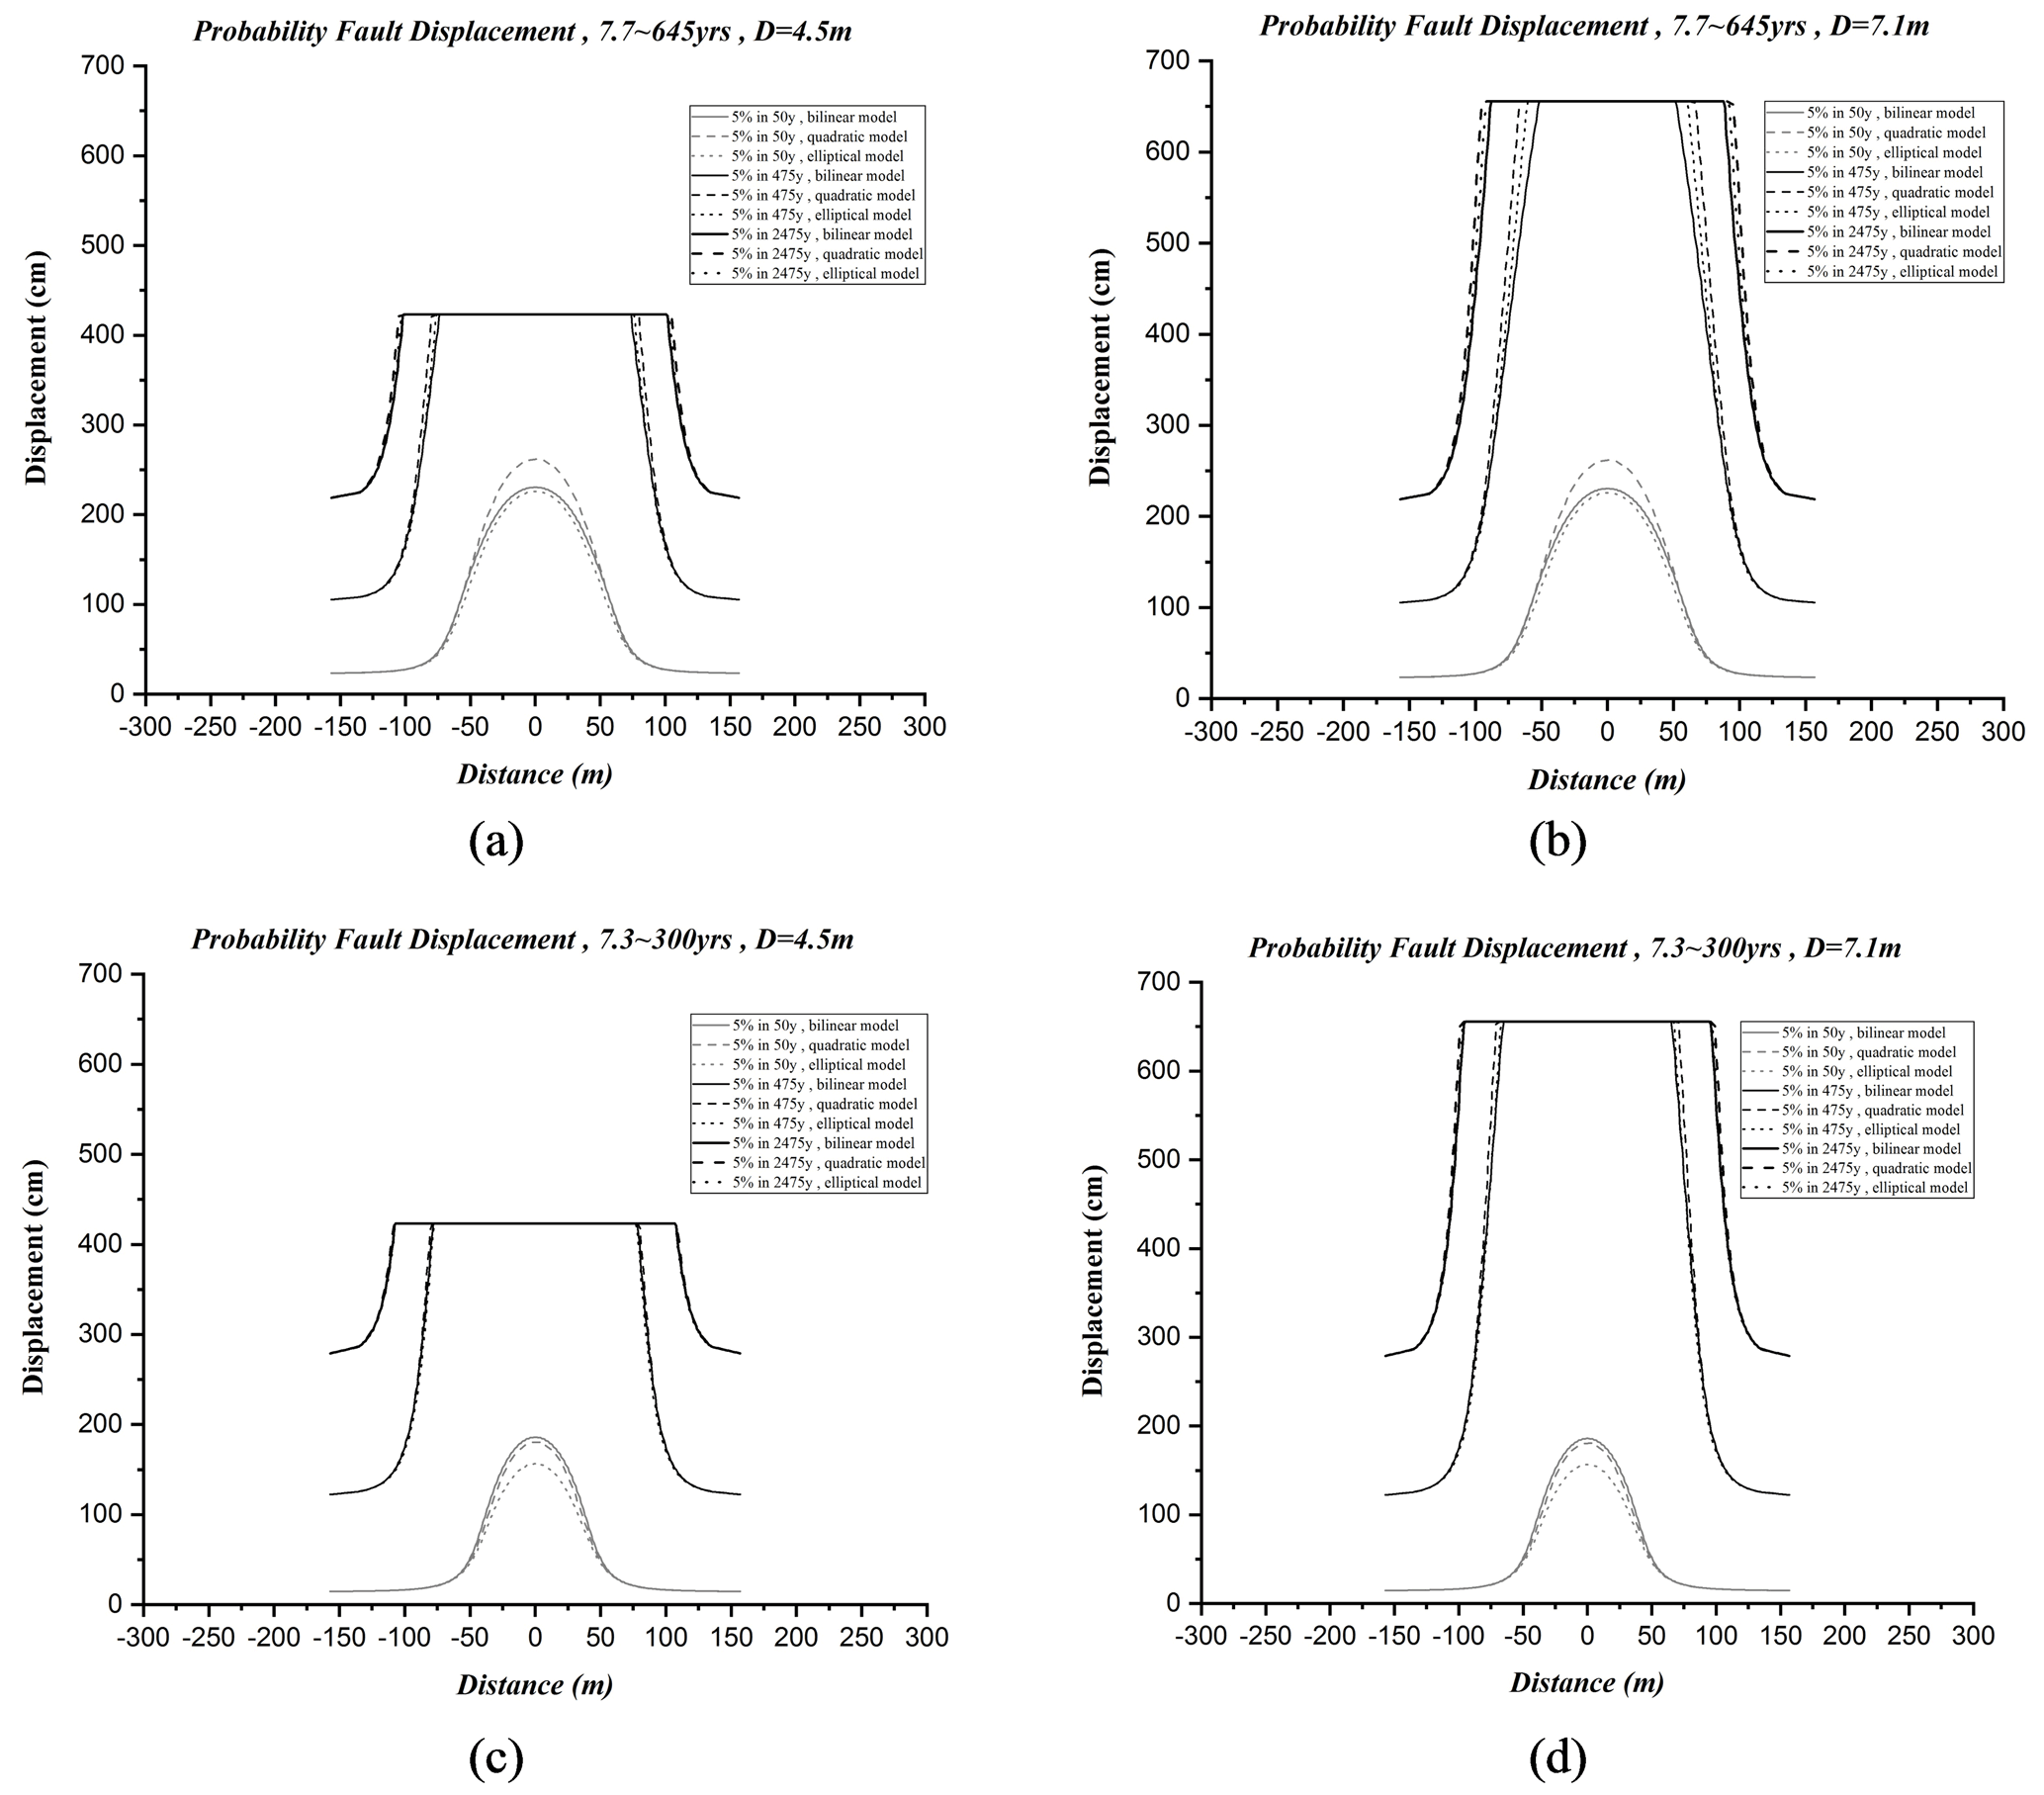
Figure 4Comparison of probability displacement, different fitting models for (a) 645-year return period and D=4.5 m, (b) 645-year return period and D=7.1 m, (c) 300-year return period and D=4.5 m, and (d) 300-year return period and D=7.1 m.
4.2 Comparison of different fitting models
The fitting models (bilinear, elliptical, and quadratic) have similar uncertainties. In this study, the bilinear model is used to obtain probabilistic displacements. In Fig. 4, estimated probability displacement has been compared using different fitting models.
4.3 Annual exceedance rate of 5 % in 50 years
In the next step, for both 4.5 and 7.1 m displacements, the annual exceedance rate of 5 % in 50 years, at distances of 64 and 120 m from the assumed site, has been examined and shown in Fig. 5. For both scenarios (Mw∼7.7, 645 years, and Mw∼7.7, 645 years), the results are shown in Fig. 5a and b. In the case of displacement of 4.5 m, the annual exceedance rates of displacement of D=4 m at distances of 64 and 120 m for the first and second scenarios are , , , and , respectively. In the case of displacement of 7.1 m, the annual exceedance rates of displacement of D=4 m at distances of 64 and 120 m for the first and second scenarios are estimated as , , , and , respectively.
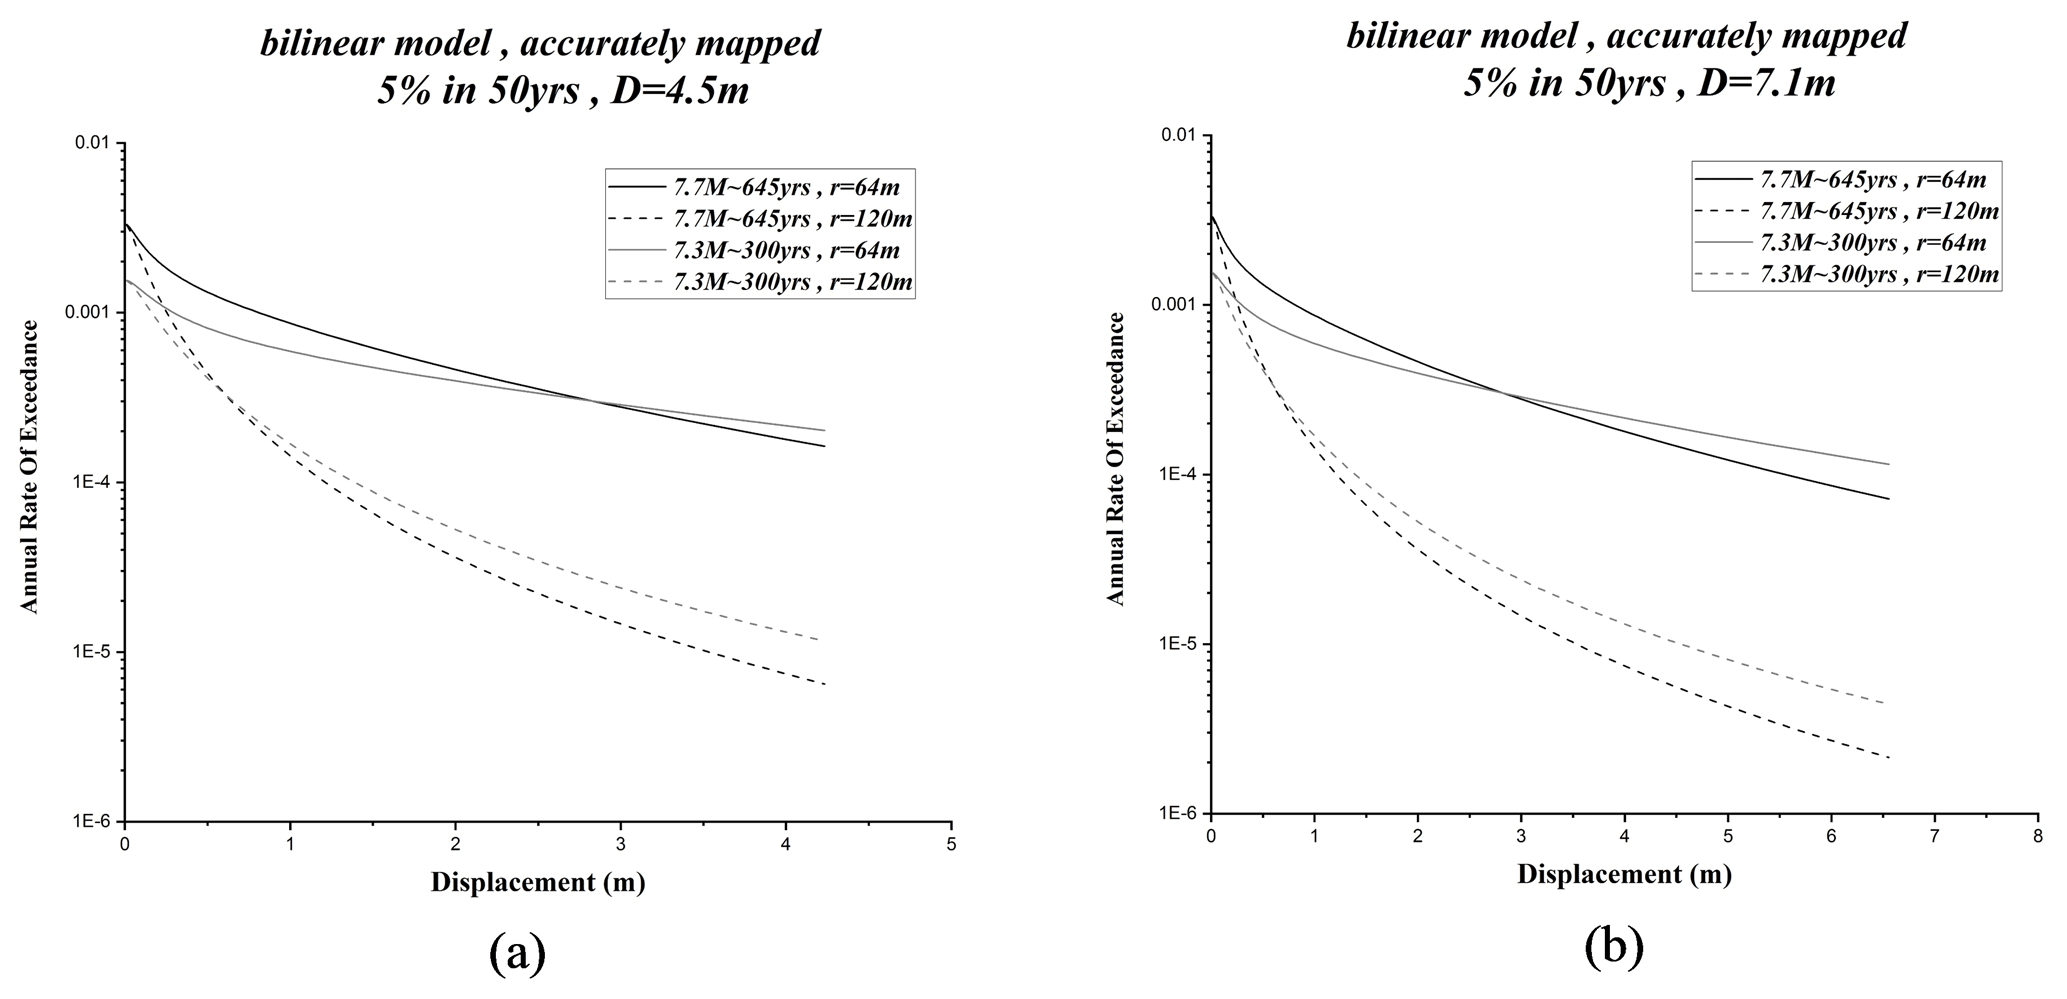
Figure 5Comparison of the annual exceedance rate of displacement for (a) D=4.5 m displacement and (b) D=7.1 m displacement.
4.4 Probabilistic displacement of the north Tabriz fault
According to passing a part of the north Tabriz fault through the fifth district of Tabriz city, estimating the probabilistic displacement in this area is of great importance, and predicting the areas with a higher level of surface rupture hazard is an important matter.
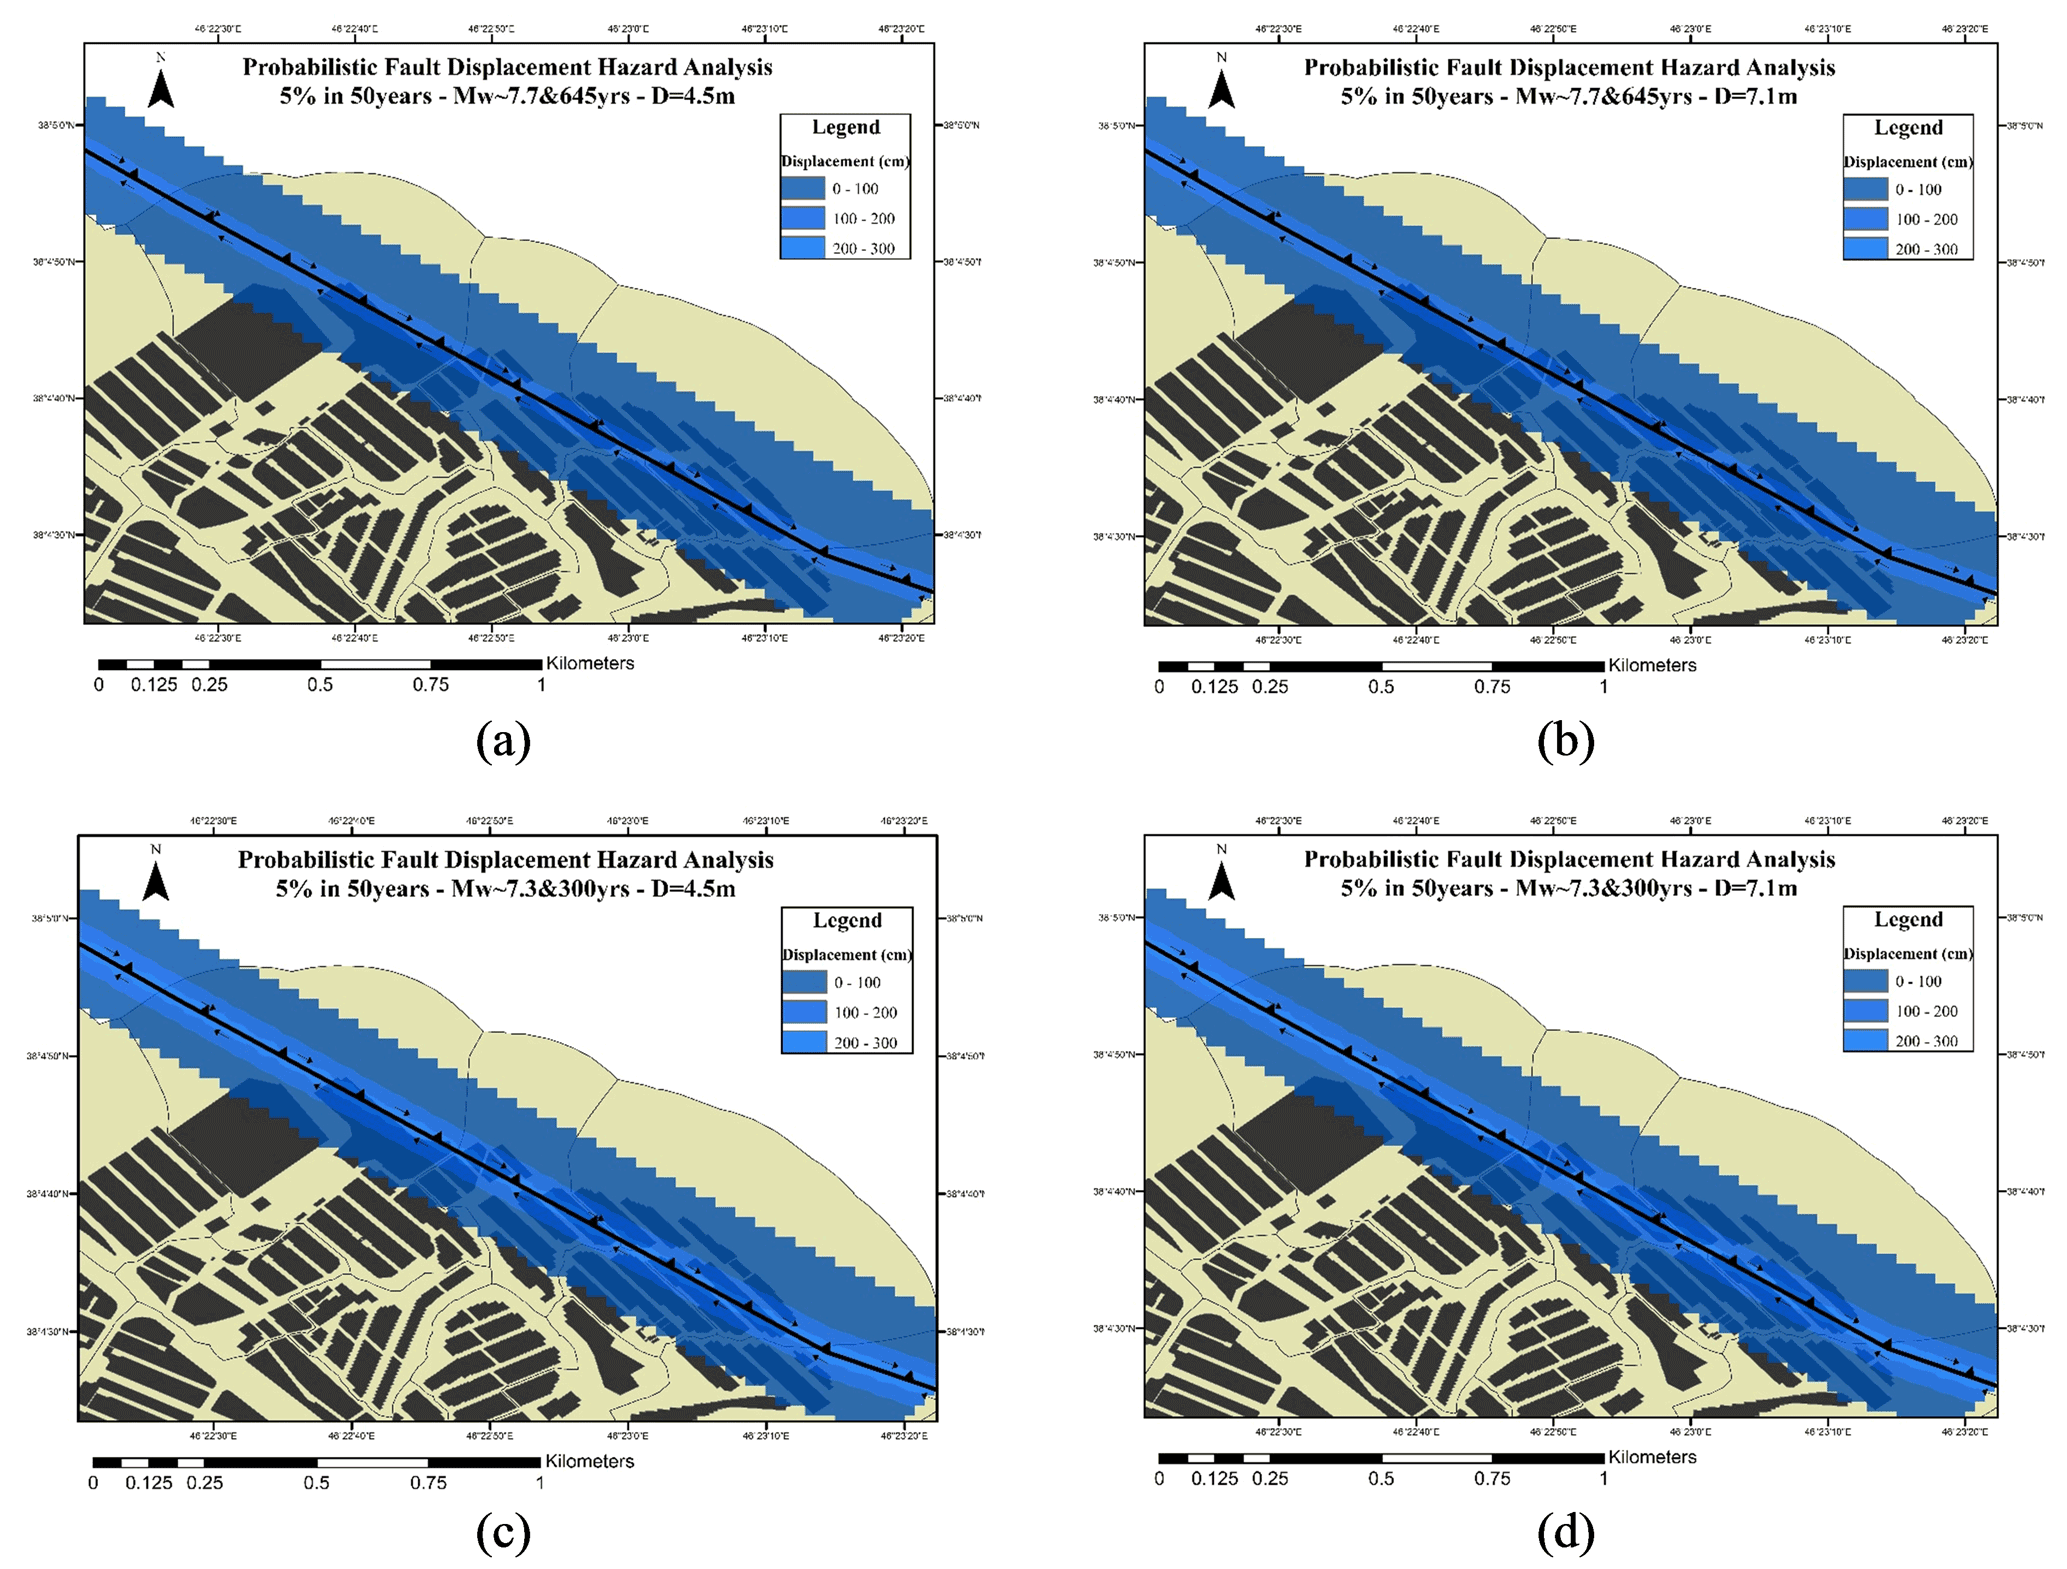
Figure 6Fault displacement hazard map for a 5 % probability of exceedance in 50 years for (a) Mw∼7.7 and return period of 645 years for D=4.5 m, (b) Mw∼7.7 and return period of 645 years for D=7.1 m, (c) Mw∼7.3 and return period of 300 years for D=4.5 m, and (d) Mw∼7.3 and return period of 300 years for D=7.1 m.
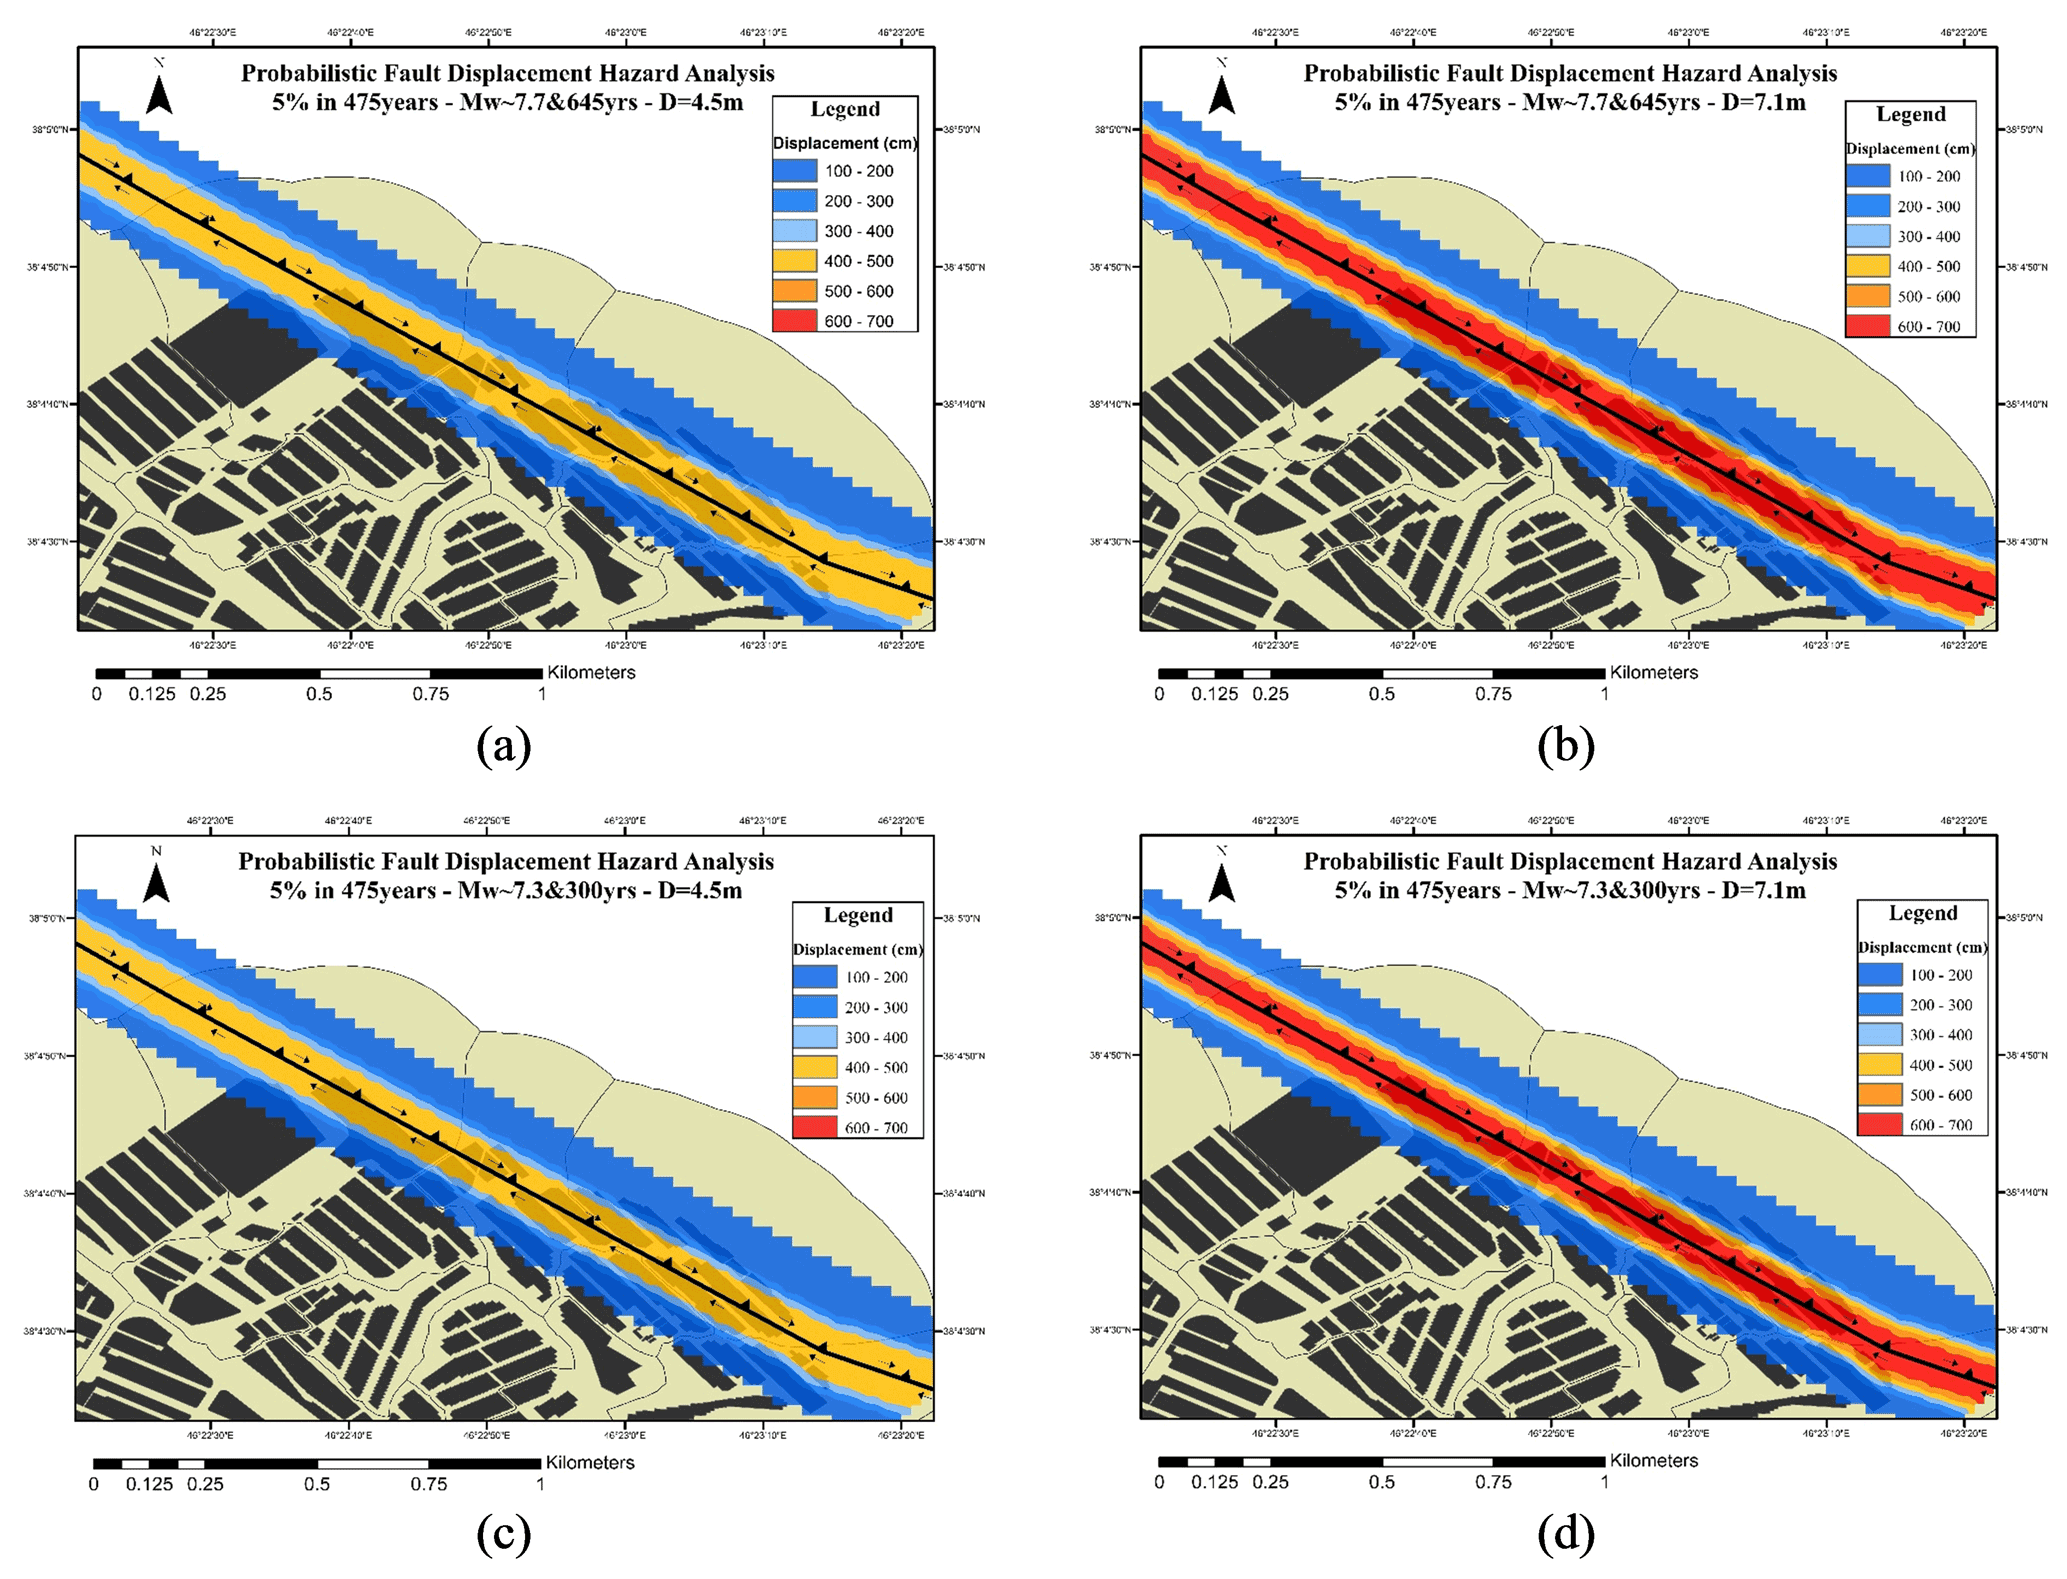
Figure 7Fault displacement hazard map for a 5 % probability of exceedance in 475 years for (a) Mw∼7.7 and return period of 645 years for D=4.5 m, (b) Mw∼7.7 and return period of 645 years for D=7.1 m, (c) Mw∼7.3 and return period of 300 years for D=4.5 m, and (d) Mw∼7.3 and return period of 300 years for D=7.1 m.
Considering a section with a length of 2 km from the north Tabriz fault according to Figs. 6, 7, and 8, the possible 2D displacements for the north Tabriz fault have been estimated. Figure 6 shows the probabilistic displacement of the two scenarios for 5 % in 50 years (by the blue color spectrum). The probabilistic displacements for the 4.5 and 7.1 m displacements for the first scenario are shown in Fig. 6a and b, and for the second scenario, results are shown in Fig. 6c and d, respectively. For the second scenario, the probabilistic displacement values have a higher level of hazard that can be seen at greater distances from the assumed sites. The probabilistic displacements of two scenarios for 5 % in 475 and 2475 years are shown in Figs. 7 and 8, respectively (using the blue to red color spectrum).
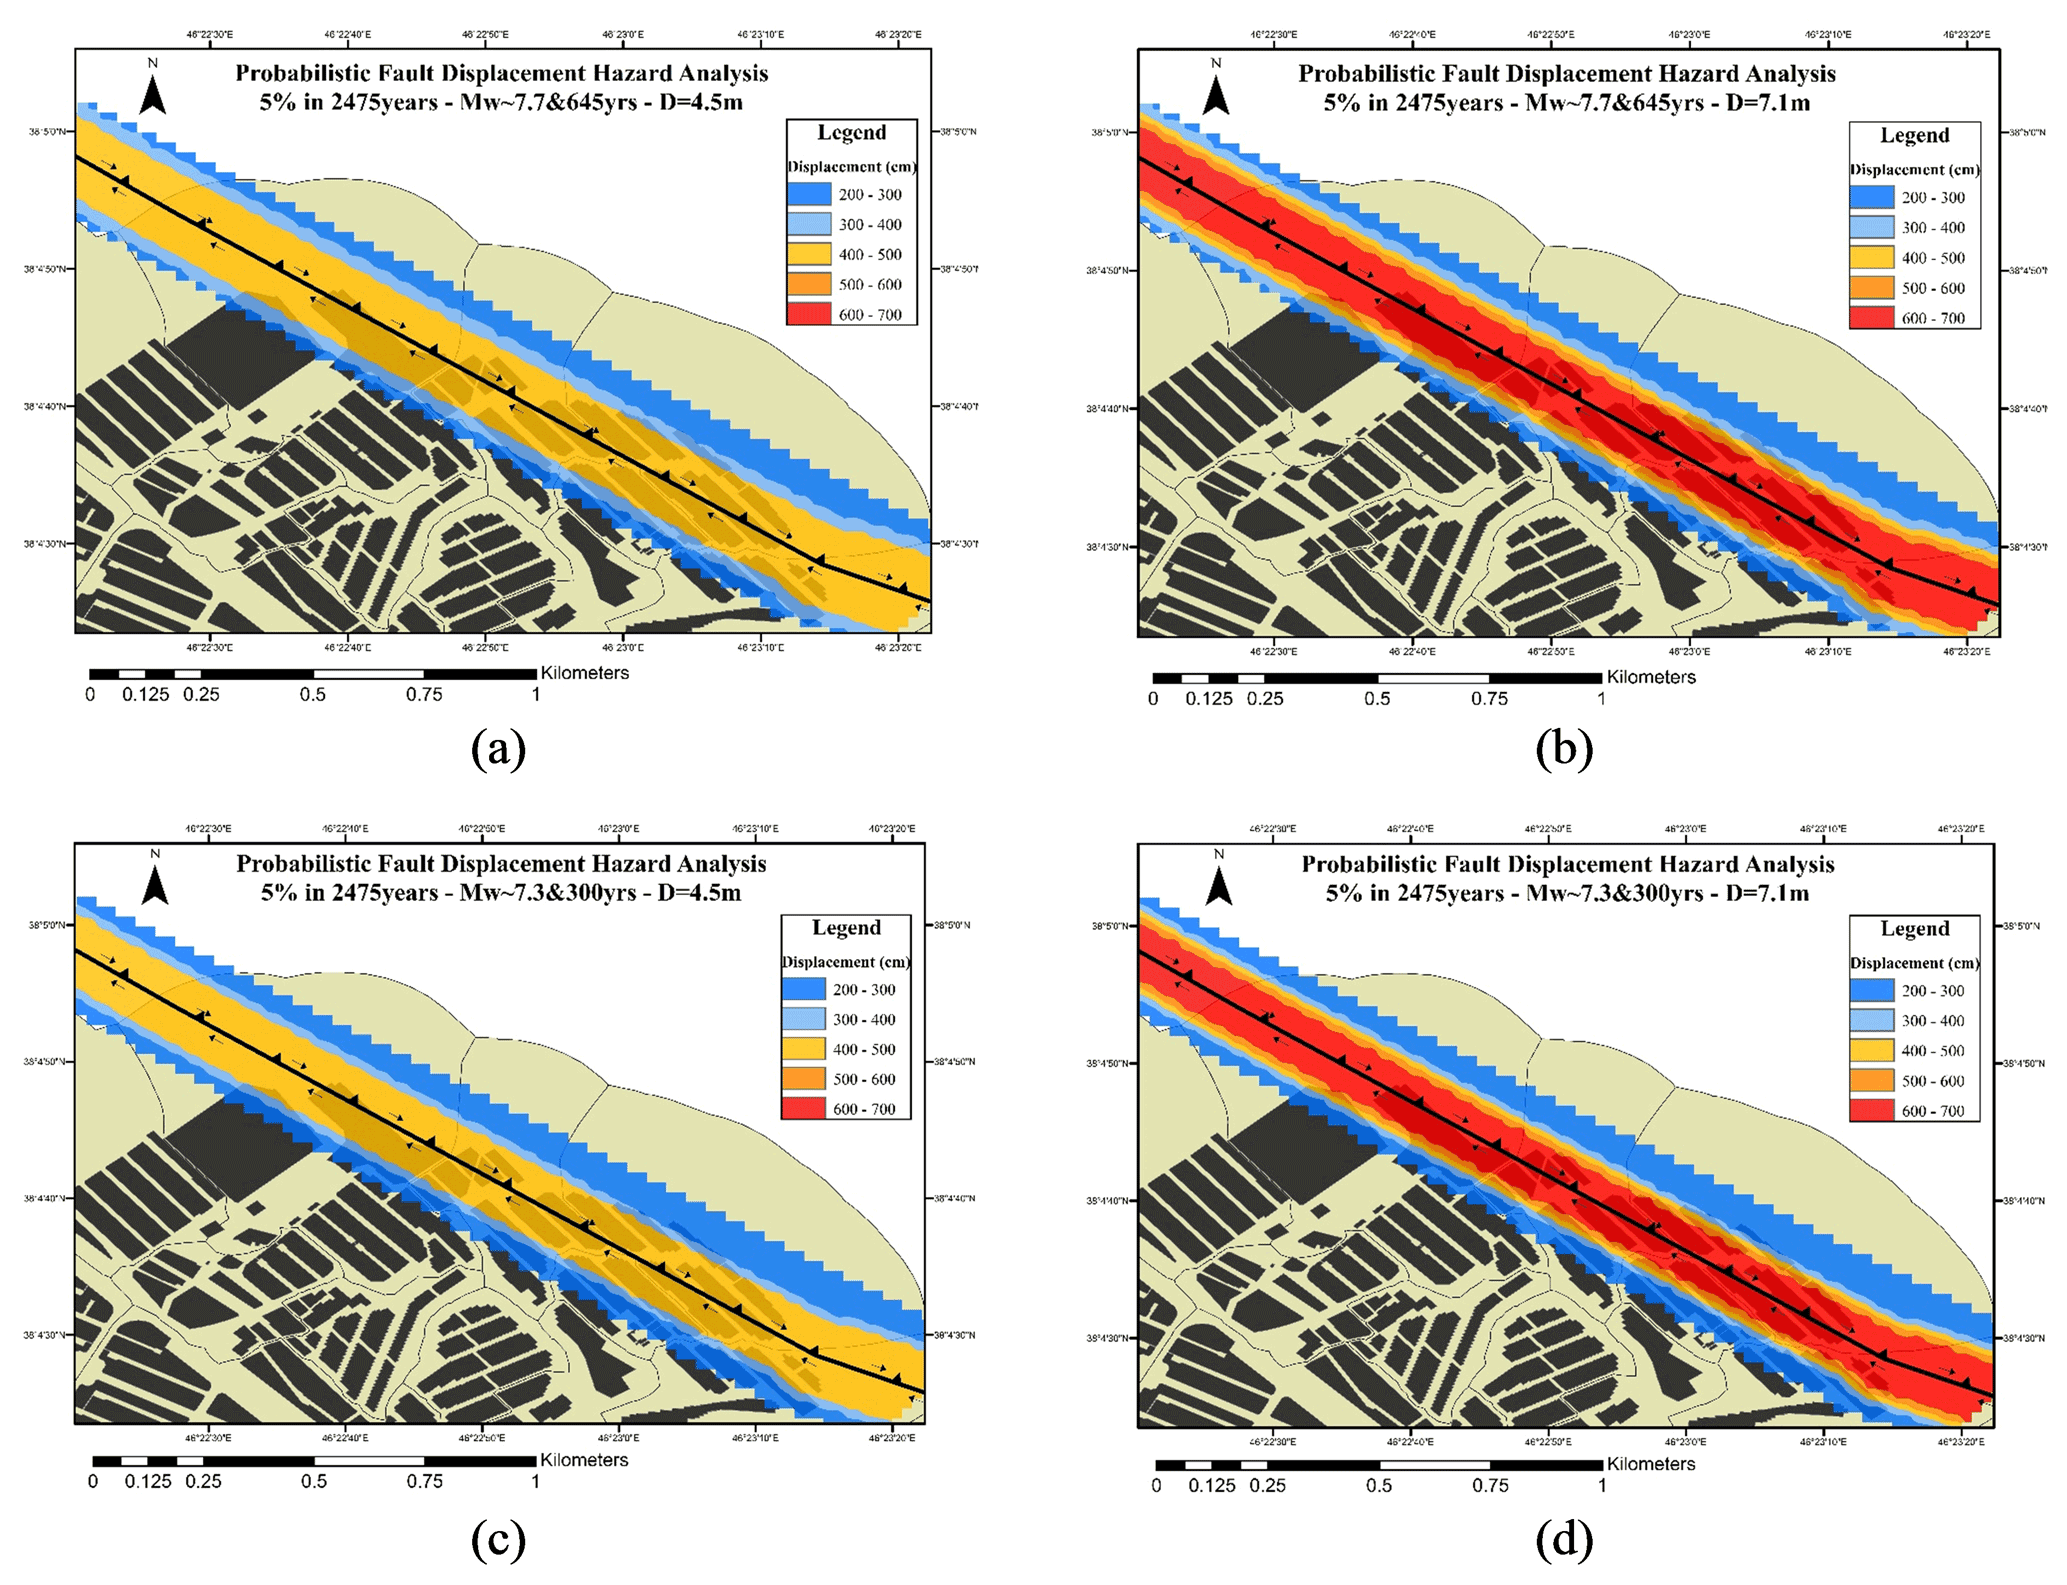
Figure 8Fault displacement hazard map for a 5 % probability of exceedance in 2475 years for (a) Mw∼7.7 and return period of 645 years for D=4.5 m, (b) Mw∼7.7 and return period of 645 years for D=7.1 m, (c) Mw∼7.3 and return period of 300 years for D=4.5 m, and (d) Mw∼7.3 and return period of 300 years for D=7.1 m.
The values of displacement perpendicular to the assumed site and the amount of probability hazard in the area were investigated and are illustrated in Fig. 9. The two scenarios (Mw∼7.7, 645 years, and Mw∼7.3, 300 years) were compared. According to Fig. 9a, for 5 % in 50 years, the scenario Mw∼7.3 and 300 years has a higher hazard level and can be considered the worst-case scenario. The numerical value of the displacement is obtained equally in the two displacement cases (4.5 and 7.1 m). The first scenario, given that it has a larger magnitude than the second scenario (Δm=0.4) but due to the higher return period, has a lower hazard level than the second scenario. At about 5 % in 50 years as shown in Fig. 9a, the second scenario has a higher level of hazard than the first scenario due to the shorter return period. In the case of 5 % in 475 and 2475 years, according to Fig. 9b and c, unlike the case of 50 years, the first scenario has a higher level of hazard and is more critical and can be considered as the worst-case scenario.
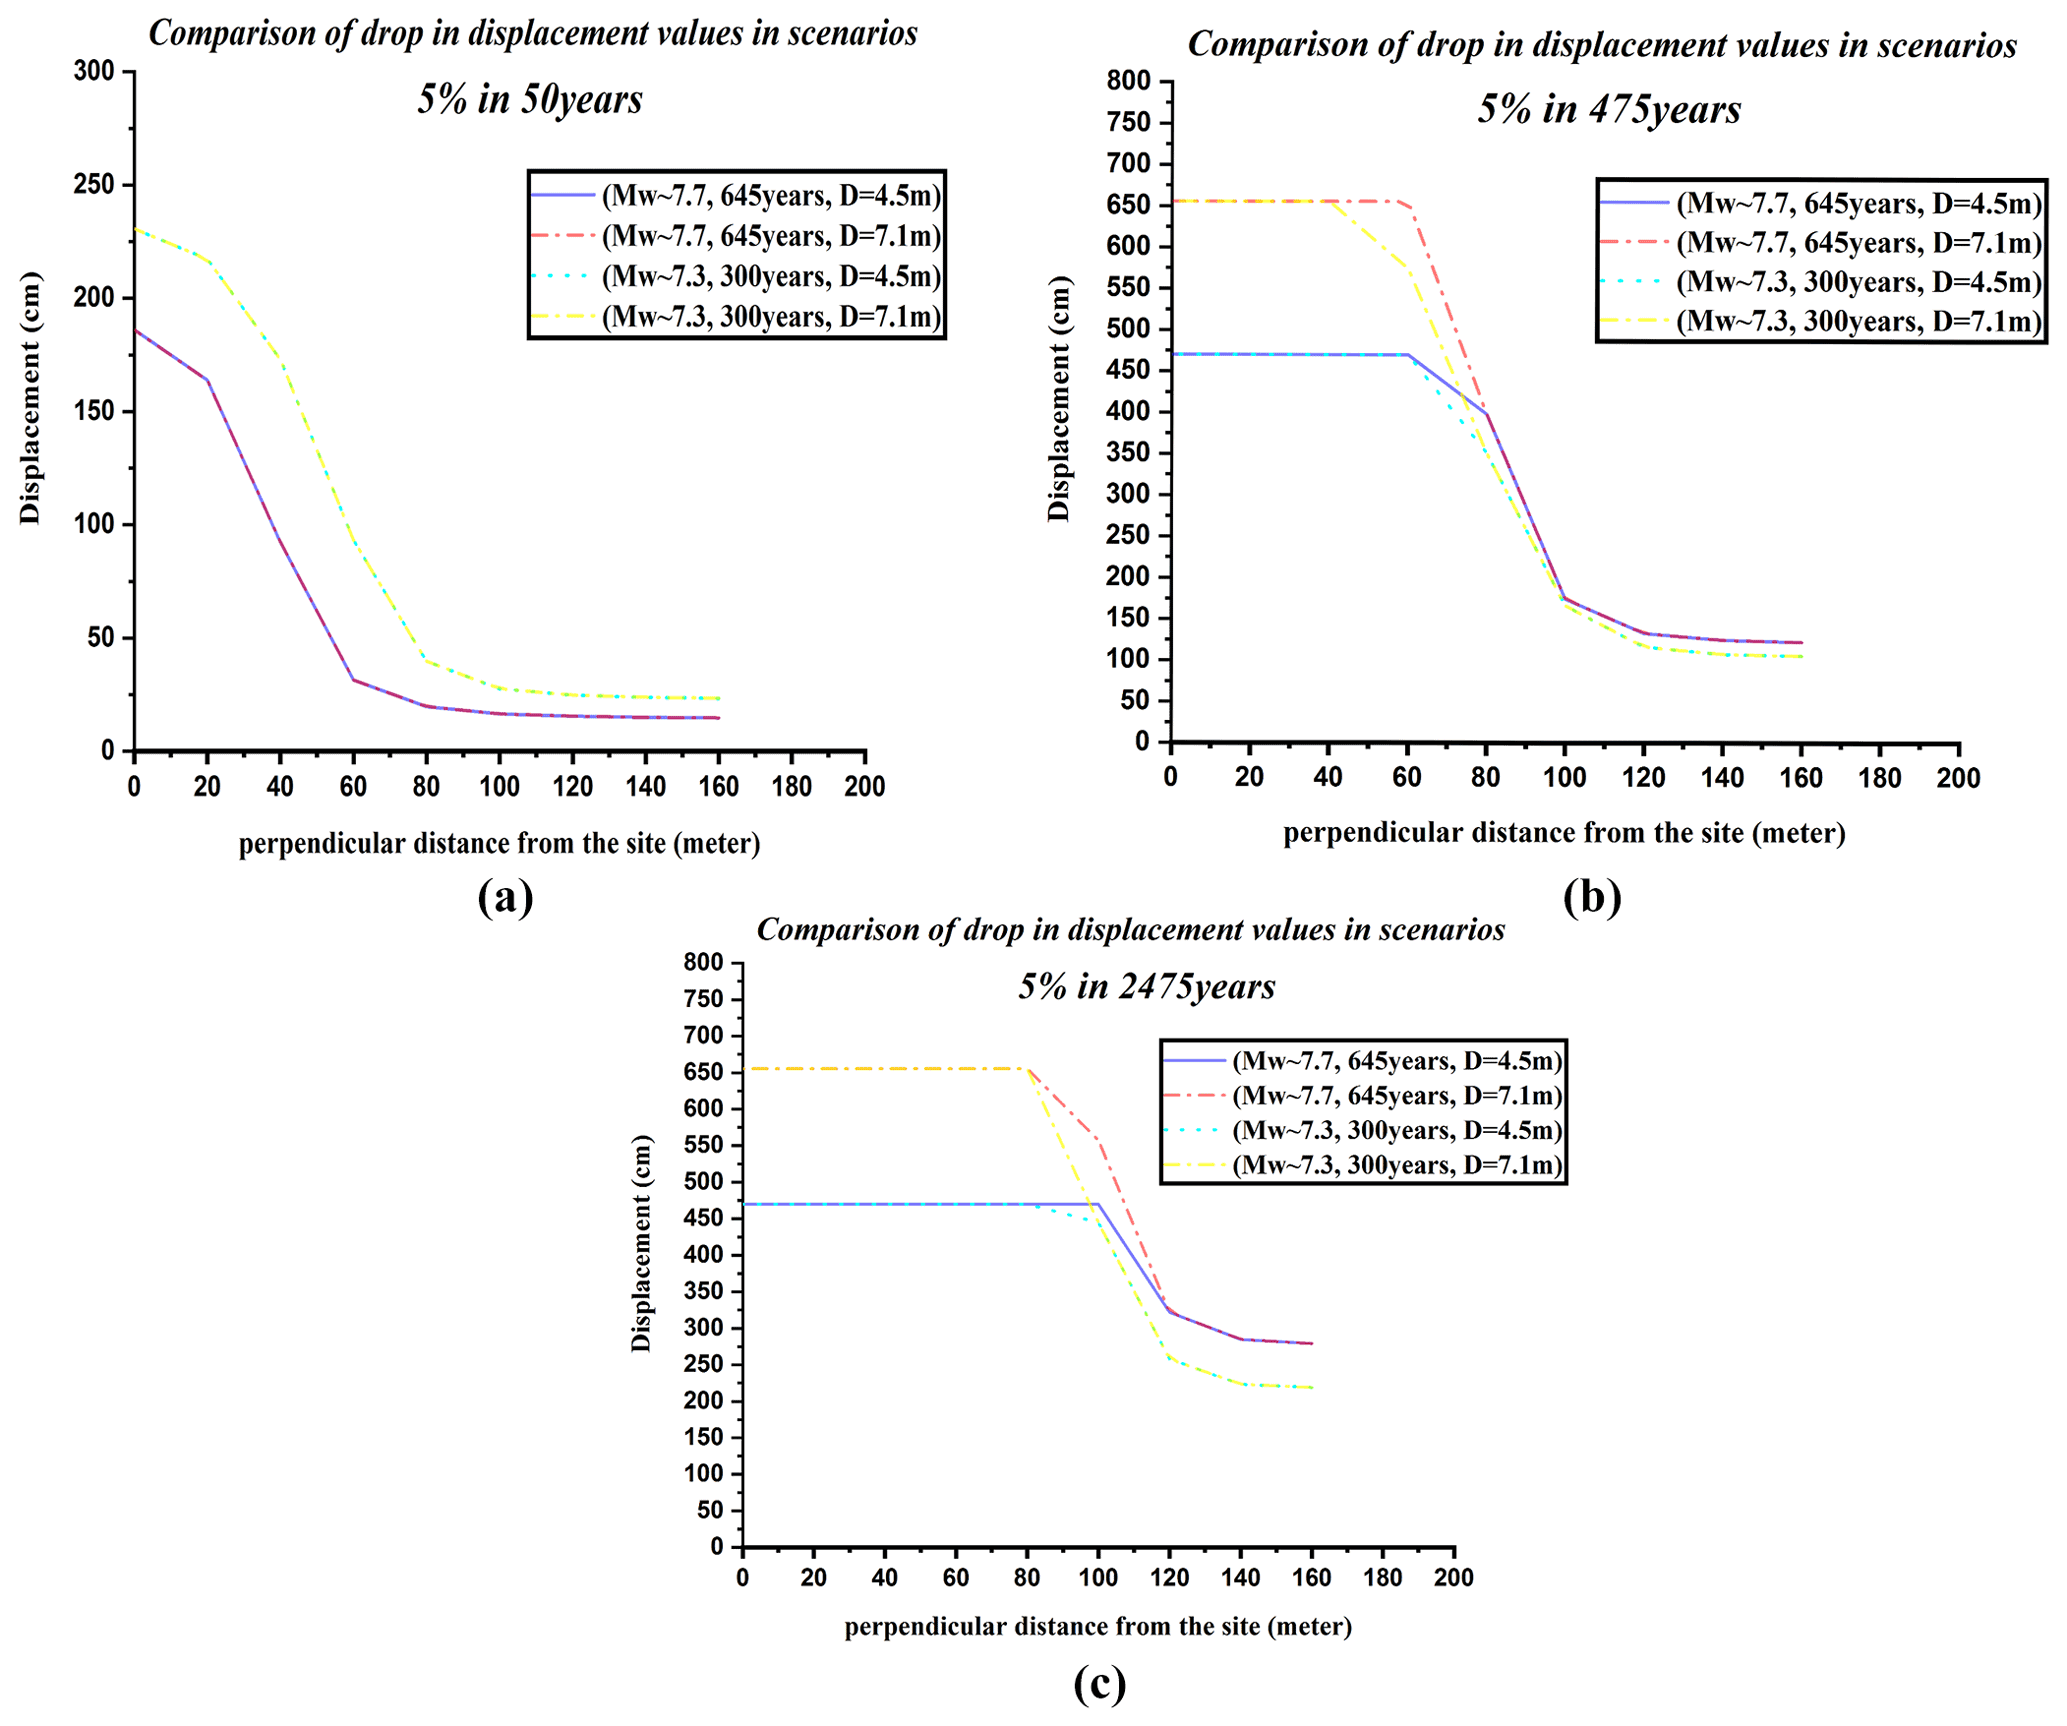
Figure 9Comparison of drop in displacement values in the scenarios for (a) 50 years, (b) 475 years, and (c) 2475 years.
The lack of large instrumental earthquakes in northwestern Iran leads to more significant epistemic uncertainty in the obtained values. Due to the passing of the north Tabriz fault through the city of Tabriz and destructive historical earthquakes, studying methods such as PFDHA is essential to prevent disasters and economic and human losses in this region.
Despite following the Petersen et al. (2011) study and code, which have been associated with favorable properties such as fault mapping accuracy, and a survey of various fitting models, we mention some weaknesses here. We hope that the hazard analysis community will be able to incorporate these points in future studies.
-
In the mentioned method, the geometry of the causal fault is not considered, so the characteristics of the source, such as dip, depth, and rake, are not used, which will increase the uncertainty in calculating numerical values. The north Tabriz fault has a slope to the north, so the displacement values on the north plate should be more than the displacement values on the south plate.
-
The attenuation relationships used for this hazard analysis are also taken from a minimal database that has used only 22 historical and instrumental earthquakes in the world. Surface rupture data in Asia, the United States, and other parts of the world, which have different seismotectonic characteristics, cause high uncertainties in the displacement and exceedance rate.
-
It is clear that probabilistic displacement values for the exceedance rate in 475 and 2475 years have similar values in some cases. We can guess that one of the drawbacks of this method is the estimation of probabilistic displacement values for higher exceedance rates, including 2475 years.
-
The values obtained clearly show that the first scenario (Mw∼7.7, 645 years) has a higher hazard level such as in 475 and 2475 years because it has a higher magnitude. It is the worst case, and in 50 years, the second scenario has a higher level of risk due to the shorter return period. We conclude that the return period is the most influential parameter in the lower years, and in the higher years, the magnitude is.
Due to the lack of instrumental data for high-magnitude earthquakes and surface ruptures, the discussion about the future probabilistic failure level of this active fault is uncertain. As a result, one of the ways to reduce the level of damage and financial and human losses is to avoid construction around this fault trace due to several terrible historical earthquakes.
In this study, we have used the code related to Petersen et al. (2011, https://doi.org/10.1785/0120100035), which we received by request from Rui Chen.
The data used in this study can be obtained from the studies of Youngs et al. (2003), Hessami et al. (2003) and Ghassemi et al. (2016).
Mohammadreza Hosseini was responsible for methodology, software, and writing the original draft. Habib Rahimi was responsible for supervision, methodology, writing, reviewing, and editing.
The contact author has declared that neither of the authors has any competing interests.
Publisher’s note: Copernicus Publications remains neutral with regard to jurisdictional claims in published maps and institutional affiliations.
This article is part of the special issue “Earthquake-induced hazards: ground motion amplification and ground failures”. It is not associated with a conference.
A sincere thanks to Mark Petersen and Rui Chen for providing computer programs and the editor and reviewers for their help in improving the paper.
This paper was edited by Hans-Balder Havenith and reviewed by Robb E. S. Moss and one anonymous referee.
Baize, S., Nurminen, F., Sarmiento, A., Dawson, T., Takao, M., Scotti, O., Azuma, T., Boncio, P., Champenois, J., Cinti, F. R., and Civico, R.: A worldwide and unified database of surface ruptures (SURE) for fault displacement hazard analyses, Seismol. Res. Lett., 91, 499–520, https://doi.org/10.1785/0220190144, 2020.
Berberian, M.: Seismic Sources of the Transcaucasian Historical Earthquakes. in: Historical and Prehistorical Earthquakes in the Caucasus', NATO ASI Series 2, Environment-28, edited by: Giardini, D. and Balassanian, S., Kluwer Academic Press, the Netherlands, 233–311, https://doi.org/10.1007/978-94-011-5464-2_13, 1997.
Berberian, M. and Arshadi, S.: On the evidence of the youngest activity of the North Tabriz Fault and the seismicity of Tabriz city, Geological Survey of Iran, 39, 397–418, 1976.
Berberian, M. and Yeats, R. S.: Patterns of historical earthquake rupture in the Iranian Plateau, B. Seismol. Soc. Am., 89, 120–139, https://doi.org/10.1785/BSSA0890010120, 1999.
Cornell, C. A.: Engineering seismic risk analysis, B. Seismol. Soc. Am., 58, 1583–1606, https://doi.org/10.1785/BSSA0580051583, 1968.
Djamour, Y., Vernant, P., Nankali, H. R., and Tavakoli, F.: NW Iran-eastern Turkey present-day kinematics: Results from the Iranian permanent GPS network, Earth. Planet. Sc. Lett., 307, 27–34, https://doi.org/10.1016/j.epsl.2011.04.029, 2011.
Ghassemi, M. R.: Surface ruptures of the Iranian earthquakes 1900–2014: Insights for earthquake fault rupture hazards and empirical relationships, Earth-Sci. Rev., 156, 1–13, https://doi.org/10.1016/j.earscirev.2016.03.001, 2016.
Goda, K.: Potential Fault Displacement Hazard Assessment Using Stochastic Source Models: A Retrospective Evaluation for the 1999 Hector Mine Earthquake, GeoHazards, 2, 398–414, https://doi.org/10.3390/geohazards2040022, 2021.
Hessami, K., Pantosti, D., Tabassi, H., Shabanian, E., Abbassi, M. R., Feghhi, K., and Solaymani, S.: Paleoearthquakes and slip rates of the North Tabriz Fault, NW Iran: Preliminary results, Ann. Geophys.-Italy., 46, 903–916, https://doi.org/10.4401/ag-3461, 2003.
Jackson, J.: Partitioning of strike-slip and convergent motion between Eurasia and Arabia in eastern Turkey and the Caucasus, J. Geophys. Res.-Sol. Ea., 97, 12471–12479, https://doi.org/10.1029/92JB00944, 1992.
Katona, T. J., Tóth, L., and Győri, E.: Fault displacement hazard analysis based on probabilistic seismic hazard analysis for specific nuclear sites, Appl. Sci., 11, 7162, https://doi.org/10.3390/app11157162, 2021.
Mousavi-Bafrouei, S. H., Mirzaei, N., and Shabani, E.: A declustered earthquake catalog for Iranian plateau, Ann. Geophys-Italy., 57, 6, https://doi.org/10.4401/ag-6395, 2014.
Nurminen, F., Boncio, P., Visini, F., Pace, B., Valentini, A., Baize, S., and Scotti, O.: Probability of occurrence and displacement regression of distributed surface rupturing for reverse earthquakes, Front. Earth Sci., 8, 456, https://doi.org/10.3389/feart.2020.58160, 2020.
Paul C. Rizzo Associates: Probabilistic Fault Displacement Hazard Analysis Krško East and West Sites Proposed Krško 2 Nuclear Power, Technical Report, Inc., 1, 1–22, 2013.
Petersen, M. D. and Wesnousky, S. G.: Fault slip rates and earthquake histories for active faults in southern California, B. Seismol. Soc. Am., 84, 1608–1649, 1994.
Petersen, M. D., Dawson, T. E., Chen, R., Cao, T., Wills, C. J., Schwartz, D. P., and Frankel, A. D.: Fault displacement hazard for strike-slip faults, Bull. Seismol. Soc. Am., 101, 805–825, https://doi.org/10.1785/0120100035, 2011.
Stepp, J. C., Wong, I., Whitney, J., Quittmeyer, R., Abrahamson, N., Toro, G., and Sullivan, T.: Probabilistic seismic hazard analyses for ground motions and fault displacement at Yucca Mountain, Nevada, Earthq. Spectra, 17, 113–151, https://doi.org/10.1193/1.1586169, 2001.
Wells, D. L. and Coppersmith, K. J.: New Empirical Relationships among Magnitude, Rupture Length, Rupture Width, Rupture Area, and Surface Displacement, B. Seismol. Soc. Am., 84, 974–1002, 1994.
Wesnousky, S. G.: Displacement and Geometrical Characteristics of Earthquake Surface Ruptures: Issues and Implications for Seismic-Hazard Analysis and the Process of Earthquake Rupture, B. Seismol. Soc. Am., 98, 1609–1632, https://doi.org/10.1785/0120070111, 2008.
Youngs, R. R., Arabasz, W. J., Anderson, R. E., Ramelli, A. R., Ake, J. P., Slemmons, D. B., and Toro, G. R.: A methodology for probabilistic fault displacement hazard analysis (PFDHA), Earthq. Spectra, 19, 191–219, https://doi.org/10.1193/1.1542891, 2003.