the Creative Commons Attribution 4.0 License.
the Creative Commons Attribution 4.0 License.
 | 14 Oct 2022
Assessing minimum pyroclastic density current mass to impact critical infrastructures: example from Aso caldera (Japan)
Andrea Bevilacqua
Alvaro Aravena
Willy Aspinall
Antonio Costa
Sue Mahony
Augusto Neri
Stephen Sparks
Brittain Hill
We describe a method for calculating the probability that a distal geographic location is impacted by a pyroclastic density current (PDC) of a given size, considering the key related uncertainties. Specifically, we evaluate the minimum volume and mass of a PDC generated at the Aso caldera (Japan) that might affect each of five distal infrastructure (marker) sites, with model input parameter uncertainties derived from expert judgment. The 5 marker sites are all located 115–145 km from the caldera; as these lie in well-separated directions, we can test the effects of the different topographic shielding effects in each case. To inform our probabilistic analysis, we apply alternative kinetic energy assessment approaches, i.e., rock avalanche and density current dynamics. In the latter formulation, the minimum mass needed to reach the markers ranges between median values of and kg (M 7.2–7.7), depending on the site. Rock avalanche dynamics modeling indicates that a ∼3-times greater mass would be required to reach the marker sites with 50 % probability, while the hypothetical scenario of a relatively dilute distal ash cloud would require ∼3-times less mass. We compare our results with the largest recorded Aso eruption, showing that a catastrophic eruption, similar to Aso-4, ≈ M8, would present a significant conditional probability of PDCs reaching the marker sites, in the density current formulation and contingent on uncertainty in the erupted mass and on marker site direction.
- Article
(6292 KB) - Full-text XML
-
Supplement
(3588 KB) - BibTeX
- EndNote


Catastrophic caldera-forming eruptions can generate gigantic clouds of ash and aerosols, extensive fallout deposits, and extremely mobile pyroclastic density currents (PDCs; Baines and Sparks, 2005; Costa et al., 2014; Black et al., 2015; Oppenheimer and Donovan, 2015; Self, 2006, 2015). For instance, the 18.8 Ma Peach Spring Tuff (AZ, USA) pyroclastic flows traveled >170 km (Roche et al., 2016) and pyroclastic flows from other large eruptions have propagated >100 km from their source vents (Wilson, 1991; Wilson et al., 1995; Streck and Grunder, 1995). However, such catastrophic caldera-forming eruptions have never been observed directly. Understanding the dynamics of these large-scale PDCs is thus limited, being based on interpretations of their deposits, analogue experiments, numerical modeling, and on extrapolations derived from the observation of smaller scale events (e.g., Fisher et al., 1993; Cas et al., 2011; Shimizu et al., 2019). Consequently, there are large uncertainties that require the use of techniques to consider them in probabilistic terms (e.g., Neri et al., 2015; Rutarindwa et al., 2019; Tadini et al., 2022a; Bevilacqua et al., 2021, 2022).
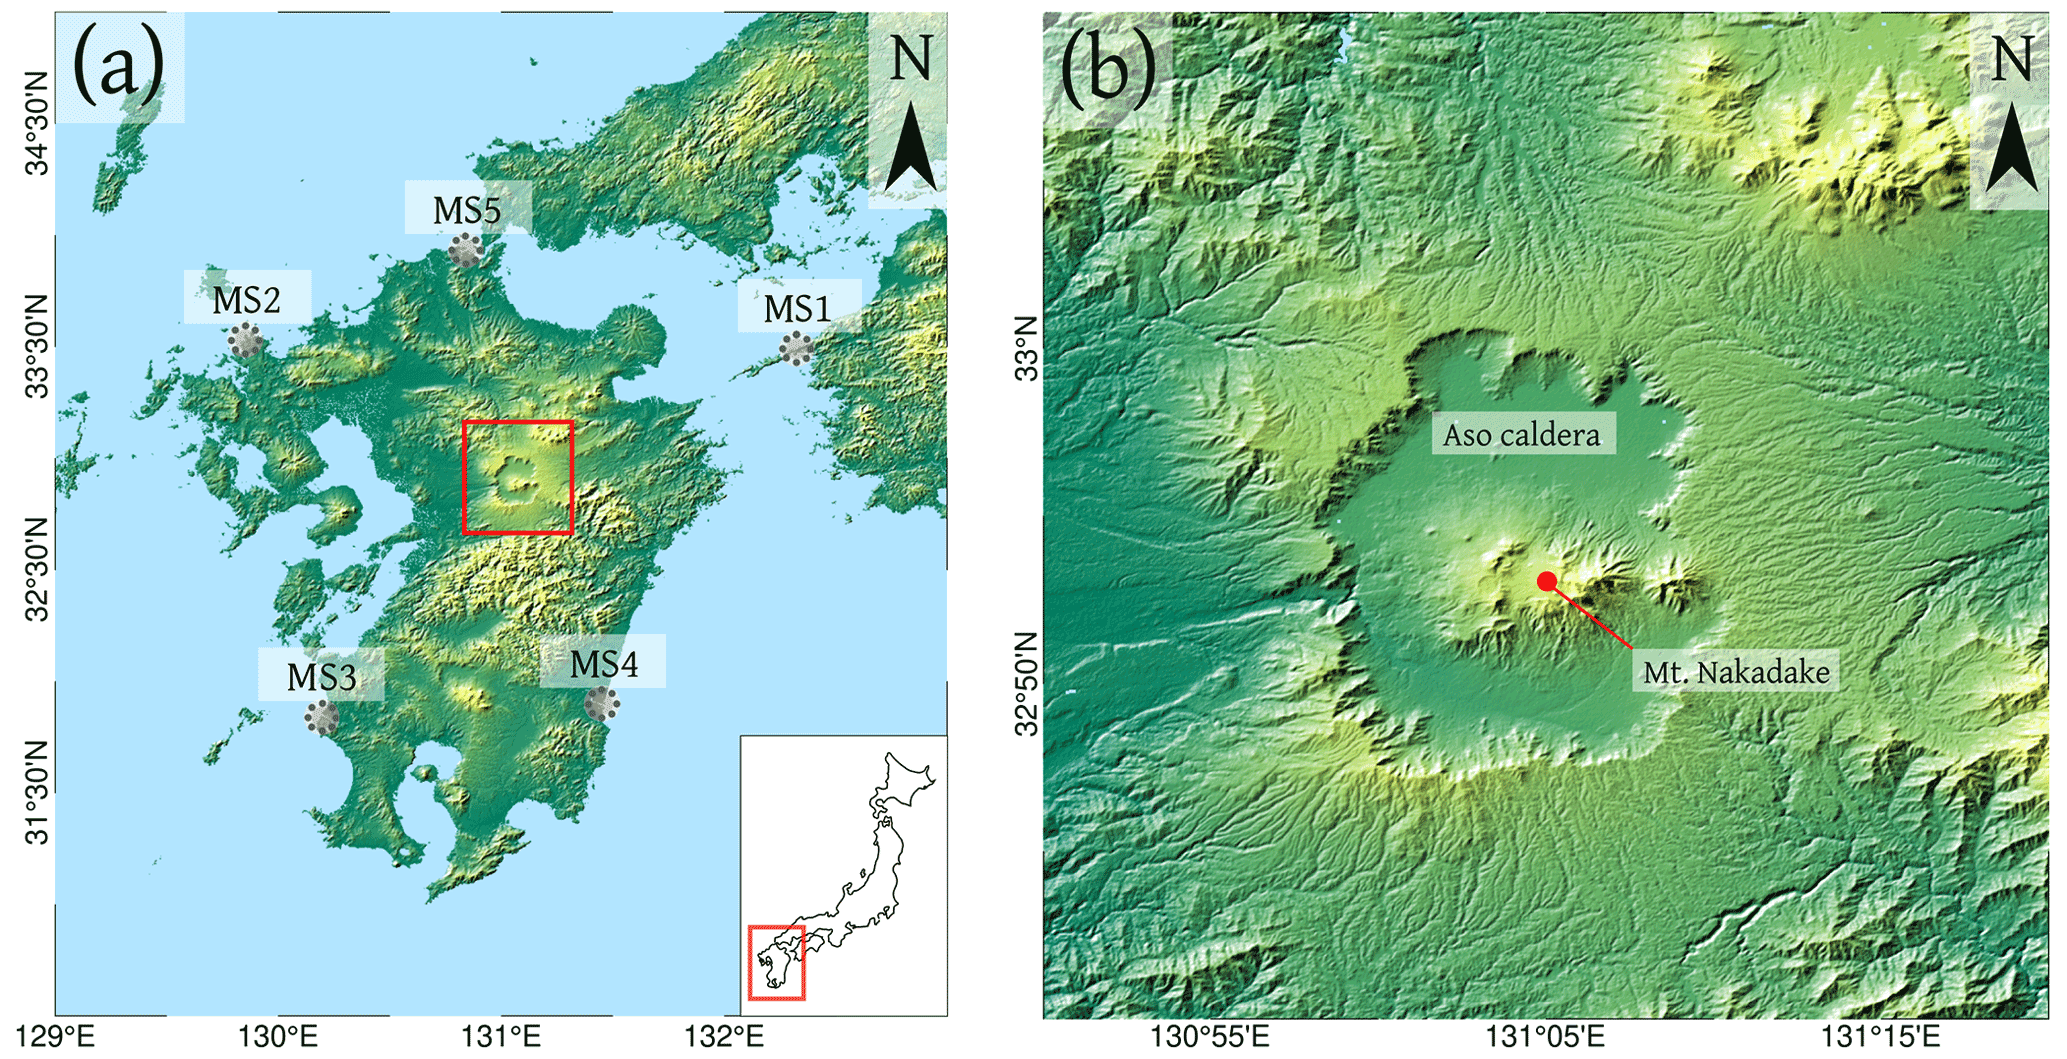
Figure 1(a) Map of Kyushu Island (South Japan), where the Aso caldera is located (inside red rectangle). The positions of the five marker sites are indicated by dotted gray circles. A sketch showing the location of Kyushu Island within Japan is also displayed in the insert. (b) Zoom on the Aso caldera. Shuttle Radar Topography Mission (SRTM) digital elevation model (DEM) 1 arcsec 30 m (NASA, 2013).
Several volcanic complexes in the world have produced catastrophic caldera-forming eruptions in the past and may do so again in the future (e.g., Lowenstern et al., 2006; Larsen et al., 2007; Aoki, 2008; Williams, 2012; Newhall et al., 2018; Suñe-Puchol et al., 2019). The expected recurrence rate of M7-8 eruptions at local and global scales has been evaluated from different datasets and through various statistical approaches (Decker, 1990; Simkin, 1993; Mason et al., 2004; Deligne et al., 2010; Brown et al., 2014; Kiyosugi et al., 2015; Rougier et al., 2016, 2018; Papale, 2018; Papale et al., 2021). Inevitably, all such analyses present substantial uncertainties.
In Japan, the largest eruption in the last 100 ka was Aso-4, which created the current Aso caldera (Fig. 1). It was responsible for the emission of about several hundred km3 dense rock equivalent (DRE) (Takarada and Hoshizumi, 2020; Aspinall et al., 2021; Rougier et al., 2022), and thus could be classed an M 8 “super-eruption”, or very close to that scale. The Aso caldera is located in the densely populated Kyushu Island (∼12.7 million people; October 2021), the volcano is currently active and poses significant challenges for risk mitigation (Tajima et al., 2017; Cigolini et al., 2018). One concern is the high runout distance of PDCs from this caldera which, in the past, have extended up to ≈160 km in some directions, e.g., for the Aso-4 eruption (Ono and Watanabe, 1985).
In this work, through first-order integral PDC models based on different assumptions, we evaluate the minimum volume and mass of a PDC generated at the Aso caldera that has the potential to affect any of five selected target “marker” sites (MS). These are populated cities or critical infrastructure positions within 160 km from the caldera, located in well-separated directions, i.e., MS1, MS2, MS3, MS4 and MS5 (see Fig. 1; Kato et al., 2016). For this, we compared four alternative kinetic energy models with variable input parameters based on structured expert judgment. Our constraints of PDC volume and mass were then compared with the main characteristics of the eruption of Aso-4. Note that our study is not dependent on accurately knowing the volumes of the Aso-4 or its individual flow units. Indeed the volumes have large uncertainties so we can use such estimates to constrain the range of volumes of interest in the modeling and then back check that the volumes with a high likelihood of reaching the observed distances are consistent with the known facts.
This work is organized in six sections. In Sect. 2 we describe the main characteristics of the volcanism of the Aso caldera. In Sect. 3 we briefly outline the first-order integral PDC models used in this analysis and the simplified strategy adopted to account for the shielding effects of topography. In Sect. 4, we present the main results derived from this study, including data elicited by expert judgment (Sect. 4.1), the minimum PDC volume and mass that would be able to reach the marker sites (Sect. 4.2) and the probability likelihoods that this threshold could be exceeded by PDCs with the characteristics of Aso-4 PDCs (Sect. 4.3). Then we present a brief sensitivity analysis of our numerical results (Sect. 4.4). Finally, in Sect. 5 we discuss the differences and limitations of the simplified models adopted to evaluate the resulting PDC runout distances and the probability of occurrence of caldera-forming eruptions on the scale of Aso-4. Supplement S1 contains technical notes on the derivation of the kinetic models and Supplement S2 is the email-log of the discussions that took place during the elicitation sessions.
2.1 The Aso caldera
The Aso caldera (dimensions 25 km N–S, 18 km E–W) is one of the largest calderas in Japan (Ono and Watanabe, 1985), with an area of 379 km2, an average wall height of 500 m and a maximum wall height of 900 m (Matumoto, 1943). It is located in central Kyushu, southwest Japan (Fig. 1), where the Philippine Sea Plate subducts beneath the Amurian Plate (e.g., Petit and Fournier, 2005; DeMets et al., 2010).
The Aso caldera was formed by four successive large magnitude eruptions: Aso-1 (0.3 Ma, M 6.7), Aso-2 (0.14 Ma, M 6.7), Aso-3 (0.12 Ma, M 7.4) and Aso-4 (86.8–87.3 ka; M 8.1–8.4; Aoki, 2008; Takarada and Hoshizumi, 2020), where M=log 10 [erupted mass (kg)] − 7 (Hayakawa, 1993; Pyle, 2000). Each of Aso-1–4 caldera cycles contains abundant dacitic to rhyodacitic pumice and volcanic ash, with mafic scoria included in the last stage of each eruption cycle (Hasenaka, 2016). The four caldera-forming eruptions of Aso produced >600 km3 DRE of pyroclastic deposits in total (>1200 km3 bulk), including hundreds of cubic kilometers of pyroclastic flow deposits (e.g., Matsumoto et al., 1991; Ono et al., 1977; Machida et al., 1985; Machida, 1999; Machida and Arai, 2003; Kaneko et al., 2007). In particular, Aso-1 erupted ≥40 km3 DRE (≥100 km3 bulk) of pyroclastic material, Aso-2 produced ∼22 km3 DRE (50 km3 bulk), and Aso-3 emitted about 100 km3 DRE (>150 km3 bulk; Matsumoto et al., 1991; Crosweller et al., 2012; Kaneko et al., 2015). Aso-4, which represents the largest eruption of Aso caldera, produced several hundred km3 DRE (please see next subsection for more details about Aso-4). The PDCs generated from these eruptions reached runout distances from the caldera of ∼30 km for Aso-1, ∼30 km for Aso-2, ∼70 km for Aso-3, and ∼166 km for Aso-4 (Ono and Watanabe, 1983; Takarada and Hoshizumi, 2020).
In addition to the caldera-forming events, Aso volcano has been the source of numerous smaller magnitude eruptions, both preceding and following Aso-4:
-
Inter-caldera volcanism produced silicic pumice and lava flows, which may be related to the initial phases or “precursory” eruptions to caldera-forming events (Hasenaka, 2016). For instance, the deeply dissected stratovolcano Nekodake, which lies in the central eastern sector of Aso caldera, may have been formed about 150 ka BP, although recent work would suggest a more recent age (Shinmura et al., 2021).
-
Post-caldera volcanism initiated soon after the Aso-4 eruption and has been dominated by smaller scale events with a wide compositional range (from basalt to rhyolite). At least 17 central cones were constructed during this period (Ono and Watanabe, 1985; Miyoshi et al., 2005; Miyabuchi, 2009), and many more edifices have been detected beneath the present central cones (Uto et al., 1994; Hoshizumi et al., 1997). Nakadake is the youngest and most active post-caldera volcano (see Fig. 1). The total thickness of scoria and ash-fall deposits is in the order of 100 m, including 36 silicic pumice-fall deposits. Most of the silicic eruptions produced deposits of <0.1 km3, while the Nojiri pumice (84 ka; ∼1 km3) and Kusasenrigahama pumice (30 ka; 2.2 km3), were one order of magnitude larger (Miyabuchi, 2011).
The total volume of post-caldera tephra has been calculated by Miyabuchi et al. (2003, 2004) and Miyabuchi (2009, 2011) as 18.1 km3 DRE. The total volume of the edifices of the post-caldera cones (including buried edifices) is estimated at ∼112 km3 DRE (Komazawa, 1995) of which approximately 24 km3 DRE are exposed at the surface (Miyoshi et al., 2012). Thus, the average rate of magma discharge during the post-caldera stage is about 1.5 km3 kyr−1, similar to the rate at other Japanese quaternary volcanoes (Miyabuchi, 2009). However, an analysis of these published volumes shows that the post-Aso-4 eruption rate has experienced a significant waning trend. The bulk (∼115 km3) of the post-Aso-4 magma erupted before approximately 70 ka, suggesting elevated eruption rates of 7 km3 kyr−1 between 70–87 ka. During the period 22–50 ka approximately 7 km3 of magma erupted at a rate of ∼0.3 km3 kyr−1, with silicic magma slightly more abundant than mafic magma. Since 22 ka, predominantly (98 %) mafic magma has erupted at a rate of approximately 0.1 km3 kyr−1.
2.2 The Aso-4 eruption and its products
The Aso-4 eruption (86.8–87.3 ka) is the largest eruption during the last 100 kyr in Japan. The PDC deposits of this eruption reached ∼166 km to the NNE from the source, being widely distributed in the northern and central zones of Kyushu Island and also in the SW part of Honshu, invading the Yamaguchi prefecture (>160 km from the source; Matumoto, 1943; Watanabe, 1978; Ono and Watanabe, 1985; Takarada and Hoshizumi, 2020).
The pyroclastic flow deposits of Aso-4 have been divided into two cycles, each one characterized by a progression from silicic to more mafic magma, with evidence of magma mixing (Lipman, 1967; Watanabe, 1979; Ono and Watanabe, 1983; Kaneko et al., 2007; Ishibashi et al., 2018). The ash of Aso-4 consists of rhyodacitic glass shards with brown hornblende and orthopyroxene phenocrysts (Machida and Arai, 1983). Plagioclase and magnetite phenocrysts occur in all ejecta from the Aso-4 eruption as well (Kaneko et al., 2007). The pyroclastic flows of Aso-4 also contain abundant lithic fragments (Ono et al., 1977) with regionally differing lithologies. This lateral heterogeneity of lithic fragments may suggest that the magmas of the Aso-4 eruption were erupted from either a ring fissure or multiple vents (Kaneko et al., 2007), as has been inferred for other explosive super-eruptions (e.g., Costa and Martí, 2016); this may also be explained by surface erosion across different lithic populations.
Takarada and Hoshizumi (2020) presented estimates of the volume and mass of PDC and fallout deposits of Aso-4, by evaluating the magnitude (M 8.1–8.4). They estimated a volume of Aso-4 tephra fall deposits of 240–370 km3 DRE (6.0–9.3×10¹⁴ kg), while the volume of Aso-4 PDC deposits was estimated at about 225–590 km3 DRE (5.6–14.8×10¹⁴ kg). These estimates implied a total volume of the Aso-4 eruption of 465–960 km3 DRE (1.2–2.4×10¹⁵ kg).
Nevertheless, the volume of magma erupted in Aso-4 and the uncertainty in volume estimates remain open questions. Aspinall et al. (2021) undertook a preliminary quantification of this uncertainty by combining several different volume estimates of PDC and fallout deposits of Aso-4, through a Bayesian belief network approach. They defined composite volumes, determined by weighted combinations of different estimates of the various products, including those from Takarada and Hoshizumi (2020), and hypothesized a lower bulk volume for the ash fall deposit and therefore a smaller total magnitude with 90 % confidence (i.e., M 7.9–8.2). In a subsequent related assessment of the Aso-4 tephra fall deposit, Rougier et al. (2022) applied advanced statistical methods and re-evaluated its bulk volume to have been in the range 220–370 km3, which equates to the range 95–160 km3 DRE (2.2–3.7×10¹⁴ kg). As the volumes of co-ignimbrite tephra fall deposits and PDC deposits are typically comparable to one another (Sparks and Walker, 1977), the reduced estimate tephra fall deposits also suggests a somewhat reduced PDC volume.
The exposure area of Aso-4 PDC deposits is about 1000 km2, but Takarada and Hoshizumi (2020) evaluated that the original area covered by these deposits was about 34 000 km2. However, in some directions the runout distance of Aso-4 pyroclastic flows largely exceeded 130 km, while in others the deposits could not be traced that far. The Aso-4 pyroclastic flow deposits have been likely conditioned by the presence of topographical obstacles such as the Kyushu Mountains.
As discussed above, there is much uncertainty about the total PDC volume and consequently the volumes of individual PDCs generated by the Aso-4 eruption. However, from the perspective of our study these uncertainties are not important as all studies agree that the total PDC volume is likely to significantly exceed 100 km3, while the volume of the largest and most extensive individual PDC emplacement units is also likely to be a significant fraction of the total volume.
3.1 Box model integral formulations
Our analysis relies on the implementation of four different versions of the box model integral formulation for axisymmetric gravity-driven particle currents, based on the pioneering work of Huppert and Simpson (1980) and with theory detailed in Bonnecaze et al. (1995) and Hallworth et al. (1998). We focus on models with analytical solutions, adopting input ranges based on expert judgment (see Sect. 4.1). This enables us to utilize a very fast model inversion approach in the uncertainty quantification process. We note that we are not using “reduced” models (i.e., statistical surrogates, e.g., Rutarindwa et al., 2019; Yang et al., 2020). Further details on the physical equations we adopted as well as the mathematical expression of the analytical solutions, can be found in the Supplement S1. In particular, we focus on two different physical formulations.
3.1.1 Model 1: rock avalanche dynamics with constant stress over the flow basal area
This model for energy dissipation is described in Dade and Huppert (1998) and assumes that the entire amount of solid material falls from a prescribed height and expands laterally while preserving its initial volume. In this model the elicited input parameters are: (a) collapse height (H), (b) flow density (ρc), and (c) equivalent stress (τ, one third of the constant stress value, see Supplement S1). The dynamics of a similar assumption on the basal stress has been further explored in Kelfoun et al. (2009) and Kelfoun (2011), using depth-averaged models.
3.1.2 Model 2: density current dynamics with particle deposition
This model is described in Dade and Huppert (1995) for the simulation of oceanic turbidity currents. Dade and Huppert (1996) adopted it to simulate emplacement of the large-scale AD 232 Taupo ignimbrite (New Zealand; Holdaway et al., 2018). The input parameters of model 2 are: (a) initial solid fraction (ϕ0), (b) velocity of settling of the solid particles (ws), (c) density of solid particles (ρ), (d) density of ambient air (ρa), (e) density of interstitial gas (ρi), and (f) the Froude number (Fr). All the input ranges of these parameters were elicited with the exception of the Froude number, which was sampled uniformly in [1.0, 1.2]; this range captures expected conditions for PDC (Esposti Ongaro et al., 2016).
In contrast to Dade and Huppert (1996), in this study we assume the instantaneous release of a fixed volume of pyroclastic material, as in Neri et al. (2015), Bevilacqua (2016), Bevilacqua et al. (2017) and Aravena et al. (2020, 2022). This assumption is considered reasonable because the time scale of the eruption of the PDC volume is shorter than the emplacement time. As the model accounting for the full total grain size distribution (TGSD) does not have analytical solutions (e.g., Biagioli et al., 2019; Tadini et al., 2021a) and, however, a TGSD of the studied PDCs would not be easy to constrain, we assumed monodispersed solid particles with an effective diameter. In particular, we adopted the Sauter diameter, which is the particle diameter where the volume/surface area ratio is the same as that of the particle distribution (Crowe et al., 1998; Neri et al., 2022), to provide a reasonable approximation to the dynamics of the full TGSD.
In this work we also considered three variants of Model 2:
- a.
Model 2a. This variant includes interstitial gas, which is thermally buoyant with respect to the surrounding cold air. The flow stops propagating when the solid fraction ϕ(t) becomes lower than a critical value ϕcr, and the remaining mixture of gas and particles lifts off possibly generating a ignimbrite cloud. Note that the thermal properties and flow volume remain constant for the duration of the flow.
- b.
Model 2b. The equations of this variant are equivalent to model 2a, but an alternative input of ws is adopted. Instead of being elicited, this range is based on the results of particle terminal velocity derived from ash fallout studies at the scale of the Sauter diameter for analog flows (Armienti et al., 1988; Bonadonna and Phillips, 2003; Dioguardi et al., 2017). These atmospheric flows are Mt. St. Helens (Costa et al., 2016), the Campanian Ignimbrite (Costa et al., 2012; Martí et al., 2016), and the Youngest Toba Tuff (Costa et al., 2014). Moreover, this variant implements an alternative input range of ϕ0, based on mass discharge rate (MDR) modeling (Costa et al., 2018). Therefore, this formulation represents the hypothetical scenario of a more dilute ash cloud than the elicited flow.
- c.
Model 2c. This variant assumes a “cold” interstitial gas equivalent to ambient air. Thermal buoyancy effects are absent, and the flow stops when ϕ(t=0 and the entire initial solid fraction has been deposited. Under this assumption, a longer runout than model 2a is expected.
Several recent papers have focused on pyroclastic flow emplacement by more sophisticated modeling; e.g., thermodynamics modeling of cooling effects and air entrainment effects (e.g., Bursik and Woods, 1996; Fauria et al., 2016), two layer systems (Burgisser and Bergantz, 2002; Doyle et al., 2007; Kelfoun, 2017; Valentine, 2020), the development of dense and dilute regimes within the same flow (Esposti Ongaro et al., 2011, 2020; Kelfoun and Gueugneau, 2022; Neri et al., 2022), the effects of pore pressure on basal friction (Roche et al., 2021; Aravena et al., 2021), and the build-up of coherent turbulent structures and gravity waves (Lube et al., 2020; Brosch et al., 2021). However, since more advanced models require more detailed data to fit additional input parameters, simplified models are suitable for probabilistic modeling in uncertain frameworks, like the present Aso-4 case study, especially for capturing extreme probabilities.
For instance, some of these models adopt a two layer approach in which a concentrated basal flow is overlaid by a dilute turbulent cloud. The two layer exchange mass during emplacement through particle settling and entrainment processes, making such models computer-intensive and currently unsuitable for probabilistic modeling. Models 1 and 2 can be seen as end members that treat the two layers separately and so are likely to yield a wide range of run-out distances that include those found in a hybrid two layer model. In Sect. 5 we further discuss the interpretation of our results in terms of such models.
3.2 Mass inversion strategy and simplified testing of topographic shielding effects
In a first step, our numerical simulations do not consider the possible shielding effect of topographic obstacles. By using the elicited probability distributions of model inputs and the analytical solutions of the kinetic energy models, for any given collapsing volume, we estimate the conditional probability for the occurrence of a PDC with runout distance on a flat topography equal or larger than the distance between the source and each marker site (i.e., ∼130 km for MS1, ∼135 km for MS2, ∼145 km for MS3, ∼115 km for MS4, and ∼120 km for MS5; see Fig. 1).
As the minimum volumes have a different density in the different models, we computed the equivalent mass to set up a more consistent comparison between them. In particular, model 1 is single-phase and the calculated volume represents the bulk solid material at the elicited flow density. On the other hand, ,models 2a–c are two-phase and include solid particles and interstitial gas, but the volume calculated only represents the solid phase, with a density that is also elicited and generally greater than the flow density of model 1. Nevertheless, because of the possible topographic effects in the propagation of PDCs, the simulation of 115–145 km runout in the absence of topographic effects is not a sufficient condition to assess the likelihood of marker site incursions for those distances from the source. Therefore, in a second step, we tested the inclusion of the topography in numerical simulations, using the program BoxMapProb (Aravena et al., 2020), which can be found in https://github.com/AlvaroAravena-/BoxMapProb (last access: 18 August 2022); this approach adopts the formulation of model 2c. To do this, we followed the “energy conoid” approach, based on the assumption of nonlinear, monotonic decay of flow kinetic energy with distance adopted by Neri et al. (2015) and Bevilacqua et al. (2017). Note that we did not follow the tree-branching algorithm in Aravena et al. (2020) because strong channelizing effects were not envisaged for the Aso case (see Supplement S2).
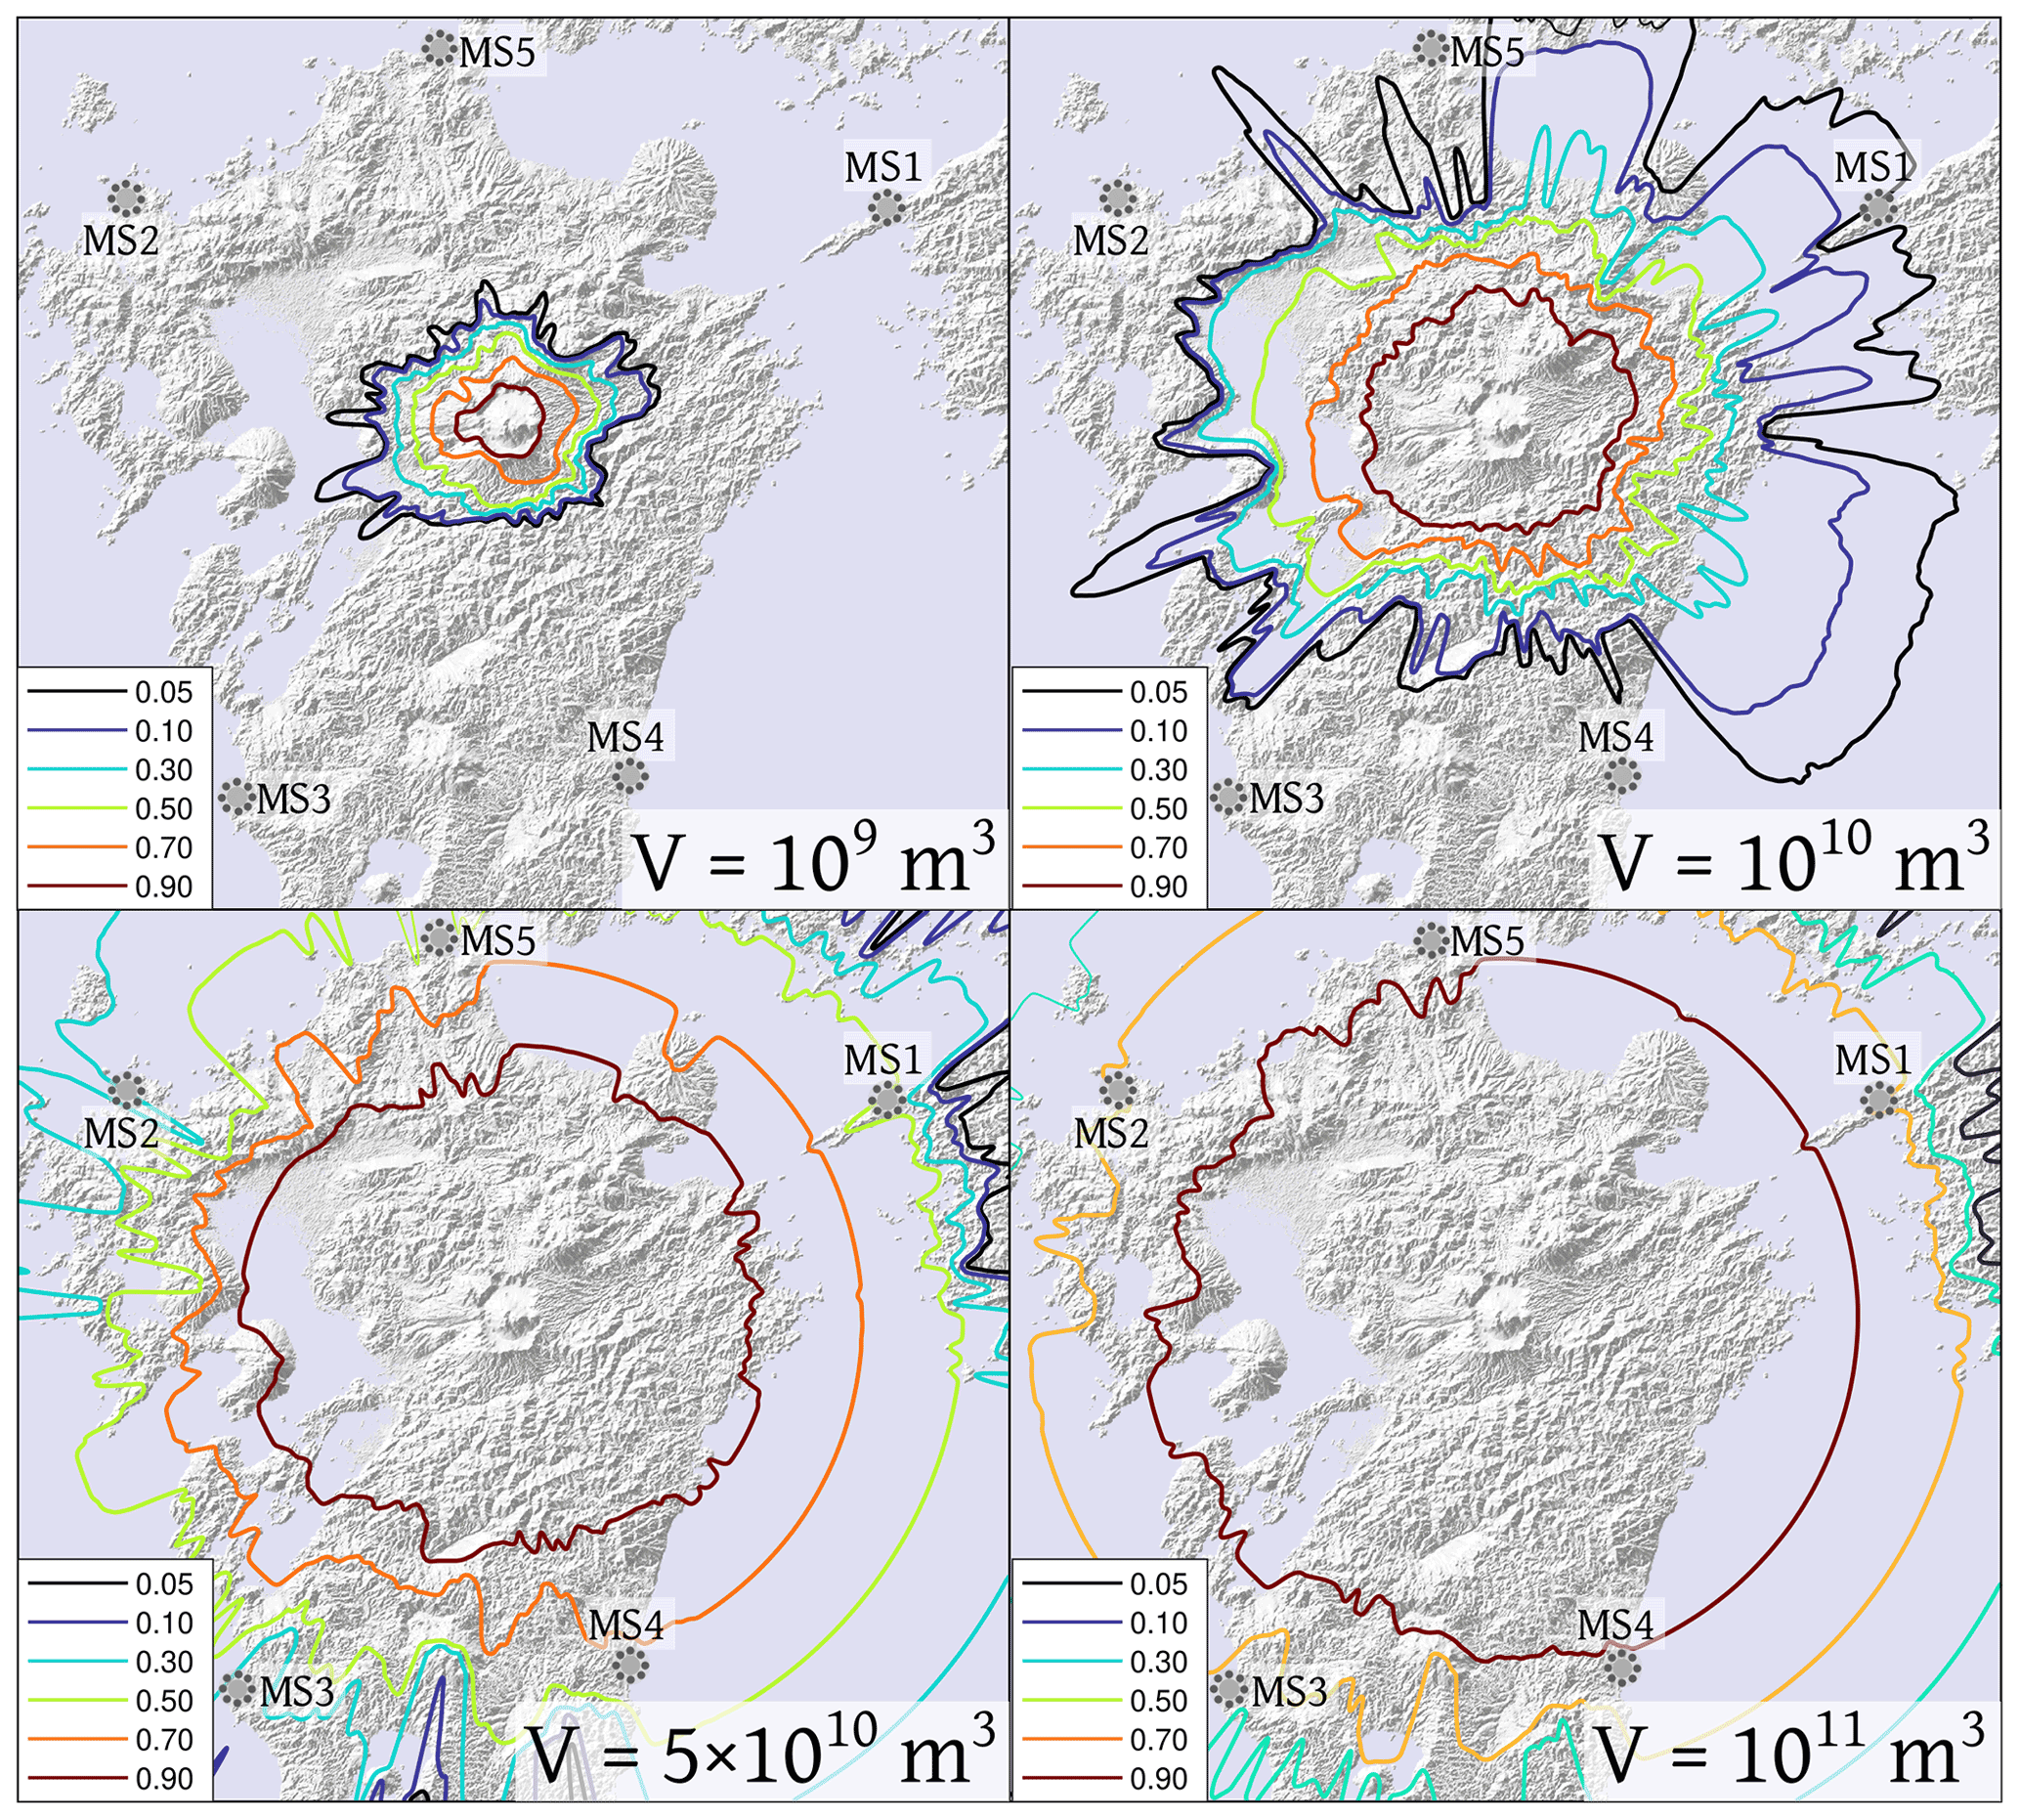
Figure 2Probabilistic PDC invasion maps for four sets of simulations (N=1000 each run) with different values of collapsing volume and vent positions sampled uniformly within Aso caldera. The other input parameters are derived from expert judgment (see Table 1). These simulations were performed using the program BoxMapProb (Aravena et al., 2020; excluding tree-branching effects), which adopts the formulation of model 2c. Dotted gray circles mark the positions of the five marker sites. Contour lines show the invasion probability values in the lower left box. SRTM – DEM 1 arcsec 30 m (NASA, 2013).
In Fig. 2 we show some examples of PDC invasion probability maps as a function of the DRE volume of pyroclasts. We compared the kinetic energy of the current front and the potential energy associated with the obstacles encountered. Our approach is most sensitive to the shielding effect of the topography close to the marker sites, and not to the large-scale topography around the source site (Aso caldera), that might also significantly affect the flow dynamics (e.g., Todesco et al., 2006; Esposti Ongaro et al., 2020). Therefore, according to the literature sources about Aso-4, we only simulated the mass of PDC outflowing from the caldera. As the energy calculation is performed axisymmetrically along every radial direction, we randomly varied the center of propagation inside the Aso caldera (see Fig. 1) and averaged the results to include uncertainty related to the geographical coordinates of the source.
Figure 3 shows the results of a set of complementary simulations performed in this way for marker sites MS1–MS3. For example, we estimated that the inputs able to produce a runout distance of 150 km on a flat surface ensures that ∼50 % of the simulated PDCs invade the marker site MS1 when the topography is considered (Fig. 3a). Using these indications to emulate the effect of topography, for MS1 we included in this work the results associated with a runout distance of 195 km, i.e., the value at which 95 % of the simulations reach the marker site. Similarly, we determined that sets of inputs able to produce runout distances of 235, 225, 155 and 170 km on a flat surface will ensure 95 % of the simulations reach MS2, MS3, MS4 and MS5, respectively, when topography is considered (Fig. 3b and c). See Sect. 5.2 for a discussion on the possible limitations of this strategy.
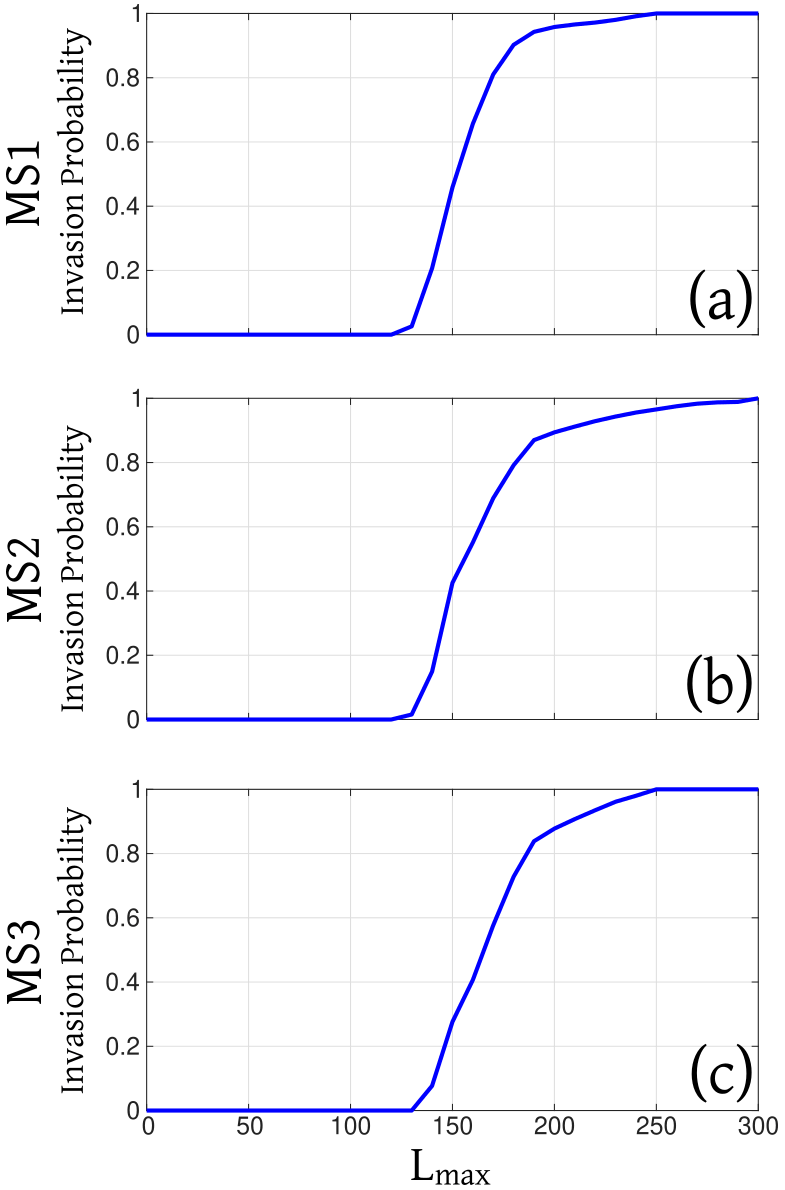
Figure 3Cumulative curves PDC invasion probability of the marker sites (a) MS1, (b) MS2, (c) MS3, for a set of simulations performed using the program BoxMapProb (Aravena et al., 2020) as a function of the parameter Lmax, which represents the runout distance on a flat surface. To perform these simulations, vent positions are uniformly sampled within the Aso caldera, the volume of pyroclasts is uniformly sampled between 109 and 1012 m3, and the other input parameters are derived from expert judgment (see Table 1 – 5000 samples). We observe that Lmax of 195, 235 and 225 km ensure that most of the simulations (>95 %) invade the MS1, MS2, MS3, respectively.
Finally, note that for simplicity in all cases we modeled the sea as a flat topography (Neri et al., 2015; Bevilacqua et al., 2017). However, it is a debatable point whether model 1 flows can go over the ocean. In fact, the ability of a flow or surge to pass over water is a complex matter, and it will depend on many factors, such as the angle of entrance into the water, flow speed, density, and temperature (Cas and Wright, 1991; Carey et al., 1996; 2000; Allen and Cas, 2001; Dufek and Bergantz, 2007; Dufek, 2016). These effects are hardly represented in simplified kinetic models like those adopted in this study but, in our opinion, the results obtained provide a first approximation of the distal runout impacts of such catastrophic eruptions. From a safety perspective, the assumption that PDCs can travel over water is both supported by observations of past (smaller magnitude) eruptions and could be exceedingly conservative, in the sense that the assumption will not underestimate risk.
4.1 Input ranges based on expert judgment
We based our input range estimation on structured expert judgment (Cooke, 1991; Aspinall, 2006). The elicitation solutions of models 1 and 2a–c are indicated in Table 1, where we also include the modified input ranges for model 2b based on MDR modeling and Sauter diameter of analogs (see Sect. 3.2). Note that volume is not considered an input parameter but it is varied to calculate the probability of any volume chosen in a wide range to reach the distance of each marker site. For judgment aggregation, we implemented the equal weights combination rule (Bevilacqua et al., 2015; Tadini et al., 2017, 2021b, 2022b). We did not apply performance-based scores because of the relatively small number of experts participating and because the overheads and time demands involved in implementing a formal elicitation protocol were not warranted in this case. Two elicitation sessions were organized remotely by sending out the questionnaires and collecting the responses by email. Supporting information S2 demonstrates that a comprehensive exchange of emails took place remotely, in which the models adopted, the variables elicited and their parameterizations were thoroughly discussed.
Table 1Elicitation solutions for model 1 and model 2 parameters, and modified input range of model 2b based on mass discharge rate (MDR) modeling and Sauter diameter of analogs (see Sect. 3.2). The reported values express the percentiles of the probability distribution obtained by equal weights pooling of experts' judgments (also called the solution decision maker DM).

a These results approximately impose the input values in the range (min, median) assessed by the joint DM. b Froude number was sampled uniformly in [1.0, 1.2].
More detailed input schemes and calibration approaches could be attempted in further research (Bevilacqua et al., 2019; Patra et al., 2020; Aravena et al., 2022), but these approaches would not be straightforward because of the lack of well-preserved distal deposits. Note that we assume the model inputs consist of an array of independent variables. A discussion of this limitation is provided in Sect. 5.3 and future research might explore the effects of possible correlations between them, especially on the computation of extreme model values. Another possibility is to develop simplified two layer models amenable to probabilistic modeling calibrated by the more computer-intensive numerical models to allow simplified parameterizations of mass exchange between the two layers.
4.2 Minimum PDC volume and equivalent mass to reach the marker sites
The volume inversion results on a flat topography are presented in Tables 2, S3 (in the Supplement), S5, S7, S9 and express, for a given percentage P, the minimum PDC volume that has such a probability P of reaching MS1, MS2, MS3, MS4 or MS5, based on values of runout distance equal to 130, 135, 145, 115 and 120 km, respectively. In all the cases, we converted the minimum volumes into PDC mass by considering the elicited values of density (ρc and ρ for model 1 and models 2a–c, respectively; see Table 1). The estimates of the minimum PDC mass (MinMass) able to invade each marker site, obtained with the four described models on a flat topography, are also included in Tables 2, S3, S5, S7, S9.
Table 2Numerical results of the minimum PDC volume and mass needed to reach MS1, with and without consideration of topographic effects (see Sect. 4.4). The density is different in the two models 1 and 2 (see Table 1). Estimates are based on 100 000 statistical samples.
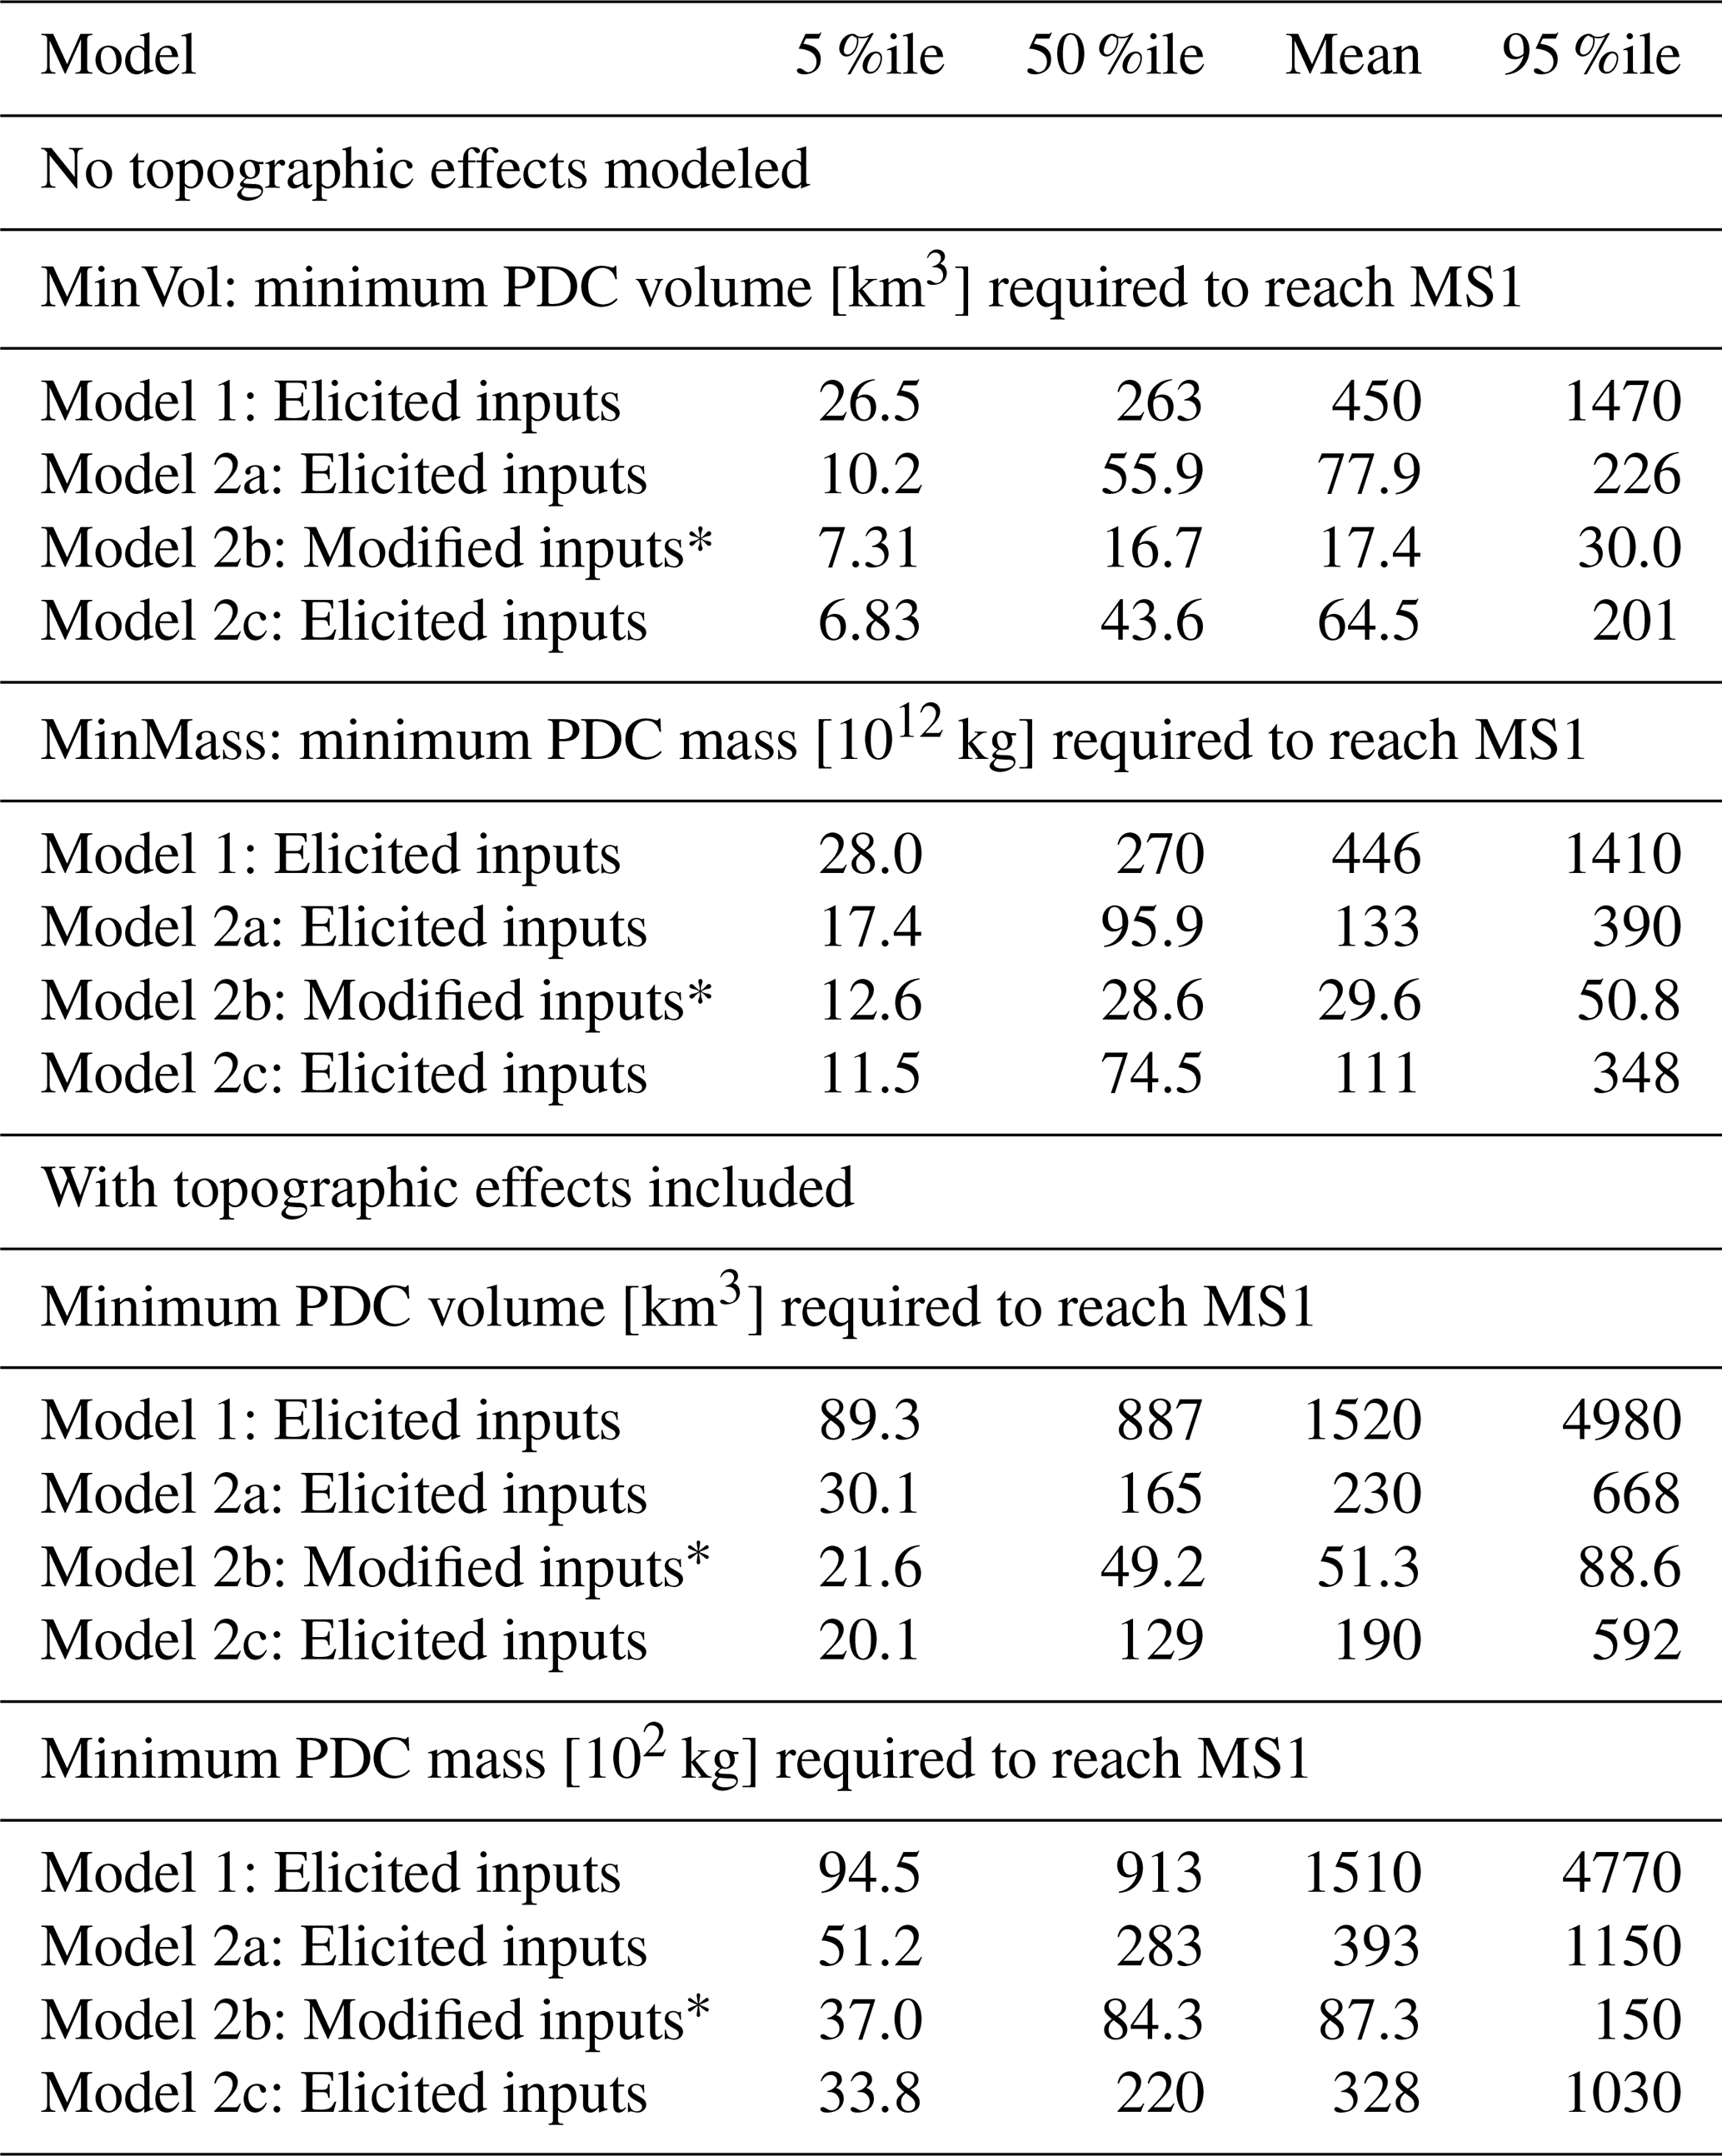
* Modified ϕ0 and ws based on MDR modeling and Sauter diameter of analogs (see Table 1).
This strategy to calculate MinMass, which is a conservative choice, according to model 2a produces values of kg (DRE equivalent 10.2 km3) if we consider a 5 % probability to reach the distance of MS1, kg (DRE equivalent 55.9 km3) if we consider a 50 % probability and kg (DRE equivalent 226 km3) if we consider a 95 % probability, always considering a flat topography (Table 2). For MS2 and MS3, the associated values of MinMass according to model 2a are 11 % and 33 % higher than those of MS1, respectively. The estimates for MS4 and MS5 (Tables S7 and S9) are 28 % and 19 % lower, respectively.
Tables 2, S3, S5, S7, S9 also include the results based on larger values of runout distance, i.e., 195, 235, 225, 155 and 170 km for MS1, MS2, MS3, MS4 and MS5, respectively, obtained by using again the analytical solutions of kinetic energy models on a flat surface. This increase in the marker runout distance is introduced so as to emulate the effect of the topography, i.e., runout distance reduction derived from the effect of distal obstacles (see Sect. 3.2). Otherwise, the analytical solutions of kinetic energy models would have been invalidated by numerically considering the topographic shielding effects in each simulation.
These results are less conservative than those presented previously and indicate that the minimum PDC mass able to affect the marker sites for model 2a, is ∼3-times greater than the previous estimates based on shorter values of runout distance. In particular, for MS1 the MinMass is kg (DRE equivalent 30.1 km3) with 5 % probability of incursion, kg (DRE equivalent 165 km3) if with 50 % probability and kg (DRE equivalent 668 km3) if with 95 % probability. The estimates of the minimum PDC mass needed to invade MS2 and MS3 (Tables S3 and S5) are 65 % and 46 % higher than those of MS1, respectively. The estimates for MS4 and MS5 (Tables S7 and S9) are 46 % and 31 % lower, respectively.
Note that our four approaches are based on significantly different physical assumptions and therefore their results are presented separately. In fact, model combination schemes could be attempted, but our expert elicitation did not indicate any model preference (see Supplement S2). Bayesian model averaging (Bevilacqua et al., 2017, 2018) was not practicable in this case because of the lack of enough well-preserved distal outcrops. A more detailed discussion of all the models and the associated MinMass inversion results is provided in Sect. 5.1. In particular, model 1 requires ∼3-times greater MinMass values to reach the same runouts as model 2a with 50 % probability, while model 2b has ∼3-times smaller values and model 2c requires ∼30 % smaller mass values than model 2a.
We finally note that these MinMass estimates represent a minimum threshold required to just reach the marker sites; however, the distal impact of these PDC could differ radically between the models, i.e., from PDCs with high particle concentrations and high dynamic pressures to co-ignimbrite flows more similar to dilute ash clouds (see Sect. 5.1).
4.3 PDC invasion probability at marker sites based on the documented eruption size of Aso-4
In Fig. 4 we show the cumulative distribution of the mass required to reach marker sites MS1–MS3 (MinMass) according to the four models described in the previous sections with (right panel) and without (left panel) consideration of the effect of the topography. Figures 5 and S11 (in the Supplements) how the probability density functions of MinMass with and without topographic effects, respectively. In these figures, we also include very uncertain estimates of the mass of the PDCs deposited during the largest caldera-forming eruption at Aso, i.e., Aso-4. For Aso-4 we used the range of PDC mass estimated by Takarada and Hoshizumi (2020), considering only the mass of PDC over-flow outside the caldera, i.e., 420–1180×1012 kg, mean value 780×1012 kg. These values of mass correspond to 168–471 km3 DRE, mean value 314 km3 DRE.
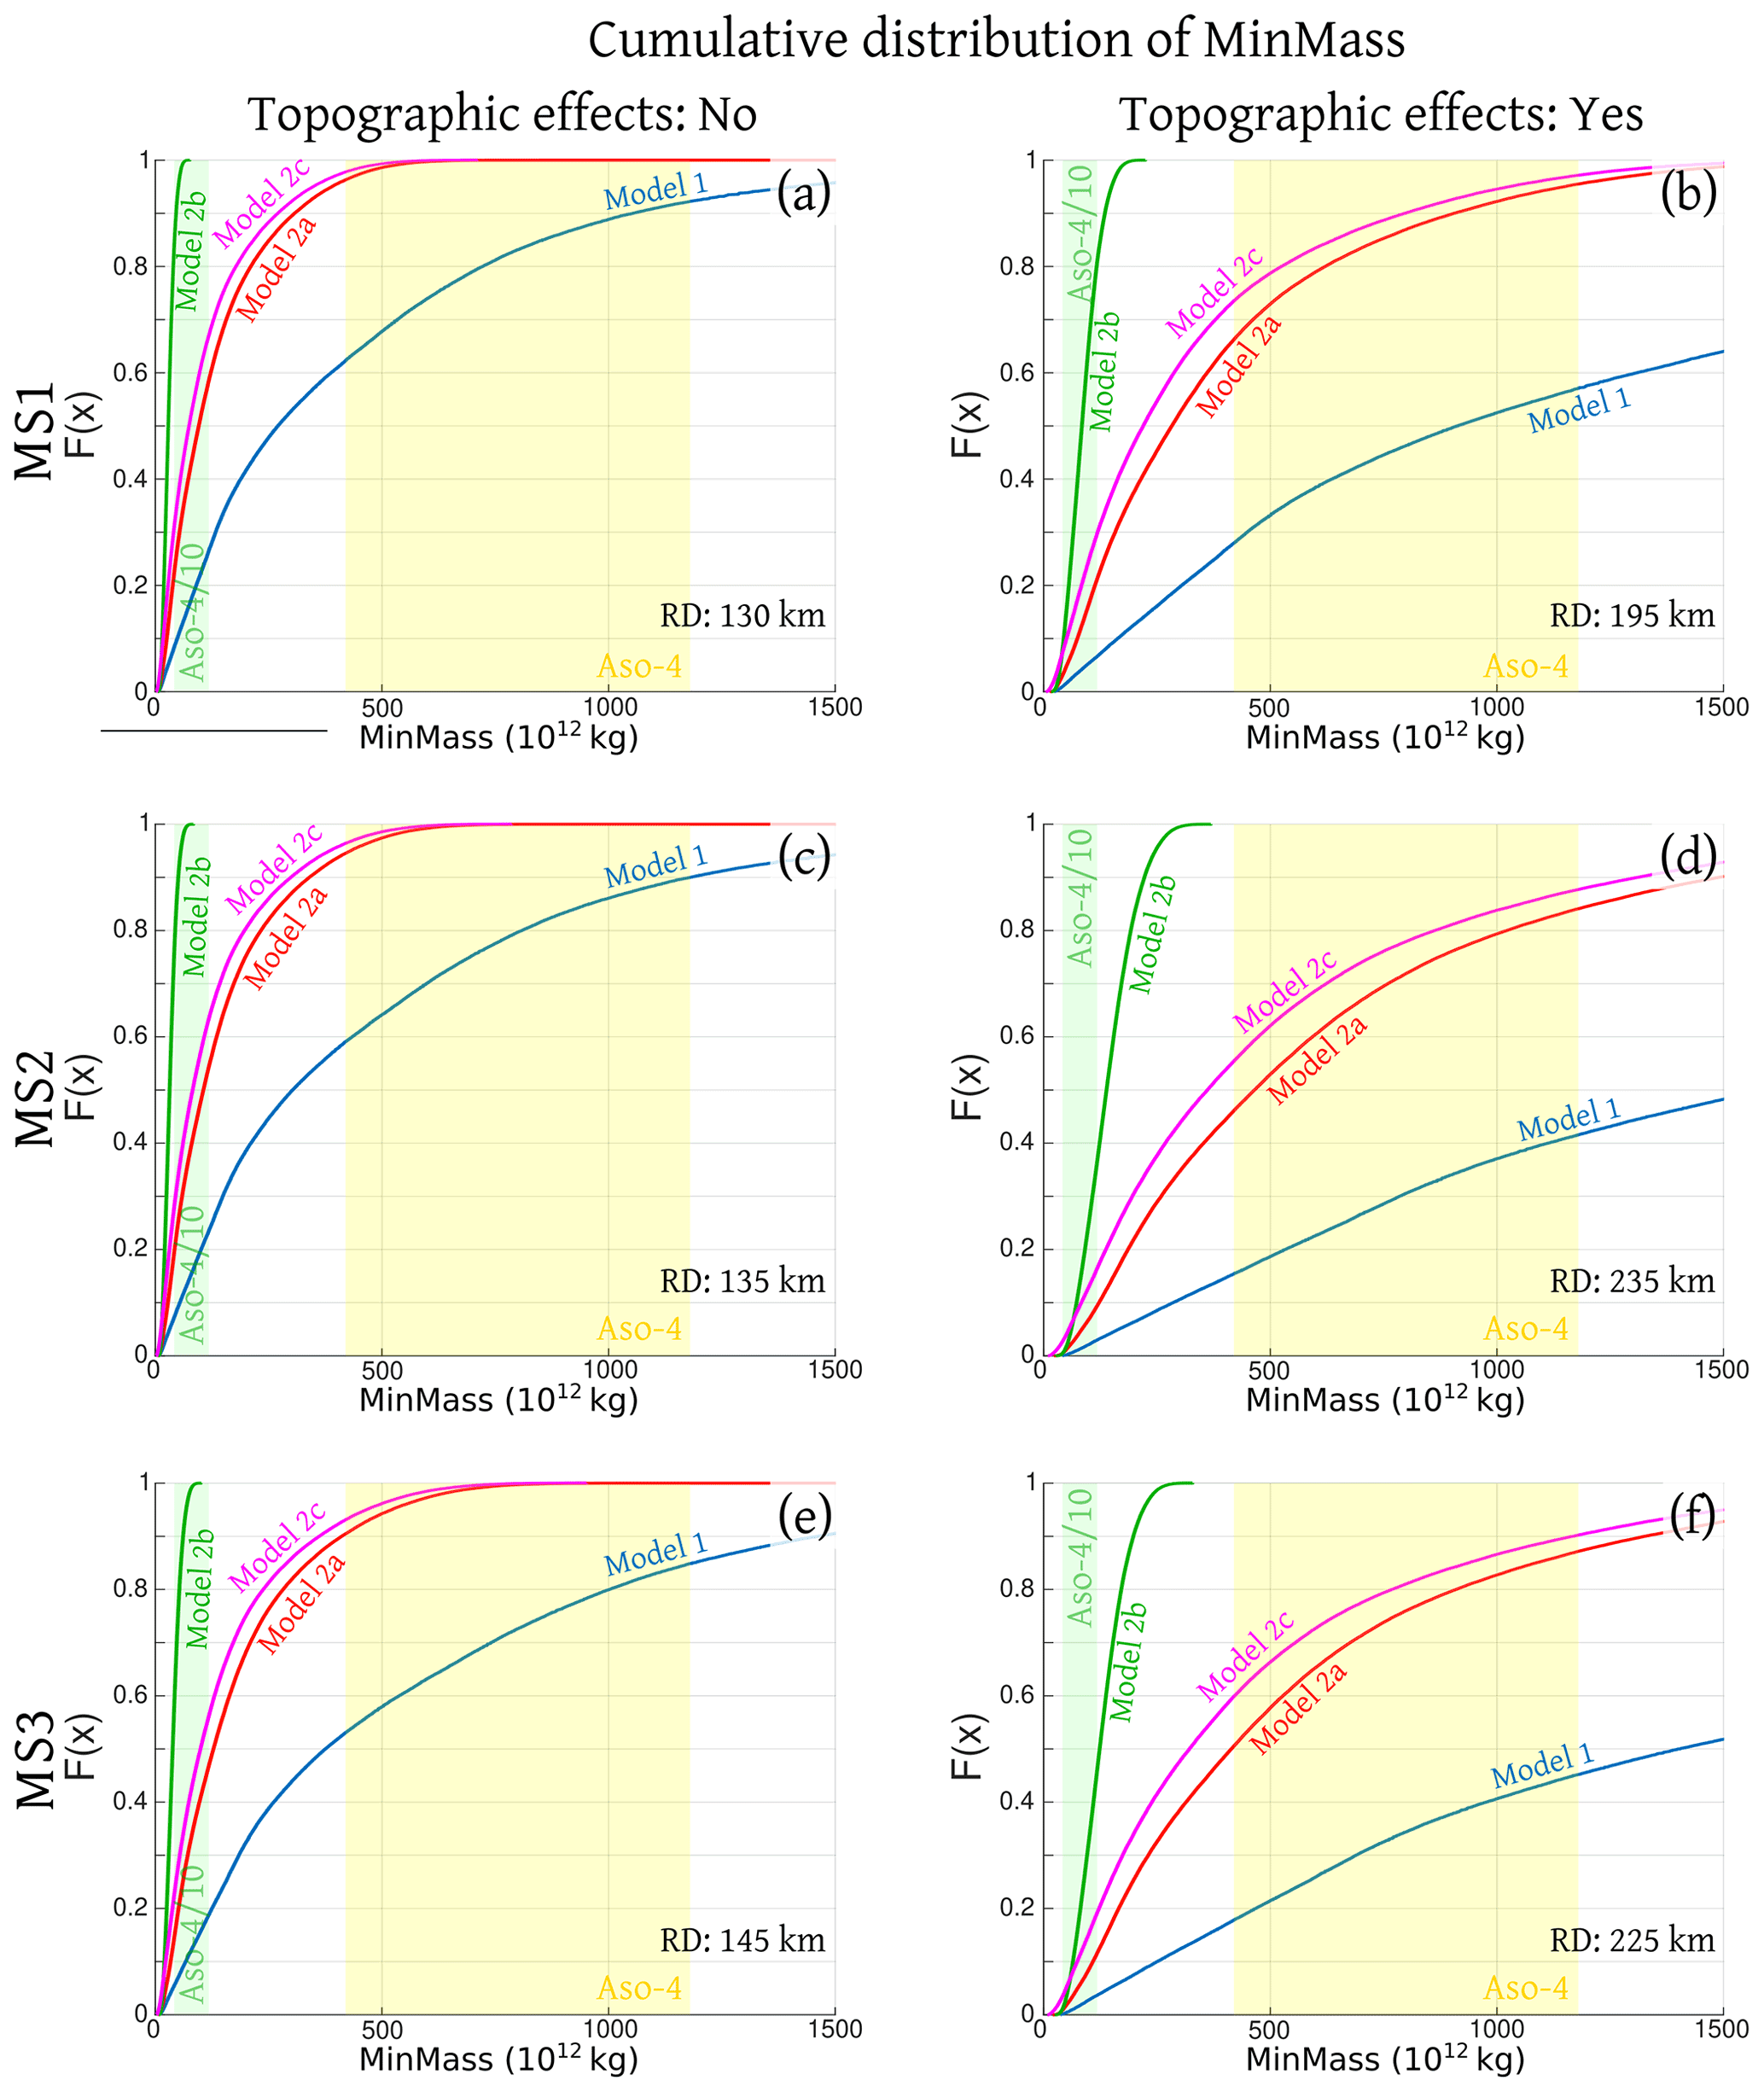
Figure 4Cumulative distributions of the variable MinMass, calculated using models 1, 2a, 2b, 2c. MinMass represents the mass of pyroclasts in a PDC flow required to invade the different marker sites. (a, c, e) are related to maximum runout distances of 130, 135 and 145 km, respectively (the distance between Aso caldera and the marker sites MS1–MS3). (b, d, f) are related to maximum runout distances of 195, 235 and 225 km, respectively, allowing the flow to overcome possible topography shielding effects near the marker sites. Estimates of the mass associated with the PDCs produced during the largest caldera-forming eruption of Aso are included: Aso-, plausibly representing the Aso-4T unit, in green; Aso-4, total PDC overflow, in yellow (Takarada and Hoshizumi, 2020). Plots are based on 100 000 statistical samples.
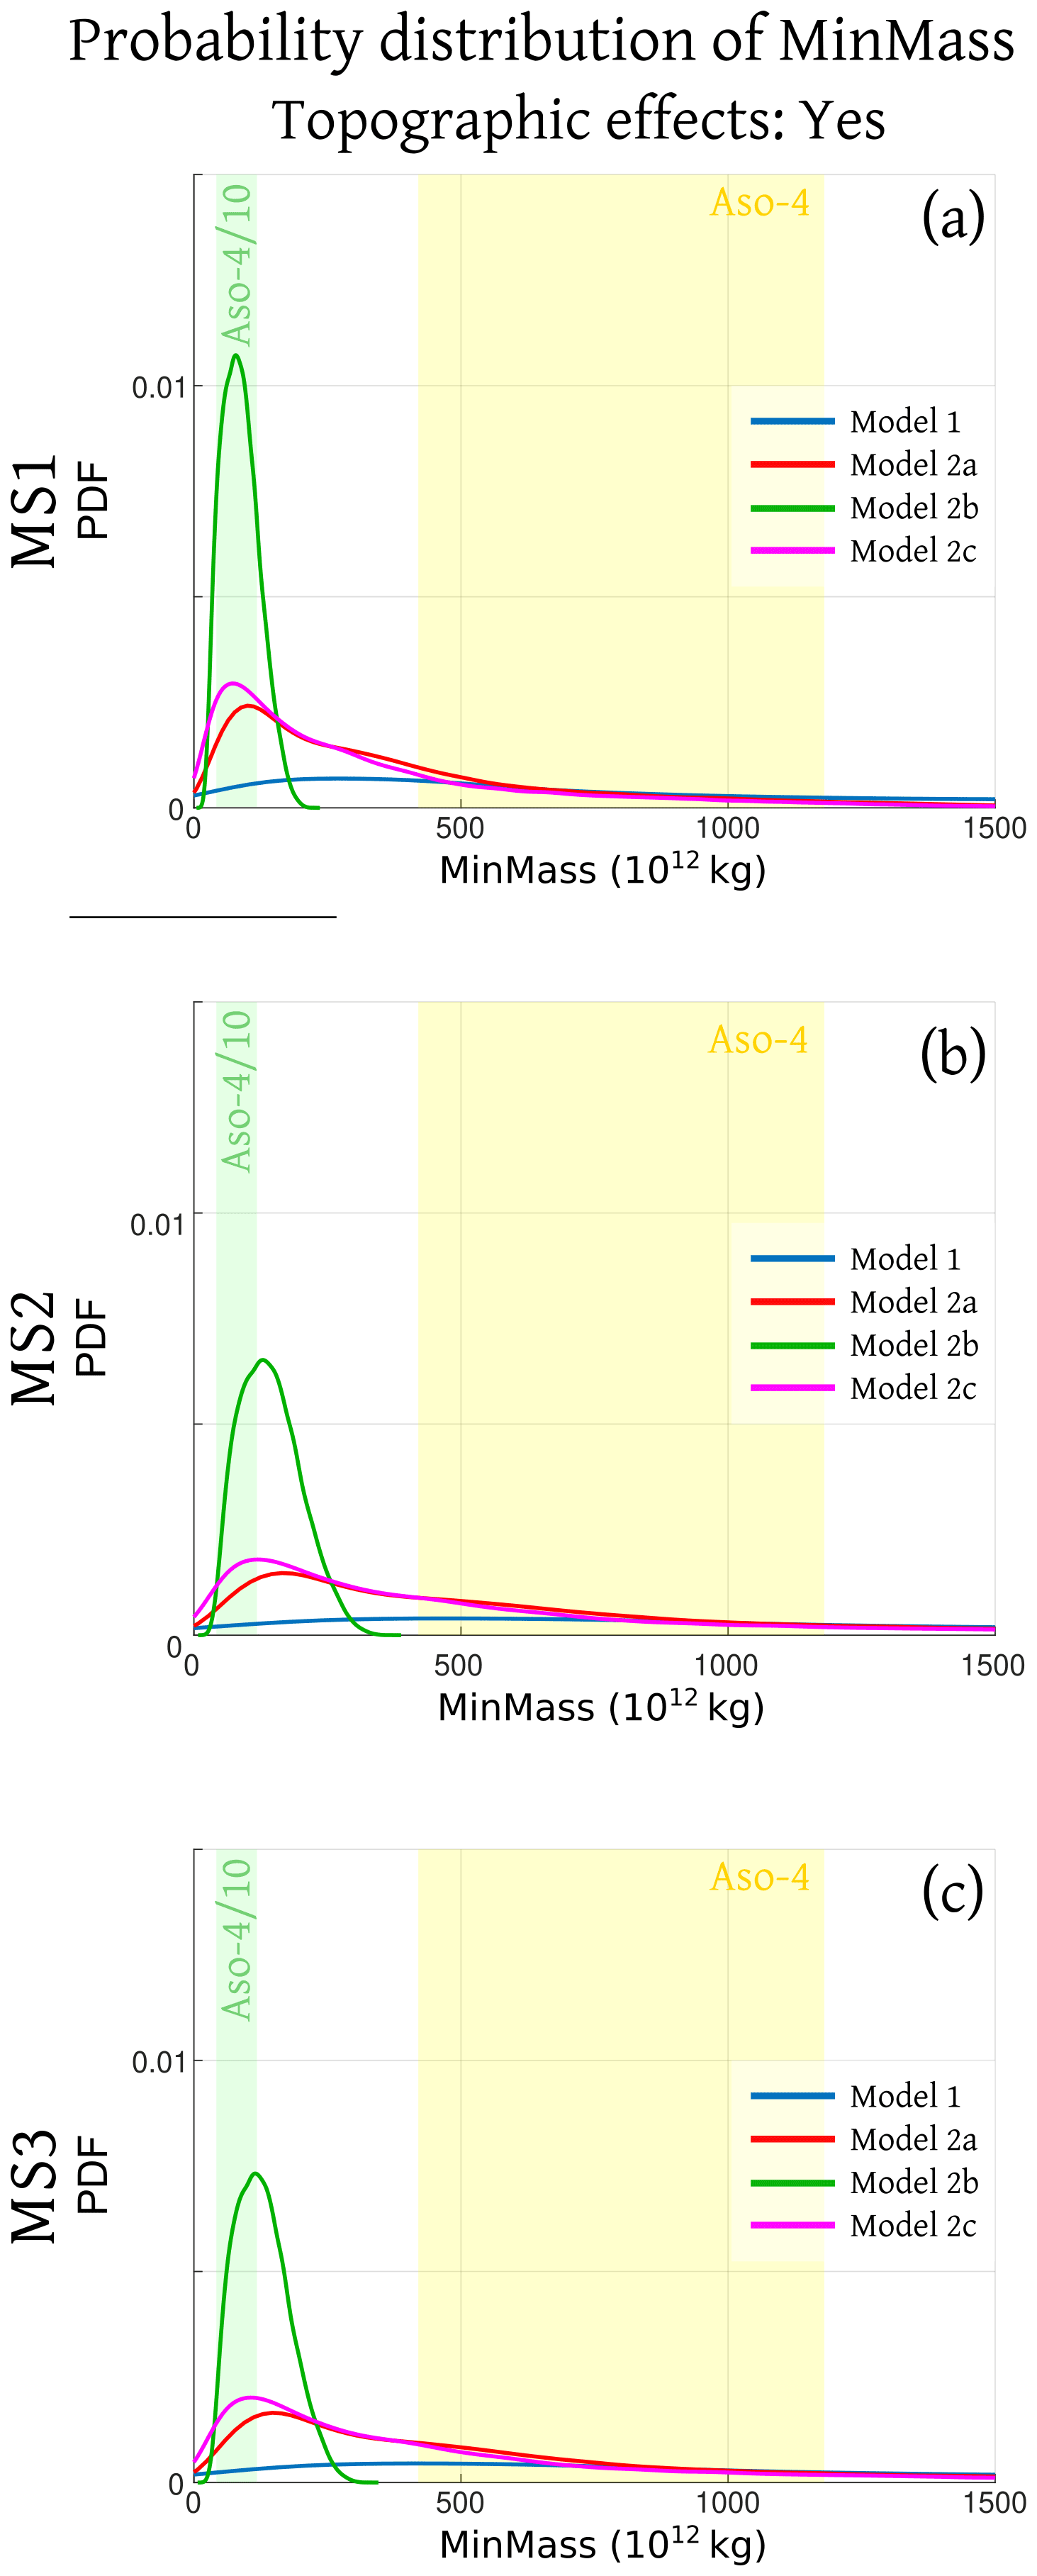
Figure 5Probability density functions of the variable MinMass, calculated using models 1, 2a, 2b, 2c. MinMass represents the mass of pyroclasts in a PDC flow required to invade the marker sites MS1–MS3, related to maximum runout distances allowing the flow to overcome possible topography shielding effects near the marker sites. Estimates of the mass associated with the PDCs produced during the largest caldera-forming eruption of Aso are included: Aso-, possibly representing the Aso-4T unit, in green; Aso-4, total PDC overflow, in yellow (Takarada and Hoshizumi, 2020). Plots based on 100 000 statistical samples.
As the mass of the longest runout PDC of Aso-4 may have been a significant fraction of the PDC flows outside of the caldera, we first assume that the total volume of the long runout PDC is equal to the total outflow PDCs of the eruption. In fact, by considering the entire Aso-4 mass we assume that a single flow contains most of the erupted mass of the outflow deposits, and that this mass was erupted within a time scale less than the PDC emplacement time. This assumption is further discussed in Sect. 5.1.
However, Aso-4 contained several emplacement units and the longest runout PDC could be only one of these, e.g., Aso-4A, Aso-4B, and Aso-4T (Lipman, 1967; Watanabe, 1979; Kaneko et al., 2007). These units contain evidence of at least 10–20 PDCs in total (Takarada and Hoshizumi, 2020). In particular, Aso-4T (Tosu unit) is the most widely distributed low-aspect-ratio ignimbrite unit within Aso PDCs, but its mass remains unknown (Suzuki-Kamata and Kamata, 1990). Therefore, we tentatively also tested a mass of of the total PDC overflow outside the caldera, i.e., 42–118×1012 kg, mean value 78×1012 kg (17–47 km3 DRE, mean value 31 km3 DRE), plausibly representative of Aso-4T mass. Note that this assumption is not aimed at constraining the actual mass of Aso-4T, but it provides an illustrative example of a PDC that does not contain most of the erupted mass of the outflow deposits.
The conditional invasion probabilities obtained according to all models and for each marker site are listed in Tables 3, S4, S6, S8, and S10. In particular, these results indicate that a PDC with a mass of of the total PDC overflow of Aso-4, without considering the shielding effects of topography, would likely affect MS1 according to model 2a, with a conditional probability of 23 %–56 %. After including topographic shielding effects (see Sect. 3.2), this conditional probability is reduced to 3.1 %–21 %. Slightly lower conditional invasion probabilities are computed for MS2 and MS3, with values of 0.5 %–9.3 % and 0.9 %–12 %, respectively, slightly higher for MS4 and MS5, i.e., 11 %–40 % and 7 %–32 %. In contrast, the conditional incursion probabilities based on the total outflow PDCs of the eruption are significantly higher, i.e., 46 %–100 % with 90 % confidence, depending on the marker site. Note that Table 3 also shows the results based on the volume estimates of Aspinall et al. (2021), which are lower than those based on Takarada and Hoshizumi (2020) but still significant, i.e., 49 %–87 % instead of 66 %–96 % for TS1.
Table 3Numerical results of the probability that a PDC derived from a caldera-forming eruption similar to Aso-4 reaches MS1, with and without topographic effects. For each scenario, we present the values of the cumulative curves displayed in Fig. 4 at the central point of the variation range of the PDC mass, while between parentheses we include the results at the extremes of these variation ranges. We test the mass of PDC overflow outside of the caldera of Aso-4 and of that estimate, tentatively representing the Aso-4T unit.

a TE: Topographic effects. b Modified ϕ0 and ws based on MDR modeling and Sauter diameter of analogs (see Table 1).
4.4 Sensitivity analysis
We use a Bayesian belief network (BBN; e.g., Hincks et al., 2014) related to each model to characterize uncertainties on the MinMass and MinVol estimates (Figs. 6 and S12), including the existing correlation coefficients (marked with linking arc arrows) between the input variables and the calculated MinMass and MinVol. This analysis was performed with the UNINET software (Ababei, 2016). The histograms in each BBN also illustrate the shape of the uncertainty distributions for the intermediate variables (gc, gp and ϕcr) and for the minimum mass (MinMass) and volume (MinVol) needed to reach the first marker site, based on the elicited distributions of the relevant input variables.

Figure 6Sensitivity analysis of the evaluation of functional variable MinMass in the different models used in this work. Gray boxes indicate the input parameters, and arrow labels indicate correlation coefficients in relation to model inputs and functional variables. BBN based on 100 000 statistical samples.
Larger correlation values highlight variables to which our probability calculations are most sensitive. Negative correlation means that an increase of that input parameter decreases the MinMass (or MinVol) required to reach the marker site. Positive correlations produce the opposite effect. The correlation coefficients are based on the elicited input distributions and on the 130 km maximum runout distance, i.e., valid for MS1 with no consideration of topographic effects. We tested other runout thresholds but observed negligible differences. In model 1, both the height of collapse and the stress coefficient are significantly relevant, the former negatively, the latter positively, while density does not affect the MinMass estimate.
In all versions of model 2, a significant effect on modeling results comes from the sedimentation velocity and from the initial concentration of solid particles, both positively correlated with MinMass, while the solid density and the Froude number are less relevant. Further research aimed at developing better constraints on the uncertainty distributions of the most influential input parameters would likely better constrain the resolution of probability results.
5.1 First-order integral PDC models
Most recent models of PDCs have highlighted the stratified nature of such flows (Valentine, 2020; Roche et al., 2021; Neri et al., 2022). Nevertheless, in our study we just focused on two simple end member types, suitable for a first-order quantitative assessment of the hazard (see Supplement S2). Although our simplified models do not include the development of dense and dilute regimes within the same flow (Burgisser and Bergantz, 2002; Doyle et al., 2007; Kelfoun and Gueugneau, 2022), models 1 and 2 may represent the two end members, concentrated and dilute flows, respectively, thus shedding some light on more complex assumptions. For example, our results are consistent with Roche et al. (2021), where their model includes both dense and dilute regions, and interactions. In fact, by analyzing data from well-documented explosive eruptions those authors observed that at a given mass discharge rate dilute PDCs have runouts generally longer than those of their concentrated counterparts.
From a risk point of view, our analysis solely derives probability estimates of PDCs reaching the marker sites. A PDC represented by model 2 may do so as a dilute and low temperature flow. Structural risks from these relatively dilute and “cold” PDCs may be similar to risks from tephra fall and would differ radically from the greater thermal and mechanical loads that might be associated with dense PDCs.
Note that for simplicity, rather than modeling a mass discharge rate for unknown eruption duration, we assumed an instantaneous release of a fixed volume of pyroclastic material, as in Neri et al. (2015), Bevilacqua et al. (2017) and Aravena et al. (2020). Further research could follow a similar probabilistic approach by inverting minimum mass discharge rates from the runout distance rather than the MinMass, but this strategy would introduce challenging questions on how volume, eruption duration, runout and flux are quantitatively related. Further model development could also include eliciting the proportion of magma that is erupted as a single volume within a time scale less than the emplacement time.
5.2 Simplified testing of topographic shielding effects
The strategy that we adopted to emulate the effect of the topography on our results relies on the energy conoid approach. Thus, the energy calculation is calculated axisymmetrically along every radial direction, and in some cases the inferred topographic effect might be too intense, as flows can actually converge around obstacles. Also, this approach cannot include partial blocking by topographic obstacles, and returning waves (e.g. Todesco et al., 2006; Esposti Ongaro et al., 2020). Although we reduced the spurious effects related to the exact geographical coordinates of the PDC source by randomly varying the center of propagation inside the Aso caldera (see Fig. 1), only a 2D or 3D model would be capable to capture the more complex source-dependent features of the fluid dynamics.
Whereas the MinMass estimates obtained on a flat surface are probably underestimated, i.e., conservative, our simplified strategy to account for topographic shielding effects might instead overestimate MinMass in some cases. In fact, our approach invokes runout thresholds such that the inputs that enable the PDC to reach a marker on a flat surface will also project the marker site invasion likelihood with 95 % confidence when the topography is considered by the simplifying expedient adopted. Therefore, lower runout thresholds would produce intermediate MinMass values between those obtained on a flat surface and those that account for topographic effects with 95 % confidence. However, these intermediate values would be associated with a lower chance of marker site incursion when the topography is considered and a relatively low kinetic energy budget at the marker site. These bounding effects may be further studied through statistical methods that analyze the edge of the inundated region once 2D or 3D models are applied (Hyman et al., 2019).
5.3 Expert judgment approach and the input sampling strategy
Our results are valid under the assumption that the BBN samples drawn from the elicited inputs are independent, but this might not be valid in some cases. For example, in model 1 the combination of high collapse height H and low equivalent friction τ could be problematic and, likewise, high density is hard to reconcile with a high collapse height (see Table 1 and Supplement S2). Similar questions may arise about other combinations of input values. While the median values of our estimates are not likely to be significantly affected by such statistical dependence effects, the application of interparameter correlations or probabilistic copula techniques would become really important for making robust probabilistic estimates of extreme events, say with less than 5 % probability (Bamber et al., 2019; Barons and Aspinall, 2020; Werner et al., 2021). Further model inversion analysis could evaluate which extreme events are in fact drawn from combinations of independent parameters that are physically debatable.
An indirect and interesting finding of our study is the identification of input variables that are most difficult to constrain. For example, in model 1, while for dense debris avalanches or dome collapse PDCs the variable H can be well defined, some of the experts found it difficult to constrain height H values for PDCs generated from explosion columns. In fact, the dense underflow is thought to be formed by segregation of particles and so it is essentially unknown how initial potential energy is partitioned between the dense and less dense components of the PDC: the effective height H is not likely to be related to overall column height. There would be a similar issue with the H variable in the energy cone formulation, which was not implemented in this study (Bevilacqua et al., 2022; Aravena et al., 2022).
As the emplacement of a low-aspect-ratio ignimbrite has never been observed, we tested several models and a wide range of input parameters. Our purpose was to capture the uncertainty affecting the plausible dynamics of similar flows, and constrain the minimum mass (MinMass) required to reach marker site distances; we did not endeavor to produce an optimized reconstruction of parameters for a flow identical to Aso-4 PDCs, as such. Nevertheless, one aspect that could be addressed in further research is calibration with large scale PDCs which originated from other volcanoes, e.g., Taupo, AD 232, (Dade and Huppert, 1996, 1997; Wilson, 1985a, b, 1997), or Krakatau, 1883 (Carey et al., 1996, 2000), where volumes as well as runouts are relatively well-established. For example, the initial solid fraction of the PDC of Taupo, AD 232, was estimated as 0.3 % by Dade and Huppert (1996), by model fitting. Nevertheless, while discussing density above the ground, Wilson (1985b, 1997) observed tens percentage solid. Although they both do not consider that column collapse creates highly variable solid fractions, these differences outline the dissimilar conditions ranging from density current dynamics with particle deposition to one possibly similar to a rock avalanche with constant friction.
It might be feasible to repeat our analysis approach to find the runout model parameter PDFs which best fit those observations. However, since these parameters would be related to different source conditions, they might need detailed discussion and perhaps additional expert judgment sessions before being invoked as counterparts to this case study. Similarly, we note that for our Aso-4T analysis, while we did not elicit the volume, we relied on the same runout model parameters that were elicited for the total Aso-4 PDC overflow outside of the caldera; eliciting and setting different parameters in the model might improve the robustness of the Aso-4T probability estimates.
5.4 Probability of occurrence of large-scale events in Japan
The PDC invasion hazard at the marker sites is ultimately related to the recurrence rate of catastrophic caldera-forming eruptions at the Aso volcano. We estimated PDC invasion probabilities that are all conditional on the occurrence of large-scale eruptions. In practice, we are dealing with extremely low probabilities of occurrence, but extremely high impact events. Although this aspect is beyond the objectives of this paper, a full magnitude frequency model for the Aso caldera could be integrated into our PDC invasion probability estimates to obtain hazard assessments at 100 or 1000 years. We briefly review the main historical results available.
For eruptions > M 7, global studies (Decker, 1990; Simkin, 1993; Mason et al., 2004; Deligne et al., 2010; Brown et al., 2014) suggest a minimum global average recurrence rate of ∼1–2 times per 1 kyr (Newhall et al., 2018). Once record incompleteness is corrected for (Kiyosugi et al., 2015; Rougier et al., 2016), the value approaches 2 events per 1 kyr. At individual volcanoes, >M 7 recurrence rates range from 1 per 10 kyr to 1 per 100 kyr (Newhall et al., 2018). For eruptions > M 8, Rougier et al. (2018) estimated a return period of 17 ka (95 % confidence interval 5.5–48 ka) from analysis of the LaMEVE database (Crosweller et al., 2012).
More recently, Aspinall et al. (2021), implementing a comprehensive stochastic uncertainty analysis, estimated the probability in the next 100 years of an eruption from the Aso volcano on the same scale as Aso-4. They set up a Bayesian belief network informed by multiple strands of evidence from volcanology, petrology, geochemistry and geophysics, together with reviews of published data, models, and inputs from expert elicitation. Based on the current and expected state of the Aso volcanic system in the short term, they assessed the probability of a similar eruption ≥M8 at the Aso volcano in the next 100 years to be no greater than 10−8– 10−9 (i.e., 10−10–10−11 on an annualized basis).
We describe a new method for estimating the probabilities that distal geographic locations might be invaded by a large pyroclastic density current (PDC) from a high magnitude explosive eruption by expressing the problem in terms of PDC flow mass and related uncertainties. The ranges of key parameters were obtained by expert elicitation performed in two remotely organized sessions.
Our analysis relied on different versions of the box model integral formulation for axisymmetric gravity-driven particle currents (Huppert and Simpson, 1980), and a simplified testing of topographic shielding effects. We focused on models based on an underlying assumption of instantaneous release of pyroclastic material with fixed volume of pyroclastic material, which permit analytical solutions, enabling us to utilize a very fast model-inversion approach. In particular, we adopted the energy conoid approach to generate regional PDC invasion maps, based on the comparison of the mass-dependent kinetic energy of the flow with the potential energy needed to overcome topographic obstacles along radial directions. We considered four different models based on two physical sets of assumptions:
- a.
Model 1 assumed that the entire amount of solid material originates from a prescribed height above the volcano and flows as a granular current slowed down by a constant stress, i.e., a rock avalanche dynamics model.
- b.
Models 2a–c were two-phase density current dynamics with particle deposition and thermally buoyant gas. Three variants of this approach were tested, i.e., the first implemented the expert judgments, the second tested the hypothetical scenario of a more dilute ash cloud, and the third assumed a “cold” gas phase in the generation of PDC flow.
We included analytical solutions of these kinetic models on a flat topography and with a simplified approach for testing topographic shielding effects on PDC flow runout. Finally, we used a Bayesian belief network related to each inversion model to probabilistically evaluate the uncertainties on the mass required to invade the marker sites, estimating correlation coefficients between the input variables and the calculated mass, and showing that the greatest influence of correlation effects is exerted by sedimentation velocity and the initial concentration of solid particles.
Our probabilistic approach was applied to the case of the Aso caldera, Japan, which is located at distances between ∼115 and ∼145 km from 5 marker sites. We found that a rock avalanche dynamics model would require a ∼3-times greater mass to reach the same marker sites with 50 % probability than the elicited density current dynamics model; a hypothetical scenario of a more dilute ash cloud would require a ∼3-times less mass, and a “cold” density current would require ∼30 % lower mass. Our strategy to consider topography with a simplifying procedure produced the finding that ∼3-times greater mass values are needed to overcome topographic controls than is indicated by PDC runout estimates obtained for a flat surface. We noted that in the rock avalanche model the identification and constraining of the input variables by expert judgment was more difficult than in the density current models.
According to the density current formulation and the emulation of topographic effects, we showed that an axisymmetric PDC with a mass similar to the Aso-4 total PDC overflow outside the caldera would likely reach the sites of the three distal critical infrastructures with probabilities in the range 46 %–100 % depending on the marker site and the uncertainty on the erupted mass. By tentatively testing a mass of of the total PDC overflow of Aso-4 outside the caldera, plausibly representative of the single largest PDC flow unit, we obtained a probability range of 0.5 %–40 %. These numbers are based on the PDC mass described in Takarada and Hoshizumi (2020) and only present an illustrative example of application of our methodology to very uncertain estimates.
Our methodology provides a rational basis for assessing the probability of PDC invasion at critical geographic locations when there is major uncertainty about the actual or forecast extent of flow runout from a major magnitude ignimbrite eruption scenario.
BoxMapProb 2.0 is available at https://doi.org/10.5281/zenodo.7189776 (Aravena, 2022) (Apache 2.0 license). The random datasets of runout model parameters, the derived data, and the R scripts utilized for statistical analysis are available upon request.
The supplement related to this article is available online at: https://doi.org/10.5194/nhess-22-3329-2022-supplement.
AB, AC, AN, BH, SS, WA contributed to the choice of the different modeling strategies and evaluated the assumptions adopted. AB, AC, AN, BH, SS were elicited in the expert judgment sessions organized by WA. AB and AA calculated the presented results. AB and AA prepared the first draft of the manuscript. All authors contributed to the writing and revision of the manuscript.
The contact author has declared that none of the authors has any competing interests.
Publisher's note: Copernicus Publications remains neutral with regard to jurisdictional claims in published maps and institutional affiliations.
We thank Charles Connor for contributing as one of experts in the elicitation sessions together with the authors Andrea Bevilacqua, Antonio Costa, Augusto Neri, Brittain Hill and Stephen Sparks. We are very grateful to Shinji Takarada for the scientific discussions that stimulated this research initially and for the useful comments that he and an anonymous reviewer provided during the review process. A preliminary version of this study was presented in Aspinall et al. (2019).
Alvaro Aravena was financed by the French government (IDEX-ISITE initiative 16-IDEX-0001, CAP 20–25). This work was supported in part by Aspinall & Associates.
This paper was edited by Amy Donovan and reviewed by Shinji Takarada and one anonymous referee.
Ababei, D.: UNINET, Software designed by the Risk and Environmental Modeling Group, Delft University of Technology, Lighttwist Software, Fitzroy North, Vic., Australia, https://lighttwist-software.com/uninet/ (last access: 4 January 2019), 2016.
Allen, S. R. and Cas, R. A.: Transport of pyroclastic flows across the sea during the explosive, rhyolitic eruption of the Kos Plateau Tuff, Greece, Bull. Volcanol., 62, 441–456, https://doi.org/10.1007/s004450000107, 2001.
Aoki, K.: Revised age and distribution of ca. 87 ka Aso-4 tephra based on new evidence from the northwest Pacific Ocean, Quatern. Int., 178, 100–118, https://doi.org/10.1016/j.quaint.2007.02.005, 2008.
Aravena, A.: AlvaroAravena/BoxMapProb: BoxMapProb (v2.0), Zenodo [code], https://doi.org/10.5281/zenodo.7189776, 2022.
Aravena, A., Cioni, R., Bevilacqua, A., de' Michieli Vitturi, M., Esposti Ongaro, T., and Neri, A.: Tree-branching-based enhancement of kinetic energy models for reproducing channelization processes of pyroclastic density currents, J. Geophys. Res.-Solid, 125, e2019JB019271, https://doi.org/10.1029/2019JB019271, 2020.
Aravena, A., Chupin, L., Dubois, T., and Roche, O.: The influence of gas pore pressure in dense granular flows: numerical simulations versus experiments and implications for pyroclastic density currents, Bull. Volcanol., 83, 77, https://doi.org/10.1007/s00445-021-01507-7, 2021.
Aravena, A., Bevilacqua, A., de' Michieli Vitturi, M., Esposti Ongaro, T., Neri, A., and Cioni, R.: Calibration strategies of PDC kinetic energy models and their application to the construction of hazard maps, Bull. Volcanol., 84, 29, https://doi.org/10.1007/s00445-022-01538-8, 2022.
Armienti, P., Macedonio, G., and Pareschi, M. T.: A numerical model for simulation of tephra transport and deposition applications to May 18, 1980, Mount St. Helens eruption, J. Geophys. Res.-Solid., 93, 6463–6476, https://doi.org/10.1029/JB093iB06p06463, 1988.
Aspinall, W. P.: Structured elicitation of expert judgment for probabilistic hazard and risk assessment in volcanic eruptions, in: Statistics in Volcanology, Geological Society of London on behalf of IAVCEI, edited by: Mader, H. M., Coles, S. G., Connor, C. B., and Connor, L. J., Geological Society for IAVCEI, London, 296 pp., https://doi.org/10.1144/IAVCEI001.2, 2006.
Aspinall, W. P., Bevilacqua, A., Costa, A., Inakura, H., Mahony, S., Neri, A., and Sparks, R. S. J.: Probabilistic reconstruction (or forecasting) of distal runouts of large magnitude ignimbrite PDC flows sensitive to topography using mass-dependent inversion models, in: AGU Fall Meeting 2019, San Francisco, CA, USA, https://doi.org/10.1002/essoar.10502300.1, 2019.
Aspinall, W. P., Sparks, R. S. J., Connor, C. B., Hill, B. E., Costa, A., Rougier, J. C., Inakura, H., and Mahony, S.: Aso volcano: estimating the probabilistic likelihood of a future Aso4-scale eruption from stochastic uncertainty analysis of volcanological evidence using importance sampling, in: International Workshop on Rock Mechanics and Engineering Geology in Volcanic Fields (RMEGV2021), Fukuoka, Japan, edited by: Ito, T., Ohta, T., and Osada, M., SRM & JSEG, ISBN 978-4-907430-05-4, 2021.
Baines, P. G. and Sparks, R. S. J.: Dynamics of volcanic ash clouds from supervolcanic eruptions, Geophys. Res. Lett, 32, L24808, https://doi.org/10.1029/2005GL024597, 2005.
Bamber, J. L., Oppenheimer, M., Kopp, R., Aspinall, W., and Cooke, R.: Ice sheet contributions to future sea-level rise from structured expert judgment, P. Natl. Acad. Sci. USA, 116, 11195–11200, https://doi.org/10.1073/pnas.1817205116, 2019.
Barons, M. J. and Aspinall, W.: Anticipated impacts of Brexit scenarios on UK food prices and implications for policies on poverty and health: a structured expert judgement approach, BMJ Open, 10, e032376, https://doi.org/10.1136/bmjopen-2019-032376, 2020.
Bevilacqua, A.: Doubly stochastic models for volcanic hazard assessment at Campi Flegrei caldera, Theses 21, Edizioni della Normale, Birkhäuser/Springer, Pisa, p. 227, https://doi.org/10.1007/978-88-7642-577-6, 2016.
Bevilacqua, A., Isaia, R., Neri, A., Vitale, S., Aspinall, W. P., Bisson, M., Flandoli, F., Baxter, P. J., Bertagnini, A., Esposti Ongaro, T., Iannuzzi, E., Pistolesi, M., and Rosi, M.: Quantifying volcanic hazard at Campi Flegrei caldera (Italy) with uncertainty assessment: I. Vent opening maps, J. Geophys. Res.-Solid, 120, 2309–2329, https://doi.org/10.1002/2014JB011775, 2015.
Bevilacqua, A., Neri, A., Bisson, M., Esposti Ongaro, T., Flandoli, F., Isaia, R., Rosi, M., and Vitale, S.: The effects of vent location, event scale, and time forecasts on pyroclastic density current hazard maps at Campi Flegrei caldera (Italy), Front. Earth Sci., 5, 72, https://doi.org/10.3389/feart.2017.00072, 2017.
Bevilacqua, A., Bursik, M. I., Patra, A. K., Pitman, B. E., Yang, Q., Sangani, R., and Kobs-Nawotniak, S.: Late Quaternary eruption record and probability of future volcanic eruptions in the Long Valley volcanic region (CA, USA), J. Geophys. Res.-Solid, 123, 5466–5494, https://doi.org/10.1029/2018JB015644, 2018.
Bevilacqua, A., Patra, A. K., Bursik, M. I., Pitman, E. B., Macías, J. L., Saucedo, R., and Hyman, D.: Probabilistic forecasting of plausible debris flows from Nevado de Colima (Mexico) using data from the Atenquique debris flow, 1955, Nat. Hazards Earth Syst. Sci., 19, 791–820, https://doi.org/10.5194/nhess-19-791-2019, 2019.
Bevilacqua, A., Aravena, A., Neri, A., Gutiérrez, E., Escobar, D., Schliz, M., Aiuppa, A., and Cioni, R.: Thematic vent opening probability maps and hazard assessment of small-scale pyroclastic density currents in the San Salvador volcanic complex (El Salvador) and Nejapa-Chiltepe volcanic complex (Nicaragua), Nat. Hazards Earth Syst. Sci., 21, 1639–1665, https://doi.org/10.5194/nhess-21-1639-2021, 2021.
Bevilacqua, A., Macedonio, G., Neri, A., Orsi, G., and Petrosino, P.: Volcanic Hazard Assessment at the Campi Flegrei Caldera (Italy), in: Campi Flegrei, Active Volcanoes of the World, edited by: Orsi, G., D'Antonio, M., and Civetta, L., Springer, https://doi.org/10.1007/978-3-642-37060-1_12, 2022.
Biagioli, G., Bevilacqua, A., Esposti Ongaro, T., and de' Michieli Vitturi, M.: PyBox: a Python tool for simulating the kinematics of pyroclastic density currents with the box-model approach, Reference and user's guide, Zenodo [code], https://doi.org/10.5281/zenodo.2616551, 2019.
Black, B., Neely, R., and Manga, M.: Campanian Ignimbrite volcanism, climate, and the final decline of the Neanderthals, Geology, 43, 411–414, https://doi.org/10.1130/G36514.1, 2015.
Bonadonna, C. and Phillips, J.: Sedimentation from strong volcanic plumes, J. Geophys. Res.-Solid, 108, 2340, https://doi.org/10.1029/2002JB002034, 2003.
Bonnecaze, R. T., Hallworth, M. A., Huppert, H. E., and Lister, J. R.: Axisymmetric particle-driven gravity currents, J. Fluid Mech., 294, 93–121, https://doi.org/10.1017/S0022112095002825, 1995.
Brosch, E., Lube, G., Cerminara, M., Esposti-Ongaro, T., Breard, E. C. P., Dufek, J., Sovilla, B., and Fullard, L.: Destructiveness of pyroclastic surges controlled by turbulent fluctuations, Nat. Commun., 12, 7306, https://doi.org/10.1038/s41467-021-27517-9, 2021.
Brown, S. K., Crosweller, H. S., Sparks, R. S. J., Cottrell, E., Deligne, N. I., Guerrero, N. O., Hobbs, L., Kiyosugi, K., Loughlin, S. C., Siebert, L., and Takarada, S.: Characterisation of the Quaternary eruption record: analysis of the Large Magnitude Explosive Volcanic Eruptions (LaMEVE) database, J. Appl. Volcanol., 3, 1–22, https://doi.org/10.1186/2191-5040-3-5, 2014.
Burgisser, A. and Bergantz, G. W.: Reconciling pyroclastic flow and surge: the multiphase physics of pyroclastic density currents, Earth Planet. Sc. Lett., 202, 405–418, 2002.
Bursik, M. I. and Woods, A. W.: The dynamics and thermodynamics of large ash flows, Bull. Volcanol., 58, 175–193, https://doi.org/10.1007/s004450050134, 1996.
Carey, S., Sigurdsson, H., Mandeville, C., and Bronto, S.: Pyroclastic flows and surges over water: an example from the 1883 Krakatau eruption, Bull. Volcanol., 57, 493–511, https://doi.org/10.1007/BF00304435, 1996.
Carey, S., Sigurdsson, H., Mandeville, C., and Bronto, S.: Volcanic hazards from pyroclastic flow discharge into the sea: examples from the 1883 eruption of Krakatau, Indonesia, Special Papers, Geological Society of America, 1–14, https://doi.org/10.1130/0-8137-2345-0.1, 2000.
Cas, R. A. and Wright, J. V.: Subaqueous pyroclastic flows and ignimbrites: an assessment, Bull. Volcanol., 53, 357–380, https://doi.org/10.1007/BF00280227, 1991.
Cas, R. A., Wright, H. M., Folkes, C. B., Lesti, C., Porreca, M., Giordano, G., and Viramonte, J. G.: The flow dynamics of an extremely large volume pyroclastic flow, the 2.08-Ma Cerro Galán Ignimbrite, NW Argentina, and comparison with other flow types, Bull. Volcanol., 73, 1583–1609, https://doi.org/10.1007/s00445-011-0564-y, 2011.
Cigolini, C., Coppola, D., Yokoo, A., and Laiolo, M.: The thermal signature of Aso Volcano during unrest episodes detected from space and ground-based measurements, Earth Planets Space, 70, 67, https://doi.org/10.1186/s40623-018-0831-7, 2018.
Cooke, R. M.: Experts in Uncertainty: Opinion and Subjective Probability in Science, Oxford Univ. Press, New York, ISBN 10:0195064658, ISBN 13:978-0195064650, 1991.
Costa, A. and Martí, J.: Stress Field Control during Large Caldera-Forming Eruptions, Front. Earth Sci., 4, 92, https://doi.org/10.3389/feart.2016.00092, 2016.
Costa, A., Folch, A., Macedonio, G., Giaccio, B., Isaia, R., and Smith, V. C.: Quantifying volcanic ash dispersal and impact of the Campanian Ignimbrite super-eruption, Geophys. Res. Lett., 39, L10310, https://doi.org/10.1029/2012GL051605, 2012.
Costa, A., Smith, V. C., Macedonio, G., and Matthews, N. E.: The magnitude and impact of the Youngest Toba Tuff super-eruption, Front. Earth Sci., 2, 16, https://doi.org/10.3389/feart.2014.00016, 2014.
Costa, A., Pioli, L., and Bonadonna, C.: Assessing tephra total grain-size distribution: Insights from field data analysis, Earth Planet. Sc. Lett., 443, 90–107, https://doi.org/10.1016/j.epsl.2016.02.040, 2016.
Costa, A., Suzuki, Y. J., and Koyaguchi, T.: Understanding the plume dynamics of explosive super-eruptions, Nat. Commun., 9, 1–6, https://doi.org/10.1038/s41467-018-02901-0, 2018.
Crosweller, H. S., Arora, B., Brown, S. K., Cottrell, E., Deligne, N. I., Guerrero, N. O., Hobbs, L., Kiyosugi, K., Loughlin, S. C., Lowndes, J., Nayembil, M., Sieber, L., Sparks, R. S. J., Takarada, S., and Venzke, E.: Global database on large magnitude explosive volcanic eruptions (LaMEVE), J. Appl. Volcanol., 1, 1–13, https://doi.org/10.1186/2191-5040-1-4, 2012.
Crowe, C., Sommerfeld, M., and Tsuji, Y.: Multiphase Flows with Droplets and Particles, CRC Press, Boston, ISBN 9780429106392, https://doi.org/10.1201/b11103, 1998.
Dade, W. B. and Huppert, H. E: Runout and fine-sediment deposits of axisymmetric turbidity currents, J. Geophys. Res.-Oceans, 100, 18597–18609, https://doi.org/10.1029/95JC01917, 1995.
Dade, W. B. and Huppert, H. E.: Emplacement of the Taupo Ignimbrite by a dilute turbulent flow, Nature, 381, 509–512, https://doi.org/10.1038/381509a0, 1996.
Dade, W. and Huppert, H.: Emplacement of Taupo ignimbrite, Nature, 385, 307–308, https://doi.org/10.1038/385307a0, 1997.
Dade, W. B. and Huppert, H. E.: Long-runout rockfalls, Geology, 26, 803–806, https://doi.org/10.1130/0091-7613(1998)026<0803:LRR>2.3.CO;2, 1998.
Decker, R. W.: How often does a Minoan eruption occur? Thera and the Aegean world III, in: Earth Sciences, edited by: Hardy, D. A., Keller, J., Galanopoulos, V. P., Fleming, N. C., and Druitt, T. H., The Thera Foundation, London, p. 1240, ISBN 10:0950613371, ISBN 13:9780950613376, 1990.
Deligne, N. I., Coles, S. G., and Sparks, R. S. J.: Recurrence rates of large explosive volcanic eruptions, J. Geophys. Res.-Solid, 115, B06203, https://doi.org/10.1029/2009JB006554, 2010.
DeMets, C., Gordon, R. G., and Argus, D. F.: Geologically current plate motions, Geophys. J. Int., 181, 1–80, https://doi.org/10.1111/j.1365-246X.2009.04491.x, 2010.
Dioguardi, F., Mele, D., Dellino, P., and Dürig, T.: The terminal velocity of volcanic particles with shape obtained from 3D X-ray microtomography, J. Volcanol. Geoth. Res., 329, 41—3, https://doi.org/10.1016/j.jvolgeores.2016.11.013, 2017.
Doyle, E. E., Huppert, H. E., Lube, G., Mader, H. M., and Sparks, R. S. J.: Static and flowing regions in granular collapses down channels: insights from a sedimenting shallow water model, Phys. Fluids, 19, 106601, https://doi.org/10.1063/1.2773738, 2007.
Dufek, J.: The fluid mechanics of pyroclastic density currents, Annu. Rev. Fluid Mech., 48, 459–485, 2016.
Dufek, J. and Bergantz, G. W.: Dynamics and deposits generated by the Kos Plateau Tuff eruption: controls of basal particle loss on pyroclastic flow transport, Geochem. Geophy. Geosy., 8, Q12007, https://doi.org/10.1029/2007GC001741, 2007.
Esposti Ongaro, T., Widiwijayanti, C., Clarke, A. B., Voight, B., and Neri, A.: Multiphase-flow numerical modeling of the 18 May 1980 lateral blast at Mount St. Helens, USA, Geology, 39, 535–538, https://doi.org/10.1130/G31865.1, 2011.
Esposti Ongaro, T., Orsucci, S., and Cornolti, F.: A fast, calibrated model for pyroclastic density currents kinematics and hazard, J. Volcanol. Geoth. Res., 327, 257–272, https://doi.org/10.1016/j.jvolgeores.2016.08.002, 2016.
Esposti Ongaro, T., Komorowski, J. C., Legendre, Y., and Neri, A.: Modelling pyroclastic density currents from a subplinian eruption at La Soufrière de Guadeloupe (West Indies, France), Bull. Volcanol., 82, 76, https://doi.org/10.1007/s00445-020-01411-6, 2020.
Fauria, K. E., Manga, M., and Chamberlain, M.: Effect of particle entrainment on the runout of pyroclastic density currents, J. Geophys. Res.-Solid, 121, 6445–6461, https://doi.org/10.1002/2016JB013263, 2016.
Fisher, R. V., Orsi, G., Ort, M., and Heiken, G.: Mobility of a large-volume pyroclastic flow – emplacement of the Campanian ignimbrite, Italy, J. Volcanol. Geoth. Res., 56, 205–220, https://doi.org/10.1016/0377-0273(93)90017-L, 1993.
Hallworth, M. A., Hogg, A., and Huppert, H. E.: Effects of external flow on compositional and particle gravity currents, J. Fluid Mech., 359, 109–142, https://doi.org/10.1017/S0022112097008409, 1998.
Hasenaka, T.: Evaluation of eruptivity of silicic magma in Aso volcano system, in: Proceedings of the International Meeting on Eruptive History and Informatics 2016-2, January 2017, Fukuoka, https://gbank.gsj.jp/ld/resource/geolis/201710289 (last access: 12 October 2022), 2016.
Hayakawa, Y.: Proposal of eruption magnitude, Bull. Volcanol. Soc. Jpn., 6, 223–226, https://doi.org/10.18940/kazan.38.6_223, 1993.
Hincks, T. K., Komorowski, J. C., Sparks, S. R., and Aspinall, W. P.: Retrospective analysis of uncertain eruption precursors at La Soufrière volcano, Guadeloupe, 1975–77: Volcanic hazard assessment using a Bayesian Belief Network approach, J. Appl. Volcanol., 3, 26, https://doi.org/10.1186/2191-5040-3-3, 2014.
Holdaway, R. N., Duffy, B., and Kennedy, B.: Evidence for magmatic carbon bias in 14C dating of the Taupo and other major eruptions, Nat. Commun., 9, 4110, https://doi.org/10.1038/s41467-018-06357-0, 2018.
Hoshizumi, H., Watanabe, K., Sakaguchi, K., Uto, K., Ono, K., and Nakamura, T.: The Aso-4 pyroclastic flow deposit confirmed from the deep drill holes inside the Aso caldera, Programme and Abstracts the Volcanological Society of Japan, 1997_2, 5, https://doi.org/10.18940/vsj.1997.2.0_5, 1997.
Huppert, H. E. and Simpson, J. E.: The slumping of gravity currents, J. Fluid Mech., 99, 785–799, https://doi.org/10.1017/S0022112080000894, 1980.
Hyman, D. M., Bevilacqua, A., and Bursik, M. I.: Statistical theory of probabilistic hazard maps: a probability distribution for the hazard boundary location, Nat. Hazards Earth Syst. Sci., 19, 1347–1363, https://doi.org/10.5194/nhess-19-1347-2019, 2019.
Ishibashi, H., Suwa, Y., Miyoshi, M., Yasuda, A., and Hokanishi, N.: Amphibole–melt disequilibrium in silicic melt of the Aso-4 caldera-forming eruption at Aso Volcano, SW Japan, Earth Planets Space, 70, 1–12, https://doi.org/10.1186/s40623-018-0907-4, 2018.
Kaneko, K., Kamata, H., Koyaguchi, T., Yoshikawa, M., and Furukawa, K.: Repeated large-scale eruptions from a single compositionally stratified magma chamber: An example from Aso volcano, Southwest Japan, J. Volcanol. Geoth. Res., 167, 160–180, https://doi.org/10.1016/j.jvolgeores.2007.05.002, 2007.
Kaneko, K., Inoue, K., Koyaguchi, T., Yoshikawa, M., Shibata, T., Takahashi, T., and Furukawa, K.: Magma plumbing system of the Aso-3 large pyroclastic eruption cycle at Aso volcano, Southwest Japan: Petrological constraint on the formation of a compositionally stratified magma chamber, J. Volcanol. Geoth. Res., 303, 41–58, https://doi.org/10.1016/j.jvolgeores.2015.07.016, 2015.
Kato, Y., Koyama, M., Fukushima, Y., and Nakagaki, T.: Energy Technology Roadmaps of Japan, Springer, Tokyo, https://doi.org/10.1007/978-4-431-55951-1, 2016.
Kelfoun, K.: Suitability of simple rheological laws for the numerical simulation of dense pyroclastic flows and long-runout volcanic avalanches, J. Geophys. Res.-Solid., 116, B08209, https://doi.org/10.1029/2010JB007622, 2011.
Kelfoun, K.: A two-layer depth-averaged model for both the dilute and the concentrated parts of pyroclastic currents, J. Geophys. Res.-Solid, 122, 4293–4311, https://doi.org/10.1002/2017JB014013, 2017.
Kelfoun, K. and Gueugneau, V.: A unifying model for pyroclastic surge genesis and pyroclastic flow fluidization, Geophys. Res. Lett., 49, e2021GL096517, https://doi.org/10.1029/2021GL096517, 2022.
Kelfoun, K., Samaniego, P., Palacios, P., and Barba, D.: Testing the suitability of frictional behaviour for pyroclastic flow simulation by comparison with a well-constrained eruption at Tungurahua volcano (Ecuador), Bull. Volcanol., 71, 1057–1075, https://doi.org/10.1007/s00445-009-0286-6, 2009.
Kiyosugi, K., Connor, C., Sparks, R. S. J., Crosweller, H. S., Brown, S. K., Siebert, L., Wang, T., and Takarada, S.: How many explosive eruptions are missing from the geologic record? Analysis of the quaternary record of large magnitude explosive eruptions in Japan, J. Appl. Volcanol., 4, 1–15, https://doi.org/10.1186/s13617-015-0035-9, 2015.
Komazawa, M.: Gravimetric analysis of Aso volcano and its interpretation, J. Geodet. Soc. Jpn., 41, 17–45, https://doi.org/10.11501/3102626, 1995.
Larsen, J. F., Neal, C., Schaefer, J., Beget, J., and Nye, C.: Late Pleistocene and Holocene caldera-forming eruptions of Okmok caldera, Aleutian Islands, Alaska, Geophysical Monograph Series 172, American Geophysical Union, Washington, DC, 343–364, https://doi.org/10.1029/172GM24, 2007.
Lipman, P. W.: Mineral and chemical variations within an ash-flow sheet from Aso caldera, south-western Japan, Contrib. Mineral. Petrol., 16, 300–327, https://doi.org/10.1007/BF00371528, 1967.
Lowenstern, J. B., Smith, R. B., and Hill, D. P.: Monitoring super-volcanoes: geophysical and geochemical signals at Yellowstone and other large caldera systems, Philos. T. Roy. Soc. A, 364, 2055–2072, https://doi.org/10.1098/rsta.2006.1813, 2006.
Lube, G., Breard, E. C. P., Esposti-Ongaro, T., Dufek, J., and Brand, B: Multiphase flow behaviour and hazard prediction of pyroclastic density currents, Nat. Rev. Earth Environ., 1, 348–365, https://doi.org/10.1038/s43017-020-0064-8, 2020.
Machida, H.: The stratigraphy, chronology and distribution of distal marker-tephras in and around Japan, Global Planet. Change, 21, 71–94, https://doi.org/10.1016/S0921-8181(99)00008-9, 1999.
Machida, H. and Arai, F.: Extensive ash falls in and around the Sea of Japan from large late Quaternary eruptions, J. Volcanol. Geoth. Res., 18, 151–164, https://doi.org/10.1016/0377-0273(83)90007-0, 1983.
Machida, H. and Arai, F.: Atlas of Tephra in and around Japan, University of Tokyo Press, Tokyo, 336 pp., 2003.
Machida, H., Arai, F., and Momose, M.: Aso-4 ash: a widespread tephra and its implications to the events of Late Pleistocene in and around Japan, Bull. Volcanol. Soc. Jpn., 30, 49–70, https://doi.org/10.18940/kazanc.30.2_49, 1985.
Martí, A., Folch, A., Costa, A., and Engwell, S.: Reconstructing the plinian and coignimbrite sources of large volcanic eruptions: A novel approach for the Campanian Ignimbrite, Scient. Rep., 6, 1–11, https://doi.org/10.1038/srep21220, 2016.
Mason, B. G., Pyle, D. M., and Oppenheimer, C.: The size and frequency of the largest explosive eruptions on Earth, Bull. Volcanol., 66, 735–748, https://doi.org/10.1007/s00445-004-0355-9, 2004.
Matsumoto, A., Uto, K., Ono, K., and Watanabe, K.: K–Ar age determinations for Aso volcanic rocks-concordance with volcanostratigraphy and application to pyroclastic flows, Volcanol. Soc. Jpn., B3, 73, https://doi.org/10.18940/vsj.1991.2.0_73, 1991.
Matumoto, T.: The four gigantic caldera volcanoes of Kyushu, Jpn. J. Geol. Geogr., 19, 1–57, 1943.
Miyabuchi, Y.: A 90,000-year tephrostratigraphic framework of Aso Volcano, Japan, Sediment. Geol., 220, 169–189, https://doi.org/10.1016/j.sedgeo.2009.04.018, 2009.
Miyabuchi, Y.: Post-caldera explosive activity inferred from improved 67–30 ka tephrostratigraphy at Aso Volcano, Japan, J. Volcanol. Geoth. Res., 205, 94–113, https://doi.org/10.1016/j.jvolgeores.2011.05.004, 2011.
Miyabuchi, Y., Hoshizumi, H., Takada, H., Watanabe, K., and Xu, S.: Pumice-fall deposits from Aso volcano during the past 90,000 years, southwestern Japan, Bull. Volcanol. Soc. Jpn., 48, 195–214, https://doi.org/10.18940/kazan.48.2_195, 2003.
Miyabuchi, Y., Masuda, N., and Watanabe, K.: Geologic history of the western part of post-caldera central cones of Aso volcano, southwestern Japan, based on stratigraphic relationships between lava flows and airfall tephra layers, Bull. Volcanol. Soc. Jpn., 49, 267–282, https://doi.org/10.18940/kazan.49.5_267, 2004.
Miyoshi, M., Hasenaka, T., and Sano, T.: Genetic relationships of the compositionally diverse magmas from Aso post-caldera volcanism, Bull. Volcanol. Soc. Jpn., 50, 269–283, 2005.
Miyoshi, M., Sumino, H., Miyabuchi, Y., Shinmura, T., Mori, Y., Hasenaka, T., Furukawa, K., Uno, K., and Nagao, K.: K–Ar ages determined for post-caldera volcanic products from Aso volcano, central Kyushu, Japan, J. Volcanol. Geoth. Res., 229, 64–73, https://doi.org/10.1016/j.jvolgeores.2012.04.003, 2012.
NASA: Shuttle Radar Topography Mission (SRTM) Global, OpenTopography, https://doi.org/10.5069/G9445JDF, 2013.
Neri, A., Bevilacqua, A., Esposti Ongaro, T., Isaia, R., Aspinall, W., Bisson, M., Flandoli, F., Baxter, P., Bertagnini, A., and Iannuzzi, E.: Quantifying volcanic hazard at Campi Flegrei caldera (Italy) with uncertainty assessment: 2. Pyroclastic density current invasion maps, J. Geophys. Res.-Solid, 120, 2330–2349, https://doi.org/10.1002/2014JB011776, 2015.
Neri, A., Esposti Ongaro, T., de' Michieli Vitturi, M., and Cerminara, M.: Multiphase Flow Modeling of Explosive Volcanic Eruptions, in: Transport Phenomena in Multiphase Systems, Springer, Cham, 243–281, https://doi.org/10.1007/978-3-030-68578-2_10, 2022.
Newhall, C., Self, S., and Robock, A.: Anticipating future Volcanic Explosivity Index (VEI) 7 eruptions and their chilling impacts, Geosphere, 14, 572–603, https://doi.org/10.1130/GES01513.1, 2018.
Ono, K. and Watanabe, K.: Aso Caldera, Chikyu Month., 5, 73–82, 1983.
Ono, K. and Watanabe, K.: Geological Map of Aso Volcano, , Geological Survey of Japan, Tsukuba, https://gbank.gsj.jp/volcano/Act_Vol/aso/index-e.html (last access: 12 October 2022), 1985.
Ono, K., Matsumoto, Y., Miyahisa, M., Teraoka, Y., and Kambe, N.: Geology of the Taketa District. Quadrangle Series, , Geological Survey of Japan, Kawasaki, https://www.gsj.jp/Map/EN/docs/5man_doc/15/15_023.htm (last access: 12 October 2022), 1977.
Oppenheimer, C. and Donovan, A. R.: On the nature and consequences of super-eruptions, in: Volcanism and global environmental change, Cambridge University Press, 16–29, https://doi.org/10.1017/CBO9781107415683.004, 2015.
Papale, P., Global time-size distribution of volcanic eruptions on Earth, Scient. Rep., 8, 1–11, https://doi.org/10.1038/s41598-018-25286-y, 2018.
Papale, P., Marzocchi, W., and Garg, D.: Global volume distribution for subaerial volcanism on Earth, J. Geophys. Res.-Solid, 126, e2021JB021763, https://doi.org/10.1029/2021JB021763, 2021.
Patra, A., Bevilacqua, A., Akhavan-Safaei, A., Pitman, E. B., Bursik, M., and Hyman, D.: Comparative Analysis of the Structures and Outcomes of Geophysical Flow Models and Modeling Assumptions Using Uncertainty Quantification, Front. Earth Sci., 8, 275, https://doi.org/10.3389/feart.2020.00275, 2020.
Petit, C. and Fournier, M.: Present-day velocity and stress fields of the Amurian Plate from thin-shell finite-element modelling, Geophys. J. Int., 160, 357–369, https://doi.org/10.1111/j.1365-246X.2004.02486.x, 2005.
Pyle, D. M.: Sizes of volcanic eruptions, in: Encyclopedia of Volcanoes, edited by: Sigurdsson, H., Houghton, B. F., McNutt, S. R., Rymer, H., and Stix, J., Academic Press, Cambridge, MA, 257–264, https://doi.org/10.1016/B978-0-12-385938-9.00013-4, 2000.
Roche, O., Buesch, D., and Valentine, G.: Slow-moving and far-travelled dense pyroclastic flows during the Peach Spring super-eruption, Nat. Commun., 7, 1–8, 2016.
Roche, O., Azzaoui, N., and Guillin, A.: Discharge rate of explosive volcanic eruption controls runout distance of pyroclastic density currents, Earth Planet. Sc. Lett., 568, 117017, https://doi.org/10.1016/j.epsl.2021.117017, 2021.
Rougier, J., Sparks, S. R., and Cashman, K. V.: Global recording rates for large eruptions, J. Appl. Volcanol., 5, 1–10, https://doi.org/10.1186/s13617-016-0051-4, 2016.
Rougier, J., Sparks, R. S. J., and Cashman, K. V.: Regional and global under-recording of large explosive eruptions in the last 1000 years, J. Appl. Volcanol., 7, 1–10, https://doi.org/10.1186/s13617-017-0070-9, 2018.
Rougier, J. C., Sparks, R. S. J., Aspinall, W. P., and Mahony, S. H.: Estimating tephra fall volume from point-referenced thickness measurements, Geophys. J. Int., 230, 1699–1710, https://doi.org/10.1093/gji/ggac131, 2022.
Rutarindwa, R., Spiller, E. T., Bevilacqua, A., Bursik, M. I., and Patra, A. K.: Dynamic probabilistic hazard mapping in the Long Valley Volcanic Region CA: integrating vent opening maps and statistical surrogates of physical models of pyroclastic density currents, J. Geophys. Res.-Solid, 124, 9600–9621, https://doi.org/10.1029/2019JB017352, 2019.
Self, S.: The effects and consequences of very large explosive volcanic eruptions, Philos. T. Roy. Soc. A, 364, 2073–2097, https://doi.org/10.1098/rsta.2006.1814, 2006.
Self, S.: Explosive super-eruptions and potential global impacts, in: Volcanic Hazards, Risks and Disasters, Elsevier, 399–418, https://doi.org/10.1016/B978-0-12-396453-3.00016-2, 2015.
Shimizu, H. A., Koyaguchi, T., and Suzuki, Y. J.: The run-out distance of large-scale pyroclastic density currents: a two-layer depth-averaged model, J. Volcanol. Geoth. Res., 381, 168–184, https://doi.org/10.1016/j.jvolgeores.2019.03.013, 2019.
Shinmura, T., Miyoshi, M., Sumino, H., Ueda, Y., Mori, Y., Hasenaka, T., Arakawa, Y., and Nagao, K.: K–Ar ages determined for volcanic rocks from Nekodake volcano in the eastern rim of Aso caldera, central Kyushu, Japan, in: Programme and abstracts the volcanological society of Japan, 2021 Fall Meeting, Session ID B1-07, p. 51, https://doi.org/10.18940/vsj.2021.0_51, 2021.
Simkin, T.: Terrestrial volcanism in space and time, Annu. Rev. Earth Planet. Sci., 21, 427–452, https://doi.org/10.1146/annurev.ea.21.050193.002235, 1993.
Sparks, R. S. J. and Walker, G. P. L.: The significance of vitric-enriched air fall ashes associated with crystal-enriched ignimbrites, J. Volcanol. Geoth. Res., 2, 329–341, 1977.
Streck, M. and Grunder, A.: Crystallization and welding variations in a widespread ignimbrite sheet; the Rattlesnake Tuff, eastern Oregon, USA, Bull. Volcanol., 57, 151–169, https://doi.org/10.1007/BF00265035, 1995.
Suñe-Puchol, I., Aguirre-Díaz, G.J., Dávila-Harris, P., Miggins, D. P, Pedrazzi, D., Costa, A., Ortega-Obregón, C., Lacan, P., Hernández, W., and Gutiérrez, E.: The Ilopango caldera complex, El Salvador: Origin and early ignimbrite-forming eruptions of a graben/pull-apart caldera structure, J. Volcanol. Geoth. Res., 371, 1–19, https://doi.org/10.1016/j.jvolgeores.2018.12.004, 2019.
Suzuki-Kamata, K. and Kamata, H.: The proximal facies of the Tosu pyroclastic-flow deposit erupted from Aso caldera, Japan, Bull. Volcanol., 52, 325–333, https://doi.org/10.1007/BF00302046, 1990.
Tadini, A., Bevilacqua, A., Neri, A., Cioni, R., Aspinall, W. P., Bisson, M., Isaia, R., Mazzarini, F., Valentine, G. A. V., Vitale, S., Baxter, P.J., Bertagnini, A., Cerminara, M., de' Michieli Vitturi, M., Di Roberto, A., Engwell, S. L., Esposti Ongaro, T., Flandoli, F., and Pistolesi, M.: Assessing future vent opening locations at the Somma-Vesuvio volcanic complex: 2. Probability maps of the caldera for a future Plinian/sub-Plinian event with uncertainty quantification, J. Geophys. Res.-Solid, 122, 4357–4376, https://doi.org/10.1002/2016JB013860, 2017.
Tadini, A., Bevilacqua, A., Neri, A., Cioni, R., Biagioli, G., de' Michieli Vitturi, M., and Esposti Ongaro, T.: Reproducing pyroclastic density current deposits of the 79 CE eruption of the Somma–Vesuvius volcano using the box-model approach, Solid Earth, 12, 119–139, https://doi.org/10.5194/se-12-119-2021, 2021a.
Tadini, A., Roche, O., Samaniego, P., Azzaoui, N., Bevilacqua, A., Guillin, A., Gouhier, M., Bernard, B., Aspinall, W., Hidalgo, S., Eychenne, J., de' Michieli Vitturi, M., Neri, A., Cioni, R., Pistolesi, M., Gaunt, E., Vallejo, S., Encalada, M., Yepes, H., Proaño, A., and Pique, M.: Eruption type probability and eruption source parameters at Cotopaxi and Guagua Pichincha volcanoes (Ecuador) with uncertainty quantification, Bull. Volcanol., 83, 35, https://doi.org/10.1007/s00445-021-01458-z, 2021b.
Tadini A., Azzaoui, N., Roche, O., Samaniego, P., Bernard, B., Bevilacqua, A., Hidalgo, S., Guillin, A., and Gouhier, M.: Tephra fallout probabilistic hazard maps for Cotopaxi and Guagua Pichincha volcanoes (Ecuador) with uncertainty quantification, J. Geophys. Res.-Solid, 127, e2021JB022780, https://doi.org/10.1029/2021JB022780, 2022a.
Tadini, A., Harris, A., Morin, J., Bevilacqua, A. Peltier, A., Aspinall, W., Ciolli, S., Bachèlery, P., Bernard, B., Biren, J., Brum da Silveira, A., Cayol, V., Chevrel, Coppola, D., Dietterich, H., Donovan, A., Dorado, O., Drenne, S., Dupéré, O., Gurioli, L., Kolzenburg, S., Komorowski, JC, Labazuy, P., Mangione, D., Mannini, S., Martel-Asselin, F., Médard, E., Pailot-Bonnétat, S., Rafflin, V., Ramsey, M., Richter, N., Vallejo, S., Villeneuve, N., and Zafrilla, S.: Structured elicitation of expert judgement in real-time eruption scenarios: an exercise for Piton de la Fournaise volcano, La Réunion island, Volcanica, 5, 105–131, https://doi.org/10.30909/vol.05.01.105131, 2022b.
Tajima, Y., Hasenaka, T., and Torii, M.: Effects of the 2016 Kumamoto earthquakes on the Aso volcanic edifice, Earth Planets Space, 69, 1–15, https://doi.org/10.1186/s40623-017-0646-y, 2017.
Takarada, S. and Hoshizumi, H.: Distribution and eruptive volume of aso-4 pyroclastic density current and tephra fall deposits, Japan: a M8 super-eruption, Front. Earth Sci., 8, 170, https://doi.org/10.3389/feart.2020.00170, 2020.
Todesco, M., Neri, A., Esposti Ongaro, T., Papale, P., and Rosi, M.: Pyroclastic flow dynamics and hazard in a caldera setting: application to Phlegrean Fields (Italy), Geochem. Geophy. Geosy., 7, Q11003, https://doi.org/10.1029/2006GC001314, 2006.
Uto, K., Sakaguchi, K., Shibuya, A., and Yoshioka, H.: K–Ar ages of volcanic rocks from the deep drill holes inside the Aso caldera: implication for the reconstruction of the early stage of the post-caldera volcanism, Programme and abstracts, Volcanological Society of Japan, 1994_2, 211, https://doi.org/10.18940/vsj.1994.2.0_211, 1994.
Valentine, G. A .V.: Initiation of dilute and concentrated pyroclastic currents from collapsing mixtures and origin of their proximal deposits, Bull. Volcanol., 82, 20, https://doi.org/10.1007/s00445-020-1366-x, 2020.
Watanabe, K.: Studies on the Aso pyroclastic flow deposits in the region to the west of Aso Caldera, Southwest Japan, I: Geology, Mem. Fac. Educ. Kumamoto Univ. Nat. Sci., 27, 97–120, 1978.
Watanabe, K.: Studies on the Aso pyroclastic flow deposits in the region to the west of Aso Caldera Southwest Japan, II: Petrology of the Aso-4 pyroclastic flow deposits, Mem. Fac. Educ. Kumamoto Univ. Nat. Sci., 28, 75–112, 1979.
Werner, C., Colson, A., Morton, A., and Bedford, T.: Risk Assessment of Future Antibiotic Resistance – Eliciting and Modelling Probabilistic Dependencies Between Multivariate Uncertainties of Bug-Drug Combinations, Front. Appl. Math. Stat., 7, 669391, https://doi.org/10.3389/fams.2021.669391, 2021.
Williams, M.: The ∼73 ka Toba super-eruption and its impact: History of a debate, Quatern. Int., 258, 19–29, https://doi.org/10.1016/j.quaint.2011.08.025, 2012.
Wilson, C.: Emplacement of Taupo ignimbrite, Nature, 385, 306–307, https://doi.org/10.1038/385306a0, 1997.
Wilson, C. J. N.: The Taupo eruption, New Zealand. I. The Taupo Ignimbrite, Philos. T. Roy. Soc. Lond. A, 314, 199–228, https://doi.org/10.1098/rsta.1985.0019, 1985a.
Wilson, C. J. N.: The Taupo eruption, New Zealand. II. The Taupo Ignimbrite, Philos. T. Roy. Soc. Lond. A, 314, 229–310, https://doi.org/10.1098/rsta.1985.0020, 1985b.
Wilson, C. J. N.: Ignimbrite morphology and the effects of erosion: a New Zealand case study, Bull. Volcanol., 53, 635–644, https://doi.org/10.1007/BF00493690, 1991.
Wilson, C. J. N., Houghton, B. F., Kampt, P. J. J., and McWilliamst, M. O.: An exceptionally widespread ignimbrite with implications for pyroclastic flow emplacement, Nature, 378, 605–607, https://doi.org/10.1038/378605a0, 1995.
Yang, Q., Pitman, E. B., Spiller, E., Bursik, M., and Bevilacqua, A.: Novel statistical emulator construction for volcanic ash transport model Ash3d with physically-motivated measures, Philos. T. Roy. Soc. Lond. A, 476, 20200161, https://doi.org/10.1098/rspa.2020.0161, 2020.