the Creative Commons Attribution 4.0 License.
the Creative Commons Attribution 4.0 License.
 | 12 Oct 2022
Dynamic risk assessment of compound hazards based on VFS–IEM–IDM: a case study of typhoon–rainstorm hazards in Shenzhen, China
Wenwu Gong
Jie Jiang
Global warming has led to increased compound hazards, and an accurate risk assessment of such hazards is of great importance to urban emergency management. Due to the interrelations between multiple hazards, the risk assessment of a compound hazard faces several challenges: (1) the evaluation of hazard level needs to consider the correlations between compound hazard drivers, (2) usually only a small number of data samples are available for estimating the joint probability distribution of the compound hazard drivers and the loss caused by the hazards, and (3) the risk assessment process often ignores the temporal dynamics of compound hazard occurrences. This paper aims to address the mentioned challenges and develop an integrated risk assessment model VFS–IEM–IDM to quantify the dynamic risk of compound hazards based on variable fuzzy set theory (VFS), information entropy method (IEM), and information diffusion method (IDM). For the first challenge, VFS–IEM–IDM measures the effect of the compound hazard drivers via the use of relative membership degree and analyses the correlation between drivers with the entropy weight method, which is combined to evaluate compound hazard level. To address the second challenge, VFS–IEM–IDM applies the normal diffusion function to estimate the probability distribution of the compound hazard and the corresponding loss vulnerability curve. To deal with the third challenge, VFS–IEM–IDM assesses the risk of a compound hazard in different months based on the definition of probabilistic risk. In the end, this paper takes the typhoon–rainstorm disaster in Shenzhen, China, as an example to evaluate the effectiveness of the proposed VFS–IEM–IDM model. The results show that VFS–IEM–IDM effectively estimates the typhoon–rainstorm compound hazard level and assesses the dynamic risk of the compound hazards.
- Article
(819 KB) - Full-text XML
- BibTeX
- EndNote


With global climate change, many cities have suffered extreme natural hazards more frequently (Ming et al., 2022). People and their properties have been exposed to various hazards simultaneously or successively worldwide. In the literature, there has been an increasing interest in the research of assessing multi-hazard risks (Choi et al., 2021). A compound hazard is a typical multi-hazard problem that involves the concurrence of multiple hazard drivers, such as heavy rainfall, extreme wind intensity, and storm surge. For example, typhoons and rainstorms are two different types of natural hazards that can cause significant damages. When these two types of hazards simultaneously occur, compound hazards are produced, leading to more severe catastrophes than individual hazards. Therefore, the risk assessment of such compound hazards needs to take into account the interrelations between the individual hazards.
The risk of a hazard is defined as the potential consequences brought by the disaster and can be quantified by the probability of losses (He and Wang, 2020). Risk assessment is a technique that uses the relevant hazard data to estimate the likelihood that natural hazards may occur and further assess their economic losses (Huang and Huang, 2018). Traditional methods of risk assessment mainly utilize geographic information systems to get risk maps (Gigovic and Pamucar, 2017) or rely on information diffusion methods to deal with the problem of data sparsity (Gong et al., 2020). These risk assessment methods (Julià and Ferreira, 2021; Zhou et al., 2020) are mainly applied to individual hazards, while the risk assessment of compound hazards is not simply the aggregation of the assessment results of the individual hazards but needs to consider the interrelations between them (Kappes et al., 2012).
There are many research works discussing the risk assessment of multi-hazards. They classify the relationship between the individual hazards in the scenarios of multi-hazards into three categories: mutually amplified hazards, mutually exclusive hazards, and non-influential stakes (Wang et al., 2020). The existing methods and technologies relevant to the risk assessment of multi-hazards have been reviewed in Khan et al. (2020). For example, a Cloquet integral multiple linear regression model has been proposed to overcome the problem of nonlinear additivity of mutually amplified hazards for hazard level evaluation (He and Wang, 2020). An information diffusion method has been used to assess the risk of multiple hazards quantitatively and evaluate the risk of loss of human lives from meteorological hazards in China (Xu et al., 2016). A quantitative approach of multi-hazard risk assessment based on vulnerability distribution and joint return period of hazards is proposed to assess the risk of crop losses in the Yangtze River Delta region of China (Ming et al., 2015). However, all of these works do not consider the correlations between the occurrences of the individual hazards, such as the co-appearance of typhoon–rainstorm hazards. Furthermore, there is little research focusing on typhoon-induced risk assessment in the literature, and temporal dynamics are rarely considered in risk assessments.
Compound hazards, a sub-group of “multi-hazards”, are considered as the combination of multiple hazard drivers that contribute to societal or environmental risks. The characteristics of compound hazards include (1) two or more extreme events occurring simultaneously or successively, (2) combinations of extreme events with underlying conditions that amplify the impact, and (3) combinations of events that are not themselves extreme but lead to an extreme event or impact when combined (Jennifer and Andrew, 2021). Here, we explicitly consider compound hazards for the case when two or more individual extreme events occur at the same place and at the same time, such as extreme precipitation, winds, and ocean waves. In this paper, we define the risk of a compound hazard as a scene in the future associated with some adverse incidents caused by cascading hazard systems, where there are strong connections between different hazard drivers. Compared with the risk assessment of multi-hazards in the literature (Xu et al., 2016; Huang and Huang, 2018), assessing the risk of compound hazards requires an integrated hazard level without losing any correlated information between the individual hazards.
While there have been many attempts to assess the risk of multi-hazards, most of the existing methods have limitations in dealing with compound hazards (Ming et al., 2022; Huang and Huang, 2018). Firstly, the correlation between the hazard drivers is often ignored. Considering that the disaster control engineering system is a synthesis of multi-dimensional factors, the potential inter-dependencies of the drivers will affect the joint probability and the economic losses of compound hazards. Secondly, the relationship between the hazards, i.e., vulnerability and exposure analysis, cannot be modeled effectively when the data are sparse. Thirdly, most of the existing risk analysis frameworks for compound hazards are based on either qualitative or semi-quantitative methods. Moreover, the temporal dynamics of the occurrences of compound hazards are often not considered.
To address the first limitation, researchers have applied variable fuzzy set (VFS) methods to deal with the multi-factor problem. Some researchers have shown that the relative membership function can be used to evaluate the relations between multiple indicators in risk assessment (Chen and Yu, 2006). A fuzzy method (Li et al., 2012) is proposed to solve the flood risk assessment problems with interval boundaries, and this integrated model improves the reliability of a single hazard risk assessment. VFS has also been used to evaluate the synthetic hazard level of Nagapattinam district with the north-east monsoon rainfall's data sets (Beaula and Partheeban, 2013). In this paper, we propose to combine VFS with the information entropy method (IEM) to assess the hazard level of compound hazards such that the correlations between the hazard drivers can be captured.
To deal with the second limitation, the information diffusion method (IDM) is commonly used to model the physical relationship between different attributes. In many cases, it is challenging to collect compound hazard data, and the historical data are often sparse. To this end, many fuzzy probabilistic models have been proposed to enhance the accuracy of the risk assessment results (Mehran et al., 2017). Fuzzy probabilistic models are used to model uncertainties related to hazards and the randomness due to environmental, natural, or period changes. The main feature of the fuzzy probabilistic models is to transform the raw data points into fuzzy sets to partly fill the gap caused by data sparsity and improve the estimation accuracy between the inputs and the outputs. One of the most powerful techniques is IDM (Huang, 1997, 2002), which helps extract useful underlying information from the hazard data sets. Researchers have done a simulation study on IDM and demonstrated the benefit of information distribution for probability estimation (Huang, 2000). The capability of IDM in dealing with the problem of data sparsity has been well studied in the literature (Li, 2013). In this paper, we construct a normal information diffusion estimator (IDM) to analyze the probability function and vulnerability curve of compound hazards.
As for the third limitation, preliminary attempts have been made to develop quantitative multi-hazard risk assessment frameworks (Huang and Huang, 2018). The probabilistic risk model combined with the concept of dynamic risk assessment has been proposed to estimate the flooding risk (Huang, 2015). In this paper, we present the definition of dynamic compound hazard risk and then propose a method to assess the compound hazard risk quantitatively, which also considers the temporal dynamics of the occurrences of the hazards.
The main contributions of this paper are summarized as follows.
-
We propose a model named variable fuzzy set and information diffusion (VFS–IEM–IDM) to assess the dynamic risk of compound hazards, which takes into account the interrelations between the hazard drivers, deals with the problem of data sparsity, and considers the temporal dynamics of the occurrences of the compound hazards.
-
We simplify the procedures of calculating relative membership degree to improve the efficiency of compound hazard level evaluation, and we also use a predictive cumulative logistic model to verify the evaluation results.
-
To examine the efficacy of the proposed model VFS–IEM–IDM, a case study of the typhoon–rainstorm hazards in Shenzhen, China, is presented.
The rest of this paper is organized as follows. Section 2 introduces the basic concepts and definitions in this paper. In Sect. 3, we present the dynamic compound hazard risk assessment model, namely VFS–IEM–IDM. Section 4 provides an evaluation of the VFS–IEM–IDM with a case study of typhoon–rainstorm hazards in Shenzhen, China. In Sect. 5, we discuss the results of the case study obtained at different stages of VFS–IEM–IDM. Finally, conclusions are drawn in Sect. 6.
2.1 Basic concepts
Variable fuzzy set is used to express the fuzzy effect of the hazard drivers by relative membership degree (RMD) functions, and then the compound effects between different drivers can be modeled. This method provides an enhanced implementation of the compound hazard level evaluation process and can reflect the coupled characteristics of compound hazards. Information entropy is based on the entropy coefficient calculation process, which is used to measure the importance of the individual hazard drivers and determine the weight of different drivers. Information diffusion is a function learning method with high estimation accuracy from a small data set, which makes full use of the diffusion information given by the data samples to estimate the probability density of the data samples or the relationship between the data samples without the knowledge of the distribution from which the data samples were drawn. This method is applied to estimate the probability distribution p (hazard potential) of the occurrence of hazards and the causal relationship f (hazard vulnerability).
2.2 Dynamic compound hazard risk
From the previous studies, risks could be classified into four categories: pseudo-risk, probability risk, fuzzy risk, and uncertainty risk (Huang and Huang, 2018). Existing hazard risk assessment models are often qualitative or semi-quantitative, which cannot directly estimate economic losses from the joint impact of several hazards. Probability risk is estimated by integrating the probability distribution p of the occurrence of hazards, as well as the causal relationship f between the economic loss and the hazard attributes. As a result, the probability risk could be quantified as the expected value of economic losses, i.e., the integration of hazard potential with hazard vulnerability.
Though these four types of risks have been investigated by many researchers, there are few studies on dynamic compound hazard risk. In this paper, compound risk is defined as a scene in the future associated with some adverse incident caused by cascading hazard systems, where there are strong connections between different hazards and the hazard level is influenced by many drivers. Furthermore, as proposed by Huang (2015), the concept of compound risk could be extended to dynamic compound risk if the impact of occurrence time on risk assessment is taken into consideration. To assess the risk of a compound hazard, the probability distribution p of the occurrences of the compound hazard will be estimated with probability models, and the causal relationship f between the hazard attributes and the losses is captured by a fuzzy model. The compound hazard risk is defined as follows:
where , 2, ⋯, N; j=1, 2, ⋯, J} represents the data samples with the sample size N and the number of compound hazard attributes J, and Φ and Φ′ denote a set of hazard attributes which reflects the characteristics of the compound hazard. For example, the risk of the compound hazard typhoon–rainstorm can be assessed by three hazard attributes including hazard occurrence time ϕ1, compound hazard level ϕ2, and economic losses ϕ3. The dynamic compound risk is derived by integrating the conditional probability distribution p(X;Φ), where , with the hazards vulnerability , where .
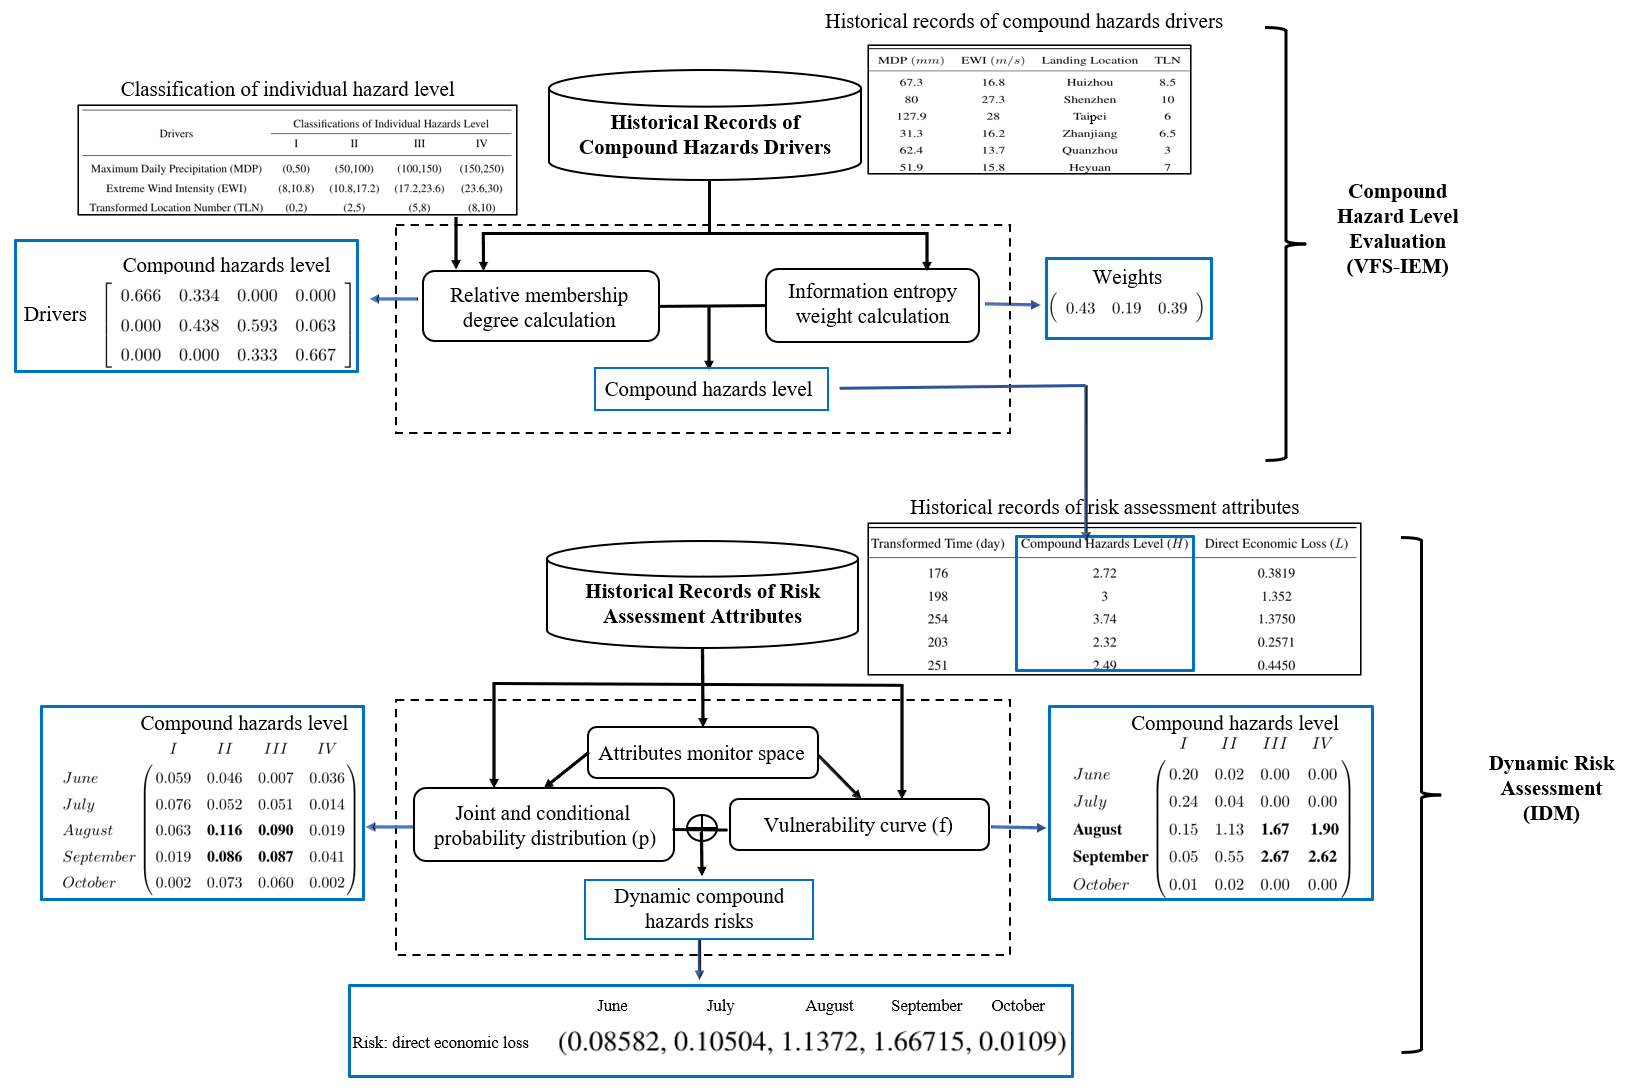
Figure 1Workflow of the VFS–IEM–IDM dynamic compound hazard risk assessment model for typhoon–rainstorm hazards. Based on the historical records of typhoon–rainstorm hazards, our proposal provides two-part procedures: firstly, an enhanced implementation of the compound hazard level evaluation is proposed to assess the typhoon–rainstorm hazard level; and then the probability distribution and the corresponding loss vulnerability curve of typhoon–rainstorm are estimated to calculate the dynamic hazard risk. We use the black rectangle to denote different calculation modules and use the blue one to represent the results obtained by the VFS–IEM–IDM model.
Risk assessment of compound hazards should consider the correlation between the compound hazard drivers, the problem of data sparsity, and the dynamic property of hazard occurrences. This section proposes VFS–IEM–IDM, a risk assessment model for compound hazards, which combines the variable fuzzy set theory with the information diffusion method to assess the dynamic risk of compound hazards when only a small set of data samples is available. Our proposal mainly consists of two components: with individual hazard level and historical records of hazard drivers as inputs, the first component VFS–IEM combines variable fuzzy set methods with information entropy methods to provide a comprehensive evaluation of the compound hazard level (Sect. 3.1). Based on the compound hazard levels and historical records of risk assessment attributes, the second component IDM adapts normal information diffusion methods to quantify the dynamic risk of the compound hazards in terms of the direct economic losses (Sect. 3.2). Figure 1 shows the workflow of VFS–IEM–IDM, where the black rectangle denotes different calculation modules and the blue one represents the results obtained by the VFS–IEM–IDM model.
3.1 Compound hazard level evaluation: VFS–IEM
For the compound hazard risk assessment, the correlation between the compound hazard drivers should be considered. Fortunately, the variable fuzzy set (VFS) theory which considers the contributions of multiple related drivers and decreases the fuzziness by using membership functions (Chen and Yu, 2006) provides an appropriate tool for evaluating the compound hazard level.
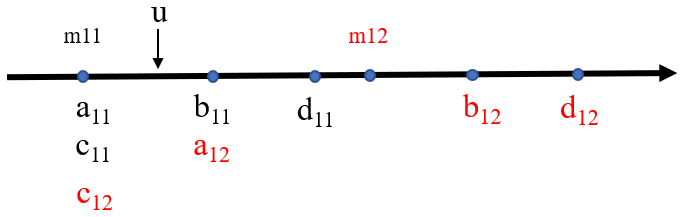
Figure 2Lowest case: the position between u with parameter m11 and fuzzy intervals (a11, b11) and (c11, d11). Symbols with different colors indicate different fuzzy intervals.
Based on VFS, the fuzzy set intervals given by the individual hazard level classification can be used to assess the compound hazard level. For example, suppose we have two fuzzy set intervals and , where , in which Icd is an extended fuzzy set interval based on Iab, as shown in Fig. 2. Specifically, the relative membership degree (RMD) function μ(u), which determines the probability of a hazard driver u belonging to different hazard level intervals, is applied to evaluate the contributions of compound-hazard-related drivers. Since the calculation of RMD is complicated and time-consuming, we use different locations of the balance boundaries matrix M (Wang et al., 2014) and the value of driver u to simplify the calculation process. Firstly, we use the interval (arl, brl) to define the balance boundaries matrix M=[mrl], which is shown in Eq. (2).
where r=1, 2, …, R and R indicate the number of hazard drivers, l=1, 2, …, L, and L denotes the number of compound hazard levels. Then, we compare the relative locations of u with mrl in the interval (arl, brl) and (crl, drl). RMD can then be constructed by the ratio as follows:
It can be seen that RMD is influenced by the hyper-parameter q and the position between the hazard driver value u and the level interval Iab, Icd, and the value of mrl. In this paper, guided by the procedure of calculating RMD in the literature (Fang et al., 2019), we simplify the procedure of calculating relative membership degree to improve the efficiency of compound hazard level evaluation. Firstly, the intervals Iab, Icd of the individual hazard levels and the balance boundaries matrix M are obtained following the VFS theory (Chen and Yu, 2006). Secondly, we determine whether the location of u is in the lowest, middle, or highest grade of the interval Iab, as shown respectively in Figs. 2–4. Finally, according to the location of u, we use one of the three sets of formulas to calculate RMD, as shown in Eqs. (4)–(6), accordingly.

Figure 3Highest case: the position between u with parameter m1L and fuzzy intervals (a1L, b1L) and (c1L, d1L). Symbols with different colors indicate different fuzzy intervals.
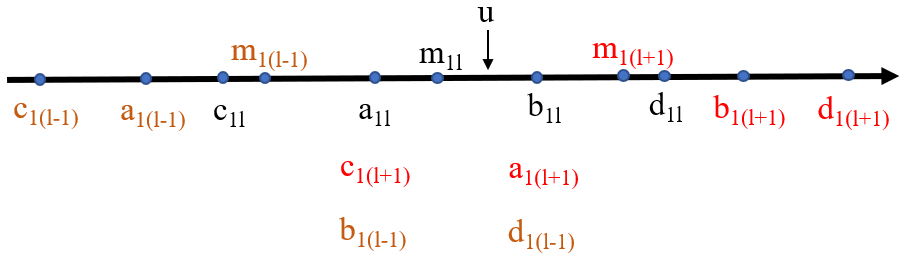
Figure 4Middle case: the position between u with parameter m1l and fuzzy intervals (a1l, b1l) and (c1l, d1l). Symbols with different colors indicate different fuzzy intervals.
Algorithm 1VFS–IEM compound hazard level evaluation.
Following the previous works by Kwakernaak (1978) and Chen and Yu (2006), we use the variable fuzzy recognition model to obtain the comprehensive RMD of each driver. Then, the proposed compound hazard level evaluation model can be constructed by Eq. (7).
where α and β are two hyper-parameters, wr indicates the weight of each hazard driver, ν(u)l is the weighted RMD of different hazard drivers, and H is the compound hazard level. The weights of the individual hazard drivers wr are obtained via the use of information entropy (Liu et al., 2010) as shown in Eq. (8):
where vrl is defined as the measured value from the lth level for the rth driver and N denotes the sample size. The detailed procedure of VFS–IEM is shown in Algorithm 1.
3.2 Dynamic risk assessment model: IDM
To assess the dynamic risk of compound hazards, especially when the data sets are sparse, the information diffusion method (IDM) which belongs to the fuzzy theory can be used to extract useful underlying information from the limited data samples to estimate the probability function p and vulnerability curve f. According to Huang (1997), the J-dimension normal information diffusion function Γ(xi;Sk) (shown in Eq. 9) is more powerful to improve the precision of the estimators. Therefore, this paper adapts the normal information diffusion estimator to approximate the dynamic compound hazard risk:
Here N is the sample size of , 2, ⋯, N; j=1, 2, ⋯, J}, Kj is the number of diffusion points of a given monitor set sj, and is the diffusion coefficient with respect to different attributes j. Based on the normal estimator, the research by Huang (2002) has shown how to determine the coefficients (shown in Eq. 10). This approximate reasoning of information diffusion is used to estimate probabilities and fuzzy relationships from a small data set for risk assessment (Huang and Huang, 2018). As an example, we use a two-dimension normal estimator to calculate the discrete probability density function. For the given compound hazard attribute monitor set , we estimate the discrete probability matrix and the conditional probability distribution :
Similarly, we can calculate the three-dimensional diffusion function for the compound hazard attributes set , , , . Suppose s3 corresponds to the attribute of economic loss, the vulnerability curve between the set of causes s1, s2 and the consequence s3 can be estimated by the following fuzzy membership function:
where the fuzzy relationship model (shown in Eq. 13) is defined by the three-dimension information diffusion function Γ(xi;SK).
Then the vulnerability curve , is defined as follows.
Based on the VFS–IEM–IDM risk assessment model, the dynamic compound hazard risk (direct economic losses) can be obtained via Eq. (15), where the risk is quantified as the expected value of the conditional probability distribution p and the vulnerability distribution f. The detailed procedure of IDM is shown in Algorithm 2.
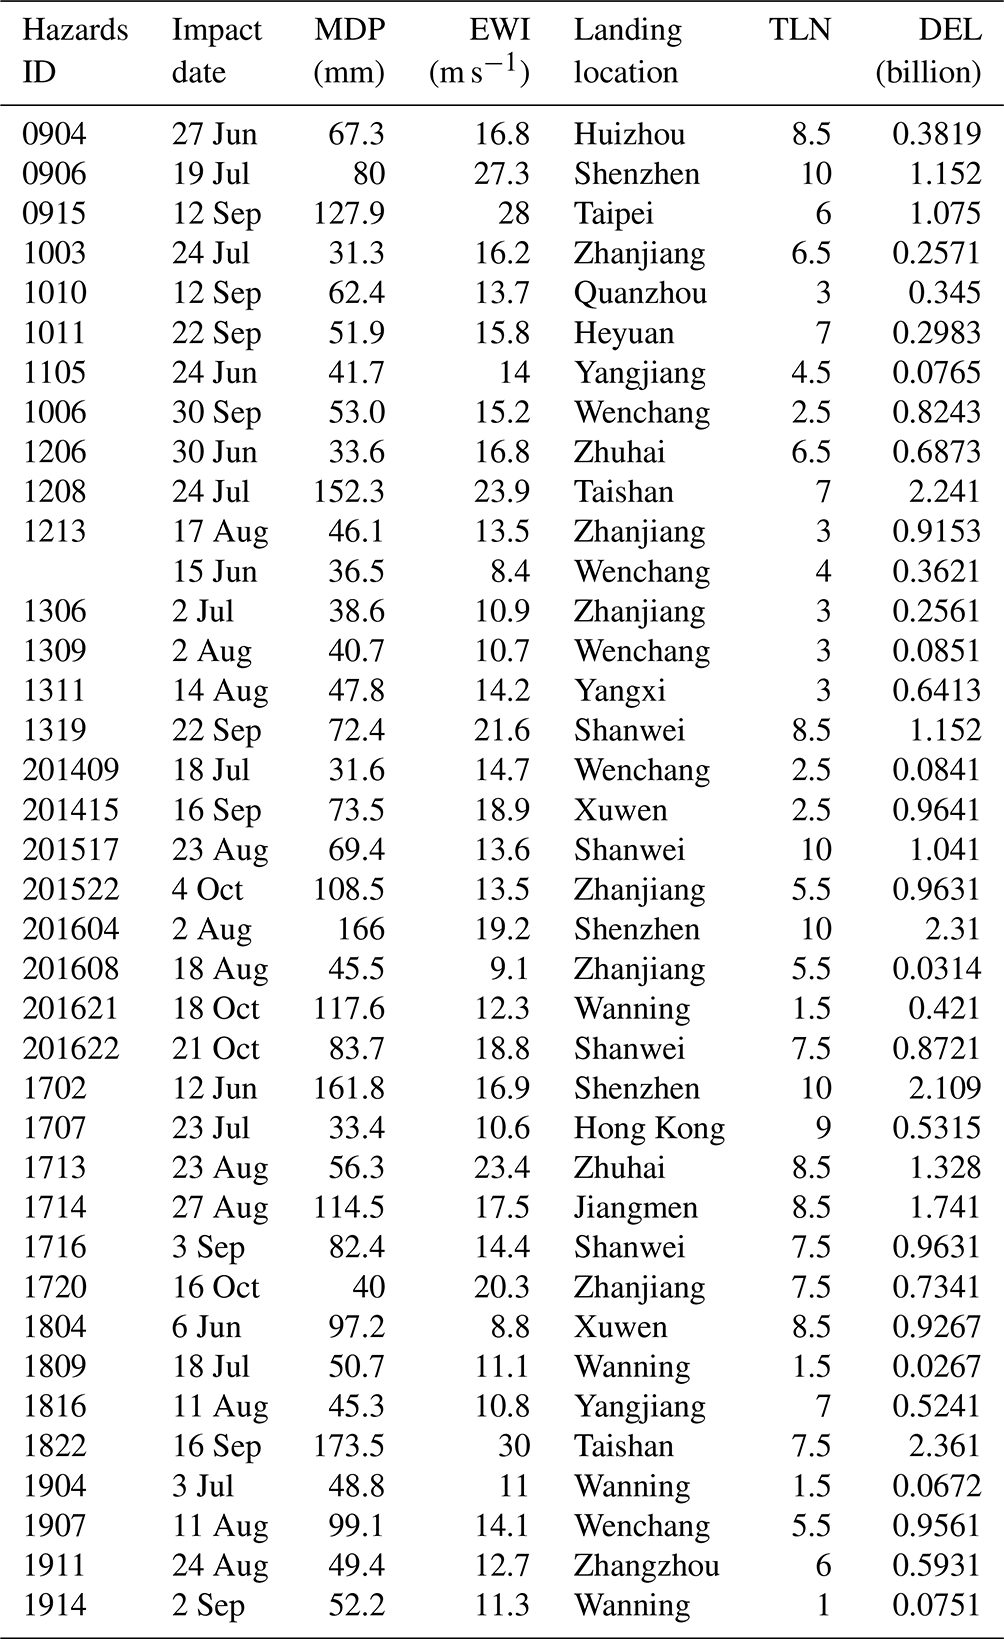
In this section, we evaluate VFS–IEM–IDM with a case study of typhoon–rainstorm compound hazards that occurred in Shenzhen, China. Shenzhen is located on the east bank of the Zhujiang River (also known as the Pearl River) and is surrounded by Daya Bay and Dapeng Bay, where the climate is subtropical and maritime. Typhoons and rainstorms are the most frequently occurring hazards in Shenzhen. According to the collected data, as shown in Table A1, the direct economic losses of the typhoon and rainstorm hazards from 1980 to 2016 in Shenzhen, on average, exceeded RMB 360 million per year. Also, Zhou investigated the typhoon and rainstorm hazards that caused 3.4 deaths on average, and about 149 000 people were affected (Zhou et al., 2017). Accurate assessments of the typhoon–rainstorm risk are crucial to determine whether or not the early warning systems are working and implemented effectively.
Algorithm 2IDM dynamic risk assessment model.
4.1 Classifications of individual hazard level
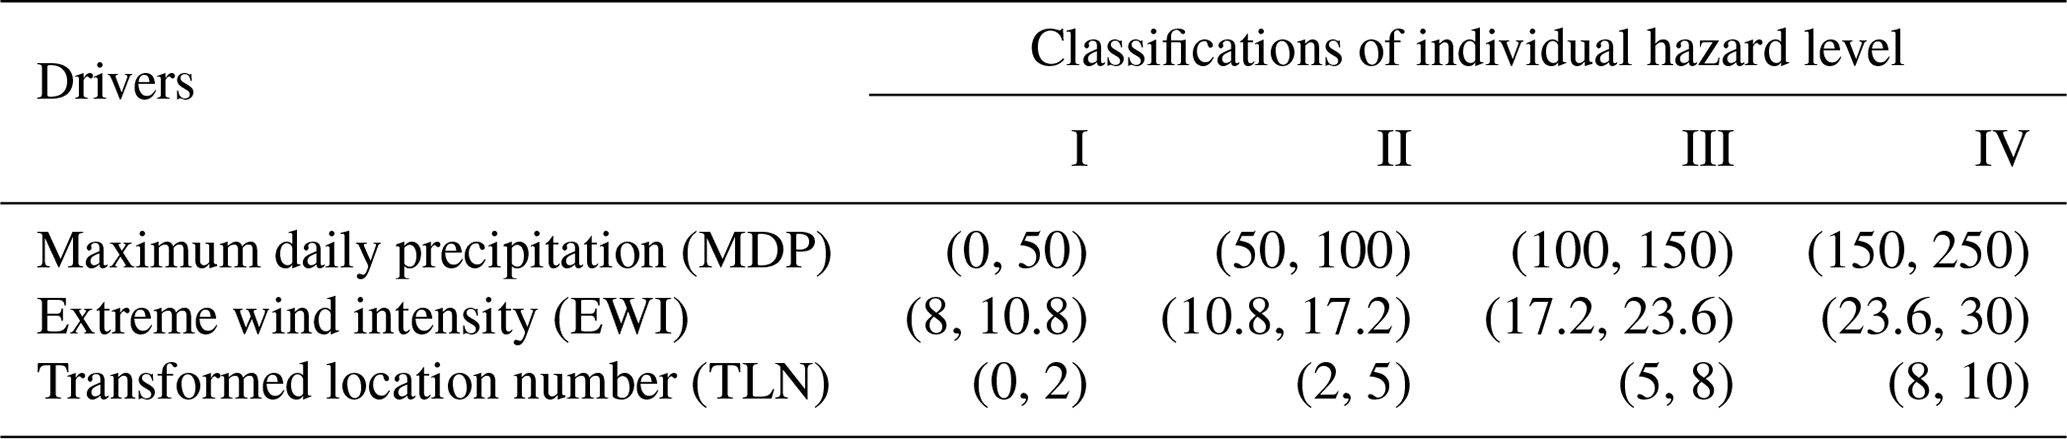
The typhoon–rainstorm compound hazards are usually characterized by three drivers, i.e., maximum daily precipitation (MDP), extreme wind intensity (EWI), and landing location. To better measure the impact of typhoon landing on the typhoon–rainstorm compound hazard level, the landing location is converted into transformed location number (TLN) via circle distance calculation, where the large value represents that the typhoon landing in Shenzhen is closer. Based on the data provided by the Meteorological Bureau of Shenzhen Municipality (http://weather.sz.gov.cn/qixiangfuwu/qihoufuwu/, last access: 15 January 2022), the values of the three drivers are segmented into four intervals in terms of four individual hazard levels, i.e., I, II, III, and IV. A higher hazard level indicates a more severe consequence.
Based on the segmentation of the four individual hazard levels, we also classify the typhoon–rainstorm compound hazards into four levels, i.e., I, II, III, and IV, where a higher compound hazard level indicates the corresponding compound hazard is of greater severity. As described in Sect. 3.1, the VFS–IEM compound hazard level evaluation model (Algorithm 1) can be applied to obtain the comprehensive value H, which is then used to derive the compound hazard level based on the classification criteria of the typhoon–rainstorm compound hazards.
4.2 Calculation of relative membership degree
The relative membership degree is determined by the individual hazard level classifications. According to the value segmentation shown in Table 1, we have the different fuzzy intervals for four different hazard levels. Then, for three hazard drivers, the interval criterion matrix Iab can be expressed as
Further, the corresponding interval Icd for different hazard level is defined as
and we define the balance boundaries matrix M:
In the end, the relative membership degree matrix can be calculated by Eqs. (4)–(6). Taking sample point = (MDP = 33.4, EWI = 18, TL = 9) for example, we obtain the relative membership degree matrix shown as below, in which the matrix element represents the probability of each driver belonging to the four individual hazard levels.
4.3 Typhoon–rainstorm hazard level
To derive the compound hazard level, the information entropy method is used to obtain the weight of each hazard driver. We have the weight Ω shown as follows, where the element in Ω implies that the maximum daily precipitation and location play the main role in determining the typhoon–rainstorm hazard level.
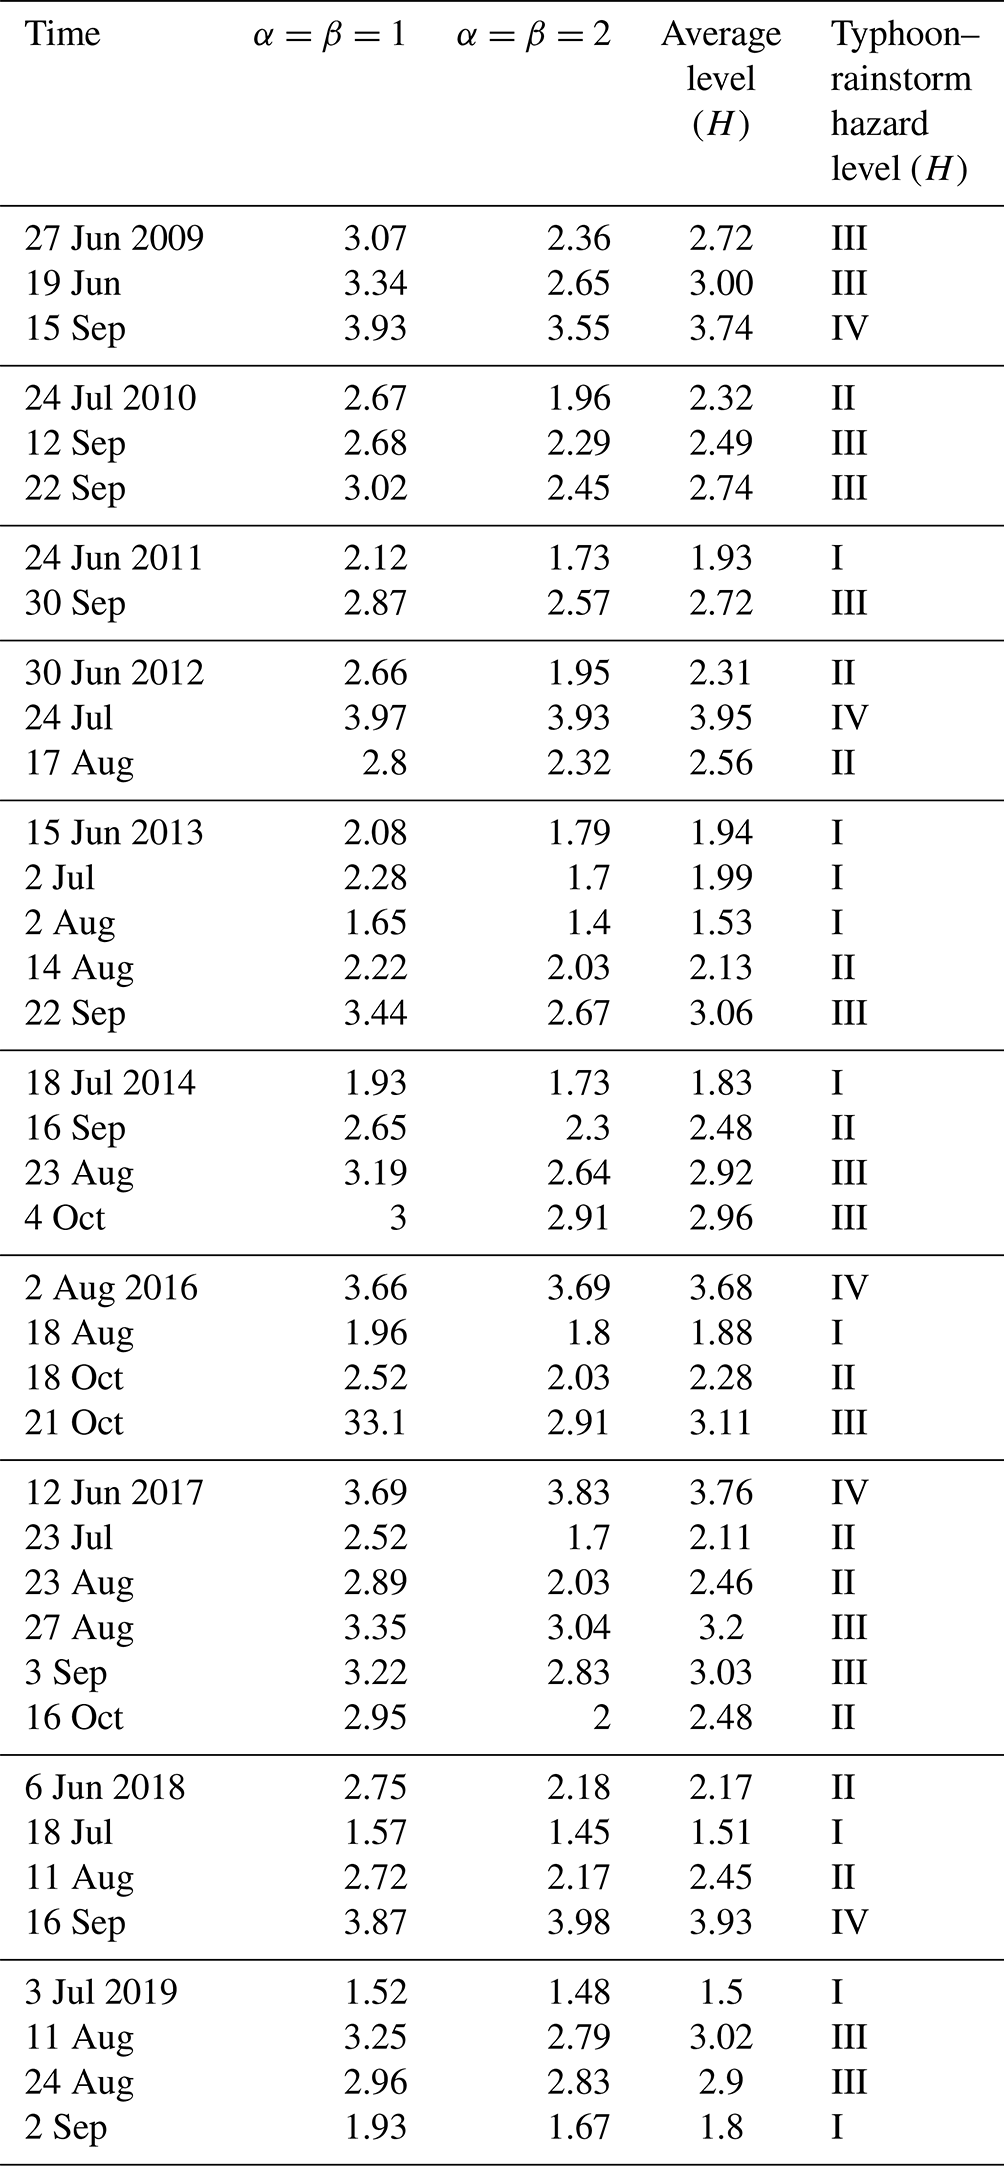
Based on the VFS–IEM compound hazard level evaluation model (Algorithm 1), we obtain the comprehensive value H of typhoon–rainstorm hazards. Then, guided by the domain experts, we have the classification criteria of the typhoon–rainstorm compound hazard level in Shenzhen: for level I, for level II, for level III, and for level IV. For the case (MDP = 33.4, EWI = 18, TL = 9), the value of the typhoon–rainstorm hazard level H is obtained. When the hyper-parameters , H=2.75. When , H=2.18. Furthermore, we take the average of H=2.75 and H=2.18 to obtain the final compound hazard level value, i.e., H=2.4, which corresponds to the compound hazard level II. The results of other typhoon–rainstorm cases can be found in Appendix Table B1.
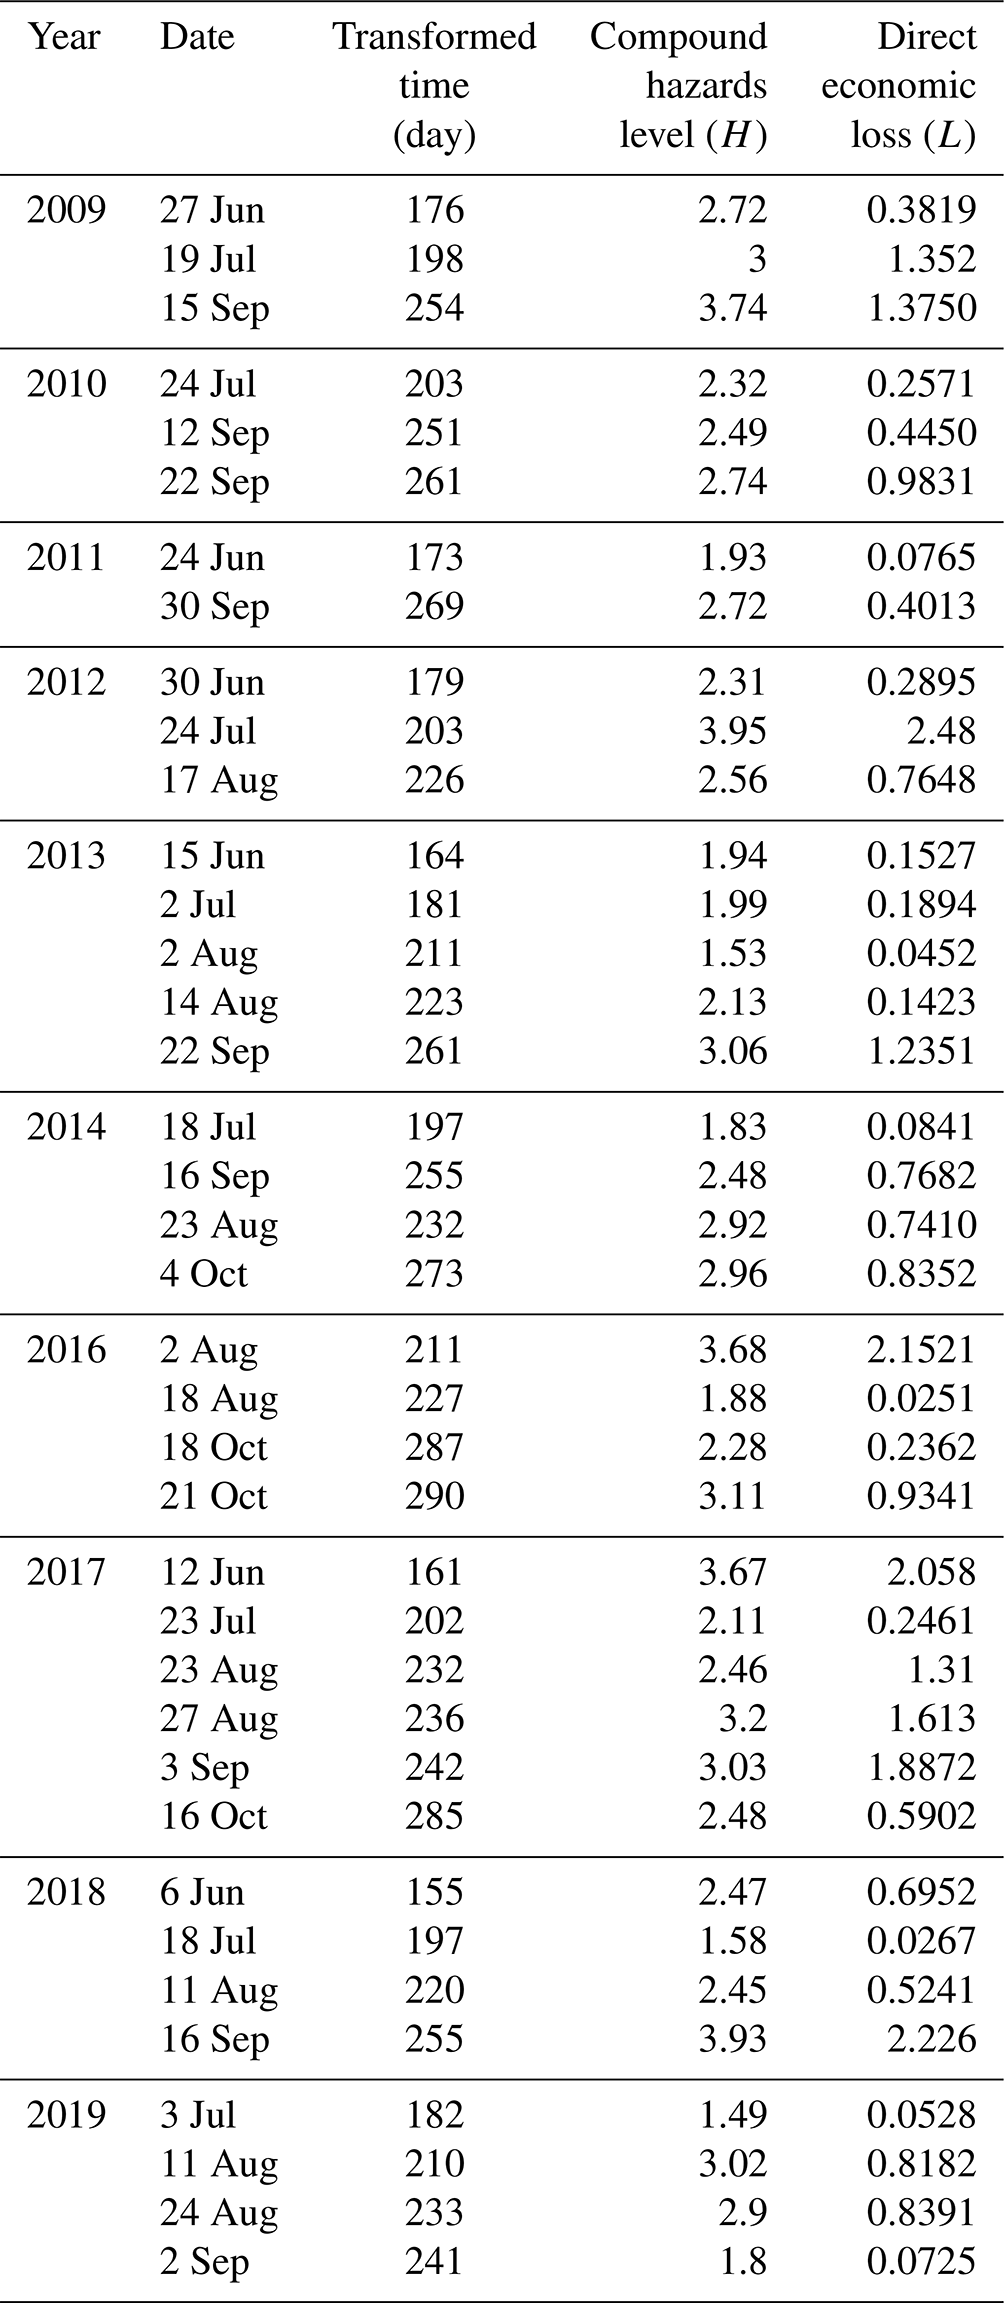
Table 2Transformed typhoon–rainstorm hazard data sets in Shenzhen.
4.4 Dynamic typhoon–rainstorm hazard risk
Based on the data in Table 2, we obtain three typhoon–rainstorm hazard attributes, including direct economic loss L (Billions), hazard level H, and hazard occurrence day. Then the dynamic risk of compound hazards can be calculated by 38 data points:
where xi1 and xi2 represent the time attribute of the typhoon–rainstorm hazards and the compound hazard level, respectively, and xi3 represents the direct economic losses caused by the typhoon–rainstorm hazards. Then the diffusion coefficients can be calculated by Eq. (10), shown as follows.
Following Algorithm 2, we use the information diffusion method to estimate the conditional probability and vulnerability distribution of the typhoon–rainstorm hazards. In this paper, we define the following monitor space: corresponds to months (June, July, August, September, October), corresponds to the compound hazard levels (I, II, III, IV), and corresponds to the direct economic losses. Then we can calculate the joint probability density function P and the conditional probability function as follows:
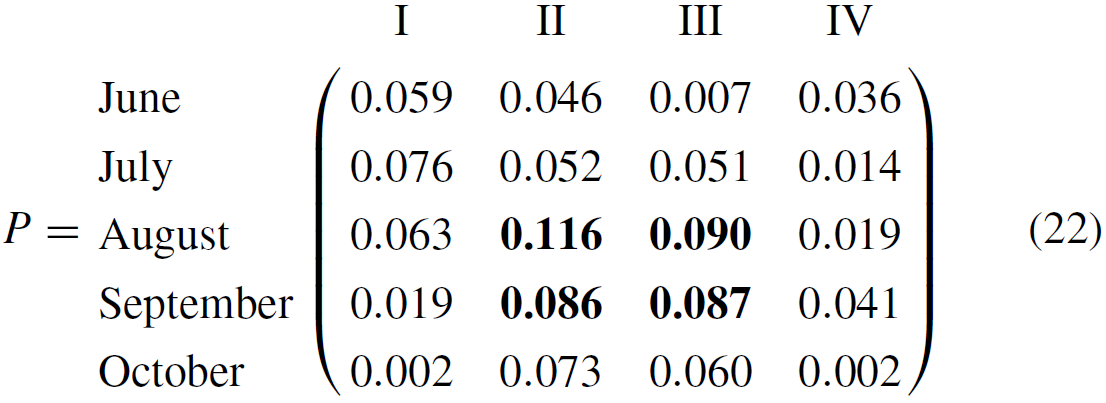
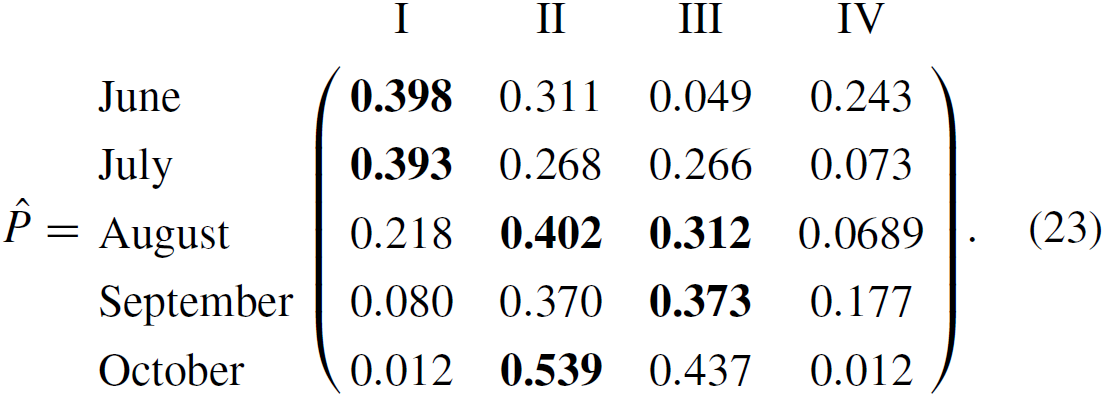
From the results above, it can be seen that the typhoon and rainstorm with hazard level III occur more frequently, and they are most likely to occur in August and September. Furthermore, the vulnerability distribution f between the hazard level H and the direct economic losses L over the time attribute T can be calculated by the three-dimension diffusion estimator (shown in Eq. 13). The fuzzy causal relationship which takes the time attribute T and hazard level H as the inputs and the loss L as the output is denoted as matrix R. Then the discrete vulnerability curve f in terms of the direct economic loss is evaluated by Eq. (14).
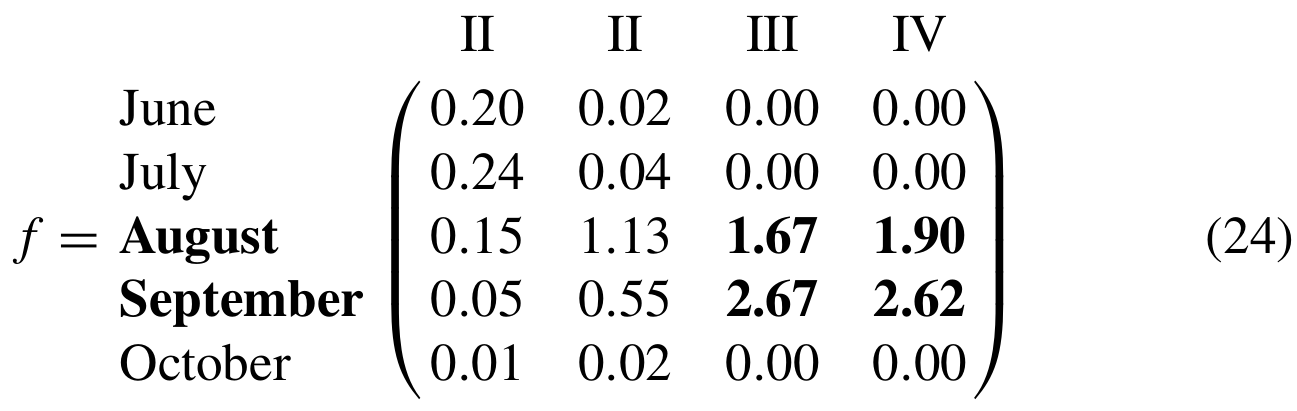
It can be seen that most of the economic losses caused by the typhoon–rainstorm hazards are concentrated in August and September. Dynamic compound hazard risks can be quantified as the expected value of the damages caused by the compound hazards, and the result is
where the elements of the vector denote the estimated economic losses caused by the typhoon–rainstorm hazards from June to October.
5.1 Compound hazard level prediction
The proposed VFS–IEM–IDM model provides a comprehensive evaluation of the compound hazard level, but the relationship between the hazard level and the hazard drivers is unclear. To find more information from the results of the compound hazard level evaluation model, we build a predictive model (shown in Eq. 26) to shed light on the relationship between the compound hazard levels.
Since the compound hazard level is ordinal data (monotone trend and proportional odds), the cumulative logistic model (shown in Eq. 27) can be used to predict the compound hazard level. Let the response be the compound hazard level with probability πh(U), h=1, ⋯, 4 under the covariate compound hazard drivers U. So the cumulative probability of H is less than or equal to level h; i.e., the probabilities of compound hazards belonging to different level categories are given by
According to the research by Alan (1980), the cumulative logistic model can be replaced by
where the log odds measures how likely the response H is to be in category h or below versus in a category higher than h. In this paper, the typhoon–rainstorm hazard level prediction problem can be solved by using the VAGM package (Thomas, 2010), and the result is given by
where the different intercept coefficients denote the main effects of different hazard drivers compared to the reference compound hazard level IV. The rationality of this model is judged by the likelihood ratio (LR) test (p value < 0.001) and the predictive performance R2=0.898, which shows that the model is well fitted and can be used to predict the compound hazard level.
5.2 The superiority of the normal diffusion estimator
One advantage of using the information diffusion method to assess the risk of compound hazards is that it does not need to know the type of distribution from which the given samples are drawn and the function form of the causal relationship, which are constructed by the joint probability distribution and the vulnerability distribution. More importantly, it can provide a more accurate evaluation when the compound hazard data set is sparse. The performance of the IDM estimation procedure has been well studied in the literature. For example, Huang (2000) shows the efficiency of IDM is about 35 % higher than the histogram estimator, and the estimation error is reduced by 23.2 % when the data sets are small. Therefore, the assessed compound hazard risk is more reliable and accurate using a normal diffusion estimator. However, if the size of the data samples is large, it is unnecessary to replace the statistics with the information diffusion method (Li et al., 2012).
5.3 Results
For the dynamic risk assessment of typhoon–rainstorm hazards, this paper proposes a hybrid model VFS–IEM–IDM and provides extensive assessment results based on a case study. The results of the VFS–IEM evaluation model show that the probability of type II and III hazard levels is the highest in Shenzhen, so the emergency management department should prepare more effective emergency plans to reduce secondary hazards. The dynamic risk assessment model IDM shows that the hazard occurrence probability of different hazard levels is different, and hazard level II and III are most likely to occur in August and September. Furthermore, considering the occurrence of the hazards with different hazard levels for each month, the probability of hazard level I occurring in June and July is the highest. Hazard level II mainly happens in August and October, and hazard level III is most likely to occur in September. From the perspective of hazard losses, the difference between the direct economic losses caused by the typhoons and rainstorms of the same hazard level each month indicates that the impacts of the typhoon–rainstorm hazards on the economy are not the same. Besides, the influence of economic losses decreases when the compound hazard level rises, which indicates that the capacity of typhoon–rainstorm hazard resistance in Shenzhen is reliable, and the ability to cope with sudden compound hazards is relatively strong under the existing emergency management system. The dynamic compound hazard risk of the typhoon–rainstorm hazards in Shenzhen shows that the compound hazard risk in each month is different, and the highest risk appears in August and September. On average, the typhoon–rainstorm hazards brought Shenzhen RMB 114 million and RMB 167 million in losses in these two months, respectively, which is in line with the actual situation.
Compound hazard risk assessment is a complex multi-criteria problem and is crucial to the success of strategic decision-making in emergency management. Traditional statistical methods are often inaccurate when only a small set of data samples is available. Few studies discuss the correlations of compound hazard drivers and consider the dynamics of the occurrences of the compound hazards. In this paper, we first present the definition of dynamic compound hazard risk and then propose the variable fuzzy set (VFS) and information entropy method (IEM) model to evaluate the compound hazard level by considering the correlations of different hazard drivers. Based on the results obtained by VFS–IEM, we apply the information diffusion method (IDM) to estimate the compound hazard probability and vulnerability distribution with the hazard occurrence time and the corresponding losses. Then the dynamic risk is calculated by the probabilistic model.
There are mainly three aspects of innovations in this paper. Firstly, based on the definition of compound hazard risk, we consider the temporal dynamics and introduce the concept of dynamic compound hazard risk. Secondly, considering that compound hazards have many drivers for the hazard level evaluation, a hybrid model of variable fuzzy sets and the information entropy method has been proposed to improve the accuracy of compound hazard level evaluation. Thirdly, according to the concept of dynamic compound hazard risk, we apply the information diffusion method to estimate the hazard probability and the vulnerability distribution. The proposed model VFS–IEM–IDM can be used to deal with the problem of data sparsity in dynamic compound hazard risk assessment. We quantify the dynamic typhoon–rainstorm risk by evaluating the expected value of the conditional probability distribution and the vulnerability distribution. Furthermore, VFS–IEM–IDM can be extended to other compound hazards in urban cities, such as flooding. As a case study, we show that the occurrences of the typhoon–rainstorm risks bring Shenzhen RMB 114 million and RMB 167 million in losses in August and September, respectively.
Dynamic risk assessment is a relatively new topic, and many issues need further improvement. In this paper, the weights of different hazard drivers are subjective, and the results of the vulnerability curve have not considered the development of the affected areas. There are also some subjective issues regarding the processing of the data sets. We will explore techniques to deal with these issues and improve assessment accuracy in future work.
For the typhoon–rainstorm dynamic compound hazard risk assessment, the useful data sets were collected from the Meteorological Bureau of Shenzhen Municipality (http://weather.sz.gov.cn/qixiangfuwu/qihoufuwu/nianduqihougongbao/, last access: 15 January 2022) and Typhoon Online (http://typhoon.nmc.cn/web.html, last access: 15 January 2022), and they are listed in Table A1. In this table, MDP denotes maximum daily precipitation, EWI denotes extreme wind intensity, DEL denotes direct economic loss, and the transformed location number (TLN) denotes the typhoon landing location, which is determined by radio distance transform using expert knowledge.
Based on the VFS–IEM model, this paper takes the average of and to denote the final typhoon–rainstorm hazard level. Table B1 shows the typhoon–rainstorm hazard level in Shenzhen.
The data and code used in the study are available at https://doi.org/10.5281/zenodo.7181424 (Gong, 2022).
WG and LY conceived the research framework and developed the methodology. WG was responsible for the code compilation, data analysis, and graphic visualization. WG and JJ wrote the first draft. LY managed the implementation of the research activities and revised the manuscript. All the authors discussed the results and contributed to the final version of the paper.
The contact author has declared that none of the authors has any competing interests.
Publisher's note: Copernicus Publications remains neutral with regard to jurisdictional claims in published maps and institutional affiliations.
This article is part of the special issue “Advances in flood forecasting and early warning”. It is not associated with a conference.
This work was mainly supported by the National Key Research and Development Program of China (grant nos. 2019YFC0810705 and 2018YFC0807000) and the National Natural Science Foundation of China (grant no. 71771113). The authors would like to acknowledge Shuanghua Yang and Manyu Meng of the Southern University of Science and Technology for providing useful information.
This research has been supported by the National Key Research and Development Program of China (grant nos. 2019YFC0810705 and 2018YFC0807000) and the National Natural Science Foundation of China (grant no. 71771113).
This paper was edited by Jie Yin and reviewed by three anonymous referees.
Alan, A.: Generalized Odds Ratios for Ordinal Data, Biometrics, 36, 59–67, https://doi.org/10.2307/2530495, 1980. a
Beaula, T. and Partheeban, J.: Application of Variable Fuzzy Sets in the Analysis of Synthetic Disaster Degree for Flood Management, Int. J. Fuzzy Log. Syst., 5, 153–162, 2013. a
Chen, Y. and Yu, G.: Variable Fuzzy Sets and its Application in Comprehensive Risk Evaluation for Flood-control Engineering System, Fuzzy Optimiz. Decis. Mak., 5, 153–162, https://doi.org/10.1007/s10700-006-7333-y, 2006. a, b, c, d
Choi, E., Ha, J. G., and Min, K. K.: A review of multihazard risk assessment: Progress, potential, and challenges in the application to nuclear power plants, Int. J. Disast. Risk Reduct., 53, 19–33, https://doi.org/10.1016/j.ijdrr.2020.101933, 2021. a
Fang, Y., Zheng, X., Peng, H., Wang, H., and Xin, J.: A New Method of the Relative Membership Degree Calculation in Variable Fuzzy Sets for Water Quality Assessment, Ecol. Indic., 98, 515–522, https://doi.org/10.1016/j.ecolind.2018.11.032, 2019. a
Gigovic, L. and Pamucar, D.: Application of GIS-Interval Rough AHP Methodology for Flood Hazard Mapping in Urban Areas, Water, 9, 1–26, https://doi.org/10.3390/w9060360, 2017. a
Gong, W.: Data sets of typhoon–rainstorm hazards in Shenzhen. NHESS, Zenodo [code and data set], https://doi.org/10.5281/zenodo.7181425, 2022. a
Gong, W., Chen, K., Tom, H. J., and Yang, L.: Risk Evaluation Based on Variable Fuzzy Sets and Information Diffusion Method, J. Appl. Math. Phys., 8, 821–830, https://doi.org/10.4236/jamp.2020.85064, 2020. a
He, Z. and Weng, W.: A Risk Assessment Method for Multi-Hazard Coupling Disasters, Risk Anal., 4, 14–25, https://doi.org/10.1111/risa.13628, 2020. a, b
Huang, C.: Principle of Information Diffusion, Fuzzy Sets Syst., 91, 69–90, https://doi.org/10.1016/S0165-0114(96)00257-6, 1997. a, b
Huang, C.: Demonstration of Benefit of Information Distribution for Probability Estimation, Signal Process., 80, 1037–1048, https://doi.org/10.1016/S0165-1684(00)00018-9, 2000. a, b
Huang, C.: Towards Efficient Fuzzy Information Processing: Using the Principle of Information Diffusion, Springer-Verlag, Berlin, Heidelberg, Germany, https://doi.org/10.1007/978-3-7908-1785-0, 2002. a, b
Huang, C.: A Formal Model of Dynamic Risk Analysis of Natural Disasters, J.f Catastrophol., 30, 1–9, 2015. a, b
Huang, C. and Huang, Y.: An Information Diffusion Technique to Assess Integrated Hazard Risks, Environ. Res., 161, 104–113, https://doi.org/10.1016/j.envres.2017.10.037, 2018. a, b, c, d, e, f
Jennifer, L. C. and Andrew, D.: Understanding compound hazards from a weather system perspective, Stoch. Environ. Res. Risk A., 32, 10–18, https://doi.org/10.1016/j.wace.2021.100313, 2021. a
Julià, P. B. and Ferreira, T. M.: From Single- to Multi-hazard Vulnerability and Risk in Historic Urban Areas: A Literature Review, Nat. Hazards, 108, 93–128, https://doi.org/10.1007/s11069-021-04734-5, 2021. a
Kappes, M. S., Keiler, M., and Elverfeldt, K.: Challenges of Analyzing Multi-hazard Risk: A Review, Nat. Hazards, 64, 1925–1958, https://doi.org/10.1007/s11069-020-04259-3, 2012. a
Khan, A., Gupta, C., and Gupta, S. K.: Multi-hazard Disaster Studies: Monitoring, Detection, Recovery, and Management, based on Emerging Technologies and Optimal Techniques, Int. J. Disast. Risk Reduct., 47, 16–42, https://doi.org/10.1016/j.ijdrr.2020.101642, 2020. a
Kwakernaak, H.: Fuzzy Random Variables: Definitions and Theorems, Inform. Sci., 15, 1–29, https://doi.org/10.1016/0020-0255(78)90019-1, 1978. a
Li, Q.: Fuzzy Approach to Analysis of Flood Risk Based on Variable Fuzzy Sets and Improved Information Diffusion Methods, Nat. Hazards Earth Syst. Sci., 13, 239–249, https://doi.org/10.5194/nhess-13-239-2013, 2013. a
Li, Q., Zhou, J., Liu, D., and Jiang, X.: Research on Flood Risk Analysis and Evaluation Method Based on Variable Fuzzy Sets and Information Diffusion, Safety Sci., 50, 1275–1283, https://doi.org/10.1016/j.ssci.2012.01.007, 2012. a, b
Liu, L., Zhou, J., An, X., Zhang, Y., and Yang, L.: Using Fuzzy Theory and Information Entropy for Water Quality Assessment in Three Gorges Region, China, Exp. Syst. Appl., 37, 2517–2521, https://doi.org/10.1016/j.eswa.2009.08.004, 2010. a
Mehran, A., Abdollah, A., and Mohammad, H. F. J.: Fuzzy Probabilistic Expert System for Occupational Hazard Assessment in Construction, Safety Sci., 93, 16–28, https://doi.org/10.1016/j.ssci.2016.11.008, 2017. a
Ming, X., Xu, W., Li, Y., Du, J., and Shi, P.: Quantitative Multi-hazard Risk Assessment with Vulnerability Surface and Hazard Joint Return Period, Stoch. Environ. Res. Risk A., 29, 35–44, https://doi.org/10.1016/j.wace.2021.100313, 2015. a
Ming, X., Liang, Q., Xia, X., and Hou, J.: A quantitative multi-hazard risk assessment framework for compound flooding considering hazard inter-dependencies and interactions, J. Hydrol., 607, 1274–1279, https://doi.org/10.1016/j.jhydrol.2022.127477, 2022. a, b
Thomas, W. Y.: The VGAM Package for Categorical Data Analysis, J. Stat. Softw., 32, 1–34, 2010. a
Wang, J., He, Z., and Weng, W.: A review of the research into the relations between hazards in multi-hazard risk analysis, Nat. Hazards, 104, 2003–2026, https://doi.org/10.1007/s11069-020-04259-3, 2020. a
Wang, Y., Sheng, D., Wang, D., Ma, H., Wu, J., and Xu, F.: Variable Fuzzy Set Theory to Assess Water Quality of the Meiliang Bay in Taihu Lake Basin, Water Resour. Manage., 28, 867–880, https://doi.org/10.1007/s11269-014-0521-6, 2014. a
Xu, W., Zhuo, L., Zheng, J., Ge, Y., Gu, Z., and Tian, Y.: Assessment of the Casualty Risk of Multiple Meteorological Hazards in China, Int. J. Environm. Res. Publ. Health, 13, 222–234, https://doi.org/10.3390/ijerph13020222, 2016. a, b
Zhou, L., Wu, X., Ji, Z., and Gao G.: Characteristic Analysis of Rainstorm-induced Catastrophe and the Countermeasures of Flood Hazard Mitigation about Shenzhen City. Geomatics, Nat. Hazards Risk, 8, 1886–1897, https://doi.org/10.1080/19475705.2017.1392368, 2017. a
Zhou, S., Zhai, G., and Shi, Y.: A Literature Review of Urban Natural Disaster Risk Assessment, J. Catastrophol., 35, 180–186, https://doi.org/10.3969/j.issn.1000-811X.2020.04.033, 2020. a
- Abstract
- Introduction
- Preliminaries
- Dynamic risk assessment of compound hazards: VFS–IEM–IDM
- Case study
- Discussion
- Conclusions
- Appendix A: Data source
- Appendix B: Comprehensive compound hazard level
- Code and data availability
- Author contributions
- Competing interests
- Disclaimer
- Special issue statement
- Acknowledgements
- Financial support
- Review statement
- References