the Creative Commons Attribution 4.0 License.
the Creative Commons Attribution 4.0 License.
 | 06 Oct 2022
The 2017 Split wildfire in Croatia: evolution and the role of meteorological conditions
Ivana Čavlina Tomašević
Kevin K. W. Cheung
Višnjica Vučetić
Paul Fox-Hughes
Kristian Horvath
Maja Telišman Prtenjak
Paul J. Beggs
Barbara Malečić
Velimir Milić
The Split wildfire in July 2017, which was one of the most severe wildfires in the history of this Croatian World Heritage Site, is the focus in this study. The Split fire is a good example of a wildfire–urban interface, with unexpected fire behavior including rapid downslope spread to the coastal populated area. This study clarifies the meteorological conditions behind the fire event, those that have limited the effectiveness of firefighting operations, and the rapid escalation and expansion of the fire zones within 30 h. The Split fire propagation was first reconstructed using radio logs, interviews with firefighters and pilots involved in the intervention, eyewitness statements, digital photographs from fire detection cameras, media, and the monthly firefighting journal. Four phases of fire development have been identified.
Then, weather observations and numerical simulations using an enhanced-resolution operational model are utilized to analyze the dynamics in each phase of the fire runs. The synoptic background of the event includes large surface pressure gradient between the Azores anticyclone accompanied by a cold front and a cyclone over the southeastern Balkan Peninsula. At the upper level, there was a deep shortwave trough extending from the Baltic Sea to the Adriatic Sea, which developed into a cut-off low. Such synoptic conditions have resulted in the maximum fire weather index in 2017. Combined with topography, they also locally provoke the formation of the strong northeasterly bura wind along the Adriatic coast, which has been accompanied by a low-level jet (LLJ). The bura (downslope wind), with mid- to low-level gravity-wave breaking and turbulence mixing (as in the hydraulic jump theory), also facilitated the subsidence of dry air from the upper troposphere and rapid drying at the surface.
This study demonstrates that numerical guidance that indicates the spatial and temporal occurrence of a LLJ is highly capable of explaining the Split fire evolution from the ignition potential to its extinguishment stage. Thus, in addition to the conventional fire weather indices, such products are able to improve fire weather behavior forecasting and in general more effective decision-making in fire management.
- Article
(11229 KB) - Full-text XML
- BibTeX
- EndNote


Croatia lies within one of the world's most fire-prone areas, the Mediterranean Basin (Fig. 1a; e.g., San-Miguel-Ayanz et al., 2013; Rundel et al., 2018). In recent years, Mediterranean Europe has experienced a significant number of wildfires that have caused tremendous casualties in terms of human life (Lagouvardos et al., 2019), natural destruction (Pausas et al., 2008), and economic disruption (Moreira et al., 2011). Especially concerning are fires that burn at the so-called wildland–urban interface (WUI), such as many Mediterranean coastal regions, where small touristic towns merge with natural areas (Bento-Gançalves and Vieira, 2019). Coincidence of a wildfire and extreme weather conditions within the WUI can contribute to catastrophe. For example, the severe blaze within the WUI in eastern Attica (Greece) in 2018 took the lives of 102 people in less than 3 h (Lagouvardos et al., 2019).
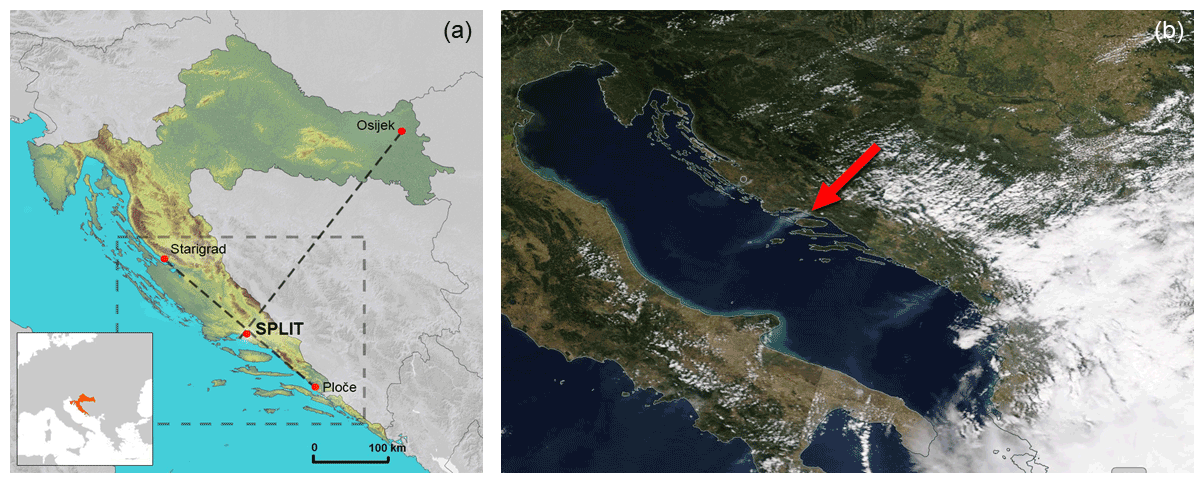
Figure 1(a) Location of the Split wildfire in Croatia with positions of vertical cross-sections (dashed lines) and location of the inner nested domain used in the ALADIN model simulation (dashed rectangle) and (b) Terra satellite MODIS image on 17 July 2017 showing active fire areas along the Adriatic Sea coast (https://worldview.earthdata.nasa.gov, last access: 18 August 2022).
Similar wildfire tragedies have occurred in many other regions globally. The deadliest wildfire in this century in Australia, Black Saturday in 2009, killed 173 people, the majority in the first 12 h following ignition (BoM, 2009), while an extremely high death toll and economic loss occurred in the United States (California) in the first 24 h of the 2018 Camp Fire (Brown et al., 2020). Extreme wildfires are rare; based on statistics from the western US, they account for only 1 % of fire occurrences but cause more than 90 % of damage (Strauss et al., 1989). Once ignited, rapid wildfire progression causing huge damage and high mortality mostly occurs in a short time interval during the wildfires' active period (Wang, 2011). Whether wildfire exhibits extreme behavior and becomes a major threat largely depends on prevailing weather conditions (e.g., Lydersen et al., 2014; Hernandez et al., 2015). Indeed, it has been found that, with available flammable vegetation, weather conditions explain the severe behavior and rate of spread of crown wildfires observed within Mediterranean ecosystems (Pyne et al., 1996; Ruffault et al., 2017).
The local state of the atmosphere in days prior to wildfire and during wildfire activity is determined by synoptic-scale weather systems, which would determine the conditions of fuels and set the background for other mesoscale factors responsible for the start and spread of fire. Linking synoptic features to extreme wildfire behavior or fire danger and localizing major wildfires in relation to existing fronts and low- and high-pressure areas has long been the subject of fire weather research (e.g., Beals, 1914; McCarthy, 1923; Werth, 2011). The majority of such studies found the most threatening synoptic patterns to be the ones creating conditions of increasing wind, accompanied by unusually low relative humidity, with an antecedent period of warm and dry stable conditions. Thus, the trigger for extreme wildfire behavior is an abrupt transition from so-called “blocking” or stationary and persistent anticyclonic patterns to a low-pressure environment, accompanied by a sudden change in wind direction and increase in wind speed, often with little or no precipitation. Indeed, many severe wildfire cases have been associated with the surface pressure pattern appearing as a border between two different air masses, known as a summertime dry cold front. This synoptic-scale phenomenon was confirmed in the aforementioned case of the catastrophic Black Saturday fires in Australia in 2009 (Cruz et al., 2012; Engel et al., 2013; Dowdy et al., 2017), as well as in numerous other large wildfires that have occurred either prior to or following a dry cold front passage in southeastern Australia (e.g., Bond et al., 1967; Mills, 2005a, b; Long, 2006; Fromm et al., 2006; Reeder et al., 2015; Tomašević et al., 2022) and the United States (Schroeder et al., 1964; Brotak, 1977; Brotak and Reifsnyder, 1977). Although less often, cold fronts do sweep the Adriatic coast in summer. Research on synoptic conditions that occurred during 11 large (> 500 ha) wildfires in Croatia in the period from 1985 to 2010 showed association with cold fronts (e.g., Vučetić, 1987, 1992; Vučetić et al., 2007; Tomašević, 2012; Tomašević et al., 2022).
Another critical fire weather pattern includes synoptically forced downslope winds, resulting from interaction of prevailing flow with the underlying topography. Strong downslope winds are often related to sudden escalations in local fire danger levels and with rapid wildfire spread (e.g., Kondo and Kuwagata, 1992; Conedera et al., 1996; Sharples et al., 2010). Strong gusts cause abrupt surface drying and warming on the lee side of mountains through adiabatic compression and turbulent mixing (Whiteman, 2000; Abatzoglou et al., 2020). Foehn, a variety of downslope wind, has been related to severe wildfire behavior in the lee of the Rocky Mountains in the United States and southern Canada (Brewer and Clements, 2020), the southeastern Australian Alps (Marsh, 1987; Sharples et al., 2010; Tomašević et al., 2022), and the southern Alps in New Zealand (Pretorius et al., 2020). The characteristic downslope wind associated with wildfires along the eastern Adriatic coast is the bura wind (local name for bora wind). It is the northeasterly, gusty, and dry but cold wind that blows perpendicular to the mountain barrier of the Dinarides and mostly from the northeast (NE) along the coast (Grisogono and Belušić, 2009). Bura is more frequent in the northern than in the southern Adriatic (including the Split area), but it can be similarly severe (e.g., Horvath et al., 2009). Although bura is more frequent in winter (Vučetić, 1991), with gusts up to 69 m s−1 (248.4 km h−1; Vučetić and Vučetić, 2013) on the lee side of the coastal range in the form of bura jets (e.g., Grisogono and Belušić, 2009; Telišman Prtenjak et al., 2015; Belušić et al., 2018), severe episodes may occur during summer as well (Telišman Prtenjak et al., 2010). If bura coincides with a wildfire, it dominates its behavior, as has been confirmed in multiple events (Kozarić and Mokorić, 2012; Tomašević, 2012; Tomašević et al., 2022).
In addition to cold front and bura wind, low-level jets (LLJs; Bonner, 1968) are another less obvious mesoscale/microscale meteorological feature that has been found to coincide with large wildfires along the Adriatic coast (e.g., Vučetić et al., 2007; Tomašević, 2012). Regardless of its synoptic background, LLJs are associated with a very strong wind shear and turbulence in the atmospheric boundary layer (Byram, 1954). Rapid changes in wind speed and direction consequently result in rapid changes in the direction, rate of spread, and intensity of wildfires (Sharples et al., 2012), especially in areas of complex terrain such as the Adriatic coast.
Research on fire weather in Croatia is rare, and despite a few existing studies, many questions remain open. Previous studies have also had limited knowledge on fire behavior and progression and, therefore, could not correlate them with certain meteorological conditions. In July 2017 a severe wildfire occurred on the outskirts of Croatia's second-largest city, Split, situated on the coast of the Adriatic Sea. Due to its proximity to an urban area, the wildfire quickly captured public attention and became one of the country's most significant wildfires in terms of firefighting resources involved in the intervention; burnt forest and agricultural land; and the threat to people, property, and infrastructure. The “wind-driven” wildfire burned within complex coastal orography, consisting of a steep mountain range backing the coastline. In the first 30 h from its ignition, the wildfire exhibited unusual behavior and was at times unexpectedly active. It was characterized by rapid progression, widespread flaming, and spotting; it easily transitioned to a crown fire, burned overnight without slowing down, and on multiple occasions spread rapidly downhill towards the city. An extreme fire weather event like in this case calls for special attention and provides an opportunity to investigate meteorological factors that can lead to such a destructive and life-threatening phenomenon. Therefore, the aim of this study is to analyze atmospheric processes related to the major fire runs during the Split wildfire in Croatia, in order to improve understanding of the most dangerous fire weather conditions that can occur along the Adriatic coast and contribute to both fire weather forecasting and more effective decision-making in fire management.
The meteorological context of the Split wildfire is investigated in the subsequent sections. A description of the Split environment and an overview of the wildfire's aftermath are given in Sect. 2. Section 3 describes the data and methods, Sect. 4 details observed and modeled atmospheric conditions prior to ignition and in the first 30 most significant hours of the Split wildfire, and Sect. 5 provides further discussion and a summary.
The most fire-prone area in Croatia is the Adriatic Sea coastline (Fig. 1a), together with its surrounding hinterland and islands, of which there are more than a thousand in the Croatian archipelago. High fire risk is pronounced during summer months, from June to August, when long dry spells and intense heat favor fire ignition and spread through highly flammable Mediterranean vegetation including pine forests and shrubs. The majority of wildfires are human-caused (Mamut, 2011), with an average annual burnt area of ∼ 18 400 ha in ∼ 2500 wildfires every year (including the smallest ones) based on statistics from the period 2006–2016 (DUZS, 2018). The burnt-area figure escalated in 2017, with a total of ∼ 87 000 ha in more than 4100 wildfires along the Adriatic coast, marking the worst fire season in Croatian history.
Split is a historic and touristic city, listed as a UNESCO World Heritage Site (Kapusta and Wiluś, 2017). Its wider urban area counts up to 300 000 citizens, with more than 720 000 tourists visiting in 2017 (Ministry of Tourism, 2018), mostly in July and August, when wildfires are most frequent. The Split wildfire occurred on the last night of the Ultra Festival, which attracted more than 150 000 visitors to the city that weekend alone. The city is situated on a peninsula surrounded by gulfs to the west and mountains and hills in the east. The wildfire started 15 km southeast of the city, in the valley between hills parallel to the Adriatic coast and oriented northwest to southeast (Fig. 2). Further inland lies the highest mountain, Mosor (1339 m a.s.l.), with foothills, towards the Adriatic Sea, Makirina (marked as C in Fig. 2; 723 m a.s.l.), Sridivica (B; 420 m a.s.l.), and Perun (A; 533 m a.s.l.). The peaks are between 2 and 8 km from the sea, making this highly urbanized coast very narrow. This type of topography, consisting of the steep mountain range rising from the coastline, can significantly influence airflows and create complex atmospheric dynamics in the area. The hinterland landscape is dominated by Mediterranean Aleppo pine forests (Pinus halepensis Mill.), scrub, and maquis intermixed with small agricultural fields within scattered villages. The area is well known to be prone to fires, but mostly with minor wildfire incidents each year. The last significant conflagration near Split, similar to the one from 2017 in terms of area burnt and firefighting demand, was in 2001 (Tomašević, 2012). However, that wildfire took 4 d to make the same impact as the 2017 fire had in under 30 h (Francetić, 2017). The 2017 wildfire was stopped only 4 km from the city center.
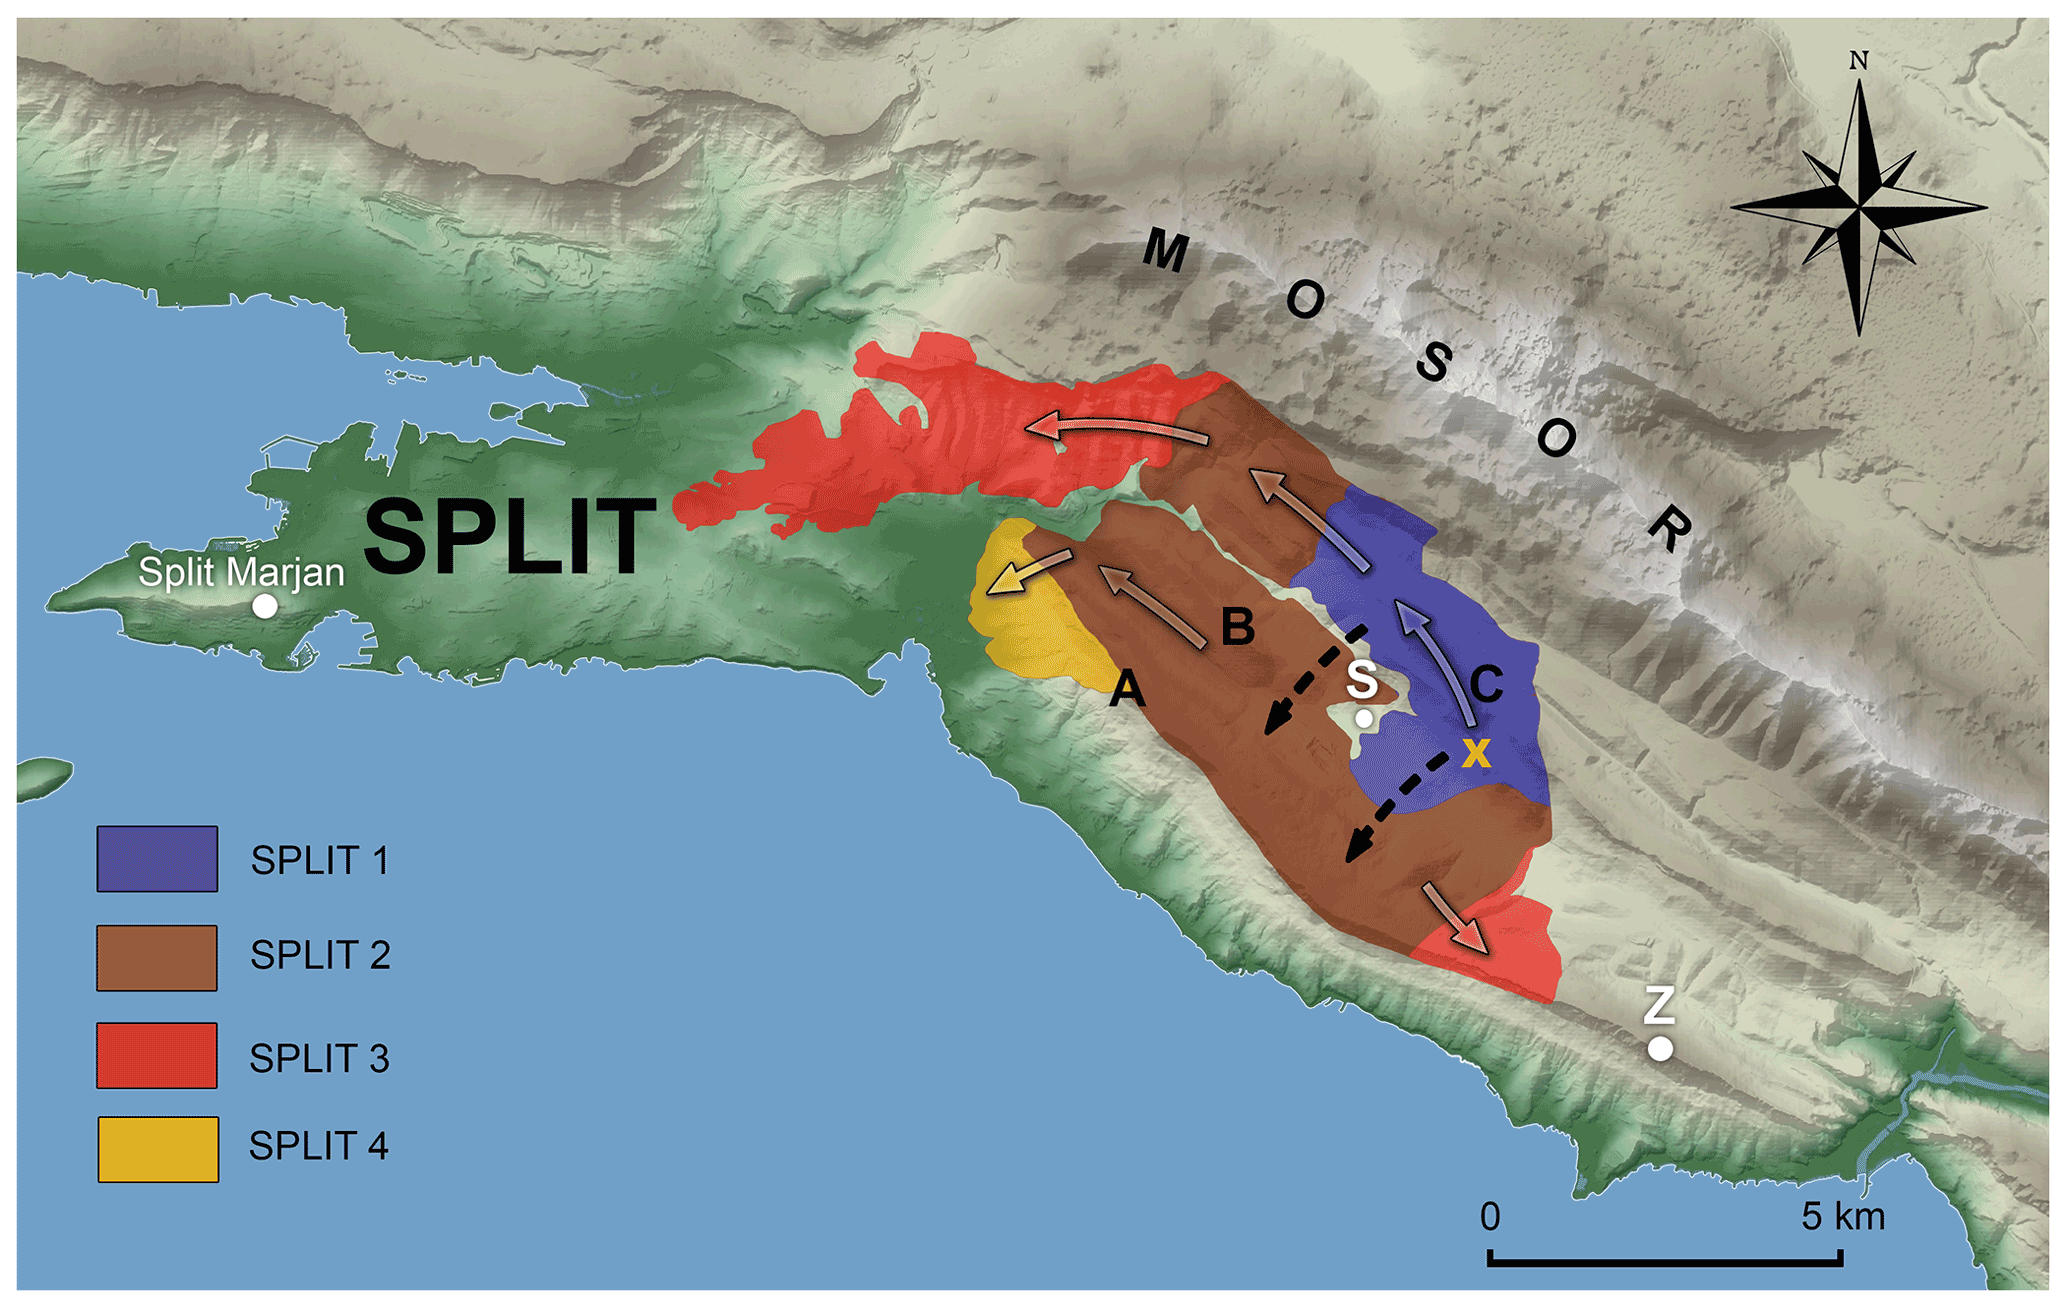
Figure 2Map of the Split wildfire with the final perimeter and four prominent progressions in growth, noted as SPLIT 1 to SPLIT 4, over the first 30 h from ignition (from 22:38 UTC on 16 July 2017 to 04:00 UTC on 18 July 2017). Ignition location is noted as X. White dots indicate locations of the Split-Marjan meteorological station, Zahod tower with cameras (noted as Z) used for fire detection and surveillance, the location of the village of Srinjine (noted as S). Split-Marjan and Srinjine are locations used for vertical profiles (pseudotemps). Letters indicate the hills Perun (A; 533 m a.s.l.), Sridivica (B; 420 m a.s.l.), and Makirina (C; 723 m a.s.l.), all part of the Mosor (1339 m a.s.l.) mountain range. (Basic topography from https://geoportal.dgu.hr/, last access: 18 August 2022.)
The 2017 wildfire lasted 9 d, from 16 to 25 July, and burned 5122 ha (Jovanović and Župan, 2017), most of which within 30 h of ignition. The total cost of the Split wildfire is estimated at USD 20.6 million. It burned 3 houses and damaged 46 others and burned 18 cars, 11 olive groves, and 2 greenhouses (DUZS, 2018). The plume from the wildfire crossed the Adriatic Sea and reached the coast of Italy, and it was clearly visible from space (Fig. 1b). Ash was observed up to 25 km south of the conflagration. Within the city, smoke drastically lowered air quality. The cause of the wildfire was declared to be of unknown origin. Given the size and rapid rate of spread of the fire, which made multiple runs into densely populated areas, it was very fortunate that no lives were lost as a direct result of the wildfire. Due to the intense fire activity, unexpected fire escalations, and enormous demands on property protection, mostly without aircraft support and with limited water supplies, additional firefighting resources and personnel from other parts of Croatia had to join the intervention, including ones from the closest island, which is unprecedented in Croatian firefighting history. In total 168 vehicles, 796 firefighters, and more than 200 soldiers were deployed. To date, firefighters refer to the Split wildfire as the “mother of all fires”.
3.1 Wildfire reconstruction
In order to correlate atmospheric conditions with extreme fire behavior a detailed wildfire reconstruction is provided before the meteorological analysis. Digital time-referenced photographs from official firefighting cameras situated at the Zahod tower (Fig. 2) on the southeastern peak of the hill Perun (594 m a.s.l.) provided information on time of ignition, propagation, and characteristics of the fire front, but only on its eastern side. The wildfire progression was mostly reconstructed from 3208 radio logs and 1124 emergency calls obtained from the Split Firefighting Brigade (SFB). This information, together with witness statements and interviews with firefighters and pilots, provided an insight into fire characteristics (flame height, crowning, smoke, and plume), spotting, weather conditions on the ground, and upper-air turbulence. Together with interviews, a large number of photographs were collected. All the information gathered was geo-referenced and used to approximately define fire isochrones. The reconstruction of the fire propagation and fire isochrones was plotted onto the total burnt area isochrone provided by the SFB.
3.2 Observations
Surface weather conditions were analyzed using meteorological data from the Split-Marjan station (122 m a.s.l.), the closest station to the wildfire (approximately 16 km west of the ignition location and 4 km from the closest line of final fire perimeter; Fig. 2). The Split-Marjan station is situated on the peninsula of the city of Split and has been operated by the Croatian Meteorological and Hydrological Service (DHMZ) since 1926, with automatic measurements since 2003. The meteorological variables used for this study include 10 min data of air temperature, relative humidity, mean sea level pressure, precipitation amount, mean and maximum wind speed and direction, and solar radiation, all from July 2017. Through the study, times are indicated in universal coordinated time (UTC), which is central European summer time (CEST) – 2 h. All measurements were recalculated accordingly.
Antecedent weather conditions were analyzed using climatological assessments available from the DHMZ. Assessments include the comparison of monthly, seasonal, and annual air temperature and precipitation with the climatological period 1961–1990 (from https://meteo.hr/klima.php?section=klima_pracenje¶m=ocjena, last access: 18 August 2022).
3.3 Fire danger rating
The Canadian Forest Fire Danger Rating System (CFFDRS) (Van Wagner and Pickett, 1985; Stocks et al., 1989) has been implemented in Croatia since 1982 (Dimitrov, 1982) and is used to alert firefighting agencies. The major product of the CFFWIS (Canadian forest fire weather index) system is the fire weather index (FWI), which is a combination of six sub-indices. Along with the FWI, this study also focuses on the ISI (initial spread index), one of the sub-indices, which represents the rate of fire spread in meters per minute.
3.4 Synoptic charts
The data used to examine the synoptic environment prior to and during the Split wildfire included synoptic surface and upper-level analysis obtained from the German Meteorological Service (Deutsche Wetterdienst, DWD; https://www1.wetter3.de/Archiv/, last access: 18 August 2022). The products used included 850 and 300 hPa wind and relative vorticity charts, 500 hPa geopotential (gpdam), surface pressure, and relative topography (RT; at 500 and 1000 m).
3.5 Numerical model
Numerical simulations were performed using the operational limited-area mesoscale numerical weather prediction model ALADIN-HR (ALADIN International Team, 1997). Details on model setup and configuration can be found in Tudor et al. (2013, 2015). For the purpose of this study, the ALADIN/HR model was initialized at 00:00 UTC for each day of the Split wildfire, from 16 to 25 July 2017, with the hourly output data. The simulation ran with two nested domains (in operational use at the DHMZ) in 4 km horizontal resolution (ALADIN-HR44) up to 72 h forecasting. The outer domain covers a 1900 km × 1700 km area, while the inner domain is zoomed on the area covering 550 km × 550 km over Croatia. The ALADIN model also provides dynamical adaptation of wind fields (ALADIN-HRDA) with 2 km horizontal resolution, which has in a number of cases improved near-surface wind representation in complex terrain such as the Adriatic Sea coastline (e.g., Hrastinski et al., 2015). Dynamically downscaled surface wind fields with a grid spacing of 2 km for the purpose of this study covered an additional sub-domain of 250 km × 250 km around Split.
Numerous validation and verification methods, in both an operational and in a research context, applied over the years confirmed that the ALADIN model also provides very good representation of the vertical state of the atmosphere (e.g., Horvath et al., 2009; Ivančan-Picek et al., 2016; Stanešić et al., 2019). For ALADIN-HR44, the vertical grid is stretched with 73 hybrid sigma-pressure levels, with the lowest vertical level at approximately 10 m above ground level, while dynamic adaptation products have 15 vertical levels (with 8 levels in the first 1000 m). Vertical profiles in this case are simulated for the Split location (43.525∘ N, 16.506∘ E) and included air pressure, air temperature, dew point temperature, wind speed, and wind direction.
Finer-scale atmospheric features were additionally examined by vertical cross-sections of horizontal wind speed and direction combined with air temperature, relative humidity, potential temperature, and z wind covering 300 km horizontally and 5 km in height. The location of vertical cross-sections can be seen in Fig. 1a.
3.6 Low-level-jet definition and spatial distribution
Here we introduce a new ALADIN model product, a spatial distribution of LLJs. Vertical profiles were simulated for each grid point at 4 km resolution and plotted over the inner domain over Croatia for each hourly time step. LLJs at a grid point were defined according to one of four criteria (Bonner, 1968):
-
a wind speed maximum between 10 and < 12 m s−1 with a wind speed decrease aloft by 4 m s−1 up to 3 km height, noted as LLJ criterion 0;
-
a wind speed maximum between 12 and < 16 m s−1 with a wind speed decrease aloft by 6 m s−1 up to 3 km height, noted as LLJ criterion 1;
-
a wind speed maximum between 16 and < 20 m s−1, with a wind speed decrease aloft by 8 m s−1 up to 3 km height, noted as LLJ criterion 2;
-
a wind speed maximum ≥ 20 m s−1 with a wind speed decrease aloft by 10 m s−1 up to 3 km height, noted as LLJ criterion 3.
The LLJ criterion 0 was additionally implemented since some of the previous studies indicated that ALADIN may underestimate near-surface wind speed (e.g., Vučetić et al., 2007). To our knowledge, a spatial distribution of LLJ speed and height has never been applied in fire weather research to date.
4.1 Wildfire reconstruction
The Split wildfire was characterized by four very active fire runs in the first 30 h from ignition (Fig. 2). Those four periods of broad fire spread accompanied by erratic fire behavior and air turbulence are noted as SPLIT 1 through 4. SPLIT 1 refers to the first 11 h of the wildfire, or a period from the late-night ignition to the morning hours the following day, when fire activity slightly eased. Within this period, firefighting aircraft could not join the intervention due to air turbulence. The SPLIT 2 period refers to early-afternoon fire reactivation and further spread of the fire zone with a mosaic fire front. SPLIT 3 refers to the late-afternoon escalation in fire activity around all zones with the most significant downhill fire run into the city. The fourth and final period, SPLIT 4, refers to the nighttime downhill fire run into the eastern suburbs of the city. It should be noted that during the defined periods wildfire simultaneously progressed and remained active while also reactivating at locations impacted beforehand.
4.1.1 Burn period SPLIT 1: 22:38 UTC (16 July)–09:00 UTC (17 July)
The wildfire was reported in the evening on 16 July 2017 at 22:38 UTC (00:38 CEST on 17 July), 15 km east of the city, on the southern foothill of Makirina (C, Fig. 2). Within minutes surveillance cameras (Z, Fig. 2) detected very fast fire growth. Wildfire developed under a very strong and gusty NE bura wind, which pushed the fire in the SW direction, into the valley. However, between strong bura gusts fire progressed northwards, burning uphill Makirina (C) and threatening villages at higher altitudes and the astronomical observatory. Depending on available fuels, wildfire easily transitioned to crown fire. From 05:00 UTC to 13:00 UTC on 17 July 2017, firefighting aircraft made multiple attempts to join the intervention but were unable to approach the site due to severe turbulence. According to fire officials, at one period during the early morning fire activity slightly eased, and wildfire could potentially have been controlled with air assistance at higher altitudes, while ground troops focused their suppression efforts on keeping the fire away from villages at lower altitude.
4.1.2 Burn period SPLIT 2: 10:00–14:00 UTC (17 July)
The significant shift in fire activity occurred around 10:00 UTC on 17 July. While still flanking along the hill Makirina, mostly towards the northwest, towards the city of Split, a southern flank of the fire front reactivated and spread further into the valley (Fig. 3a). Multiple spot fires created a mosaic fire front. Photographs from the camera at the Zahod location (noted as Z in Fig. 2) revealed fire smoke rising in different directions within the valley and surrounding hills during the early afternoon (Fig. 3b). At Makirina hill (C; Fig. 2) smoke was rising in the SW direction as well as within the valley in the NW direction and at the foothill of Perun (A; Fig. 2) vertically. Wildfire easily crossed the lower hill of Sridivica (B) and burned upslope on the northern side of the hill of Perun (A, Fig. 2). At some locations wildfire crossed the hill A and threatened to run downslope towards the sea (which happened in the late evening of the same day during the SPLIT 4 period). At this time it was prevented by the firefighting aircraft, which could join the intervention only at the southern side of hill A between 13:00 and 14:00 UTC. After 14:00 UTC weaker turbulence enabled firefighting aircraft to approach the fire burning in the valley, but it had only a minor impact on it. By 15:00 UTC, the NW flank of the wildfire, which was progressing towards the city, had traveled 6 km, 13 hours after ignition.
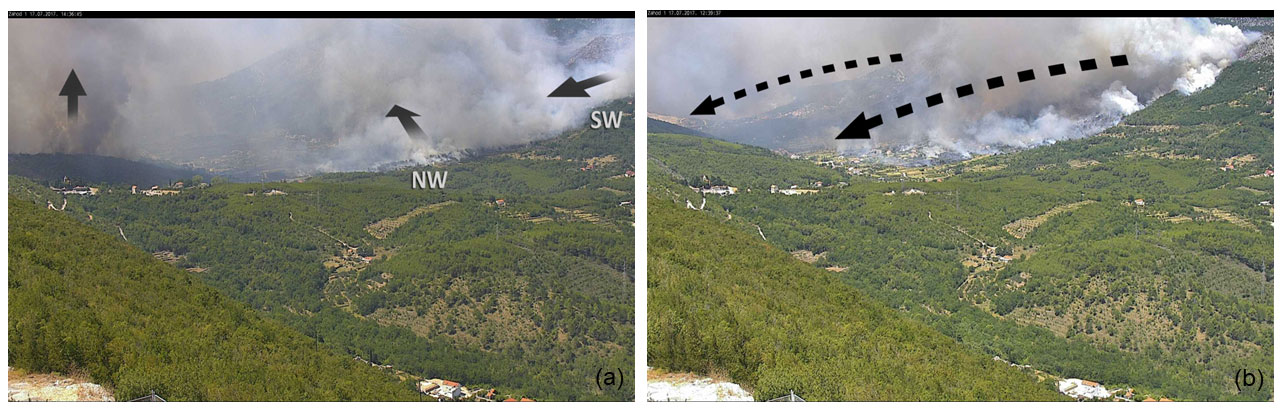
Figure 3Photographs from the Zahod location of (a) the mosaic fire front and wildfire spread down into the valley in SW direction between the SPLIT 1 and SPLIT 2 period (at 10:39 UTC on 17 July) and (b) fire smoke rising in different directions in the early afternoon hours during the SPLIT 2 period (at 12:30 UTC on 17 July).
4.1.3 Burn period SPLIT 3: 15:00–21:00 UTC (17 July)
During this burning period fire activity escalated around all fire zones. The NW flank of the wildfire, which by 15:00 UTC was located 10.5 km from the city center, turned southwest and started its downslope run towards the city from the nearby hills and Mosor (Fig. 2). The fire burned into dense pine forest in the higher altitudes in the northeast of the wider city area. This area also contains a possible minefield, remaining from the war in the 1990s, which meant fire burned into plenty of long unburned dry fuels. As the main fire front entered heavy fuel, smoke and ash lofted into the extensive convection plume (Fig. 4a). Also, a number of spot fires were reported ahead of the main front, and some ignited up to 500 m in distance by flying pine cones. It is striking that in the first 20 min of this burn period, wildfire crossed an additional 2.8 km, which makes the average forward rate of fire spread for this period 35 m min−1. According to a firefighter witness, six fire whirls were spotted in the northern city suburbs, along the foothill of Mosor. Due to the wildfire's high intensity, erratic behavior, and fast spread, constraining the propagation of the main fire front was not possible. Active fire suppression could only be organized in defensible space around people's homes. The situation within the city in this period can be described as chaotic. Fire threatened, among other things, gas stations, substations, and the city's main landfill. Observed spread rates within the outskirt suburbs were estimated to be from 500 m to 1 km per hour. The propagation of this flank of the wildfire was constrained due to fuel discontinuity and massive suppression efforts of firefighters, self-organized citizens, and military. This flank of the wildfire was stopped only 4 km from the historical city center and brought under control by 21:00 UTC. Overall, in less than 6 h wildfire traveled an additional 6.5 km. Although wildfire did not travel far east, along the valley where it started, drastic reactivation of the fire front on this side occurred simultaneously with the downslope fire run into the Split urban area (Fig. 2), which contributed to chaos in already-strained fire management. Firefighters on this side reported a 3 km long fire front, extensive spotting, and at one point flames up to 30 m high.

Figure 4(a) Fire smoke in the afternoon hours (15:09 UTC) on 17 July during the SPLIT 3 period, (b) fire burning into the highly populated coastal area, (c) wildfire's downslope run into the coastal area on the southern side of the hill Perun (A in Fig. 2)at 22:05 UTC and (d) 13 min later, at 22:18 UTC on 17 July, all during the SPLIT 4 period (photos in panels a, c, and d photographed by Zvonimir Barišin and photo in b photographed by Damira Kalajzić).
4.1.4 Burn period SPLIT 4: 22:00 UTC (17 July)–04:00 UTC (18 July)
By this time the wildfire drastically reactivated on the hill Perun (A; Fig. 2). Wildfire crossed the hill multiple times on 17 July, but only around 21:00 UTC did its activity escalate, and it could not be stopped before it ran downslope towards the sea. Wildfire burned into a native downy oak (Quercus pubescens) forest on the top of the hill and spread rapidly downhill, reaching a narrow and densely populated coastal area at the bottom of the hill within minutes (Fig. 4b, d). Crown fire propagated down slopes inclined at approximately 20∘ and in less than 30 min burned 1 km of forest before it reached houses. This flank of the fire front was 700–800 m long, with an average forward rate of fire spread of 2 km h−1, or 33 m min−1. According to witnesses, pine cones from the burning forest on the hill started several isolated spot fires up to 800 m ahead of the fire front. Flames from the crown fire reached heights in a range from 10 to 30 m above the canopy. This flank of the wildfire was controlled around 04:00 UTC in the morning on 18 July 2017. The majority of 5122 ha burned by this time. Only small additional areas burned until the wildfire was declared contained 9 d after ignition, on 25 July.
4.2 Antecedent conditions and fire danger rating
The summer season in Croatia in 2017 was extremely warm and dry, with air temperature at the Split-Marjan meteorological station 3.1 ∘C above average and with only 6 % of the 30-year (1961–1990) mean rainfall. Extreme weather conditions during the summer were an extension of a long dry period that started in the preceding spring season. Spring was very warm and dry, with the last significant rainfall in Split 2 months prior to the wildfire (on 26 May, 10.5 mm).
The lack of precipitation accompanied by higher-than-average air temperature in the months prior to the wildfire led to continued drying of fuels in the region and consequently had an impact on fire danger rating. Fire danger was very high for more than 20 consecutive days prior to the Split wildfire. On the day of the fire, FWI reached its annual maximum, and ISI reached the seasonal maximum (Fig. 5). This confirms that the most severe fire weather conditions in 2017 occurred on 16 July, the first day of the Split wildfire.

Figure 5Daily course of initial spread index (ISI) and fire weather index (FWI) at 12:00 UTC from 1 January 2017 to 31 December 2017 at Split-Marjan meteorological station.
Additionally, according to the definition of ISI, if it is greater than 18, then the estimated speed of a fire front is 18.3 m min−1. The seasonal peak value of ISI (27.4) also pointed out that, along with rapid spread, wildfire may create multiple fire fronts and develop into a crown wildfire, the most dangerous type of fire. According to wildfire reconstruction, this type of fire behavior occurred exactly in the first 30 h of the Split wildfire.
4.3 Surface synoptic conditions
The synoptic analysis revealed that prior to and during the first 30 h of the Split wildfire there was a strong pressure gradient over the Adriatic coast (Fig. 6a). On 16 July and most of the day on 17 July Croatian territory was placed between the front of the Azores anticyclone and rear of the cyclone over the SE Balkan Peninsula. Consequently, a strong pressure gradient over the 600 km long coastline was created, with pressure varying from approximately 1023 to 1010 hPa, which was followed by an advection by strong NE airflow. This gradient remained strong in the morning on 17 July, when aircraft reported severe turbulence. The pressure gradient along the Adriatic eventually weakened on 18 July and was replaced by almost non-gradient conditions which lasted for several days, until a low-pressure system on 24 July brought light rain over the fire ground. These conditions helped firefighters to completely extinguish the wildfire on 25 July 2017.
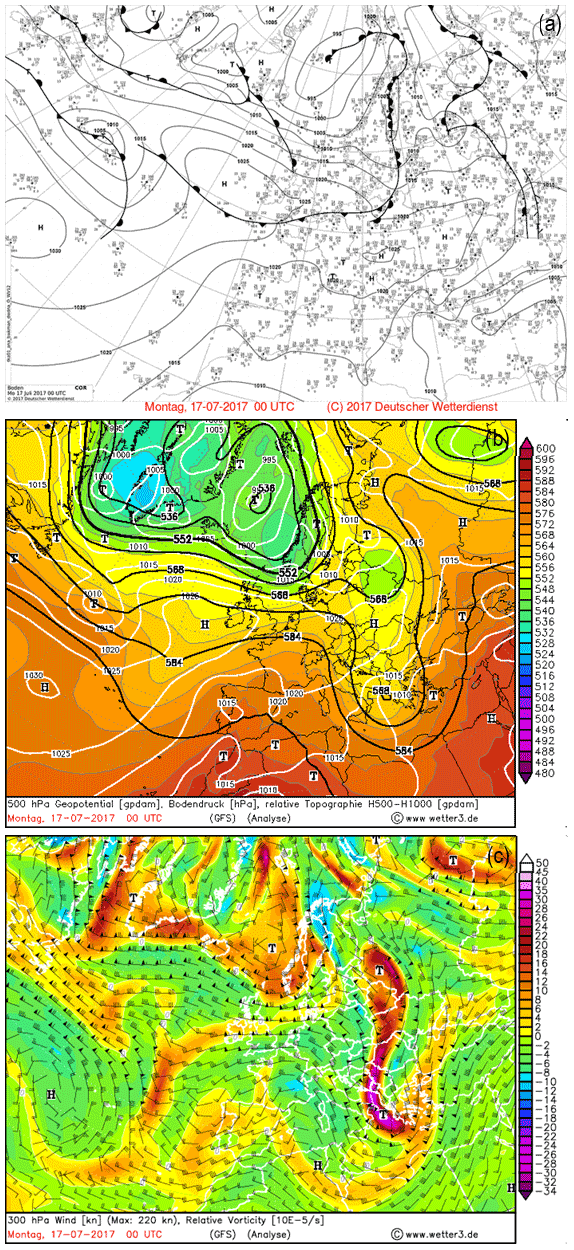
Figure 6Analysis charts for Europe at 00:00 UTC (approximately 2 h after the ignition) on 17 July 2017 of (a) mean sea level pressure (hPa; black contours) and fronts; (b) 500 hPa geopotential (gpdam; black contours), surface pressure (hPa; white contours), and relative topography RT (gpdam; colored); and (c) 300 hPa wind (kt, where 1 kt = 0.51 m s−1; wind barbs) and relative vorticity (10−5 s−1; colored). The Split wildfire location on charts is indicated as a red dot. (The charts are available from https://www1.wetter3.de/archiv/, last access: 18 August 2022.)
Model data corroborate the surface pressure analysis and depict the strong pressure gradient over the wildfire's area prior to ignition and until midday on 17 July (transition from SPLIT 1 to SPLIT 2 period). The wildfire location (43.5∘ N, 16.6∘ E) of ignition was placed in the narrow band of the tight pressure gradient between 1020 and 1012 hPa over 100 km of N–S line (between 43∘ N and 44∘ N; Fig. 9a). This tight pressure slightly eased during the day on 17 July (SPLIT 2 to SPLIT 4) and was replaced by a non-gradient field in the midday on 18 July.
4.4 Upper-level trough and cyclone
The upper-level charts revealed that synoptic conditions coinciding with the Split wildfire featured a large-amplitude upper-level trough extending from the Baltic Sea in the north to the Adriatic Sea in the south (Fig. 6b). The trough amplified in the hours prior to the wildfire. Around the time of ignition, the trough attained maximum strength and traveled slightly east, placing the wildfire's area exactly on its western side. Analysis of the 500 hPa chart (not shown) revealed stronger wind speed here (25.7 m s−1), accompanied by a 300 hPa jet stream (Fig. 6c; up to 46.3 m s−1). This western flank of the jet stream and trough is associated with air subsidence, which can be further confirmed by the advection of the vorticity maximum away from the wildfire's location. The region right behind the vorticity maximum is linked to the strong sinking motion.
A large-amplitude and shortwave trough are known to be dynamically unstable and also associated with fast upper-level cut-off processes (Jurčec, 1989). The cut-off process in this case started at 00:00 UTC (Fig. 6b) and further deepened by 06:00 UTC on 17 July, becoming a cut-off cyclone, which can be seen over the SE Balkans and Greece. The upper-level trough acted as a boundary between two airflows. On its western side, immediately above the wildfire's location, it brought a cool change with strong NNE airflow, while on the eastern side it brought ESE airflow with cloudiness and development of storm centers, which can be seen over the SE Balkan Peninsula from satellite imagery in Fig. 1b.
The model provides an accurate location of the upper-level shortwave trough stretched over the study area at 500 hPa, at the time of the wildfire's ignition (Fig. 7a–c); however, the cut-off process appeared earlier (by 16:00 UTC on 16 July) in ALADIN simulations in relation to synoptic analysis and a little dislocated towards the Adriatic Sea. By the time of the ignition, the Split wildfire was exactly on the western or rear edge of the upper-level cyclone, which caused the cool air outbreak from the north of the continent (Fig. 7a), bringing very dry air (Fig. 7b) and leaving clear skies over the entire Croatian territory, as can be seen in the satellite imagery (Fig. 1b). After the ignition, the upper-level cyclone progressively dissipated until the midday on 18 July 2017. During the whole study period (SPLIT 1 to SPLIT 4) the Croatian territory was placed in a narrow dry area of subsiding flow (Fig. 7b).
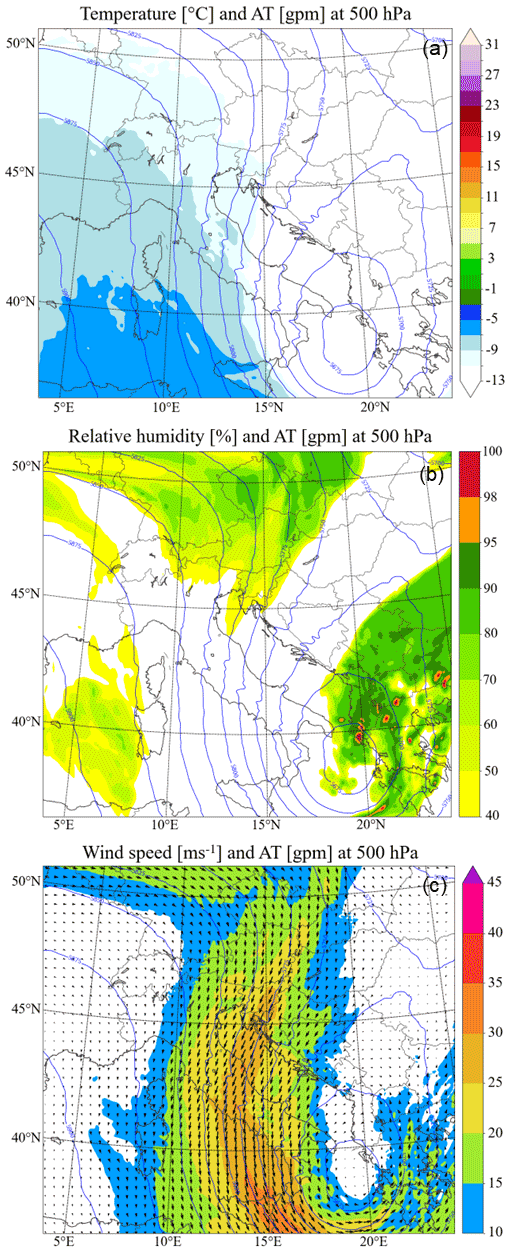
Figure 7(a) Temperature (∘C; colored), (b) relative humidity (%; colored), and (c) wind speed (m s−1; colored), all including geopotential height (AT) (gpm; blue contours) at 500 hPa from the ALADIN-HR44 model valid for 16 July 2017 at 23:00 UTC.
The wind pattern at 500 hPa also confirms the cool air outbreak from the north (Fig. 7c). A jet-like shape following a jet streak and jet stream aloft embedded the NE circulation in the morning on 16 July. As the jet streak was situated on the western side of the trough, it pointed to its amplification, which occurred hours prior to the ignition. The band of accelerated air further intensified and positioned the edge of its core immediately above the ignition location at ignition time.
4.5 Surface conditions and bura wind
Automatic measurements from the Split-Marjan station recorded the cool outbreak as a drop in maximum daily air temperature by 5 ∘C, from 33.3 to 27.0 ∘C between 15 and 16 July (Fig. 8a). This was followed by a drop in relative humidity which was sourced from dry air intrusion, despite the drop in air temperature, which remained between 18 % and 38 % for 2 consecutive days, on 16 and 17 July.
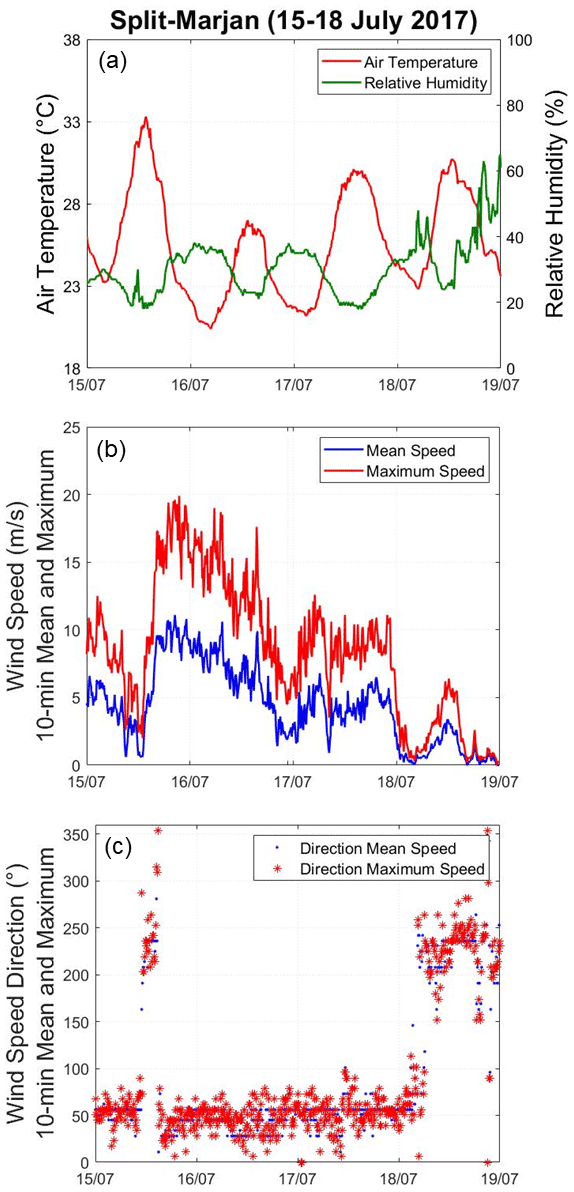
Figure 8Split-Marjan automatic weather station 10 min observations of (a) air temperature (∘C) and relative humidity (%), (b) mean and maximum wind speed (m s−1), and (c) mean and maximum wind direction (∘) from 15 to 18 July 2017.

Figure 9(a) Mean sea level pressure (hPa; colored) and (b) relative humidity (%; colored) at 2 m, both valid for 23:00 UTC on 16 July; (c) air temperature (∘C; colored) at 2 m valid for 13:00 UTC on 16 July; (d) relative humidity ( %; colored) at 2 m valid for 15:00 UTC, (e) air temperature (∘C; colored) at 2 m valid for 13:00 UTC, and (f) relative humidity ( %; colored) at 2 m valid for 23:00 UTC, all valid for 17 July 2017 from the ALADIN-HR44 model.
Simulated air temperature and relative humidity follow the in situ observation data and give insight into broader conditions in the mountainous outback where wildfire started. Maximum values here on 16 and 17 July were between 25 and 29 ∘C (Fig. 9c and e), with minimum values on the night of the ignition between 13 and 19 ∘C, depending on the elevation. The overnight relative humidity, during the first hours of wildfire, reached a maximum of 60 % at the elevated terrain (Fig. 9b). Early morning on 17 July brought a drop in relative humidity as expected (Fig. 9d); however, relative humidity in the area remained below 40 % the following night (between the SPLIT 3 and SPLIT 4 period; Fig. 9f).
Wind measurements at the Split-Marjan station confirm the NE airflow during the first 30 h of the wildfire (Fig. 8b, c). A sudden increase in wind speed is evident in the afternoon on 15 July, with the strongest gust of the month 19.9 m s−1. Wind gusts remained strong throughout 16 July, although they decreased to 4.5 m s−1 by the time of the wildfire's ignition (Fig. 8b). Wind speed and gusts increased again (to 12.7 m s−1) in the morning on 17 July, at the time of the reported air turbulence by firefighting aircraft. Wind speed slightly eased at times during the midday on 17 July and intensified again right at the time of a downslope run towards the city of Split (the SPLIT 3 period). Wind direction remained persistent as NE bura wind, which can also be seen by the direction of the fire smoke, which was perpendicular to the coast and traveled across the Adriatic Sea towards Italy (Figs. 1b and 4a). The smoke also caused a drop in the total solar radiation at the Split-Marjan station (not shown). Wind dropped in speed and changed direction to SW in the morning on 18 July, which helped firefighters to control the fire spread. Light rain on 24 July (1.2 mm) and 25 July (1.6 mm), also the most significant rainfall in 2 months, additionally helped to finally extinguish the wildfire.
The dynamical adaptation of the ALADIN model at 2 km horizontal resolution gave a more detailed spatial structure of near-surface winds in the area. Model data reveal that during the SPLIT 1 period, bura wind in the coastal outback, where the wildfire was burning at the time (foothill of C; Fig. 2), had a speed between 5.5 and 8.0 m s−1, with gusts between 13.9 and 24.5 m s−1 (Fig. 10). Bura retained this strength by 05:00 UTC on 17 July, when the aircraft tried to approach the fire site (Fig. 11a). At the same time the wind dropped in speed away from the coast. The area of a low wind offshore and perpendicular to the mountain range during bura flow is known as wake (Grubišić, 2004). This low-wind zone corresponds to the successful aircraft operation at another wildfire site on the island 35 km south, which burned simultaneously with the Split wildfire. It is worth mentioning that the Croatian firefighting aviation is one of the rare operations which descend to 20 m or even 10 m height (Željko Žugaj, personal communication, 2022).
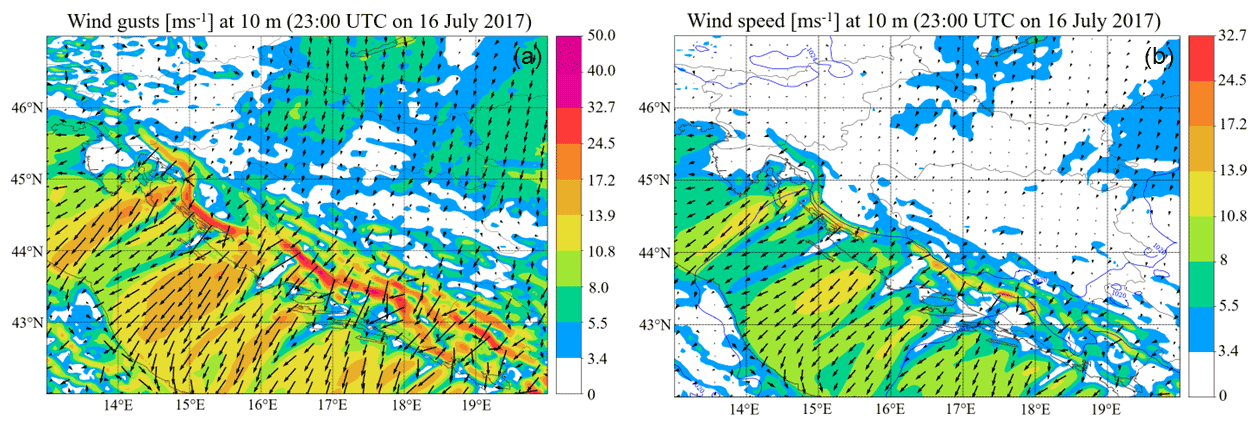
Figure 10(a) Wind gusts (m s−1; vector and colored contour) at 10 m. (b) Winds (m s−1; vector and colored contour) at 10 m and MSLP (mean sea level pressure; blue contours), both valid for 23:00 UTC on 16 July 2017 from the ALADIN-HR44 model.
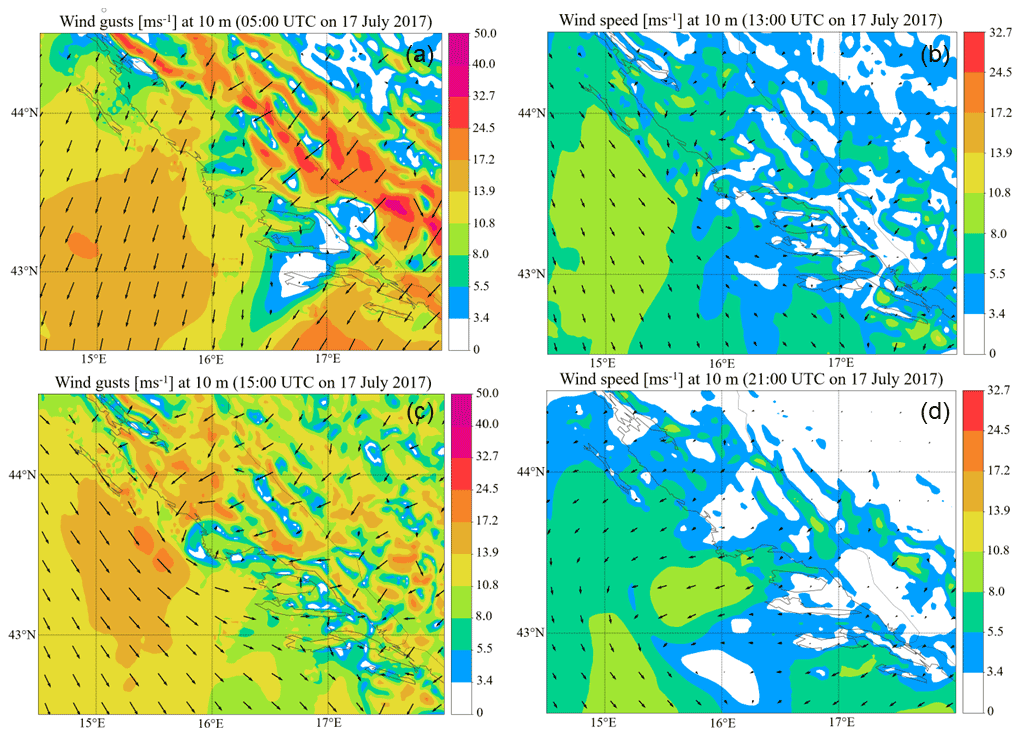
Figure 11(a) Wind gusts (m s−1; vector and colored contour) at 05:00 UTC, (b) winds (m s−1; vector and colored contour) at 13:00 UTC, (c) wind gusts (m s−1; colored and array) at 15:00 UTC, and (d) wind speed (m s−1; colored and array) at 21:00 UTC, all valid for 17 July 2017 at 10 m from the ALADIN-HRDA model.
During the SPLIT 2 period, bura retained strength in the area closest to Mosor; however, narrow bands of weak wind started to appear over the continental area in the NE section of the domain (Fig. 11b). One such band of weak wind was located over the Split peninsula, Perun hill (A, Fig. 2), and the outback valley, where wildfire reactivated and started its reverse spread. Weaker wind speed along the hill A also contributed to a successful aircraft operation on its southern side. During the SPLIT 2 period, wind was westerly along the southern foothill of A and northeasterly along the hill C (Fig. 2).
At the time of the SPLIT 3 downslope fire run, bura wind over the landward part of the city's peninsula, at the location of the NW flank of the wildfire (Fig. 2), remained strong, with speeds between 5.5 and 10.8 m s−1 and gusts between 10.8 and 24.5 m s−1 according to the model (Fig. 11c). The speed of bura and its gusts persisted during the most critical hours of fire burning within the city, after which it eased down to between 3.4 and 8.0 m s−1, with gusts between 8.0 and 13.9 m s−1 until the evening on 17 July (end of SPLIT 3 period; Fig. 11d).
Although weakening in the broader Split area and in contrast to the previous 48 h, the bura wind continued into the late evening and during the SPLIT 4 period, preserving its aforementioned wind speed and gusts until morning on 18 July, after which it further weakened, and wind turned westerly.
4.6 Hydraulic jump and dry air subsidence
Vertical cross-sections reveal a hydraulic-jump-like structure over the coastal mountain slopes at the time of the wildfire's ignition (Fig. 12a and c). The bura flow was strongest between 600 m and 1700 m above ground level, immediately upstream of the wildfire's location, with a maximum horizontal wind speed close to 30 m s−1. Above this strong bura flow was a layer of weak NE wind at an altitude between 2300 and 4300 m. This deep layer of weak wind on top of the wind maximum in the lee of the coastal range indicates a possible wave breaking below, which is the mechanism of a hydraulic-like flow. The presence of the hydraulic jump was also suggested by the positive vertical wind component at the downstream end of the hydraulic jump, with a maximum value of +2 m s−1 at this side (in combination with −2.5 m s−1 within the downstream flow; Fig. 12b). Hydraulic jump flow culminated right at the time of the ignition, after which it dissipated by the end of the SPLIT 1 period.
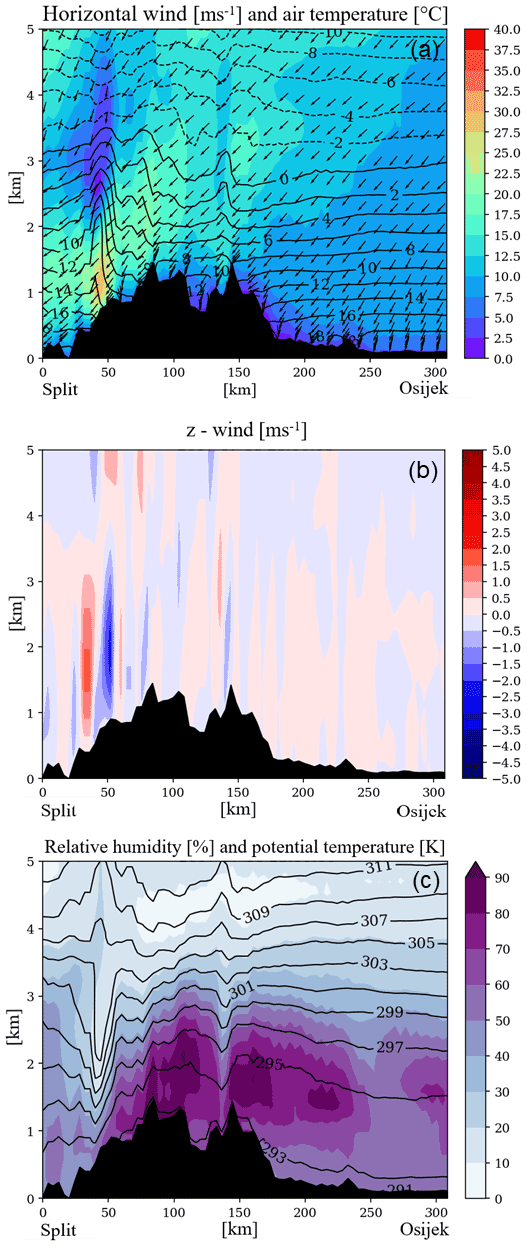
Figure 12Vertical cross-sections from the ALADIN-HR44 model of (a) horizontal wind speed (m s−1; colored) and direction (vector) and temperature (∘C; black contours for ≥ 0 ∘C, dashed contours for < 0 ∘C), (b) z wind (m s−1; colored), and (c) relative humidity ( %; colored) and potential temperature (K; black contours every 2 K), all valid for 23:00 UTC on 16 July 2017 from the ALADIN model. The bottom black area depicts the terrain. The location of the cross-section between the cities of Split and Osijek is indicated in Fig. 1a. Each section is 300 km long and 5 km high, oriented northeast to southwest and perpendicular to the Adriatic coast, with Split situated approximately 20 km from the bottom left corner. Airflow in each panel is from right to left.
The acceleration of the bura flow within the 1 km height throughout the day on 16 July is also apparent from the potential temperature in the same cross-section line (Fig. 12c). While the potential temperature field did not change significantly on the windward side of the bura flow, indicating the statically stable lower atmosphere during the observed period, on the left side of the panel, or above the Dinarides and Split area, isentropes deformed during the day of the wildfire, suggesting a decrease in stability here. By 23:00 UTC on 16 July (ignition time) isentropes became densely packed, with a steep downward, nearly vertical slope right above the mountain crest in the vicinity of the wildfire and jump-like recovery downwind, also indicating a hydraulic jump. Deformation of isentropes occupied a deep layer from 800 to 3500 m height. Together with the accompanied hydraulic jump, this dense packing of isentropes signals the existence of the orographic gravity-wave breaking, known to generate strong bura flows (Gohm and Mayr, 2005). The sharp potential temperature gradient shows the gravity wave right above the leeward side of the Dinarides (Fig. 12c). Peak gravity-wave activity occurred at the ignition time, after which it weakened until the following morning (end of SPLIT 1). A descending slope of isentropes above coastal mountains at the ignition time, when the gravity wave was the most amplified, clearly indicates the strong flow acceleration and formation of the jet in the lee of the mountains.
The appearance of a sharper potential temperature gradient was accompanied by a significant drop in relative humidity. The cross-section of relative humidity reveals that the most prominent dry air descent occurred right at the ignition time (Fig. 12c). A tongue of low relative humidity (< 30 %) extended downward to 1300 m height, coinciding with the most intense sloping of isentropes. Moving forward in time, the model indicated a relative humidity drop for the entire vertical column above the wildfire area, which from early afternoon on 17 July had relative humidity under 30 %. This low relative humidity persisted during the overnight hours between 17 and 18 July (SPLIT 3 and SPLIT 4 periods) in the first 1000 m height and decreased further to under 10 % at 3500 m height above the wildfire. This dry air subsidence is in agreement with the upper-level analysis, which also suggested a possible dry air subsidence due to the position of the upper-level cyclone in relation to the wildfire.
4.7 Low-level jet
Bura flow meets the characteristics of LLJs (defined in Sect. 3.4). Mechanisms recognized to cause LLJs include synoptic pressure gradients, cold front passage, mountain waves, cyclogenesis in mid-latitudes, and upper-level jet streak dynamics (Uccellini, 1980; Jurčec, 1992). Pseudotemps or vertical profiles from the ALADIN model permit analysis of the temporal evolution of LLJs during the bura flow since radiosonde measurements at the closest station (Zadar airport) were not obtained during the study period. A sequence of vertical profiles was simulated for locations closest to wildfire at key times – in the village of Srinjine in the coastal hinterland (relevant for periods SPLIT 1 and SPLIT 2) and the Split-Marjan station (relevant for periods SPLIT 3 and SPLIT 4; Fig. 13).

Figure 13Vertical profiles of wind speed (m s−1) at Srinjine and Split-Marjan locations for the periods (a) SPLIT 1 (from 22:00 UTC on 16 July 2017 to 09:00 UTC on 17 July 2017), (b) SPLIT 2 (from 10:00 to 14:00 UTC on 17 July 2017), (c) SPLIT 3 (from 15:00 to 21:00 UTC on 17 July 2017), and (d) SPLIT 4 (from 22:00 UTC on 17 July 2017 to 04:00 UTC on 18 July 2017) from the ALADIN model. See Fig. 2 for location of Split-Marjan and Srinjine (noted as S).
The vertical wind profiles reveal the existence of a strong LLJ with a peak wind maximum above the wildfire's location 2.5 h before the ignition (19.1 m s−1, LLJ criterion 2). During the first few hours of the wildfire, the LLJ eased to criterion 1 and maintained this strength until the end of the SPLIT 1 period (Fig. 13a) and throughout the SPLIT 2 period (Fig. 13b). At 12:00 UTC on 17 July the LLJ speed was 13.0 m s−1 between 786 m and 891 m height. As hill C has 723 m elevation, this corresponds to the plume direction at the top of this hill (upper right corner in Fig. 3b). The LLJ was not found in this area after the SPLIT 2 period.
In general, LLJ appearance and temporal evolution in the rough topography of Mosor and the one from the coastal location of Split followed the same pattern throughout the study period. However, at the location of Srinjine, the LLJ was slightly weaker, with a more highly positioned maximum. This discrepancy in height of a LLJ core between a coastal and outback location is in agreement with previous studies on bura flow that found the center of the maximum flow higher in the outback and lower along the coast (Lepri et al., 2015). At all times at both locations, whether during the mature stage of the LLJ or in its complete absence during the periods SPLIT 3 and SPLIT 4 (Fig. 13c and d), wind was persistently NE up to 3000 m height.
The vertical profile up to 10 km revealed that the upper jet stream had a peak strength immediately prior to ignition (57.3 m s−1) and during the SPLIT 1 period (Fig. 14a, b). At all times during the study period, wind direction throughout the troposphere was north to northeast (with some exceptions in the first 1000 m height during the SPLIT 3 and SPLIT 4 periods), illustrating that this was a deep bura event (Gohm and Mayr, 2005).
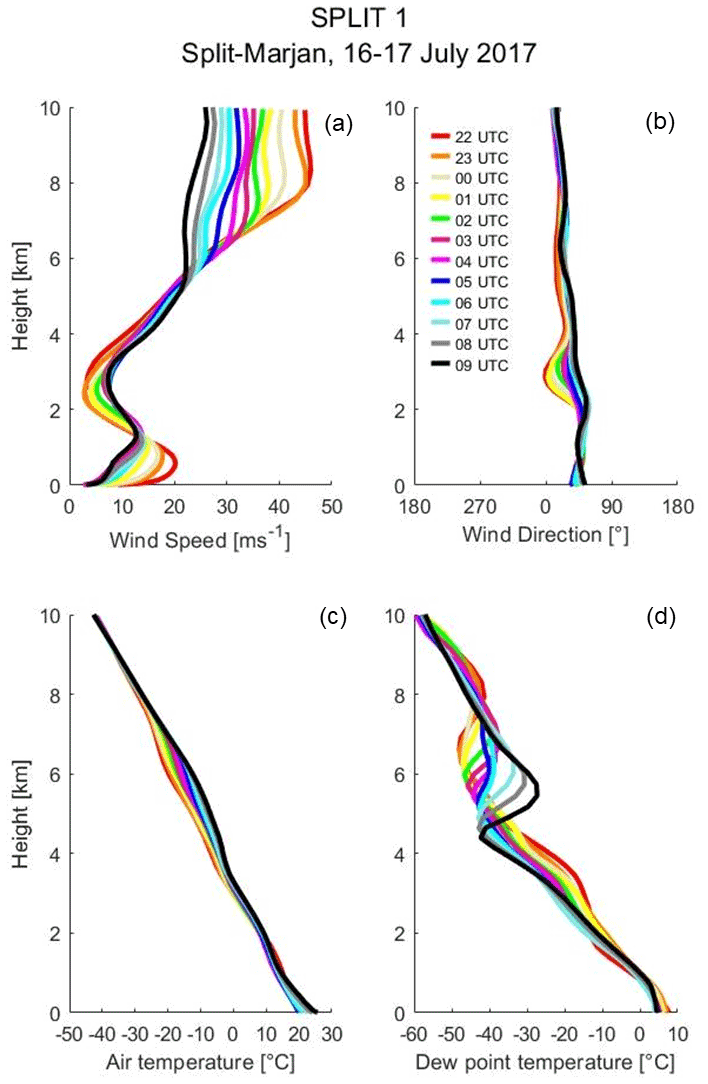
Figure 14Vertical profiles of (a) wind speed (m s−1), (b) wind direction (∘), (c) air temperature (∘C), and (d) dew point temperature (∘C) at Split-Marjan locations for the period SPLIT 1 (from 22:00 UTC on 16 July 2017 to 09:00 UTC on 17 July 2017) from the ALADIN model. See Fig. 2 for location of Split-Marjan.
Vertical profiles of air temperature (Fig. 14c) reveal the absence of the inversion in both the lower and upper troposphere. The lower troposphere lacked the inversion at all times significant to strong bura flow, even during the hydraulic jump appearance. Vertical profiles of both air and dew point temperature (Fig. 14c, d) reveal their considerably different values for the entire study period, which indicates very dry conditions. Dry conditions might be explained by the complete absence of the tropopause, which potentially led to larger vertical motion and dry air subsidence from the upper levels of the troposphere. Dry upper-tropospheric air advection to the mid and lower troposphere was generated by the jet stream dynamics situated above the study region. Vertical cross-sections revealed that the dry air started to persistently dominate the fire ground after the SPLIT 1 period until the end of the study period. The presence of a ribbon of dry air (Fig. 7b) with large potential vorticity (Fig. 6c) suggests the translation and descent of a tropopause fold into the study area.
Previous studies suggested that LLJs are a weather phenomenon of considerable spatial extent (e.g., Vučetić, 1988; Gohm and Mayr, 2005); however, this conclusion was drawn from simulated vertical profiles at various locations. This is the first study to present the spatial distribution of a LLJ in Croatia or, according to the authors' knowledge, elsewhere.
The spatial extent of the LLJ reveals that the strongest jet defined as criterion 3 occurred over the highest coastal mountains, extending from the northwest to southeast, with parts of the flow stretching more than 100 km over the Adriatic Sea accompanied by wakes in between. This spatial distribution of the strongest flow and wakes between the jet wind region over the Adriatic confirms the expected flow pattern formed by topographic incisions along the coast. The greatest extent of the LLJ defined by criterion 3 appeared 23 h prior to the wildfire (Fig. 15a), after which it slightly reduced its strength and coverage during midday on 16 July before it intensified again over the entire coast in the late afternoon hours, culminating 2.5 h before the ignition. The location of the wildfire during the SPLIT 1 period was situated in the wake-like region of the much stronger flow in the outback, where the LLJ defined as criterion 3 coincided with the location of the hydraulic jump that appeared in vertical cross-sections. The LLJ at the wildfire's location during the morning on 17 July (end of SPLIT 1 period) was classified as criterion 1 and 2 and stretched over the valley between hills A and C, right at the time of the reported turbulence by firefighting aircraft. During the SPLIT 2 period the LLJ flow within the valley was classified by criterion 0, after which it completely disappears from the area. Although the LLJ appeared at the southeastern and northwestern edge of the wildfire during the SPLIT 3 period, it gradually disappeared over the entire Adriatic region by the end of the study period or SPLIT 4.

Figure 15Spatial distribution of a low-level jet defined by criterion 0 to 3 (m s−1) at (a) 00:00 UTC on 16 July 2017, (b) 23:00 UTC on 16 July 2017 (SPLIT 1 period – ignition time), (c) 07:00 UTC on 17 July 2017 (SPLIT 1 period – aircraft approach), and (d) 13:00 UTC on 17 July 2017 (SPLIT 2 period) from the ALADIN-HR44 model.
5.1 Summary
The Split wildfire in July 2017 was one of the most severe wildfires in Croatian history given the size; unexpected fire behavior; and rapid spread, which included two downslope runs into the densely populated area of the second-largest city in the peak of the tourist season. This study sets to answer several questions on meteorological conditions preceding this wildfire event as well as those related to the rapid fire spread in the first 30 h of ignition, noted as fire propagation periods SPLIT 1 to SPLIT 4, within which most of the total 5122 ha burnt.
In the months leading up to the Split wildfire a prolonged period of extremely warm and dry conditions caused continuous drying of fuels in the area and an increase in the fire danger, which culminated exactly on the day of the ignition. The annual maximum of FWI on 16 July 2017 at the Split-Marjan station highlights the state of fuels as very dry and flammable with the possibility for rapid fire spread, multiple fire fronts, and crown fire, all of which occurred during periods SPLIT 1 to SPLIT 4. These fire weather conditions mirror the state across the rest of the Mediterranean region affected by abnormal drought and heat waves during the particularly severe and record-breaking fire season of 2017 (e.g., Turco et al., 2019; Sanchez-Benítez et al., 2018).
The sequence of severe antecedent meteorological conditions, combined with the specific synoptic situation that occurred prior to the ignition, contributed to the acute fire weather in the Split area. The favorable fire weather synoptic pattern in this case included (1) a strong surface pressure gradient caused by the presence of an Azores anticyclone stretching towards central Europe and a low-pressure area over the southeastern Balkans and (2) a large-amplitude and shortwave upper-level trough extending from the Baltic Sea to the Ionian Sea, with the accompanying upper-level cut-off cyclone over the SE Balkans. The synchronization of the low-surface-pressure area with the upper-tropospheric trough produced a deep northeasterly bura flow over the Adriatic Sea. Deep bura flow, in contrast to shallow bura, extends throughout the troposphere and is typical for colder months (Grisogono and Belušić, 2009). As previously mentioned, bura is a gusty downslope windstorm that blows from the NE quadrant perpendicular to the Adriatic coast and the adjacent Dinarides. The general criterion for severe bura is mean hourly wind speed greater than 17 m s−1 for at least 1 h (Vučetić, 1991). A severe bura downslope windstorm prevents road traffic between inland and coastal parts of Croatia and poses a great danger to aircraft. In this case, bura coincided with the wildfire ignition and strongly contributed to it becoming a large conflagration. Although bura in this case was weaker (with mean wind speed up to 10.5 m s−1 and gusts up to 19.9 m s−1 at the Split-Marjan station) and does not fulfill the criteria for severe bura, it occurred during summer, when such episodes are rare. Bura dominated the fire ground during each of the most significant wildfire progression periods from SPLIT 1 to SPLIT 4.
Based on the nexus of meteorological and fuel conditions in combination with complex topography, the most significant fire progressions during the Split wildfire from July 2017 can be explained as follows:
-
Both synoptic and upper-level conditions that coincided with the wildfire ignition are recognized to be factors that can contribute to very dangerous fire weather conditions. A strong surface pressure gradient with a source of dry air from the upper atmosphere that was transported to the surface by the hydraulic bura flow led to rapid fire growth immediately following ignition. In the first few hours of the nighttime SPLIT 1 period, strong NE bura pushed the fire downhill on south-facing slopes of hill C (Fig. 2), into the valley, where the fire was eventually stopped by firefighters. Wildfire also burned upslope on hill C for two reasons. The first is due to buoyancy effects on flames and smoke between bura gusts, and the second is potentially due to eddies and rotors in the lee, under the accelerated LLJ stream embedded in the bura flow (Gohm et al., 2008). This is, however, yet to be confirmed by numerical simulations of higher resolution.
-
The complexity of the flow at the wildfire's location was especially pronounced during the SPLIT 2 period (Fig. 3b). The sudden fire reactivation and its run downhill of C (Fig. 3a) surprised firefighter crews, who had to redefend settlements in the valley that had been considered safe from the fire burning at higher altitude. Why the fire front could return into the valley and burn upslope on hills B, and afterwards A, may again be explained by the vertical wind profile, which revealed lowering of both LLJ speed and height. By lowering its height, the core of the LLJ now coincided with the top of the hill C, where the wildfire was burning. As wind dropped in speed it may have resulted in more laminar and attached flow over the terrain, which therefore pushed the fire again downslope of hill C, with flying embers creating a mosaic fire in the valley. The LLJ weakening is related to daytime bura weakening, typical for a bura episode in its decaying stage (Gohm and Mayr, 2005), as was the case during the SPLIT 2 period.
-
The total fire escalation around all zones occurred during relatively benign fire weather conditions. Bura weakened by the beginning of the SPLIT 3 period (Fig. 11c), and the firefighting aircraft could join the intervention. However, the location of the wildfire at the time together with local atmospheric conditions likely to be crucial for the rapid downslope fire run into the city area. By the beginning of the SPLIT 3 period, the NW flank of the wildfire (Fig. 2) burned into abundant dry fuels on the city edge on the slopes of Mosor. Covered by dense pine forest and long unburnt fuels, this elevated terrain was aligned with the bura flow. The NE bura was still moderate to strong in this elevated area, contributing to a channeling effect and pushing the fire down the SW-oriented slopes, towards Split. Such dynamic fire channeling is considered impossible to control due to high fire spread rate and intensity (Sharples, 2009), as was the case in this event. Furthermore, the rugged terrain with favorable fire weather and plenty of dry fuel available caused fire whirls and spotting. Dynamic channeling can also trigger evolution of pyro-cumulonimbus, and although not confirmed in this case, a large plume generated by the fire during the SPLIT 3 period signaled highly active fire behavior. The extensive NE plume (Fig. 1a) was sheared off sharply at approximately 4500 m altitude (Fig. 4a), consistent with the strong NE wind at this height found in vertical profiles.
Simultaneously, mosaic fire that was still flanking in the more highly elevated valley between hills A and C on the eastern side of the wildfire (Fig. 2) merged into a single fire front. Intensification of the wildfire on this side was most likely caused by burning into heavier fuels and turbulent effects associated with the LLJ that persisted in the surrounding mountainous area.
-
Another downslope fire run during the nighttime SPLIT 4 period can be explained by moderate bura in the area (Fig. 11d), which pushed the wildfire over the top of hill A towards its southern side (Fig. 2). Its downslope run was therefore amplified by bura and additionally favored by nighttime reduction in relative humidity, most likely caused by dry upper-tropospheric air drawn down to the surface by the daytime mixed layer during the previous fire progression period SPLIT 3. Furthermore, on its downslope path the fire burned into downy oak forest, resulting in significant fire escalation before it reached the urban area in the foothill of A in a matter of minutes (Fig. 4c and d). Again, such fire behavior is extremely dangerous for fire fighters, communities, and assets in the path of such a rapidly advancing downslope fire.
5.2 Further discussion on the dynamics of bura and LLJs
In general, bura flow over the Adriatic can be described by dynamic processes presented in hydraulic theory (Long, 1953) where orographic wave breaking plays a key role for strong surface downslope windstorm occurrence (e.g., Smith, 1985; Vučetić, 1993). The theory includes acceleration of the flow upslope as well as an abrupt acceleration of the flow downslope in the lee with a hydraulic jump gradually restoring subcritical conditions (Cesini et al., 2004). Hydraulic jump is a frequent feature of strong bura flow over the Adriatic (e.g., Grisogono and Belušić, 2009). Although there are numerous studies investigating the bora in the Adriatic (especially in the northern part during the cold part of the year; e.g., Horvath et al., 2009; Grubišić, 2004; Šoljan et al., 2018), in this study, the Split wildfire case study presents an opportunity to analyze a summertime moderate bura case over the mid-Adriatic and to go a step further to relate it to the reconstructed wildfire behavior.
The only study on deep bura flow in the mid-Adriatic region in wintertime suggests that hydraulic theory can be applied here if an upstream bura layer is sufficiently deep (i.e., 5 km in contrast to the usual bura depth of between 2 and 3 km; Jurčec and Visković, 1989). Vertical wind profiles up to 10 km in the case of the Split wildfire showed that NE wind extended throughout the troposphere (Fig. 14). Similar to the aforementioned winter deep bura case study, the Split event lacked temperature inversion, which is usually assumed to exist above the bura layer and according to which it is possible to determine the top of the disturbed flow. In the case of the Split wildfire, the temperature inversion or critical layer was not simulated with the ALADIN model. However, mesoscale models are known to underestimate inversions or stable layers, and, when compared to radiosonde measurements, the ALADIN model was found to underestimate the inversion layer in previous wildfire analyses (Vučetić et al., 2007).
Hydraulic flow is found to coincide with the Split wildfire ignition. It is marked by wave breaking aloft, an abrupt tilt of streamlines, accelerated wind on the leeward slopes, and strong turbulence immediately above (Sharples, 2009; Whiteman, 2000; Smith, 1985; Jurčec and Visković, 1989). This type of flow is found in the most destructive wildfire in California history, the 2018 Camp Fire, where hydraulic jump structures were linked to erratic surface winds, causing the lifting of firebrands during the wildfire (Brewer and Clements, 2020). Similar hydraulic flow indicated a downward transport of energy and momentum during the deadly 2018 wildfire in the Attica region in Greece (Kartsios et al., 2020).
LLJs are of interest here not only as a phenomenon itself, but because of their effect on wildfire behavior and aircraft operations. Previous studies suggest that LLJs are associated with turbulent kinetic energy that can be mixed down to the fire ground and cause rapid fire growth (Charney et al., 2003). Early US research (Byram, 1954) described vertical profiles similar to those found in this case as the most dangerous for fire weather, especially in the mountainous area. The reason for that lies in the intersection of the LLJ core and the elevated forested terrain, which in the case of a fire ignition can lead to blow-up fire behavior. Also, the fire behavior characteristics described for this type of wind profile include possible appearance of fire whirlwinds, which were observed during the SPLIT 3 period.
LLJs have been found to coincide with all wildfires larger than 500 ha along the Adriatic coast in the period 2001–2011 (Tomašević, 2012; Mifka and Vučetić, 2012). However, it is important to note that although in the majority of those cases LLJs appeared in bura-driven wildfires, LLJs have also been generated in different types of synoptic forcing (e.g., Mifka and Vučetić, 2012).
Rapid intensification of wildfires associated with a LLJ is reported in the international literature as well. A LLJ generated in the upper-level frontal zone contributed to the turbulent downward mixing of high momentum into the Mack Lake wildfire in 1980 in the Great Lakes region, USA, and most likely caused the rapid fire spread reported in that event (Zimet et al., 2007; Charney et al., 2003). The fastest fire growth in a single day was recorded in the Rocky Mountains Canyon Creek fire after a LLJ became the dominant atmospheric feature in the area (Sharples, 2009). The “blow-up” fire day with unusually severe fire weather during the catastrophic fires of Ash Wednesday in 1983 in southeastern Australia included a deep tropospheric trough whose prefrontal winds were accompanied by a LLJ (Mills, 2005a).
5.3 Concluding remarks
The following is a short summary of the unique drivers of the Split fire:
-
Climatically, there was a prolonged period of extremely warm and dry conditions at the Adriatic Coast, leading to drying of fuels.
-
The FWI reached its annual maximum just before the wildfire, and the ISI also reached its seasonal maximum.
-
Synoptically, there was the synchronization of a strong surface pressure gradient (the Azores anticyclone) and an upper-level cut-off low. Such a synoptic pattern led to very strong northeasterly bura flow toward the Adriatic Sea.
-
Due to the topography at the Adriatic coast, the bura flow underwent downslope gravity-wave breaking and changes in speed (hydraulic jump theory), which was favorable for further dry air subsidence at the coast.
-
The variability in the strength of the bura flow led to the downslope and upslope spread of fire in the four stages of the event described in Sect. 5.1.
Another significant finding from the Split wildfire, documented in association with severe fire weather conditions found in other catastrophic wildfires, is the influence of dry air subsidence. Descent of dry air occurred in conjunction with upper-level trough and jet stream dynamics above the study area. The subsidence process started 24 h prior to the wildfire, with the dry air descending sharply towards the wildfire right at the ignition time (SPLIT 1 period). This dry air descent was enhanced by the topographically induced hydraulic bura flow on the downstream side of the Dinarides. The dry air was further transported towards the already-fast-growing wildfire with the deepening of the daytime mixed layer on 17 July 2017 (SPLIT 2 and SPLIT 3). These processes resulted in significant reduction in relative humidity during the downslope fire runs during the SPLIT 3 and SPLIT 4 periods.
Analysis of the Split wildfire leads to better understanding of bura-driven wildfires within the complex topography of the mid-Adriatic region in Croatia and, moreover, towards application of LLJ spatial and temporal distribution in the future. It has been confirmed that LLJs are related to the most destructive wildfires in the area. Therefore, the information on LLJs provided from the ALADIN model has the potential to improve fire weather forecasts. As LLJ spatial distribution is available in the 72 h forecast range, it is possible to detect these phenomena days in advance. However, prerequisites such as long-term dry and warm weather conditions and, consequently, high FWI are necessary. LLJs, as an operational model product, can identify locations where weather conditions are favorable for erratic fire behavior, especially if they coincide with other synoptic features such as dry air subsidence and, additionally, with a range of extreme mesoscale mechanisms enabling the downward mixing of dry air to the fire ground.
Some previous studies proposed development of a new generation of fire weather indices that would highlight areas of LLJ intersection with a deep daytime mixing layer (e.g., Charney et al., 2003; Mills, 2005a). This kind of index can be designed for the Croatian region in the future. An operational model-based LLJ product such as that presented here could provide a pathway in that direction and, meanwhile, serve as complementary information to FWI risk estimation and forecasting. However, in-depth hindcast verification should be conducted beforehand, i.e., to estimate high FWI and LLJ appearance and predict subsequent wildfires' potential. Temporal evolution of LLJs can, among other data, assist in prediction of fire behavior in ongoing wildfires. All meteorological indicators found in this case study are likely to significantly contribute to better understanding and estimation of fire risk than those derived only from fire danger indices.
Only an operational numerical weather prediction (NWP) model with limited outputs has been utilized here. An additional set of NWP model simulations at finer resolution for this wildfire case will be conducted to investigate the smaller-scale bura flow features and LLJ impacts on the Split wildfire characteristics in more detail. In recent decades extreme wildfires around the world have demonstrated their destructive power, even creating their own weather and producing dangerous phenomena such as fire whirls, tornadoes, or fire storms generated from pyroconvection (Tory et al., 2018; Tory and Kepert, 2021) generally. As the Split wildfire also demonstrated unprecedented fire behavior, it is very likely that the energy released from the wildfire influenced the meteorology and surrounding atmosphere (e.g., Peace et al., 2015). To investigate this matter, it is in addition planned to prepare coupled fire–atmosphere simulations for this case study.
The systematic analysis of extreme wildfire events, such as the Split wildfire here, is also useful to derive a series of recommendations or lessons learned to support fuel reduction practices, increase awareness of potential extreme events, and prevent their occurrence in the Mediterranean region and other similar areas globally. The results are expected to contribute to better prediction of fire activity by fire management agencies, resulting in improved planning processes and capability, including estimation of future fire regimes and exposure as a key adaptation element.
Code used in this study can be obtained from the corresponding author upon request.
The data applied in this study, including the observations and model outputs, can be obtained from the corresponding author upon request.
ICT, KKWC, and VV conceptualized the study. KKWC, VV, PFH, MTP, PJB, and BM supervised the study. ICT, KH, and VM performed data analysis, numerical modeling, and visualization. ICT drafted the paper. ICT, KKWC, VV, PFH, KH, MTP, PJB, BM, and VM reviewed and edited the paper. KKWC, PFH, and PJB made English language edits.
The contact author has declared that none of the authors has any competing interests.
Publisher's note: Copernicus Publications remains neutral with regard to jurisdictional claims in published maps and institutional affiliations.
The first author (ICT) is supported by the Macquarie University Cotutelle Scholarship per the Cotutelle Agreement between Croatia and Australia. The authors would like to thank the comments from Andrew Dowdy and Dragana Rajak (Bureau of Meteorology, Australia) on this work. Special thanks to the Split Firefighting Brigade for kindly providing radio logs and final burnt area isochrones and sharing valuable information on fire behavior. We thank the handling editor and the anonymous reviewers for their inputs to this paper.
This paper was edited by Maria-Carmen Llasat and reviewed by two anonymous referees.
Abatzoglou, J. T., Hatchett, B. J., Fox-Hughes, P., Gershunov, A., and Nauslar, N. J.: Global climatology of synoptically-forced downslope winds, Int. J. Climatol., 41, 1–20, https://doi.org/10.1002/joc.6607, 2020.
ALADIN International Team: The ALADIN project: Mesoscale modelling seen as a basic tool for weather forecasting and atmospheric research, WMO Bull., 46, 317–324, 1997.
Beals, A.: The value of weather forecasts in the problem of protecting forests from fire, Mon. Weather Rev., 42, 111–119, https://doi.org/10.1175/1520-0493(1914)42<111:TVOWFI>2.0.CO;2, 1914.
Belušić, A., Telišman Prtenjak, M., Güttler, I., Ban, N., Leutwyler, D., and Schär, C.: Near-surface wind variability over the broader Adriatic region: insights from an ensemble of regional climate models, Clim. Dynam., 50, 4455–4480, https://doi.org/10.1007/s00382-017-3885-5, 2018.
Bento-Gançalves, A. and Vieira, A.: Wildfires in the wildland-urban interface: Key concepts and evaluation methodologies, Sci. Total Environ., 707, 135592, https://doi.org/10.1016/j.scitotenv.2019.135592, 2019.
Bond, H. G., Mackinnon, K., and Noar, P. F.: Report on the meteorological aspects of the catastrophic bushfires in south-eastern Tasmania on 7 February 1967, Bureau of Meteorology, Regional Office, Tasmania, 2544446, 1967.
Bonner, W. D.: Climatology of the low level jet, Mon. Weather Rev., 96, 833–850, https://doi.org/10.1175/1520-0493(1968)096<0833:COTLLJ>2.0.CO;2, 1968.
Brewer, M. J. and Clements, C. B.: The 2018 Camp Fire: Meteorological analysis using in situ observations and numerical simulations, Atmosphere, 11, 47, https://doi.org/10.3390/atmos11010047, 2020.
Brotak, A. E.: A synoptic study of the meteorological conditions associated with major wildland fires, PhD Thesis, Faculty of the Graduate School, Yale University, 1977.
Brotak, A. E. and Reifsnyder, W. E.: An investigation of the synoptic situations associated with major wildland fires, Fire Manag. Today, 38, 867–870, https://doi.org/10.1175/1520-0450(1977)016<0867:AIOTSS>2.0.CO;2, 1977.
Brown, T., Leach, S., Wachter, W., and Gardunio, B.: The Northern California 2018 extreme fire season, B. Am. Meteorol. Soc., 101, S1–S4, https://doi.org/10.1175/BAMS-D-19-0275.1, 2020.
Bureau of Meteorology (BoM): Meteorological aspects of the 7 February 2009 Victorian fires, an overview, Bureau of Meteorology report for the 2009 Victorian Bushfires Royal Commission, Melbourne, Australia, 2009.
Byram, G. M.: Atmospheric conditions related to blowup fires, Station Paper SE-SP-35, USDA-Forest Service, Southeastern Forest Experiment Station, Asheville, 1954.
Cesini, D., Morelli, S., and Parmiggiani, F.: Analysis of an intense bora event in the Adriatic area, Nat. Hazards Earth Syst. Sci., 4, 323–337, https://doi.org/10.5194/nhess-4-323-2004, 2004.
Charney, J. J., Bian, X., Potter, B., and Heilman, W. E.: The role of a stratospheric intrusion in the evolution of the Double Trouble State Park wildfire, in: 5th Symposium on fire and forest meteorology joint with 2nd International wildland fire ecology and fire management congress, Orlando, P5.3, 16–20 November 2003.
Conedera, M., Marxer P., Hoffmann, C., Tinner, W., and Amman, B.: Forest fire research in Switzerland. Part 1: Fire ecology and history research in the Southern part of Switzerland, Int. For. Fire News, 15, 13–21, 1996.
Cruz, M. G., Sullivan, A. L., Gould, J. S., Sims, N. C., Bannister, A. J., Hollis, J. J., and Hurley, R. J.: Anatomy of a catastrophic wildfire: The Black Saturday Kilmore East fire in Victoria, Australia, Forest Ecol. Manag., 284, 269–285, https://doi.org/10.1016/j.foreco.2012.02.035, 2012.
Dimitrov, T.: Forest fires and forest fire danger assessment, in: Osnovne zaštite šuma od požara, edited by: Bertović, S., Centar za informacije i publicitet, Zagreb, 181–256, ISBN 86-7125-016-4, 1982 (in Croatian).
Dowdy, A. J., Fromm, M. D., and McCarthy N.: Pyrocumulonimbus and fire ignition on Black Saturday in southeast Australia, J. Geophys. Res.-Atmos., 122, 7342–7354, https://doi.org/10.1002/2017JD026577, 2017.
DUZS: Report on the realization of the program of activities in the implementation of special measures of protection from forest fires in Republic of Croatia in 2017, National protection and rescue directorate, Zagreb, 2018 (in Croatian).
Engel, C. B., Lane, T. P., Reeder, M. J., and Rezny, M.: The meteorology of Black Saturday, Q. J. Roy. Meteor. Soc., 139, 585–599, https://doi.org/10.1002/qj.1986, 2013.
Francetić, N.: We can learn from the Split wildfire, Vatrogasni vjesnik, 8, 14–17, 2017 (in Croatian).
Fromm, M., Tupper, A., Rosenfeld, D., Servranckx, R., and McRae, R.: Violent pyro-convective storm devastates Australia's capital and pollutes the stratosphere, Geophys. Res. Lett., 33, L05815, https://doi.org/10.1029/2005GL025161, 2006.
Gohm, A. and Mayr, G. J.: Numerical and observational case-study of a deep Adriatic bora, Q. J. Roy. Meteor. Soc., 131, 1363–1392, https://doi.org/10.1256/qj.04.82, 2005.
Gohm, A., Mayr, G. J., Fix, A., and Giez, A.: On the onset of bora and the formation of rotors and jumps near a mountain gap, Q. J. Roy. Meteor. Soc., 134, 21–46, https://doi.org/10.1002/qj.206, 2008.
Grisogono, B. and Belušić, D.: A review of recent advances in understanding the meso- and micro-scale properties of the severe Bora wind, Tellus A, 61, 1–16, https://doi.org/10.1111/j.1600-0870.2008.00369.x, 2009.
Grubišić, V.: Bora-driven potential vorticity banners over the Adriatic, Q. J. Roy. Meteor. Soc., 130, 2571–2603, https://doi.org/10.1256/qj.03.71, 2004.
Hernandez, C., Drobinski, P., and Turquety, S.: How much does weather control fire size and intensity in the Mediterranean region?, Ann. Geophys., 33, 931–939, https://doi.org/10.5194/angeo-33-931-2015, 2015.
Horvath, K., Ivatek-Šahdan, S., Ivančan-Picek, B., and Grubišić, V.: Evolution and Structure of Two Severe Cyclonic Bora Events: Contrast between the Northern and Southern Adriatic, Weather Forecast., 24, 946–964, https://doi.org/10.1175/2009WAF2222174.1, 2009.
Hrastinski, M., Horvath, K., Odak Plenković, I., Ivatek-Šahdan, S., and Bajić A.: Verification of the operational 10 m wind forecast obtained with the ALADIN mesoscale numerical weather prediction model, Croat. Meteorol. J., 50, 105–120, 2015.
Ivančan-Picek, B., Tudor, M., Horvath, K., Stanešić, A., and Ivatek-Šahdan, S.: Overview of the first HyMeX special observation period over Croatia, Nat. Hazards Earth Syst. Sci., 16, 2657–2682, https://doi.org/10.5194/nhess-16-2657-2016, 2016.
Jovanović, N. and Župan, R.: Analysis of vegetation conditions before and after forest fires in Dalmatia using Sentinel-2 satellite images, Geod. List, 71, 233–248, 2017.
Jurčec, V.: Severe Adriatic bora storms in relation to synoptic developments, Rasprave, 24, 11–20, 1989.
Jurčec, V.: Low-level jet stream over the Adriatic area, Vijesti, 1991, 36–41, 1992.
Jurčec, V. and Visković, S.: Causes of bora in Split, Vijesti, 1989, 20–26, 1989.
Kapusta, A. and Wiluś, R.: Geography of Tourism in Croatia, in: The Geography of Tourism of Central and Eastern European Countries, edited by: Widawski, K. and Wyrzykowski, J., Springer, Cham, 109–147, https://doi.org/10.1007/978-3-319-42205-3_4, 2017.
Kartsios, S., Karacostas, T., Pytharoulis, I., and Dimitrakopoulos, A. P.: Numerical investigation of atmosphere-fire interactions during high-impact wildland fire events in Greece, Atmos. Res., 247, 105253, https://doi.org/10.1016/j.atmosres.2020.105253, 2020.
Kondo, J. and Kuwagata, T.: Enhancement of forest fires over northeastern Japan due to atypical strong dry wind, J. Appl. Meteorol., 31, 386–396, https://doi.org/10.1175/1520-0450(1992)031<0386:EOFFON>2.0.CO;2, 1992.
Kozarić T. and Mokorić, M.: Kvarner fire 23rd and 24 July 2012 – weather analysis, Firefighting and Management, 2, 53–66, 2012.
Lagouvardos, K., Kotroni, V., Giannaros, T. M., and Dafis, S.: Meteorological conditions conducive to the rapid spread of the deadly wildfire in Eastern Attica, Greece, B. Am. Meteorol. Soc., 100, 2137–2145, https://doi.org/10.1175/BAMS-D-18-0231.1, 2019.
Lepri, P., Večenaj, Ž., Kozmar, H., and Grisogono, B.: Near-ground turbulence of the Bora wind in summertime, J. Wind Eng. Ind. Aerod., 147, 345–357, https://doi.org/10.12989/was.2014.19.5.505, 2015.
Long, M. : A climatology of extreme fire weather days in Victoria, Aust. Meteorol. Mag., 55, 3–18, 2006.
Long, R. R.: Some aspects of the flow of stratified fluids. I. A theoretical investigation, Tellus, 5, 42–58, 1953.
Lydersen, J. M., North, M. P., and Collins, B. M.: Severity of an uncharacteristically large wildfire, the Rim Fire, in forests with relatively restored frequent fire regimes, Forest Ecol. Manag., 328, 326–334, https://doi.org/10.1016/j.foreco.2014.06.005, 2014.
Mamut, M.: Ties between the geographical and social geographical features of Dalmatia with the endangerment of forest fires, Croat. J. For. Eng., 1–2, 37–50, 2011 (in Croatian).
Marsh, L.: Fire weather forecasting in Tasmania, Meteorological Note 171, Bureau of Meteorology, Adelaide, 1987.
McCarthy, E. F.: Forest fire weather in the southern Appalachians, Mon. Weather Rev., 51, 182–185, doi:/https://doi.org/10.1175/1520-0493, 1923.
Mifka, B. and Vučetić, V.: Weather analysis during extreme forest fire on island of Brač from 14 to 17 July 2011, Firefighting and Management, 1, 13–25, 2012 (in Croatian).
Mills, G. H.: A re-examination of the synoptic and mesoscale meteorology of Ash Wednesday 1983, Aust. Meteorol. Mag., 54, 35–55, 2005a.
Mills, G. H.: On the sub-synoptic scale meteorology of two extreme fire weather days during the Eastern Australian fires of January 2003, Aust. Meteorol. Mag., 54, 265–290, 2005b.
Ministry of Tourism: Tourism in numbers 2017, Republic of Croatia, Zagreb, https://www.htz.hr/sites/default/files/2018-08/HTZ TUB HR_ 2017 FINAL.pdf (last access: 18 August 2022), 2018.
Moreira, F., Viedma, O., Arianoutsou, M., Curt, T., Koutsias, N., Rigolot, E., Barbati, A., Corona, P., Vaz, P., Xanthopoulos, G., Mouillot, F., and Bilgilir, E.: Landscape–wildfire interactions in southern Europe: implications for landscape management, J. Environ. Manage., 92, 2389–2402, https://doi.org/10.1016/J.JENVMAN.2011.06.028, 2011.
Pausas, J. G., Llovet J., Rodrigo A., and Vallejo, R.: Are wildfires a disaster in the Mediterranean basin? – A review, Int. J. Wildland Fire, 17, 713–723, https://doi.org/10.1071/WF07151, 2008.
Peace, M., Matiner, T., Mills, G., Kepert, J., and McCaw, L.: Fire-modified meteorology in a coupled fire-atmosphere model, J. Appl. Meteorol. Clim., 54, 704–720, https://doi.org/10.1175/JAMC-D-14-0063.1, 2015.
Pretorius, I., Sturman, A., Strand, T., Katurji, M., and Pearce, G.: A meteorological study of the Port Hills fire, Christchurch, New Zealand, J. Appl. Meteorol. Clim., 59, 263–280, https://doi.org/10.1175/jamc-d-19-0223.1, 2020.
Pyne, S. J., Andrews, P. L., and Laven, R. D.: Introduction to Wildland Fire, second ed., John Wiley & Sons Inc, ISBN 9780471549130, ISBN 0471549134, New York, 1996.
Reeder, M. J., Spengler T., and Musgrave R.: Rossby waves, extreme fronts, and wildfires in southeastern Australia, Geophys. Res. Lett., 42, 2015–2023, https://doi.org/10.1002/2015GL063125, 2015.
Ruffault, J., Moron, V., Trigoc R. M., and Curta T.: Short Communication: Daily synoptic conditions associated with large fire occurrence in Mediterranean France: evidence for a wind-driven fire regime, Int. J. Climatol., 37, 524–533, https://doi.org/10.1002/joc.4680, 2017.
Rundel, P. W., Arroyo, M. T. K., Cowling, R. M., Keeley, J. E., Lamont, B. B., Pausas J. G., and Vargas, P.: Fire and plant diversification in Mediterranean-climate regions, Front. Plant. Sci., 9, 851, https://doi.org/10.3389/fpls.2018.00851, 2018.
San-Miguel-Ayanz, J., Moreno, J. M., and Camia, A.: Analysis of large fires in European Mediterranean landscapes: Lessons learned and perspectives, Forest Ecol. Manag., 294, 11–22, https://doi.org/10.1016/j.foreco.2012.10.050, 2013.
Sanchez-Benítez, A., Garcia-Herrera, R., Barriopedro, D., Sousa, P. M., and Trigo, R. M.: June 2017: The Earliest European Summer Mega-heatwave of Reanalysis Period, Geophys. Res. Lett., 45, 1955–1962, https://doi.org/10.1002/2018GL077253, 2018.
Schroeder, M. J., Glovinsky, M., Hendricks, V. F., Hood, F. C., Hull, M. K., Jacobson, H. L., Kirkpatrick, R., Krueger, D. W., Mallory, L. P., Oertel A. G., Reese, R. H., Sergius, L. A., and Syverson, C. E.: Synoptic weather types associated with critical fire weather, Forest Service, US Department of Agriculture, Berkeley, 1964.
Sharples, J. J.: An overview of mountain meteorological effects relevant to fire behaviour and bushfire risk, Int. J. Wildland Fire, 18, 737–754, https://doi.org/10.1071/WF08041, 2009.
Sharples, J. J., Mills, G. A., McRae, R. H. D., and Weber, R. O.: Foehn-Like winds and elevated fire danger conditions in southeastern Australia, J. Appl. Meteorol. Clim., 49, 1067–1095, https://doi.org/10.1175/2010JAMC2219.1, 2010.
Sharples, J. J., McRae, R. H. D., and Wilkes, S. R.: Wind-terrain effects on the propagation of wildfires in rugged terrain: fire channelling, Int. J. Wildland Fire, 21, 282–296, https://doi.org/10.1071/WF10055, 2012.
Smith, R. B.: On severe downslope winds, J. Atmos. Sci., 42, 2597–2603, 1985.
Stanešić, A., Horvath, K., and Keresturi, E.: Comparison of NMC and Ensemble-Based Climatological Background-Error Covariances in an Operational Limited-Area Data Assimilation System, Atmosphere, 10, 570, https://doi.org/10.3390/atmos10100570, 2019.
Stocks, B. J., Lawson, B. D., Alexander, M. E., Van Wagner, C. E., McAlpine, R. S., Lynham, T. J., and Dube, D. E.: The Canadian Forest Fire Danger Rating System: an overview, Forest. Chron., 65, 450–457, 1989.
Strauss, D., Bednar, L., and Mees, R.: Do one percent of forest fires cause ninety-nine percent of the damage?, Forest Sci., 35, 319–328, 1989.
Šoljan, V., Belušić, A., Šarović, K., Nimac, I., Brzaj, S., Suhin, J., Belavić, M., Večenaj, Ž., Grisogono, B.: Micro-Scale Properties of Different Bora Types, Atmosphere, 9, 116, https://doi.org/10.3390/atmos9040116, 2018.
Telišman Prtenjak, M., Horvat, I., Tomažić, I., Kvakić, M., Viher, M., and Grisogono, B.: Impact of mesoscale meteorological processes on anomalous radar propagation conditions over the northern Adriatic area, J. Geophys. Res.-Atmos., 120, 8759–8782, https://doi.org/10.1002/2014JD022626, 2015.
Telišman Prtenjak, M., Viher, M., and Jurković, J.: Sea-land breeze development during a summer bora event along the north-eastern Adriatic coast, Q. J. Roy. Meteor. Soc., 136, 1554–1571, https://doi.org/10.1002/qj.649, 2010.
Tomašević, I.: Vertical atmospheric profiles during the large wildland fires, Master thesis, Faculty of Science, University of Zagreb, 2012 (in Croatian).
Tomašević, I., Cheung, K., Vučetić, V., and Fox-Hughes, P.: Comparison of wildfire meteorology and climate at the Adriatic coast and southeast Australia, Atmosphere, 13, 755, https://doi.org/10.3390/ATMOS13050755, 2022.
Tory, K. J. and Kepert, J. D.: Pyrocumulonimbus firepower threshold: accessing the atmospheric potential for pyroCb, Weather Forecast., 36, 439–456, https://doi.org/10.1175/WAF-D-20-0027.1, 2021.
Tory, K. J., Thurston, W., and Kepert, J. D.: Thermodynamics of pyrocumulus: a conceptual study, Mon. Weather Rev., 146, 2579–2598, https://doi.org/10.1175/MWR-D-17-0377.1, 2018.
Tudor, M., Ivatek-Šahdan, S., Stanešić, A., Horvath, K., Bajić A.: Forecasting weather in Croatia using ALADIN numerical weather prediction model, in: Climate Change and Regional/Local Responses, edited by: Zhang, Y. and Ray, P., IntechOpen, Rijeka, 59–88, https://doi.org/10.5772/55698, 2013.
Tudor, M., Stanešić, A., Ivatek-Šahdan, S., Hrastinski, M., Odak Plenković, I., Horvath, K., Bajić A., and Kovačić, T.: Operational validation and verification of ALADIN forecast in Meteorological and hydrological service of Croatia, Croat. Meteorol. J., 50, 47–70, 2015.
Turco, M., Jerez, S., Augusto, S., Tarín-Carrasco, P., Ratola, N., Jiménez-Guerrero, P., and Trigo, R. M.: Climate drivers of the 2017 devastating fires in Portugal, Sci. Rep.-UK, 9, 13886, https://doi.org/10.1038/s41598-019-50281-2, 2019.
Uccellini, L. W.: On the Role of Upper Tropospheric Jet Streaks and Leeside Cyclogenesis in the Development of Low-Level Jets in the Great Plains, Mon. Weather Rev., 108, 1689–1696, https://doi.org/10.1175/1520-0493(1980)108<1689:OTROUT>2.0.CO;2, 1980.
Van Wagner, C. E. and Pickett, T. L.: Equations and Fortran Program for the Canadian Forest Fire Weather Index System, Forestry Technical Report 33, Canadian Forestry Service, Government of Canada, Ontario, ISBN 0-662-13906-2, 1985.
Vučetić, M.: Meteorological analysis of a catastrophic forest fire on Korčula in 1985, Croat. Meteorol. J. (Rasprave), 22, 67–72, 1987 (in Croatian).
Vučetić, M.: Weather phenomena during the 13–31 July 1990 forest fire on the island of Hvar, Croat. Meteorol. J., 27, 69–76, 1992 (in Croatian).
Vučetić, M. and Vučetić, V.: Adriatic Weather – Meteorology for Sailors, Fabra Press, Zagreb, ISBN 98-953-7317-22-5, 2013.
Vučetić, V.: Bora on the northern Adriatic, 12–16 April 1982, Croat. Meteorol. J. (Rasprave), 23, 27–44, 1988.
Vučetić, V.: Statistical analysis of severe Adriatic bora, Croat. Meteorol. J., 26, 41–51, 1991.
Vučetić, V.: Severe bora on the mid-Adriatic, Croat. Meteorol. J., 28, 19–36, 1993.
Vučetić, V., Ivatek-Šahdan, S., Tudor, M., Kraljević, L., Ivančan-Picek, B., and Strelec Mahović, N.: Weather analysis during the Kornat Fire on 30 August 2007, Croat. Meteorol. J., 42, 41–66, 2007 (in Croatian).
Wang, H. H.: Analysis on downwind distribution of firebrands sourced from a wildland fire, Fire Technol., 47, 321–340, https://doi.org/10.1007/s10694-009-0134-4, 2011.
Werth, P. A., Potter, B. E., Clements, C. B., Finney, M. A., Goodrick, S. L., Alexander, M. E., Cruz, M. G., Forthofer, J. A., and McAllister, S. S.: Synthesis of Knowledge of Extreme Fire Behavior, Volume 1 for Fire Managers. General Technical Report PNW-GTR-854, Pacific Northwest Research Station, Forecast Service, U.S. Department of Agriculture, November, https://doi.org/10.2737/PNW-GTR-854, 2011.
Whiteman, C. D.: Mountain Meteorology: Fundamentals and Applications, Oxford University Press, US, ISBN 9780195132717, 2000.
Zimet, T., Martin, J. E., and Potter, B. E.: The influence of an upper-level frontal zone on the Mack Lake Wildfire environment, Meteorol. Appl., 14, 131–147, https://doi.org/10.1002/met.14, 2007.