the Creative Commons Attribution 4.0 License.
the Creative Commons Attribution 4.0 License.
 | 26 Sep 2022
Rare flood scenarios for a rapidly growing high-mountain city: Pokhara, Nepal
Melanie Fischer
Jana Brettin
Sigrid Roessner
Ariane Walz
Monique Fort
Oliver Korup
Pokhara (ca. 850 m a.s.l.), Nepal's second-largest city, lies at the foot of the Higher Himalayas and has more than tripled its population in the past 3 decades. Construction materials are in high demand in rapidly expanding built-up areas, and several informal settlements cater to unregulated sand and gravel mining in the Pokhara Valley's main river, the Seti Khola. This river is fed by the Sabche glacier below Annapurna III (7555 m a.s.l.), some 35 km upstream of the city, and traverses one of the steepest topographic gradients in the Himalayas. In May 2012 a sudden flood caused >70 fatalities and intense damage along this river and rekindled concerns about flood risk management. We estimate the flow dynamics and inundation depths of flood scenarios using the hydrodynamic model HEC-RAS (Hydrologic Engineering Center’s River Analysis System). We simulate the potential impacts of peak discharges from 1000 to 10 000 m3 s−1 on land cover based on high-resolution Maxar satellite imagery and OpenStreetMap data (buildings and road network). We also trace the dynamics of two informal settlements near Kaseri and Yamdi with high potential flood impact from RapidEye, PlanetScope, and Google Earth imagery of the past 2 decades. Our hydrodynamic simulations highlight several sites of potential hydraulic ponding that would largely affect these informal settlements and sites of sand and gravel mining. These built-up areas grew between 3- and 20-fold, thus likely raising local flood exposure well beyond changes in flood hazard. Besides these drastic local changes, about 1 % of Pokhara's built-up urban area and essential rural road network is in the highest-hazard zones highlighted by our flood simulations. Our results stress the need to adapt early-warning strategies for locally differing hydrological and geomorphic conditions in this rapidly growing urban watershed.
- Article
(16956 KB) - Full-text XML
- BibTeX
- EndNote


Many mountain communities and their infrastructure have become exposed and vulnerable to natural hazards (Fort, 2015; Hock et al., 2019). The Hindu Kush Himalayas, home to some 200 million people and “water tower” to 1.3 billion people living downstream (Immerzeel et al., 2010; Schild, 2008), have seen rapid population growth, expanding road networks, shifts from agriculture to tourism as the main economic revenue, and the rise in hydropower projects (Hock et al., 2019; Schwanghart et al., 2018; Sidle and Ziegler, 2012). Current projections of cryospheric change in this mountain belt foresee a continued total glacier-mass wastage of up to 64±5 % by the end of the 21st century under the RCP8.5 scenario (Kraaijenbrink et al., 2017) as well as permafrost degradation (Bolch et al., 2019). These changes will likely result in a destabilisation of mountain slopes and increase in meltwater volumes stored in lakes impounded behind potentially unstable natural dams (Hock et al., 2019). Thus, the potential for hazards caused from these instabilities, including sudden floods, is likely to increase in the future. The Pokhara valley in Nepal, home to the nation's second-largest city, is a prime example of a Himalayan valley experiencing rapid socio-economic development. Emerging job opportunities in the tourism sector triggered the steep rise in Pokhara's population since the 1970s, fuelled by unabated migration from rural to urban areas (Rimal et al., 2015, 2018). Urbanisation pressure has also forced informal settlements of marginalised communities on the lowermost river terraces and floodplains of the valley's main river, the Seti Khola (Fort et al., 2018; Thapa et al., 2022).
Apart from annual monsoonal floods, this river has a history of rare, extreme floods. On 5 May 2012, a hyperconcentrated flow killed 72 persons and destroyed roads, bridges, and drinking water pipelines in the northern Pokhara Valley (Gurung et al., 2015, 2021). The exact sequence of events remains debated but may have been initiated by rock-slope failures from the western flank of the Annapurna IV Massif at 7525 m a.s.l., observed by chance by a pilot (Hanisch et al., 2013; Kargel et al., 2013). Similar to the 2021 Chamoli disaster (Shugar et al., 2021), a highly mobile ice–rock avalanche may have transformed into an hyperconcentrated flow that hit the village of Kharapani (1100 m a.s.l.) some 23 km downstream just half an hour later, causing most of the damage and fatalities, with an estimated peak discharge of 8400 m3 s−1 (Hanisch et al., 2013; Oi et al., 2014; SANDRP, 2014). Thanks to the pilot, a radio warning was issued, most likely preventing a higher death toll further downstream (Kargel et al., 2013).
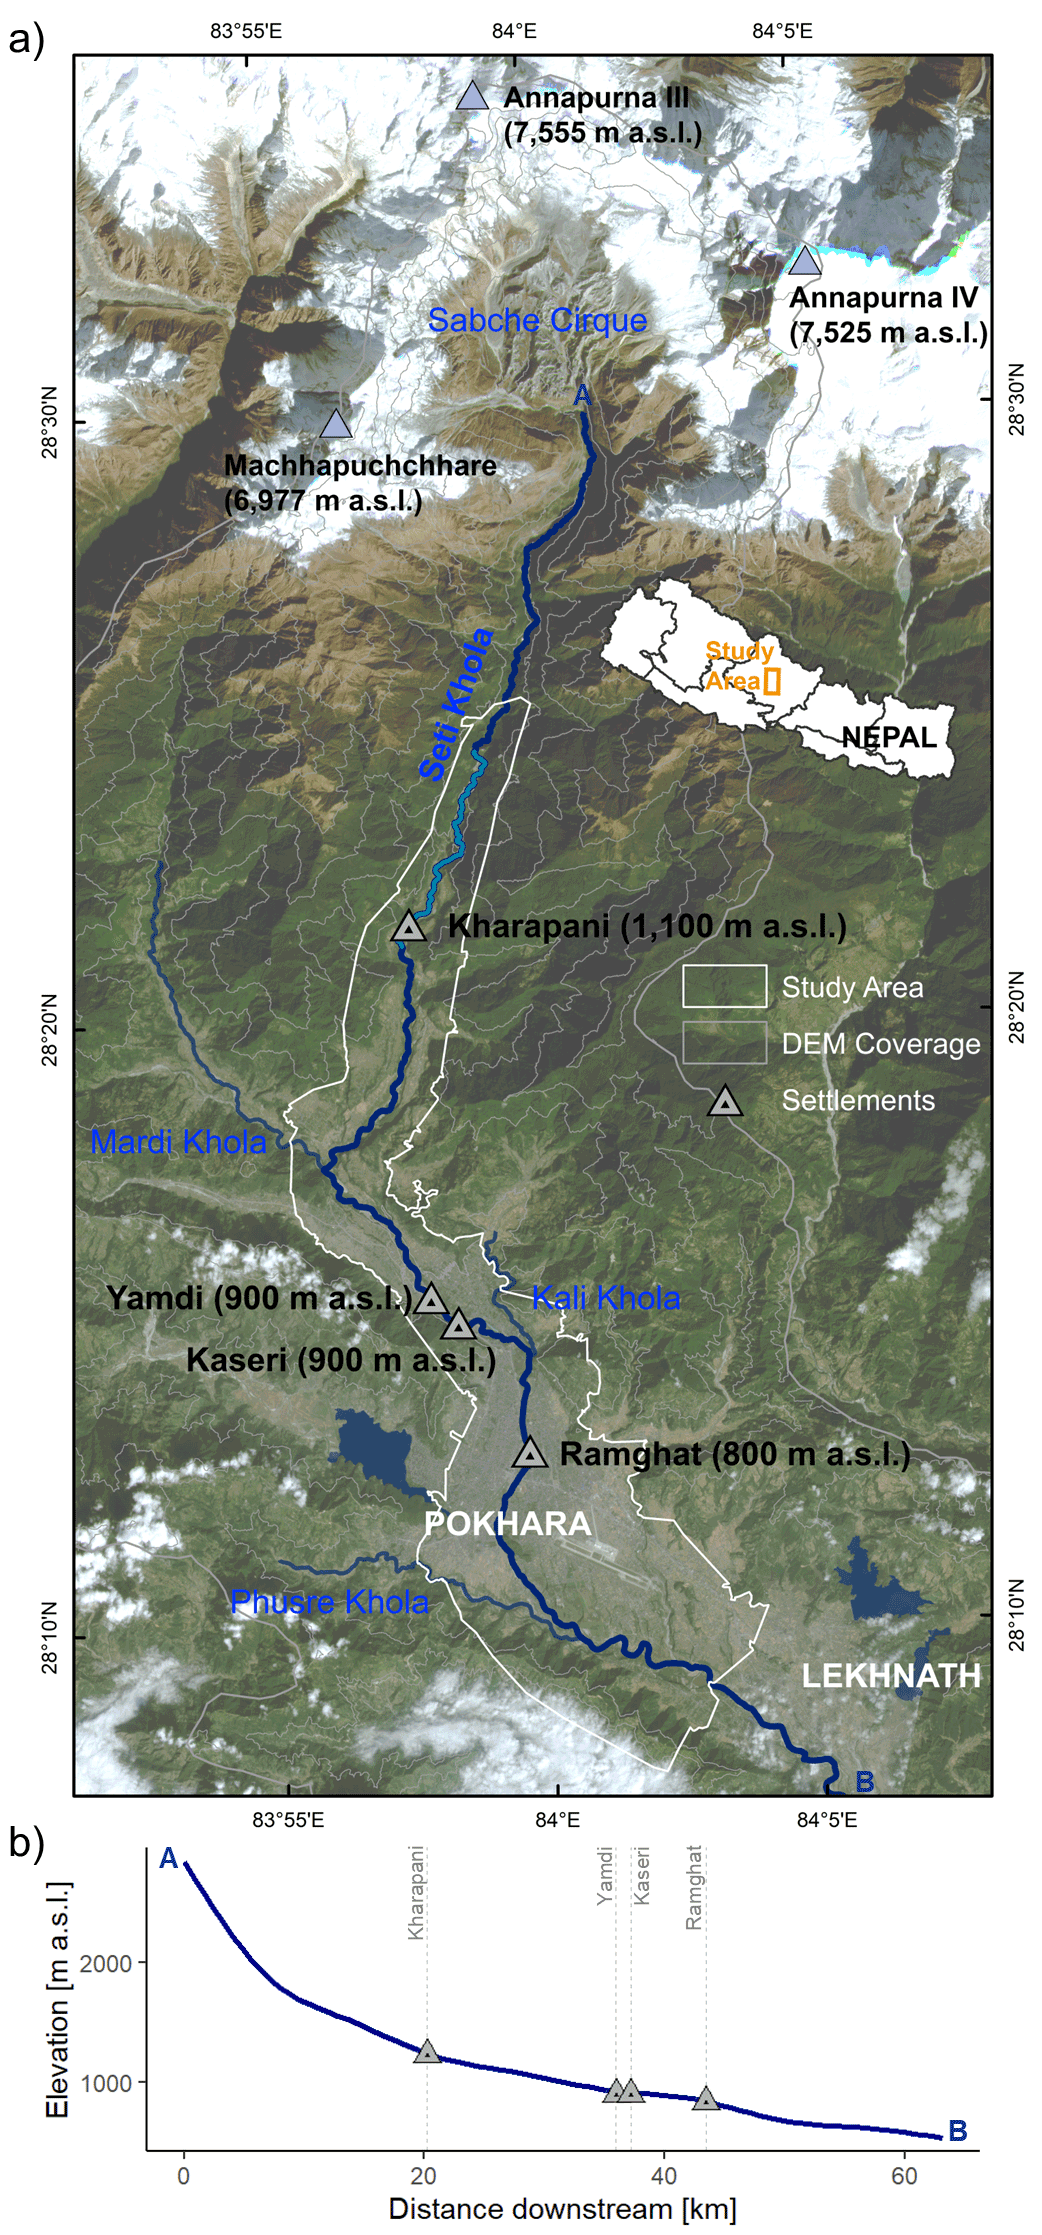
Figure 1The Pokhara Valley and the Seti Khola in November 2021. (a) Our HEC-RAS (Hydrologic Engineering Center’s River Analysis System) model domain and manual land cover mapping cover the study area (white polygon, Fig. A2). The most intense damages during the May 2012 flood occurred along the uppermost inhabited reach of the Seti Khola (light blue). Grey triangles mark settlements mentioned in this study. Image: PlanetScope (Planet Team, 2017); contour lines (500 m spacing) are from AW3D DEM (JAXA, NTT Data, and Remote Sensing Technology, 2022; ALOS 3D digital elevation model; © NTT DATA, RESTEC/© JAXA); Nepal administrative boundaries are from the UN Office for the Coordination of Humanitarian Affairs – Field Information Services Section (OCHA FISS, 2020). (b) Smoothed longitudinal profile of the Seti Khola from the Sabche Cirque (A) to the south-eastern periphery of Lekhnath (B).
Even larger catastrophic floods may have occurred in the Seti Khola in Medieval times, depositing much of the youngest sediment fill of the Pokhara valley during or shortly after large earthquakes, likely in the wake of major landslides or outbursts of glacier- and landslide-dammed lakes in the Annapurna Massif (Fort, 1987; Schwanghart et al., 2016; Stolle et al., 2017). Based on relict natural dams, Schwanghart et al. (2016) estimated that up to 1 km3 of water could have been stored in the steep-walled and sediment-filled Sabche Cirque some 35 km north of Pokhara city; outburst floods from this cirque could have released water at peak rates of up to 600 000 m3 s−1. Several authors agree that the cirque might spawn large floods along the Seti Khola in the future (Fort, 2010; Grandin et al., 2012; Gurung et al., 2021; Kargel et al., 2013; Lovell et al., 2018). The upper Seti Khola gorge below the cirque is a bottleneck prone to blockage by landslides detaching from the cirque walls and might impound large amounts of water (Kargel et al., 2013). Further downstream, landslides triggered by monsoonal storms (Talchabhadel et al., 2018) could also form temporary dams that might fail catastrophically like in the Melamchi outburst flood in June 2021 (Petley, 2021). Fort (1987) and Kargel et al. (2013) reported that the Sabche Cirque stores large amounts of unconsolidated material to nourish floods and debris flows. Although not present currently, meltwater lakes could form and grow rapidly in the Sabche Cirque and may release glacial lake outburst floods (GLOFs) in the near future (Zheng et al., 2021). The Sabche glacier could also contribute to generating outburst floods as its surges could form potentially short-lived lakes (Lovell et al., 2018). Despite this evidence of past non-meteorological floods along the Seti Khola, appraisals of flood hazard have so far largely focused on the 100-year meteorological flood as estimated from rainfall data (Basnet and Acharya, 2019; Gurung et al., 2021; Shrestha et al., 2021). The associated risk estimates rely on land use and land cover (LULC) mapping and projections from Landsat data (Gurung et al., 2021; Rimal et al., 2015, 2018), floodplain mapping (Gurung et al., 2021; Rimal et al., 2015, 2018), and hydrodynamic modelling for selected reaches (Basnet and Acharya, 2019; Gurung et al., 2021).
We aim to expand on these studies by providing a comprehensive, semi-quantitative estimation of potential non-meteorological flood impacts on the city of Pokhara and surrounding regions. In our approach we recognise possibly inundated areas for different flood scenarios, the types of land cover and infrastructure most likely affected, and the role of rapid urban expansion. We intersect the results of hydrodynamic modelling with land cover data on buildings and the road network, and highlight the rapid recent growth of two informal settlements. Our appraisal forms a building block for a more formal risk assessment that is currently curtailed by a lack of data on non-meteorological flood probabilities as well as exposed values. Nonetheless, our study is one of the few to combine flood scenarios with land cover and land use changes and might aid both urban planning and anticipatory risk management in the Pokhara Valley (Nussbaumer et al., 2014).
Pokhara is the second-largest city of Nepal, capital of the Kaski District and the Gandaki Province, and lies at the southern foot of the 8 km high, seismically active Annapurna Massif of the Higher Himalaya (Fort, 2010; Grandin et al., 2012). The Seti Khola is Pokhara's main river and traverses one of the steepest topographic gradients in the Himalayas, originating at 3700 m a.s.l. in the Sabche Cirque of the Annapurna Massif and entering the city 850 m a.s.l. some 35 km downstream (Fig. 1). The headwaters are mainly fed by Sabche glacier, the only glacier with observed surges in the central Himalayas (Lovell et al., 2018). The Seti Khola is also fed by the Mardi Khola, entering the valley in the north-west, and the Phusre Khola, to the south-east of Pokhara.
Pokhara is built on a large (>120 km2) intramontane alluvial fan of the Seti Khola. The youngest of three depositional units of this fan is the 60–100 m thick Pokhara Formation that was formed by (post-)seismic sediment pulses in the 12th to 14th century CE (Fort, 2010; Schwanghart et al., 2016). These mostly unconsolidated gravel beds cap the more indurated, but undated, Ghachok Formation (Fort, 1987; Hormann, 1974). Over a course of 70 km, the Seti Khola cuts through its own sediments, forming broad, unpaired, and 100 m high terraces (Fort, 2010; Stolle et al., 2017). The cut-and-fill terraces alternate with the gorges, the latter being short (<1 km), narrow (<10 m), and up to 90 m deep, in resistant calcareous conglomerates of the Ghachok Formation and the bedrock of the Lesser Himalayan Sequence (Stolle et al., 2019). Some of these gorges are connected to karst features like potholes, tunnels, and caves (Fort, 2010).
Climate in the Seti Khola catchment is distinctly seasonal. The summer monsoon (May to October) brings >80 % of the annual precipitation of about 4000 mm per year (Gabet et al., 2004). Climate also strongly varies with topographic relief (Rimal et al., 2018): the central Pokhara Valley has a humid sub-tropical to humid temperate climate with mean monthly temperatures of 13 to 26 ∘C (Ross and Gilbert, 1999), whereas temperate to alpine climate characterises the Annapurna Massif to the north (Rimal et al., 2015, 2018).
With a population of about 518 000 in 2021 (Central Bureau of Statistics, 2022) the city and its surrounding valley have seen rapid socio-economical changes following the construction of major transportation infrastructure since the 1970s, driven by better access to higher standards of living, and inbound migration attracted by the growing tourism sector and new employment opportunities (Fort et al., 2018).
Between 1990 and 2013, the urban area increased by 30 km2, or 2.6 % of the total watershed, whereas cultivated land decreased by 2.5 % (Rimal et al., 2015). Population migration dynamics are also reflected by an increase of 45 % in areas classified as urban in 2010 when compared to Pokhara's municipal area in 1977 (Rimal, 2012; Rimal et al., 2015). The urban population has more than tripled since the 1990s (Rimal et al., 2015; United Nations Department of Economic and Social Affairs, 2019). Many informal settlements formed on the lowermost river terraces or the floodplain of the Seti Khola (Fig. 1), where squatters largely rely on gravel and sand mining as an income source (Fort et al., 2018; Gurung et al., 2021; Stolle, 2018).
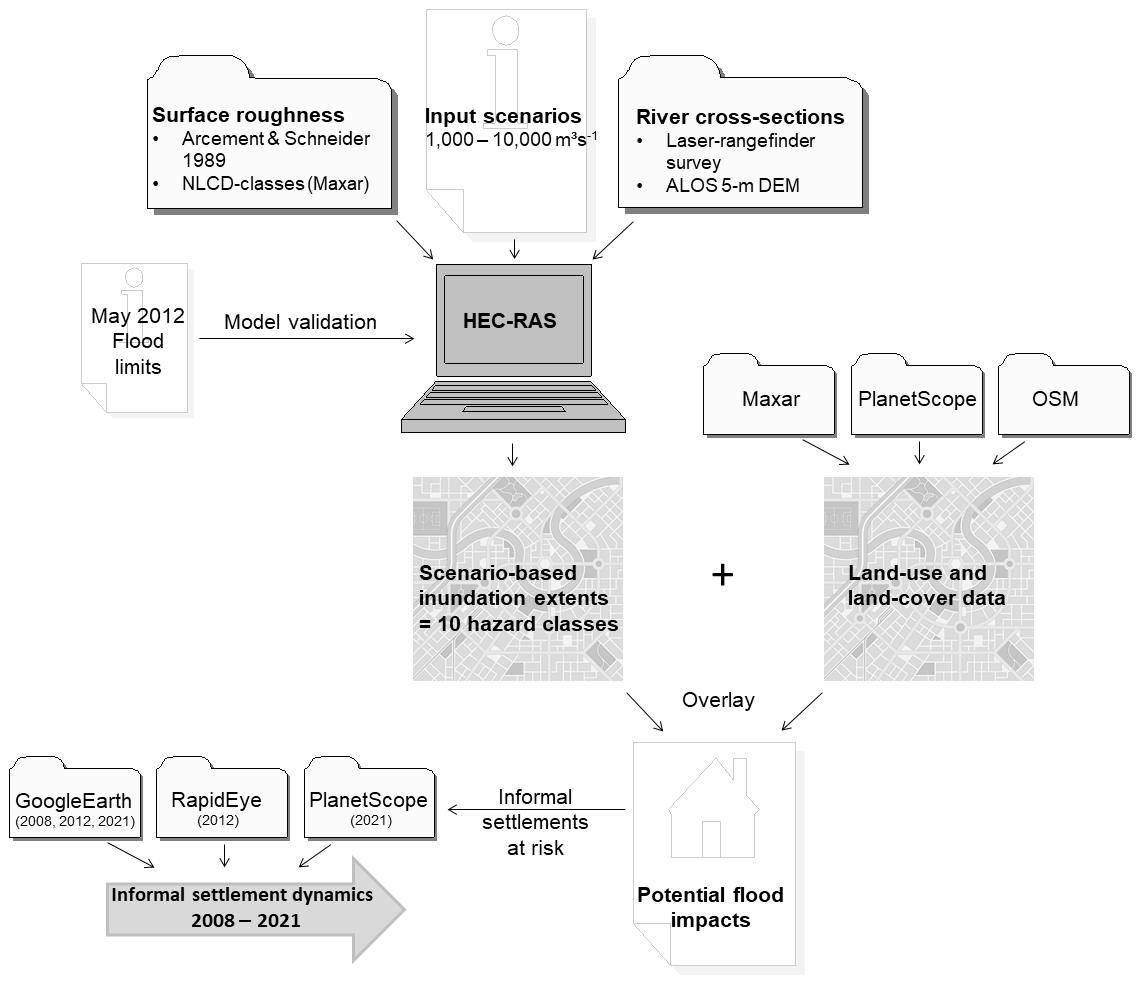
Figure 2Data sources and workflow of our semi-quantitative assessment of flood impacts in the Pokhara Valley. See Fig. A1 for model validation workflow.
3.1 Overall approach
We analyse potential impacts from physically plausible magnitudes of sudden floods along a 40 km long reach of the Seti Khola. Data to inform our range of scenarios come from two non-meteorological floods in the Pokhara Valley and have estimated peak discharges differing by orders of magnitude: while the May 2012 flood involved between 1000 and 12 300 m3 s−1 (Kargel et al., 2013; Oi et al., 2012; SANDRP, 2014), much larger Medieval floods may have involved 45 000 to 600 000 m3 s−1 (Schwanghart et al., 2016), judging from geomorphic flood markers. Reported peak discharges from non-meteorological floods elsewhere in the Himalayas are 1600 m3 s−1 for the Dig Tsho GLOF of 1985 (Vuichard and Zimmermann, 1987) and 8000 to 14 000 m3 s−1 for the 2021 Chamoli disaster (Pandey et al., 2022; Shugar et al., 2021) and thus support our range of historic flood scenarios plausibly. Our assessment is built on combining scenario-based inundation modelling with current LULC and data of buildings and the road network to identify areas of potential flood impact (Fig. 2). We also selected two informal settlements close to the river and estimate how the growth of their built-up area between 2008 and 2021 affected their exposure to floods. Stream-gauge data are unavailable for the Seti Khola; hence we validated our model with mapped damage and sediment traces caused by the May 2012 flood (Fig. A1).
3.2 Scenarios for numerical flood routing
We simulated 10 flood scenarios with the Hydrologic Engineering Center's River Analysis System, HEC-RAS (version 5.0.7; https://www.hec.usace.army.mil/software/hec-ras/, last access: 16 September 2022). HEC-RAS uses a step method for simulating steady (i.e. constant but gradually varied), open-channel flow in one dimension, based on the Saint-Venant equations (Brunner, 2020a; Westoby et al., 2014). The standard step method computes water-level profiles between two river cross-sections that describe the geometry of the channel and the adjacent overbank areas by iteratively solving the energy equation (Eq. 1):
For cross-sections 1 and 2, Z1 and Z2 describe their main channel bed elevations, Y1 and Y2 the corresponding flow depths, V1 and V2 the mean flow velocities, and a1 and a2 the weighting coefficients; g is the gravitational acceleration. The energy head loss he specifies the effects of friction, as well as expansion and contraction caused by the channel geometry. At each cross-section, Manning's equation is used to compute discharge Q (Eq. 2):
where A is cross-section area, R is the hydraulic radius, Sf is the energy gradient, and n is a hydraulic loss (or roughness) coefficient (Brunner, 2020a).
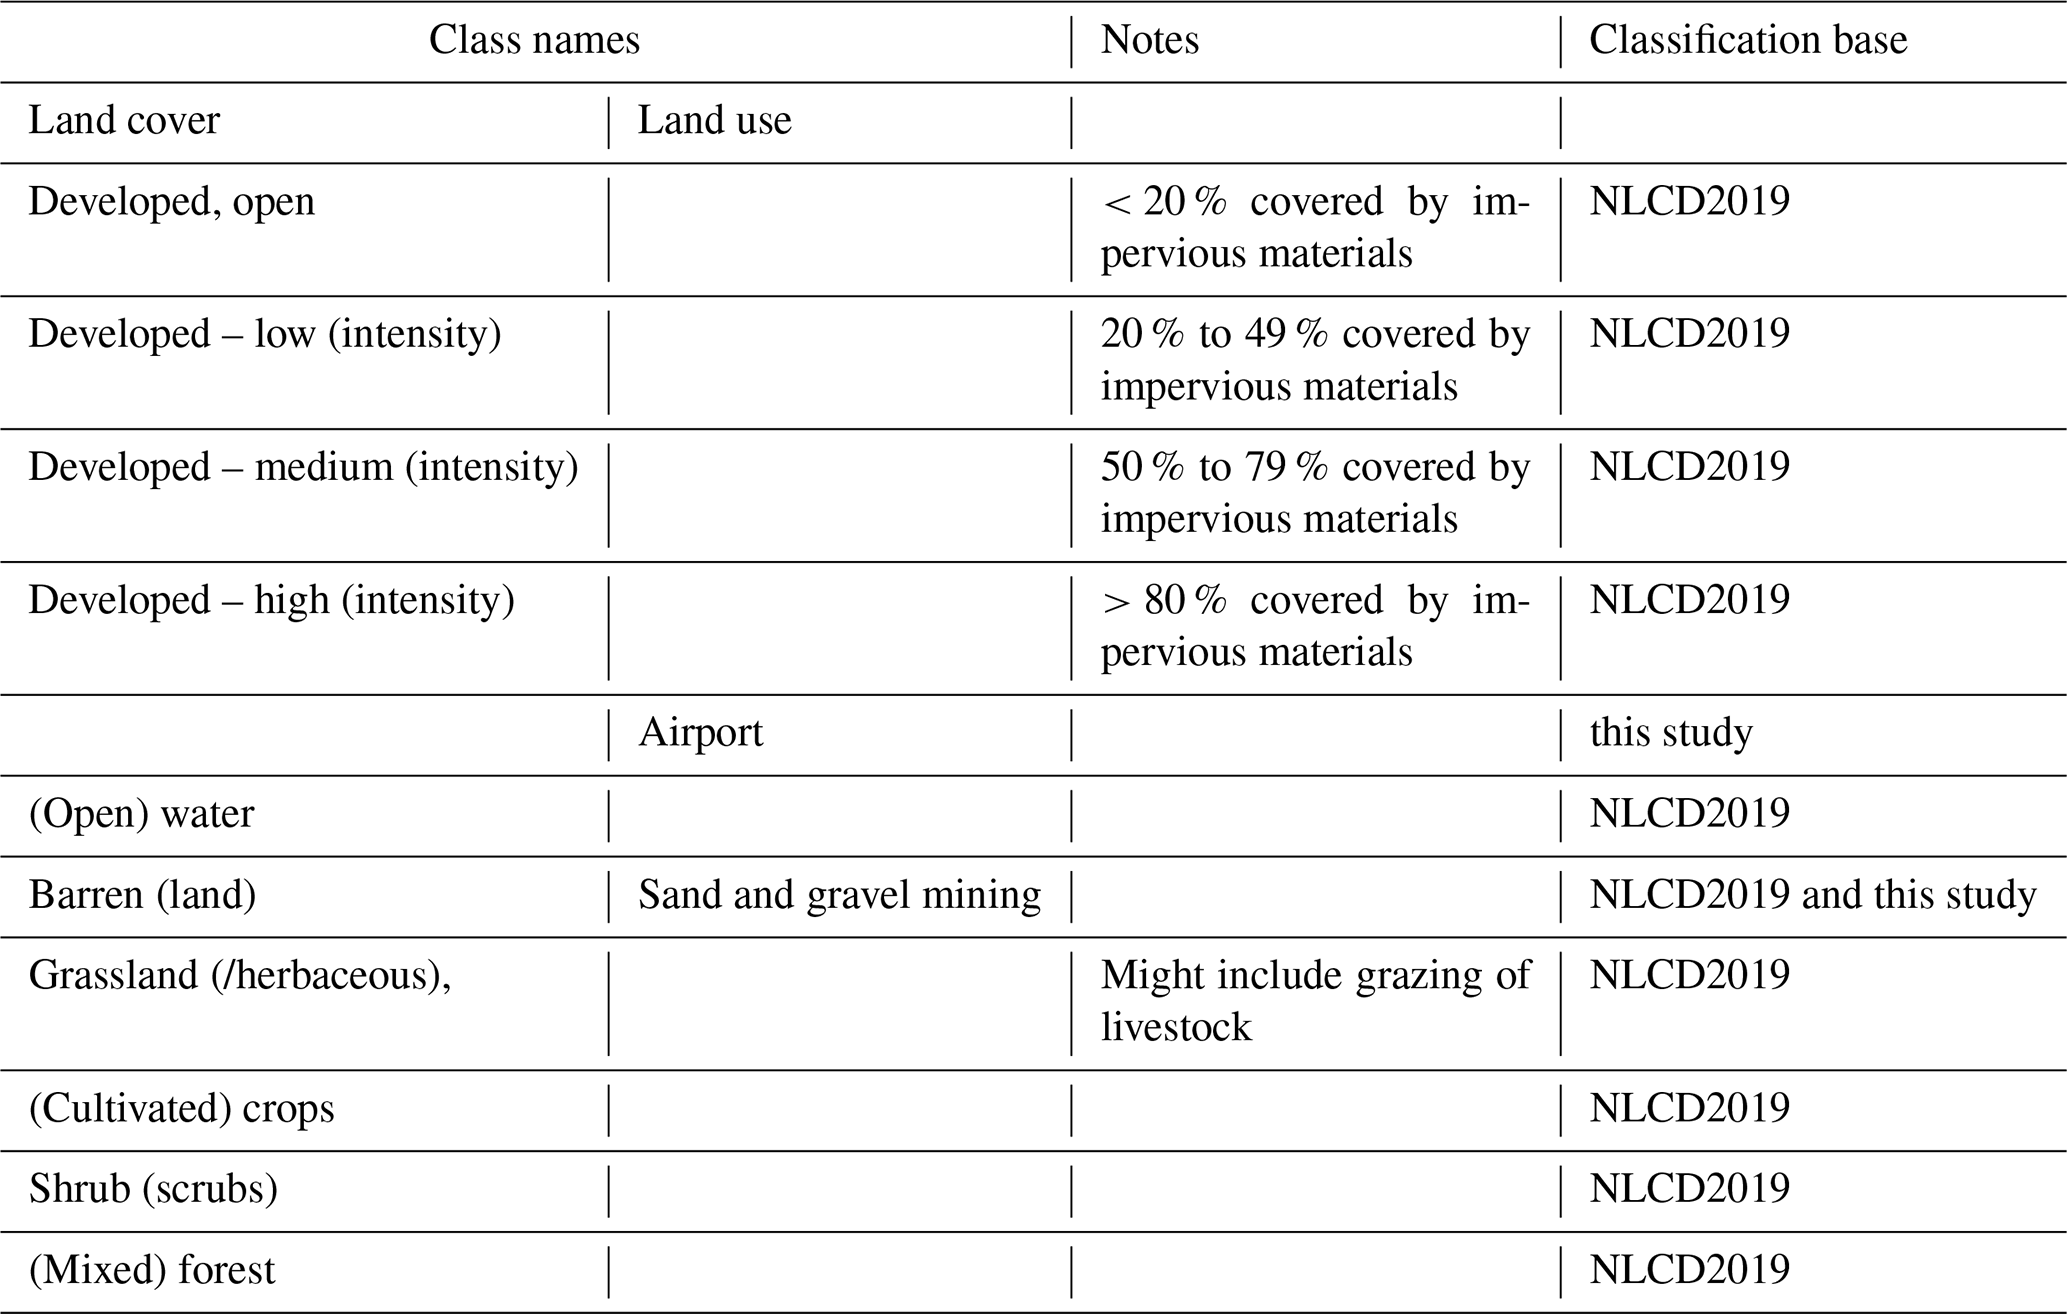
Table 1Manually mapped land cover (LC) and land use (LU) classes. LC definition follows the USGS National Land Cover Database 2019 (NLCD2019; Multi-Resolution Land Characteristics (MRLC) Consortium, 2019), complemented by two LU classes.
Geometric data for our HEC-RAS runs were mainly derived from the commercial ALOS 3D digital elevation model (AW3D DEM; JAXA, NTT Data, and Remote Sensing Technology, 2022), which has a vertical and horizontal resolution of <5 m and was projected to UTM Zone 44N (Fig. 2). We also acquired field data with a TruPulse 360 laser range finder and a Garmin eTrex handheld GPS during two campaigns in October of 2016 and 2019. We used these field data to correct some of the 572 DEM-derived cross-sections of the Seti Khola and its major tributaries, especially in the narrow gorges (Fig. 1). The average spacing between cross-sections was 90 m (Fig. A2). We estimated Manning's n from manual mapping of land cover classes based on 1 m resolution Maxar satellite data (ESRI and Maxar Technologies, 2022) following guidelines by Brunner (2020b). We also estimated Manning's n at 61 field locations following methods by Arcement and Schneider (1984) and Chow (1959). We defined 10 discharge scenarios with peak discharge 000 m3 s−1 in the main channel. This range covers monsoonal floods (1500 to 2300 m3 s−1; Basnet and Acharya, 2019) and also larger but rarer non-meteorological floods like the one in May 2012 (8400 m3 s−1; Oi et al., 2014). The steepness of the Seti Khola's upper reach led us to specify mixed flow conditions with the critical flow depth as the upper boundary condition, while we set a normal depth of 0.0065 as the lower boundary condition. We assumed a constant base flow of 100 m3 s−1 (i.e. 10 % of our lowest discharge scenario) in three ungauged tributaries, i.e. the Mardi Khola, Kali Khola, and Phusre Khola.
3.3 Land use and land cover data
Using 1 m Maxar satellite imagery acquired in 2020 (ESRI and Maxar Technologies, 2022), we manually mapped 10 land cover (LC) and two land use (LU) classes in our model domain with an area of 136 km2 (Table 1 and Fig. 1).
We derived object-scale data on Pokhara city's buildings as well as roads and footpaths from the OpenStreetMap (OSM) collaborative project (https://www.openstreetmap.org/, last access: 30 September 2021; OSMF, 2021) via the Overpass Turbo tool (https://overpass-turbo.eu/, last access: 30 September 2021) to capture the situation in September 2021.
We mapped built-up areas in two informal settlements from medium- to high-resolution satellite imagery of April 2008 (Google Earth), November 2012 (Google Earth and RapidEye), and November 2021 (Google Earth and PlanetScope). In these images, we also identified sand and gravel mining activities based on the presence of artificial groynes and gravel heaps at the active channel margins.
3.4 Potential flood impact analysis
We used a geospatial overlay of our modelled flood inundation boundaries with the LULC data to assess on a semi-quantitative basis the likely impacts of 10 peak discharge scenarios. We defined 10 flood hazard classes by assigning areas and objects of the smallest flood scenario (Qp=1000 m3 s−1) to the highest hazard class (HC), HC 10. Conversely, the lowest hazard class 1 is attributed to areas and objects that would be inundated by the largest floods only (Qp=10 000 m3 s−1). In contrast to the total area flooded in a given scenario, these hazard classes do not overlap and label instead the relative increases in inundation area with each peak discharge scenario. Thus, HC 1 defines areas and objects that are potentially impacted by a flood with 000 m3 s−1, whereas HC 10 defines areas and objects that would be inundated at m3 s−1.
To check the plausibility of our model results, we mapped the uppermost reach of the Seti Khola between Karuwa and Kharapani (Fig. 1), where the 2012 flood caused the most damage. We used high-resolution Google Earth satellite imagery from December 2011 (pre-flood) and June 2012 (post-flood) to map man-made structures, including houses, huts, and temples. We also recorded the extent of sediment deposited during the May 2012 flood along this 8.4 km long reach from orthorectified 5 m resolution RapidEye imagery of 18 October 2012. We compared the simulated flood areas with the mapped extent of flood sediments and the mapped changes in buildings.
4.1 Impacts of the 2012 flood and flood scenarios
Our mapping of the May 2012 flood impacts along the Seti Khola show that nearly 30 % of the 145 man-made structures visible in satellite images before the flood were undetectable after. We estimate a loss in built-up area of 14 %. In the most heavily affected reach near Kharapani, only 5 of the 29 buildings remained, while 60 % of the built-up area was lost (Fig. 3). The best agreement between modelled inundation extent and observed flood sediment in this reach is for a simulated Qp of 3700 m3 s−1, which underestimates inundated areas by 14 %.
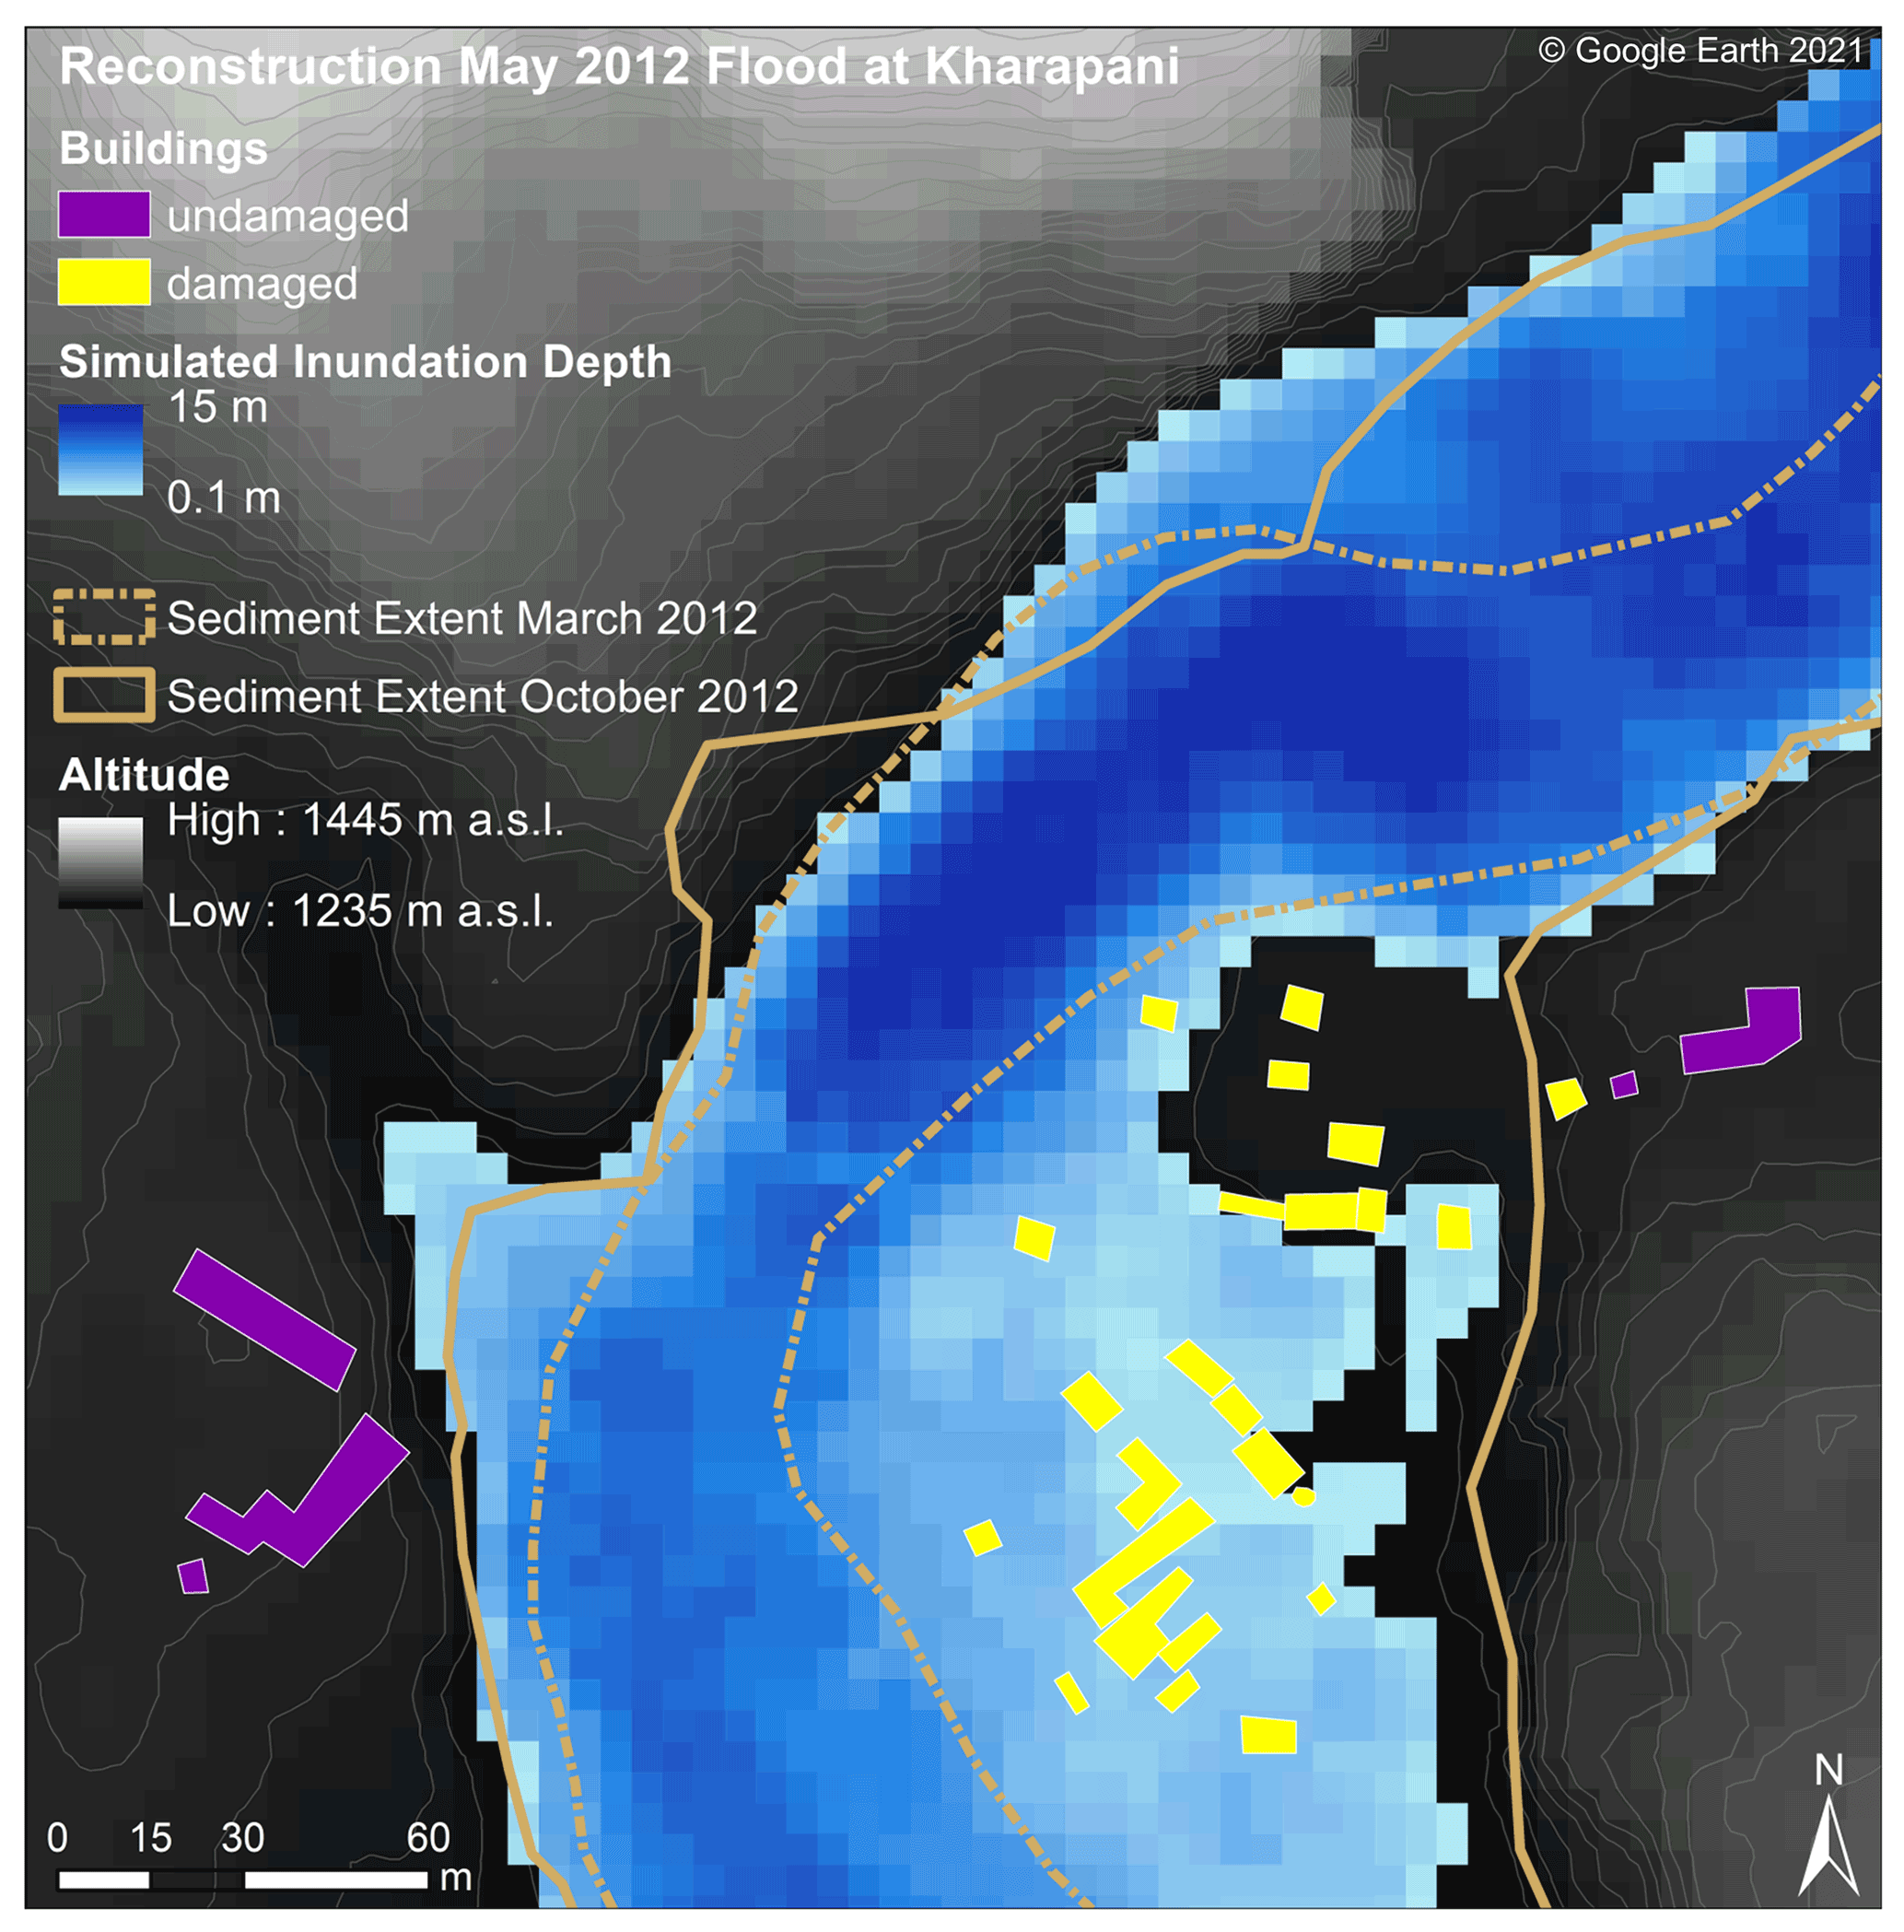
Figure 3Simulated flow depths of the May 2012 flood in the village of Kharapani for a flood peak of 3700 m3 s−1. Blue lines delimit patches of flood-derived sediment mapped from RapidEye imagery (October 2012). Building damage is based on comparing Google Earth imagery of December 2011 and June 2012. Displayed on top of the AW3D DEM (© NTT DATA, RESTEC/© JAXA).
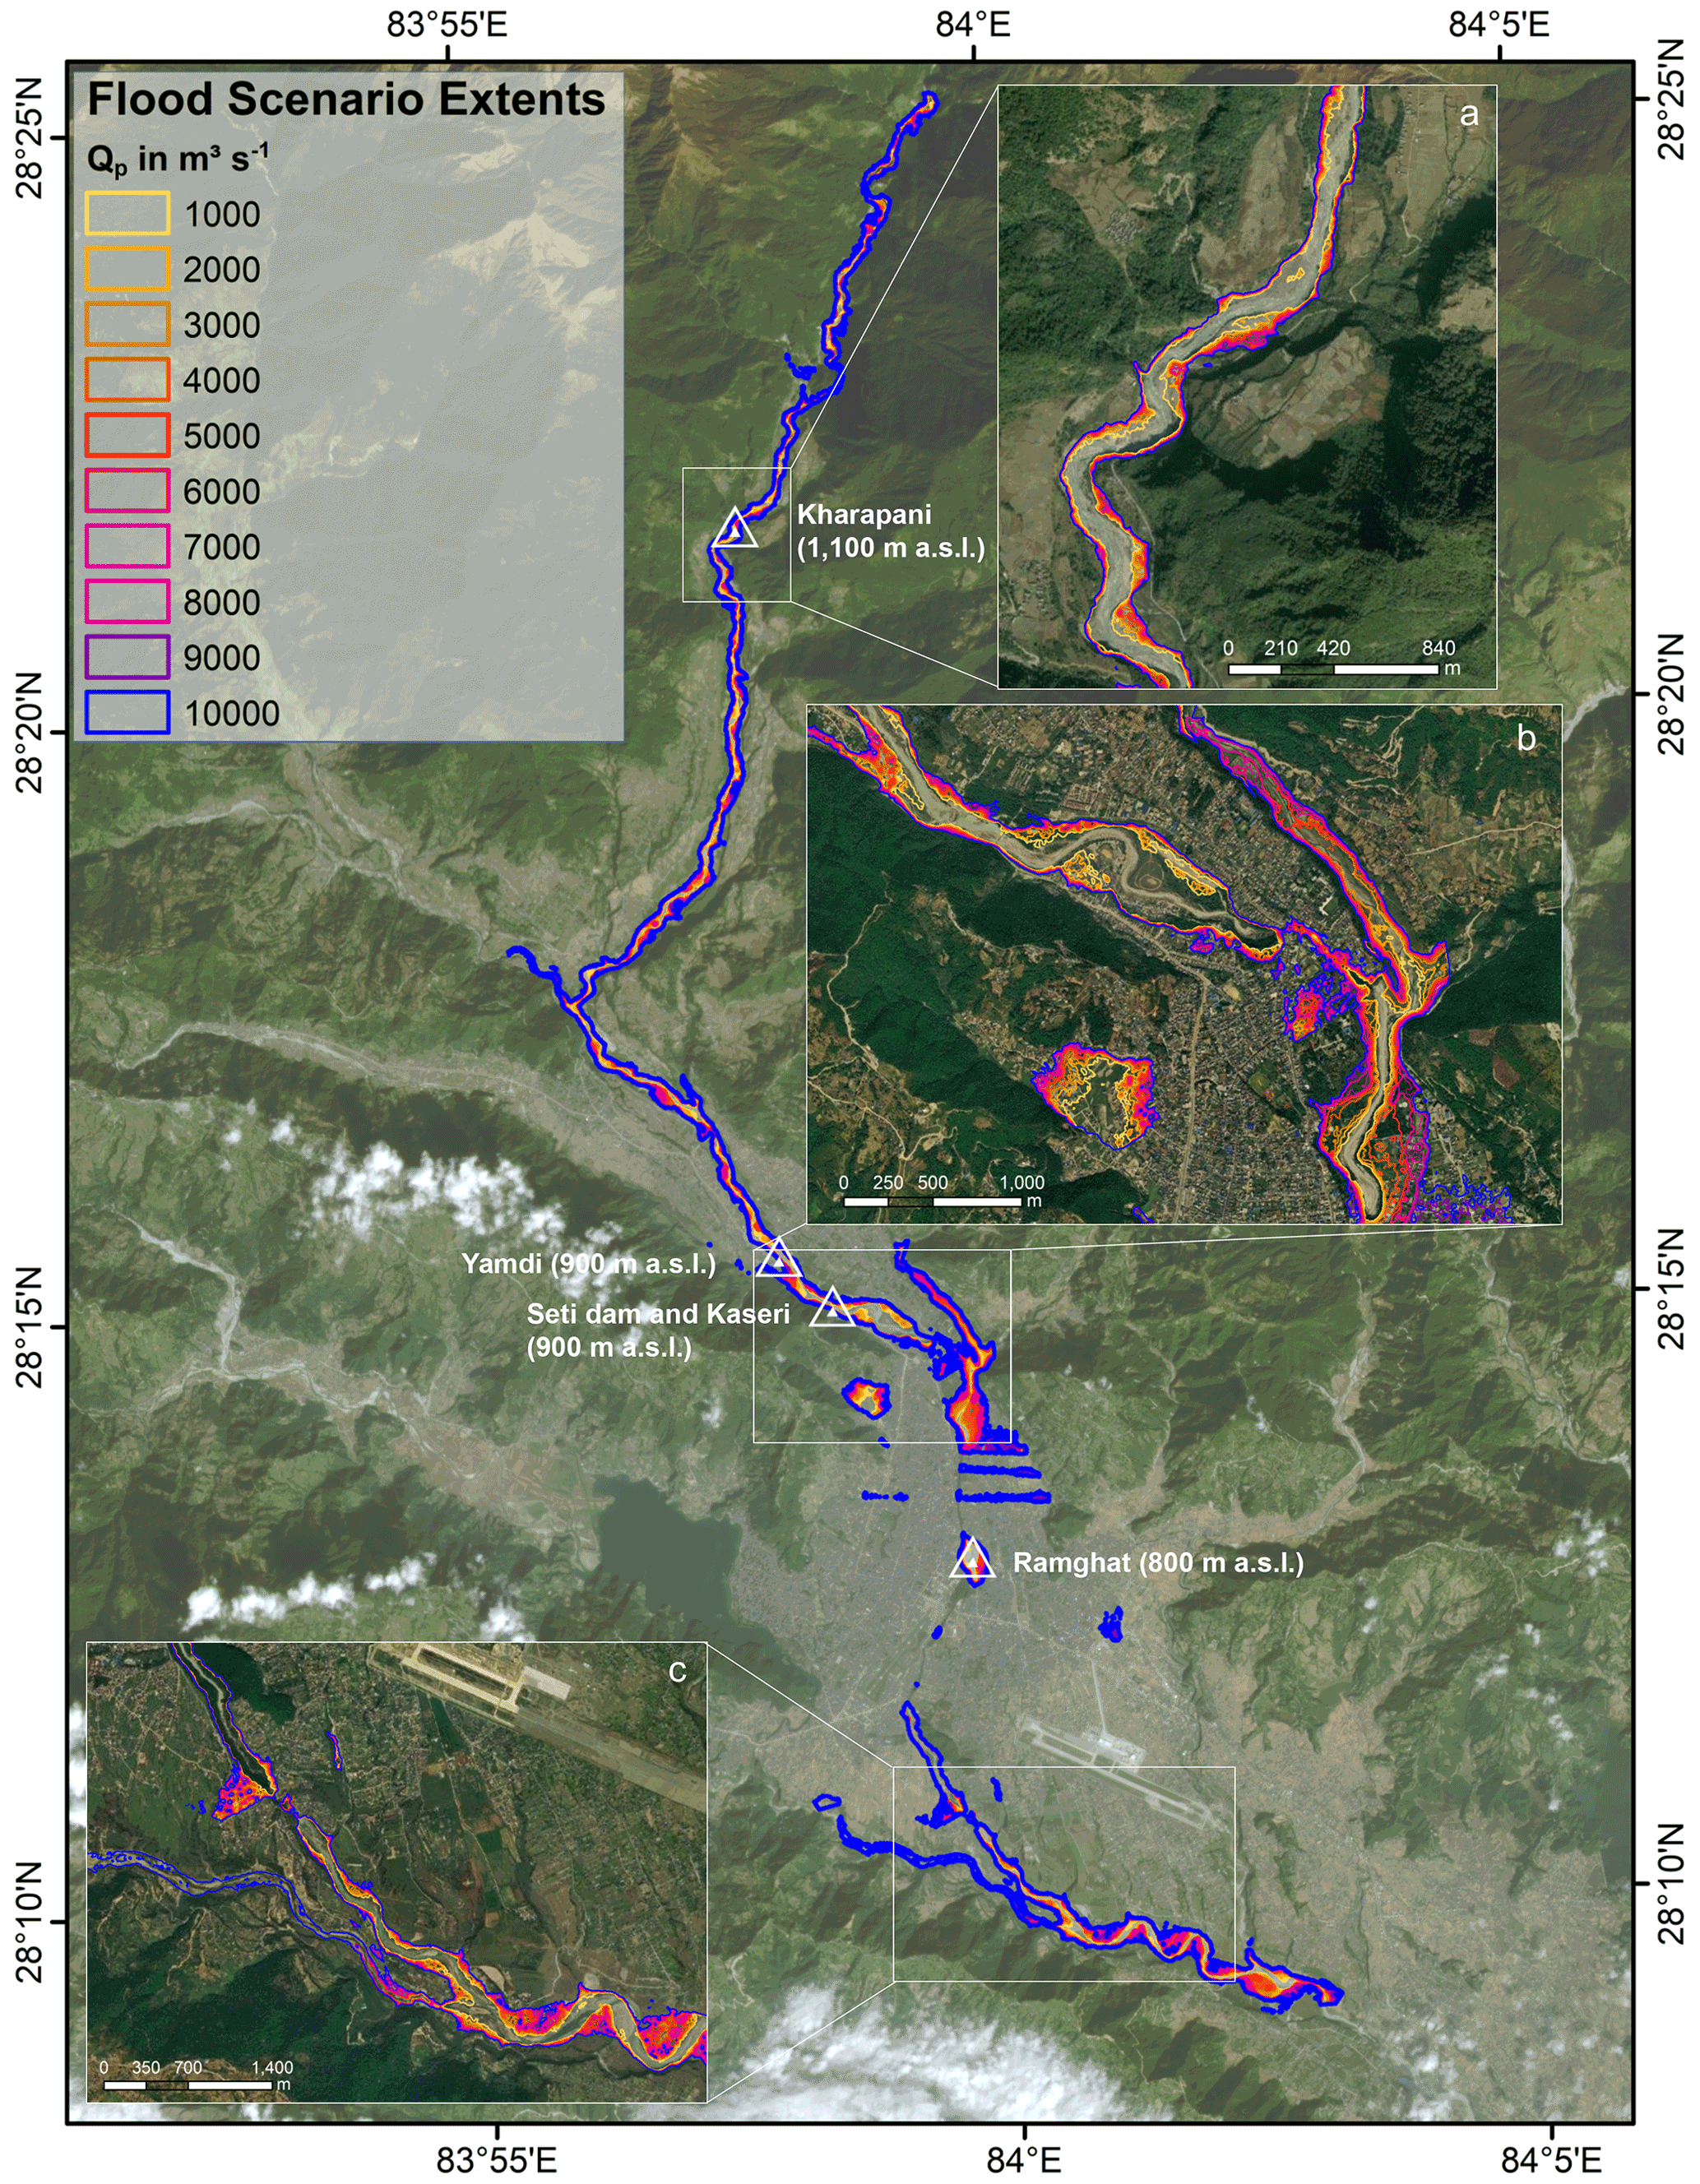
Figure 4Flood extents for HEC-RAS models of steady flow with Qp ranging from 1000 to 10 000 m3 s−1. Insets highlight results at Kharapani (a), Seti dam (b), and Phusre Khola confluence (c). Image: PlanetScope (acquisition date: 13 November 2021; Planet Team, 2017); inserts: ESRI basemap using Maxar imagery of 2020 (ESRI and Maxar Technologies, 2022).

Figure 5Simulated water levels at an informal settlement and gravel mining site at Yamdi (Fig. 4) for five selected Qp scenarios. Buildings on overbank areas would be inundated in all modelled scenarios. Groynes and gravel heaps (in foreground) aid the detection of gravel mining activities from optical satellite images.
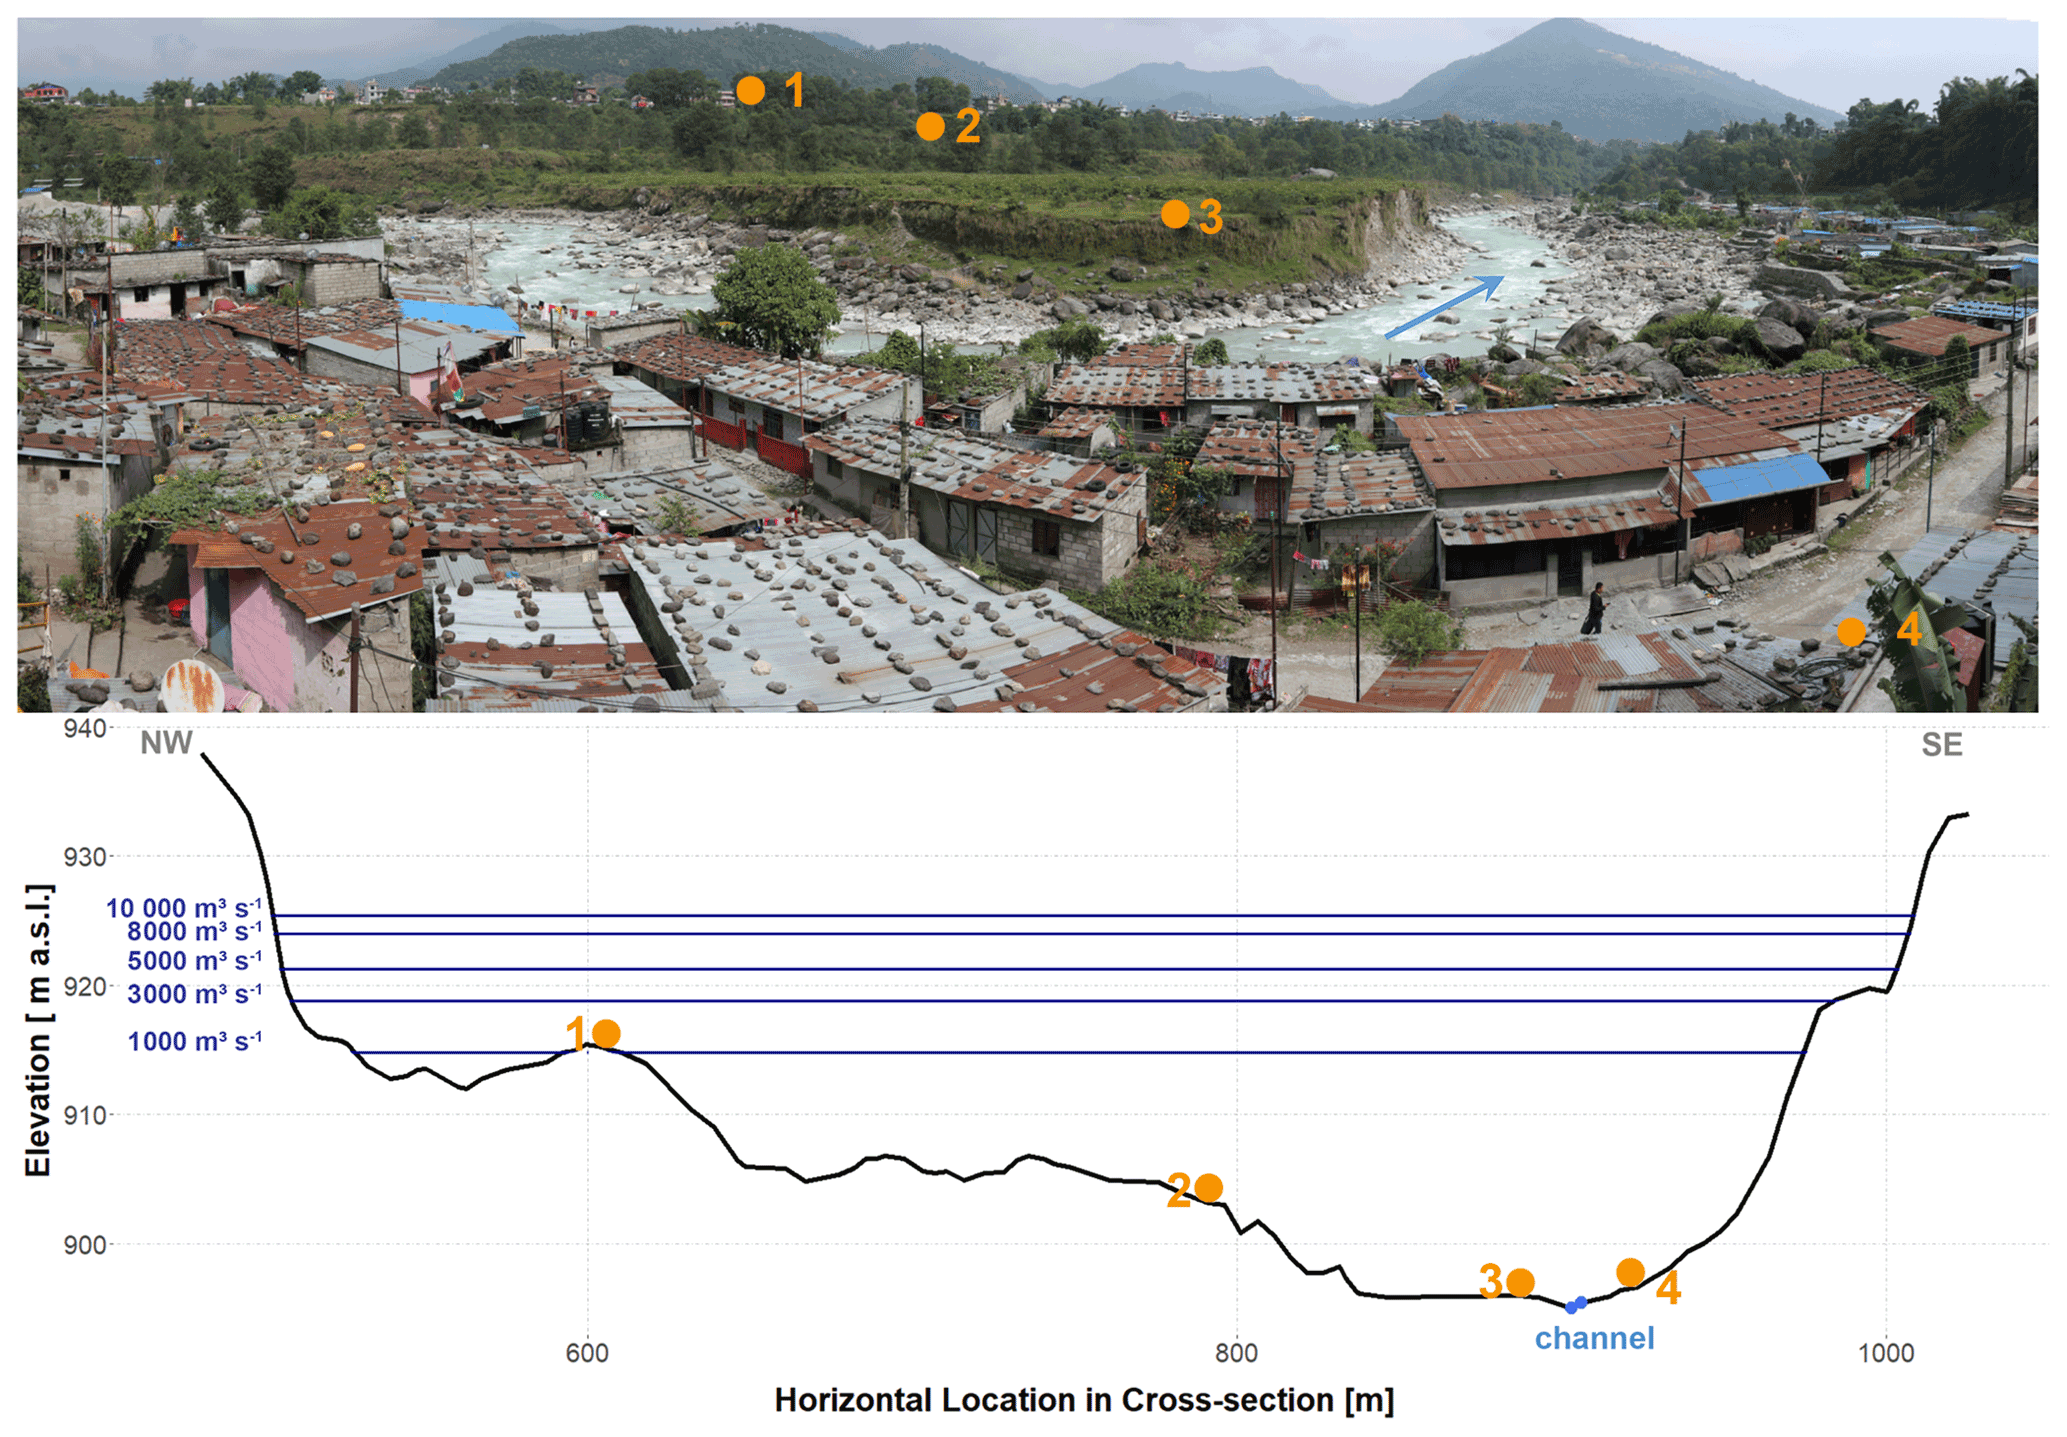
Figure 6Simulated water levels at the Kaseri informal settlement (Fig. 4) for five Qp scenarios. View from the edge of the settlement's core, which formed in the 1980s on a low terrace (Gurung et al., 2021), onto newer houses built close to the active channel bed of the Seti Khola.
Our scenario-based simulations reveal a spatially variable downstream pattern of potentially inundated areas along the Seti Khola (Fig. 4). In the uppermost reach north of the Mardi Khola confluence, simulated flood extents are very similar for all scenarios but funnel out further downstream, where the May 2012 flood deposited gravel sheets. Gravel bars near or below Kharapani are currently exploited for gravel mining and likely to be flooded in all scenarios; local flow depth is as much as 14 m for peak discharge Qp of 10 000 m3 s−1 (Fig. 4).
Between the Mardi Khola and Kali Khola confluences (Fig. 1), inundation would largely affect a number of informal settlements and infrastructure as well as the Seti dam, given that the lowermost river terrace would be extensively flooded for Qp>3000 m3 s−1. One of these informal settlements at Yamdi would be inundated in all scenarios (Fig. 5), together with a major road connecting Pokhara with north-western Nepal. For another informal settlement at Kaseri, all flood scenarios indicate extensive flooding with a mean flow depth of 23 m and a mean flow velocity of 1.3 m s−1 for Qp=10 000 m3 s−1 (Fig. 6).
Further downstream, Ramghat is another informal settlement and also a site of religious importance that could be affected by up to 32 m deep flows in the Qp=10 000 m3 s−1 scenario. Floodwater levels could reach the edge of the uppermost terrace if Qp>7000 m3 s−1 and thus affect the surrounding dense urban areas (Fig. 4).
The less confined, meandering channel downstream of the Phusre Khola confluence has the largest variations in inundation areas in the Pokhara Valley, and point bars mined for gravel or used for crop production are likely to be flooded at Qp>6000 m3 s−1. We observe pronounced backwater flooding in at least three tributaries of the Seti Khola in all Qp scenarios, likely inundating the lowest reaches of these tributaries for several hundred metres for Qp>6000 m3 s−1 (Fig. 4). Our results also show a patch of inundation in central Pokhara, some 1.5 km away from the Seti Khola and close to the Phirke Khola tributary (Fig. 4).
4.2 Potential future flood impacts
In 2020, 41 % of the study area was covered by developed land, while mixed forest covered 27 % mostly in the northern and southern parts (Fig. 7). Our simulations indicate that grassland, forests, and barren classes (including heavily mined gravel bars) would be flooded widely in all Qp scenarios (Table 2 and Fig. 8). Some 0.5 km2, or 2.3 %, of the total crop area could be submerged for Qp=10 000 m3 s−1. Of all developed LC classes, 0.3 km2, or 0.6 %, would be affected by a peak discharge Qp of 1000 m3 s−1, compared to 2.8 % (1.5 km2) for a peak discharge 10 times higher. Areas with a low level of development appear to be affected most extensively in all scenarios (Fig. 9). For the worst Qp scenario, some 0.6 km2 of area with both a low (2 %) and medium (4.1 %) level of development would be flooded, as opposed to 0.09 km2 (1 %) and 0.25 km2 (2.8 %) for the densest urban areas. Thus, most of the affected areas of the “developed – high” and “developed – open” classes are rated as hazard class 10 (Table 2 and Fig. 9). Only airport areas seem completely devoid of flooding under the scenarios considered here.
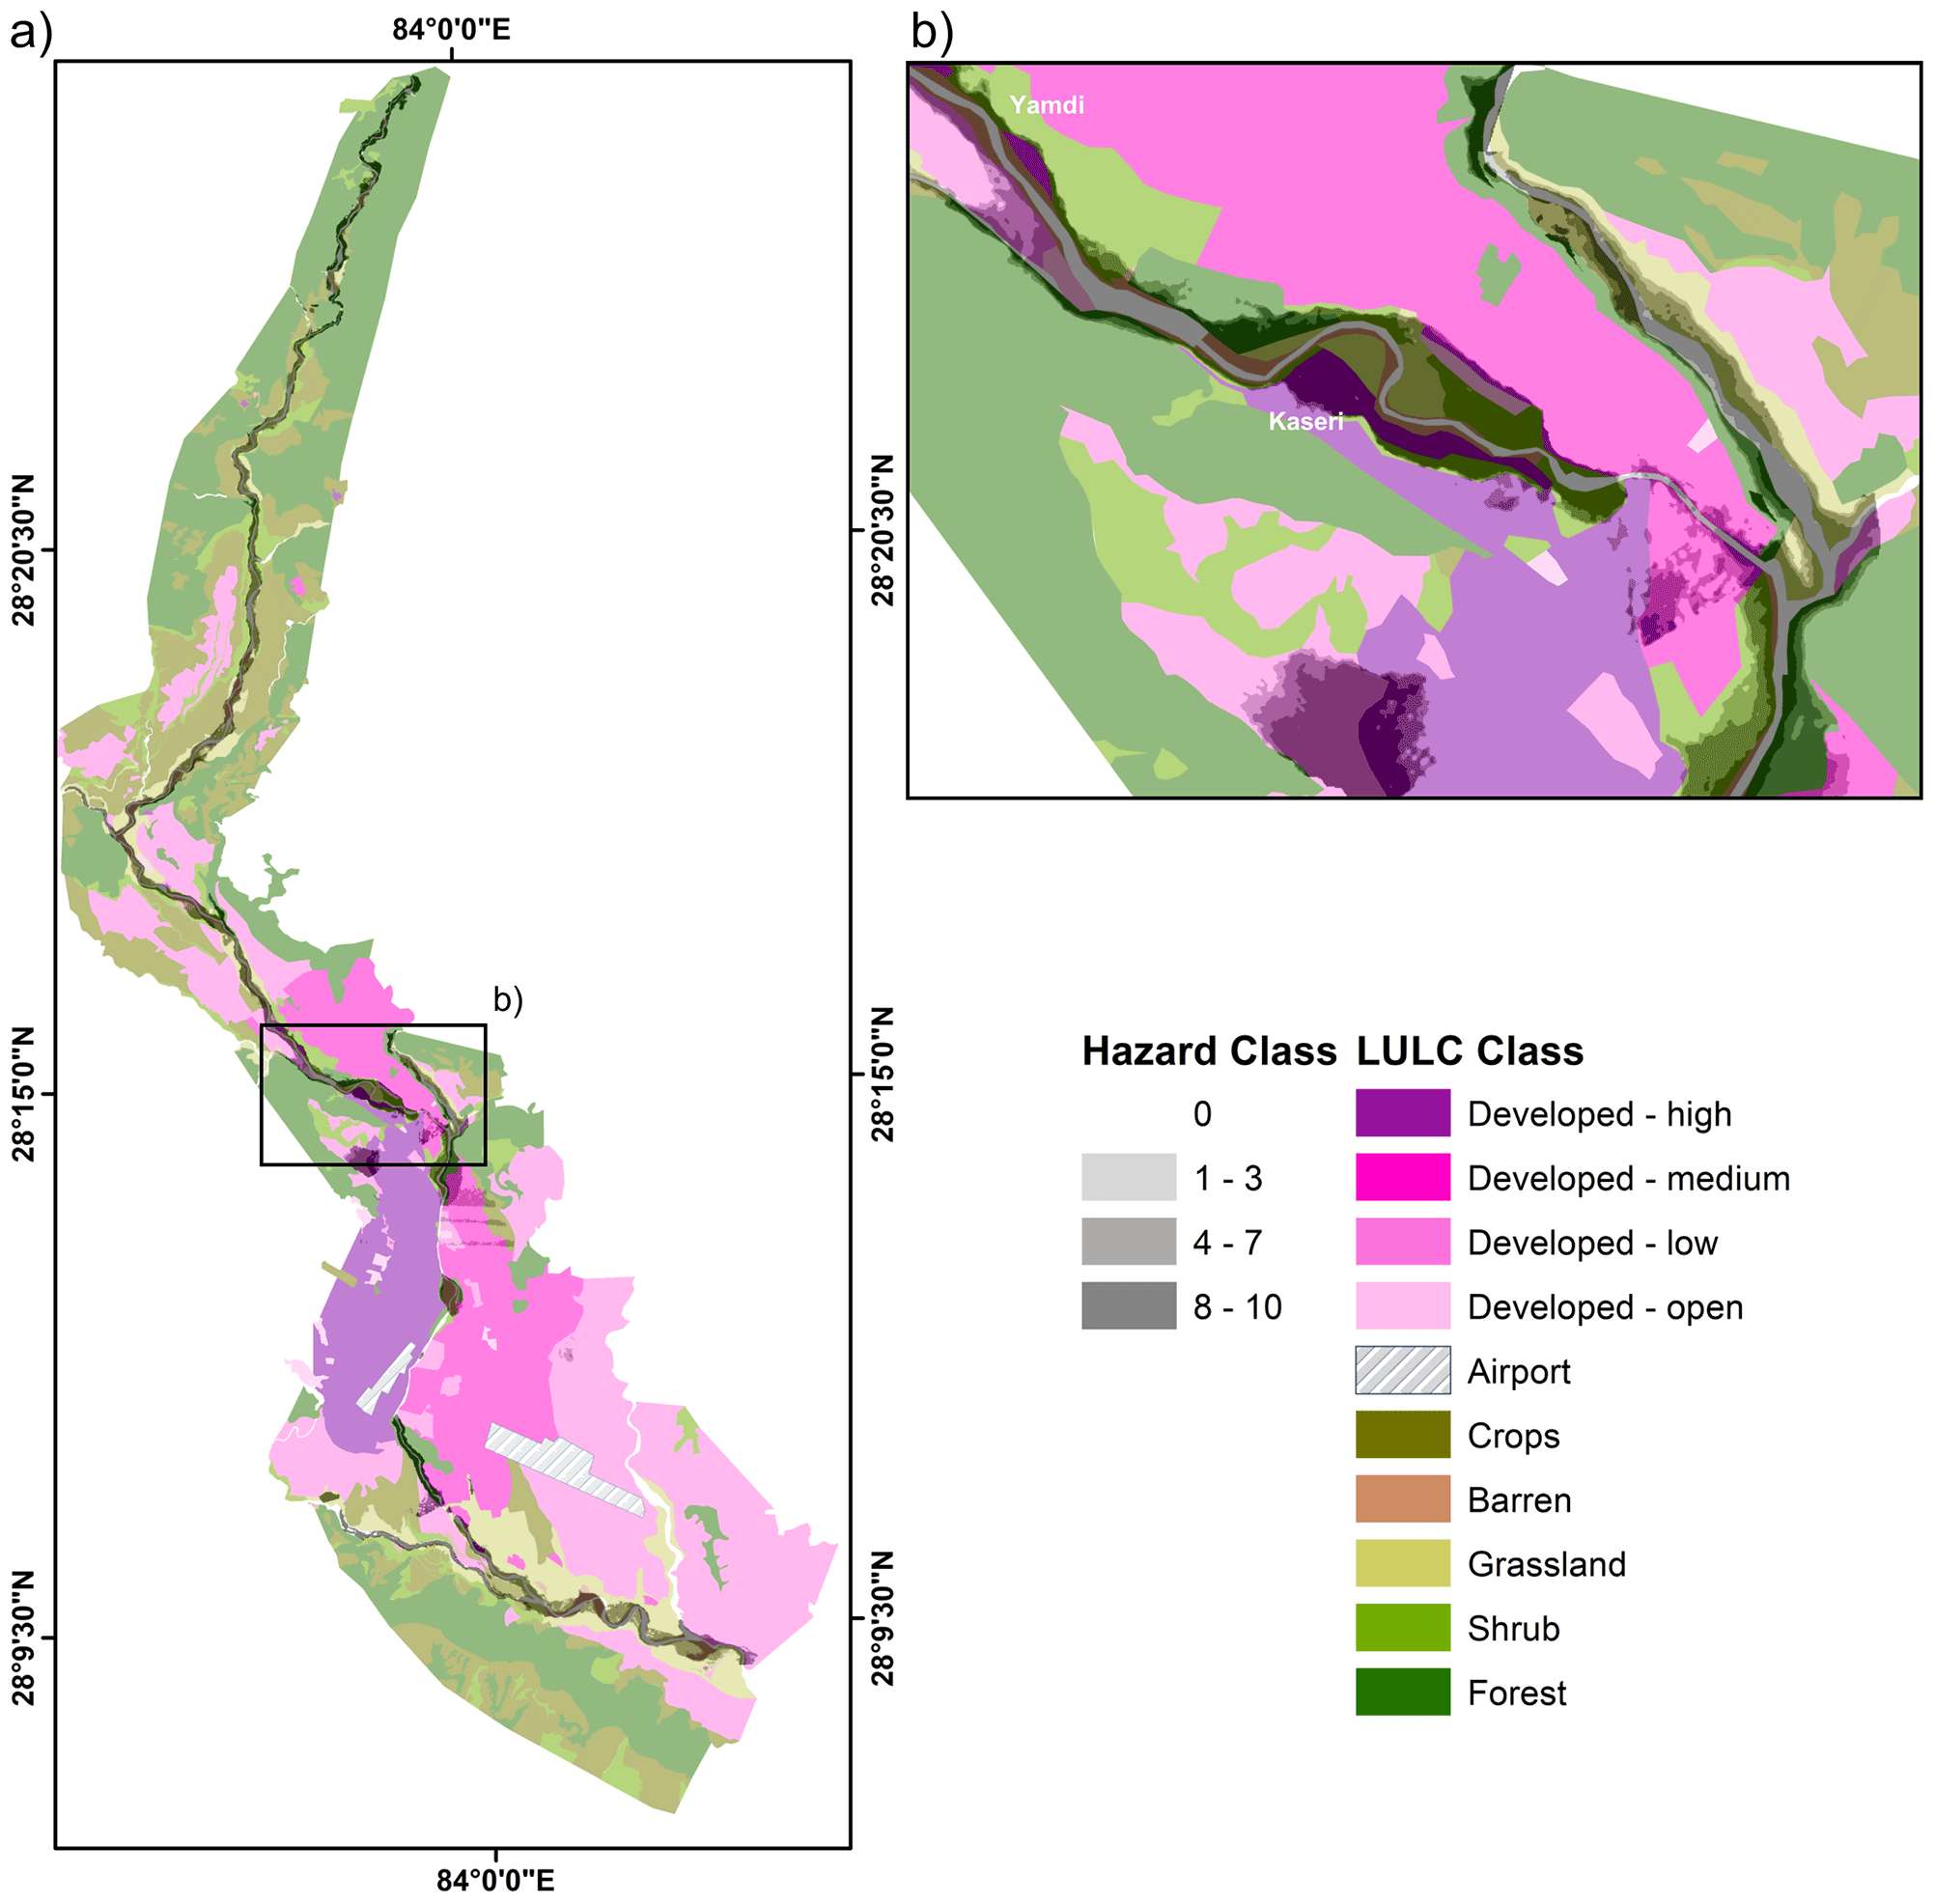
Figure 7LULC map with flood hazard classes (a). Panel (b) shows overlap of high hazard classes (HC 8–10) and densely populated areas (high to medium level of development) at Yamdi and Kaseri informal settlements. LULC classes mapped from 2020 ESRI basemap using Maxar imagery (ESRI and Maxar Technologies, 2022).
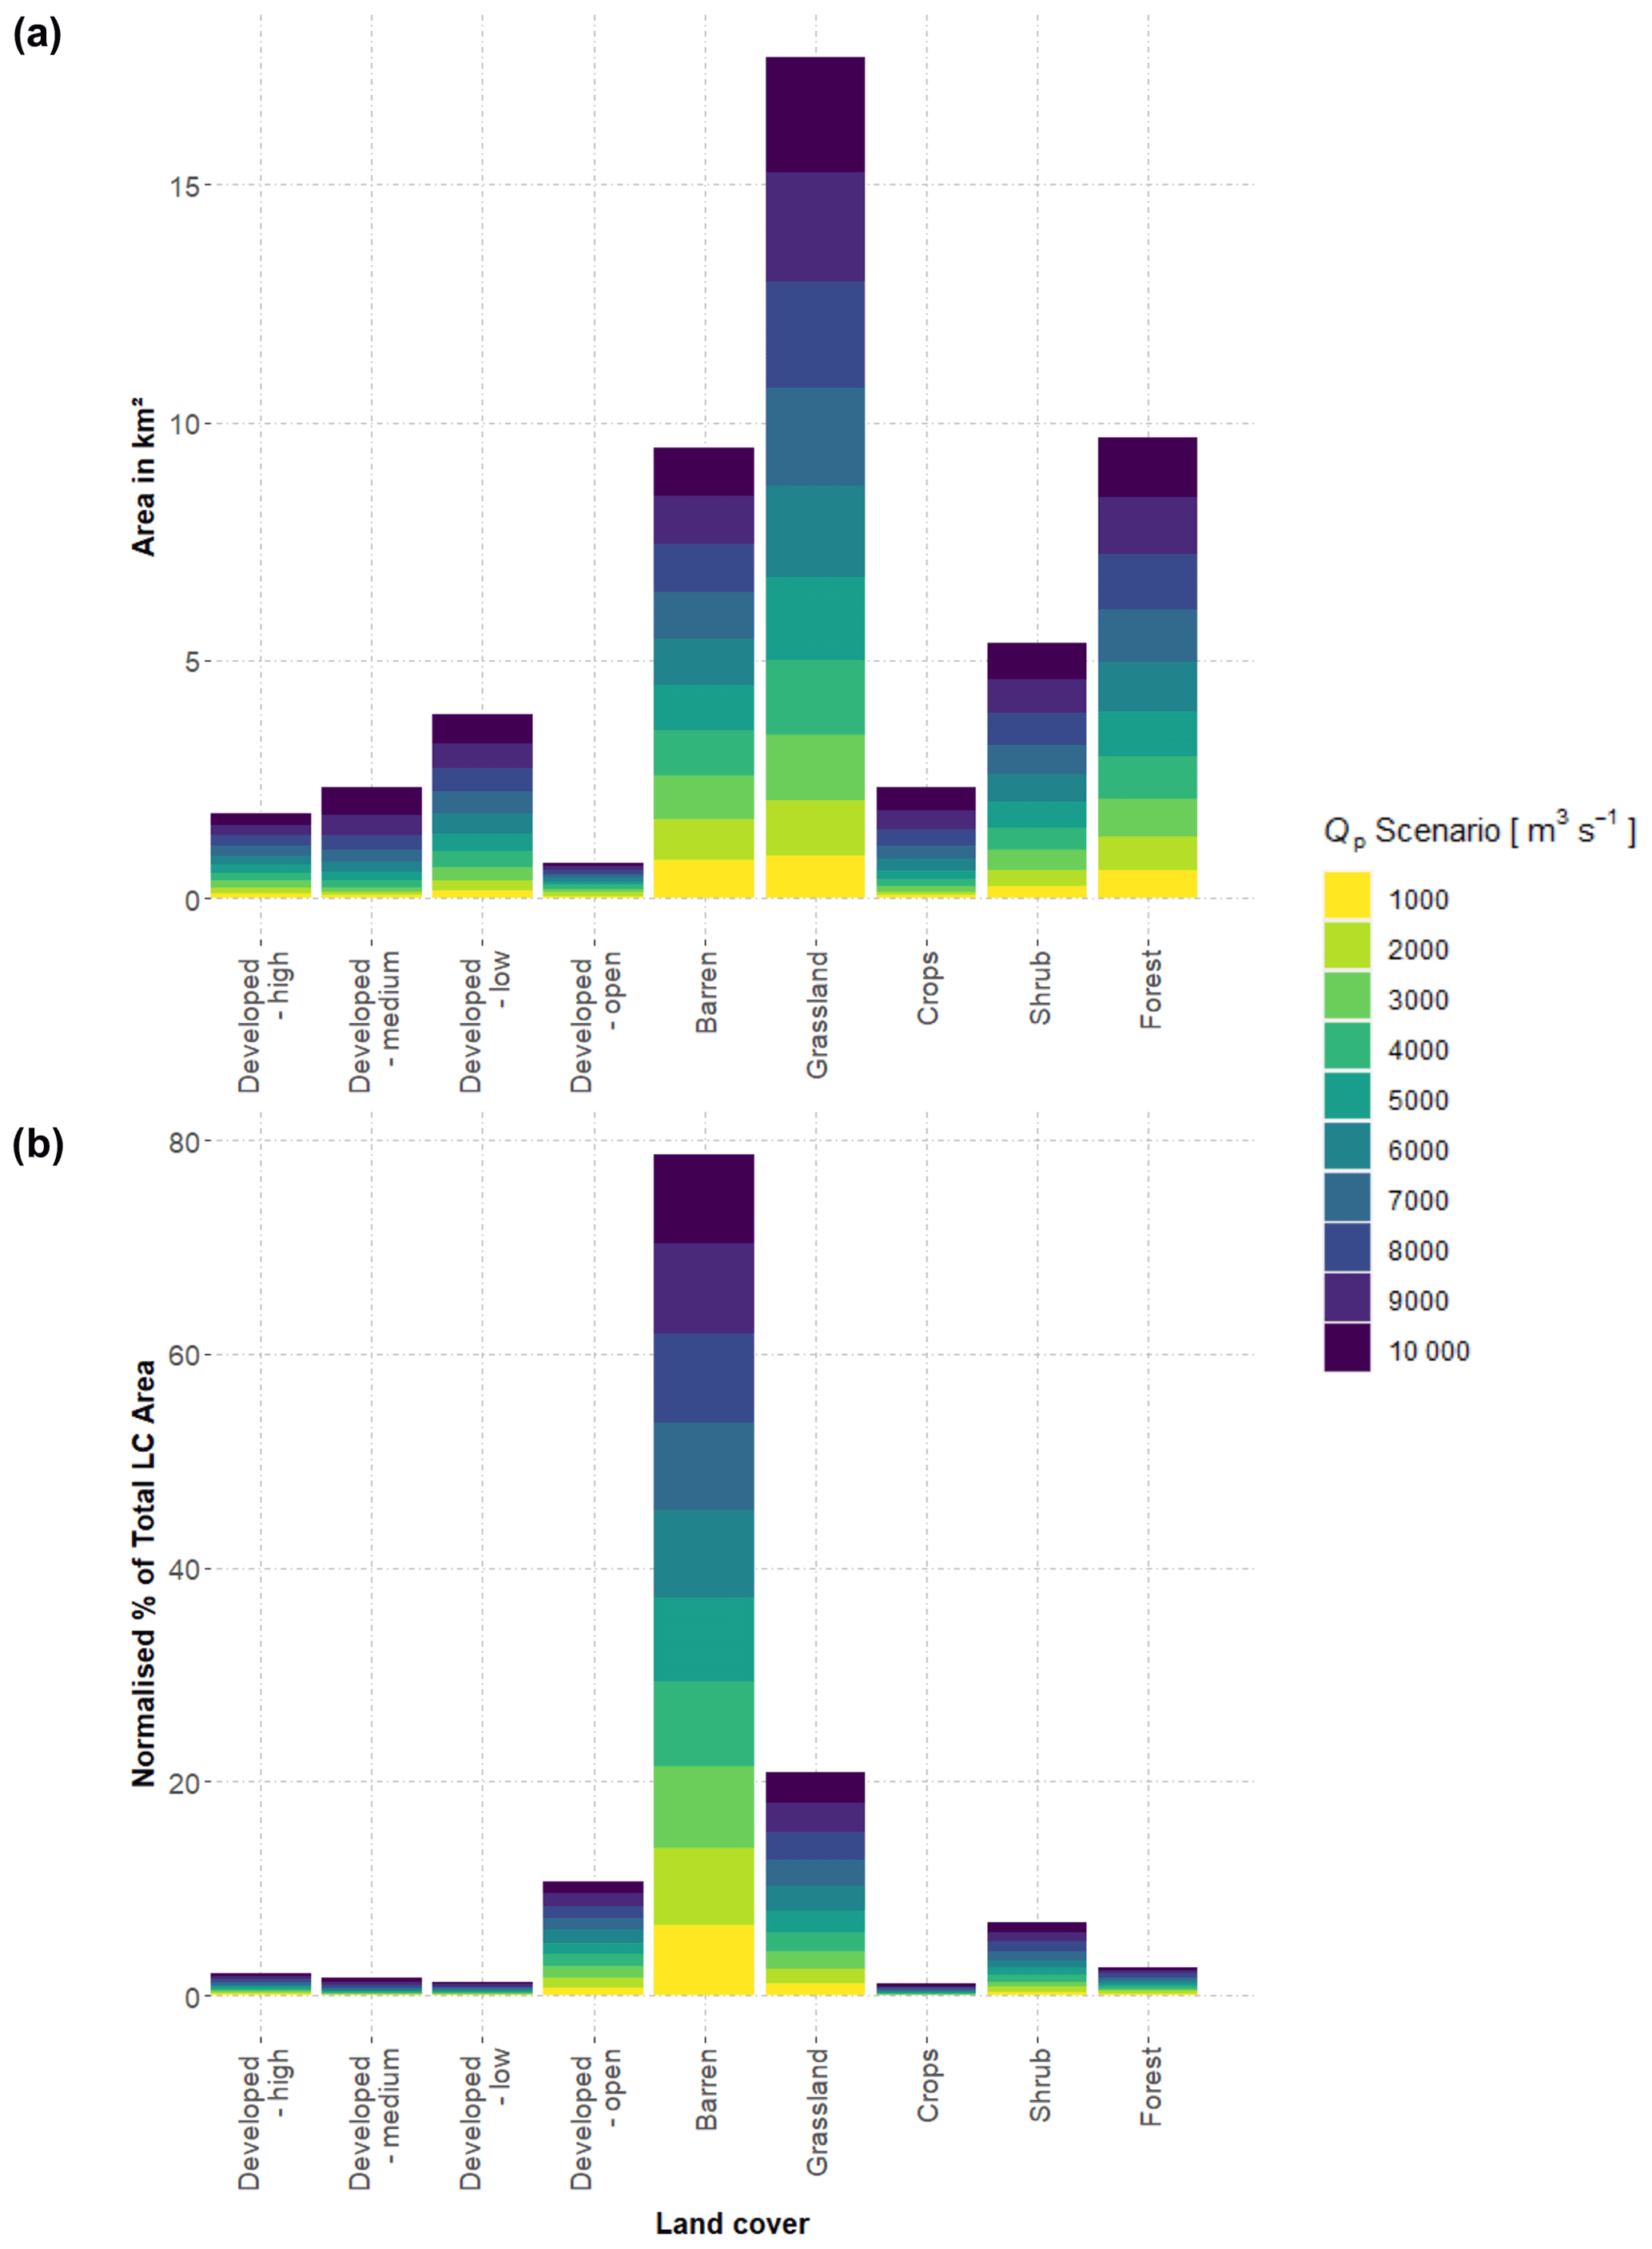
Figure 8Distribution of potentially flooded land cover (LC) classes in different Qp scenarios. (a) Area of LC class affected; (b) affected normalised percentage of total mapped LC class areas in our study area.
Table 2Hazard matrix listing the area (in hectares) of each LULC class located within the respective hazard class (HC).
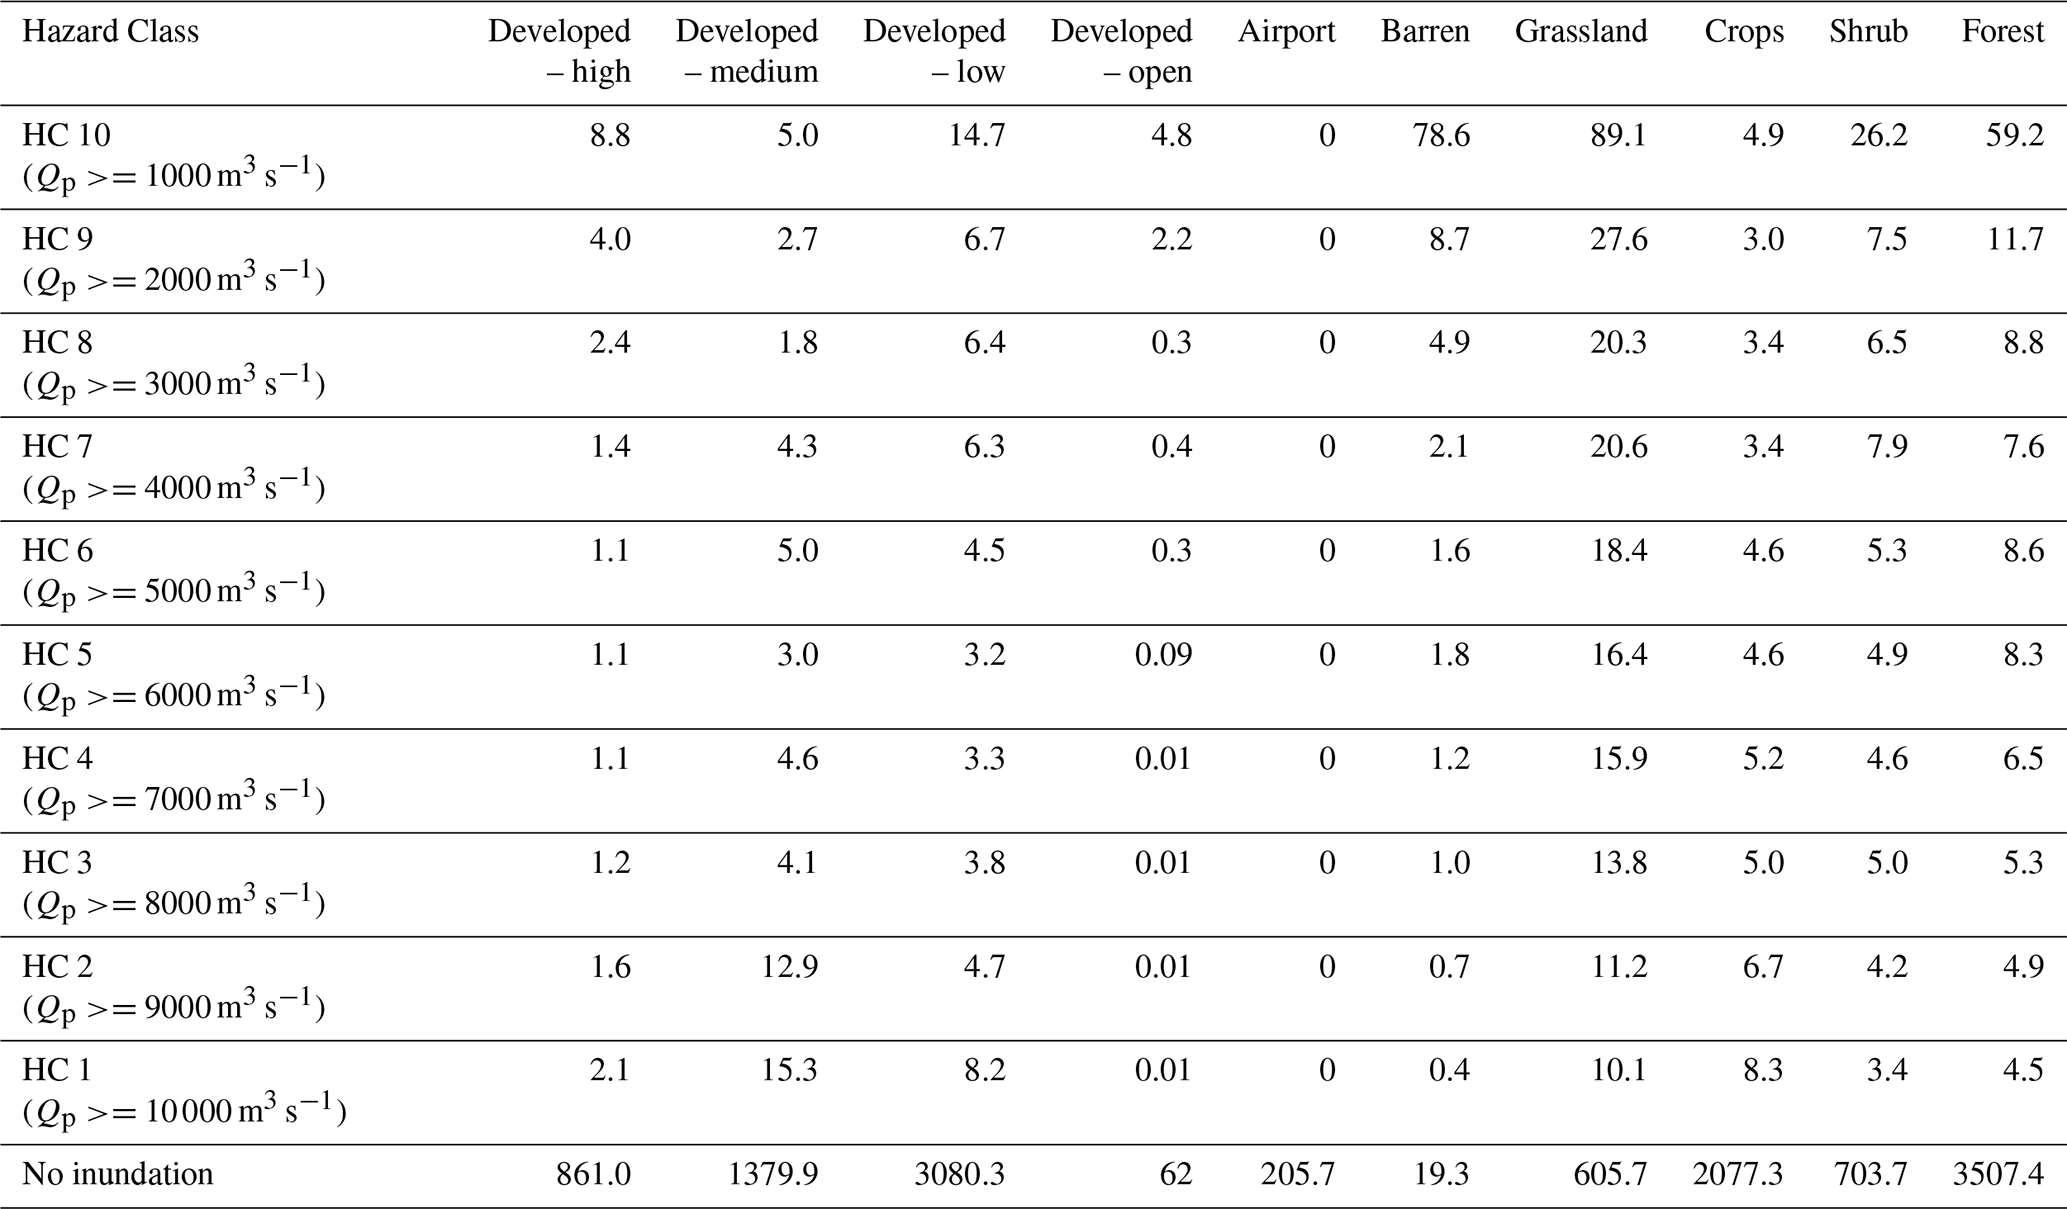
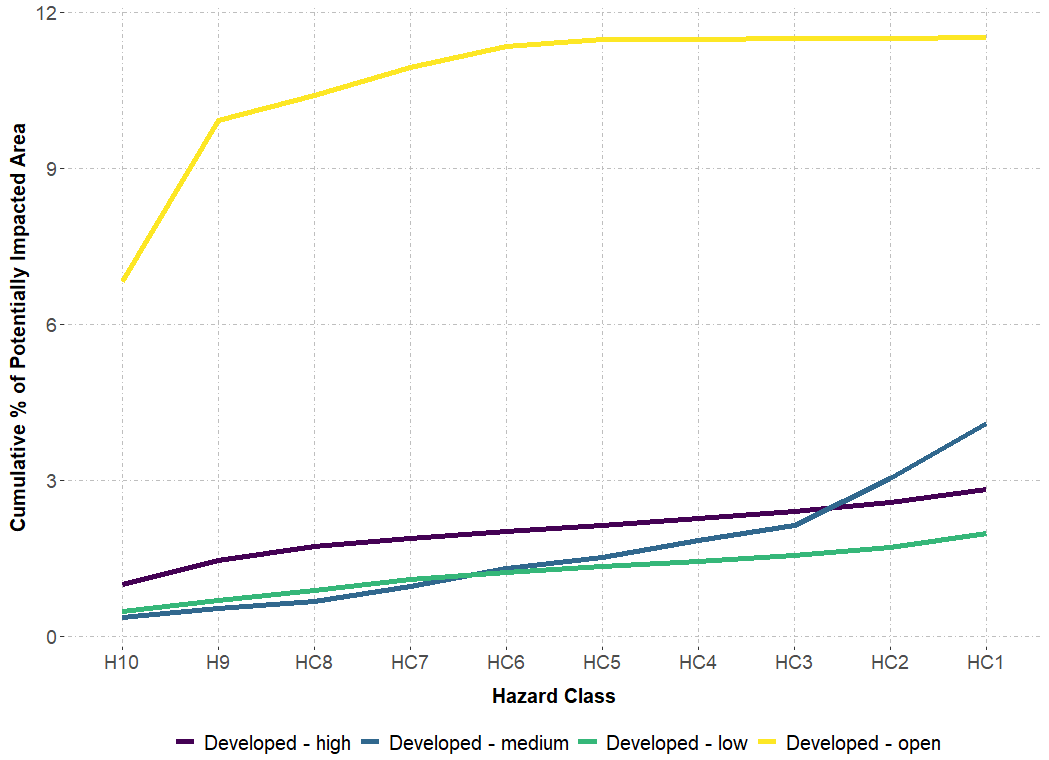
Figure 9Cumulative percentage of potentially flooded areas for each of the four developed LC classes.
Our analysis of the 2021 OSM route network shows that 4 % of its length is prone to flooding, with 0.7 % being in the highest hazard class, HC 10 (Table 3 and Fig. 10). Most roads and paths with HC >7 run along the upper Seti Khola, upstream of Kaseri.
Table 3Relative hazard classification of the Pokhara route network and buildings. Data from OpenStreetMap (OSMF, 2021; September 2021).

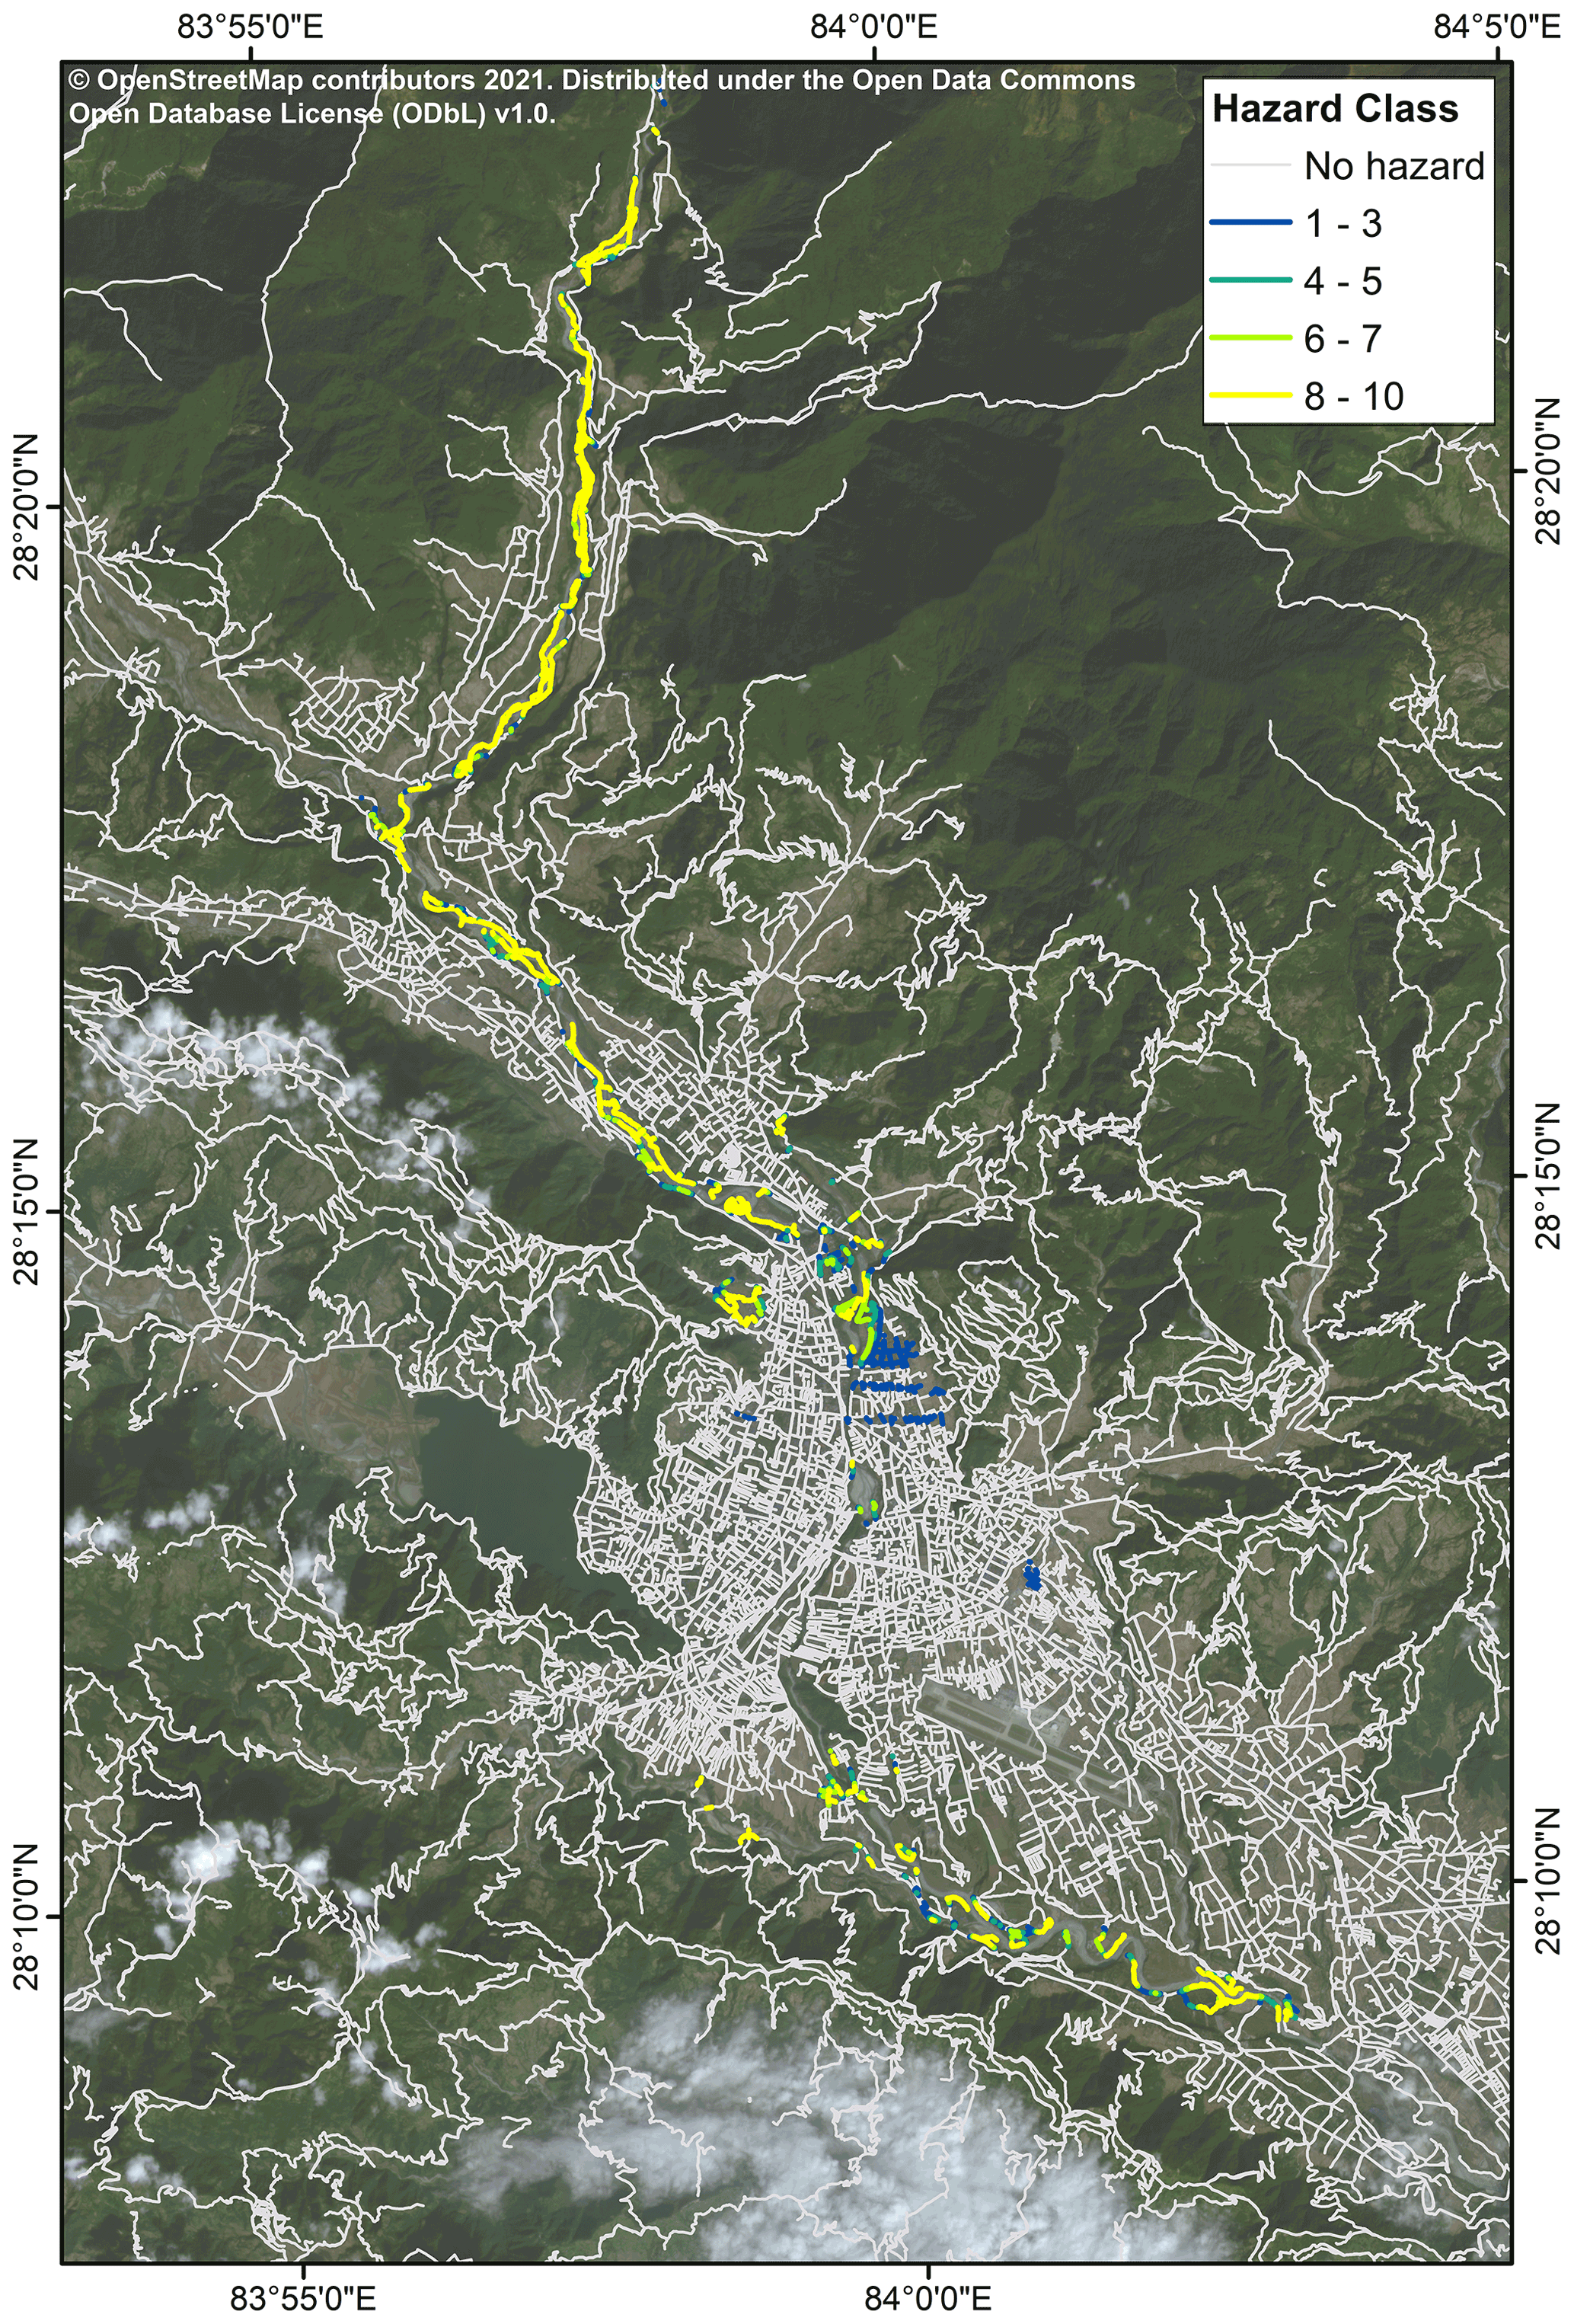
Figure 10Relative hazard classification of Pokhara's route network. Data from OpenStreetMap in September 2021 (OSMF, 2021) and draped on PlanetScope imagery (acquisition date: 13 November 2021; Planet Team, 2017).
As of September 2021, OSM users have mapped a total of 62 930 buildings in Pokhara, and 2.6 % of these buildings and 2.5 % of the total built-up area are prone to flooding scenarios (Table 3 and Fig. 11). A peak discharge of 10 000 m3 s−1 could affect 282 buildings (0.5 %), which translates to 0.3 % (0.02 km2) of the total built-up area falling into hazard class 10. Many of the buildings categorised into the higher hazard classes (HC >7) are in Pokhara's north-western urban areas, especially in the Yamdi and Kaseri settlements.
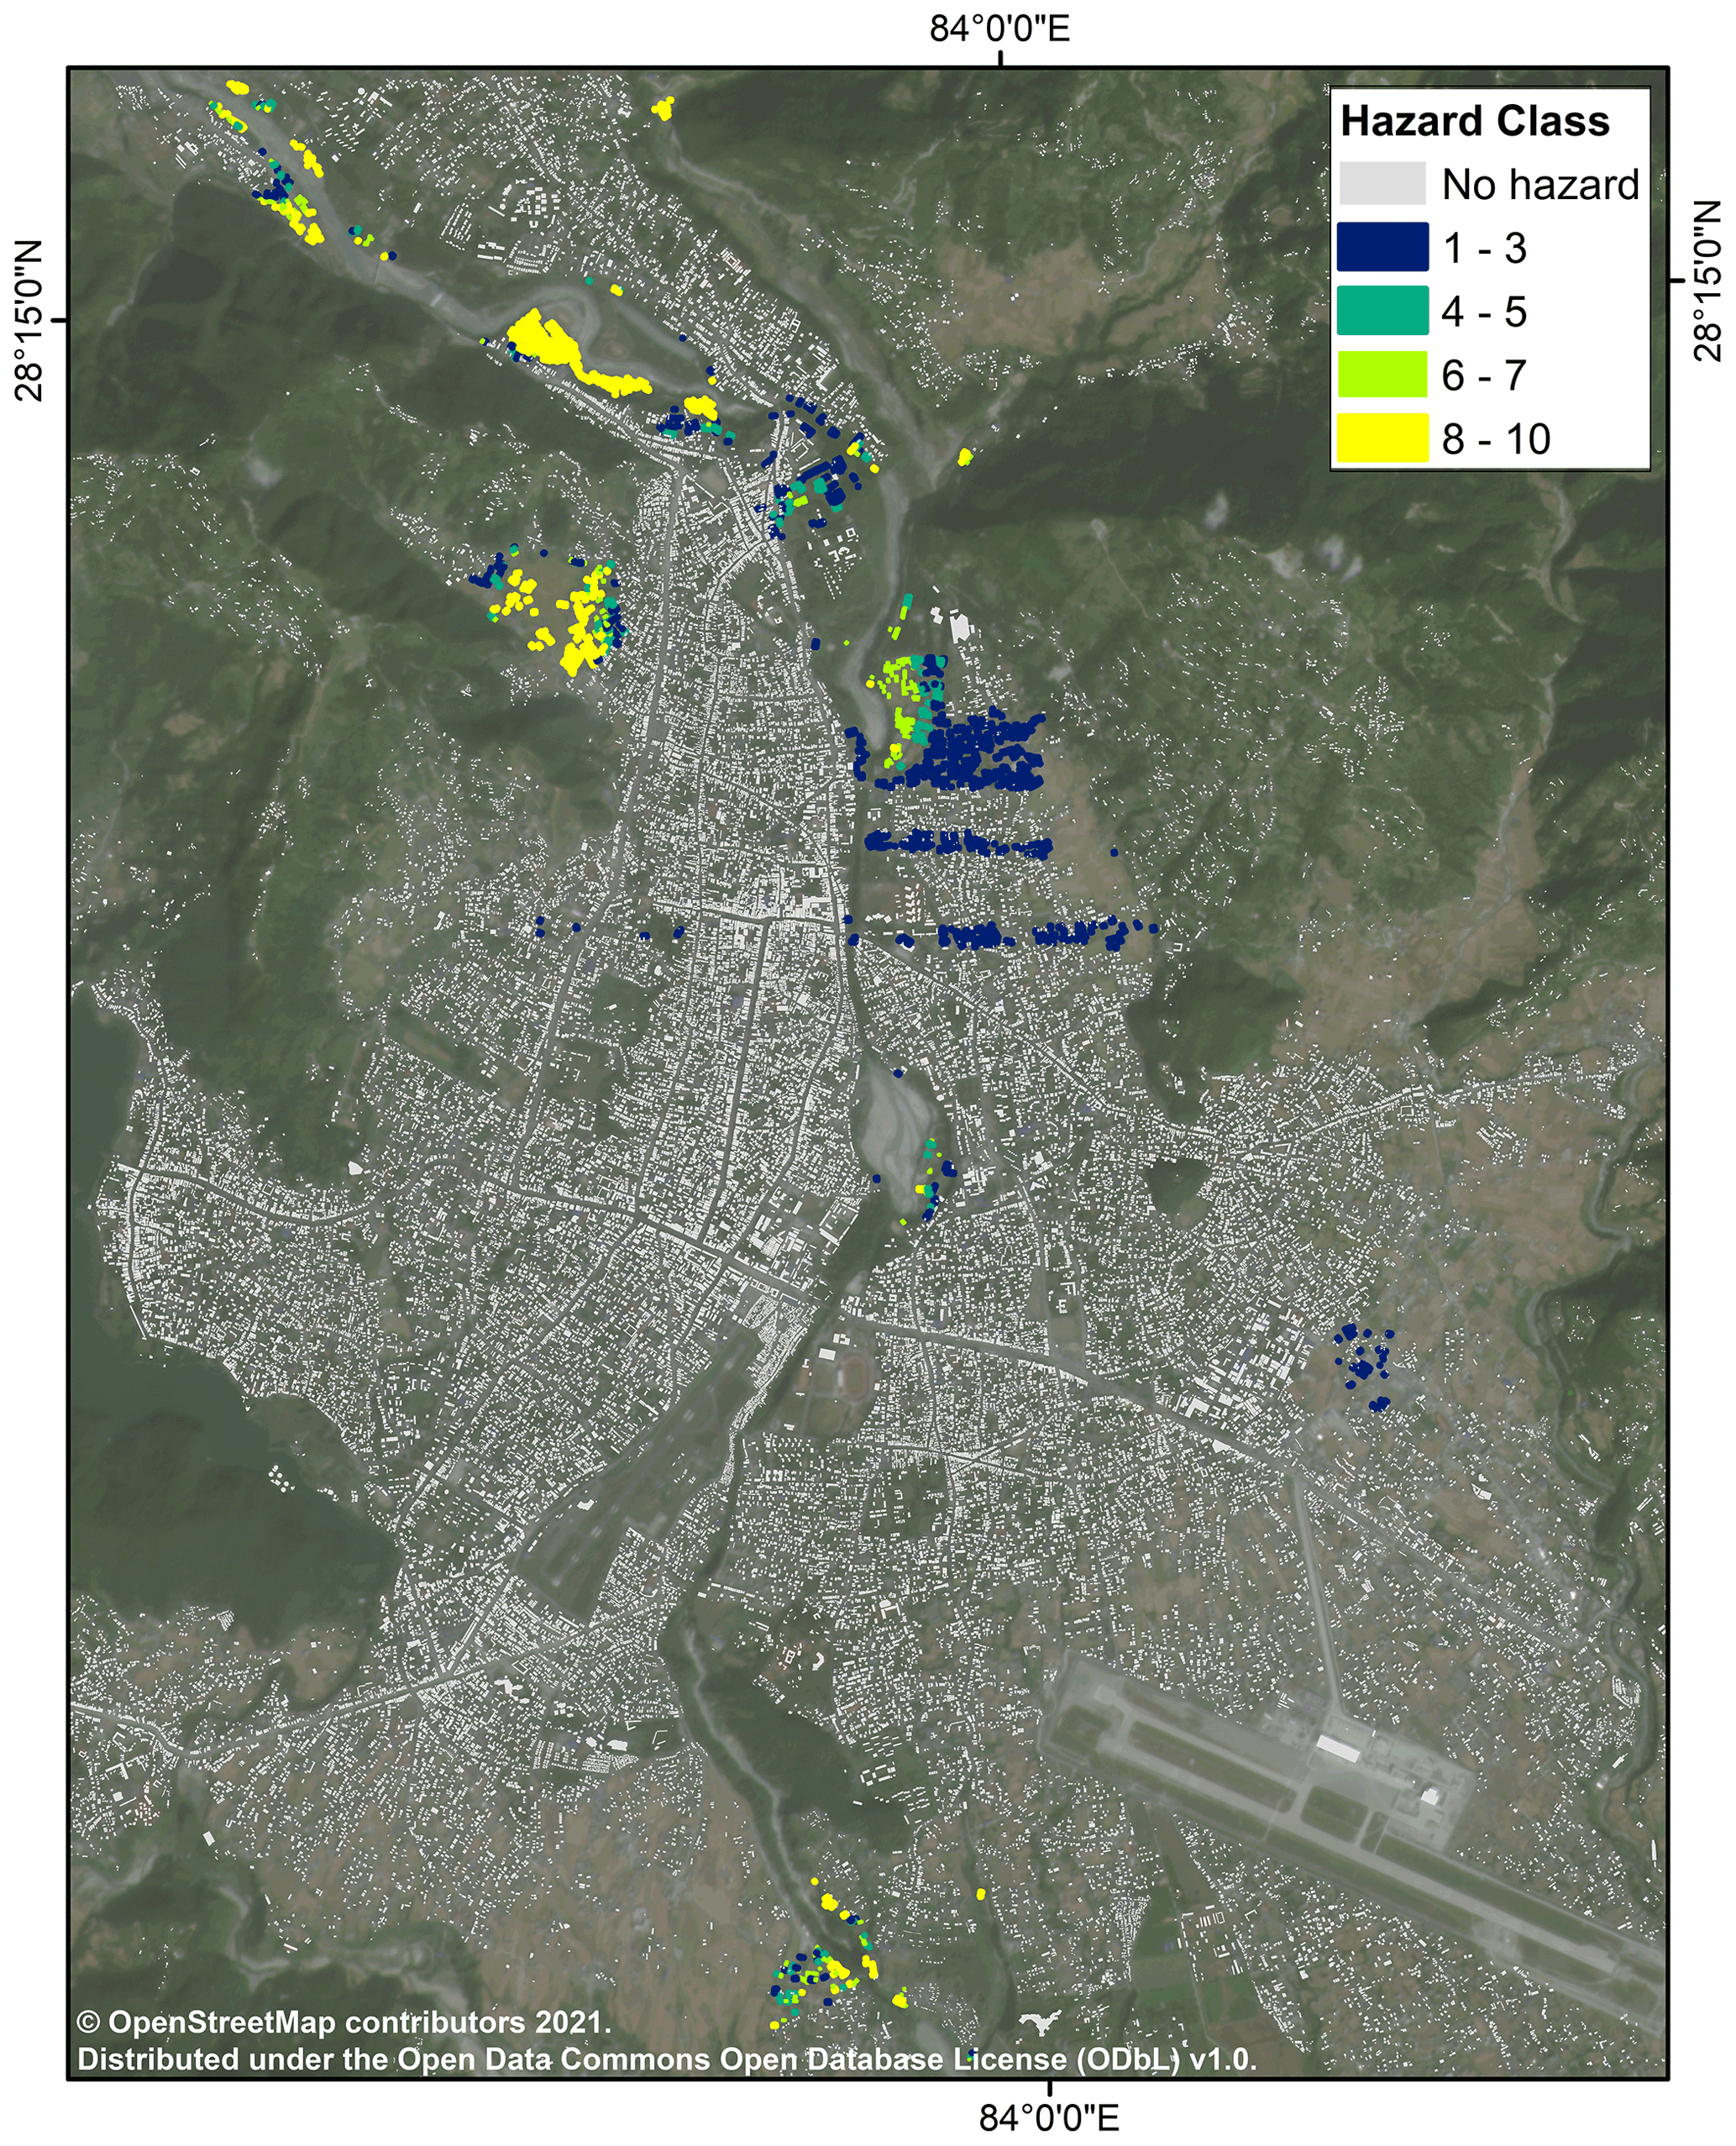
Figure 11Relative hazard classification of Pokhara's buildings. Data from OpenStreetMap (OSMF, 2021; September 2021) draped on PlanetScope imagery (acquisition date: 13 November 2021; Planet Team, 2017).
4.3 Informal settlement dynamics
The two informal settlements at Kaseri and Yamdi have developed rapidly since 2008 (Table 4 and Fig. 12). We find that Kaseri had expanded from a low terrace in 2008 towards the floodplain by 2012, thus more than doubling its built-up area. This growth continued until at least 2021, covering more than a fifth of the overbank area. The built-up area at Yamdi covered a much lower proportion of overbank area in 2008 (0.4 %). Yet, growth has been more rapid since then, and the built-up area more than tripled between 2008 and 2012 and increased by a factor of 6 from 2012 to 2021. Comparing November 2012 and November 2021, we also observed a significant expansion of sand and gravel mining in this particular reach.
Table 4Growth of built-up areas of informal settlements at Kaseri and Yamdi, Pokhara, 2008–2021.
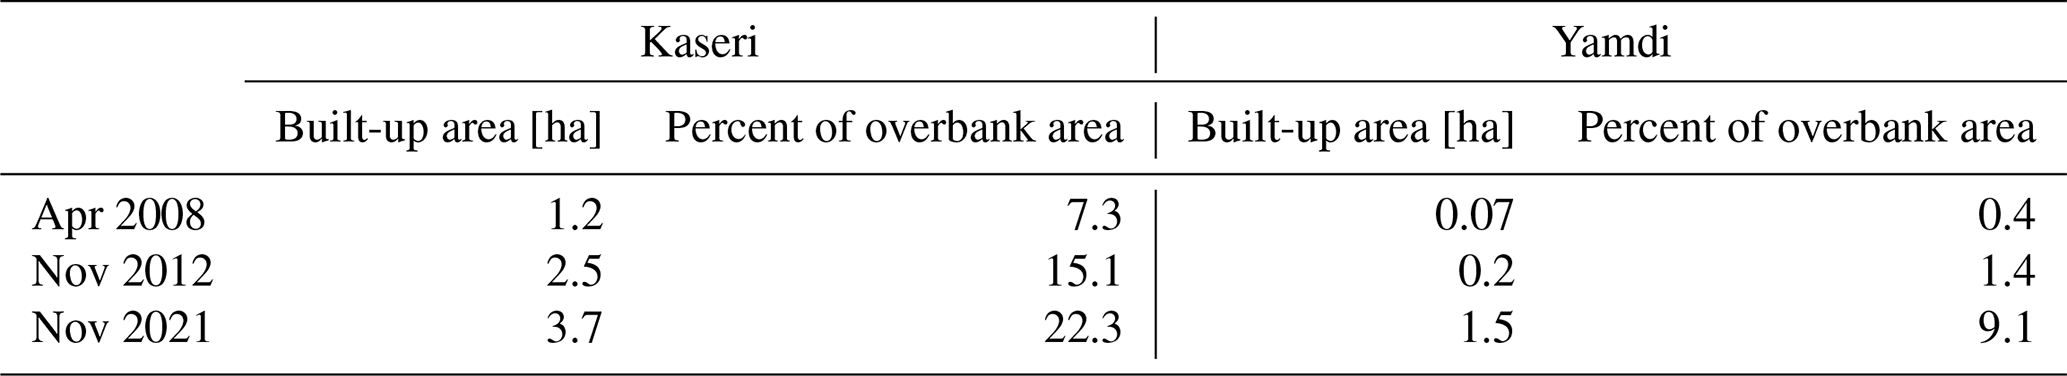
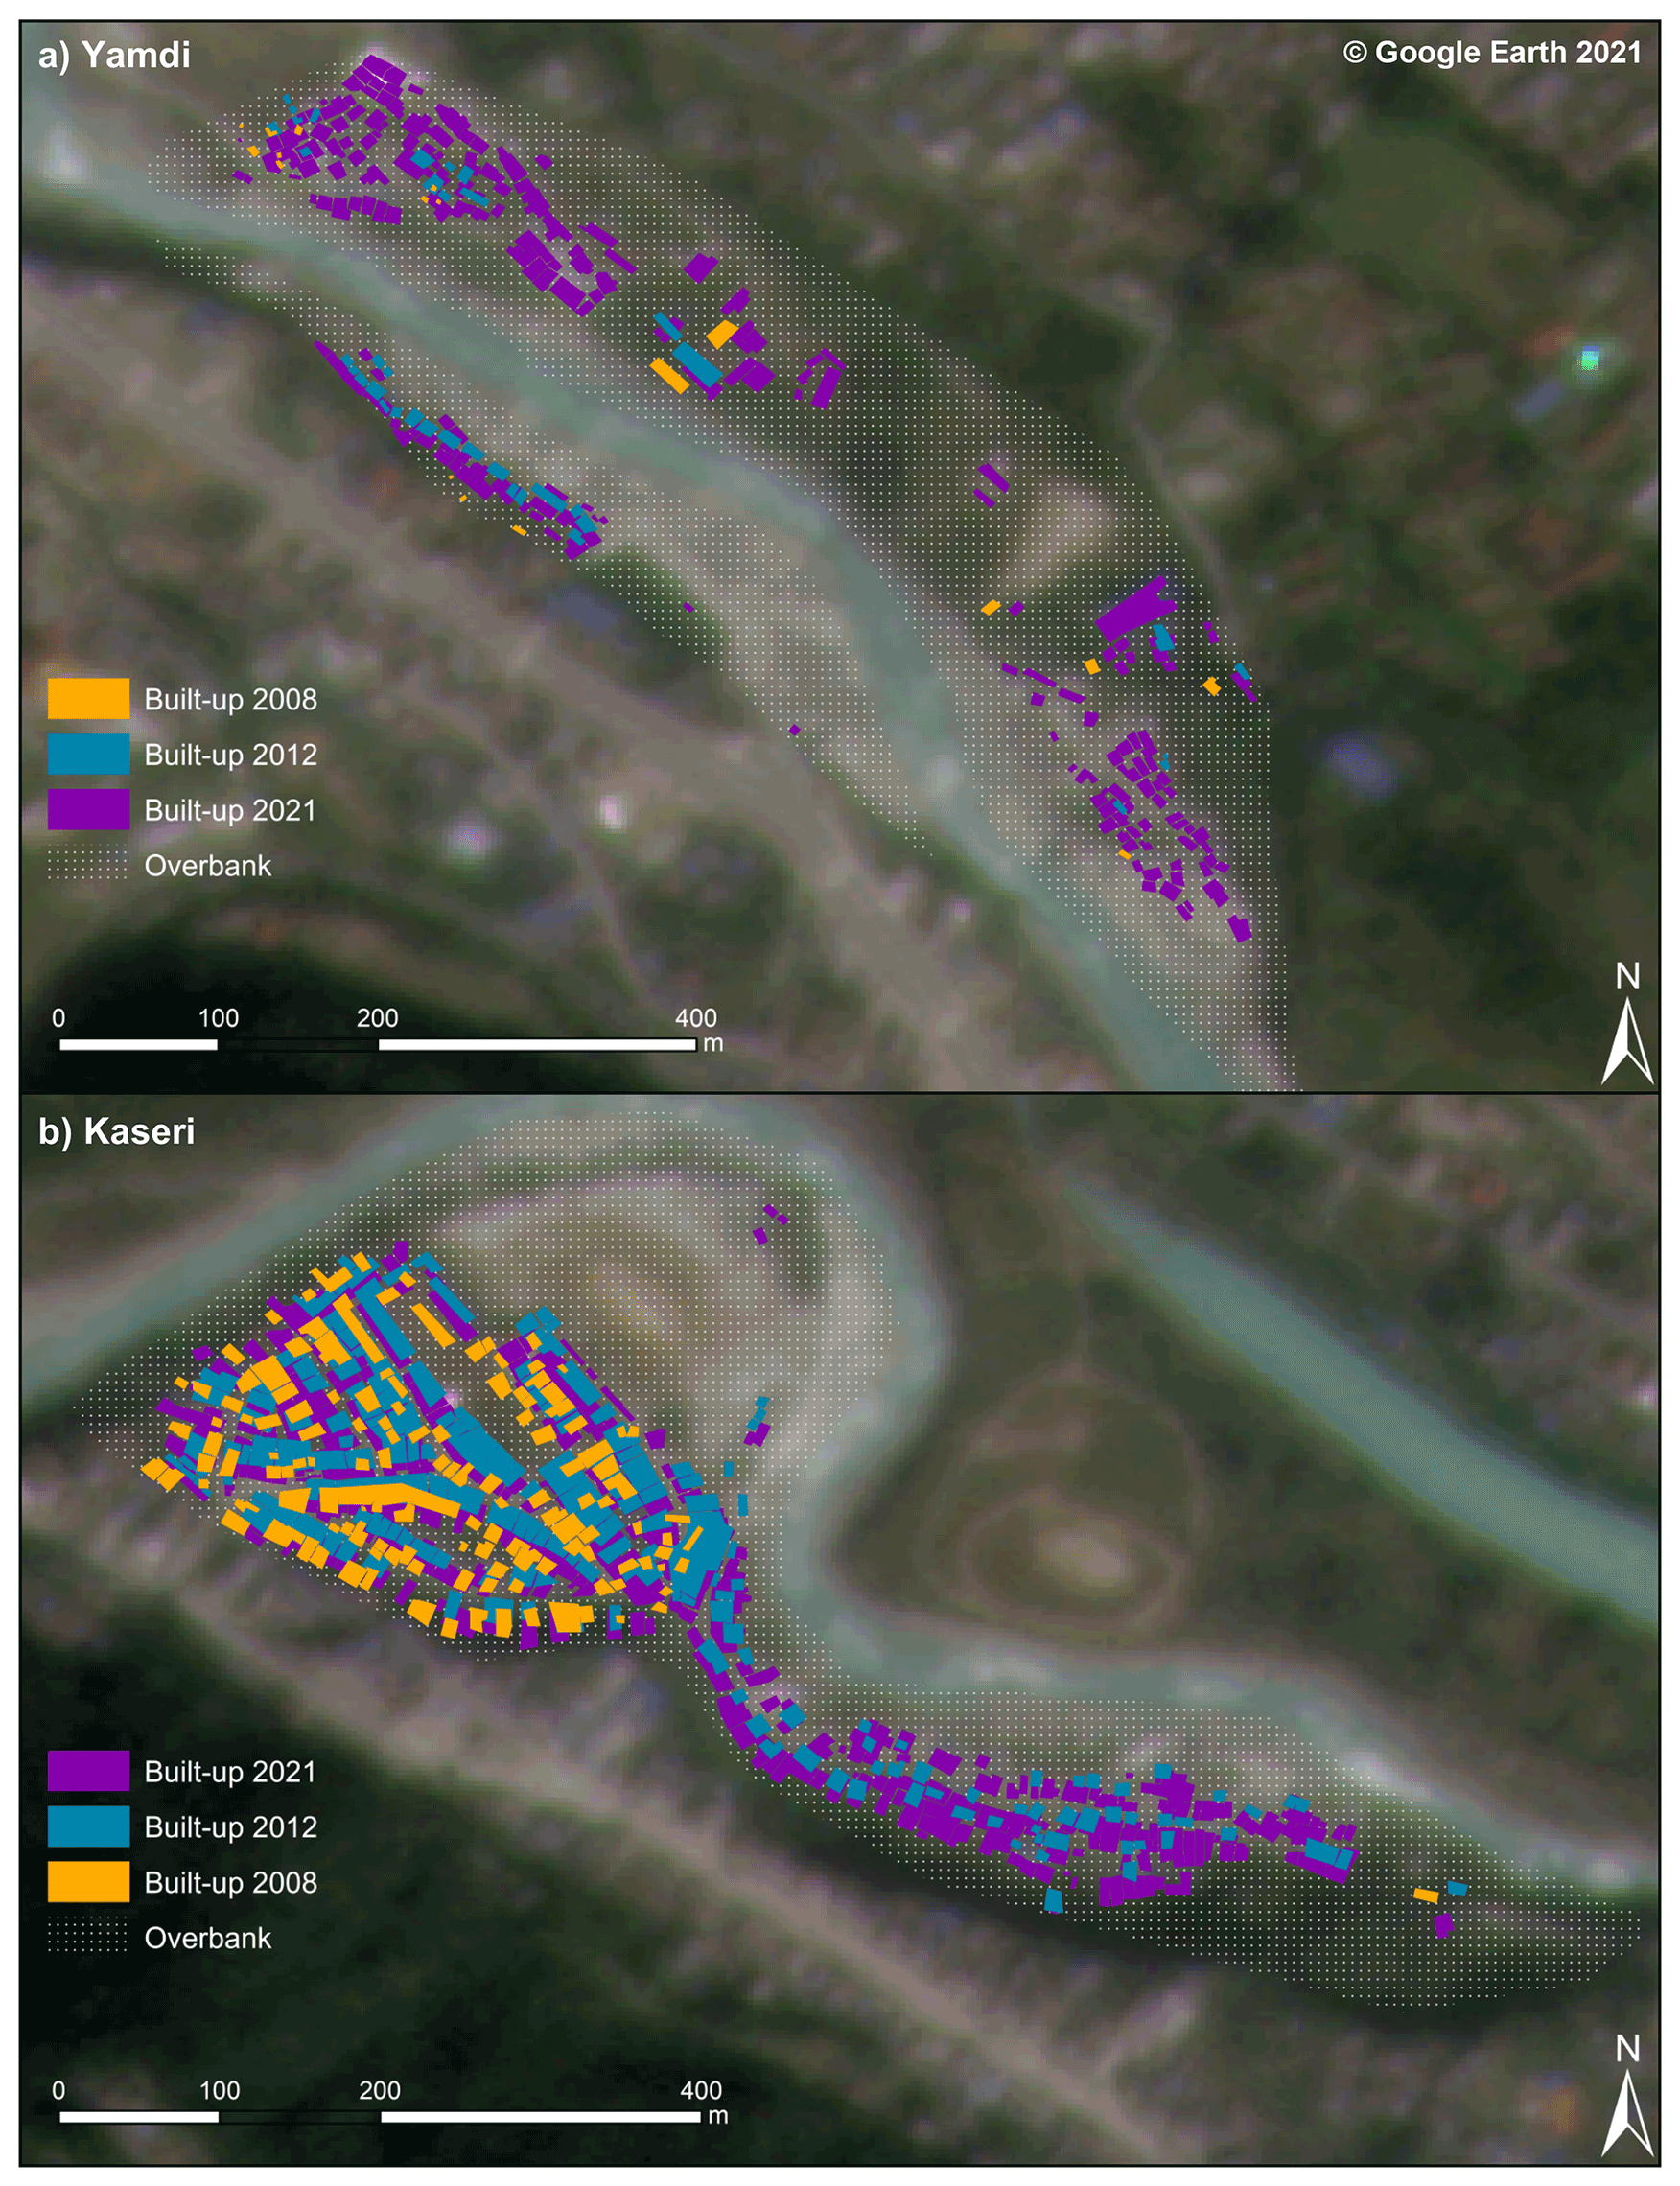
Figure 12Changes in built-up area between April 2008 and November 2021 at Yamdi (a) and Kaseri (b) informal settlements. Built-up area mapped from Google Earth and draped on Planet Scope imagery (acquisition date: 13 November 2021; Planet Team, 2017).
5.1 Inundation modelling
Our scenario-based models of potential flood impacts in Pokhara highlight that especially recent and rapidly growing informal settlements close to the active channel have a high likelihood of being inundated. Before we discuss the implications, we comment on the applicability of our methods. HEC-RAS has been widely applied to model sudden floods (Cenderelli and Wohl, 2003; Klimeš et al., 2014; Wang et al., 2018), albeit at the cost of simplifying flood dynamics in terms of sediment content and channel bed stability. Dynamic entrainment of sediments by bed erosion may alter flow rheology and runout (Westoby et al., 2014). Exact channel geometries are inaccessible in the high-alpine headwaters of the Seti Khola, thus curtailing the use of physically more advanced flow models. Although these could handle erosion and sedimentation dynamics in the propagation of sediment-laden flows, many of the required input parameters remain unconstrained (Cesca and D'Agostino, 2008; Westoby et al., 2014; Zhang and Liu, 2015). While the geomorphic setting caters to numerous potential floodwater sources and generating mechanisms, it rarely conserves evidence of initial breach characteristics. Yet these unknown parameters are essential for the empirical estimation of hydrographs that are required in models of unsteady flow; hence, we restricted our scenario simulations to one-dimensional steady flow.
The accuracy of our results hinges on the accuracy of river cross-sections and the estimates of channel and overbank roughness (Manning's n; Westoby et al., 2014; Wohl, 1998). Previous studies of HEC-RAS for sudden floods have used mostly coarser digital elevation data than the 5 m ALOS DEM we used here (Mergili et al., 2011; Somos-Valenzuela et al., 2015; Wang et al., 2018; Zhang and Liu, 2015). The stereo satellite imagery forming the basis for this DEM was acquired between 2006 and 2011 and excludes channel changes by the May 2012 flood (Gurung et al., 2021). We minimised potential resulting effects on our models by manually adjusting cross-sections with our additional field-surveyed elevation data. We tested the sensitivity of our HEC-RAS simulations related to the choice of Manning's n by comparing the results of two Qp=10 000 m3 s−1 scenario models, one with spatially varying and one with constant Manning's n. Variations between these two models are minimal such that spatially varied Manning's n slightly improves the local accuracy of simulations. Yet these local improvements might be crucial in assessing flood hazard for the informal settlements near the Seti Khola. If the accuracy of our simulations of the May 2012 flood is anything to go by, we surmise that our inundation scenarios are potential underestimates.
Our HEC-RAS simulations also show apparent flooding in places that are likely artefacts of the poorly resolved geometry of several narrow gorges and some subsurface drainage (Fig. 4). Sinkholes and caves in the Ghachok Formation may route some of the discharge of the Seti Khola below the surface, especially in urban areas (Fort, 2010; Rimal et al., 2015; Stolle et al., 2019). Modelling the groundwater flow in these potential karst structures is beyond the scope of this study and would require hydrological details that remain largely unresolved. We thus modelled flood flows for an idealised gorge geometry informed by DEM and field data. Hence, model artefacts potentially occur at cross-sections where this idealised gorge geometry fails to capture or underestimates subsurface flow. Thus, interpretations of the resulting highly localised inundation areas should be handled with care.
5.2 Flood scenarios and their potential impact
Our results offer a first comprehensive set of non-meteorological flood scenarios along the Seti Khola and thus expand on previous studies of a more qualitative (Rimal et al., 2015, 2018) or local focus (Gurung et al., 2021; Thapa et al., 2022). By intersecting modelled inundation extents with spatial data on individual buildings and the route network, we are able to outline relative hazard zones on the assumption that smaller flood magnitudes are more frequent than larger ones. We show that zones with higher relative flood hazard (HC >7) are mostly along the Seti Khola's upper reach. Despite the May 2012 flood's intense damage to infrastructure in this area, a number of infrastructure projects have been developed close to the Seti Khola, including several road bridges and a run-of-the-river hydroelectric station (Gurung et al., 2021).
Further downstream, our mapping of the recent spread of informal settlements along the Seti Khola at Kaseri and Yamdi between 2008 and 2021 substantiates residence interviews about this rapid growth (Gurung et al., 2021). We found that unregulated sand and gravel extraction at Yamdi has, like in many other Nepalese rivers, increased in past decades but has especially accelerated after a large amount of sediment was deposited by the May 2012 flood (Dahal et al., 2012; Fort et al., 2018). Our results illustrate the coupling of intense flood sediment deposition and built-up area expansion along the Seti Khola's mid-reaches, where more people were and still are attracted by this emerging opportunity of income. Although interviews with gravel and sand miners have shown that they are aware of this risk (Henzmann, 2020), they successively move into these flood-prone locations and raise their vulnerability to floods. Gravel mining of this scale is likely to further modulate the roughness of the active channel while enhancing bank erosion and cliff collapse, thus propagating the flood hazards also to the densely populated river terraces further up (Fort et al., 2018; Kondolf, 1994).
One key finding of our simulations is that hydraulic ponding upstream of gorges and backwater flooding at tributaries occurs in all scenarios, leading to high local flow depth and reduced flow velocities. The Seti dam and Kaseri informal settlement appear to be particularly prone to hydraulic ponding, which might cause severe flooding there. Locally sustained flood peaks might cause a spatially much more diverse flood hazard along this reach. While our models simulate clear-water flow, hydraulic ponding is likely exacerbated by entrained sediment and debris that may further clog or block the gorges (Thapa et al., 2022). Hydraulic ponding is a common process during sudden floods in bedrock or resistant-boundary channels and was reported for Holocene jökulhlaups in Iceland (Carrivick, 2006, 2007) and historic outbursts of moraine-dammed lakes in British Columbia (Kershaw et al., 2005). This importance of hydraulic ponding complements the findings of previous studies concerned with estimating flood frequency at several sites (Basnet and Acharya, 2019; Gurung et al., 2021). Estimates of the 100-year flood based on rainfall data are Qp=2336 m3 s−1 (Basnet and Acharya, 2019) and Qp=2423 m3 s−1 (Gurung et al., 2021). These are consistent with the lower range of non-meteorological flood scenarios and offer comparable flood limits in the Ramghat (Basnet and Acharya, 2019) and Kharapani areas (Gurung et al., 2021).
5.3 Recommendations
No early-warning strategy was in place during the May 2012 flood, and several authors surmised that a chance warning presumably prevented a higher death toll in the north-western outskirts of Pokhara (Gurung et al., 2015; Kargel et al., 2013). In the flood's immediate aftermath, public flood risk awareness and preparation training as well as an early-warning system were implemented – including a water-level sensor in the Seti Khola just above the furthest upstream settlement (Gurung et al., 2015). However, recent interviews with local residents showed that a lack of maintenance has rendered the early-warning system inoperable in the past years (Henzmann, 2020). Thapa et al. (2022) pointed out that existing evacuation routes from Yamdi and Kaseri settlements towards higher ground are inadequate and outlined several structural (e.g. river embankment) and non-structural (e.g. evacuation rehearsal drills, population relocation) mitigation measures. The authors proposed to install weather and hydrological stations and to transmit early warnings via mobile phone. However, their flood response strategy strictly focuses on urban areas in Pokhara's north-west. We argue that a regularly maintained warning system might want to provide full coverage of settlements along the Seti Khola's course through the Pokhara Valley, including rural settlements and exposed infrastructure in the northern valley. The May 2012 flood also demonstrated that such flash floods can travel fast in the steep headwaters of the Seti Khola (Kargel et al., 2013; Oi et al., 2014). Stream gauges and comparable monitoring stations may need to be located further upstream than presently implemented, ideally close to the outlet of Sabche Cirque to maximise warning times for downstream communities. Complementing the proposal of Thapa et al. (2022) for early-warning strategies in the downstream reaches, we argue that a special focus should be on monitoring water and sediment dynamics in the Seti Khola's headwaters. Optical and synthetic aperture radar (SAR) satellite data acquired at short repeat rates, for example, via the Sentinel and Planet platforms, might further assist early warning, as ground movement and deformation of the cirque walls, surge phases of the Sabche glacier, and lake formation might be tell-tale warning signs (Grebby et al., 2021; Hermle et al., 2021; Kirschbaum et al., 2019; Quincey et al., 2005). Following Zhang and Wang (2022) on their mitigation efforts of outburst hazard from Lake Cirenmaco, China, field monitoring could include the real-time transmission of optical and thermal data, captured by 360∘ cameras, to a round-the-clock-operating data processing centre. Yet, the potential cloudiness of this area together with increasing pollution may constrain visual monitoring. Downstream, however, urban planning may have a different priority for decision-makers (Gurung et al., 2021). Instead of relocating people from vulnerable informal settlements to safer places, the government and local authorities may have encouraged people to live near riverbanks or on floodplains by providing them with basic amenities (drinking water, electricity, access road) and land owner certificates (Gurung et al., 2021).
The Seti Khola is the lifeline of Nepal's second-largest city, but also a river prone to sudden floods, given that it traverses one of the steepest topographic gradients in the Higher Himalayas. We provide the first comprehensive assessment of potential discharge scenarios and intersect hydrodynamically modelled inundation extents with land cover data. Our simulations demonstrate the high spatial variability in potential flood impacts in the Pokhara Valley. All model runs point to potential hydraulic ponding with high flow depths and low flow velocities above deeply incised gorges in urban areas.
We find that even a moderate non-meteorological flood scenario with peak discharge well within the ranges of monsoonal floods (Qp=1000 m3 s−1) could inundate some 0.6 % (0.3 km2) of the developed area and 3.2 % of cropland and grassland. A larger flood involving a peak discharge 10 times higher would flood 2.8 % (1.5 km2) of the Pokhara Valley's developed areas and 9.8 % of its agricultural areas. OSM data of built-up area in Pokhara's urban areas show that relative inundation hazard is highest in the city's north-western outskirts, where a rapidly growing number of informal buildings linked to gravel mining has moved close to the Seti Khola. These sites of extensive unregulated sand and gravel mining would be extensively inundated in all our discharge scenarios, putting workers and informal settlement dwellers at risk. Built-up area in both Kaseri and Yamdi has grown intensively in the past decade: while built-up area in Kaseri, Pokhara's oldest established informal settlement, tripled between 2008 and 2021, built-up area rapidly increased by a factor of 20 in the recently formed settlements at Yamdi. Since 2012, a 6-fold increase in built-up area at the latter has been accompanied by an intense expansion of gravel and sand mining activities. Several roads that are crucial for the supply reliability of rural communities are also prone to more frequent flooding as these roads run parallel to the Seti Khola on its lower alluvial terraces.
We conclude that urban planning and risk mitigation strategies in the Pokhara Valley might wish to consider the hazard posed by sudden, non-meteorological floods in more detail, given the accumulating evidence of repeated historic and prehistoric events. Potential risk reduction measures may include in-field and remote monitoring of the Seti Khola's headwaters as well as early-warning strategies, including a statutorily determined chain of warning as well as public awareness training. Such training could be aided by considering scenario-based limits of inundation for different flood sources.
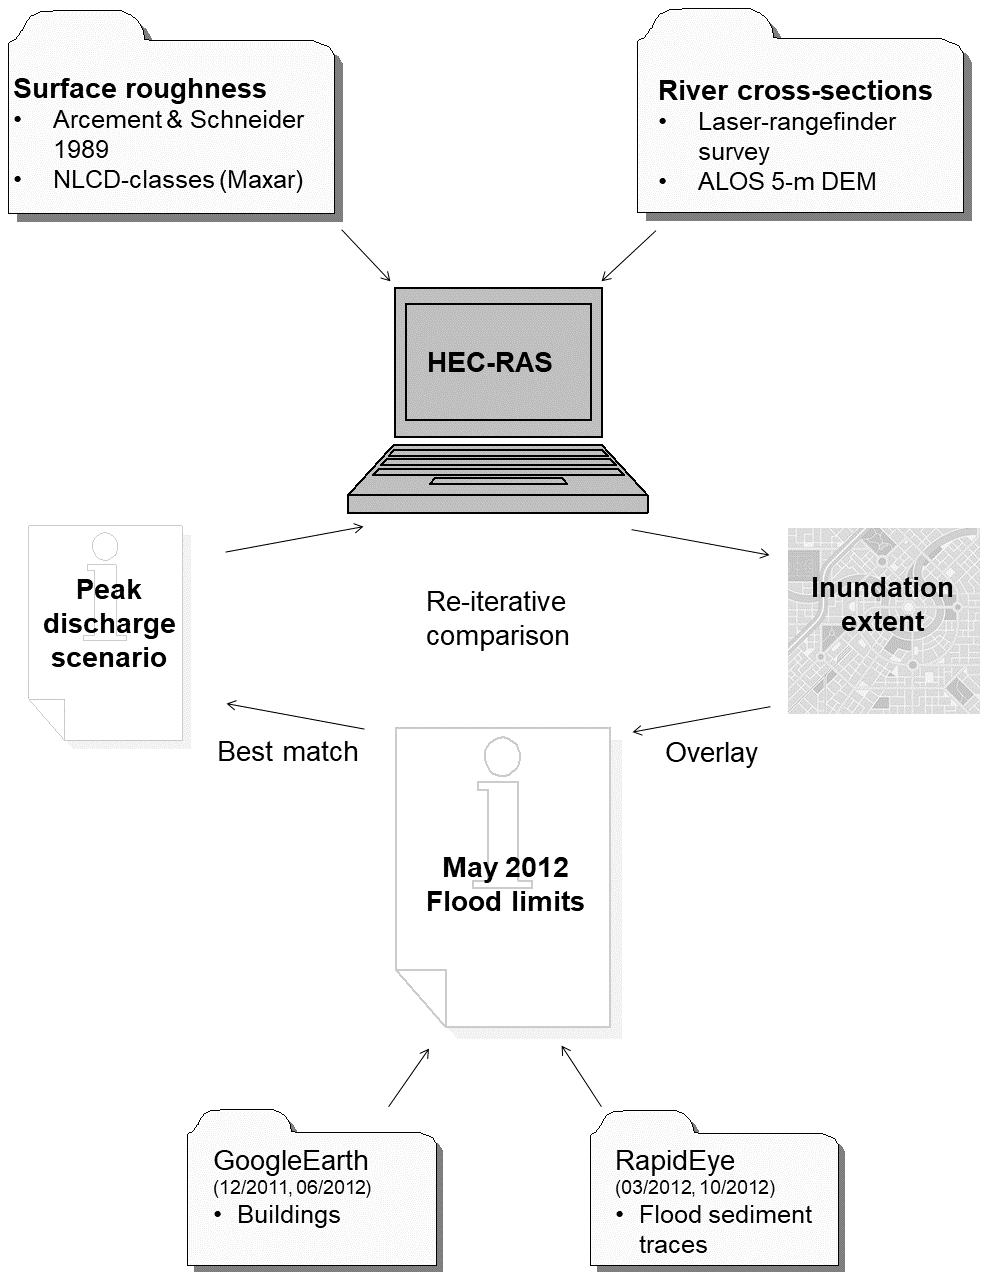
Figure A1Data sources and workflow of our model validation based on satellite-mapped sediment and damage traces of the May 2012 flood in the upper reach of the Seti Khola.
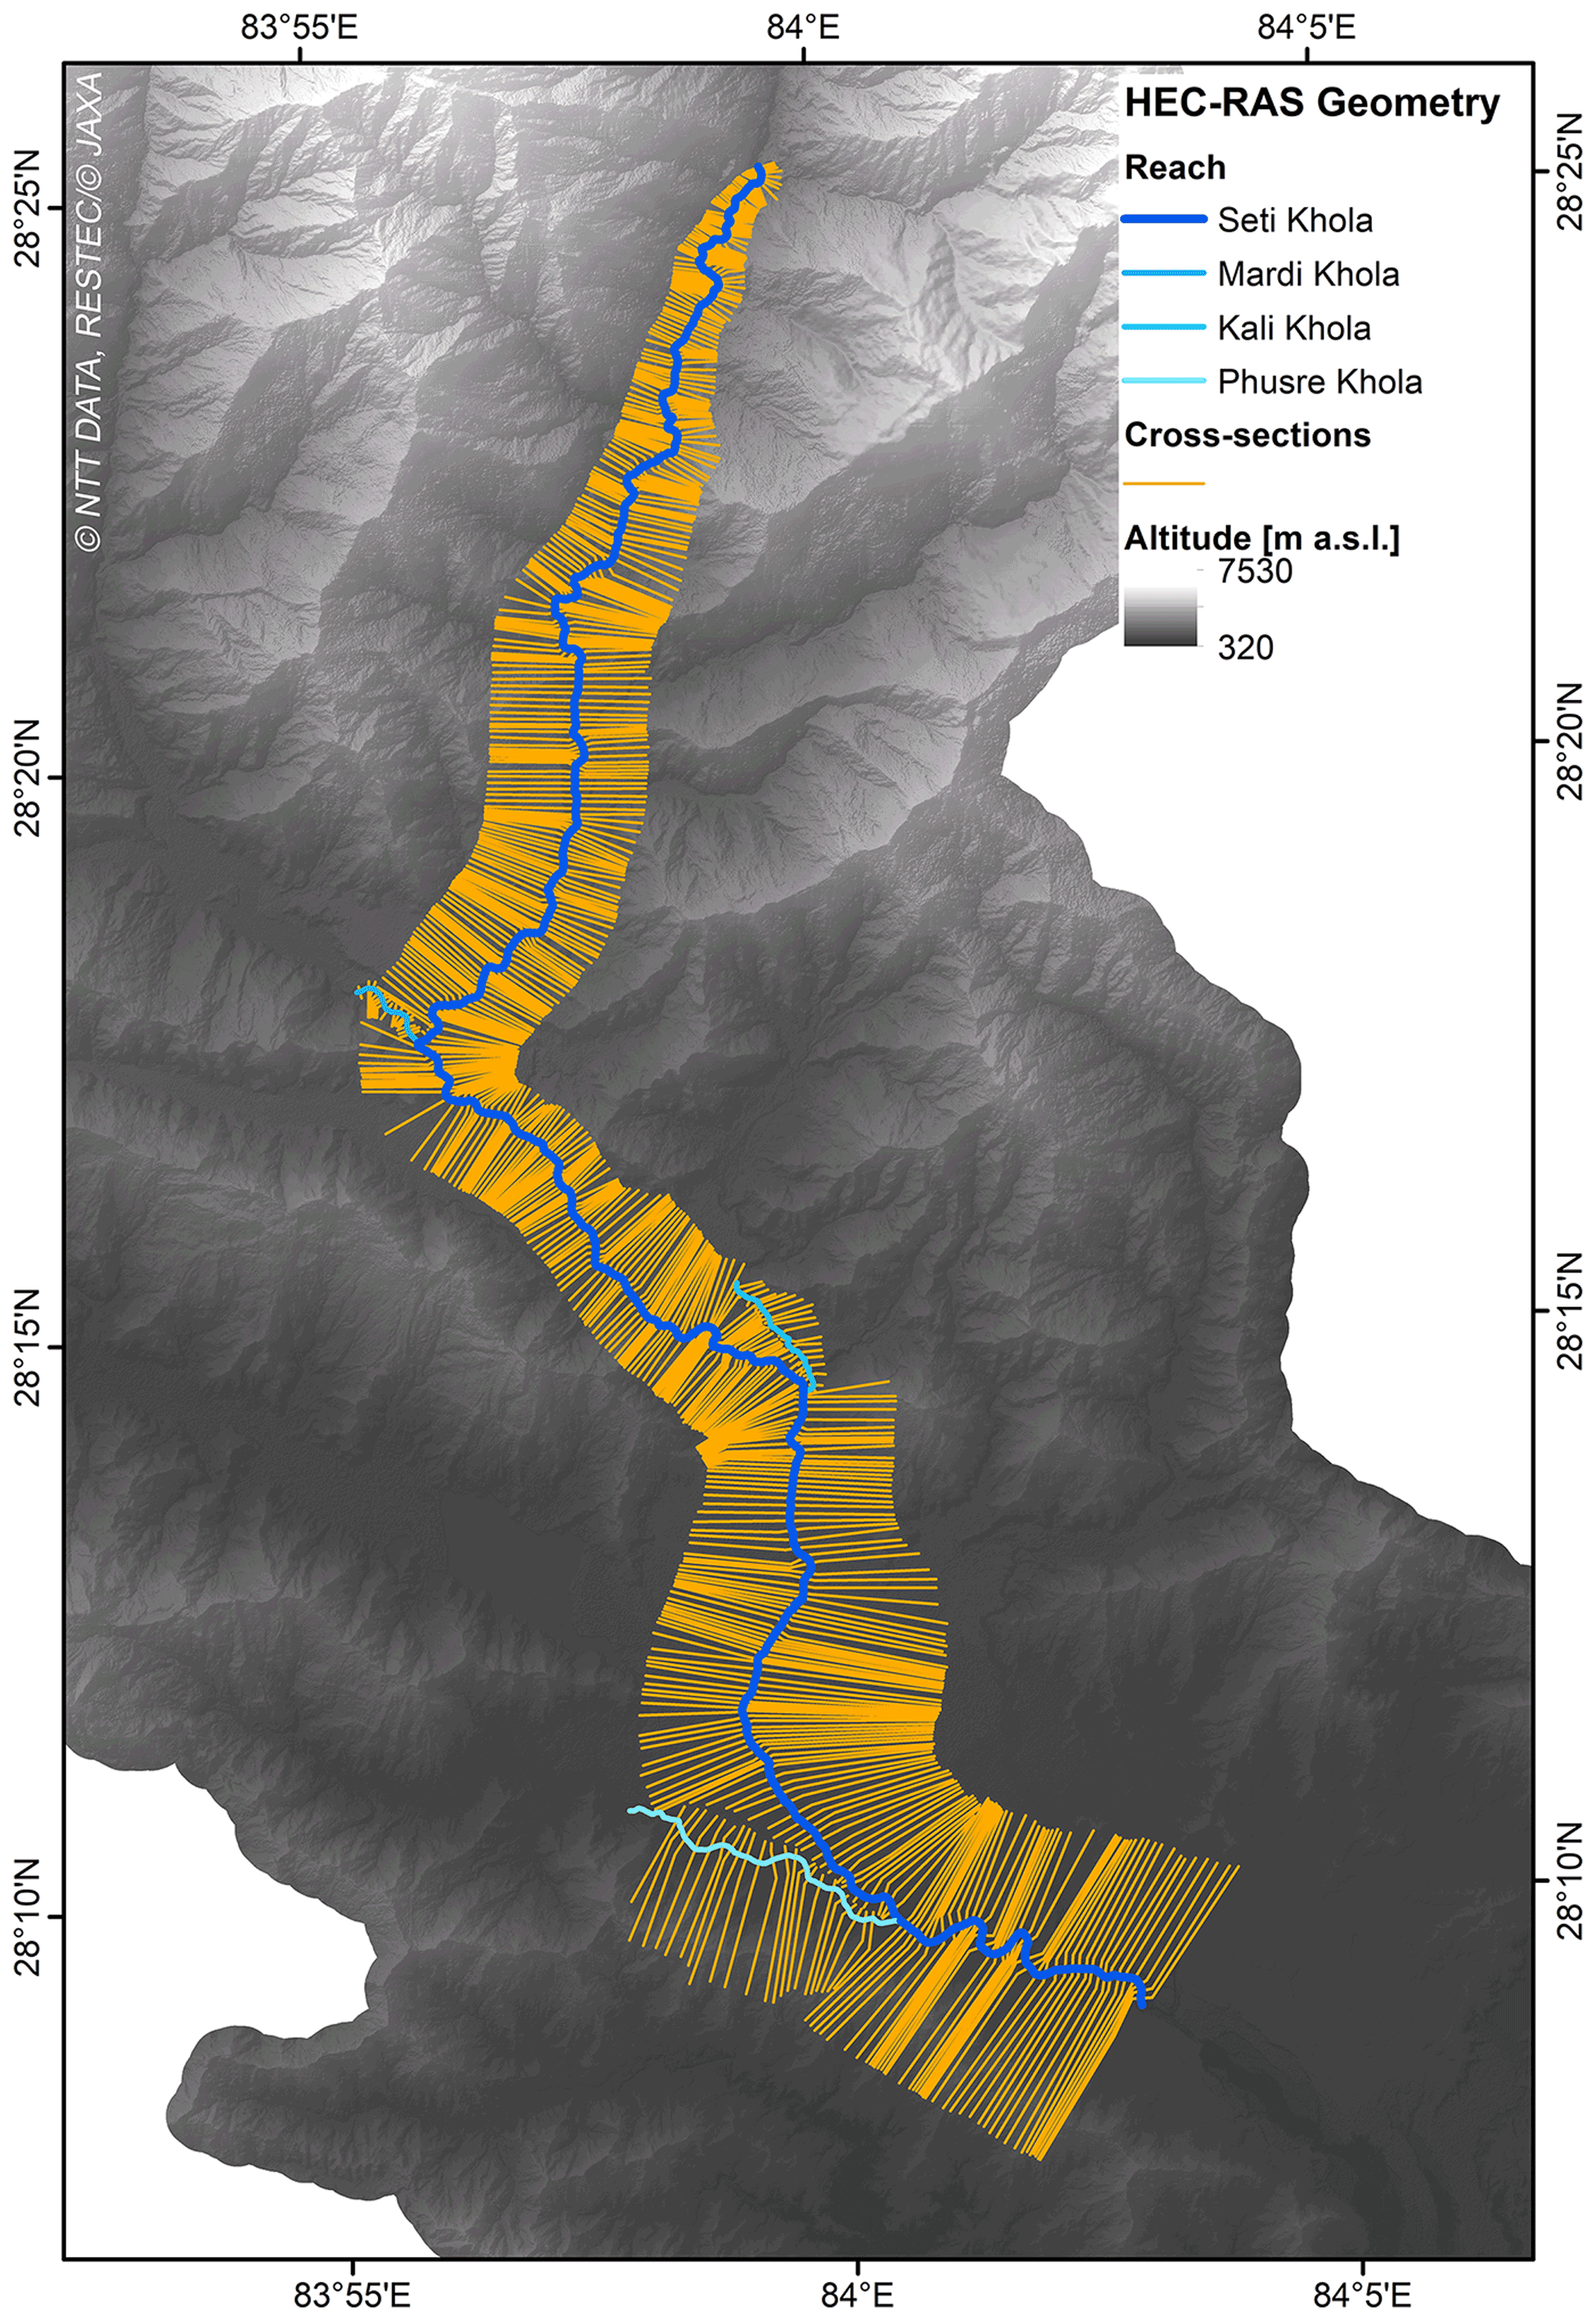
Figure A2Location of 572 cross-sections along the main (Seti Khola) and tributary reaches (Mardi, Kali, Phusre Khola) used as input to HEC-RAS models, plotted on top of the AW3D DEM (JAXA, NTT Data, and Remote Sensing Technology, 2022; © NTT DATA, RESTEC/© JAXA).
All field data were published by Fischer et al. (2022) in the PANGAEA Data Publisher for Earth & Environmental Science (https://www.pangaea.de/, last access: 16 September 2022) and are freely available under https://doi.org/10.1594/PANGAEA.941540 (Fischer et al., 2022). ALOS WORLD 3D Standard was created by the Japan Aerospace Exploration Agency (JAXA), NTT Data, and Remote Sensing Technology Center of Japan (RESTEC) and can be purchased at https://www.aw3d.jp/en/products/standard/ (JAXA, NTT Data, and Remote Sensing Technology, 2022). PlanetScope and RapidEye satellite imagery was freely provided through the Education and Research Program of Planet Lab Inc. (https://www.planet.com/explorer; Planet Team, 2017). Data from the OpenStreetMap project are freely available via https://www.openstreetmap.org/ (OSMF, 2021) and https://overpass-turbo.eu/ (last access: 30 September 2021). We further used the freeware HEC-RAS 5.0.7, which is available under https://www.hec.usace.army.mil/software/hec-ras/ (last access: 16 September 2022), and Google Earth Pro (https://www.google.com/earth/versions/#earth-pro, last access: 16 September 2022).
MeF, AW, OK, and SR conceptualised the study. The field data were collected by MeF and OK, while MeF and JB curated field and additional data. All data were processed and visualised by MeF. MeF prepared the original manuscript, which was reviewed and edited by AW, SR, MoF, and OK.
The contact author has declared that none of the authors has any competing interests.
Publisher’s note: Copernicus Publications remains neutral with regard to jurisdictional claims in published maps and institutional affiliations.
This article is part of the special issue “Estimating and predicting natural hazards and vulnerabilities in the Himalayan region”. It is not associated with a conference.
This research was supported by the graduate research training group NatRiskChange at the University of Potsdam (https://www.natriskchange.de, last access: 16 September 2022). The authors thank Georg Veh, Elisabeth Schönfeldt, and Narayan Gurung for their support during fieldwork and Natalie Lützow for data support with HEC-RAS. Adam Emmer and Mohit Mohanty provided helpful reviews of an earlier manuscript version.
This research has been supported by the Deutsche Forschungsgemeinschaft (grant nos. GRK 2043/1 and GRK 2043/2, and project no. 491466077 ).
This paper was edited by Ankit Agarwal and reviewed by Mohit Mohanty and Adam Emmer.
Arcement Jr., G. J. and Schneider, V. R.: Guide for selecting Manning's roughness coefficients for natural channels and flood plains: U.S. Geological Survey Water Supply Paper 2339, US Department of Transportation, Federal Highway Administration, https://doi.org/10.3133/wsp2339, 1984.
Basnet, K. and Acharya, D.: Flood Analysis at Ramghat, Pokhara, Nepal Using HEC-RAS, Tech. J., 1, 41–53, https://doi.org/10.3126/tj.v1i1.27591, 2019.
Bolch, T., Shea, J. M., Liu, S., Azam, F. M., Gao, Y., Gruber, S., Immerzeel, W. W., Kulkarni, A., Li, H., Tahir, A. A., Zhang, G., and Zhang, Y.: Status and Change of the Cryosphere in the Extended Hindu Kush Himalaya Region BT – The Hindu Kush Himalaya Assessment: Mountains, Climate Change, Sustainability and People, 1st edn., edited by: Wester, P., Mishra, A., Mukherji, A., and Shrestha, A. B., 209–255, Springer International Publishing, Cham, https://doi.org/10.1007/978-3-319-92288-1_7, 2019.
Brunner, G. W.: HEC-RAS, River Analysis System – Hydraulic Reference Manual, 520, https://www.hec.usace.army.mil/software/hec-ras/documentation/HEC-RAS%205.0%20Reference%20Manual.pdf (last access: 16 September 2022), 2020a.
Brunner, G. W.: HEC-RAS River Analysis System – 2D Modeling User's Manual, 283, https://www.hec.usace.army.mil/confluence/rasdocs/r2dum/6.0 (last access: 16 September 2022), 2020b.
Carrivick, J. L.: Application of 2D hydrodynamic modelling to high-magnitude outburst floods: An example from Kverkfjöll, Iceland, J. Hydrol., 321, 187–199, https://doi.org/10.1016/j.jhydrol.2005.07.042, 2006.
Carrivick, J. L.: Modelling coupled hydraulics and sediment transport of a high-magnitude flood and associated landscape change, Ann. Glaciol., 45, 143–154, https://doi.org/10.3189/172756407782282480, 2007.
Cenderelli, D. A. and Wohl, E. E.: Flow hydraulics and geomorphic effects of glacial-lake outburst floods in the Mount Everest region, Nepal, Earth Surf. Process. Landforms, 28, 385–407, https://doi.org/10.1002/esp.448, 2003.
Central Bureau of Statistics: National Population and Housing Census 2021, Natl. Popul. Hous. Census 2021, https://cbs.gov.np/, last access: 21 February 2022.
Cesca, M. and D'Agostino, V.: Comparison between FLO-2D and RAMMS in debris-flow modelling: A case study in the Dolomites, WIT Trans. Eng. Sci., 60, 197–206, https://doi.org/10.2495/DEB080201, 2008.
Chow, V. T.: Open-channel hydraulics, 1st edn., Civ. Eng. Ser., McGraw-Hill, New York, 680 pp., ISBN: 9780070859067, 1959.
Dahal, K. R., Sharma, S., and Sharma, C. M.: A Review of Riverbed Extraction and its Effects on Aquatic Environment with Special Reference to Tinau River, Nepal, Hydro Nepal J. Water Energy Environ., 11, 49–56, https://doi.org/10.3126/hn.v11i0.7163, 2012.
ESRI and Maxar Technologies: World Imagery, https://services.arcgisonline.com/ArcGIS/rest/services/World_Imagery/MapServer, last access: 17 May 2022.
Fischer, M., Veh, G., and Korup, O.: Surface topography and roughness along the Seti Khola (Pokhara Valley, Nepal) measured in-field in 2016 and 2019, PANGAEA [data set], https://doi.org/10.1594/PANGAEA.941540, 2022.
Fort, M.: Sporadic morphogenesis in a continental subduction setting: an example from the Annapurna Range, Nepal Himalaya, Zeitschrift für Geomorphol. Suppl., 63, 9–36, 1987.
Fort, M.: The Pokhara Valley: A product of a natural catastrophe, in: Geomorphological Landscapes of the World, edited by: Migon, P., Springer Science + Business Media B. V., 265–274, https://doi.org/10.1007/978-90-481-3055-9_27, 2010.
Fort, M.: Impact of climate change on mountain environment dynamics, Rev. géographie Alp., 103, 1–7, https://doi.org/10.4000/rga.2877, 2015.
Fort, M., Adhikari, B. R., and Rimal, B.: Chapter 12 – Pokhara (Central Nepal): A Dramatic Yet Geomorphologically Active Environment Versus a Dynamic, Rapidly Developing City, in: Urban Geomorphology, edited by: Thornbush, M. J. and Allen, C. D., Elsevier, Amsterdam, Oxford, Cambridge, 231–258, https://doi.org/10.1016/B978-0-12-811951-8.00012-6, 2018.
Gabet, E. J., Burbank, D. W., Putkonen, J. K., Pratt-Sitaula, B. A., and Ojha, T.: Rainfall thresholds for landsliding in the Himalayas of Nepal, Geomorphology, 63, 131–143, https://doi.org/10.1016/j.geomorph.2004.03.011, 2004.
Grandin, R., Doin, M. P., Bollinger, L., Pinel-Puysségur, B., Ducret, G., Jolivet, R., and Sapkota, S. N.: Long-term growth of the Himalaya inferred from interseismic InSAR measurement, Geology, 40, 1059–1062, https://doi.org/10.1130/G33154.1, 2012.
Grebby, S., Sowter, A., Gee, D., Athab, A., De la Barreda-Bautista, B., Girindran, R., and Marsh, S.: Remote monitoring of ground motion hazards in high mountain terrain using InSAR: A case study of the Lake Sarez area, Tajikistan, Appl. Sci., 11, 1–17, https://doi.org/10.3390/app11188738, 2021.
Gurung, D. R., Maharjan, S. B., Khanal, N. R., Joshi, G., and Murthy, M. S. R.: Nepal disaster report 2015, Kathmandu, ISBN: 978-9937-0-0324-7, 2015.
Gurung, N., Fort, M., Bell, R., Arnaud-Fassetta, G., and Maharjan, N. R.: Hydro-torrential hazard vs. anthropogenic activities along the Seti valley, Kaski, Nepal: Assessment and recommendations from a risk perspective, J. Nepal Geol. Soc., 62, 58–87, https://doi.org/10.3126/jngs.v62i0.38695, 2021.
Hanisch, J., Koirala, A., and Bhandary, N. P.: The Pokhara May 5th flood disaster: a last warning sign sent by nature?, J. Nepal Geol. Soc., 46, 1–10, 2013.
Henzmann, I.: Local Peoples Risk Perception of Natural Hazards in the Seti River Valley, Nepal, MS thesis, Department of Geography, University of Zurich, 2020.
Hermle, D., Keuschnig, M., Hartmeyer, I., Delleske, R., and Krautblatter, M.: Timely prediction potential of landslide early warning systems with multispectral remote sensing: a conceptual approach tested in the Sattelkar, Austria, Nat. Hazards Earth Syst. Sci., 21, 2753–2772, https://doi.org/10.5194/nhess-21-2753-2021, 2021.
Hock, R., Rasul, G., Adler, C., Cáceres, B., Gruber, S., Hirabayashi, Y., Jackson, M., Kääb, A., Kang, S., Kutuzov, S., Milner, A., Molau, U., Morin, S., Orlove, B., and Steltzer, H. I.: High Mountain Areas, in: IPCC Special Report on the Ocean and Cryosphere in a Changing Climate, edited by: Pörtner, H.-O., Roberts, D. C., Masson-Delmotte, V., Zhai, P., Tignor, M., Poloczanska, E., Mintenbeck, K., Alegría, A., Nicolai, M., Okem, A., Petzold, J., Rama, B., and Weyer, N. M., Genf, 131–202, https://doi.org/10.1017/9781009157964.004, 2019.
Hormann, K.: Die Terrassen an der Seti Khola – Ein Beitrag zur quartären Morphogenese in Zentralnepal, Erdkunde, 28, 161–176, 1974.
Immerzeel, W. W., van Beek, L. P. H., and Bierkens, M. F. P.: Climate change will affect the Asian water towers, Science, 328, 1382–1385, https://doi.org/10.1126/science.1183188, 2010.
JAXA, NTT Data, and Remote Sensing Technology: AW3D Standard, https://www.aw3d.jp/en/products/standard/, JAXA [data set], last access: 16 September 2022.
Kargel, J. S., Paudel, L., Leonard, G., Regmi, D., Joshi, S., Poudel, K., Thapa, B., Watanabe, T., and Fort, M.: Causes and human impacts of the Seti River (Nepal) disaster of 2012, in: Glacial Flooding & Disaster Risk Management Knowledge Exchange and Field Training; High Mountains Adaptation Partnership: Huaraz, Peru, 1–11, https://issuu.com/johnharlinmedia/docs/regmi_causes_humanimpactssetiriver_/1, (last access: 16 September 2022), 2013.
Kershaw, J. A., Clague, J. J., and Evans, S. G.: Geomorphic and sedimentological signature of a two-phase outburst flood from moraine-dammed Queen Bess Lake, British Columbia, Canada, Earth Surf. Process. Landforms, 30, 1–25, https://doi.org/10.1002/esp.1122, 2005.
Kirschbaum, D., Watson, C. S., Rounce, D. R., Shugar, D. H., Kargel, J. S., Haritashya, U. K., Amatya, P., Shean, D., Anderson, E. R., and Jo, M.: The State of Remote Sensing Capabilities of Cascading Hazards Over High Mountain Asia, Front. Earth Sci., 7, 1–25, https://doi.org/10.3389/feart.2019.00197, 2019.
Klimeš, J., Benešová, M., Vilímek, V., Bouška, P., and Cochachin Rapre, A.: The reconstruction of a glacial lake outburst flood using HEC-RAS and its significance for future hazard assessments: An example from Lake 513 in the Cordillera Blanca, Peru, Nat. Hazards, 71, 1617–1638, https://doi.org/10.1007/s11069-013-0968-4, 2014.
Kondolf, G. M.: Geomorphic and environmental effects of instream gravel mining, Landsc. Urban Plan., 28, 225–243, https://doi.org/10.1016/0169-2046(94)90010-8, 1994.
Kraaijenbrink, P. D. A., Bierkens, M. F. P., Lutz, A. F., and Immerzeel, W. W.: Impact of a global temperature rise of 1.5 degrees Celsius on Asia's glaciers, Nature, 549, 257–260, https://doi.org/10.1038/nature23878, 2017.
Lovell, A. M., Carr, J. R., and Stokes, C. R.: Topographic controls on the surging behaviour of Sabche Glacier, Nepal (1967 to 2017), Remote Sens. Environ., 210, 434–443, https://doi.org/10.1016/j.rse.2018.03.036, 2018.
Mergili, M., Schneider, D., Worni, R., and Schneider, J. F.: Glacial lake outburst floods in the Pamir of Tajikistan: Challenges in prediction and modelling, Int. Conf. Debris-Flow Hazards Mitig. Mech. Predict. Assessment, Proc., 973–982, https://doi.org/10.4408/IJEGE.2011-03.B-106, 2011.
Multi-Resolution Land Characteristics (MRLC) Consortium: National Land Cover Database 2019 (NLCD2019) Legend, NLCD2019, https://www.mrlc.gov/data/legends/national-land-cover-database-2019-nlcd2019-legend (last access: 12 January 2022), 2019.
Nussbaumer, S., Schaub, Y., Huggel, C., and Walz, A.: Risk estimation for future glacier lake outburst floods based on local land-use changes, Nat. Hazards Earth Syst. Sci., 14, 1611–1624, https://doi.org/10.5194/nhess-14-1611-2014, 2014.
Oi, H., Higaki, D., Yagi, H., Usuki, N., and Yoshino, K.: Survey Report on the Seti River Flood, Nepal (May 5, 2012), Sabo Frontier Foundation, Tokyo, https://www.sff.or.jp/nepal/osirase/121009Setikawagenchichousahoukokusho_English.ver.pdf (last access: 16 September 2022), 2012.
Oi, H., Higaki, D., Yagi, H., Usuki, N., and Yoshino, K.: Report of the investigation of the flood disaster that occurred on May 5, 2012 along the Seti River in Nepal, Int. J. Eros. Control Eng., 7, 111–117, https://doi.org/10.13101/ijece.7.111, 2014.
OSMF: OpenStreetMap, OSMF [data set], https://www.openstreetmap.org, last access: 30 September 2021.
Pandey, V. K., Kumar, R., Singh, R., Kumar, R., Rai, S. C., Singh, R. P., Tripathi, A. K., Soni, V. K., Ali, S. N., Tamang, D., and Latief, S. U.: Catastrophic ice-debris flow in the Rishiganga River, Chamoli, Uttarakhand (India), Geomatics, Nat. Hazards Risk, 13, 289–309, https://doi.org/10.1080/19475705.2021.2023661, 2022.
Petley, D.: Melamchi: a landslide dam break flood in Nepal last week, Landslide Blog – AGU Blogosph., https://blogs.agu.org/landslideblog/2021/06/21/melamchi-a-landslide-dam-break-flood-in-nepal-last-week/, last access: 16 July 2021.
Planet Team: Planet Application Program Interface: In Space for Life on Earth, https://www.planet.com/explorer (last access: 16 September 2022), 2017.
Quincey, D. J., Lucas, R. M., Richardson, S. D., Glasser, N. F., Hambrey, M. J., and Reynolds, J. M.: Optical remote sensing techniques in high-mountain environments: Application to glacial hazards, Prog. Phys. Geogr., 29, 475–505, https://doi.org/10.1191/0309133305pp456ra, 2005.
Rimal, B.: Urbanization and the Decline of Agricultural Land in Pokhara Sub-metropolitan City, Nepal, J. Agric. Sci., 5, 54–65, https://doi.org/10.5539/jas.v5n1p54, 2012.
Rimal, B., Baral, H., Stork, N., Paudyal, K., and Rijal, S.: Growing City and Rapid Land Use Transition: Assessing Multiple Hazards and Risks in the Pokhara Valley, Nepal, Land, 4, 957–978, https://doi.org/10.3390/land4040957, 2015.
Rimal, B., Zhang, L., Keshtkar, H., Sun, X., and Rijal, S.: Quantifying the spatiotemporal pattern of urban expansion and hazard and risk area identification in the Kaski District of Nepal, Land, 7, 1–22, https://doi.org/10.3390/land7010037, 2018.
Ross, J. and Gilbert, R.: Lacustrine sedimentation in a monsoon environment: The record from Phewa Tal, middle mountain region of Nepal, Geomorphology, 27, 307–323, https://doi.org/10.1016/S0169-555X(98)00079-8, 1999.
SANDRP: Explained: Seti River floods in May 2012, Nepal – A chain of events, starting at 25,000 feet!, https://sandrp.in/2014/01/26/explained-seti-river-floods-in-may-2012 (last access: 18 March 2021), 2014.
Schild, A.: ICIMOD's Position on Climate Change and Mountain Systems, Mt. Res. Dev., 28, 328–331, https://doi.org/10.1659/mrd.mp009, 2008.
Schwanghart, W., Bernhardt, A., Stolle, A., Hoelzmann, P., Adhikari, B. R., Andermann, C., Tofelde, S., Merchel, S., Rugel, G., Fort, M., and Korup, O.: Repeated catastrophic valley infill following medieval earthquakes in the Nepal Himalaya, Science, 351, 147–150, https://doi.org/10.1126/science.aac9865, 2016.
Schwanghart, W., Ryan, M., and Korup, O.: Topographic and Seismic Constraints on the Vulnerability of Himalayan Hydropower, Geophys. Res. Lett., 45, 8985–8992, https://doi.org/10.1029/2018GL079173, 2018.
Shrestha, A., Thapa, S., and Ghimire, B. N. S.: Flood Hazard Mapping and Vulnerability Analysis Along Seti River in Pokhara Metropolitan City, Lect. Notes Civ. Eng., 115, 183–190, https://doi.org/10.1007/978-981-15-9805-0_15, 2021.
Shugar, D. H., Jacquemart, M., Shean, D., Bhushan, S., Upadhyay, K., Sattar, A., Schwanghart, W., McBride, S., de Vries, M. V. W., Mergili, M., Emmer, A., Deschamps-Berger, C., McDonnell, M., Bhambri, R., Allen, S. K., Berthier, E., Carrivick, J. L., Clague, J. J., Dokukin, M., Dunning, S. A., Frey, H., Gascoin, S., Haritashya, U. K., Huggel, C., Kääb, A., Kargel, J. S., Kavanaugh, J. L., Lacroix, P., Petley, D., Rupper, S., Azam, M. F., Cook, S. J., Dimri, A. P., Eriksson, M., Farinotti, D., Fiddes, J., Gnyawali, K. R., Harrison, S., Jha, M., Koppes, M., Kumar, A., Leinss, S., Majeed, U., Mal, S., Muhuri, A., Noetzli, J., Paul, F., Rashid, I., Sain, K., Steiner, J., Ugalde, F., Watson, C. S., and Westoby, M. J.: A massive rock and ice avalanche caused the 2021 disaster at Chamoli, Indian Himalaya, Science, 373, 300–306, https://doi.org/10.1126/science.abh4455, 2021.
Sidle, R. C. and Ziegler, A. D.: The dilemma of mountain roads, Nat. Geosci., 5, 437–438, https://doi.org/10.1038/ngeo1512, 2012.
Somos-Valenzuela, M. A., McKinney, D. C., Byers, A. C., Rounce, D. R., Portocarrero, C., and Lamsal, D.: Assessing downstream flood impacts due to a potential GLOF from Imja Tsho in Nepal, Hydrol. Earth Syst. Sci., 19, 1401–1412, https://doi.org/10.5194/hess-19-1401-2015, 2015.
Stolle, A.: Catastrophic Sediment Pulses in the Pokhara Valley, Nepal, University of Potsdam, https://publishup.uni-potsdam.de/opus4-ubp/frontdoor/deliver/index/docId/41334/file/stolle_diss.pdf (last access: 16 September 2022), 2018.
Stolle, A., Bernhardt, A., Schwanghart, W., Hoelzmann, P., Adhikari, B. R., Fort, M., and Korup, O.: Catastrophic valley fills record large Himalayan earthquakes, Pokhara, Nepal, Quat. Sci. Rev., 177, 88–103, https://doi.org/10.1016/j.quascirev.2017.10.015, 2017.
Stolle, A., Schwanghart, W., Andermann, C., Bernhardt, A., Fort, M., Jansen, J. D., Wittmann, H., Merchel, S., Rugel, G., Adhikari, B. R., and Korup, O.: Protracted river response to medieval earthquakes, Earth Surf. Process. Landforms, 44, 331–341, https://doi.org/10.1002/esp.4517, 2019.
Talchabhadel, R., Karki, R., Thapa, B. R., Maharjan, M., and Parajuli, B.: Spatio-temporal variability of extreme precipitation in Nepal, Int. J. Climatol., 38, 4296–4313, https://doi.org/10.1002/joc.5669, 2018.
Thapa, B., Watanabe, T., and Regmi, D.: Flood Assessment and Identification of Emergency Evacuation Routes in Seti River Basin, Nepal, Land, 11, 1–33, https://doi.org/10.3390/land11010082, 2022.
UN Office for the Coordination of Humanitarian Affairs – Field Information Services Section (OCHA FISS): Nepal – Subnational Administrative Boundaries, Humanit. Data Exch., https://data.humdata.org/dataset/administrative-bounadries-of-nepal (last access: 5 January 2022), 2020.
United Nations Department of Economic and Social Affairs: World Population Prospect 2019, World Population Prospect, https://population.un.org/wpp/ (last access: 13 January 2022), 2019.
Vuichard, D. and Zimmermann, M.: The 1985 Catastrophic Drainage of a Moraine-Dammed Lake, Khumbu Himal, Nepal: Cause and Consequences, Mt. Res. Dev., 7, 91–110, https://doi.org/10.2307/3673305, 1987.
Wang, W., Gao, Y., Iribarren Anacona, P., Lei, Y., Xiang, Y., Zhang, G., Li, S., and Lu, A.: Integrated hazard assessment of Cirenmaco glacial lake in Zhangzangbo valley, Central Himalayas, Geomorphology, 306, 292–305, https://doi.org/10.1016/j.geomorph.2015.08.013, 2018.
Westoby, M. J., Glasser, N. F., Brasington, J., Hambrey, M. J., Quincey, D. J., and Reynolds, J. M.: Modelling outburst floods from moraine-dammed glacial lakes, Earth-Sci. Rev., 134, 137–159, https://doi.org/10.1016/j.earscirev.2014.03.009, 2014.
Wohl, E. E.: Uncertainty in Flood Estimates Associated with Roughness Coefficient, J. Hydraul. Eng., 124, 219–223, https://doi.org/10.1061/(asce)0733-9429(1998)124:2(219), 1998.
Zhang, T. and Wang, W.: Development of monitoring and early warning system for Cirenmaco glacial lake in the central Himalayas, Int. J. Disaster Risk Reduct., 73, 102914, https://doi.org/10.1016/j.ijdrr.2022.102914, 2022.
Zhang, X. and Liu, S.: A framework of numerical simulation on moraine-dammed glacial lake outburst floods, J. Arid Land, 7, 728–740, https://doi.org/10.1007/s40333-015-0133-x, 2015.
Zheng, G., Allen, S. K., Bao, A., Ballesteros-Cánovas, J. A., Huss, M., Zhang, G., Li, J., Yuan, Y., Jiang, L., Yu, T., Chen, W., and Stoffel, M.: Increasing risk of glacial lake outburst floods from future Third Pole deglaciation, Nat. Clim. Chang., 11, 411–417, https://doi.org/10.1038/s41558-021-01028-3, 2021.