the Creative Commons Attribution 4.0 License.
the Creative Commons Attribution 4.0 License.
 | 08 Sep 2022
Reliability of flood marks and practical relevance for flood hazard assessment in southwestern Germany
Annette Sophie Bösmeier
Iso Himmelsbach
Stefan Seeger
Flood marks are rarely utilized in hazard assessment, mainly because of a lack of data availability and accessibility and mistrust in their reliability. Challenging these common assumptions, we present an approach for evaluation and practical utilization of flood marks by the example of the Kinzig River, a Rhine tributary from the Black Forest with a history of severe floods. We combined written documents describing flood marks with field mapping at three study sites and collected information relating to 89 marks – about 50 % of them still preserved – which refer to ≥15 large floods between 1824 and 1991. The inclusion of a detailed historical-mark survey enabled an assessment of changes through time for each flood mark: they extend from small (±15 cm) imprecisions in mark heights to considerable uncertainties in position, height, and displayed date for some modified marks. Plausibility checks with further data nevertheless demonstrated good overall consistency. We then juxtaposed these marks with the current, modeled flood hazard maps. A wide agreement is apparent, in that the large majority of marks are situated at probable heights and within the modeled flooding area associated with extreme floods. For the few exceptions, we see plausible and historically sound reasons in changed local hydraulic conditions by flood protection walls, exceptional processes during a massive ice jam, and possibly also a local underestimation of hazard along Kinzig River tributaries. Overall, this study highlights (1) the broad availability of flood mark data, both on a larger spatial scale and with regard to already vanished marks, and (2) the significance of the marks, verified by further data, and also demonstrates (3) the possibility of a straightforward inclusion in hazard assessment. We thus encourage the systematic collection, maintenance, and integration of flood marks as responsible risk management, not least regarding their value in the wider context of risk awareness and memory.
- Article
(8151 KB) - Full-text XML
- BibTeX
- EndNote


Floods represent an enormously destructive, costly, and fatal natural hazard in Europe on a local to supra-regional scale (European Environment Agency, 2010), which the example of the most recent extreme event in western Europe in July 2021 clearly demonstrated. Generally, adverse consequences of flooding with regard to areas and persons affected have increased during the past 150 years (Paprotny et al., 2018). Although observed streamflow records show high interdecadal variability affecting trend detection both with respect to magnitude and direction (Hannaford et al., 2013), Kundzewicz et al. (2018) found a rising trend in the number of severe floods with a large magnitude. In parts of Europe, the threat of floods is even likely to continue to grow in the near future: current climate change appears to have already altered flood frequencies over the past decades, leading to a precipitation-driven increase in floods in northwestern Europe in contrast to decreasing floods in southern and eastern Europe (Blöschl et al., 2019). Despite the detected spatiotemporal heterogeneity, these trends largely comply with results from climate change projections and hydrological modeling (Thober et al., 2018).
Good flood risk management is thus essential to minimize adverse effects of flood events, not solely but also regarding a changing climate. Preventive and protective measures as well as adequate coping strategies, such as coordinated early alert, strengthen preparedness towards floods (Merz et al., 2011). Thereby, measures aim both at the vulnerability aspect in flood risk, which designates the exposition of a place and the sensitivity of its assets, and at the hazard aspect in risk. The latter designates the probability and magnitude of floods, usually defined by statistical return periods and associated peak discharges. Policy instruments in flood risk management, for instance, the flood risk maps required by the European Floods Directive (2007/60/EC) or flood protection measures, are often rigorously oriented towards “design floods”, such as the 100-year flood (Parkes and Demeritt, 2016).
Therefore, the assessment of flood hazard plays a key role in flood risk management, as it is vital to estimate future risk as precisely as possible. However, extreme floods are rare events, and systematic discharge records, which form the basis for a statistical flood frequency analysis, often do not contain large floods. The extrapolation from short systematic measurements can hence induce considerable uncertainty to flood hazard estimates (e.g., Di Baldassarre and Montanari, 2009). Continuous refinement of quantitative methods in flood frequency analysis (e.g., Leese, 1973; Stedinger and Cohn, 1986) allowed for compensating the scarcity of systematic measurements to a certain extent by a temporal, spatial, and causal information extension (Merz and Blöschl, 2008). Temporal information extension, i.e., adding quantitative estimates of single historical extreme floods, can significantly decrease uncertainties in the flood hazard assessment, as many studies demonstrated (e.g., Hosking and Wallis, 1986; Payrastre et al., 2011; Viglione et al., 2013). Although its inclusion is meanwhile a standardized procedure regarding the methodology, historical flood information still has unrealized potential (Kjeldsen et al., 2014). Note that we use the term “historical information” for data derived from human observation, e.g., written documentary sources and early-instrumental records, excluding, however, official systematic measurements, as discussed for instance by Brázdil et al. (2005).
Documentary evidence represents a necessary basis for the reconstruction of the historical flood record and quantitative estimates, which may serve as additional input data for hazard analysis. Methods for the systematic collection, critical assessment, classification, and quantification of historical floods have been developed within the area of historical climatology and hydrology (e.g., Glaser et al., 2010). Comprehensive reviews with a focus on Europe are presented by Brázdil et al. (2006) and Benito et al. (2015). They refer to a large number of studies that utilized historical documentary evidence and could thereby provide insight into the variability, seasonality, causes, and impacts of floods preceding the systematic measurements. Only this knowledge allows for putting recent flood trends into context, as, e.g., Blöschl et al. (2020) demonstrated by identifying the recent decades as one of several flood-rich periods of the last centuries yet with specific hydroclimatic conditions. Also under non-stationary hydrological conditions, historical information can be included in frequency analysis (Machado et al., 2015). Even if insufficient for a local flood frequency analysis, historical information, such as landmarks reached by the flood, can be of use: for instance, the most severe historically documented floods may serve as a benchmark for modeled extreme events or safety risk analysis (Benito et al., 2015). Hence, the historical perspective adds value to flood research and risk management despite various sources of uncertainty in documentary data or climate-change-induced non-stationarities affecting flood generation.
Flood marks are an important historical source besides the pictorial documentation of floods and diverse printed or written historical sources, such as economic records, newspapers, annals, and chronicles (Brázdil et al., 2006). Carved into bridge abutments, gates, or house walls, the markings remind one of disastrous floods that occurred centuries ago. They illustrate the maximum flood water level at a specific location in varied appearance, mostly by a horizontal line accompanied by the year of the flood. Located at a river cross-section with a known water level–discharge relationship and a sufficient comparability to the historical situation, flood marks can be utilized to estimate the flood peak discharge (Macdonald, 2007; Herget et al., 2014). In this sense, they can provide valuable information for the flood hazard estimation. At the same time, the small monuments are societal relicts of the past, form part of the cultural heritage, and should be protected as such. By increasing public awareness of severe floods, flood marks can contribute essentially to the continuity of a collective risk memory and a risk culture affirm Metzger et al. (2018) and Martin et al. (2018). Thereby, the marks help to build more flood-resilient communities (McEwen et al., 2017). In France, the significance assigned to flood marks for the development of a lasting risk culture even led to the adoption of a law in 2003 to install, protect, and maintain both new and historical flood marks (Article L563-3, Code de l'environnement).
Often, flood marks are the only measurable indication of the dimension of a historical flood; thus they are part of many studies that ultimately aim at a flood frequency analysis (e.g., Benito et al., 2003; Naulet et al., 2005; Payrastre et al., 2005; Parkes and Demeritt, 2016; Macdonald and Sangster, 2017). While flood marks are often considered valid sources, several caveats have to be taken into account (Wetter, 2017). Not only do they provide relatively rudimentary information compared with the spatiotemporal complexity of a flood event (Metzger et al., 2018), but they can also be affected by various error sources, e.g., with regard to the time of the installation of a mark, the accuracy of its height, or a relocation or alteration at a later date (e.g., Macdonald, 2013). Moreover, changes over time, e.g., altered hydraulic conditions caused by new buildings or protection measures, might distort assumptions. Therefore, a critical assessment of different pieces of information – a basic procedure in historical hydrology (Brázdil et al., 2006) – is also pivotal when utilizing flood marks. While cross-checking with other sources is a general requirement (e.g., Glaser et al., 2010), and alterations of mark inscriptions as well as relocation of marks have been described (Deutsch, 1997; Metzger et al., 2018), a systematic multi-temporal investigation of the credibility and usefulness of flood marks has not been published yet. To our knowledge, actually only a few studies exist that drew on a large number of spatially distributed flood marks to assess flood hazard (Deutsch, 1997; Pekárová et al., 2013; Luu et al., 2018). However, a systematic comparison of several marks at different points in time in addition to other sources may reveal consistencies and discrepancies, show changes over time, and finally increase our knowledge of uncertainties in historical flood data.
In southwestern Germany, numerous flood marks have been installed over 2 centuries. Exceptionally rich information is available regarding both the flood history (e.g., Himmelsbach et al., 2015) and the marks, of which many have already vanished. Based on these data, we aim to shed light on questions of uncertainty and imprecision in flood mark information. For this study, we collected flood marks at selected communities within the Kinzig catchment, where flood hazard is still an important issue despite a long-time endeavor in flood protection. We evaluated the preservation and plausibility of historical flood marks and examined mark relocations, if observed, regarding indications and the extent of change.
At our study sites, neither recent nor century-old flood marks were utilized in the creation of the current flood hazard maps (FHMs), even though knowledge of historical floods can add value as additional evidence on flood hazard despite uncertainties (Merz et al., 2011). Specifically, observations of large floods of the past can help to estimate the potential extent of extreme flood scenarios. The recent disastrous flood of the Ahr River, western Germany, in July 2021 may serve as example: this event was locally comparable to the magnitude of the largest historical events, but it far exceeded the systematic records (Roggenkamp and Herget, 2014; Thieken et al., 2021). Yet, the historical floods apparently had not been taken into account for the FHMs (Merz et al., 2021; Thieken et al., 2021). Even though the 2021 flood far exceeded the HQ100 (a 100-year flood), it might have been better anticipated if the historical floods had been considered. In our study, we therefore also assessed the compliance between the collected marks and the FHMs along the Kinzig River. On this basis, we finally discuss the general significance of flood mark information considering both uncertainties and limitations, and we point out potential feasible strategies to benefit more from this source of information.
2.1 Catchment characteristics
The Kinzig catchment is located in the west of Baden-Württemberg, southwestern Germany (Fig. 1). It extends from the central Black Forest mountain range with an altitude of about 1080 m down to the southern Upper Rhine valley at 134 m. With a size of 1406 km2, it is the largest tributary to the Upper Rhine River from the western side of the Black Forest. The catchment is to a large extent covered by a hilly to mountainous landscape and has a compact shape and a large headwater area with a number of narrow sub-catchments with a steep gradient. This contributes to rapid flood generation and high flood discharges, e.g., 1050 m3 s−1 for the 100-year flood in comparison to the annual mean flow of 23.5 m3 s−1 at the main gauge Schwaibach. Data were made available by the Landesanstalt für Umwelt Baden-Württemberg (LUBW, Baden-Württemberg State Institute for the Environment; LUBW, 2015).
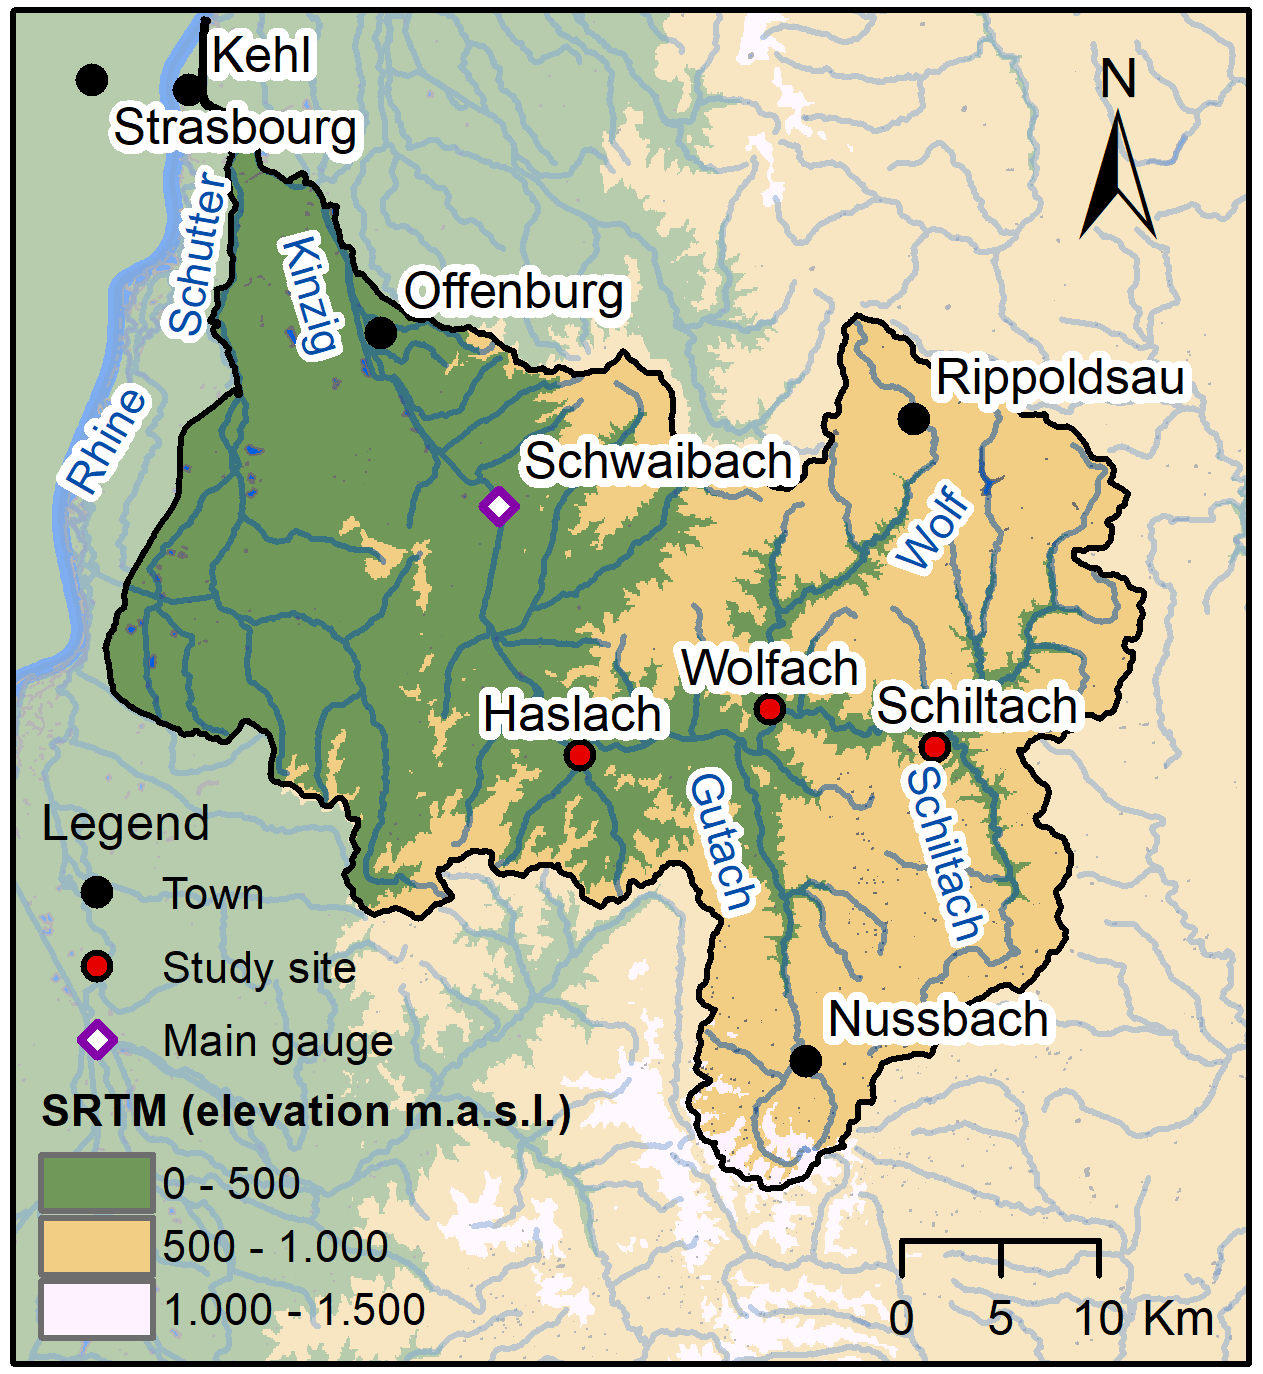
Figure 1The Kinzig catchment with its main tributaries and relevant locations. Data are channel network and catchment shape from the Amtliches Digitales Wasserwirtschaftliches Gewässernetz (AWGN) provided by the LUBW and SRTM (Shuttle Radar Topography Mission; Jarvis et al., 2008).
The climatic conditions of the region are characterized by a mid-latitude temperate climate with superimposed orographic effects specifically regarding the catchments' position on the windward side of the Black Forest. Data provided by the Deutscher Wetterdienst (DWD, Germany's national meteorological service) show a wide range of long-term mean annual precipitation between the lowlands (890 mm at Offenburg), the middle catchment (1100 mm at Haslach), and the mountainous region (1890 mm at Bad Rippoldsau and 1370 mm at Triberg-Nussbach). The lower stations display a rather uniformly distributed, year-round precipitation. By contrast, the Black Forest region, which is decisive regarding the discharge generation, tends to a winter maximum.
Consequently, the Kinzig River has a pluvio-nival discharge regime with a maximum in November to March and a minimum in August, with reference to measurements at the main gauge at Schwaibach between 1914 and 2015 (data: LUBW). Accordingly, floods occur often during the winter half-year. The most destructive events tend to occur between late October and March. These floods were caused by extensive, often long-lasting and heavy, rainfall and were frequently intensified by snowmelt or rain on snow. Occasionally, highly destructive though rather local floods were caused by an ice jam (winter) or torrential rainfall (summer).
The knowledge about historical floods in the region is particularly good with respect to the last 250 years. This can be explained by the repeatedly high impact of recurring large flood events, which encouraged their tradition. Besides that, a river rectification program was initiated by Johann Gottfried Tulla in the early 19th century, mainly motivated by expanding the arable land (Himmelsbach, 2014). These river training measures came along with a closer observation of the river, such as the installation of a gauge at Schwaibach as early as in the 1830s, providing an unusually long record. Moreover, the general availability of documentary sources has increased over the past centuries.
Flood hazard is still an important current issue in the entire Kinzig valley. This is not only demonstrated by recurring reports in the local and regional press, for instance, regarding recent flood damages, affected locations, adopted measures, and the status of protection measures in the planning process (e.g., Heppner, 2020). The continuous enhancement of flood protection strategies, achieved with considerable investment, also reflects the strong commitment of municipalities and the state. Nevertheless, the current flood situation is still critical in some places. In Wolfach, for example, many buildings are located within the area flooded during a 100-year flood according to the official FHMs.
2.2 Study sites
This study focused on three towns in the middle and upper Kinzig catchment: Wolfach and Haslach, both medium-level centers of the southern Upper Rhine region, and the rural-area community of Schiltach (Fig. 1). Wolfach marks the boundary between the middle and upper catchment and extends across the Kinzig valley at a narrower valley section. Its medieval suburb is directly located at the confluence between the Kinzig and its tributary river, Wolf, which together with the general catchment characteristics make the town a true “bottleneck” of the Kinzig valley. Thereto related is the comparably high density of flood marks bearing evidence of a long history of devastating floods, which made Wolfach the starting point of this study. Haslach, about 12 km downstream of Wolfach, is the westernmost location. It is situated directly south of the Kinzig River. Schiltach, the smallest town, lies 10 km upstream of Wolfach. Similarly to Wolfach, it extends across the entire narrow valley and is also located at the confluence of the Kinzig with a tributary river, the Schiltach. The sites of Schiltach and Haslach were selected additionally to Wolfach due to their proximity and the existence of a number of flood marks enabling a longitudinal comparison of several events.
3.1 Flood information from documentary data and measurements
The publications by the Centralbureau für Meteorologie und Hydrographie im Grossherzogthum Baden (CMH, Central Office for Meteorology and Hydrology of the Grand Duchy of Baden; later written as Zentralbureau für Meteorologie und Hydrographie im Großherzogtum Baden) fundamentally contributed to the reconstruction of the Kinzig flood history in addition to various continuous or individual sources on historical floods (Himmelsbach, 2014). Founded in 1883, the CMH published yearly reports as well as special issues on hydrometeorological observations for the area of the former Grand Duchy of Baden between 1884 and 1915.
The primary documentary source utilized in this study is a large-scale historical survey of flood marks undertaken by order of the CMH during the years 1902–1904. The results of this survey were published in the 13th volume of Beiträge zur Hydrographie des Grossherzogtums Baden (Contributions to the hydrography of the Grand Duchy of Baden; CMH, 1908, 1911). The collection includes about 2560 flood marks within the former Grand Duchy, more than 300 of them located in the Kinzig area. Drawings of the individual marks and their relative position on buildings or walls and, at a smaller scale, within map sections can be found in CMH (1908). CMH (1911) lists the assigned flood mark identification numbers, the associated river and the locations in river kilometers, a description of the flood mark, and the heights above the ground in meters above sea level (m a.s.l.). Rarely, series of 19th-century peak water levels at historic gauges are also documented, allowing for comparing different floods with each other.
Furthermore, discharge measurements and documentary sources provided background information. It was utilized to identify the events represented by the collected marks, set them in relation to each other, and put them in the long-term context of flooding. Specifically, early gauge measurements including notable 19th-century floods were available, published by the CMH in a special report (CMH, 1884) and on a yearly basis until 1915. Continuous daily (1914–1967) to hourly (1968–2016) discharge measurements for the gauge at Schwaibach were provided by the LUBW. In addition, a long, index-based record of historical Kinzig floods dating back to the 16th century was contributed by Himmelsbach (2014). It is based on written documentary data, such as the chronicle of Adolph Christoph Trautwein (1818–1898) of Schiltach (Christoph Trautwein, unpublished data) or the chronicle of the town of Wolfach (Disch, 1920). The latter represents one of the most valuable and continuous written sources. The individual quotes utilized by Himmelsbach (2014) are for the most part available in the collaborative research environment of https://tambora.org/ (last access: 15 April 2019) (Riemann et al., 2016). The historical flood record was also updated and combined with discharge reconstructions based on early-instrumental measurements of water level maxima during floods (1845–1882) and monthly maxima (1882–1914) at the gauge at Schwaibach by Bösmeier (2020). The updated Kinzig flood record comprises 308 flood events between 1500 and 2016. Discharge data could be assigned to 35 % of these events.
3.2 Flood mark collection
The collection of flood mark information at the study sites included both archival research and the mapping of flood marks in the field. In advance of the fieldwork, the documentation of the historical survey by the CMH (CMH, 1908, 1911) was consulted. Currently existing flood marks in the study sites were then mapped in 2018 and 2021. Mapping was undertaken utilizing a handheld GNSS (global navigation satellite system) receiver (a Trimble GeoExplorer® 6000 Series); a folding pocket rule for measuring the heights above the ground; and photo documentation to record flood mark locations, heights, and appearance.
For mapping, the following procedure was used: the historically documented flood mark locations were checked initially. The search was then extended to the further vicinity so that the main parts of the town centers close to the river were covered. In Wolfach, the marks within a radius of 750 m around the confluence between Kinzig and Wolf were recorded. In the smaller town of Schiltach, the confluence between Kinzig and Schiltach as well as the area extending approximately 500 m upstream along both rivers was examined. In Haslach, the historical town center is not directly located along the Kinzig. Thus, the area north of the center including the industrial canal and the adjacent 500 m Kinzig River section were examined. Mapping generally was undertaken without any claim of completeness.
Since satellite reception was limited in some narrow streets, the recorded coordinates were subsequently verified by reviewing their positions in Google Earth Pro (2020). In order to georeference the historical map sections in CMH (1908), the mapped marks were then compared with the historical maps which include the flood mark positions but do not display any coordinates. This allowed for restoring the coordinates of “lost” historical marks which had been destroyed, removed by construction works, or just had disappeared over time due to weathering of the rock. The mapped and photo-documented marks were finally collated with the detailed descriptions and illustrations in CMH (1908).
3.3 Assessment of flood mark plausibility and preservation
The gathered multi-temporal data set contains the results of the recent field survey on flood marks, the historical survey, and further qualitative and quantitative information on floods. These data present not only a unique basis to investigate which marks were preserved or vanished over the years but also a framework that can be used to rate the plausibility of a flood mark. Moreover, the data enabled for checks to be made to determine whether marks had been altered or moved since the beginning of the 20th century and, if so, reveal to what extent these changes affected the marks regarding their location, height, or inscriptions. Such information is necessary for assessing the value of a mark as a substantial indication of the dimensions of historical floods and the potential extent of uncertainties.
As first step, all collected flood marks including both preserved and historically documented marks were cross-checked with measurements and additional written descriptions. Therefore, the marks initially were grouped by associated flood events with the flood year as reference. It was checked (1) whether the events documented by the flood marks are plausible with regard to the flood discharge record and (2) whether they are backed with written descriptions, such as reports or chronicle entries. (3) Finally, a qualitative comparison between the written evidence and the marks regarding the mark locations, heights, or inscriptions followed. Noticeable compliance as well as clear discrepancies with the written evidence were noted. All marks were tagged as questionable in regard to the further analysis if they could not be matched with a measured or described flood or if they showed discrepancies with written documents.
In a second step, for assessing flood mark preservation, a special focus was put on the historical flood mark survey at the beginning of the 20th century. Flood marks that had been recorded during that survey documented by the CMH (1908, 1911) were compared with the marks that were found to be still preserved at the sites. This allowed for (1) evaluating the overall mark preservation over the course of a century and drawing conclusions about potential reasons for the disappearance of marks. (2) A consistency check between the historical survey and the preserved marks followed regarding the mark location, height, inscription, and appearance. This allowed for marks to be identified that very likely had been reinstalled or moved and for assessing in how far the reinstallation had affected the mark.
3.4 Comparison with flood hazard maps
According to the European directive “on the assessment and management of flood risks” (2007/60/EC), member states had to undertake a preliminary risk assessment, produce maps for flood hazard and risk, and develop flood risk management plans by 2015. For the area of Baden-Württemberg, FHMs were created using regionalized hydrological data, catchment models, rainfall-runoff models, and hydrological studies (Reich et al., 2012). They display the extent of flooding which is likely to occur in the case of HQ10, HQ50, and HQ100, which designate floods with the return periods of 10, 50, and 100 years, respectively. The maps also show an area which may be flooded during a very rare, extreme scenario (HQextreme) which takes failure of protective measures and log jams at bridges or narrow passages into account (Ministerium für Umwelt, Klima und Energiewirtschaft Baden-Württemberg, 2016).
For this study, the current FHMs along the Kinzig between Schiltach and Haslach were provided by the LUBW (LUBW, 2018). In order to juxtapose the collected flood marks and the FHMs, a geospatial analysis was conducted. First, it was assessed whether the mark sites were located within or outside of the flooding areas in the FHMs. This enabled a local validation of the extent of flooded area in the FHMs. Then, the flooding depths of the FHMs at the flood mark sites were extracted. This allowed for a quantitative analysis of the flood mark heights with respect to the current flood hazard estimates. On the one hand, an event-specific relative comparison between mark heights and flooding depths was undertaken to test for consistency. On the other hand, exceptionally high marks were selected and individually examined with regard to their potential use in the flood hazard assessment. The analysis was carried out utilizing R (R Core Team, 2015) and the specific packages “raster” (Hijmans, 2020) and “rgdal” (Bivand et al., 2019).
4.1 Flood mark preservation and credibility
4.1.1 Collected marks
In this study, overall 89 flood marks were collected from historical documentary sources and/or were mapped in the communities of Haslach (15 marks), Wolfach (44 marks), and Schiltach (30 marks). These marks document at least 15 flood events between 1824 and 1991. About 70 % of them (62 marks) refer to 19th-century floods, and all of them but two marks are listed in CMH (1908). About 30 % of the marks (26 marks) date back to the 20th century and were in a very good condition at the time of mapping between 2018 and 2021. Only one mark in Wolfach could not be assigned to a specific flood, as strong weathering had obscured the inscription. In total, 46 of 89 marks are still preserved at the sites (status as of 2018–2021).
The majority of the flood marks were attached to houses along the river and to the river embankment, and some can be found at bridges or bridge abutments. Hence, they exist or existed in close proximity to the river. Yet, a few flood marks are also located at a distance of more than 100 m to the river (Fig. 2). While many single marks can be found, more than one mark has been installed at most locations. A gateway in Haslach once even displayed a series of eight different marks referring to some of the largest flood events of the past centuries (Fig. 3a). A large majority of the currently preserved marks are well visible from public places. Only a small number are strongly weathered or somewhat hidden so that a close look at the right location is necessary to discover the mark.
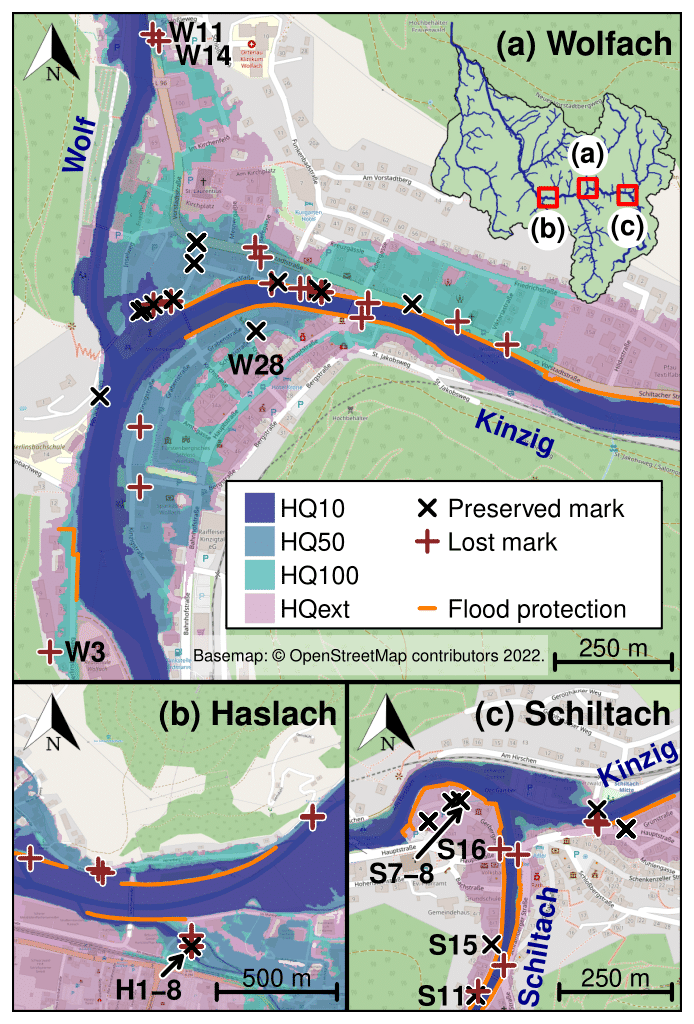
Figure 2Locations of collected marks, both preserved and lost but documented, at the three study sites (a–c). The flood protection walls and the areas most likely to be flooded during HQ10 to HQextreme (HQext) flood events were extracted from the FHMs (LUBW, 2018). The labels, which refer to the mark location by the site initials and to the utilized sequential numbering, e.g., H1, are displayed for particular marks. Basemap distributed under the Open Data Commons Open Database License (ODbL) v1.0.
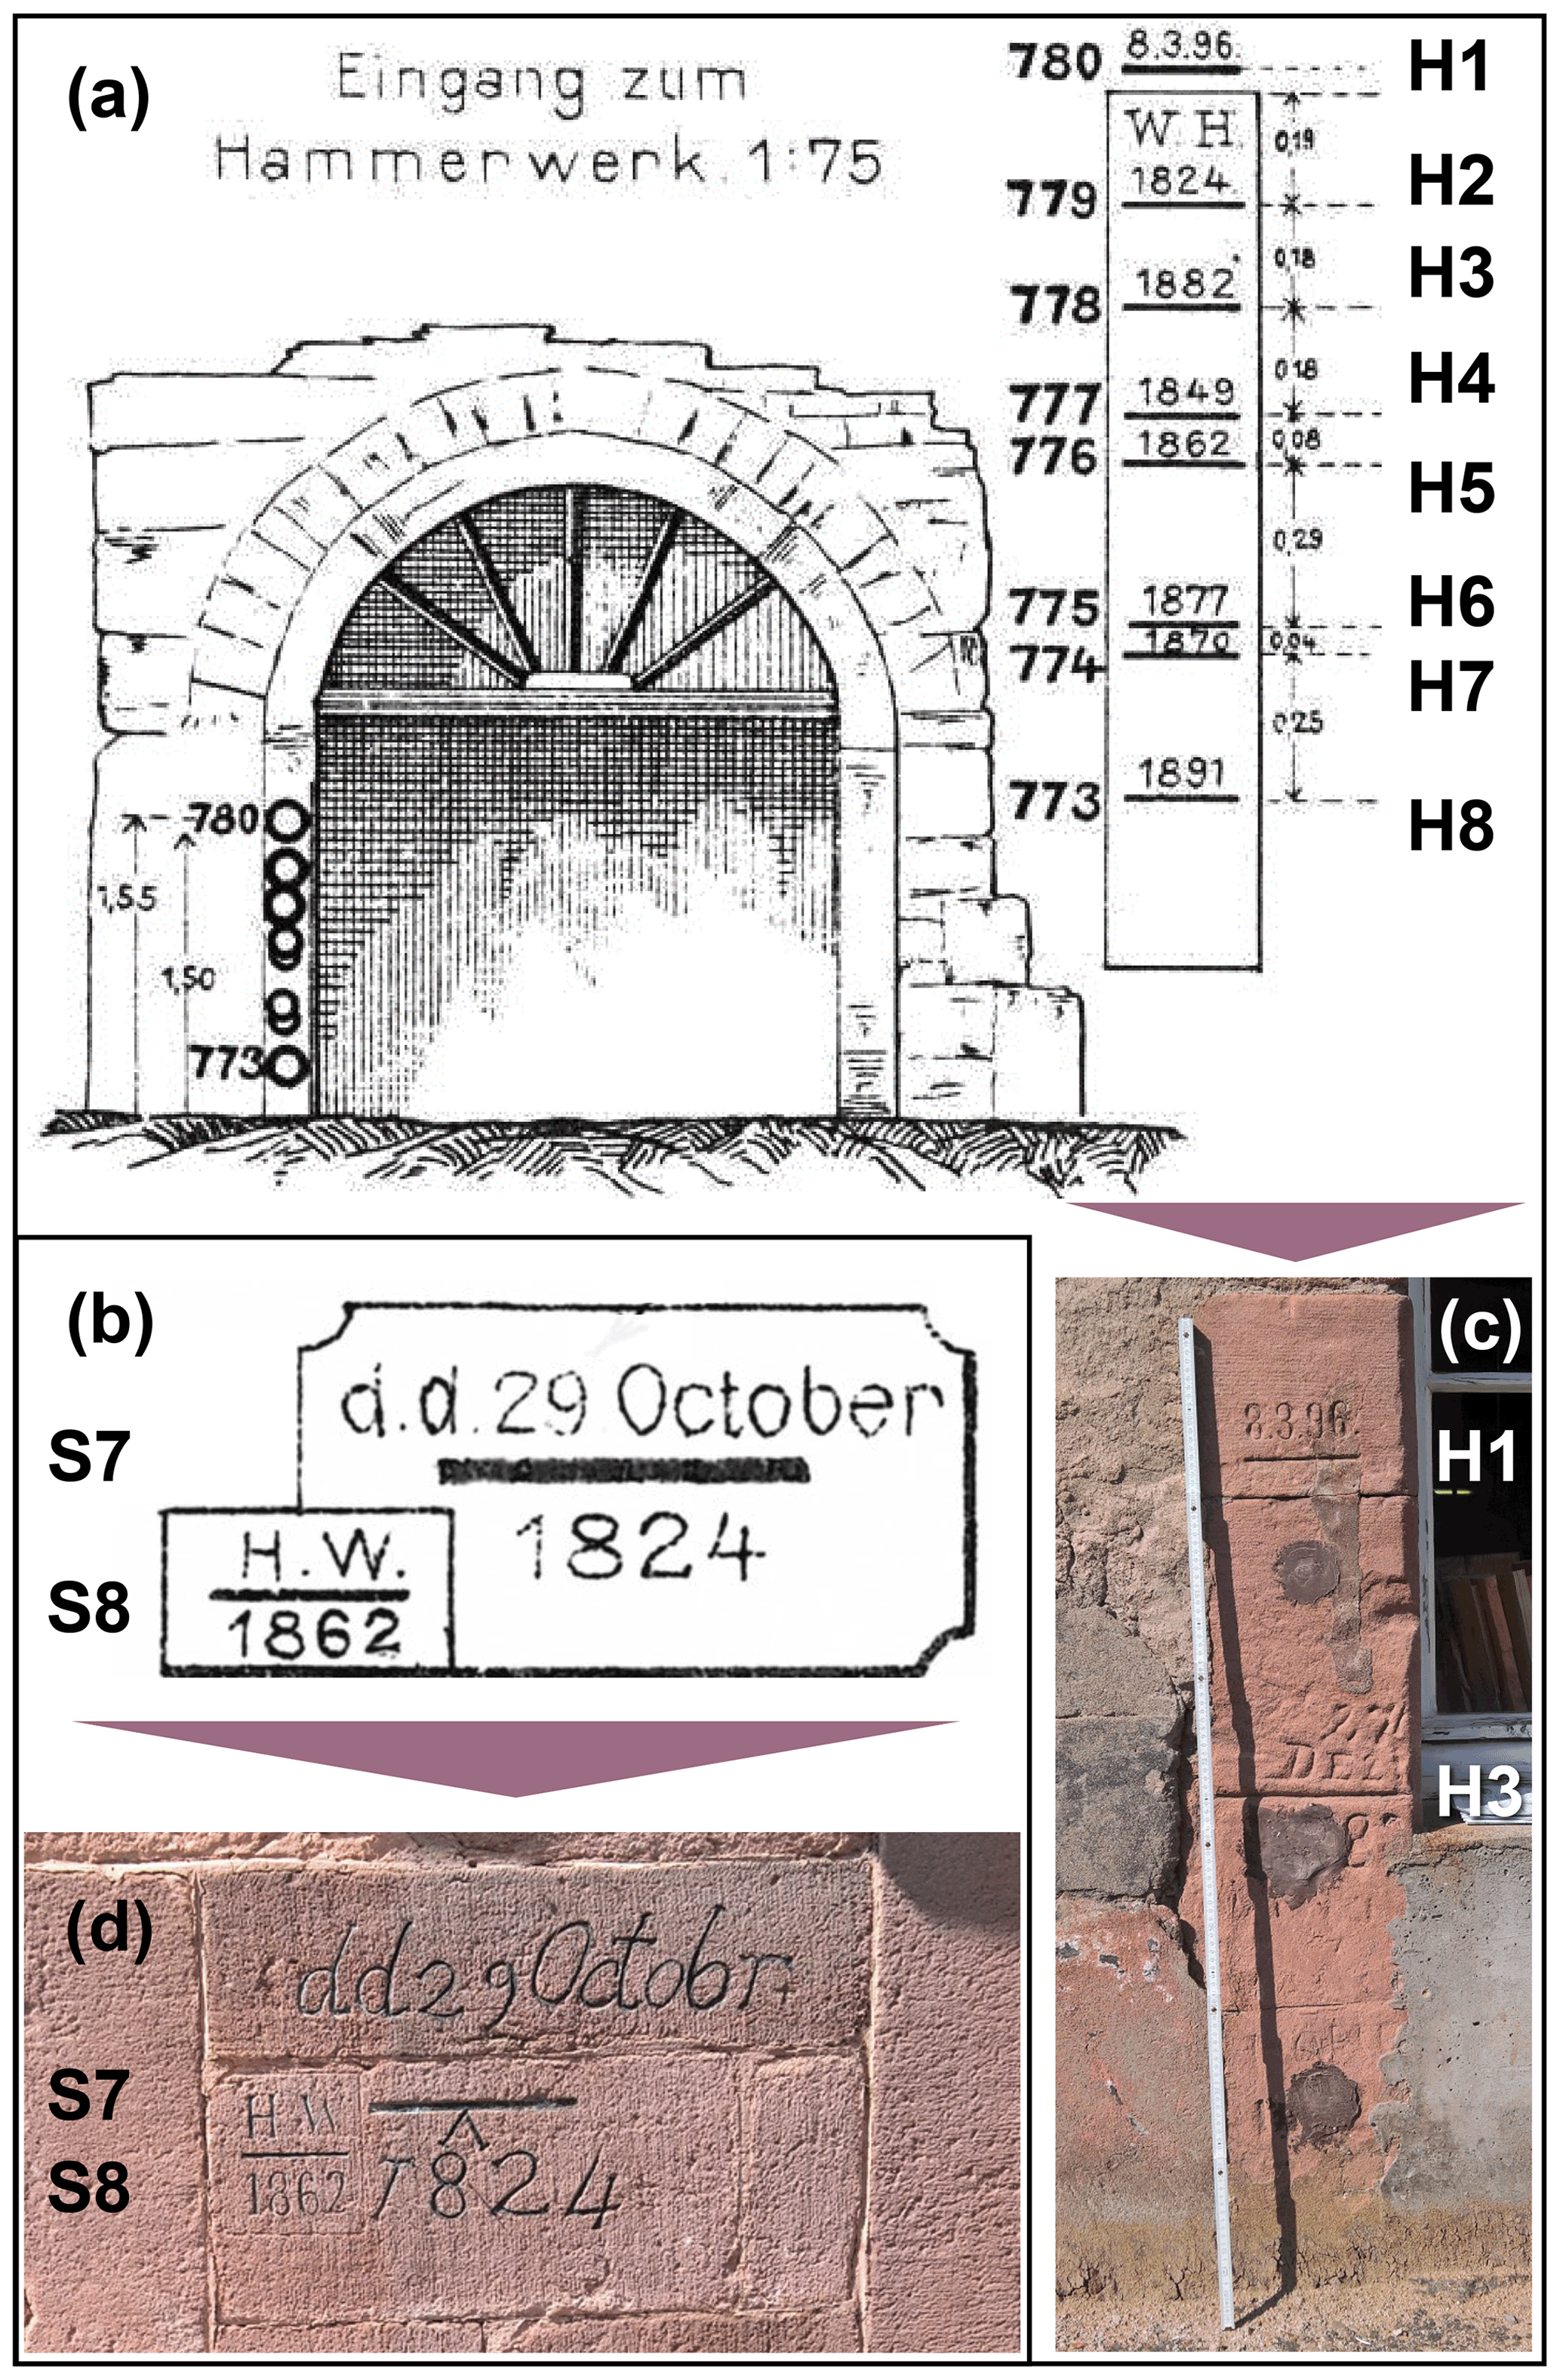
Figure 3Historical documentation of flood marks (modified from CMH, 1908) in Haslach (a) and Schiltach (b). The remaining preserved marks at these sites in July 2018 are displayed in (c) and (d). The labels refer to Fig. 2.
With regard to type and appearance, the mapped markings are mostly made of notches engraved in bricks or house walls, indicating the maximum flood level. A number of marks are located on particular stone slabs and a few on metal slabs. Most of the collected flood marks are not only engraved but also painted. Some older marks appear repainted, obviously in order to preserve the signs (Fig. 3d); however due to weathering, it is not always clear whether or not they initially also had been engraved. Typically, the year of the flood event is inscribed next to the notch, frequently in combination with the labels “H.W.” or Hochwasser, which is German for “flood”. Some marks even show the exact date of the flood, occasionally with the prefix “d.d.”, which is an abbreviation for the Latin de dato (“from the date”; see Fig. 3b and d).
4.1.2 Plausibility of the flood marks
A large consistency was found between flood marks in Haslach, Wolfach, and Schiltach and discharge measurements as well as written documents. To begin with, the flood record in combination with documentary evidence confirmed that the majority of events represented by flood marks were severe on a local to regional scale. A long flood record at the main gauge in Schwaibach was combined by Bösmeier (2020) from early-instrumental and systematic measurements (Fig. 4b). The gauge is located in the lower catchment; thus the return periods of measured events cannot be contrasted directly with single flood marks. The gauge measurements are nevertheless an approximate reference. In a synopsis with the flood mark record, they underline the credibility of flood marks as evidence on historical floods (Fig. 4). First, the events with the highest number of marks are 1882, 1896, and 1919, the three floods with the highest flood discharges in the past 150 years. Second, 10 out of 15 years represented by the flood marks correspond to the 10 highest reconstructed or measured discharges. The years 1824, 1830, 1849, and 1862 precede the beginning of available water level observations, but documentary sources verify extreme floods in these years. Only a single flood mark in Haslach (H8), referring to the year 1891, cannot be matched with a major flood. With a 5-year recurrence interval, the 1891 event may represent the smallest flood labeled with a flood mark at the study sites.
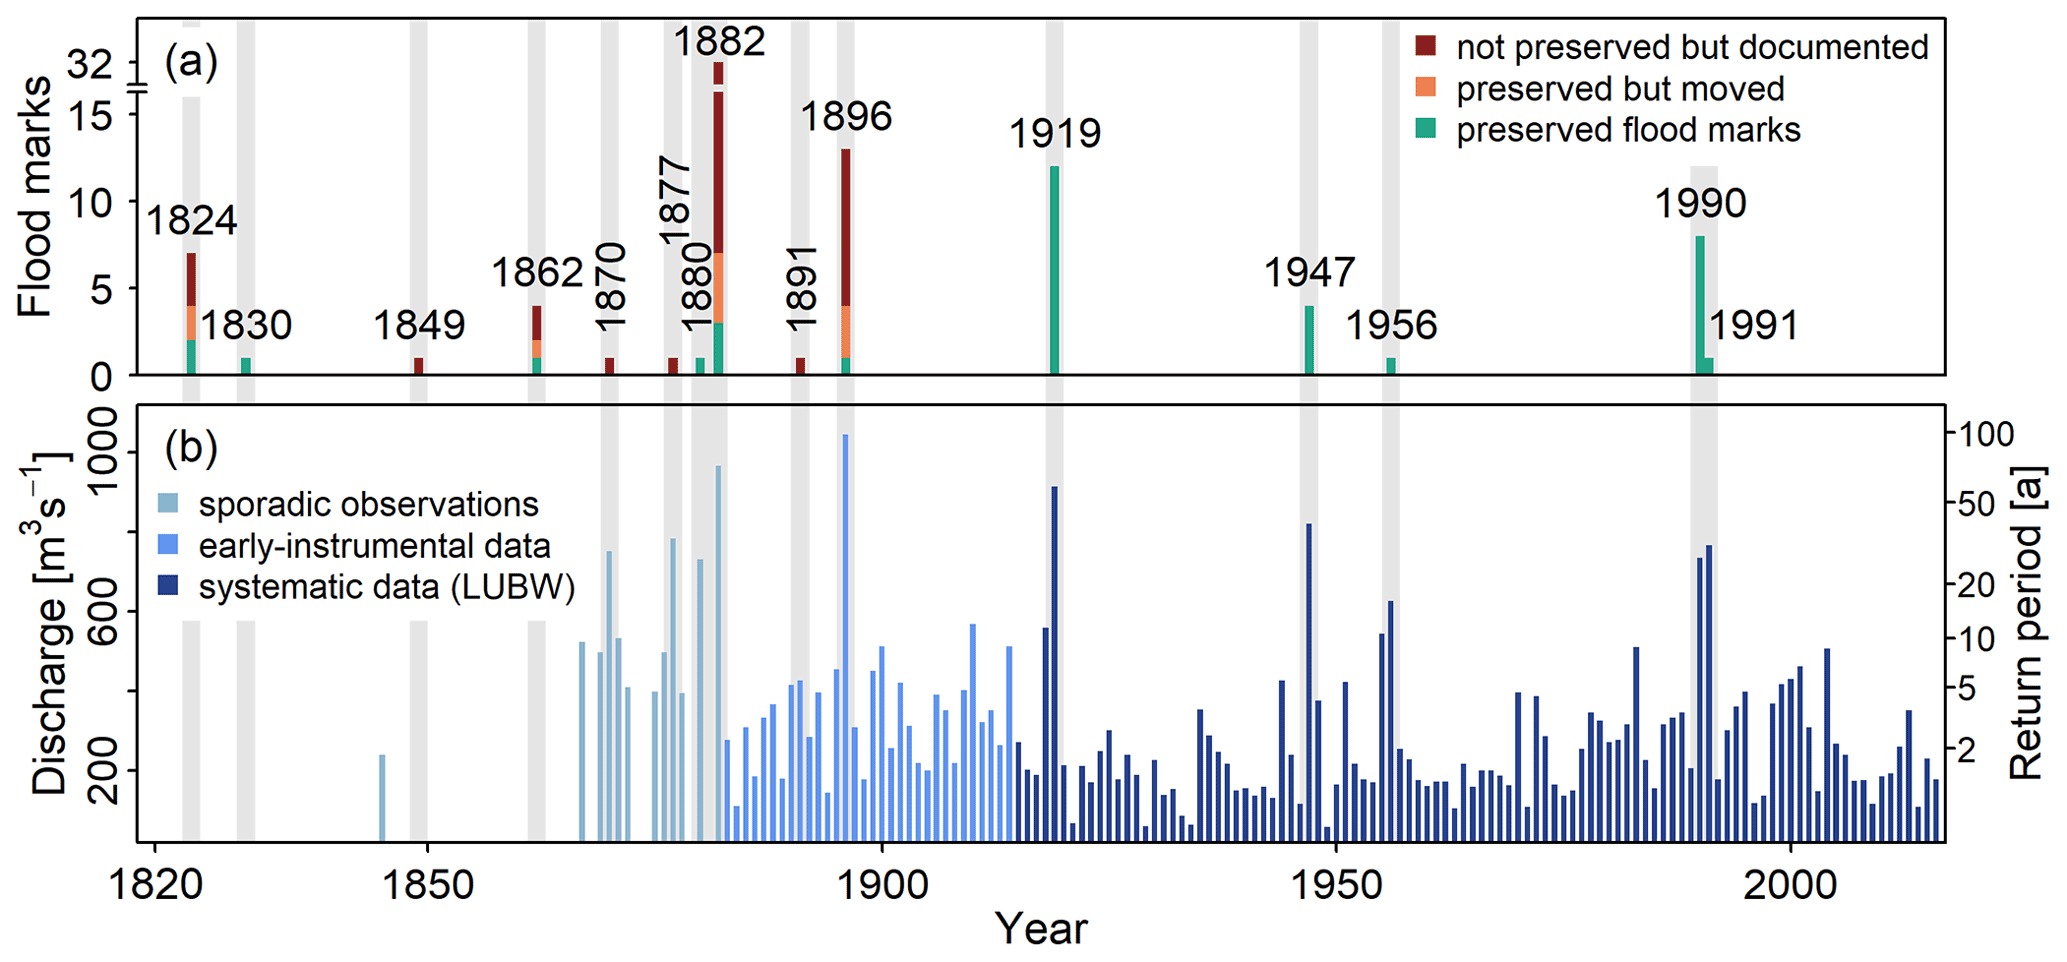
Figure 4Number of collected flood marks in Haslach, Wolfach, and Schiltach with red and orange bars showing deviations from the historical flood mark survey (a) and associated peak discharges at the gauge at Schwaibach (b). The record of annual discharge maxima combines data reconstructed from peak water levels (1845–1914) with systematic measurements since 1915 (Bösmeier, 2020).
A further systematic plausibility check demonstrated that the large majority of the marks are well supported by written sources, such as the chronicles of Schiltach (Christoph Trautwein, unpublished data) or Wolfach (Disch, 1920). These sources describe – in parts very detailed – the temporal evolution, extent, or severity of the floods. First, all flood marks, except one, could be associated with flood events that were documented by written information. Reports were only missing for the 1891 mark in Haslach, which as a consequence was classified as questionable. Second, the qualitative comparison between the marks and the content of the associated written documents did not reveal explicit and considerable discrepancies. By contrast, some statements literally verify particularly high marks by describing the extent or maximum water level in reference to specific landmarks, buildings, or bridges. One example represents the extreme flood in 1896, when the Kinzig tributary Wolf tore parts of the graveyard in Wolfach away (Disch 1920). Another example is the disastrous ice jam in 1830: according to the chronicle of Wolfach, the flood followed a very cold winter. Since a large amount of ice, unrooted trees, and other material blocked the riverbed in Wolfach, the Kinzig forged its way through the suburb (Disch, 1920). The consequence was an outstandingly high flood water level which even reached the first floor, as reports stated. This is documented by an extraordinary high mark in Wolfach (W28, Fig. 5c).
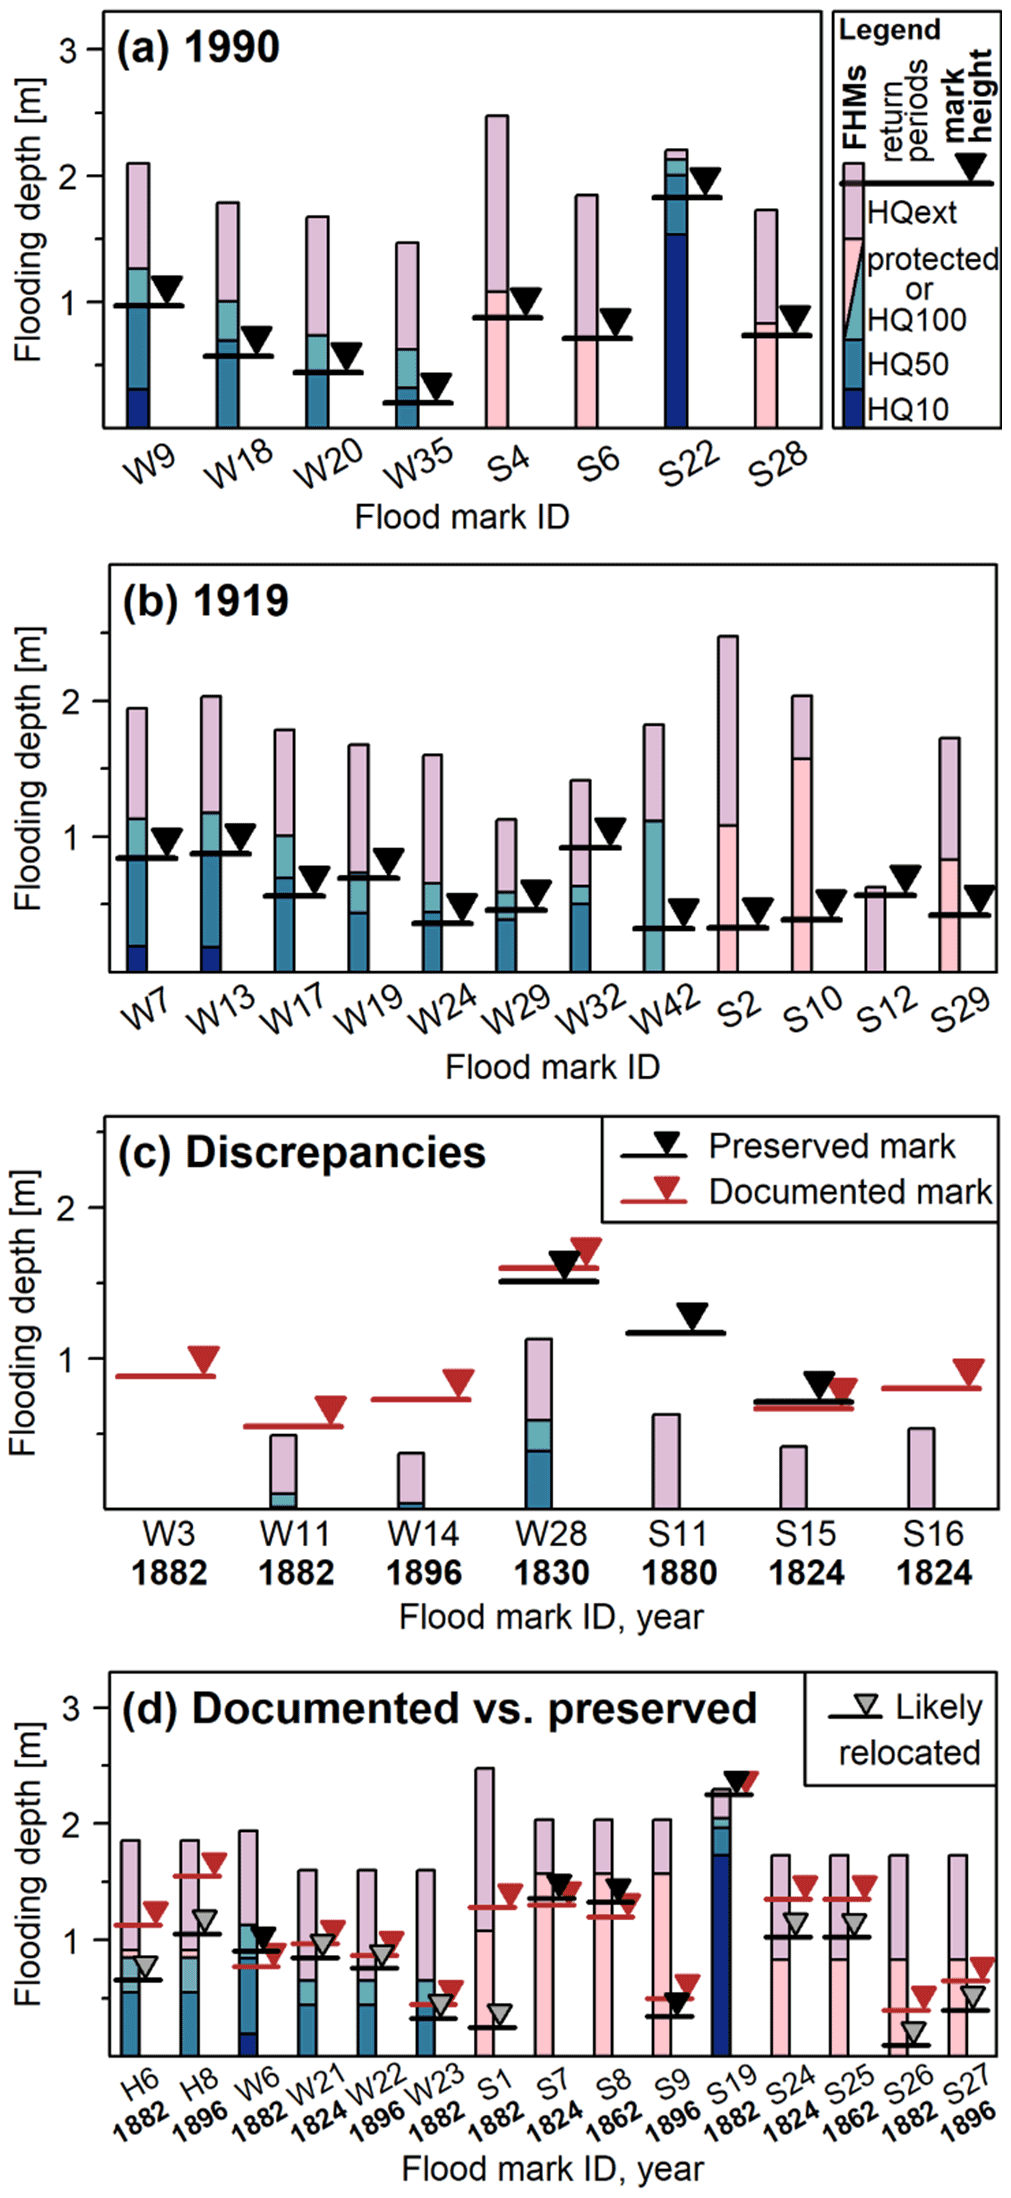
Figure 5Flood marks and the local flooding depths of the flood hazard maps (LUBW, 2018). All marks in Wolfach and Schiltach are displayed which refer to the flood on 15 February 1990 (a) or the flood in December 1919 (b) or which exceeded the HQextreme (c). All other pairs of documented and preserved marks with an indication of likely reinstalled marks are displayed in (d).
4.1.3 Flood mark preservation
The preservation and alteration of flood marks over the course of a century was assessed by comparing the historical flood mark survey at the beginning of the 20th century (CMH, 1908, 1911) with their status as of 2021 (Fig. 4a). Flood mark preservation turned out to be rather limited and appeared to be location dependent. Overall nearly a third of the 19th-century markings were still preserved, among them only 2 marks in Haslach (13 %), 6 marks in Wolfach (23 %), and 9 in Schiltach (50 % of the 18 marks documented for the 19th century). In addition, one mark (W3) at a private site could not be accessed (hence, it was not added to the preserved marks), and two marks (W16, S11) from the 19th century were not mentioned in CMH (1908) (hence, possibly installed post hoc).
It appeared that flood marks were less likely to be lost when installed at houses in the town (Schiltach and Wolfach) than positioned directly along the river (Haslach; compare Fig. 2). Generally, flood marks that had been attached to bridges before the 20th century were not found anymore, as the bridges across the Kinzig and its tributaries were frequently destroyed and rebuilt. Similarly, flood mark stones or pillars positioned along the river embankment or on roads close to the river were mostly not preserved. Likely reasons may be construction activities along the river such as the renewal or extension of dams, walls, roads, or the river embankment. The higher degree of mark preservation within the settlement is a fortunate coincidence. It might be connected with a special mindset towards flood hazard, related to the long history of recurring floods and the dependence on the river with regards to the century-old tradition of timber rafting, which is a particularity of the Kinzig area. By contrast, examples of intentional removal of flood marks from private places are also known in the region and beyond, even though flood marks are in many places protected by law. But even at the three study sites along the Kinzig, marks on house walls often did not outlast the 20th century due to rebuilding or new construction of houses as well as weathering. Nevertheless, the positions of lost marks on buildings could be reconstructed fairly accurate utilizing the documented historical map sections and reference points such as other buildings in the street. Lacking such close points of reference, the positions of vanished flood mark stones along the river in Haslach could only be approximated. This also reduced their value for the comparison with FHMs.
The consistency check between the preserved marks which had been documented during the survey undertaken by the CMH in the early 20th century also allowed for an examination of alterations over time. Several issues appeared and were regarded as an indication for relocation or reinstallation during the past 115 years: (1) a significantly modified mark height or position relative to building characteristics; (2) modified mark components such as the inscription, its position relative to the notch, a correction of outdated orthography, or other specifics; and (3) obvious signs of the renewal of a mark inscription, such as new paint or a new panel.
With regard to (1), note that building activity over the years often results in a change in ground elevation. Since it was not possible to quantify urban surface change at the three study sites within this work, its effects on the absolute flood mark height relative to the ground level are unknown. Thus, it was decided to define a range of tolerance: a mark height difference in comparison to the early 20th-century survey was designated as significant when exceeding 15 cm. This range was derived from the (maximum positive or negative) height deviations between historically recorded and still preserved flood marks, excluding preserved marks that had been noticeably relocated or significantly modified compared to their original status (compare Figs. 3a, c, and 5d). Moreover, height differences in this magnitude appeared plausible with respect to ground elevation changes due to construction or removal of footpaths during the 20th century and a common curb height between 5 and 15 cm in Germany.
Besides local base changes, an imprecision in the range of a few centimeters may easily have resulted from the historical source because the mark heights above the ground or their relative distance were digitized from sketches in CMH (1908). In that source, some mark heights occasionally were not explicitly specified; thus they needed to be measured directly from the relatively small sketches which implied inaccuracies.
The results of this consistency check showed that 10 out of 17 preserved flood marks likely had been moved and reinstalled (Fig. 4a, in orange). Yet, a considerable (> 15 cm) height difference between the historical and the current position was only found for seven marks, as shown in Fig. 5d. One potential reason may be the integration of cornerstones with engraved flood marks into new buildings, regardless of their original position, inducing significant alterations. This might have caused the 0.5 m height difference between the documented and preserved marks H1 and H3 in Haslach (Figs. 3a, c, and 5d). Then, 10 marks showed an insignificant height difference to their historical position, among them seven marks without and three with clear indications of reinstallation (Fig. 5d). Hence, some flood marks have been maintained and reinstalled close to the original after a new building construction. Nevertheless, even some marks in a very good condition – apparently maintained and repainted – were found to be significantly (about 30 cm) below their documented historical position (Fig. 5d, S24–27). Thus, clear signs of flood mark conservation are no proof for their trustworthiness. As a consequence, the historical information in CMH (1908) was generally assigned higher credibility if preserved marks showed considerable alterations. A precondition for this, however, was a successful plausibility check between the historical flood mark description and further written sources, as described above.
Nevertheless, the comparison between preserved marks and their historical documentation occasionally pointed towards some inaccuracies in the historical documents of the CMH. Again, the preserved marks in Haslach (Fig. 3a and c) serve as an example: even though the marks are weathered, the deviation between the documented inscription (“1882”) for H3 and the label recorded during fieldwork (“27 Dez 82”) is well visible. The preserved marks are most likely the remains of the historically recorded marks, and there was no apparent reasons for a later addition of the date. Hence, it appears as if the date was simply omitted during the survey of the CMH. This might be an isolated case. However, the repeated omission of a precise dating on flood marks would mean a significant loss of information, particularly for years with more than one severe flood, such as 1882.
4.2 Comparison of flood marks and flood hazard maps
The results of a geospatial analysis combining the flood mark positions and heights with the FHMs at the study sites demonstrated a wide agreement. They also reflected a range of uncertainty in the mark heights, particularly regarding the older marks. In addition, the analysis revealed a few inconsistencies, which required a closer examination and appeared to be of potential use in the flood hazard assessment. Note that the historical-mark heights could not be reconstructed for all marks that were documented but since then have vanished: in 7 (out of 60) cases, the documentation in CMH (1908) was imprecise or missing a reference to the ground level.
To begin with, the collected flood marks could not indicate clear gaps in the FHMs: the current FHMs at Haslach, Wolfach, and Schiltach show considerable flooding depths at all but 1 of 89 collected mark locations (Fig. 2). Thereby, the majority of the mark locations in Haslach and Wolfach match with flooding areas assigned to a 50- or 100-year flood. In Schiltach, many marks exist(ed) in places that have been protected by flood defenses up to a 100-year return period. However, these locations are still likely to be flooded during more severe events. The only exception, where a flood mark coincided with no flooding depths in the FHMs, is the mark W3 in Wolfach. This exception is however plausible because the mark was located close to a former side channel leading to a saw mill (CMH, 1887). The area of the former side channel has been protected, and local hydraulic conditions have changed since then.
An event-specific relative comparison between marks and FHMs demonstrated overall good agreement, which can be considered a mutual verification between marks and modeled hazard maps. In February 1990, for instance, the Kinzig catchment was struck by a severe flood with a recurrence interval between 20 and 50 years at Schwaibach in the lower catchment, with several flood marks recording local flood levels (Fig. 5a). Since long gauge records were not available directly at the study sites, it was not possible to reconstruct and assign local return periods to the marks using conventional flood frequency analysis approaches (Bösmeier, 2020). Therefore, the absolute FHM flooding depths could not be verified directly and precisely utilizing the flood marks. However, a relative comparison was possible: all four marks in Wolfach are placed at heights approximately corresponding to HQ50, adding confidence to the HQ50 estimation and mapping. In Schiltach, one mark (S22) also points to a flood between HQ20 and HQ50. However, three other marks are situated within an area protected against floods up to HQ100 by walls at the waterside of the Kinzig and its tributary, the river Schiltach. Hence, local hydraulic conditions cannot be compared with the situation during the flood of 1990. This may also explain why the recurrence intervals in Fig. 5a do not match with the other marks. Similar results, yet with larger deviations, were found for the extreme flood in December 1919, which was an event between HQ50 and HQ100 according to the measurements at Schwaibach (Fig. 5b).
Finally, a number of marks with extreme heights in comparison to the FHMs were found. Seven marks exceeded the modeled flooding depths of an HQextreme event, most of them quite considerably (Fig. 5c). Searching for factors that could explain these discrepancies, the individual cases were examined. Two of the seven marks are located along the Kinzig: W3, which appeared plausible as aforementioned, and W28. The latter is a reminder of the massive ice jam in Wolfach in February 1830, and its plausibility could be verified (Sect. 4.1.2). Strikingly, five of the seven marks above the HQextreme level were situated along tributary rivers. In Wolfach, W11 and W14 existed along the Wolf roughly 500 m upstream of the confluence between the Wolf and Kinzig. In Schiltach, S11, S15, and S16 were or still are situated along the Schiltach River. There, protective walls have been installed (Fig. 2), which considerably improved the flood situation and changed hydraulic conditions. Nevertheless, the height of the marks is exceptional – note, however, that S11 might have been installed post hoc (compare Sect. 4.1.3) and may be questionable despite available reports about the flood in 1880. In any case, as opposed to the Schiltach, protective walls do not exist along the Wolf near W11 and W14. Assuming that the historical circumstances are approximately comparable with the current situation, the marks W11 and W14 are evidence of the particular severity of the floods in 1882 and 1896 along the Wolf River. At least for the 1896 event, documentary data confirmed an exceptional destructive power of the Wolf, as described above. These results might indicate a local underestimation of the flood hazard along tributary rivers by the FHMs and encourage a review.
5.1 Reliability of flood mark information
This study of flood marks along the Kinzig River demonstrates that the marks are for the most part consistent with the measured and reconstructed flood record and written documentations of flood events. On the whole, available flood marks apparently have been installed consciously. In contrast to the Tarn valley, southern France, where Metzger et al. (2018) found indications of intentional elevation of flood marks likely in the hope of receiving compensation, evidence for deliberate mark modifications were not apparent at our study sites along the Kinzig. At the same time, we underline the importance of cross-referencing between marks and further sources. Specifically, the historical documentation of flood marks from the early 20th century made it possible to sort out single questionable marks.
Comparison between preserved marks and their historical documentation revealed multiple uncertainties in the flood mark information. Uncertainties appeared as imprecisions in current absolute flood mark heights with reference to the heights documented about 115 years ago. These imprecisions are at best smaller than ±15 cm but may be larger if the mark has been moved carelessly. They may be a result of measurement uncertainty, transmitted through the small-scale historical documentation, derived from changes in the ground level or also from imprecise reinstallation of historical marks. Moreover, it is not clear, to what extent the results of this study can be extrapolated into the earlier past. Ground level changes, for instance, likely have occurred repeatedly so that their effects accumulate over time and can result in higher imprecision for older marks. However, this study cannot quantify this imprecision, as it only captures changes during the past 115 years. It also became apparent in this context that rankings of several flood events over time could be uncertain, even if derived from a single site. In addition, we found that the absolute mark heights can sometimes be verified by written documentation, but even then, imprecision in the range of several centimeters has to be considered.
Our findings are certainly location and time dependent, yet they may serve as an example of potential changes over time. As a conclusion, we strongly recommend considering uncertainty ranges when utilizing flood mark information in a hazard analysis, as demonstrated by, e.g., Parkes and Demeritt (2016), to avoid false accuracy in the estimates.
Flood marks not only are an imprecise source, but they also can be uncertain in terms of substantial flaws in the height, position, and year or date displayed by the mark (e.g., Wetter, 2017). Not only is this form of uncertainty hardly quantifiable, but it is also difficult to be detected at all. In this study, only the comparison between preserved and historically documented marks could identify a few cases of significant alterations of flood marks, e.g., by construction works. Hence, historical documentation provides information on lost marks (Macdonald and Black, 2010), and it is also extremely helpful as a reliability check. Admittedly, the documents published by the Central Office for Meteorology and Hydrology of the Grand Duchy of Baden represent an exceptional data source. The approach of temporal comparison cannot be transferred to regions without such an information base. Then, it might be much more difficult to decide which marks to discard.
Nevertheless, even in light of the available comprehensive database and assiduous research, some unresolved issues still remained. For instance, occasional random flaws or imprecisions could be observed in the utilized historical documents (compare Sect. 4.1.3). It is difficult to estimate the effect of such flaws, though. They can be compensated by a large amount of correct information. Finally, there is the intricacy of clustered historical floods: during some years of the 19th century, such as 1882, not one but several large floods occurred along the Kinzig (e.g., Disch, 1920). However, merely 20 % of the collected marks display the exact date of the flood. Particularly older marks mostly display the flood year only, which leaves room for speculations. Regarding the flood year 1882, it could not be fully clarified whether the 32 different flood marks refer to one flood event only.
Another critical issue with respect to the reliability of flood marks concerns the initial mark installation. According to Macdonald (2007), flood marks often have been installed shortly after a flood by direct witnesses. The author therefore assigns higher credibility to the marks than to archive material, which potentially was created at a much later stage. However, it is generally hard to determine the time that passed between a flood and the subsequent placement of marks as well as the associated uncertainty. Moreover, since many of the marks in this study show similar appearances regarding their inscriptions (compare Sect. 4.1.1), they could have been installed according to administrative order, which would give the marks a formal character suggesting higher reliability. Yet, appearances and types of marks do not show a clear pattern that could be regarded as a reliable decisive criterion to show their formal or informal character. Besides that, documentary data provided details neither on the process of flood mark placement nor on the persons responsible. Hence, it could as well be assumed that different stakeholders took the initiative, such as local residents, representatives of the municipality or administration, or river engineers, as reported for flood marks in France by Metzger et al. (2018). Even when expecting extreme consciousness in the procedure of mark placement from these stakeholders, we certainly acknowledge considerable uncertainty in the observation of the flood level. Depending on the timing of the peak and on the observation method regarding direct or indirect observation, distance, and daytime, both random and methodological errors might have led to an over- or underestimation of the flood peak. Thus, this study could not fully answer the question of flood mark reliability concerning (1) an initial correct placement of the marks and (2) the extent of earlier or later mark modifications except the alteration detected via historical documentation. Contrasting flood mark heights with current FHMs nevertheless demonstrated an overall good relative agreement, particularly for more recent floods (Fig. 5). This result can increase the trust in the potential of flood marks as a further source of past floods despite their uncertainty and imprecision.
5.2 Significance for present flood risk management
The EU Floods Directive (2007/60/EC) prescribes the inclusion of severe flood events of the past in the preliminary flood risk assessment and the creation of hazard and risk maps for rare, extreme floods, inter alia. For hazard assessment, gauge records represent an essential basis being an integral part of statistical analyses, regionalization approaches, and hydrological modeling. However, the records are usually comparably short: in Europe, continuous measurements rarely date back before the 1950s (Thieken et al., 2021). Therefore, historical data such as flood marks could significantly contribute to a more comprehensive knowledge of floods. The scientific community largely agrees on the usefulness of historical information, in particular with respect to the understanding of rare, extreme events. In most European countries, however, historical evidence is not utilized in a systematic and routine way, even though some national guidelines exist, as Kjeldsen et al. (2014) report.
Likewise, flood marks and descriptions of historical floods were not notably included in the process of FHM creation for the Kinzig catchment (Bösmeier, 2020). Official statements deny the availability of reliable descriptions of historical floods for Upper Rhine tributaries – despite recognizing the value of flood marks and further historical evidence in a responsible hazard assessment, e.g., regarding model calibration and the estimation of the HQextreme (Ministerium für Umwelt, Klima und Energiewirtschaft Baden-Württemberg, 2011, 2016). In this study, we demonstrate by the example of three sites along the Kinzig that (1) a large number of flood marks can be collected, (2) documentary evidence exists to rate the plausibility and reliability of the marks to a certain extent, and (3) this information can be juxtaposed with current FHMs in a straightforward approach. Here, the collected flood marks along the Kinzig showed a wide agreement with the FHMs. A few outstandingly high marks also turned out to be plausible, even if some of them might point to a particular hazard along Kinzig tributaries. A single flood mark may not be a robust basis for decision-making. However, we believe that the overall picture and striking patterns in the data, if apparent, can add substantial value to an integrated flood risk assessment.
The good match between current hazard assessment at the Kinzig and historical evidence is linked to the exceptionally long (>130 years) record of water level and discharge observations, which also include some high discharge events (compare Fig. 4). For rivers without long-term measurements, it is even more important to consider historical flood marks, if available. This is illustrated by the example of the devastating flood in the Ahr valley, western Germany, in July 2021: dating back to 1946 at the gauge at Altenahr, the systematic measurements of the Ahr are much shorter than those of the Kinzig. They are moreover not representative of the extent or the seasonality of historical extreme floods (Thieken et al., 2021). Yet, reconstructions of historical floods (e.g., Roggenkamp and Herget, 2014) were not sufficiently considered in the flood hazard analysis and the creation of the FHMs. This may explain the locally large discrepancy between estimations of extreme events and actual flooded areas in 2021, as Thieken et al. (2021) explain. They emphasize the importance of flood hazard and risk maps as planning and decision-making tools, not least for disaster management. After all, an underestimation of the worst-case scenario could have severe consequences. As a lesson from the 2021 flood catastrophe, Merz et al. (2021) suggest a wider approach in flood hazard assessment. Efforts should not only focus on the development of optimal hydrologic and hydrodynamic models, but critical scrutiny also has to be applied to assumptions and potential limitations of models with regard to processes beyond observations.
Then why is historical flood information not already systematically included in risk assessment? Kjeldsen et al. (2014) consider the main restraint in the difficulty of applying scientific findings in practice. This means, for instance, a limited access to historical data or the complexity of assessing the reliability of qualitative data in contrast to standardized official measurements. As delineated above, the estimation of uncertainty in flood mark information is indeed time-consuming and complex. Even if a large amount of information is available, it may not fully elucidate involved uncertainties. However, significant uncertainty in systematic discharge measurements also should be taken into consideration, as it can amount up to 30 % during extreme events (Kuczera, 1996). In this context, it appears reasonable to utilize flood mark information despite potential large uncertainty. When there is no certainty that a mark is flawed, why not used it as a benchmark for a worst-case scenario? We therefore suggest generally including the information on documented or preserved flood marks in two cases: first, if marks lie outside of areas associated with the HQextreme in the FHMs and, second, if they are positioned considerably above the modeled local flooding depth. Subsequent to this initial screening, which may be more feasible than the extensive work performed in this study, the plausibility of the discovered “extreme” marks can be tested in detail including further information. Finally, a review of one or more aspects in the process of hazard estimation may be appropriate depending on the number and reliability of these marks and in consideration of substantial changes, as described in the following.
A major reservation regarding flood marks and other historical evidence originates from the question of a realistic comparability between the historical and the current situation. In the Kinzig catchment, the assumption of stationary hydrological and hydraulic conditions can hardly be retained for the past 200 years in light of several alterations. The most radical modification in the Kinzig catchment was the river rectification during the 19th century. It affected large parts of the lower and middle reaches, and though the effects are hardly quantifiable, it is assumed to have aggravated historical floods locally (Bösmeier, 2020). Therefore, the study focused on the upper catchment. Due to its geographical setting, the flood situation in Haslach may have been influenced by the rectification works; Wolfach and Schiltach, however, are located clearly above the cutoff meanders. In fact, a few floods were represented by marks in Haslach (compare Fig. 3) but were not documented by marks at the other two sites. This may indicate a considerable difference in historical flood hazard between the middle and upper catchment. Flood retention reservoirs situated in the lower and middle catchment do not protect Wolfach or Schiltach. Continuous improvement of dams, modifications of bridges or of the riverbed, and local protection walls have continuously affected flood hazard along the Kinzig. Flood protection structures along the river are displayed in the FHMs and can help to understand discrepancies towards flood marks, e.g., in Schiltach (Sect. 4.2). Furthermore, timber rafting, pursued on the Kinzig until the 1890s, occasionally may have contributed to an increase in the local flood level. By then, logs stored close to the river provided a particularly large amount of material for river obstructions, yet driftwood and other material can also accumulate during a flood today. Whereas these various issues on the whole rather imply a decrease in flood hazard over the centuries, future flood hazard of the studied area is likely to increase due to current global warming – even though massive ice jams, such as in 1830, are increasingly unlikely. Projections of future climate conditions point to a significant increase in winter precipitation and an increase in days with heavy precipitation even in a moderate scenario (RCP4.5, Representative Concentration Pathway) for the area of the Kinzig (Riach et al., 2019). Altogether, past changes along the Kinzig are complex and not easily reproducible (Bösmeier, 2020); thus they could only be outlined but not quantified within this study. However, it appears justified to assign a higher relevance to the marks collected in Wolfach and Schiltach than to those in Haslach, based on our findings.
To conclude, we argue against a generalized rejection of historical evidence on the basis of untenable comparability between the past and present. Certainly, the benefit from historical information has to be weighed against the influence of changes and the efforts needed for the analysis. However, even if long-term changes and subsequent effects on flood hazard are hard to quantify, it might be a good idea to examine the local situation and determine whether the extent of historical floods might still be realistic as a worst-case scenario. Utilizing plausible flood mark information as a benchmark for the HQextreme, marks can help to identify possible flood-prone areas and thereby represent additional criteria helping decision-makers to decide, e.g., upon building a development or flood-adapted construction in these areas.
Moreover, we believe that a large scale, comprehensive collection and digitization of historical, lost, and still preserved flood marks is a desirable goal, as it would enable easy access to information. The national collaborative platform of France (https://www.reperesdecrues.developpement-durable.gouv.fr, last access: 1 April 2022), initiated in 2016, may serve as example. For southwestern Germany, the historical documentation by the CMH, utilized for this study, represents a formidable foundation. For this area, information is particularly rich, but many flood marks are also documented for other German states, e.g., Thuringia, Saxony-Anhalt (Deutsch, 1997), and Bavaria (Brázdil et al., 1999), and for other European countries, for instance the Czech Republic (Brázdil et al., 1999; Elleder, 2015), France (e.g., Martin et al., 2018), Poland (Gorączko, 2021), Slovakia (Pekárová et al., 2013), Spain (e.g., Benito et al., 2021), Switzerland (e.g., Pfister, 1985; Wetter, 2017), and the UK (e.g., Macdonald, 2007). Even though abundance and detailedness of flood marks may strongly vary, we are confident that many sites provide the basis for collection and analysis of flood mark information and for juxtaposition of flood marks with current FHMs. The latter are available on a large scale, as they had to be prepared by member states according to the European Floods Directive (2007/60/EC). Such follow-up studies might additionally reveal regional similarities or differences, e.g., in the history of flood mark installation, maintenance, or involved uncertainties.
Finally, a systematic collection and documentation of marks would also help to protect and maintain this important cultural heritage, as Deutsch (1997) already incited. Along the Kinzig, many marks are still preserved and highly visible at some places. This may not be the case for a large number of other communities along rivers, where all marks ever installed have been lost already. Then, it may even be advisable to reinstall lost marks at selected locations, as has recently been practiced in France. A higher number of flood marks visible in public space may increase the awareness towards flood risk among the general public and incite interest in the topic. Thereby, flood marks might stimulate precaution and (personal) risk prevention. After all, flood marks are materialized memories of floods, as illustrated by McEwen et al. (2017) in their concept of sustainable flood memories: their visibility helps to build lay knowledge through generations. Such community knowledge of flood risk adds value to the expert knowledge and thereby supports a distributed flood risk management. In case of an emergency, this lay knowledge may be a crucial factor for taking the right decision, as Thieken et al. (2021) underline.
In light of relatively short systematic records, there is general agreement on the usefulness of historical flood information. Nevertheless, these data are not systematically and routinely included in the hazard assessment across much of Europe. This can be explained by a limited access to data, a lack of confidence in historical information or an uncertainty about the comparability between the historical and the present flood situation. Flood marks in particular appear to be an underrated source, even though they can provide more precise information than most descriptive documents. However, systematic studies on uncertainties and temporal continuance based on a large number of flood marks are rare.
In our study at three flood-prone sites along the Kinzig River, southwestern Germany, we therefore collected 89 flood marks, which refer to at least 15 floods of the past 200 years. A qualitative plausibility check with historical documentation and early to recent gauge measurements showed that the marks almost exclusively refer to severe floods. Written documents support the flood marks – sometimes they even literally verify particularly high marks – and thereby underline the credibility of the marks as evidence on historical events. A historical survey of flood marks from the beginning of the 20th century moreover helped not only in retrieving many already vanished marks (43 out of 89). Together with still preserved marks from the 19th century, the survey also provided a base for assessing the extent of changes of the flood marks over time. The findings show that the effects range from small imprecisions in mark heights to considerable uncertainties in position, height, and displayed date due to mark relocation or alteration. Not least considering the unresolved question of an initially adequate installation, the collected flood marks thus must be classified as uncertain pieces of information. However, in combination with further information that accounts for their credibility and supported by their number, they can be considered useful additional information for hazard assessment. On this basis, we compared the collected marks with the modeled FHMs at the study sites, which had been created without the inclusion of historical flood information. A high agreement is apparent regarding the flood mark positions and heights and the hazard maps, indicating a realistic local hazard assessment that also covers the extent of large historical floods. For the few exceptions, plausible and historically sound reasons indicate local changes in hydraulic conditions, for instance, by flood protection walls and exceptional processes during the massive ice jam of 1830. Additionally though, a few marks may also indicate a local underestimation of the flood hazard along Kinzig River tributaries. Since past changes in the Kinzig catchment are considerable, they have to be taken into account when comparing the historical with the current situation along the river. The effects of these complex changes are hardly quantifiable. Therefore, the study deliberately focused rather on the upper catchment, where historical river rectification and the influence of flood retention reservoirs are not decisive.
Based on these findings, it appears reasonable to examine the local situation and determine whether historical floods could still be realistic as a worst-case scenario nowadays, instead of generally rejecting flood mark information. This also applies to a larger scale and in a wider context of flood risk management. In Europe, numerous flood marks are documented or still preserved. This provides the possibility of a systematic collection of these marks, as practiced, for instance, in France. After a plausibility check by documentary sources and possibly gauge measurements to identify potentially questionable and definitely flawed marks, the data should be made easily accessible. Then, the information can contribute to heritage protection, maintenance, and even reinstallation of marks, where appropriate, which can help to build a risk culture and more flood-resilient communities. Furthermore, the data can add substantial value to an integrated flood risk assessment in an effective and transparent way. Specifically, we recommend checking the current hazard maps for systematic discrepancies towards plausible flood marks and, if apparent, attempting to understand their origin. Here, the rich historical information on flood marks for southwestern Germany could be the basis of a follow-up study specifically regarding headwater catchments without flood protection reservoirs. Finally, flood marks should be practically utilized in the flood hazard assessment at least as a routine benchmark for worst-case scenarios. This can help to prevent an underestimation of extreme floods and may also strengthen adequate disaster management.
Code for extracting flooding depths from flood hazard maps and for analyzing and displaying the data is available from the corresponding author upon request (annette.boesmeier@geographie.uni-freiburg.de).
Data on the collected flood marks and details on the plausibility checks with written evidence are available from the corresponding author upon request (annette.boesmeier@geographie.uni-freiburg.de).
IH and ASB developed the study concept and collected the data. ASB and StS analyzed the data and discussed the results. ASB prepared the manuscript with contributions of both co-authors.
The contact author has declared that none of the authors has any competing interests.
Publisher's note: Copernicus Publications remains neutral with regard to jurisdictional claims in published maps and institutional affiliations.
The authors thank Rüdiger Glaser, head of the Chair of Physical Geography at the University of Freiburg, for supervising the doctoral thesis of the corresponding author, which provided the basis for this study. Moreover, the authors are very grateful for the valuable comments and suggestions of Neil Macdonald and an anonymous referee.
Annette S. Bösmeier was funded by a scholarship of the
Landesgraduiertenförderung (LGFG) Baden-Württemberg. The research of
historical written sources on Kinzig floods by Iso Himmelsbach was funded by the ANR (Agence nationale de la recherche; grant no. ANR-07-FRAL-025) and DFG (Deutsche Forschungsgemeinschaft; grant no. DFG-Gl 358/5-1) (TRANSRISK).
This open-access publication was funded by the University of Freiburg.
This paper was edited by Brunella Bonaccorso and reviewed by Neil Macdonald and one anonymous referee.
Benito, G., Diez-Herrero, A., and Villata, M. F. de: Magnitude and frequency of flooding in the Tagus basin (Central Spain) over the last millenium, Climatic Change, 58, 171–192, https://doi.org/10.1023/A:1023417102053, 2003.
Benito, G., Brázdil, R., Herget, J., and Machado, M. J.: Quantitative historical hydrology in Europe, Hydrol. Earth Syst. Sci., 19, 3517–3539, https://doi.org/10.5194/hess-19-3517-2015, 2015.
Benito, G., Castillo, O., Ballesteros-Cánovas, J. A., Machado, M., and Barriendos, M.: Enhanced flood hazard assessment beyond decadal climate cycles based on centennial historical data (Duero basin, Spain), Hydrol. Earth Syst. Sci., 25, 6107–6132, https://doi.org/10.5194/hess-25-6107-2021, 2021.
Bivand, R., Keitt, T., and Rowlingson, B.: rgdal: Bindings for the `Geospatial' Data Abstraction Library [code], https://CRAN.R-project.org/package=rgdal (last access: 28 January 2022), 2019.
Blöschl, G., Hall, J., Viglione, A., Perdigão, R. A. P., Parajka, J., Merz, B., Lun, D., Arheimer, B., Aronica, G. T., Bilibashi, A., Boháč, M., Bonacci, O., Borga, M., Čanjevac, I., Castellarin, A., Chirico, G. B., Claps, P., Frolova, N., Ganora, D., Gorbachova, L., Gül, A., Hannaford, J., Harrigan, S., Kireeva, M., Kiss, A., Kjeldsen, T. R., Kohnová, S., Koskela, J. J., Ledvinka, O., Macdonald, N., Mavrova-Guirguinova, M., Mediero, L., Merz, R., Molnar, P., Montanari, A., Murphy, C., Osuch, M., Ovcharuk, V., Radevski, I., Salinas, J. L., Sauquet, E., Šraj, M., Szolgay, J., Volpi, E., Wilson, D., Zaimi, K., and Živković, N.: Changing climate both increases and decreases European river floods, Nature, 573, 108–111, https://doi.org/10.1038/s41586-019-1495-6, 2019.
Blöschl, G., Kiss, A., Viglione, A., Barriendos, M., Böhm, O., Brázdil, R., Coeur, D., Demarée, G., Llasat, M. C., Macdonald, N., Retsö, D., Roald, L., Schmocker-Fackel, P., Amorim, I., Bělínová, M., Benito, G., Bertolin, C., Camuffo, D., Cornel, D., Doktor, R., Elleder, L., Enzi, S., Garcia, J. C., Glaser, R., Hall, J., Haslinger, K., Hofstätter, M., Komma, J., Limanówka, D., Lun, D., Panin, A., Parajka, J., Petrić, H., Rodrigo, F. S., Rohr, C., Schönbein, J., Schulte, L., Silva, L. P., Toonen, W. H. J., Valent, P., Waser, J., and Wetter, O.: Current European flood-rich period exceptional compared with past 500 years, Nature, 583, 560–566, https://doi.org/10.1038/s41586-020-2478-3, 2020.
Bösmeier, A.: Exploring and analyzing data for reconstruction, modeling, and hazard assessment of historical floods in the Kinzig catchment, Upper Rhine, Doctoral dissertation, University of Freiburg, Freiburg, https://doi.org/10.6094/UNIFR/222531, 2020.
Brázdil, R., Glaser, R., Pfister, C., Dobrovolný, P., Antoine, J.-M., Barriendos, M., Camuffo, D., Deutsch, M., Enzi, S., Guidoboni, E., Kotyza, O., and Rodrigo, F. S.: Flood Events of Selected European Rivers in the Sixteenth Century, Climatic Change, 43, 239–285, https://doi.org/10.1023/A:1005550401857, 1999.
Brázdil, R., Pfister, C., Wanner, H., Storch, H. V., and Luterbacher, J.: Historical Climatology In Europe – The State Of The Art, Climatic Change, 70, 363–430, https://doi.org/10.1007/s10584-005-5924-1, 2005.
Brázdil, R., Kundewicz, Z. W., and Benito, G.: Historical hydrology for studying flood risk in Europe, Hydrolog. Sci. J., 51, 739–764, https://doi.org/10.1623/hysj.51.5.739, 2006.
CMH – Centralbureau für Meteorologie und Hydrographie (Ed.): Beiträge zur Hydrographie des Grossherzogthums Baden: Das badische Pegelwesen, Erstes Heft, G. Braun, Karlsruhe, 1884.
CMH – Centralbureau für Meteorologie und Hydrographie (Ed.): Beiträge zur Hydrographie des Grossherzogthums Baden: Karten zum Fünften Heft: Der Binnenflussbau im Grossherzogthum Baden, G. Braun, Karlsruhe, 1887.
CMH – Zentralbureau für Meteorologie und Hydrographie (Ed.): Beiträge zur Hydrographie des Grossherzogtums Baden: Tafeln zum Dreizehnten Heft: Die Hochwassermarken im Grossherzogtum Baden, G. Braun, Karlsruhe, 1908.
CMH – Zentralbureau für Meteorologie und Hydrographie (Ed.): Beiträge zur Hydrographie des Grossherzogtums Baden: Die Hochwassermarken im Grossherzogtum Baden, Dreizehntes Heft, G. Braun, Karlsruhe, 1911.
Deutsch, M.: Einige Bemerkungen zu historischen Hochwassermarken – eine Bestandsaufnahme an der Unstrut, Archäologie in Sachsen-Anhalt, 7, 25–31, 1997.
Di Baldassarre, G. and Montanari, A.: Uncertainty in river discharge observations: A quantitative analysis, Hydrol. Earth Syst. Sci., 13, 913–921, https://doi.org/10.5194/hess-13-913-2009, 2009.
Disch, F.: Chronik der Stadt Wolfach, Von Franz Disch Reallehrer und Vorstand der Bürgerschule in Wolfach. Mit 3 Tafeldrucken und 95 Textabbildungen, G. Braunsche Hofdruckerei, Wolfach, Karlsruhe, 1920.
Elleder, L.: Historical changes in frequency of extreme floods in Prague, Hydrol. Earth Syst. Sci., 19, 4307–4315, https://doi.org/10.5194/hess-19-4307-2015, 2015.
European Environment Agency: Mapping the impacts of natural hazards and technological accidents in Europe: An overview of the last decade, EEA technical report, no. 13/2010, Publications Office of the European Union, Luxembourg, 146 pp., ISBN 978-92-9213-168-5, 2010.
Glaser, R., Riemann, D., Schönbein, J., Barriendos, M., Brázdil, R., Bertolin, C., Camuffo, D., Deutsch, M., Dobrovolný, P., van Engelen, A., Enzi, S., Halíčková, M., Koenig, S. J., Kotyza, O., Limanówka, D., Macková, J., Sghedoni, M., Martin, B., and Himmelsbach, I.: The variability of European floods since AD 1500, Climatic Change, 101, 235–256, https://doi.org/10.1007/s10584-010-9816-7, 2010.
Google Earth Pro: Version 7.3.3.7699, build date 05/07/2020. Image recording date 10/18/2018 by Landsat/Copernicus: ca. 48∘18′00.00′′ N, 18∘13′27.00′′ E, Google Earth Pro [data set], https://earth.google.com/web/ (last access: 16 December 2021), 2020.
Gorączko, M.: Flood Marks in Poland and Their Significance in Water Management and Flood Safety Education, in: Management of Water Resources in Poland, edited by: Zeleňáková, M., Kubiak-Wójcicka, K., and Negm, A. M., Springer International Publishing, Cham, 253–267, https://doi.org/10.1007/978-3-030-61965-7_13, 2021.
Hannaford, J., Buys, G., Stahl, K., and Tallaksen, L. M.: The influence of decadal-scale variability on trends in long European streamflow records, Hydrol. Earth Syst. Sci., 17, 2717–2733, https://doi.org/10.5194/hess-17-2717-2013, 2013.
Heppner, R.: Gegen Hochwasser rüsten ist nötig, baden, https://www.bo.de/lokales/kinzigtal/gegen-hochwasser-ruesten-ist-noetig (last access: 3 March 2022), 2020.
Herget, J., Roggenkamp, T., and Krell, M.: Estimation of peak discharges of historical floods, Hydrol. Earth Syst. Sci., 18, 4029–4037, https://doi.org/10.5194/hess-18-4029-2014, 2014.
Hijmans, R. J.: raster: Geographic Data Analysis and Modeling, CRAN [code], https://CRAN.R-project.org/package=raster (last access: 28 January 2022), 2020.
Himmelsbach, I.: Erfahrung – Mentalität – Management: Hochwasser und Hochwasserschutz an den nicht-schiffbaren Flüssen im Ober-Elsass und am Oberrhein (1480–2007), Doctoral Dissertation, Freiburger geographische Hefte, Selbstverl. des Inst. für Umweltsozialwiss. und Geographie der Albert-Ludwigs Univ., Freiburg im Breisgau, 244 pp., ISSN 0071-9447, 2014.
Himmelsbach, I., Glaser, R., Schoenbein, J., Riemann, D., and Martin, B.: Reconstruction of flood events based on documentary data and transnational flood risk analysis of the Upper Rhine and its French and German tributaries since AD 1480, Hydrol. Earth Syst. Sci., 19, 4149–4164, https://doi.org/10.5194/hess-19-4149-2015, 2015.
Hosking, J. R. M. and Wallis, J. R.: The Value of Historical Data in Flood Frequency Analysis, Water Resour. Res., 22, 1606–1612, https://doi.org/10.1029/WR022i011p01606, 1986.
Jarvis, A., Reuter, H. I., Nelson, A., and Guevara, E.: Hole-filled seamless SRTM data V4, CIAT – International Centre for Tropical Agriculture, http://srtm.csi.cgiar.org (last access: 30 March 2017), 2008.
Kjeldsen, T. R., Macdonald, N., Lang, M., Mediero, L., Albuquerque, T., Bogdanowicz, E., Brázdil, R., Castellarin, A., David, V., Fleig, A., Gül, G. O., Kriauciuniene, J., Kohnová, S., Merz, B., Nicholson, O., Roald, L. A., Salinas, J. L., Sarauskiene, D., Šraj, M., Strupczewski, W., Szolgay, J., Toumazis, A., Vanneuville, W., Veijalainen, N., and Wilson, D.: Documentary evidence of past floods in Europe and their utility in flood frequency estimation, J. Hydrol., 517, 963–973, https://doi.org/10.1016/j.jhydrol.2014.06.038, 2014.
Kuczera, G.: Correlated Rating Curve Error in Flood Frequency Inference, Water Resour. Res., 32, 2119–2127, https://doi.org/10.1029/96WR00804, 1996.
Kundzewicz, Z. W., Pińskwar, I., and Brakenridge, G. R.: Changes in river flood hazard in Europe: a review, Hydrol. Res., 49, 294–302, https://doi.org/10.2166/nh.2017.016, 2018.
Leese, M. N.: Use of censored data in the estimation of Gumbel distribution parameters for annual maximum flood series, Water Resour. Res., 9, 1534–1542, https://doi.org/10.1029/WR009i006p01534, 1973.
LUBW – Landesanstalt für Umwelt, Messungen und Naturschutz Baden-Württemberg: Abfluss-BW: Regionalisierte Abfluss-Kennwerte Baden-Württemberg, Hochwasserabflüsse, Landesanstalt für Umwelt, Messungen und Naturschutz Baden-Württemberg, https://udo.lubw.baden-wuerttemberg.de/projekte/themes/bwabfl/images/custom/dokumente/bwabfl/bwabfl_151012_Doku_HQ.pdf (last access: 2 ay 2018), 2015.
LUBW – Landesanstalt für Umwelt, Messungen und Naturschutz Baden-Württemberg: Flood Hazard Maps, status as of 27.09.2018, Basis: data provided by the environment information system (UIS) of the LUBW; Az. 2851.9-1/19, geodata © Landesanstalt für Geoinformation und Landesentwicklung Baden-Württemberg [data set], https://www.lgl-bw.de/ (last access: 27 September 2018), 2018.
Luu, C., von Meding, J., and Kanjanabootra, S.: Assessing flood hazard using flood marks and analytic hierarchy process approach: A case study for the 2013 flood event in Quang Nam, Vietnam, Nat. Hazards, 90, 1031–1050, https://doi.org/10.1007/s11069-017-3083-0, 2018.
Macdonald, N.: Neil MacDonald on Epigraphic Records: A Valuable Resource in Reassessing Flood Risk and Long-Term Climate Variability, Environ. Hist., 12, 136–140, https://doi.org/10.1093/envhis/12.1.136, 2007.
Macdonald, N.: Reassessing flood frequency for the River Trent through the inclusion of historical flood information since ad 1320, Hydrol. Res., 44, 215–233, https://doi.org/10.2166/nh.2012.188, 2013.
Macdonald, N. and Black, A. R.: Reassessment of flood frequency using historical information for the River Ouse at York, UK (1200–2000), Hydrolog. Sci. J., 55, 1152–1162, https://doi.org/10.1080/02626667.2010.508873, 2010.
Macdonald, N. and Sangster, H.: High-magnitude flooding across Britain since AD 1750, Hydrol. Earth Syst. Sci., 21, 1631–1650, https://doi.org/10.5194/hess-21-1631-2017, 2017.
Machado, M. J., Botero, B. A., López, J., Francés, F., Díez-Herrero, A., and Benito, G.: Flood frequency analysis of historical flood data under stationary and non-stationary modelling, Hydrol. Earth Syst. Sci., 19, 2561–2576, https://doi.org/10.5194/hess-19-2561-2015, 2015.
Martin, B., Heitz, C., Trautmann, J., and Vincent, C.: Les repères de crues: Réflexions géohistoriques autour d'un outil réglementaire de “culture du risque” d'inondation, in: Les Actes du CRESAT, edited by: CRESAT, Centre de recherche sur les économies, les sociétés, les arts et les techniques, Éditions du CRESAT, 195–217, ISSN 1766-4837, 2018.
McEwen, L., Garde-Hansen, J., Holmes, A., Jones, O., and Krause, F.: Sustainable flood memories, lay knowledges and the development of community resilience to future flood risk, Trans. Inst. Brit. Geogr., 42, 14–28, https://doi.org/10.1111/tran.12149, 2017.
Merz, R. and Blöschl, G.: Flood frequency hydrology: 1. Temporal, spatial, and causal expansion of information, Water Resour. Res., 44, W08432, https://doi.org/10.1029/2007WR006744, 2008.
Merz, B., Bittner, R., Grünewald, U., and Piroth, K.: Management von Hochwasserrisiken: Mit Beiträgen aus den RIMAX-Forschungsprojekten, XII, Schweizerbart, Stuttgart, p. 248, ISBN 978-3-510-65268-6, 2011.
Merz, B., Kreibich, H., Thieken, A., and Vorogushyn, S.: Überraschende Hochwasserereignisse: Lehren für Risikoanalysen, Notfallvorsorge: die Zeitschrift für Bevölkerungsschutz und Katastrophenhilfe, 52, 19–23, 2021.
Metzger, A., David, F., Valette, P., Rode, S., Martin, B., Desarthe, J., and Linton, J.: Entretenir la mémoire des inondations via les repères de crue?, developpementdurable, https://doi.org/10.4000/developpementdurable.12937, 2018.
Ministerium für Umwelt, Klima und Energiewirtschaft Baden-Württemberg (Ed.): Bewertung des Hochwasserrisikos und Bestimmung der Gebiete mit signifikantem Hochwasserrisiko in Baden-Württemberg: Vorläufige Risikobewertung gemäß Artikel 4 und 5 der Hochwasserrisikomanagementrichtlinie, https://www.hochwasser.baden-wuerttemberg.de/documents/20122/94084/Bewertung%20des%20Hochwasserrisikos%20und%20Bestimmung%20der%20Gebiete%20mit%20signifikantem%20Hochwasserrisiko%20in%20Baden-W%C3%BCrttemberg%20Vorl%C3%A4ufige%20Risikobewertung%20gem%C3%A4%C3%9F%20Artikel%204%20und%205%20der%20Hochwasserrisikomanagement-Richtlinie%20%281.Zyklus%29 (last access: 9 August 2018), 2011.
Ministerium für Umwelt, Klima und Energiewirtschaft Baden-Württemberg: Hochwassergefahrenkarten in Baden-Württemberg: Leitfaden, https://www.hochwasser.baden-wuerttemberg.de/documents/20122/39136/Leitfaden+Hochwassergefahrenkarten+in+Baden-Württemberg.pdf/32948fc1-abde-e029-2bb9-3e34f1a46c3f?t=1620657569991 (last access: 25 July 2017), 2016.
Naulet, R., Lang, M., Ouarda, T. B. M. J., Coeur, D., Bobée, B., Recking, A., and Moussay, D.: Flood frequency analysis on the Ardèche river using French documentary sources from the last two centuries, J. Hydrol., 313, 58–78, https://doi.org/10.1016/j.jhydrol.2005.02.011, 2005.
Paprotny, D., Sebastian, A., Morales-Nápoles, O., and Jonkman, S. N.: Trends in flood losses in Europe over the past 150 years, Nat. Ccommun., 9, 1985, https://doi.org/10.1038/s41467-018-04253-1, 2018.
Parkes, B. and Demeritt, D.: Defining the hundred year flood: A Bayesian approach for using historic data to reduce uncertainty in flood frequency estimates, J. Hydrol., 540, 1189–1208, https://doi.org/10.1016/j.jhydrol.2016.07.025, 2016.
Payrastre, O., Gaume, E., and Andrieu, H.: Use of historical data to assess the occurrence of floods in small watersheds in the French Mediterranean area, Adv. Geosci., 2, 313–320, https://doi.org/10.5194/adgeo-2-313-2005, 2005.
Payrastre, O., Gaume, E., and Andrieu, H.: Usefulness of historical information for flood frequency analyses: Developments based on a case study, Water Resour. Res., 47, W08511, https://doi.org/10.1029/2010WR009812, 2011.
Pekárová, P., Halmová, D., Mitková, V. B., Miklánek, P., Pekár, J., and Škoda, P.: Historic flood marks and flood frequency analysis of the Danube River at Bratislava, Slovakia, J. Hydrol. Hydromech., 61, 326–333, https://doi.org/10.2478/johh-2013-0041, 2013.
Pfister, C.: Klimageschichte der Schweiz, 1525–1860: Das Klima der Schweiz von 1525–1860 und seine Bedeutung in der Geschichte von Bevoelkering und Landwirtschaft, 6, 2 Bd., 2. unveraend. Aufl., Academica Helvetica, Haupt, Bern, ISBN 978-3258039565, 1985.
R Core Team: R: A Language and Environment for Statistical Computing, Vienna, Austria, http://www.R-project.org/ (last access: 8 August 2022), 2015.
Reich, J., Bödeker, F., Gruhler-Gerling, C., Stegmaier, A., and Kirste, D. (Eds.): Hochwassergefahrenkarte Baden-Württemberg: Beschreibung der Vorgehensweise zur Erstellung von Hochwassergefahrenkarten in Baden-Württemberg, Version 2.3, Ministerium für Umwelt, Naturschutz und Verkehr Baden-Württemberg, Regierungspräsidium Freiburg, Regierungspräsidium Karlsruhe, and Regierungspräsidium Tübingen, https://www.hochwasser.baden-wuerttemberg.de/documents/20122/39136/Hochwassergefahrenkarten%20Beschreibung%20der%20Vorgehensweise%20zur%20Erstellung%20von%20Hochwassergefahrenkarten%20in%20Baden-W%C3%BCrttemberg (last access: 9 August 2018), 2012.
Riach, N., Scholze, N., Glaser, R., and Roy, S., and Stern, B.: Klimawandel am Oberrhein: Ein zweisprachiges Dossier mit 24 Karten und 6 Begleittexten: Changement climatique dans le Rhin Superieur: un dossier bilingue avec 24 cartes et 6 textes d'accompagnement, https://www.georhena.eu/sites/default/files/Cartes/Klimawandel_am_Oberrhein_Changement_climatique_dans_le_Rhin_superieur.pdf (last access: 17 September 2020), 2019.
Riemann, D., Glaser, R., Kahle, M., and Vogt, S.: The CRE tambora.org – new data and tools for collaborative research in climate and environmental history, Geosci. Data J., 2, 63–77, https://doi.org/10.1002/gdj3.30, 2016.
Roggenkamp, T. and Herget, J.: Reconstructing peak discharges of historic floods of the River Ahr, Germany, Erdkunde, 68, 49–59, 2014.
Stedinger, J. R. and Cohn, T. A.: Flood Frequency Analysis With Historical and Paleoflood Information, Water Resour. Res., 22, 785–793, https://doi.org/10.1029/WR022i005p00785, 1986.
Thieken, A., Kemter, M., Vorogushyn, S., Berghäuser, L., Sieg, T., Natho, S., Mohor, G., Petrow, T., Merz, B., and Bronstert, A.: Extreme Hochwasser bleiben trotz integriertem Risikomanagement eine Herausforderung, https://www.uni-potsdam.de/fileadmin/projects/natriskchange/Taskforces/Flut2021_StatementThiekenEtAl.pdf (last access: 14 February 2022), Potsdam, 2021.
Thober, S., Kumar, R., Wanders, N., Marx, A., Pan, M., Rakovec, O., Samaniego, L., Sheffield, J., Wood, E. F., and Zink, M.: Multi-model ensemble projections of European river floods and high flows at 1.5, 2, and 3 degrees global warming, Environ. Res. Lett., 13, 14003, https://doi.org/10.1088/1748-9326/aa9e35, 2018.
Viglione, A., Merz, R., Salinas, J. L., and Blöschl, G.: Flood frequency hydrology: 3. A Bayesian analysis, Water Resour. Res., 49, 675–692, https://doi.org/10.1029/2011WR010782, 2013.
Wetter, O.: The potential of historical hydrology in Switzerland, Hydrol. Earth Syst. Sci., 21, 5781–5803, https://doi.org/10.5194/hess-21-5781-2017, 2017.