the Creative Commons Attribution 4.0 License.
the Creative Commons Attribution 4.0 License.
 | 05 Sep 2022
Brief communication: Western Europe flood in 2021 – mapping agriculture flood exposure from synthetic aperture radar (SAR)
Kang He
Qing Yang
Xinyi Shen
Emmanouil N. Anagnostou
In this communication, we present the exposure of agricultural lands to the flooding caused by extreme precipitation in western Europe from 12 to 15 July 2021. Overlaying the flood inundation maps derived from the near-real-time RAdar-Produced Inundation Diary (RAPID) system on the Coordination of information on the environment (CORINE) Land Cover map we estimate a 1920 km2 area affected by the flooding, with 64 % representing agricultural land. Among the inundated agricultural land, 36 % of the area is pastures while 34 % is arable land. Most agricultural flood exposure is found in eastern France along the Rhône River, the southern Netherlands along the Meuse River, and western Germany along the Rhine River.
- Article
(6889 KB) - Full-text XML
- BibTeX
- EndNote


The heavy precipitation between 12 and 15 July 2021 led to catastrophic floods in western European countries, including France, western Germany, the Netherlands, Belgium, and Luxembourg. The flooding caused widespread power outages and infrastructure and crop damage in the affected areas. It is estimated that the loss from the flooding is up to EUR 3 billion (Reinsurance News, 2021). In addition, 46 people were confirmed dead in the state of North Rhine-Westphalia in Germany, and in the neighboring state of Rhineland-Palatinate 110 fatalities were confirmed. At least 20 people died following catastrophic flooding in Belgium. The Netherlands, Luxembourg, and Switzerland were also affected. Thousands of people were evacuated from their homes (CNN, 2021; FloodList, 2021). In the same period, intensive floods occurred in China and the United States. Researchers highlighted that this is an effect of climate change and concluded that the frequency and intensity of such events will increase in a rapidly warming climate (World Weather Attribution, 2021).
Besides life loss, the flooding in western Europe has also taken a heavy toll on the agricultural sector according to the European farmers' association Copa Cogeca. The European Union's crop monitoring unit stated that the exceptionally high rainfall and severe floods would reduce the grain quality in the affected countries (Successful Farming, 2021) and had “effectively eliminated” any hope of a successful harvest in these areas (Euractiv, 2021). Examples of crop damage include crops of grain, rapeseed, and flax which were washed away in Wallonia, Belgium, and flood-affected fruit trees along the Meuse River (Eurofruit, 2021). In widespread crop loss scenarios like this one, damage assessment is an essential part of flood risk management and flood mitigation and is also the basis of financial appraisals in the insurance sector (Tapia-Silva et al., 2011). Even though the impact on the agriculture sector is expected to have been severe, the magnitude of the damage is yet to be determined (Agence Europe, 2021). Therefore, it is important to have a quick assessment of the agricultural land exposure to flooding, which will inform crop loss estimates, especially for countries where agriculture plays an important role in the national economy, e.g., France and Germany. Near-real-time (NRT) flood mapping capability from satellite observations is vital to facilitate rapid assessment of flood loss and damage (Shen et al., 2019a).
In this brief communication, we use NRT inundation extents from the near-real-time RAdar-Produced Inundation Diary (RAPID) system combined with Coordination of information on the environment (CORINE) Land Cover data to depict the flood-affected areas in western Europe and particularly the agricultural land.
We focus this communication on western Europe, which was the most affected by the 12–15 July heavy-precipitation event. The area extends from 1.5 to 11.6∘ E and 42.9 to 53.1∘ N and encompasses the Netherlands; Belgium; Luxembourg; Switzerland; and portions of Germany, France, and Italy. This region is dominated by marine climate with abundant moisture supplemented by the Atlantic Ocean. The weather is therefore moist and mild in winter and moist and cool in summer.
We extract half-hourly precipitation data of the event from the Integrated Multi-satellitE Retrievals for Global Precipitation Measurement (IMERG) Final Precipitation L3 V06 product with 0.1∘ spatial resolution (https://disc.gsfc.nasa.gov/datasets/GPM_3IMERGHH_06/summary, last access: 25 July 2021; Huffman et al., 2019a). The IMERG half-hourly Final Run product combines the multi-satellite data for the month with Global Precipitation Climatology Centre (GPCC) gauge analysis and thus provides research-level products for precipitation estimation. We used IMERG data to calculate the maximum hourly precipitation rate and precipitation accumulation between 12 and 15 July for each grid.
We generate inundation extents in NRT using the RAPID system and archive these maps on Amazon Web Services (AWS) (available at https://rapid-nrt-flood-maps.s3.amazonaws.com/index.html#Global_Flood_Event/Europe_Flood_2021/, last access: 22 July 2021). RAPID is a fully automated system delineating NRT inundation extents from high-resolution (10 m) synthetic aperture radar (SAR) imagery (Yang et al., 2021; Shen et al., 2019a, b). Specifically, the RAPID system first segments water from non-water pixels by optimizing the threshold and probability density function (PDF) of the water class. Then, it runs a morphology-based procedure to reject false waterbodies using rule sets defined at the body level instead of the pixel level. The morphological processing includes two sub-modules, water source tracing (WST) and improved changed detection (ICD). WST traces water pixels from known water sources (e.g., rivers, lakes) indicated by a land use map. ICD rejects any waterbody that is disconnected from a known water source and does not have significantly increased area compared to the dry time. For dry reference, we use information from ground observation and satellite precipitation to determine the non-flood period, and imagery covering that period is selected as dry reference. RAPID requires approximately five dry reference images for each SAR image sensed on the flood day to reduce the error caused by noise-like speckle. In the third and last processing steps, RAPID uses multi-threshold compensation and machine learning to further reduce the speckles and strong scatter-caused false negatives. Figure 1a presents an example of inundation delineation by RAPID system in Louhans, France. The CORINE Land Cover map is shown in Fig. 1b. The corresponding SAR images were sensed on 16 July 2021 (Fig. 1c, flooding period) and 10 July 2021 (Fig. 1d, dry reference). To rule out false positives caused by glaciers and snow, we apply a threshold using height above nearest drainage (HAND) data to mask out permafrost areas in the Alps. The HAND used in this study is obtained from the Multi-Error-Removed Improved-Terrain (MERIT) Hydro dataset (Yamazaki et al., 2019; Nobre et al., 2011). Pixels over the Alps where HAND values are greater than 20 m are removed from the inundated pixels. The threshold is determined by exploring the distribution of HAND for glaciers and perpetual snow recorded in CORINE Land Cover data and is large enough to avoid the removal of any true positives.
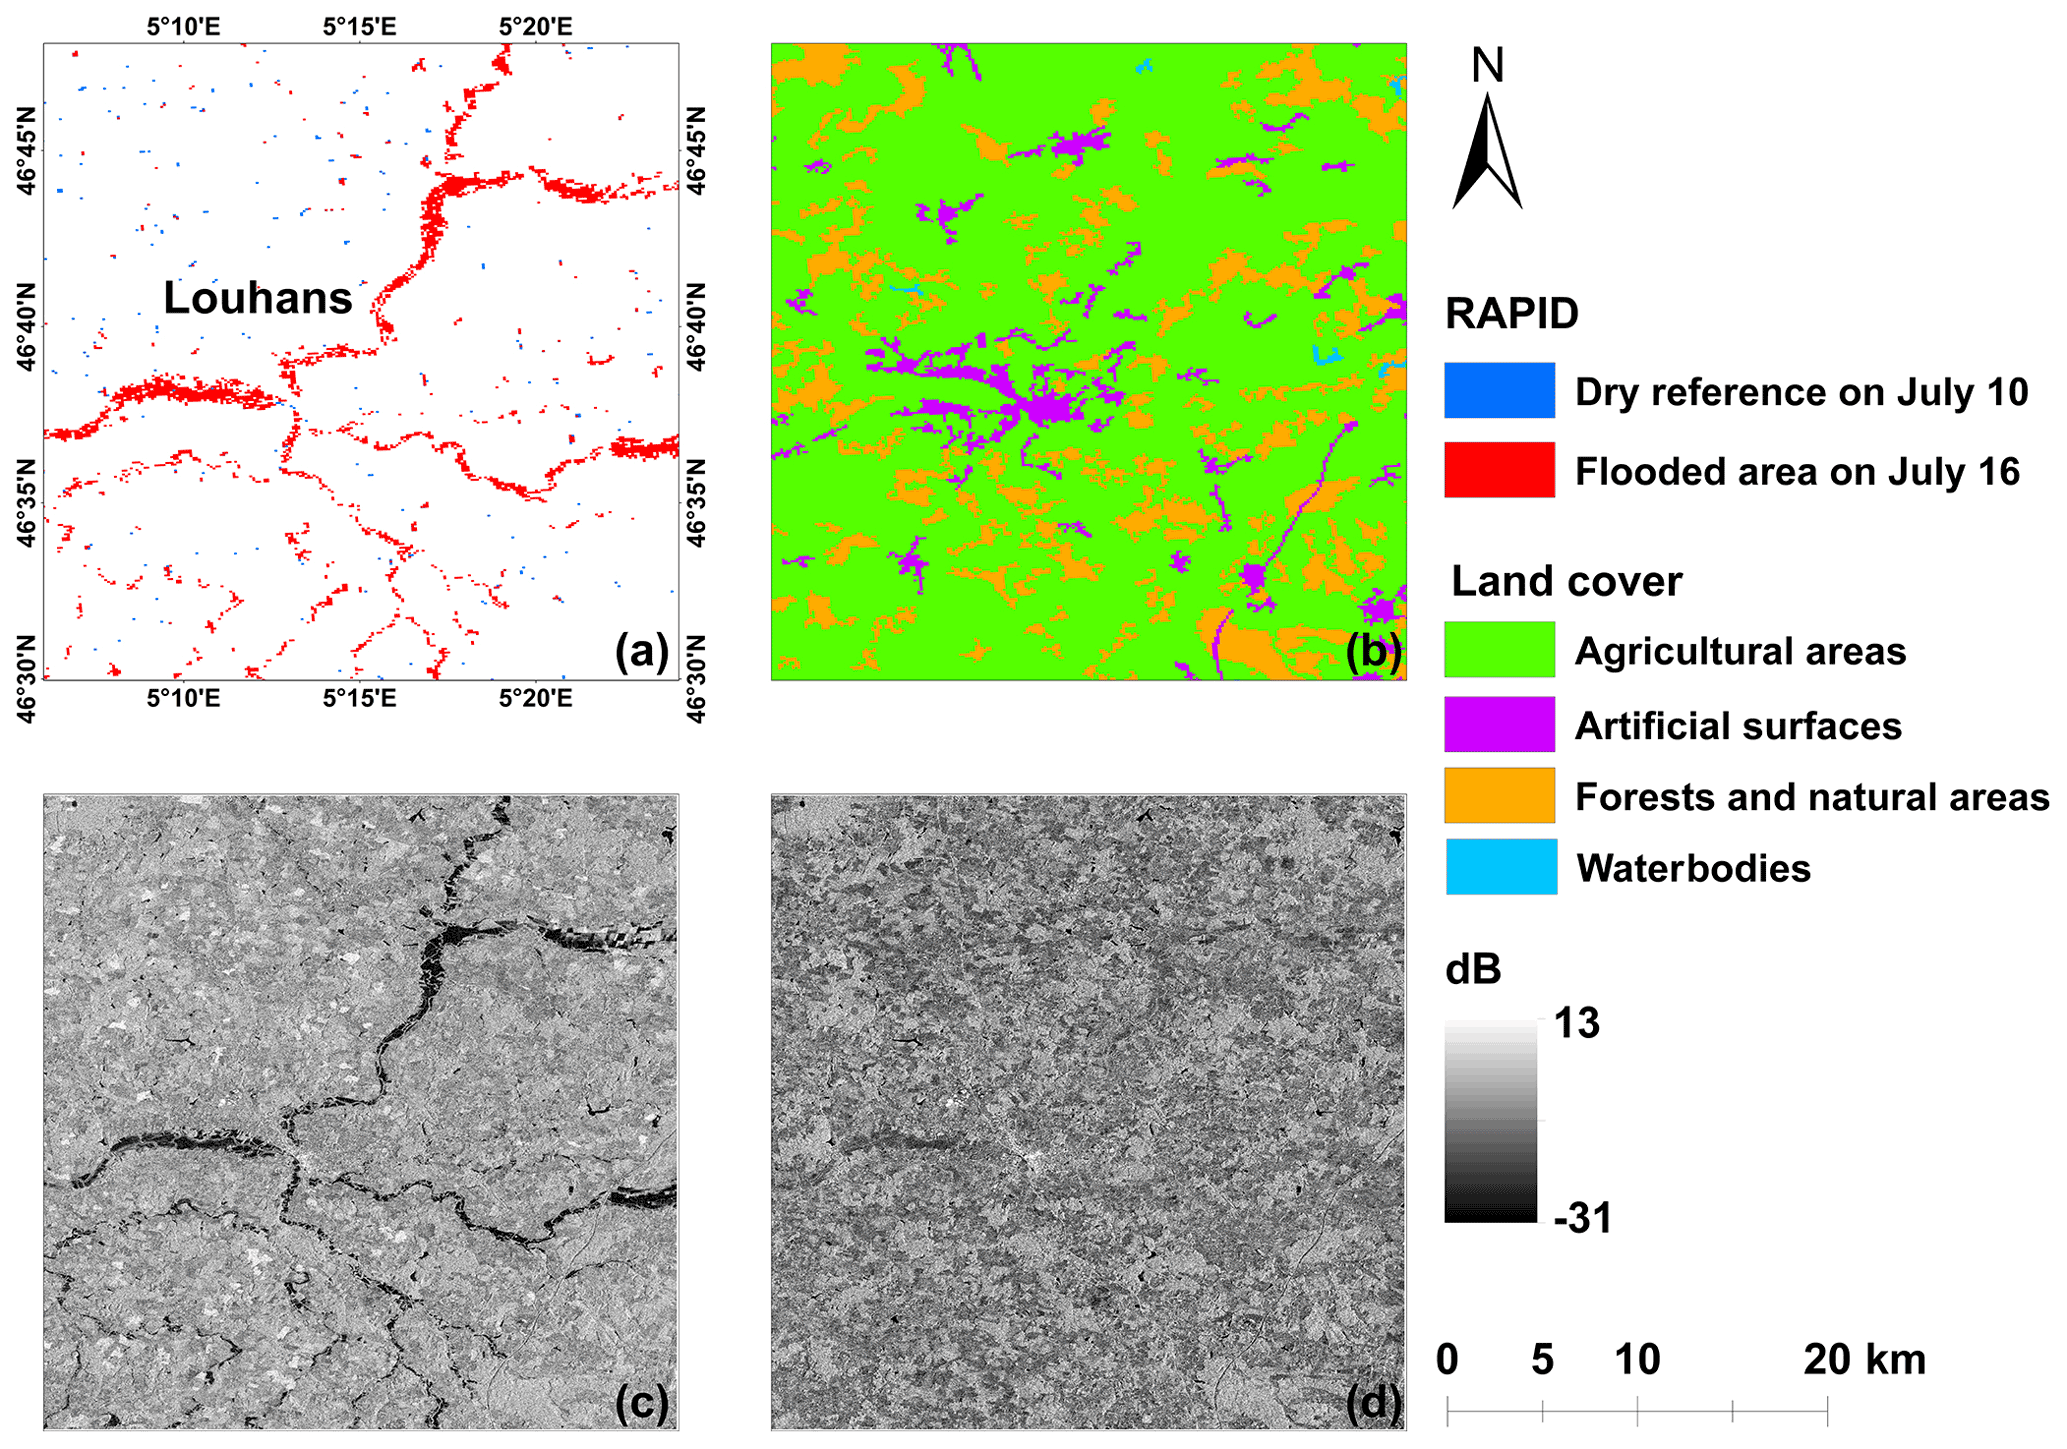
Figure 1(a) RAPID flood map; (b) CORINE Land Cover map; (c, d) Sentinel-1 SAR image in VH polarization sensed on 16 (c) and 10 (d) July.
The Landsat-based flood maps are introduced as an independent validation source for the RAPID system. To generate the flood extent from Landsat, we first acquire surface reflectance imagery sensed in the flooding period from the Landsat 8 OLI collection-2 level-2 dataset (USGS, 2022), which is available from the United States Geological Survey (USGS) Earth Explorer. We then extract the flood extent using the automated water extraction index (AWEI; Feyisa et al., 2014). We calibrate the threshold of the AWEI using water pixel samples of high water occurrence. The water occurrence and land use information are extracted from Pekel et al. (2016) and Gong et al. (2019), respectively. Specifically, pixel samples for water are taken from a persistent waterbody with more than 90 % water occurrence, and non-water pixel samples are equivalently extracted from the land cover types of cropland, forest, grassland, shrubland, impervious surface, and bare land. The optimal AWEI threshold is selected as the one that yields the highest F1 score in segmenting water and non-water pixels.
We obtain the latest land cover map over western Europe from CORINE Land Cover (CLC) inventory data (available at https://land.copernicus.eu/pan-european/corine-land-cover/clc2018, last access: 4 August 2021). CLC uses a minimum mapping unit (MMU) of 25 ha and a minimum width of 100 m for linear elements The standard CLC nomenclature includes 44 land cover classes, grouped into a three-level hierarchy. The five main categories used in this study are “artificial surfaces”, “agricultural areas”, “forest and semi-natural areas”, “wetlands” and “water bodies”. A detailed description of the CORINE program and its nomenclature can be found at https://www.eea.europa.eu/publications/COR0-part1 (last access: 4 August 2021).
The spatial pattern of the accumulated precipitation from the 12–15 July heavy-precipitation event is shown in Fig. 2a. Heavy precipitation (peak rate >20 mm h−1) is observed in western Germany, northeastern France, northern Luxembourg, the southeastern Netherlands, western Switzerland, and western Italy. The most intense precipitation (peak rate >50 mm h−1) is found in western Germany, as well as western Switzerland and Italy over the Alps. Accumulated precipitation heavier than 150 mm is found in eastern France (Châtel-de-Joux, Le Fied), northeastern France (Plainfaing, Villers-la-Chèvre), mid-eastern Luxembourg (Echternach and Mersch), western Belgium (Liège), the southern Netherlands (Limburg), western Germany (North Rhine-Westphalia, Rhineland-Palatinate), Switzerland, and Italy, which represents an equivalent of 2-month precipitation accumulation in these areas. Furthermore, accumulated precipitation is shown to exceed 200 mm in some parts of the region (e.g., western Switzerland, northeastern France, western Germany).
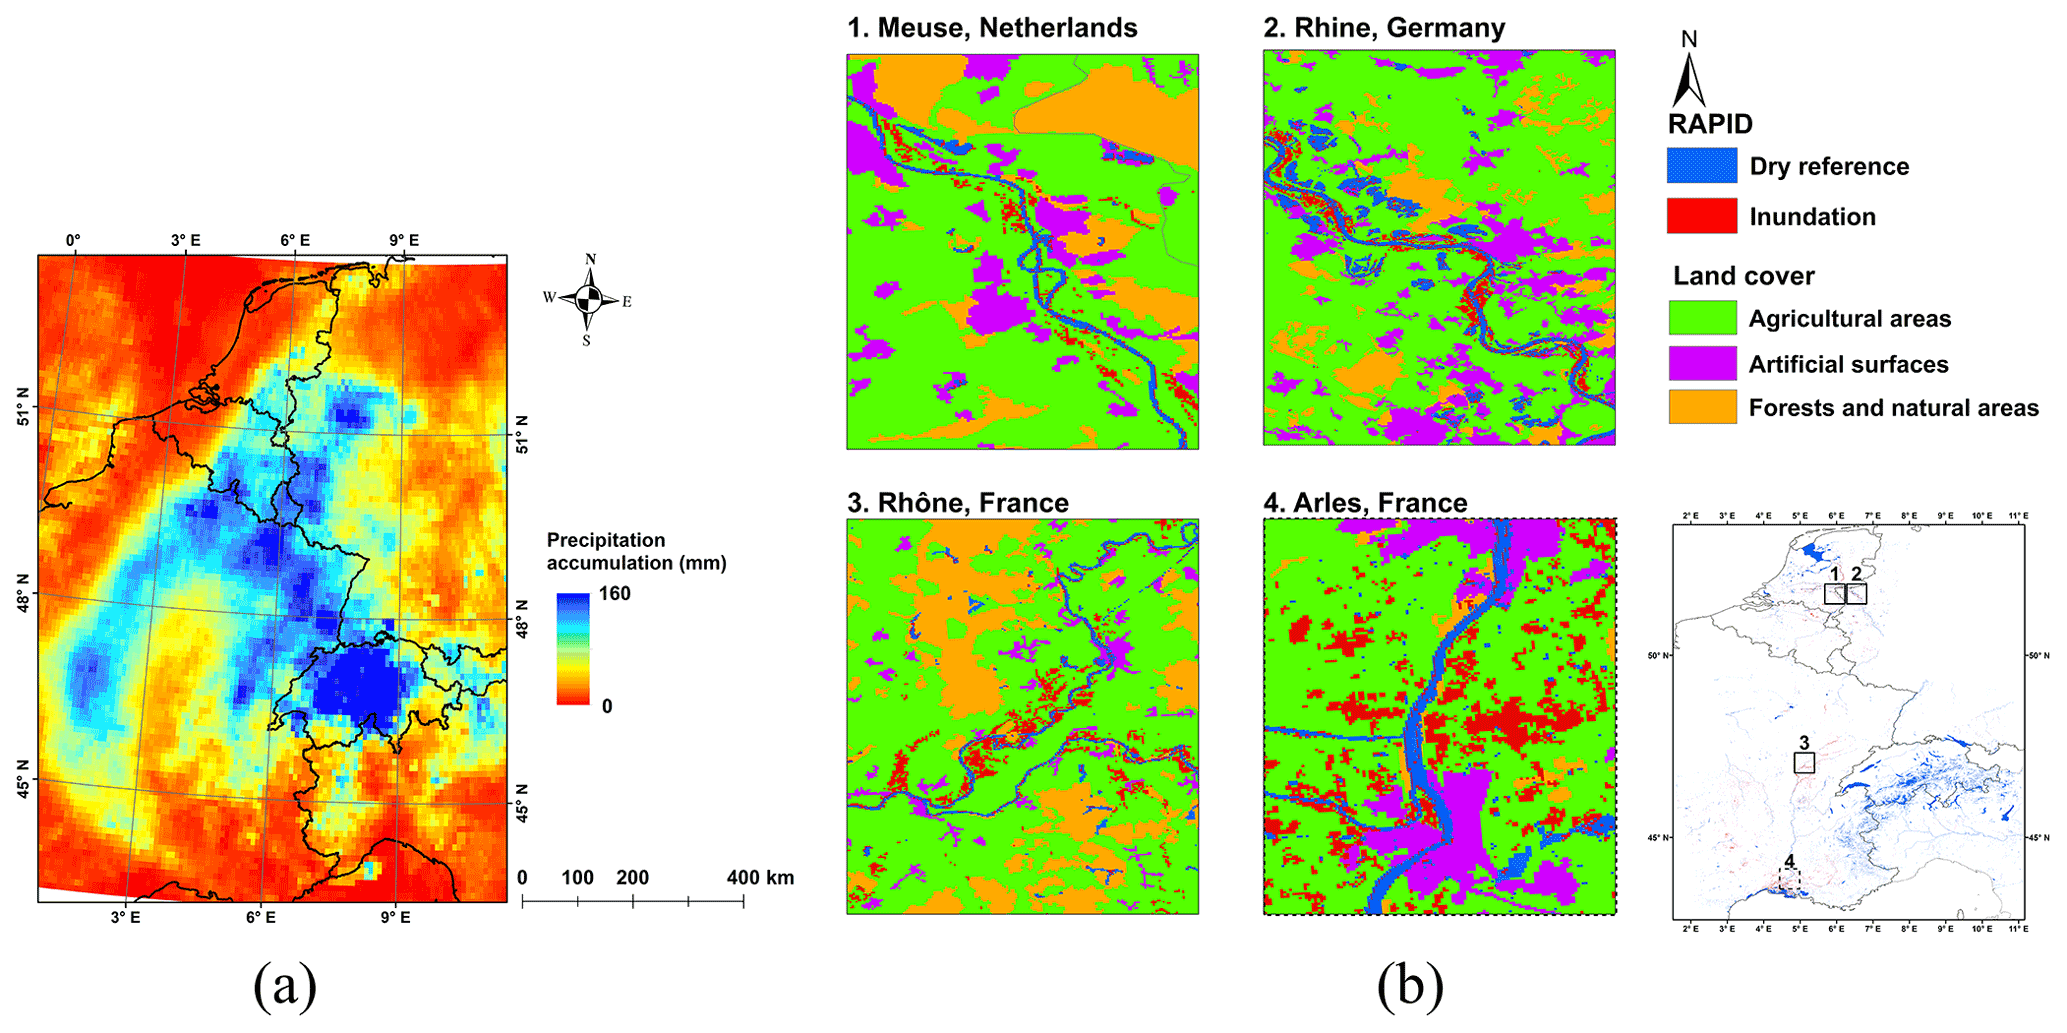
Figure 2(a) Spatial pattern of precipitation accumulation over western Europe from 12 to 15 July, derived from IMERG half-hourly Final Run data. (b) Inundation extents over western Europe from 15 to 18 July, derived from the RAPID system. Note the inundation results over southeast France, the regions around the dashed rectangle, have uncertainly due to irrigation during the flooding time.
Figure 2b shows the inundation extents over western Europe, while the regions where extensive flooded areas are found from the RAPID inundation map, e.g., the floodplains along the Meuse in the southern Netherlands, the Rhine in western Germany, and the Rhône in northeastern France, are displayed. The inundation extent over Arles in south coastal France is presented as well. The RAPID inundation map shows high consistency with the precipitation map. The total inundated area determined from the RAPID inundation map is around 1920 km2. We find extensive inundated areas in the upstream region of the Rhône River where more than 120 mm precipitation fell in 72 h. Southeastern France, especially the coastal area, exhibits extensive flood inundation as well, though the accumulated precipitation in these areas is only around 10 mm. The flooded areas in southeastern France whose pattern is primarily patchy, not linked to rivers, are mostly arable land, shown in Fig. 3a. These areas exhibit clearly dampened backscattering comparing the dry date (Fig. 3c, 22 June) to the flood date (Fig. 3b, 16 July), while their backscattering on the flood date falls into the water category. The croplands labeled as inundated in southeastern France may be caused by irrigation instead of floods because the irrigation starts from 15 June in France. As stated in the RAPID algorithm (Shen et al., 2019a), RAPID does not give the cause of an incremental area of submersion, so the labeled inundation could be caused by irrigation. But the authors intend to leave such reasoning to local flood managers or stakeholders because they have better local knowledge, and therefore the authors do not think such a limitation could cause an issue in disaster response. The total inundated area over France is approximately 1320 km2. In Germany, the main inundated area is found in the west and is caused by intensive precipitation (120 mm) along the Rhine River (about 162 km2). In the southern Netherlands where more than 100 mm precipitation is observed, the floodplains of the Meuse, Rhine, and IJssel were largely affected, with a total area of 140 km2. We compared the RAPID inundation maps and Landsat-based flood inundation maps (FIMs) for the central Netherlands, presented as Fig. 4a and b, respectively. The RAPID- and Landsat-based FIMs shows high consistency in terms of the flooded areas according to the result of quantitative comparison, with precision, recall, the F1 score and Cohen kappa metrics are 0.9, 0.8, 0.9, 0.9, respectively. In Belgium and Luxembourg, the inundated areas are 116 and 1.8 km2, mostly along the Meuse River and Sauer River, respectively. In western Italy, an area of around 50 km2 along the Po River is affected by flooding. The flash floods in Switzerland also cause a 131 km2 inundation.
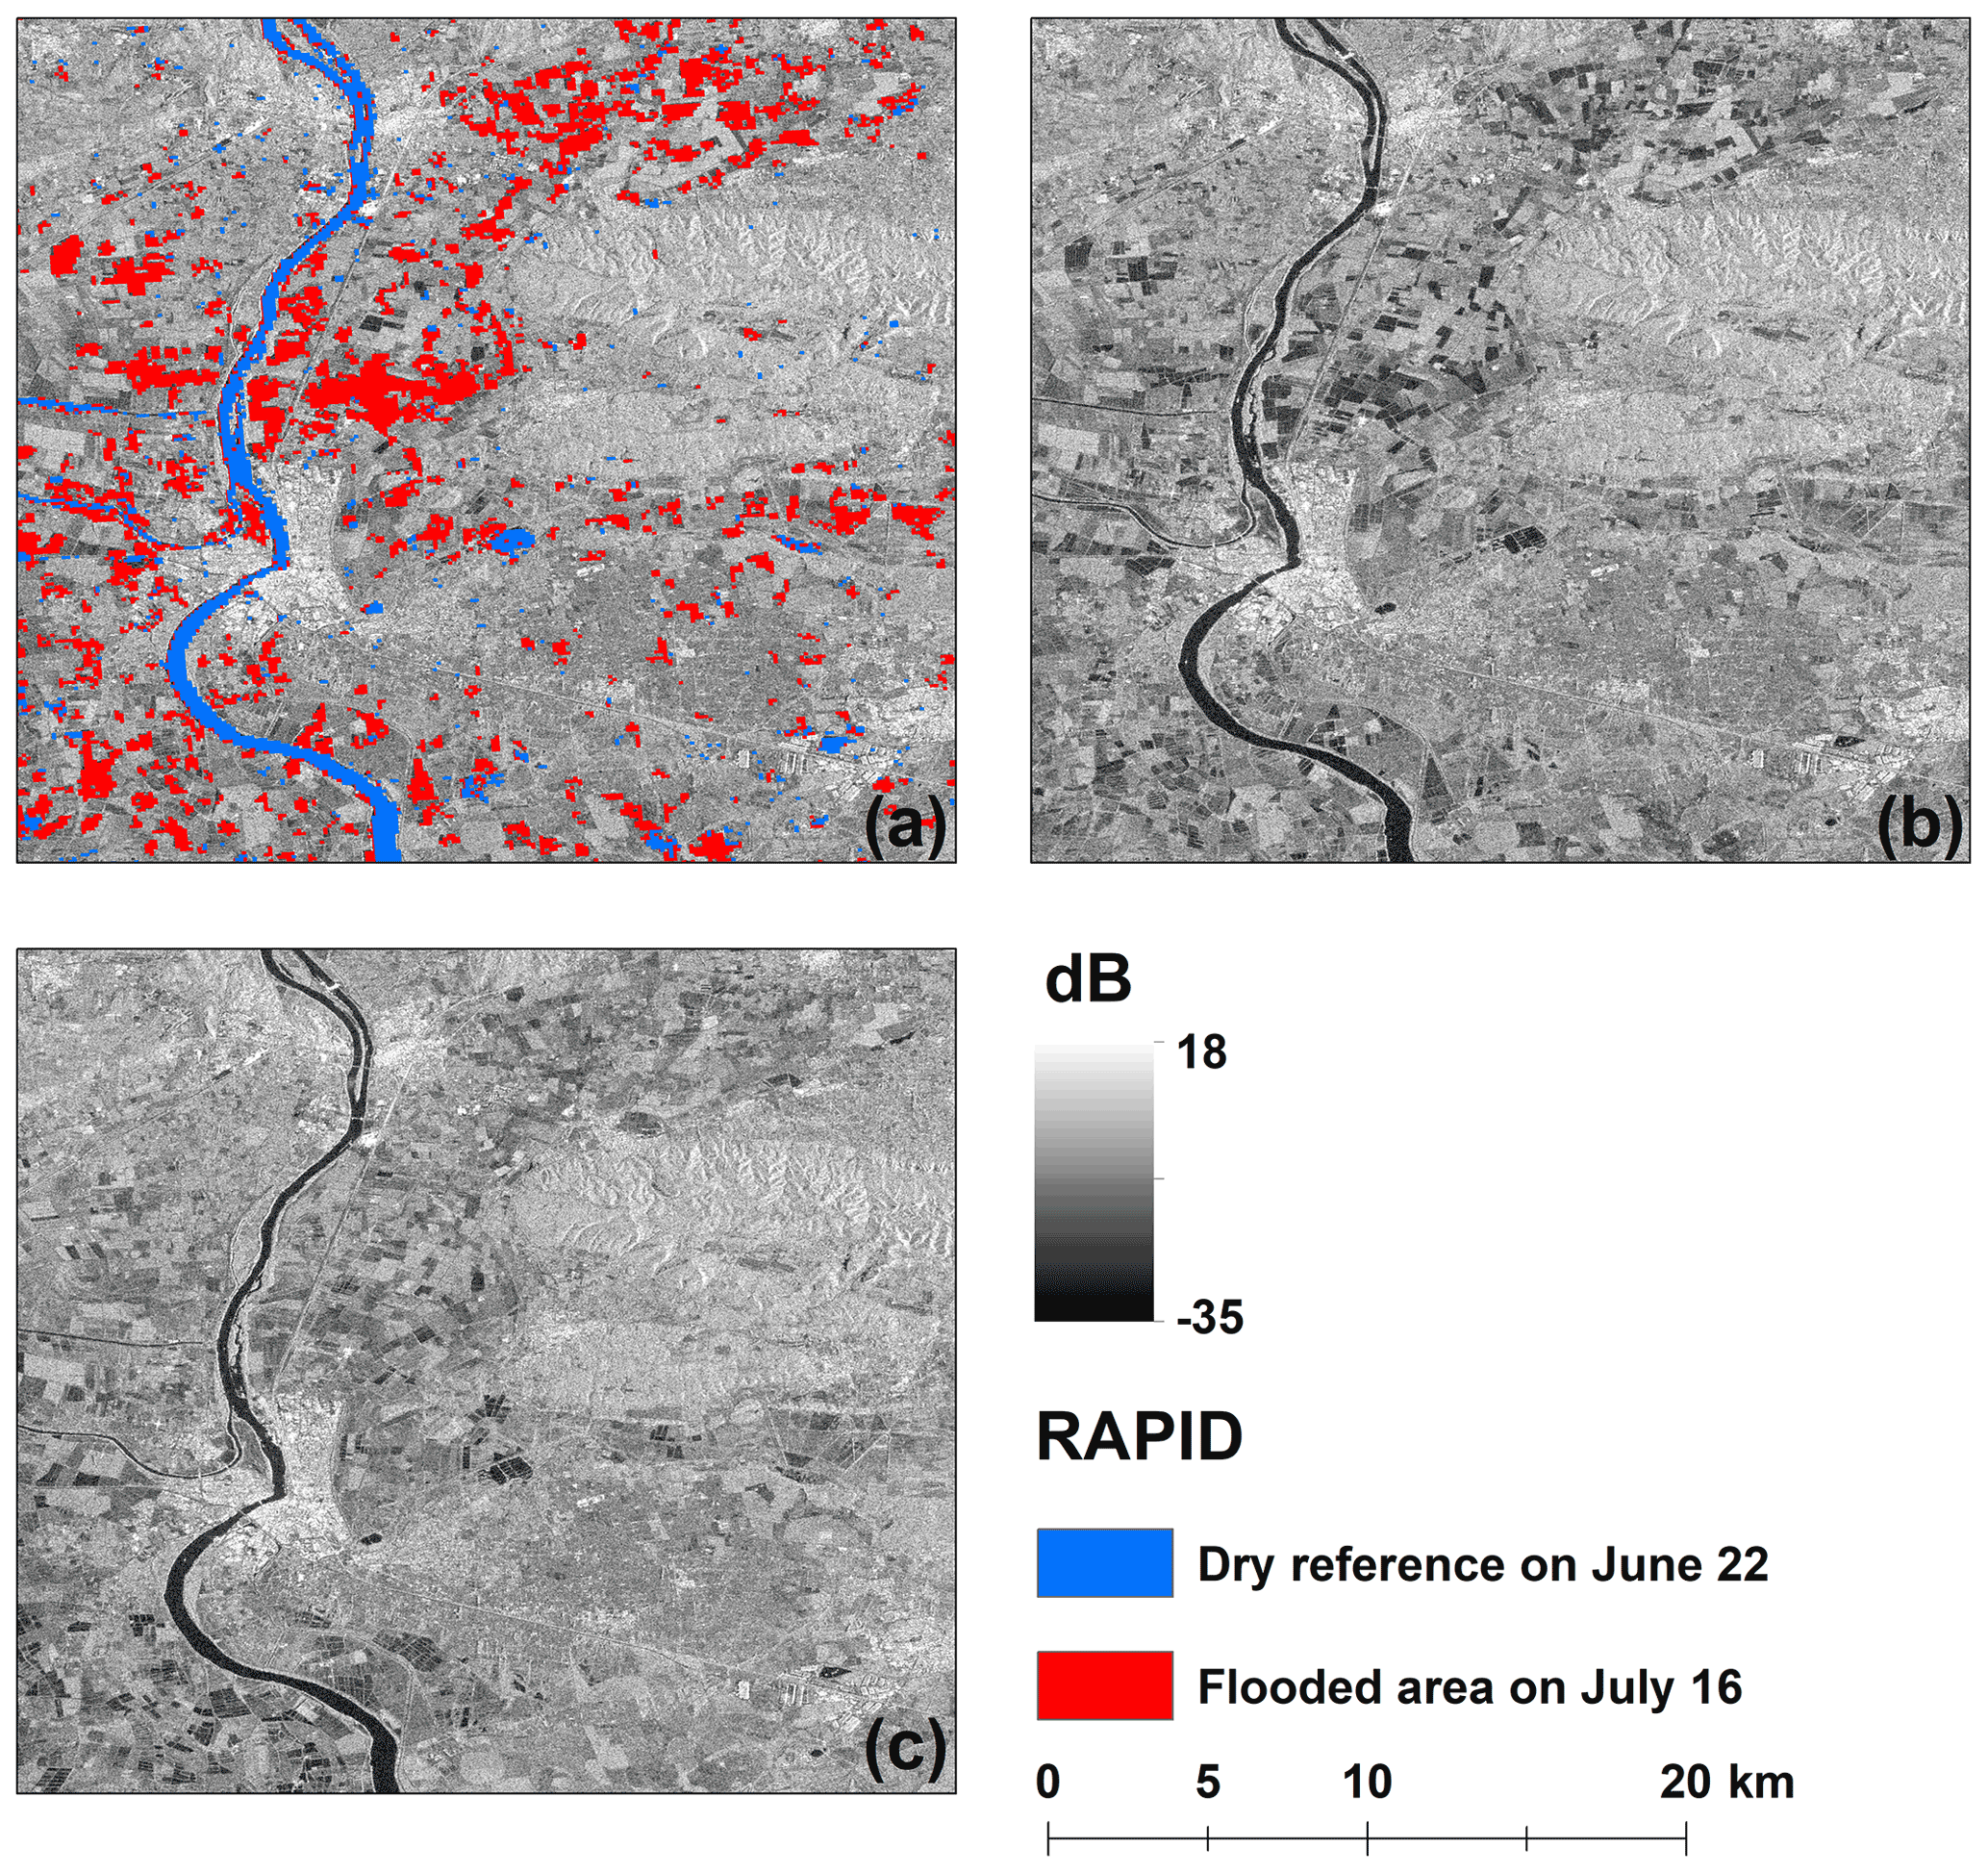
Figure 3(a) RAPID flood map; (b) Sentinel-1 SAR image in VH polarization sensed on 16 July; (c) Sentinel-1 SAR image in VH polarization sensed on 22 June.
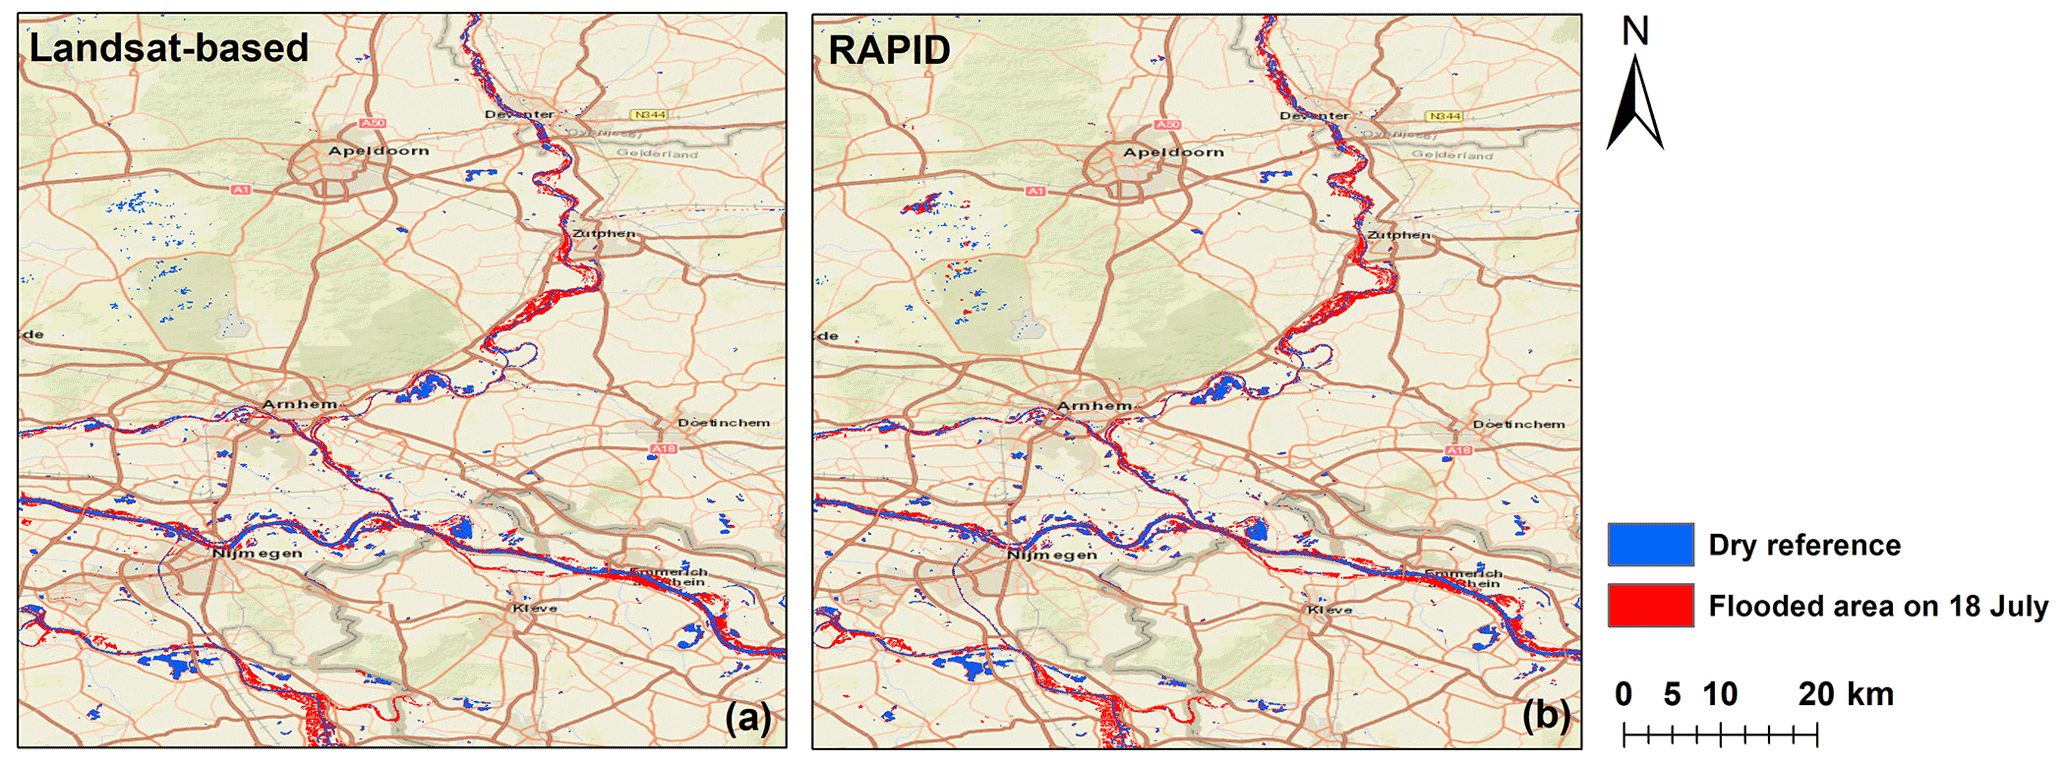
Figure 4Inundation extent from the (a) Landsat-based flood map and (b) RAPID flood map on 18 July in the central Netherlands.
Table 1 shows the land use fraction in the inundated areas. Among them, 24 % (464 km2) of the land is forested/semi-natural areas. For wetlands and artificial surfaces, the fractions are 5.7 % (110 km2) and 5.7 % (110 km2), respectively. The majority, nearly 64 % (1240 km2) of the flood inundated area, is from agricultural land. Over inundated agricultural areas, 36 % (444 km2) is pastures; 34 % (416 km2) is arable land (including non-irrigated arable land and rice fields, 339 and 77 km2, respectively); and 23 % (289 km2) is heterogeneous agricultural areas, which is the sum of complex cultivation patterns (248 km2) and land principally occupied by agriculture, with significant areas of natural vegetation (40 km2). The remaining 7.1 % (88 km2) is permanent crops consisting of vineyards (67 km2), fruit trees and berry plantations (20 km2), and olive groves (0.5 km2).
Table 1Inundated area of land use grouped by countries over western Europe.

Specifically in France, 974 km2 of agricultural land cover is affected by the flood. Among those inundated agricultural areas in France, 317, 337, 233, and 86 km2 are pastures, arable land, heterogeneous agricultural areas, and permanent crops, respectively. Especially the non-irrigated arable land in France is severely affected: the area is up to 263 km2, which is larger than the sum of inundated non-irrigated arable land in other countries. Besides, the rice fields and vineyards in France are also hit by flood. More than 74 km2 of rice fields and vineyards, mainly in the coastal areas, is inundated. In the Netherlands, 99 km2 of agricultural land is inundated, mostly pastures (50 km2) followed by heterogeneous agricultural areas (28 km2). The inundated area of arable land (mostly non-irrigated arable land) in the Netherlands is 20 km2, while only 0.1 km2 of permanent crops (mainly fruit trees and berry plantations) is affected by flood. In Germany, 88 km2 of agricultural land is inundated with 59 and 25 km2 of these areas being pastures and non-irrigated arable land, respectively. The inundation over heterogeneous agricultural areas and permanent crops (including vineyards, fruit trees, and berry plantations) in Germany is estimated at 3.1 and 0.8 km2, respectively. The total inundated areas in Belgium and Italy are 116 and 50 km2, respectively. In Belgium, the inundated areas of heterogeneous agricultural land, pastures, and arable land are 20, 12, and 14 km2, respectively, while nearly no permanent crop is affected by flood. In Italy, most inundation among agricultural areas is on arable land (12 km2 of non-irrigated arable land and 2.8 km2 of rice fields) and secondarily on heterogeneous agricultural area (1.4 km2). Only 0.2 km2 of pastures in Italy is inundated, while 0.1 km2 of permanent crops (vineyards) is affected by flood. In Switzerland, the inundated areas of non-irrigated arable land, pastures, and heterogeneous agricultural areas are 4.7, 3.4, and 2.1 km2, respectively. Of permanent crops, mainly fruit trees and berry plantations, 0.5 km2 is also found to be affected by flood in Switzerland. No permanent crop is inundated in Luxembourg; the total inundated area in Luxembourg is 1.8 km2, with 0.4, 0.3, and 0.3 km2 of this being heterogeneous agricultural areas, non-irrigated arable land, and pastures, respectively.
Unprecedented precipitation heavily damaged western Europe with catastrophic flooding, causing damage to agriculture that has as yet been minimally quantified. In this communication, we analyze the inundated area of agricultural land by overlaying the inundation extent derived from the RAPID system with CORINE Land Cover data. The results indicate that the total inundated area over western Europe is about 1920 km2, of which 1320 km2 is in France. Around 64 % of the flooded area is agricultural land. Because of the wide impact, we expect that agricultural productivity in western Europe will be significantly reduced. Mid-July, when the extreme flood happened, is the critical growing season for crops like corn in Belgium, France, Luxembourg, and the Netherlands and also the harvest season for wheat in Belgium, France, and Germany (Foreign Agricultural Service, 2022). The quality and production of these crops would have been severely damaged. Besides the direct damage to livestock and crops, the soil erosion and sedimentation due to the flood would have caused a significant part of agricultural land to be washed away or become less fertile (Ara, 2019; Morris and Brewin, 2014). In addition, extra costs are needed for pastures and cultivable land to be reconstructed and recover.
The findings of this study have to be seen in light of some limitations. The first is that the RAPID system in Europe is triggered by IMERG precipitation data, which comprise a satellite-based precipitation product found to systematically underestimate precipitation in complex terrain areas, such as the Alps (Navarro et al., 2019). More accurate precipitation data over Europe are recommended to provide more reasonable inundation results over these areas. The second limitation concerns spatial resolution. RAPID can not capture the inundation well in the limited floodplains along the small rivers, such as those in the floodplains along the Geul River in the southern Netherlands, due to the spatial resolution issue. Higher-resolution data, including satellite imagery data and land use data, could help the RAPID system to map the flooded area along the small rivers. Lastly, the irrigation on croplands during the flooding period, like the case in southeast France, may cause uncertainty in RAPID inundation results. Local knowledge from users can inform RAPID to help further improve its accuracy. With the increasing flood observing capability brought by modern satellite constellations (for example, ICEYE; Ignatenko et al., 2020), future directions of this study will include combining the NRT RAPID inundation estimates with developed flood models, crop data, and other essential data (soil salinity, crop sensitivity, etc.) to predict flood-damaged cropland areas (Lazin et al., 2021) and associated socioeconomic impact (Gould et al., 2020).
The codes to generate and analyze the results of this study are available from the corresponding author upon reasonable request.
Flood maps and data produced from RAPID are available at https://rapid-nrt-flood-maps.s3.amazonaws.com/index.html#Global_Flood_Event/Europe_Flood_2021/ (Yang et al., 2021). Precipitation data are available at https://doi.org/10.5067/GPM/IMERG/3B-HH/06 (Huffman et al., 2019b). HAND data are available at http://hydro.iis.u-tokyo.ac.jp/~yamadai/MERIT_Hydro/ (Yamazaki et al., 2019). Land cover data over Europe are available at https://land.copernicus.eu/pan-european/corine-land-cover/clc2018/ (last access: 4 August 2021) (Büttner, 2014).
KH contributed with formal analysis, writing of the original draft, and editing. QY contributed with software, formal analysis, and data curation. XS and ENA contributed with conceptualization, project administration, and review and editing of the paper.
The contact author has declared that none of the authors has any competing interests.
Publisher’s note: Copernicus Publications remains neutral with regard to jurisdictional claims in published maps and institutional affiliations.
This research was supported by the National Science Foundation HDR award entitled “Collaborative Research: Near Term Forecasts of Global Plant Distribution, Community Structure, and Ecosystem Function.” Kang He received support of the China Scholarship Council for 4 years' PhD study at the University of Connecticut (under grant agreement no. 201906320068).
This research has been supported by the National Science Foundation (Collaborative Research: Near Term Forecasts of Global Plant Distribution, Community Structure, and Ecosystem Function) and the China Scholarship Council.
This paper was edited by Philip Ward and reviewed by Lorenzo Alfieri and Hans de Moel.
Agence Europe: Impact of flood disaster on EU agriculture is yet to be determined, https://agenceurope.eu/en/bulletin/article/12766/19, last access: 21 July 2021.
Ara, M. J.: Effect of floods on farmer's livelihood: a case study for building agriculture resilient to floods in Bangladesh, International Journal of Science, Environment and Technology, 8, 334–344, 2019.
Büttner, G.: CORINE land cover and land cover change products, Land use and land cover mapping in Europe, Springer, Dordrecht, 55–74, Print ISBN 978-94-007-7968-6, Online ISBN 978-94-007-7969-3, https://doi.org/10.1007/978-94-007-7969-3_5, 2014 (data available at: https://land.copernicus.eu/pan-european/corine-land-cover/clc2018/, last access: 4 August 2021).
CNN: Germany's deadly floods were up to 9 times more likely because of climate change, study estimates, https://www.cnn.com/2021/08/23/europe/germany-floods-belgium-climate-change-intl/index.html, last access: 24 August 2021.
Euractiv: EU farmers warn harvest will fail after floods, plea for aid, https://www.euractiv.com/section/agriculture-food/news/eu-farmers-warn-harvest-will-fail-after-floods-plea-for-aid/, last access: 20 July 2021.
Eurofruit: Europe's flood damage begins to emerge, http://www.fruitnet.com/eurofruit/article/185840/europes-flood-damage-begins-to-emerge, last access: 22 July 2021.
Feyisa, G. L., Meilby, H., Fensholt, R., and Proud, S. R.: Automated Water Extraction Index: A new technique for surface water mapping using Landsat imagery, Remote Sens. Environ., 140, 23–35, 2014.
FloodList: Europe, https://floodlist.com/europe, last access: 16 July 2021.
Foreign Agricultural Service: Crop Calendars for Europe, https://ipad.fas.usda.gov/rssiws/al/crop_calendar/europe.aspx, last access: 1 March 2022.
Gong, P., Liu, H., Zhang, M., Li, C., Wang, J., Huang, H., Clinton, N., Ji, L., Li, W., Bai, Y., and Chen, B.: Stable classification with limited sample: transferring a 30-m resolution sample set collected in 2015 to mapping 10-m resolution global land cover in 2017, Sci. Bull., 64, 370–373, 2019.
Gould, I. J., Wright, I., Collison, M., Ruto, E., Bosworth, G., and Pearson, S.: The impact of coastal flooding on agriculture: A case-study of Lincolnshire, United Kingdom, Land Degrad. Dev., 31, 1545–1559, 2020.
Huffman, G. J., Stocker, E. F., Bolvin, D. T., Nelkin, E. J., and Tan, J.: GPM IMERG Late Precipitation L3 1 day 0.1 degree × 0.1 175 degree V06, edited by: Savtchenko, A., Greenbelt, MD, Goddard Earth Sciences Data and Information Services Center (GES DISC) [data set], https://doi.org/10.5067/GPM/IMERGDL/DAY/06, 2019a.
Huffman, G. J., Stocker, E. F., Bolvin, D. T., Nelkin, E. J., and Jackson, T.: GPM IMERG Final Precipitation L3 Half Hourly 0.1 degree × 0.1 degree V06, Greenbelt, MD, Goddard Earth Sciences Data and Information Services Center (GES DISC) [data set], https://doi.org/10.5067/GPM/IMERG/3B-HH/06, 2019b.
Ignatenko, V., Laurila, P., Radius, A., Lamentowski, L., Antropov, O., and Muff, D.: ICEYE Microsatellite SAR Constellation Status Update: Evaluation of first commercial imaging modes, in: IGARSS 2020-2020 IEEE International Geoscience and Remote Sensing Symposium, Waikoloa, HI, USA, 26 September 2020, pp. 3581–3584, https://doi.org/10.1109/IGARSS39084.2020.9324531, 2020.
USGS: Landsat 8-9 Collection 2 (C2) Level 2 Science Product (L2SP) Guide, United States Geological Survey, Asheville, NC, USA, 1–42, 2022.
Lazin, R., Shen, X., and Anagnostou, E.: Estimation of flood-damaged cropland area using a convolutional neural network, Environ. Res. Lett., 16, 054011, https://doi.org/10.1088/1748-9326/abeba0, 2021.
Morris, J. and Brewin, P.: The impact of seasonal flooding on agriculture: the spring 2012 floods in Somerset, England, J. Flood Risk Manag., 7, 128–140, 2014.
Navarro, A., García-Ortega, E., Merino, A., Sánchez, J. L., Kummerow, C., and Tapiador, F. J.: Assessment of IMERG precipitation estimates over Europe, Remote Sensing, 11, 2470, https://doi.org/10.3390/rs11212470, 2019.
Nobre, A. D., Cuartas, L. A., Hodnett, M., Rennó, C. D., Rodrigues, G., Silveira, A., and Saleska, S.: Height Above the Nearest Drainage – a hydrologically relevant new terrain model, J. Hydrol., 404, 13–29, 2011.
Pekel, J. F., Cottam, A., Gorelick, N., and Belward, A. S.: High-resolution mapping of global surface water and its long-term changes, Nature, 540, 418–422, 2016.
Reinsurance News: Berenberg says European floods to cost reinsurers up to €3bn, https://www.reinsurancene.ws/berenberg-says-european-floods-to-cost-reinsurers-up-to-e3bn/, last access: 20 July 2021.
Shen, X., Anagnostou, E. N., Allen, G. H., Brakenridge, G. R., and Kettner, A. J.: Near-real-time non-obstructed flood inundation mapping using synthetic aperture radar, Remote Sens. Environ., 221, 302–315, 2019a.
Shen, X., Dacheng W., Kebiao M., Anagnostou, E. N., and Hong Y.: Inundation Extent Mapping by Synthetic Aperture Radar: A Review, Remote Sensing, 11, 879, https://doi.org/10.3390/rs11070879, 2019b.
Successful Farming: Sucrose news: USA: UPDATE 2-EU MONITOR TWEAKS 2021 CROP YIELD FORECASTS AS RAINS HIT QUALITY, https://www.sucrosenews.com/usa-update-2-eu-monitor-tweaks-2021-crop-yield-forecasts-as-rains-hit-quality, last access: 27 July 2021.
Tapia-Silva, F. O., Itzerott, S., Foerster, S., Kuhlmann, B., and Kreibich, H.: Estimation of flood losses to agricultural crops using remote sensing, Physics and Chemistry of the Earth, Parts A/B/C,, 36, 253–265, https://doi.org/10.1016/j.pce.2011.03.005, 2011.
World Weather Attribution: Heavy rainfall which led to severe flooding in Western Europe made more likely by climate change, https://www.worldweatherattribution.org/heavy-rainfall-which-led-to-severe-flooding-in-western-europe-made-more-likely-by-climate-change/, last access: 23 August 2021.
Yamazaki, D., Ikeshima, D., Sosa, J., Bates, P. D., Allen, G. H., and Pavelsky, T. M.: MERIT Hydro: A high-resolution global hydrography map based on latest topography dataset, Water Resour. Res., 55, 5053–5073, https://doi.org/10.1029/2019WR024873, 2019 (data available at: http://hydro.iis.u-tokyo.ac.jp/~yamadai/MERIT_Hydro/, last access: 22 July 2019).
Yang, Q., Shen, X., Anagnostou, E. N., Mo, C., Eggleston, J. R., Kettner, A. J.: A High-Resolution Flood Inundation Archive (2016–the Present) from Sentinel-1 SAR Imagery over CONUS, B. Am. Meteorol. Soc., 102, E1064–E1079, https://doi.org/10.1175/BAMS-D-19-0319.1, 2021 (data available at: https://rapid-nrt-flood-maps.s3.amazonaws.com/index.html#Global_Flood_Event/Europe_Flood_2021/, last access: 22 July 2021).