the Creative Commons Attribution 4.0 License.
the Creative Commons Attribution 4.0 License.
 | 25 Jul 2022
Full-scale experiments to examine the role of deadwood in rockfall dynamics in forests
Adrian Ringenbach
Elia Stihl
Yves Bühler
Peter Bebi
Perry Bartelt
Andreas Rigling
Marc Christen
Guang Lu
Andreas Stoffel
Martin Kistler
Sandro Degonda
Kevin Simmler
Daniel Mader
Andrin Caviezel
Forests are rockfall-protective ecological infrastructures as a significant amount of kinetic energy is absorbed during consecutive rock–tree impacts. Although many recent works have considered rock impacts with standing trees, the effect of lying deadwood in forests has not yet been considered thoroughly, either experimentally or numerically. Here, we present a complete examination of induced rockfall experiments with sensor-equipped, 45 kg, artificial rocks on a forested area in three different management stages. The trilogy is conducted in a spruce forest stand (i) in its original state of forest; (ii) after a logging operation with fresh, lying deadwood; and (iii) after the removal of the deadwood. The tests allow us to directly quantify the effect of fresh deadwood on overall rockfall risk for the same forest (slope, species) under three different conditions. The study yields quantitative results on the barrier efficiency of the deadwood logs as only 3.6 % of the rocks surpass the deadwood section. The mean run-out distance is reduced by 42 %. Conversely, the run-out distance increases by 17 % when the cleared stand is compared to the original forest. These results quantitatively confirm the benefits of nature-based mitigation measures integrated into forestry practice, whose detailed effect has to be scrutinized for higher rockfall energies. Based on the experimental results, we extended a modern rockfall code by three-dimensional deadwood logs to incorporate such complex but realistic forest boundary conditions.
- Article
(6198 KB) - Full-text XML
- BibTeX
- EndNote


Rockfall is a common natural hazard in mountain regions. Up to certain rockfall magnitudes, protection forests are effective ecological infrastructures to reduce rockfall intensities and thus the damage to vulnerable facilities as falling rocks are decelerated by consecutive tree impacts. This has been shown by real-scale experiments at the slope scale in a mixed Abies–Picea–Fagus forest (Dorren and Berger, 2005) as well as on single trees of different species including Picea abies (Lundström et al., 2009) and Ailanthus altissima (Wunder et al., 2018). Implementation of these findings into three-dimensional rockfall models, e.g., Rammer et al. (2010), Dorren (2012), Toe et al. (2017) and Lu et al. (2020), has facilitated additional investigations to quantify the protective capacity of mountain forests using numerical tools at the forest stand (Stoffel et al., 2006; Woltjer et al., 2008; Moos et al., 2017) and regional (Dupire et al., 2016; Lanfranconi et al., 2020) scales.
Experimental tests to investigate the role of deadwood in rockfall mitigation have also been performed at the laboratory (Ammann, 2006; Olmedo et al., 2015) and slope (Bourrier et al., 2012) scales. The laboratory studies provided the first quantitative insights into the protective effects of deadwood but do not accurately represent natural deadwood configurations after disturbances since the investigators used clumped Picea abies and Fagus sylvatica specimens with relatively small mean diameters of 26 and 6 cm (Ammann, 2006; Olmedo et al., 2015). The field studies of Bourrier et al. (2012) used larger 63 cm diameter logs fixed to tree stumps using steel cables. How deadwood is naturally fixed (jammed) between trees and the ground is essential to understand its protective capacity, and therefore non-natural fixations may also not represent natural conditions in mountain forests. As a consequence, present approaches to include deadwood in a three-dimensional rockfall model are based on slope or roughness adaption methods combined with higher and empirically determined rock–ground restitution coefficients (Fuhr et al., 2015; Costa et al., 2021).
Neither the different experimental nor the modeling approaches take piled stems into account, which are often the result of uprooted trees during windthrow events. Beside windthrows (Feser et al., 2015), bark beetle outbreaks (Jönsson et al., 2009) and forest fires (Mozny et al., 2021; Jain et al., 2020) are also likely to increase in frequency or amplitude due to climate change and land-use legacies. Allowing natural processes without salvage logging after windthrow and without sanitary felling after bark beetle outbreaks are increasingly promoted as an adequate management option (Kulakowski et al., 2017; Sommerfeld et al., 2021). In rockfall protection forests, it is decisive to know more about the short- and long-term effects of piled stems on rockfalls after natural disturbances or management interventions.
In this paper, we present the results of three induced rockfall experiments within the same mountain forest but in three different management states. First, we performed rockfall experiments in the original, undisturbed forest. In the next series of tests, the effect of lying, partly piled, fresh deadwood in the upper third of the slope was tested. The “deadwood” was created after a forest management intervention and was therefore in a fresh condition with maximal physical resistance. In the final test series, the deadwood was cleared (the final forest was, therefore, sparser than the original forest). All three tests were performed in the same spruce stand to explore the protective effect of lying deadwood quantitatively. We extended a three-dimensional rockfall code with truncated cones acting as deadwood logs to imitate the experimental setting numerically. An in-depth model calibration was performed based on the experimental results. As nature-based mitigation measures are expected to gain in importance, an accurate treatment thereof in numerical tools is essential for future hazard assessment procedures.
2.1 Study site – Surava
The study site (46.65720∘ N, 9.60497∘ E; 1120 m a.s.l.) covers 0.54 ha of northwest-exposed, roughly 35∘ steep mountain forest in the community of Surava within the municipal area of Albula/Alvra, Switzerland. In a complete forest inventory the diameters at breast height (DBHs), tree species and GNSS positions of all trees with DBH ≥ 8 cm were recorded, resulting in a total of 462 trees, a stand density of 855 trees ha−1 and a mean DBH of 23.9±11.7 cm (see Fig. 1a). The principal tree species are Norway spruce (78.8 %, Picea abies (L.) Karst.), European larch (9.5 %, Larix decidua Mill.), mountain pine (6.7 %, Pinus mugo subsp. uncinata (DC.) Domin) and silver fir (4.1 %, Abies alba Mill.). Further single rowans (Sorbus aucuparia L.), beeches (Fagus sylvatica L.) and whitebeams (Sorbus aria (L.) Crantz) were registered.
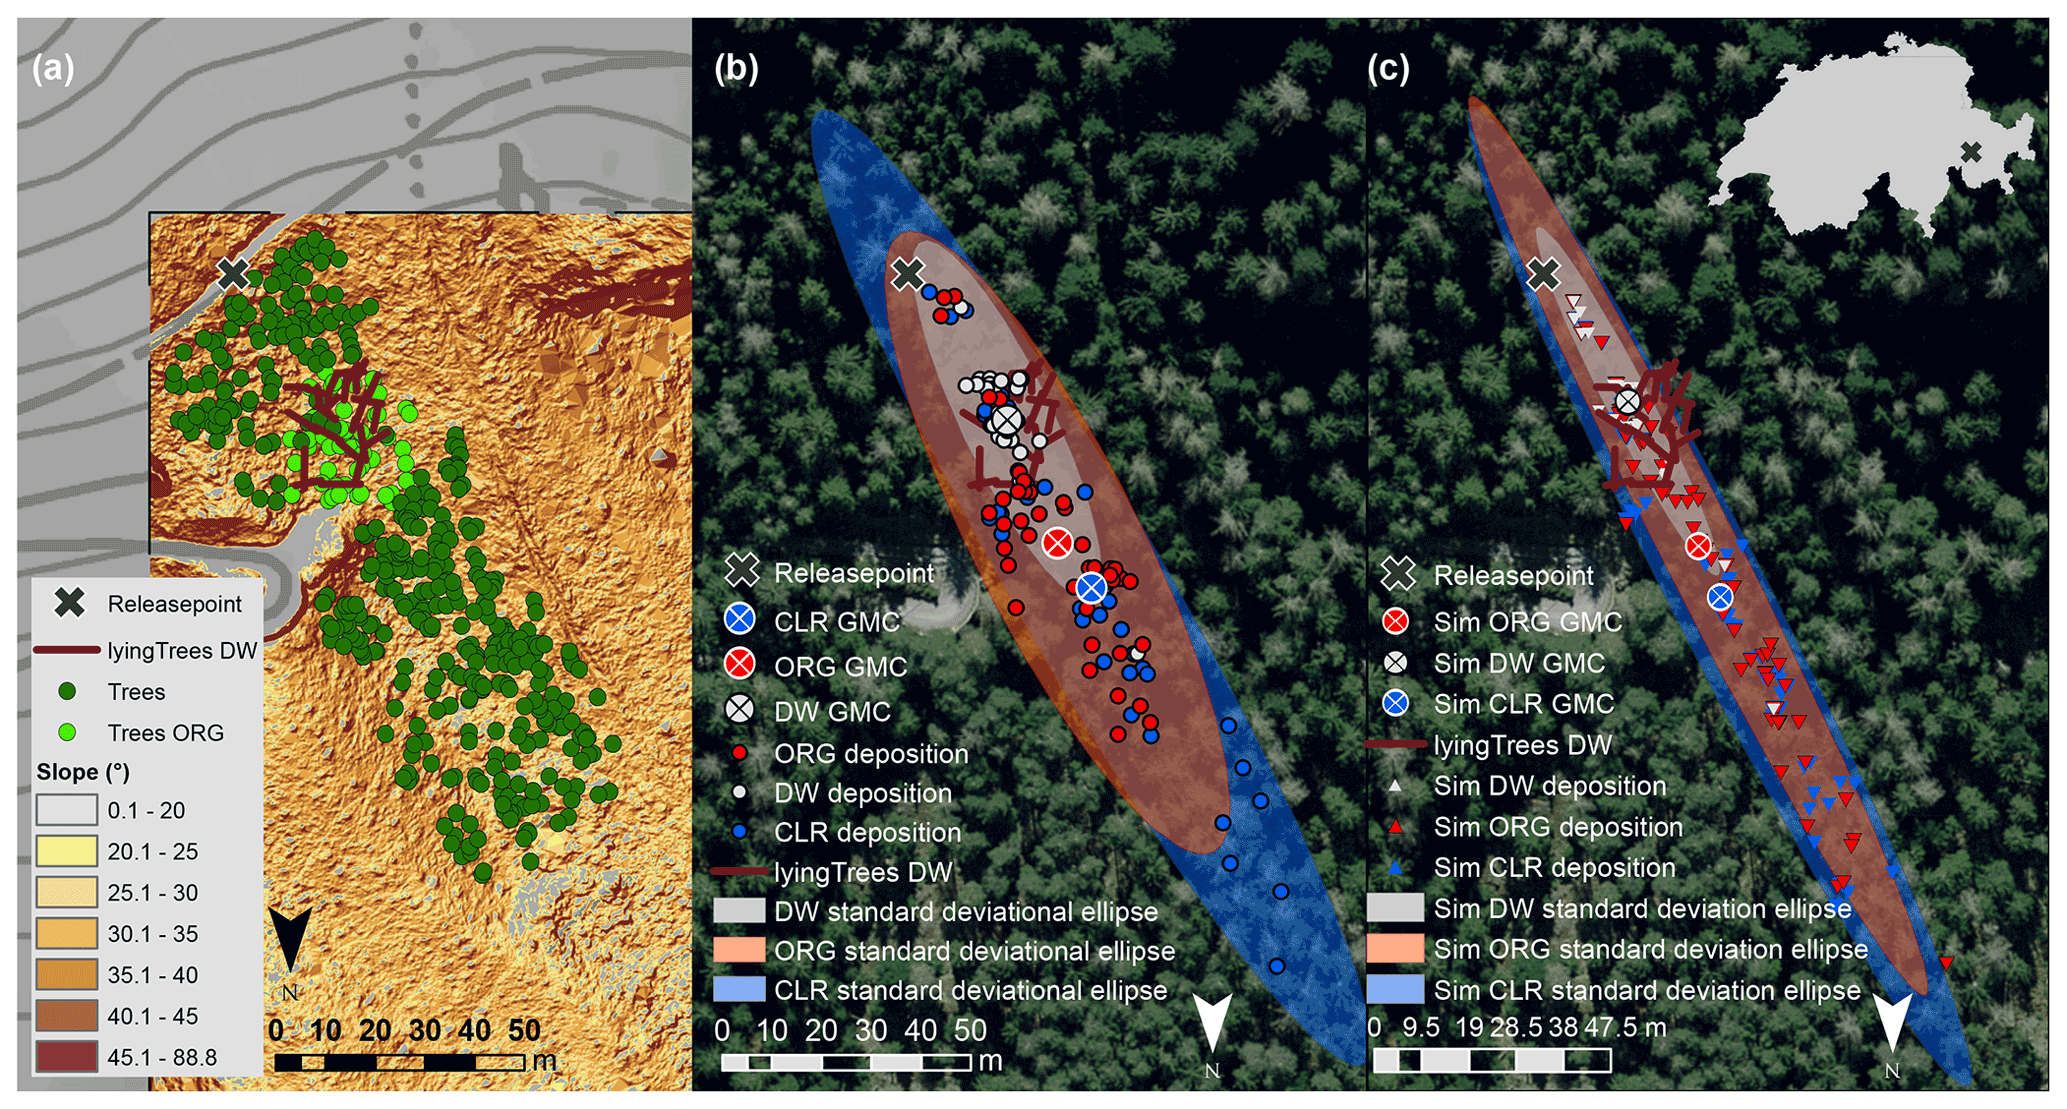
Figure 1Overview of the experimental test site Surava: (a) slope map with the standing trees during the whole trilogy (dark green circles) and during the ORG state (light green circles) and lying deadwood during DW (brown lines). (b) Deposition points of all 111 runs of the 45 kg EOTA111 rocks including all three states of the forest: ORG in red, fresh DW in gray and CLR in blue. The corresponding geographic mean centers (GMC), are shown with cross symbols in the corresponding color. Additionally, the third standard deviation ellipses (SDEs) of each data set are depicted as transparent ellipses. (c) Deposition points of the 300 total simulated trajectories under consideration of the three states of the forest. The GMC and SDE are in the corresponding colors of the experimental results. Source of topographical map (a) and orthophoto (b, c): Federal Office of Topography.
2.2 Experimental setup
Rockfall experiments were conducted during three different states of forest: in the original forest (ORG); after a logging operation but before the removal of the lying, partly piled deadwood (DW); and subsequently with this area cleared (CLR). The intention of the logging operation was the creation of a regeneration gap, a small-sized clear-cut, in the upper part of the evenly aged spruce forest. Its area covered about 700 m2 and comprised 53 trees, of which 26 trunks were left lying for the CLR experiments (Fig. 1a). We used perfectly symmetrical reinforced concrete rocks, with geometries according to the European Organisation for Technical Assessment (EOTA, ETAG 027, 2013), a mass of 45 kg and a diameter of 0.29 m (Fig. 3d). The diameter of such an EOTA rock is defined as the distance between two opposing flat surfaces. This mass still allowed manual rock handling, even if rocks were stuck between deadwood logs. In a borehole through its center of mass, in situ StoneNode v1.3 sensors were mounted to record rotational velocities (ω) in all three axes of up to 69.8 rad s−1 (4000∘ s−1) and accelerations of up to 3922.66 m s−2 (400 g) with a sampling rate of 1 kHz (Niklaus et al., 2017; Caviezel et al., 2018).
The rocks were repeatedly released manually from the same starting position at 1118.5 m a.s.l.: there were 42 runs in the ORG, 28 runs in the DW and 41 runs in the CLR state of the forest, of which at least 73 % per state include the in situ sensor streams. The deposition points of the rocks were measured with a high-precision Trimble GeoXH differential handheld GNSS reduced to a mean horizontal accuracy of 1.6 m on this steep, northwest-facing, forested slope. The rocks were winched back from their deposition point to the forest road and from there transported by a four-wheel motorcycle back to the release point.
To compare the deposition pattern between the three states of the forest quantitatively, the geographic mean center (GMC), the third standard deviation ellipse (SDE), and its radius of the long (SDEla) and short axis (SDEsa) were calculated based on the Python code provided by Schelp (2018). The mean run-out distance (MROD) is the Euclidean, slope-parallel distance between the release point and GMC.
2.3 Sensor data processing
In order to detect frontal impacts (FIs) on opposing objects such as standing trees, overturned root plates or larger rocks, we applied gyroscopic data analysis rather than evaluating the acceleration data since the latter varies strongly depending on the incoming translation velocity and especially the material being hit. Regardless of the material, after an FI, a sharp reduction in the resulting rotational velocity will occur. We generated smoothed gyroscopic data streams by applying five different moving-window sizes (0.001, 0.021, 0.061, 0.101 and 0.151 s; Fig. 3e) to reliably detect such abrupt changes in the resultant gyroscopic data stream. On each of these streams, we executed the MATLAB function ischange (Killick et al., 2012) with its linear method. The corresponding, empirically determined segment slope thresholds (, , , and ) define the minimal decrease in rotational velocity within each moving window to flag an FI (Fig. 3f). A minimum of three thresholds must be reached to flag an FI.
2.4 Rockfall simulations
The experimental rockfall trilogy was emulated with a rigid-body rockfall code that includes compactible soils (Lu et al., 2019) and standing single trees (Lu et al., 2020). The tree height used in RAMMS::ROCKFALL was estimated based on (e.g., Dorren, 2017). To represent the conditions of the DW state of the forest, we introduce three-dimensional, rigid, truncated cones. During fieldwork, all 26 trunk GNSS positions were recorded. Still missing were the exact diameters and the height above the ground of every log end, required as input parameters for the generation of the individual deadwood cone in RAMMS::ROCKFALL. As a realistic but simplified approach, we assumed a uniform maximal diameter of 40 cm for all deadwood logs. If logs were lying on top of each other, we considered the chronologically first recorded log in the GNSS file the lower log with ground contact, with the latter ones piling up on top of it.
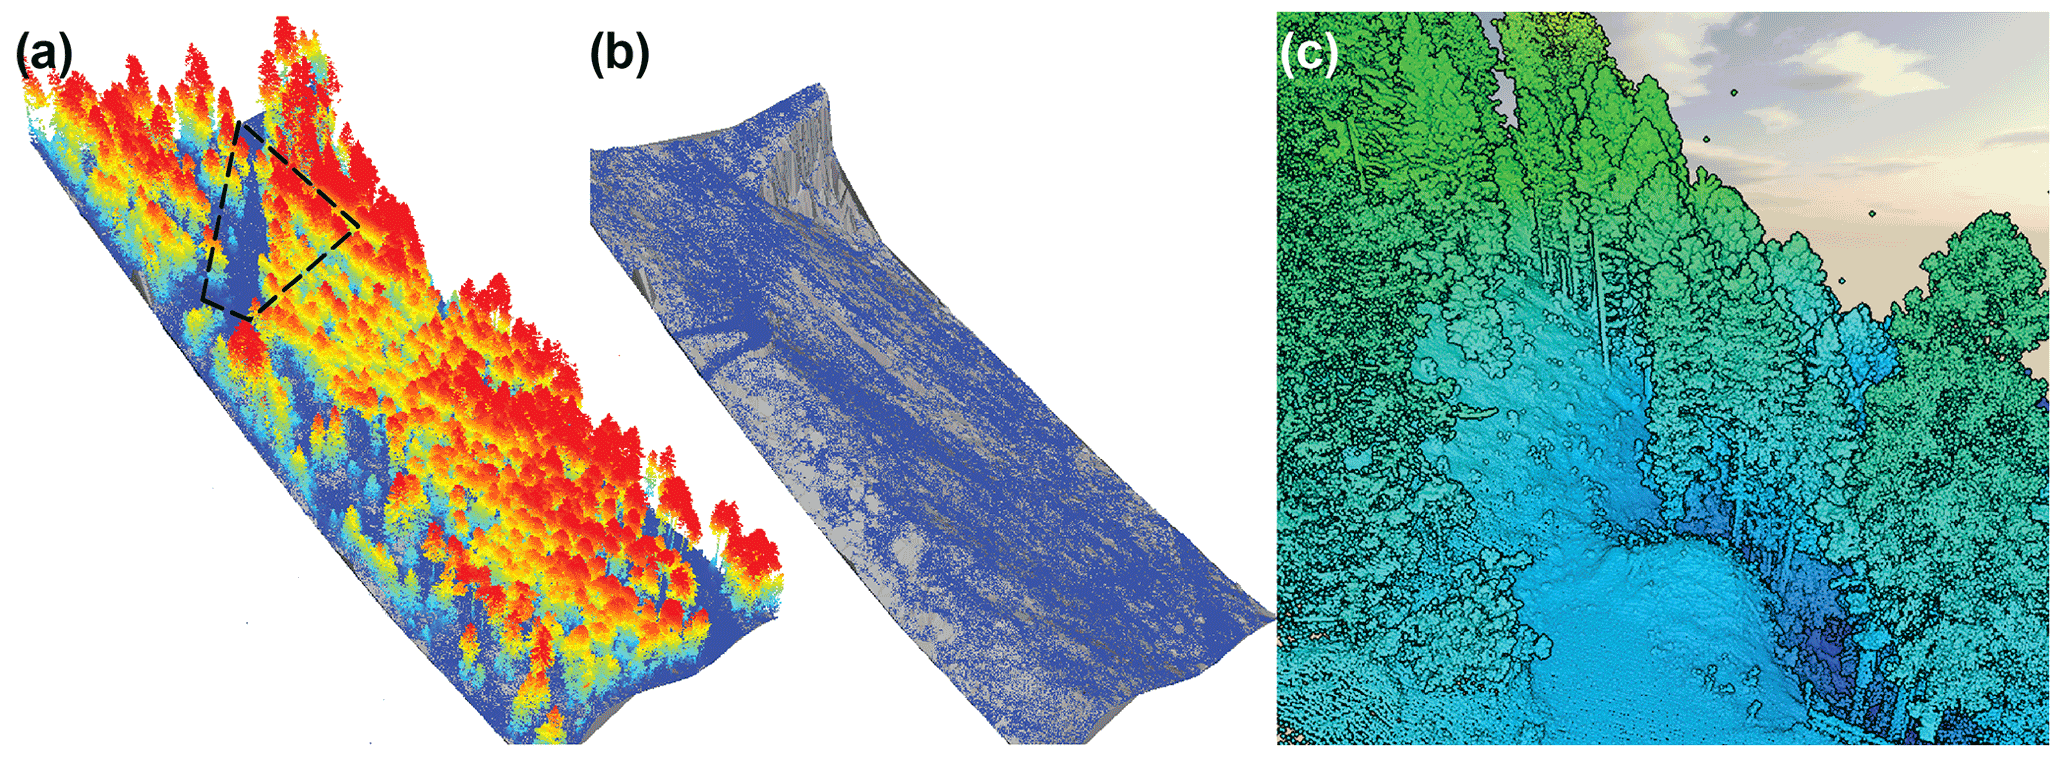
Figure 2(a) The acquired lidar point cloud colored according to the height above ground (blue is 0 m, red ≥ 23 m). (b) LAStools post-processed ground points used to generate a high-resolution digital surface model for the rockfall simulations. (c) Zoomed-in section of the cleared area as indicated in (a). The mesoscale surface roughness is clearly discernible in the ground points in the cleared area as well as below the remaining tree canopy.
Current surface models from the Swiss Federal Office of Topography swisstopo are available with resolutions as fine as 0.5 m grid size. The need to account for mesoscale roughness effects as well as customized ground point detection algorithms nonetheless demanded a site-specific airborne lidar mission. The lidar point cloud has a density of ≥500 points m−2 and was scanned by a Trimble AC60 sensor, after the CLR experiments (Fig. 2). The generated digital surface models with a resolution of 0.05 m, processed in the LAStools framework with the -extra_fine option, which is specialized in detecting ground points in steep mountainous regions (Isenburg, 2021), were used for the simulation of all states of the forest.
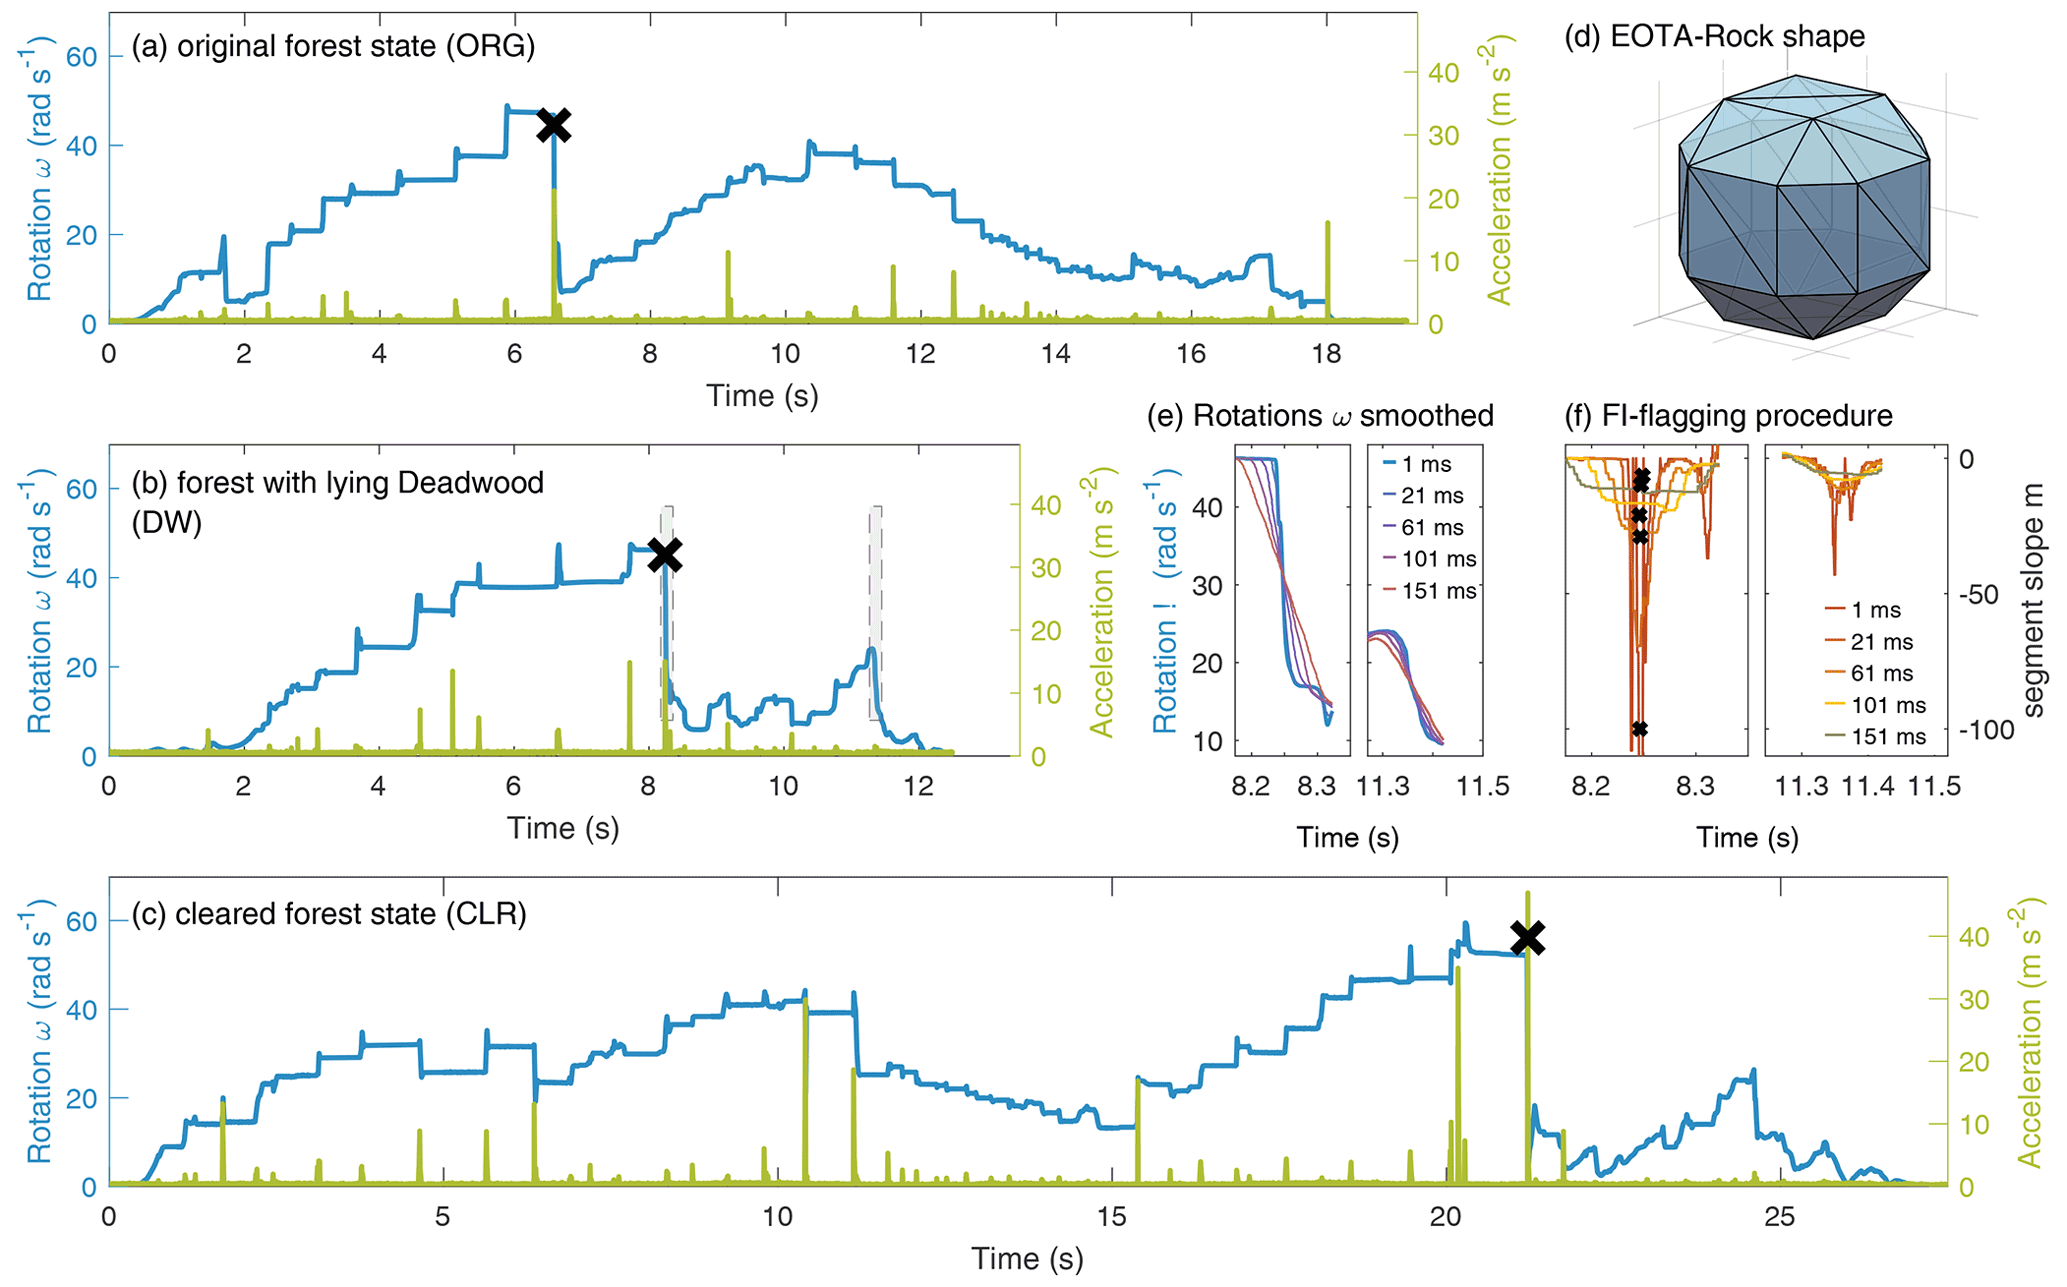
Figure 3Example of three typical StoneNode data streams (a)–(c) measured within the 45 kg EOTA111 rocks (d): in blue the resulting rotational velocities and in green the resulting impact accelerations of (a) an ORG run, (b) a DW run and (c) a run within the CLR stand. The confirmed frontal impacts (FIs) therein are marked as large black crosses; their flagging procedure exemplified in (e) and (f) for two hits are outlined in gray in (b). (e) Smoothed rotations ω with different moving-window sizes and (f) segment slopes m of linear segments in smoothed ω. If falling below the moving-window specific threshold, the impact is flagged as a possible FI (small black crosses) and as a confirmed FI if at least three flags are produced for the same impact.
The soil mechanical strength ME and the scar drag coefficient Cd are the soil parameters to calibrate (Lu et al., 2019; Caviezel et al., 2019b). We performed simulations sweeps within the relatively wide range of kN m−2 and 1.7 where the parameters of soft soils should be located. Runs with 300 orientations were performed to narrow down the parameter ranges for the in-depth calibration. Subsequently a model run with 3000 initial rock orientations per forest state and ME and Cd pairs within the ranges of kN m−2 and and with a step size of 0.1 was performed. The calibration is based on the comparison of simulated versus experimental deposition patterns, more precisely their standard deviational (or directional distribution) ellipse. The fit per state was calculated and summed in the overall fit (OF3000) over all states:
where the scenario S is ORG, DW or CLR. The sum of all the scenario fits amounts to the overall fit
This metric allows us to quantify the differences between experimental scenarios as well as the congruence between experiment and simulation. To reduce scaling effects due to the massively higher number of simulations (3000) relative to the experiments, additionally packages of 100 trajectories were randomly drawn and compared to the results of the experiments, consequently labeled OF100.
3.1 Rockfall experiments
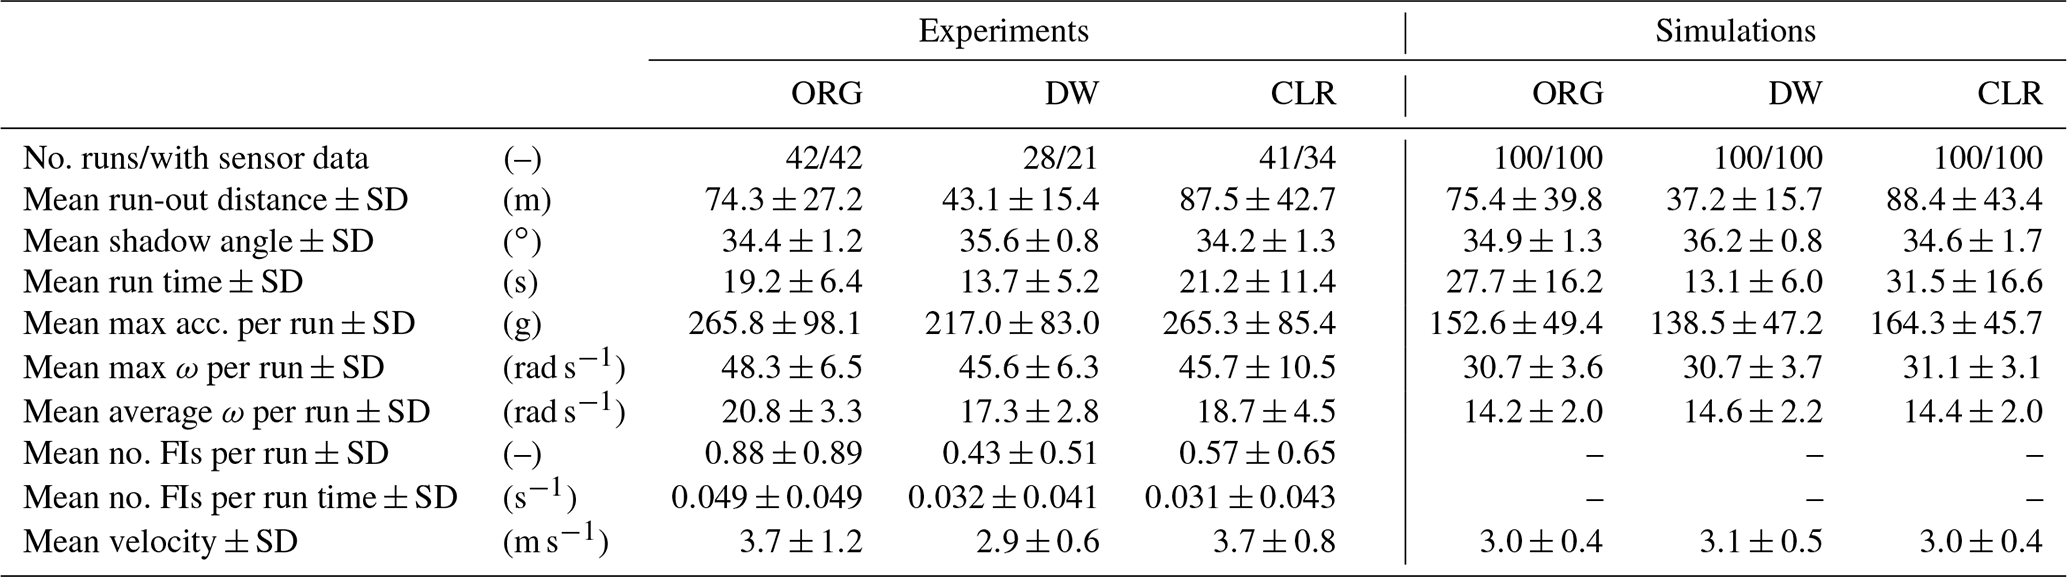
None of the 111 released EOTA111 rocks were capable of breaking a tree or a deadwood log. The effect of lying deadwood had an important influence on the observed rockfall dynamics for the investigated weight class summarized in Table 1 and visualized in Fig. 1b: the mean slope-parallel run-out distance (MROD) is reduced by 42.1 % when comparing the DW to the ORG state of the forest. The effect of the removed standing trees between ORG and CLR is visible in the prolongation of the MROD by 17.7 %. The DWMROD reduction is accompanied by an increase in the mean shadow angle DWα by 1.3 and 1.4∘ compared to ORGα and CLRα. The use of standard deviation analysis implies a compliant data set. The presented data confirm this assumption, except for the longitudinal deposition pattern for the DW state, based on the normal-distribution test (scipy.stats.normaltest, α=0.05) for the x- and y-deposition coordinates, after a principal component rotation (sklearn.decomposition.PCA).
Table 1Resulting statistics of the experiments (left) and simulations (right) for the original state of the forest ORG; the state with lying, fresh deadwood (DW); and the deadwood-cleared area (CLR).
The similar grouping among the forest configurations is also visible for the in situ-measured data: the two-sample t test produced significant (α=0.05) differences between the mean run time, the maximal accelerations of the DW state, and the corresponding variables of the ORG and CLR states. Within ORG and CLR, the differences are not significant within the chosen level.
The number of detected FIs on opposing objects was between 0.90 (ORG) and 0.43 (DW) per run. Based on the slope-parallel distance between the starting and deposition point and the run time from the sensor stream, the mean velocity for each run is calculated. The longer MROD also influences the mean run time, albeit not linearly: rocks in the DW state were moving on average for 14 s, which results in a mean velocity of 2.9 m s−1. The states ORG and CLR feature run times of 19 and 23 s, respectively. In conjunction with their longer run-out distances, ORG and CLR surpass the DW state by a 28 % higher velocity.
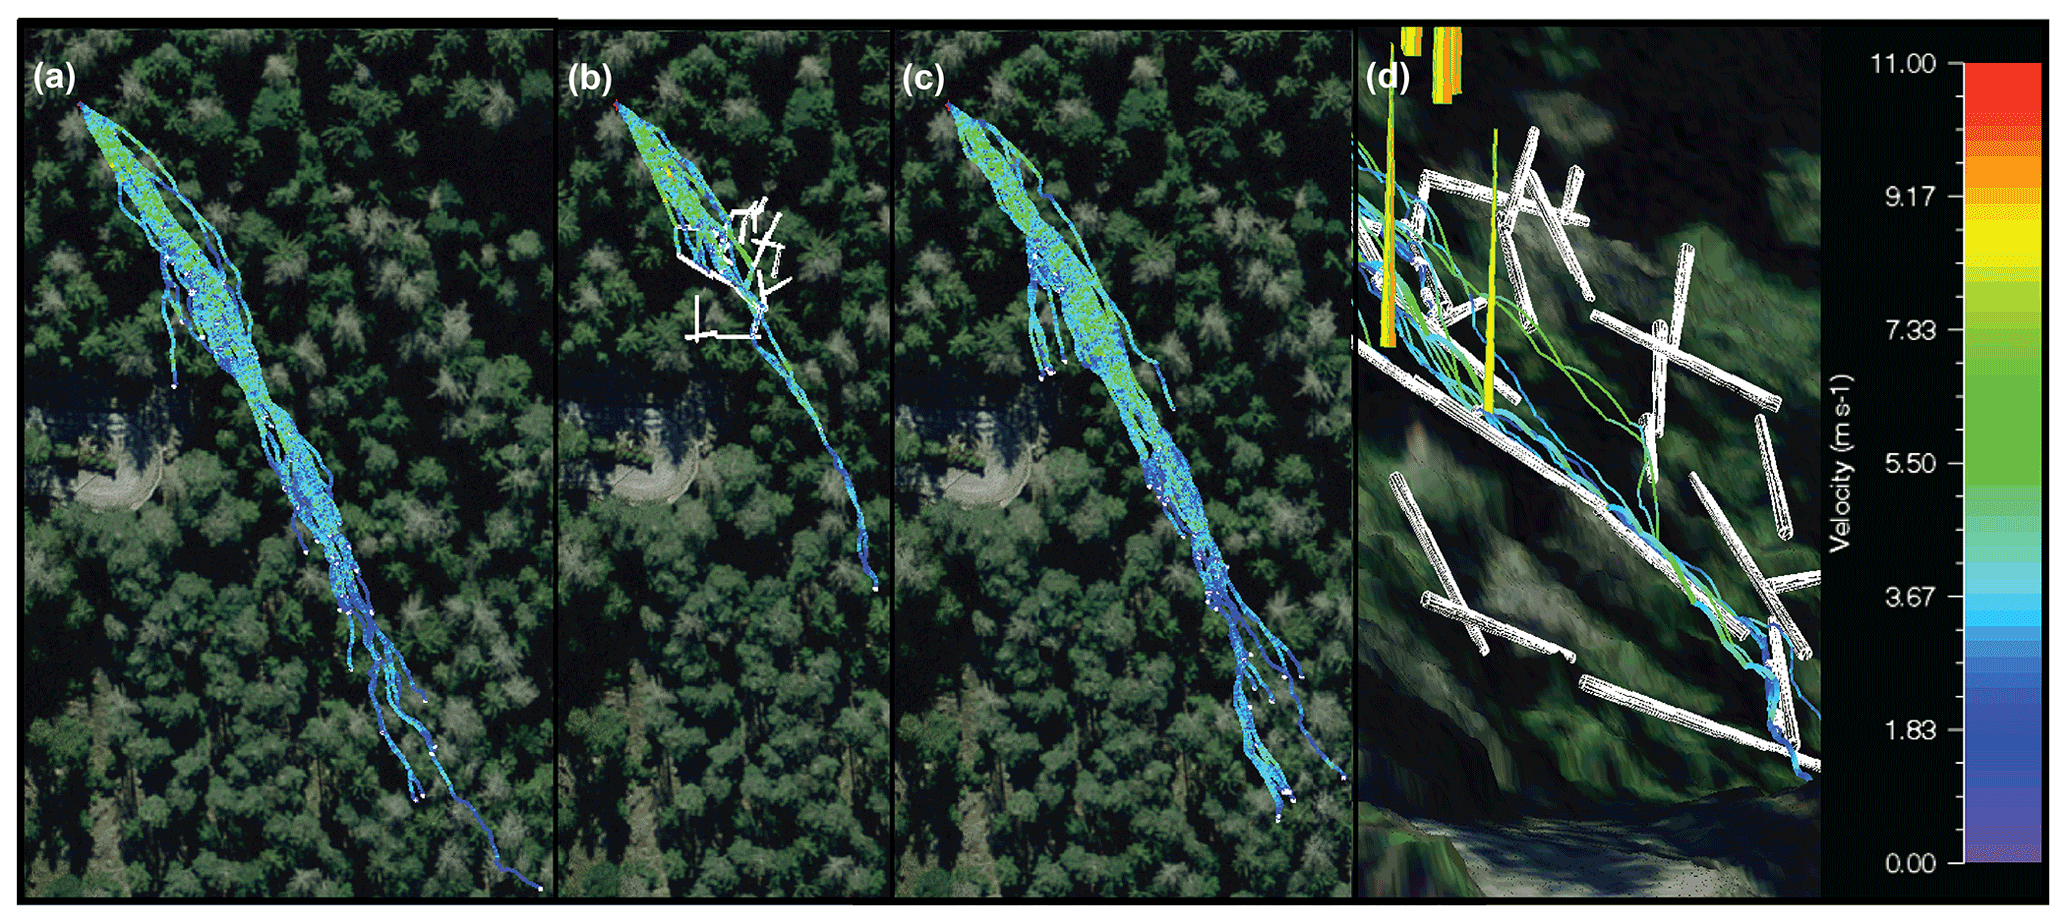
Figure 4Velocity comparison of the 100 simulated rockfall trajectories in the (a) ORG, (b) DW and (c) CLR states of the forest. (d) Detailed three-dimensional view from above the forest road of the trajectories in (b) within the deadwood section: lying deadwood in white and standing trees in yellow. Source of orthophotos (a–d): Federal Office of Topography.
3.2 Rockfall simulations
The parameter pair ME=2.0 and Cd=2.9 yields the best overall fit (OF) over all 3000 simulations (OF3000=83.0 m) and of any randomly sampled package of 100 trajectories (OF100=58.7 m). The parameter robustness is highlighted by the 10th best fit: OF m only has a 4.3 % higher deviation. The following analysis (Table 1 and Fig. 4) focuses on the trajectory package with the best OF100. The experimentally observed MROD reduction of the deadwood was recognizable in the simulations: the DW simulations had a slightly (5.9 m, 14 %) shorter MROD than the experiments but a similar length to SDEla. While the MROD and its SDEla of the CLR state simulations were both within the experimental GNSS accuracy, the ORG simulations show a good fit in the MROD but a larger longitudinal spread of SDEla as recorded during the experiments. The overall good fit of the simulated MROD consequently leads to a good agreement of the simulated mean shadow angles. The simulated mean run time for the shorter runs of the DW state is consistent with the experiments (−4.4 %). The run times for the ORG (+45.8 %) and CLR (+37.6 %) are by contrast considerably overestimated and the velocities therefore underestimated.
Although the trend of the simulated average maximum accelerations between the states of the forest is correct, the simulations globally underestimate the experimental values by roughly 40 %. The simulated maximal rotational velocities per run are between 31.9 %–36.4 % lower than the results of the experiments. A less pronounced underestimation, 15.6 % for DW and 30 % for ORG, was detected for the mean rotational velocities. Within the simulated rotational data stream, no FIs could have been detected with the same thresholds.
The important effect of lying deadwood on the rockfall dynamics of 45 kg rocks is demonstrated by the presented experimental results. Although a certain rockfall protection effect by deadwood has been known in practice, it has never been investigated with such a systematic, full-scale experiment. Out of 28 released rocks, 1 (3.6 %) surpassed the piled deadwood section in the upper third of the experimental DW slope. Compared to ORG and CLR where 81.0 % and 78.1 % of the rocks passed the deadwood area, the deadwood stopping capacity due to the deadwood barrier effect within this shape class is substantial. Even if the GNSS uncertainty is taken into account, 71.4 % and 73.2 % of the released rocks within the ORG and CLR setups still reached the forest below the deadwood section. This is the main difference from the findings of Bourrier et al. (2012), where the vast majority of the released rocks impacted the four felled deadwood trunks (85.7 %), but only 8.5 % of the rocks stopped immediately. The differences in experimental design and results underline the assumption that realistic deadwood configurations have a better protective function than deadwood with direct ground contact. The ratio between a rock and deadwood log diameter might play an important role, in terms of both hindering the rolling over of the obstacle and breaking prevention, as the reported ratio in Bourrier et al. (2012) of <1 and the ratio observed here of > 1 imply. If the protective effect of deadwood is deliberately used as a silvicultural measure, we recommend arranging logs on top of each other behind tree stumps (as discussed by Olmedo, 2015; Olmedo et al., 2020) to achieve a more favorable rock-to-deadwood diameter ratio. Similarly to the mean slope of Bourrier et al. (2012), the presented study site features an acceleration zone of roughly 37∘ but regrades in the deadwood area to 33∘. This flattening might additionally explain the higher stopping capacity of the deadwood in this study.
Although run-out estimations with the shadow angle method have lost importance, since three-dimensional rockfall simulations prevail, it is shown that this parameter is increased by the deadwood. As the amount of the absolute angle increase is strongly dependent on the location of the deadwood section, which was in this study in the upper third, a general shadow angle reduction due to deadwood is not applicable.
According to the measured in situ data (Table 1), the states of the forest ORG and CLR with high maximal accelerations per run also showed higher mean velocities than DW. These measurements underlie the assumption that higher velocities increase the probability of harder impacts. Additionally, longer MROD and run times resulted in a higher probability of hitting hard ground material, especially when rocky sections are not randomly distributed across the study site and are more frequent at the lowest part of the slope. This effect was not visible within the simulations as, for the whole area, one single ground parameter set was used. This additionally explains why velocities of short trajectories (DW) are modeled more precisely than the velocities of trajectories with longer MROD (ORG and CLR). Locally higher ME and lower Cd values could solve this issue. However, since the calibrated data should serve to model rockfall in similar forests, it is not debatable whether to include details down to the single rock scale.
The detected maximal rotational velocities per run are slightly higher within this campaign as expected from the empirically derived mass–mean rotational velocity relationship from open-field experiments (Caviezel et al., 2021a). However, experimental and simulated results for rotational velocities differ substantially. While the standard deviations of the mean rotational velocities between the experiments and the simulations overlap at least for two (DW and CLR) of the three forest states, no overlap is given for the maximal rotational velocities per run. Nevertheless, these maximal rotational velocities show a distinctly higher standard deviation than the simulated and the mean values. This might corroborate the considerable influence of local disparities in soil and tree conditions, leading to a higher torque variability acting on the rocks and resulting in higher maximal rotational velocities.
The DW sensor streams feature fewer FIs per run than the other two states. As most of the rocks stopped within the deadwood section, a higher ratio of impacts was expected. Surprisingly, the mean number of frontal impacts per run lies well below 50 %. Hence, the stopping process in the deadwood section is not abrupt enough to classify it as frontal impact like the hit of a standing tree. Additional clarification can be offered if the FIs are evaluated as frontal impacts per run time (FI s−1) (Table 1): even if the ORG state still has the highest FI s−1 values, the CLR state shows slightly lower values than the DW state. The shortest mean run time implies the smallest possibility of experiencing an FI in the deadwood state. This is not outweighed by the stopping process within the deadwood, in particular because it apparently features a more complex, temporally stretched, behavior. Although without visual verification not all questions concerning the influence of rotational velocities on FI can be solved, Fig. 3b illustrates that solely acceleration data would perform worse: of the three impacts ≥10 m s−2, the first two impacts entail increasing rotational velocities, which seems unlikely for FI on an opposing object. The third impact, however, is related to a severe drop in the rotational velocity. Compared with the overall measured accelerations of the CLR state (Fig. 3c), the DW impacts (Fig. 3.b) are much softer than but comparable with the impacts of CLR in the corresponding time range and thus slope area. This consolidates the assumption that acceleration data feature dependencies regarding the soil characteristics, and hence the FI detection method used based on gyroscopic data is more reliable. The FI of the depicted sensor streams in Fig. 3 shows a reduction by more than 50 % from >40 rad (>2000∘ s−1) to <20 rad (<1000∘ s−1), while the corresponding accelerations differ with values ranging from 15.0 to 46.9 m s−2 by more than 300 %. The FI detection within the simulations was not possible based on the same thresholds due to the standard computational output time step used and recommended of 0.02, which is too low compared to the 1 kHz sampling rate of the StoneNode sensors.
The protective effect of lying deadwood can only be emulated by rockfall simulations if deadwood configurations can be added realistically into the code. Here, all three states of the forest, incorporating the exact GNSS positions as three-dimensional cones for standing and lying trees alike, could be reconstructed as input scenarios for the rockfall simulations. This strict adherence to realistic site conditions enhances the significance of the model output for hazard assessment significantly. The inclusion of the deadwood logs as three-dimensional cones resulted in simulations with a realistic deposition pattern. Apart from the depicted barrier effect of single, near-slope deadwood logs, piled trunks after windthrow events can now be incorporated into simulations. Additionally, a tunnel effect can be modeled: rocks can slip under deadwood, which is essential if the deadwood branches are still fresh and support the log above ground. In such cases, other methods, like adapting the slope in the corresponding grid cells, overestimate the deadwood effect and experience drawbacks (Fuhr et al., 2015; Costa et al., 2021).
Nevertheless, the simulations do not feature the observed experimental lateral spread. A possible explanation lies in the post-experimental timing of the lidar flight: the deadwood clearing work may have changed the local topography slightly, which was during the ORG and DW experiments that were partially responsible for the lateral spread, since the CLRFIT generally fits best for all soil parameters sets.
One possible explanation of the overestimated mean run times in the simulations (Table 1) could be caused by a critical issue with any numeric rockfall code: an accurate stopping criterion. This criterion describes the minimal total kinetic energy of the rock below which the simulation is terminated. To examine the contribution to this overestimation, we calculated the mean velocity on the last 2 m of traveling distance (ORGv-stop and CLRv-stop) as the rocks could theoretically move with a very low velocity slightly above the stopping criterion (0.5 m s−1) for several seconds and distort the mean velocity value. However, this was not observed as ORG and CLR m s−1 are distinctly higher than the stopping criterion. We conclude that the stopping process of the rocks is simulated close to reality. Consequently, we deduce that the translational velocity is slightly underestimated over longer distances. The accurate treatment of the entire deceleration phase of rocks represents a demanding challenge for any rockfall code, in particular in this low-weight-class regime. In the given experimental setup solely the run times determine the mean rock velocity and thus the translational kinetic energy, the most crucial output variable of rockfall simulation programs. Hence, four main limitations came to our attention during the study, which leads to new practically relevant follow-up research questions and hypotheses that should be included in future experimental campaigns:
-
The investigated rock mass of 45 kg represents in many stratigraphic units a common rockfall release volume with a high occurrence probability and small return period. Nevertheless, with energies ≤3 kJ only low rockfall intensities are achieved (FOEN, 2016). The verification of the rockfall stopping capacity under higher energies remains to be investigated.
-
The deposition pattern data in different forest conditions are unique, and this allowed us to examine the performance of the presented three-dimensional deadwood, both experimentally and numerically. The available, additional in situ measurement data fostered an in-depth model calibration. However, the evaluations showed that (for example) a visual check of the impact location at high acceleration measurement values is desirable. Although challenging due to the visibility restrictions because of the trees (Bourrier et al., 2012), a slope-wide reconstruction of the rock velocities would complete the set of the parameters of interest (Caviezel et al., 2019a). A broader visual coverage enables the potential development of automated tree impact detection within the in situ sensor data.
-
Only compact rock shapes (Sneed and Folk, 1958) were used in this study. The results of open-land experiments emphasize the importance of different rock shapes (Caviezel et al., 2021a). Investigations into rockfall simulations in forests incorporating different rock shapes (Lu et al., 2020) show the importance of real-scale experiments as a calibration basis as different contact behavior and MRODs are expected.
-
The fresh deadwood used here originates from trees felled on site. However, for forestry practice, it is also relevant to know how decomposed deadwood protects against rockfall and how this effect is changing over time. It is essential to understand the potential adverse long-term effects of rocks deposited temporarily behind decaying deadwood as they may act as secondary rockfall sources.
Despite these still existing limitations and open questions, our results indicate that the complete removal of lying deadwood after natural disturbances or logging operations can lead to a substantial decrease in rockfall protection. While our experiments also allow us to quantify such effects, more experiments and long-term studies are needed to fully quantify them for different settings and to optimize their implementation in rockfall simulation models and management guidelines.
This experimental rockfall trilogy with 45 kg, cubic rocks within different states of the forest highlights the high protection capacity of partly piled deadwood against low-energy rockfalls. This is of general interest, as it has been suggested that natural disturbances causing piled deadwood will increase in the future. The ratio between the rock diameter and the overall deadwood height might have a decisive impact on the rock stopping capacity, whose thorough quantification needs further research. The agreement achieved between the simulations and the experiments is particularly convincing for the mean run-out distance, while it somewhat underestimates the lateral dispersion of the deposition points. The presented three-dimensional deadwood logs within the simulations performed realistically, which affirms the demand for the inclusion of deadwood in rockfall simulations. This will allow forest managers to base their future deadwood management after natural disturbances, thinning, sanitary felling and regeneration gaps on a larger scientific basis. Based on our experimental results, we recommend, at least in the case of relatively small expected rock sizes with low deadwood log breakage probability, considering supplementing the natural protection of the ecological infrastructure with additional transverse, lying deadwood logs as a cost-effective, economical, ecological, nature-based protection measure. Thanks to the extended model outcomes presented here, the benefits of these measures can be evaluated and thus planned in a more systematic manner, which in turn could reduce the overall economic costs. Future studies should focus on higher rockfall energies, where the rock velocities are completely retrievable, the influence of the rock shape is examined in-depth and long-term effects after partial decay of deadwood in post-disturbance stands are taken into account.
The MATLAB script used to detect FIs is publicly available at https://doi.org/10.16904/envidat.248 (Caviezel et al., 2021b).
The experimental deposition points, the in situ StoneNode data as well as the input data for the rockfall simulation (DEM, tree file, release point and .rts files of the trees) are publicly available at https://doi.org/10.16904/envidat.248 (Caviezel et al., 2021b).
AR performed the data analysis, conceived the simulations and wrote the manuscript based on discussions and improvements from all authors. ES, AC and AR carried out the model calibration. AC conceived the experiment. AC, YB, KS, SD and AS carried out the experiments. KS, MK and DM conducted the forest inventory. YB and AS operated the GNSS, and GL and MC programmed the deadwood module.
At least one of the (co-)authors is a member of the editorial board of Natural Hazards and Earth System Sciences. The peer-review process was guided by an independent editor, and the authors also have no other competing interests to declare.
Publisher's note: Copernicus Publications remains neutral with regard to jurisdictional claims in published maps and institutional affiliations.
We thank the forest owners – the municipality of Albula/Alvra, Switzerland, and the AWN, Region 4, Tiefencastel – for the permission to conduct experiments on the Surava site. The research was partially funded by the National Research Program “Sustainable Economy: resource-friendly, future-oriented, innovative” (NRP 73) of the Swiss National Science Foundation (grant number 407340_172415) and is part of the WSL research program Climate Change Impacts on Alpine Mass Movements (CCAMM).
This research has been supported by the Schweizerischer Nationalfonds zur Förderung der Wissenschaftlichen Forschung within the framework of the National Research Programme “Sustainable Economy: resource-friendly, future-oriented, innovative” (NRP 73) (grant no. 407340_172399).
This paper was edited by Paolo Tarolli and reviewed by two anonymous referees.
Ammann, M.: Schutzwirkung abgestorbener Bäume gegen Naturgefahren, Eidg. Forschungsanstalt für Wald Schnee und Landschaft WSL, Birmensdorf, https://www.dora.lib4ri.ch/wsl/islandora/object/wsl:10347, (last access: 14 July 2022), 2006. a, b
Bourrier, F., Dorren, L. K. A., and Berger, F.: Full scale field tests on rockfall impacting trees felled transverse to the slope, in: Conference proceedings/12th Congress Interpraevent, edited by: Koboltschnig, G. and Huebl, J., International Research Society INTERPRAEVENT, Klagenfurt, 643–650, http://www.interpraevent.at/palm-cms/upload_files/Publikationen/Tagungsbeitraege/2012_2_643.pdf, (last access: 14 July 2022), 2012. a, b, c, d, e, f
Caviezel, A., Schaffner, M., Cavigelli, L., Niklaus, P., Buhler, Y., Bartelt, P., Magno, M., and Benini, L.: Design and Evaluation of a Low-Power Sensor Device for Induced Rockfall Experiments, IEEE T. Instrum. Meas., 67, 767–779, https://doi.org/10.1109/TIM.2017.2770799, 2018. a
Caviezel, A., Demmel, S. E., Ringenbach, A., Bühler, Y., Lu, G., Christen, M., Dinneen, C. E., Eberhard, L. A., von Rickenbach, D., and Bartelt, P.: Reconstruction of four-dimensional rockfall trajectories using remote sensing and rock-based accelerometers and gyroscopes, Earth Surf. Dynam., 7, 199–210, https://doi.org/10.5194/esurf-7-199-2019, 2019a. a
Caviezel, A., Lu, G., Demmel, S. E., Ringenbach, A., Bühler, Y., Christen, M., and Bartelt, P.: RAMMS::ROCKFALL – a modern 3-dimensional simulation tool calibrated on real world data, in: 53rd US rock mechanics/geomechanics symposium, vol. 19-223, edited by: American Rock Mechanics Association, https://www.dora.lib4ri.ch/wsl/islandora/object/wsl:22147, (last access: 14 July 2022), 2019b. a
Caviezel, A., Ringenbach, A., Demmel, S. E., Dinneen, C. E., Krebs, N., Bühler, Y., Christen, M., Meyrat, G., Stoffel, A., Hafner, E., Eberhard, L. A., von Rickenbach, D., Simmler, K., Mayer, P., Niklaus, P. S., Birchler, T., Aebi, T., Cavigelli, L., Schaffner, M., Rickli, S., Schnetzler, C., Magno, M., Benini, L., and Bartelt, P.: The relevance of rock shape over mass – implications for rockfall hazard assessments, Nat. Commun., 12, 15, https://doi.org/10.1038/s41467-021-25794-y, 2021a. a, b
Caviezel, A., Ringenbach A., Bühler, Y., Stoffel, A., Simmler, K., Kistler, M., Degonda, S., Mader, D., Christen, M., Stihl, E., and Bartelt, P.: Experimental rockfall trilogy of Surava, EnviDat [code] and [data set], https://doi.org/10.16904/envidat.248, 2021b. a, b
Costa, M., Marchi, N., Bettella, F., Bolzon, P., Berger, F., and Lingua, E.: Biological Legacies and Rockfall: The Protective Effect of a Windthrown Forest, Forests, 12, 1141, https://doi.org/10.3390/f12091141, 2021. a, b
Dorren, L. K.: Rockyfor3D: Description of the complete 3D rockfall model, https://www.ecorisq.org/docs/Rockyfor3D_v5_2_EN.pdf, (last access: 14 July 2022), 2012. a
Dorren, L. K. A.: FINT – Find individual trees: User manual, https://www.ecorisq.org/docs/FINT_manual_EN.pdf, (last access: 14 July 2022), 2017. a
Dorren, L. K. A. and Berger, F.: Stem breakage of trees and energy dissipation during rockfall impacts, Tree Physiol., 26, 63–71, https://doi.org/10.1093/treephys/26.1.63, 2005. a
Dupire, S., Bourrier, F., Monnet, J.-M., Bigot, S., Borgniet, L., Berger, F., and Curt, T.: Novel quantitative indicators to characterize the protective effect of mountain forests against rockfall, Ecol. Indic., 67, 98–107, https://doi.org/10.1016/j.ecolind.2016.02.023, 2016. a
ETAG 027: Guidline for European Technical Approval of Falling Rock Protection Kits, https://www.eota.eu/en-GB/content/etags-used-as-ead/26/ (last access: 27 February 2018), 2013. a
Feser, F., Barcikowska, M., Krueger, O., Schenk, F., Weisse, R., and Xia, L.: Storminess over the North Atlantic and northwestern Europe – A review, Q. J. Roy. Meteorol. Soc., 141, 350–382, https://doi.org/10.1002/qj.2364, 2015. a
FOEN: Protection against Mass Movement Hazards: Guideline for the integrated hazard management of landslides, rockfall and hillslope debris flows, https://www.bafu.admin.ch/dam/bafu/en/dokumente/naturgefahren/uv-umwelt-vollzug/schutz_vor_massenbewegungsgefahren.pdf.download.pdf/protection_againstmassmovementhazards.pdf (last access: 14 July 2022), 2016. a
Fuhr, M., Bourrier, F., and Cordonnier, T.: Protection against rockfall along a maturity gradient in mountain forests, Forest Ecol. Manage., 354, 224–231, https://doi.org/10.1016/j.foreco.2015.06.012, 2015. a, b
Isenburg, M.: LAStools, https://rapidlasso.com/lastools/ (last access: 14 July 2022), 2021. a
Jain, P., Tye, M. R., Paimazumder, D., and Flannigan, M.: Downscaling fire weather extremes from historical and projected climate models, Climatic Change, 163, 189–216, https://doi.org/10.1007/s10584-020-02865-5, 2020. a
Jönsson, A. M., Appelberg, G., Harding, S., and Bärring, L.: Spatio-temporal impact of climate change on the activity and voltinism of the spruce bark beetle, Ips typographus, Global Change Biol., 15, 486–499, https://doi.org/10.1111/j.1365-2486.2008.01742.x, 2009. a
Killick, R., Fearnhead, P., and Eckley, I. A.: Optimal detection of changepoints with a linear computational cost, J. Am. Stat. Accoc., 107, 1590–1598, https://doi.org/10.1080/01621459.2012.737745, 2012. a
Kulakowski, D., Seidl, R., Holeksa, J., Kuuluvainen, T., Nagel, T. A., Panayotov, M., Svoboda, M., Thorn, S., Vacchiano, G., Whitlock, C., Wohlgemuth, T., and Bebi, P.: A walk on the wild side: Disturbance dynamics and the conservation and management of European mountain forest ecosystems, Forest Ecol. Manage., 388, 120–131, https://doi.org/10.1016/j.foreco.2016.07.037, 2017. a
Lanfranconi, C., Sala, G., Frattini, P., Crosta, G. B., and Valagussa, A.: Assessing the rockfall protection efficiency of forests at the regional scale, Landslides, 17, 2703–2721, https://doi.org/10.1007/s10346-020-01458-8, 2020. a
Lu, G., Caviezel, A., Christen, M., Demmel, S. E., Ringenbach, A., Bühler, Y., Dinneen, C. E., Gerber, W., and Bartelt, P.: Modelling rockfall impact with scarring in compactable soils, Landslides, 16, 2353–2327, https://doi.org/10.1007/s10346-019-01238-z, 2019. a, b
Lu, G., Ringenbach, A., Caviezel, A., Sanchez, M., Christen, M., and Bartelt, P.: Mitigation effects of trees on rockfall hazards: does rock shape matter?, Landslides, 50, 1689, https://doi.org/10.1007/s10346-020-01418-2, 2020. a, b, c
Lundström, T., Jonsson, M. J., Volkwein, A., and Stoffel, M.: Reactions and energy absorption of trees subject to rockfall: a detailed assessment using a new experimental method, Tree Physiol., 29, 345–359, https://doi.org/10.1093/treephys/tpn030, 2009. a
Moos, C., Dorren, L. K. A., and Stoffel, M.: Quantifying the effect of forests on frequency and intensity of rockfalls, Nat. Hazards Earth Syst. Sci., 17, 291–304, https://doi.org/10.5194/nhess-17-291-2017, 2017. a
Mozny, M., Trnka, M., and Brázdil, R.: Climate change driven changes of vegetation fires in the Czech Republic, Theor. Appl. Climatol., 143, 691–699, https://doi.org/10.1007/s00704-020-03443-6, 2021. a
Niklaus, P., Birchler, T., Aebi, T., Schaffner, M., Cavigelli, L., Caviezel, A., Magno, M., and Benini, L.: StoneNode: A low-power sensor device for induced rockfall experiments, in: 2017 IEEE Sensors Applications Symposium (SAS), 1–6, https://doi.org/10.1109/SAS.2017.7894081, 2017. a
Olmedo, I.: Felled trees as rockfall protection devices: Experimental and numerical studies, Doctoral thesis, irstea, Lyon, https://doi.org/10.13140/RG.2.1.2179.8640, 2015. a
Olmedo, I., Bourrier, F., Bertrand, D., Toe, D., Berger, F., and Limam, A.: Experimental analysis of the response of fresh wood stems subjected to localized impact loading, Wood Sci. Technol., 49, 623–646, https://doi.org/10.1007/s00226-015-0713-0, 2015. a, b
Olmedo, I., Bourrier, F., Bertrand, D., Berger, F., and Limam, A.: Dynamic analysis of wooden rockfall protection structures subjected to impact loading using a discrete element model, Eur. J. Environ. Civ. Eng., 24, 1430–1449, https://doi.org/10.1080/19648189.2018.1472042, 2020. a
Rammer, W., Brauner, M., Dorren, L. K. A., Berger, F., and Lexer, M. J.: Evaluation of a 3-D rockfall module within a forest patch model, Nat. Hazards Earth Syst. Sci., 10, 699–711, https://doi.org/10.5194/nhess-10-699-2010, 2010. a
Schelp, C.: plot_confidence_ellipse.py: A function to plot the confidence ellipse of the covariance of a 2D dataset, Uses matplotlib., GitHub [code], https://gist.github.com/CarstenSchelp/b992645537660bda692f218b562d0712 (last access: 14 July 2022), 2018. a
Sneed, E. D. and Folk, R. L.: Pebbles in the lower Colorado River, Texas, study in particle morfogenesis, J. Geol., 66, 114–150, 1958. a
Sommerfeld, A., Rammer, W., Heurich, M., Hilmers, T., Müller, J., and Seidl, R.: Do bark beetle outbreaks amplify or dampen future bark beetle disturbances in Central Europe?, J. Ecol., 109, 737–749, https://doi.org/10.1111/1365-2745.13502, 2021. a
Stoffel, M., Wehrli, A., Kühne, R., Dorren, L. K. A., Perret, S., and Kienholz, H.: Assessing the protective effect of mountain forests against rockfall using a 3D simulation model, Forest Ecol. Manage., 225, 113–122, https://doi.org/10.1016/j.foreco.2005.12.030, 2006. a
Toe, D., Bourrier, F., Olmedo, I., Monnet, J.-M., and Berger, F.: Analysis of the effect of trees on block propagation using a DEM model: implications for rockfall modelling, Landslides, 14, 1603–1614, https://doi.org/10.1007/s10346-017-0799-6, 2017. a
Woltjer, M., Rammer, W., Brauner, M., Seidl, R., Mohren, G. M. J., and Lexer, M. J.: Coupling a 3D patch model and a rockfall module to assess rockfall protection in mountain forests, J. Environ. Manage., 87, 373–388, https://doi.org/10.1016/j.jenvman.2007.01.031, 2008. a
Wunder, J., Knüsel, S., Dorren, L., Schwarz, M., Bourrier, F., and Conedera, M.: Götterbaum und Paulownie: die “neuen Wilden” im Schweizer Wald?, Schweiz. Z. Forstwes., 169, 69–76, https://doi.org/10.3188/szf.2018.0069, 2018. a