the Creative Commons Attribution 4.0 License.
the Creative Commons Attribution 4.0 License.
 | 24 Jun 2022
Strategic framework for natural disaster risk mitigation using deep learning and cost-benefit analysis
Ji-Myong Kim
Sang-Guk Yum
Hyunsoung Park
Junseo Bae
Given trends in more frequent and severe natural disaster events, developing effective risk mitigation strategies is crucial to reduce negative economic impacts, due to the limited budget for rehabilitation. To address this need, this study aims to develop a strategic framework for natural disaster risk mitigation, highlighting two different strategic implementation processes (SIPs). SIP-1 is intended to improve the predictability of natural disaster-triggered financial losses using deep learning. To demonstrate SIP-1, SIP-1 explores deep neural networks (DNNs) that learn storm and flood insurance loss ratios associated with selected major indicators and then develops an optimal DNN model. SIP-2 underlines the risk mitigation strategy at the project level, by adopting a cost–benefit analysis method that quantifies the cost effectiveness of disaster prevention projects. In SIP-2, a case study of disaster risk reservoir projects in South Korea was adopted. The validated result of SIP-1 confirmed that the predictability of the developed DNN is more accurate and reliable than a traditional parametric model, while SIP-2 revealed that maintenance projects are economically more beneficial in the long term as the loss amount becomes smaller after 8 years, coupled with the investment in the projects. The proposed framework is unique as it provides a combinational approach to mitigating economic damages caused by natural disasters at both financial loss and project levels. This study is its first kind and will help practitioners quantify the loss from natural disasters, while allowing them to evaluate the cost effectiveness of risk reduction projects through a holistic approach.
- Article
(1102 KB) - Full-text XML
- BibTeX
- EndNote


Over the past decades, the frequency and severity of extreme weather events are rapidly increasing due to climate changes. These events, represented by flooding, drought, heavy rain, tropical cyclone, heat waves, or cold waves, have often caused various damages not only in the short term, but have also had various long-term effects, such as sea level rise and spread of disease. The negative impact of these event has been highlighted by the Intergovernmental Panel on Climate Change (IPCC, 2014). Nevertheless, across the world, severe weather events such as typhoons, heavy rains, and changing patterns of meteorological disasters have already caused the loss of many lives and built assets. These damages are likely to accelerate in the future (Kim et al., 2019, 2020a, b, c, 2021).
It is well known that natural disaster-triggered losses are very closely tied with many economic losses worldwide. For example, Western European countries such as France, Germany, and Switzerland were hit by three consecutive tropical cyclones (e.g. Anatol, Lothar, and Martin) in 1999, resulting in a loss of EUR 13 billion (Ulbrich et al., 1999). Typhoon Haiyan, which hit the Philippines and China in 2013, a Category 5 Super Typhoon, was the most extreme tropical cyclone recorded on land. The typhoon's life-threatening wind and rain were enough to smash properties. South Asian countries adjacent to the typhoon track suffered about USD 300 billion in damage (Kim et al., 2019). Hurricane Katrina that hit south-eastern areas in the United States in 2005 caused the most severe damage in the national historic record as a Category 5 tropical cyclone. In detail, it caused USD 180 billion direct and indirect damages to US Gulf Coast cities due to substantial rain and robust winds (Blake et al., 2011). Later, in 2017, three different strong hurricanes named Harvey, Maria, and Irma together caused a total amount of about USD 293 billion damage, based on the individual damage amounts of USD 125 billion from Harvey, USD 90 billion from Maria, and USD 77.6 billion from Irma (USNHC, 2018).
In this sense, the quality of living in the built environment has been threatened by natural disasters across the globe. To reduce these threats, many of non-governmental organizations and countries have investigated prevention or post-disaster recovery strategies, considering aspects of time, budget, and human capacity to mitigate natural disaster risks. Mitigation of risks can reduce the loss by decreasing vulnerability or by decreasing the frequency and severity of causal factors (Rose et al., 2007). For risk mitigation, the execution and allocation of financial resources should be carried out promptly and extensively, with the limited resources available. Hence, it is important to estimate strategically the cost impact of natural disaster risks and the effect of risk reduction at the same time, specifically aiming at achieving the ultimate reduction and mitigation of risks through an efficient use of the limited resources.
2.1 Decision support for natural disaster risk mitigation strategies
Given the increasing frequency and severity of natural disasters, the demand for sophisticated natural disaster loss forecasting also increases. In response to such demand, various companies and national organizations have developed models to predict natural disaster losses. The New Multi-Hazards and Multi-Risk Assessment Method for Europe (MATRIX) in Europe, the Hazards U.S.-Multi Hazard (HAZUS-MH) of the Federal Emergency Management Agency (FEMA) in the United States, RiskScape in New Zealand, and the Probabilistic Risk Assessment initiative in Central America are representative models (Kim et al., 2017). Florida, USA, has developed the Florida Public Hurricane Loss Model (FPHLM) to predict losses due to hurricanes as it is located on the main north-facing road of hurricanes (Kim et al., 2020). These models are being used in different regions to assess the loss of life and potential economic losses for buildings and infrastructure owing to natural disasters. Since these models were developed based on vulnerability and the severity and frequency of natural disasters in specific areas, they could not be applied to other areas.
Companies specializing in natural disaster risk modelling have also developed different models, including EQECAT, Applied Insurance Research (AIR), and RMS (Risk Management Solution) (Kunreuther et al., 2004; Sanders, 2002). These models are widely used by insurers and reinsurers around the world to assess the risk of economic loss from natural disasters (e.g. windstorms, earthquakes, floods, winter storms, and tornadoes). However, these models have annual fees that are expensive for small and medium-sized users. In addition, these models are only available for a limited number of major countries (Europe, USA, Japan, China, etc.). Furthermore, it is difficult to reflect a user's portfolio, capital, business preference, and so on to optimize the models (Kim et al., 2019).
To reflect characteristics and vulnerabilities of each country associated with various situations of users, it is crucial to evaluate the loss through a country-specific model. In order to develop a loss evaluation model, the development of an in-house model using a deep learning algorithm can be a solution. Recently, fourth revolution technology (e.g. unmanned transportation, big data, artificial intelligence, IoT (Internet of things), robots, etc.) has been applied to various fields and its effectiveness has been recognized (Gledson and Greenwood, 2017; IPA, 2017). To effectively and efficiently analyse the complexity of various sensor-driven Big Data, the demand for deep learning applications has increased dramatically. Given the increasing demand, many research efforts on applying deep learning techniques for risk assessment have been made recently (Al Najar et al., 2021; Khosravi et al., 2020; Kim et al., 2021; Moishin et al., 2021; Shane Crawford et al., 2020; Rasjava et al., 2020; Yi et al., 2020; Zhang et al., 2022). In particular, for improved natural disaster risk assessment and mitigation, neural networks have been widely used for deep learning in various ways (Khosravi et al., 2020; Moishin et al., 2021; Shane Crawford et al., 2020; Yi et al., 2020). Some researchers have developed deep learning models to predict flood events (Khosravi et al., 2020; Moishin et al., 2021). Khosravi et al. (2020) developed a flood susceptibility map using convolutional neural networks (CNN). More specifically, models for 769 historical flood locations in Iran were trained and tested based on amounts of soil moisture, slopes, curvatures, altitudes, rainfall, geology, land use and vegetation, and distances from roads and rivers. In addition, a hybrid deep learning algorithm integrating the merits of CNN and long short-term memory (LSTM) networks was built to manage flood risks by predicting future flood events, by training and testing daily rainfall data obtained from 11 sites in Fiji between 1990 and 2019 (Moishin et al., 2021).
Other studies focused on post-disaster detection caused by landslides or tornados, which uses remote sensed data collected from satellites for deep learning (Al Najar et al., 2021; Shane Crawford et al., 2020; Yi et al., 2020). Shane Crawford et al. (2020) adopted CNN to classify damages of 15 945 buildings affected by the 2011 Tuscaloosa tornado in Alabama. To this end, the authors used satellite-driven images of trees as a damage classification indicator to estimate wind speeds. In addition, satellite images were added into the CNN-driven deep learning process to detect earthquake-induced landslides in China (Yi et al., 2020). More recently, Al Najar et al. (2021) estimated accurately ocean depths simulating remote-sensed images using a deep learning technique, which overcomes drawbacks of traditional bathymetry measurement activities to track the physical evolution of coastal areas against any potential natural disasters or extreme storm events. Previous studies consistently reveal that deep learning techniques can overcome shortcomings of existing methods and thus to provide more accurate and reliable decision-support models for risk assessment and risk-informed mitigation strategies.
In addition to applications of deep learning for location detection or event prediction, as stated earlier, it is important to quantify negative economic impacts caused by natural disasters. Given the importance of economic damage aspects, Kim et al. (2021) applied a deep learning technique as a cost-effective and risk-informed facilities management solution. In detail, the authors generalized maintenance and repair costs of educational facilities in Canada, using deep neural networks that learn sets of maintenance and repair records, asset values, natural hazards such as tornados, lightening, hails, floods, and storms. In this sense, this study proposed a deep learning modelling framework to predict financial losses caused by natural disasters.
2.2 Investment strategies for natural disaster risk mitigation
Mitigating risk with efficient investment and operation of resources is a challenging task because risk reduction must be made in a timely manner, with the limited financial resources. To address these issues, cost–benefit analysis has been widely adopted (Rose et al., 2007). For instance, efficient use of public resources is indicated when total estimated profits of a risk mitigation activity surpass the entire cost or are parallel to earnings of both private and public investment.
Disaster risk mitigation represents mitigating social, environmental, and economic damage caused by natural disasters. Since economic losses due to natural disasters are hard to minimize or avoid separately, there is an increasing public demand for risk reduction investment to reduce these economic losses (Bouwer et al., 2007; Shreve and Kelman, 2014). Since resources for risk mitigation investment are restricted, it is critical to estimate economic costs and benefits in order to determine the effectiveness and appropriateness of the investment. For instance, the Federal Emergency Management Agency of the United States has reported that the average cost–benefit ratio is 4 for risk mitigation investment (e.g. structural defence measures against floods and typhoons, building renovations in preparation for earthquakes, etc.) after reviewing 4000 natural disaster risk reduction programmes in the United States (Kunreuther and Michel-Kerjan, 2012; Rose et al., 2007). In addition, studies in developing countries have shown a high cost–benefit ratio in a study of 21 investment activities such as re-establishment of schools and forestry in preparation for tsunamis (Bouwer et al., 2014).
Despite high potential benefits of investment in risk reduction, it is still restricted for residents living in areas at risk of natural disasters (Bouwer et al., 2014). According to Hochrainer-Stigler et al. (2010), since natural disaster risk reduction measures are focused on short-term outcomes, only about 10 % of residents in areas vulnerable to natural disasters receive natural disaster risk reduction measures in the United States. In the case of a natural disaster risk reduction project, a large initial investment is required, which reduces the expected profit if performance indicators need to be met in a short period of time. As a result, policy makers and politicians are reluctant to make bold investments in natural disaster risk reduction. They prefer to provide economic support after disasters (Cavallo et al., 2013). This phenomenon is also reflected in the budget distribution of disaster management funds of donations and development agencies. Most (98 %) of the budget is allocated to reconstruction or relief. Only the remaining budget (2 %) is allocated to risk reduction (Mechler, 2005). As such, while the need for pre-disaster risk reduction through proactive disaster investment is widely recognized, the economic impact of natural disaster risk reduction is often not fully considered in decision-making. Moreover, although cost-benefit analysis is the main decision-making tool commonly used in investment and financial evaluations by public sectors, natural disaster risk is not sufficiently applied in the cost-benefit analysis (Hochrainer-Stigler et al., 2010). Natural disasters in public sectors' investment projects were often overlooked or not evaluated based on the cost-to-benefit comparison (Kreimer et al., 2003). In turn, this study explored natural disaster risk reduction projects and analysed the cost effectiveness of the projects adopting a cost–benefit analysis method.
Given trends for more frequent and severe natural disaster events, developing effective natural disaster risk mitigation strategies is crucial to reduce negative economic impacts on built assets, with the limited budget for rehabilitation. To address this need, this study aims to develop a strategic framework for natural disaster risk mitigation, highlighting two different strategic implementation processes (SIPs), as depicted in Fig. 1.
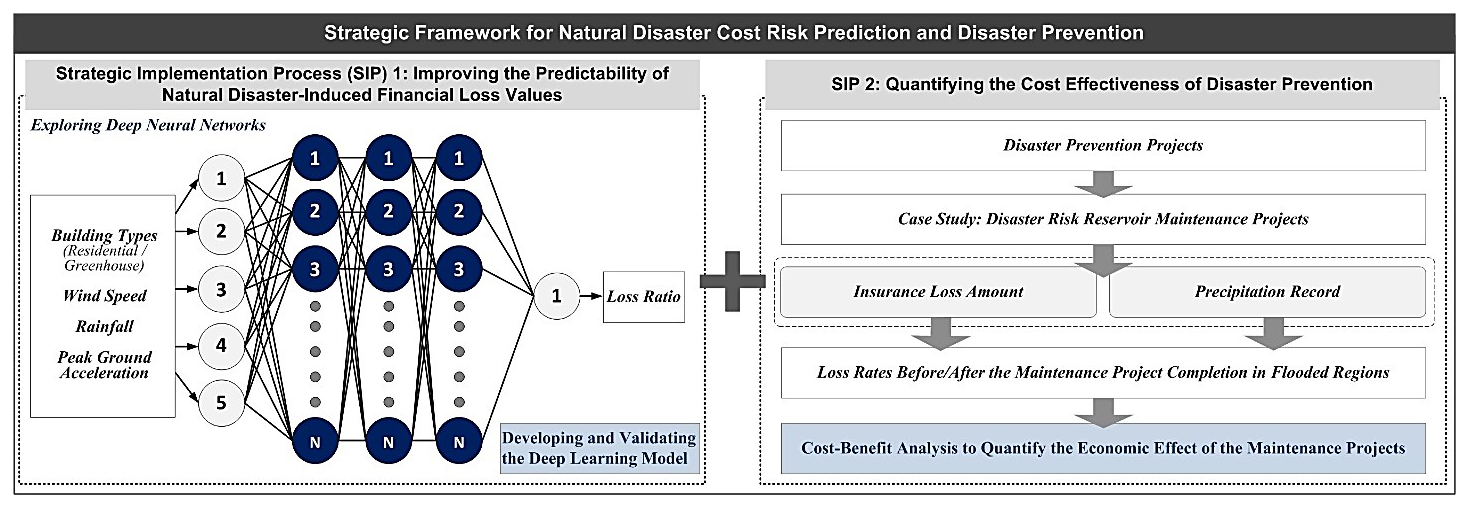
More specifically, SIP-1 is intended to improve the predictability of a natural disaster-triggered financial loss model. To this end, SIP-1 develops a deep neural network (DNN) model that learns insurance loss amounts to generalize loss ratios, associated with major indicators including rainfall, wind, and ground acceleration. To demonstrate SIP-1, this study collected reliable storm and flood damage insurance data and natural disaster risk indicators, created a predictive model using deep learning, and validated the improved predictability of the model, through the following steps:
-
To collect data on loss caused by natural disasters, this study collected data on claim payouts for storm and flood damage insurance from the Korea Insurance Development Institute (KIDI) over the past 11 years between 2009 and 2019.
-
This study obtained natural disaster risk indicators based on the collected data.
-
A model of deep learning algorithm was developed using Python 3.7, Keras, and Scikit-Learn libraries. The model was trained, tested, and validated using the collected data.
-
A multiple regression model was independently developed using IBM Statistical Package for the Social Sciences (SPSS) version 23 for model validation.
-
The root mean squared error and mean absolute error values of the deep learning algorithm model and the multiple regression analysis model were estimated and paralleled, respectively.
Compared to SIP-1, SIP-2 underlines the risk mitigation strategy at the project level, by proposing a methodological implementation process for quantifying the cost-effectiveness of natural disaster risk reduction by adopting a cost–benefit analysis method that quantifies the cost-effectiveness of disaster prevention project. To demonstrate SIP-2, a case study of disaster risk reservoir maintenance projects completed in South Korea was adopted, through the following steps:
-
Among natural disaster risk reduction projects carried out by the South Korean government, information on disaster risk reservoir maintenance projects completed in 2009–2019 was collected.
-
The loss rate of storm and flood insurance in the region where the flood damage occurred after the completion of the maintenance project was investigated through KIDI.
-
The amount of precipitation before and after the disaster risk reservoir maintenance project was investigated.
-
Cost–benefit analysis was conducted to determine the economic feasibility of the maintenance project.
SIP-1 aims to explore deep learning-driven modelling processes and develop an optimal learning model that can improve the predictability of natural disaster-triggered financial losses. To demonstrate SIP-1, the loss amounts of storm and flood insurance were learned, and the corresponding loss ratios were generalized associated with the selected risk indicators by the property type. To scientifically validate the robustness of the learning model, the prediction results were compared with a conventional parametric model underpinned by multiple regression analysis.
4.1 Data collection
A total of 458 storm and flood damage insurance claims for 11 years from 2009 to 2019 was collected from KIDI's data sets. KIDI was established in 1983. It is a professional insurance service organization that develops insurance products, calculates insurance rates, and protects the rights of policyholders. It also collects and manages various statistical data such as insurance information and losses of each insurance company (Choi and Han, 2017). Storm and flood damage insurance, which reflects the loss amount, is an insurance that compensates for property damage caused by natural disasters (e.g. typhoons, floods, heavy rains, tsunamis, strong winds, storms, heavy snow, earthquakes, and so on). It has been implemented since 2006 under the initiative of state and local governments (Kwon and Oh, 2018). The insurance payout amount is determined by objective analysis of certified loss assessment service according to standardized procedures for each insurance company. Its reliability is high (Kim et al., 2020). The collected data information includes the total loss amounts, the total net premiums, building types, and location profiles, which are publicly available. The prediction model was trained, tested, and validated using losses and natural disaster risk indicators.
The cost of loss due to natural disasters was divided by the total net premiums to calculate the ratio and then log-transformed; the distribution of the data is shown in Fig. 2. In addition, natural disaster risk indicators affecting insurance loss due to natural disasters were collected. For natural disaster risk indicators, building type, wind speed, total rainfall, and peak ground acceleration were selected as variables from past literature studies (Kim et al., 2017, 2019, 2020a, b, 2021). Figures 3, 4, 5, and 6 show the distributions of the selected indicators. A description of variables is presented in Table 1. Building types were set as dummy variables that consist of residential buildings and greenhouses. Wind speed and the maximum value of rainfalls were collected from the Korea Meteorological Administration (KMA). Peak ground accelerations were collected from the National Oceanic and Atmospheric Administration (NOAA). Accordingly, Table 2 summarizes the descriptive statistics of variables.
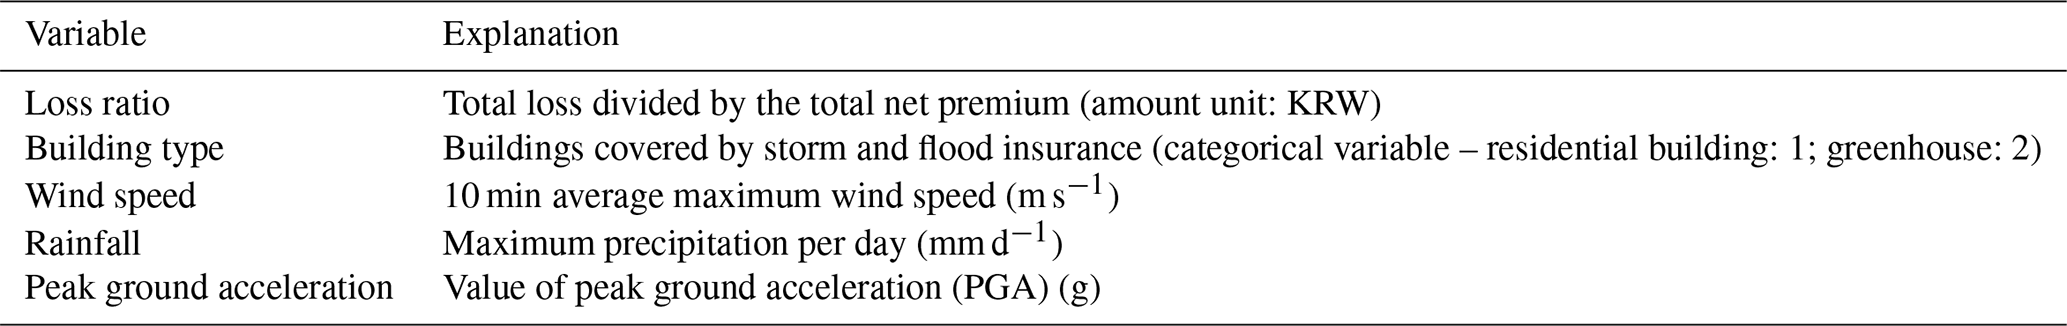
Table 2Descriptive statistics of variables by the building type (i.e. residential building and greenhouse).


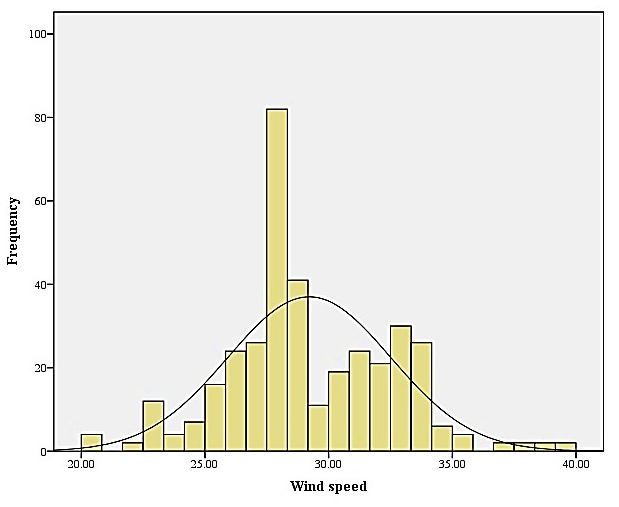
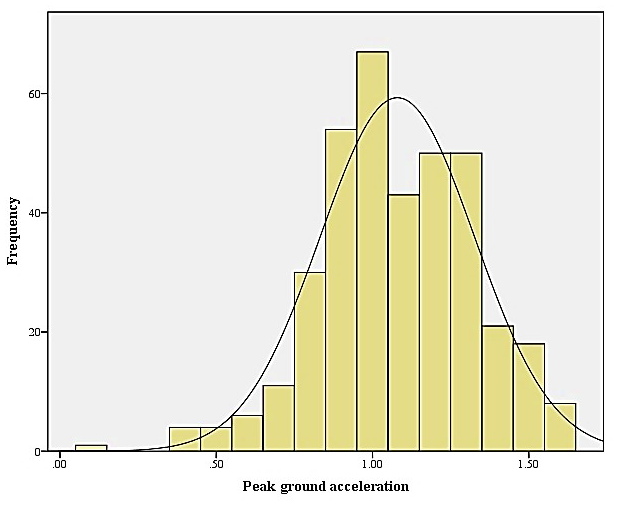
Figure 5Distributions of the indicators to learn the loss ratios of peak ground acceleration (g).
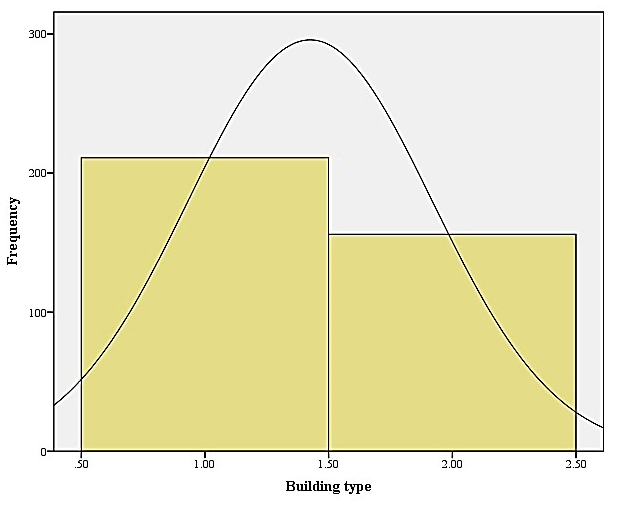
Figure 6Distributions of the indicators to learn the loss ratios of building type (1: residential (left), 2: greenhouse (right) in the table).
4.2 Modelling deep neural networks
A deep learning algorithm is a neural network with many layers and various structures in general. Its use in research and industry for prediction and recognition has spread rapidly, proving its effectiveness (Kim et al., 2021). Deep learning algorithms are also widely used for regression analysis and type classification as a machine learning technique (Ajayi et al., 2019). Deep learning models have the same training framework as other types of neural networks. However, they can train large data sets more effectively with multiple hidden layers (Bae et al., 2021). Deep learning algorithms can be divided into deep neural networks (DNNs), generative adversarial networks (GANs), recurrent neural networks (RNNs), convolutional neural networks (CNNs), and auto encoders (AEs), according to their structure and processing method (Kim et al., 2021). In particular, DNN is used for cataloguing and prediction in various engineering and academic fields (Krizhevsky et al., 2012; Toya and Skidmore, 2007). Moreover, DNNs can be applied to train and model complex nonlinear relationships due to their multi-layered structures. Thus, in this study, a DNN model was accepted considering nonlinearity of collected loss data.
The learning performance of the model was appraised by measuring the values of root mean squared error (RMSE) and mean absolute error (MAE). RMSE and MAE are representative indicators of the size of the error by comparing the predicted result of an artificial neural network with the actual value (Daniell et al., 2011). RMSE is a value that measures the average error magnitude. MAE is a value obtained by converting the difference between the actual value and the predicted value into an absolute value and averaging it. Both indicators can be used to indicate that the prediction error decreases as the error value gets smaller (e.g. closer to zero).
The collected loss data were pre-processed using a z-score normalization method to adjust the unit and quantity of the data. The pre-processed completed input data were divided into a training set, a verification set, and a test set of data. The training set of data were used for learning of the DNN algorithm. The verification set of data were used to judge whether training was optimal and the test set of data were used to verify whether the developed model was finally trained for the purpose. In this study, considering the amount of data, 70 % of the total data were set as training set of data and 30 % were used as a test set of data. Then 30 % of training data were utilized as verification data.
The DNN model selected the optimal combination through a trial-and-error method since the DNN model could update the weights of neural network nodes with a backpropagation algorithm. Since various combinations were possible depending on the input variable and the output variable, it was necessary to find the optimal combination through the trial-and-error method. For such an optimal combination, it is necessary to define the network structure scenario for setting the number of layers and nodes and defining hyper parameters, such as optimizers, activation functions, and dropouts (Cavallo et al., 2013). This study adopted a network structure scenario with three hidden layers considering data characteristics. Dropout is a regularization penalty to avoid overfitting. It was set to reduce prediction errors caused by overfitting. In this study, making an allowance for the amount of training data, dropout was set to 0 and 0.2 and simulated. The ReLu (rectified linear unit) function was utilized as the activation function, a method of adjusting the weight of each node for optimal learning. The ReLu function allows the input value to change when the input value is greater than 0 or less than 0. It was established to resolve the problem of gradient loss of the existing sigmoid function (Krizhevsky et al., 2012). The Adaptive Moment Estimation (Adam) method was accepted as the optimizer (Krizhevsky et al., 2012). An optimizer is used for speed and stability of learning. The Adam Method is a widely assumed algorithm since its development in 2015 (Kingma and Ba, 2015). The batch was defined as 5 as a data group designation for efficient learning and the number of epochs was designated as 1000 for the number of learning (Bae and Yoo, 2018; Ryu et al., 2018).
4.3 Exploring DNNs and developing the DNN model
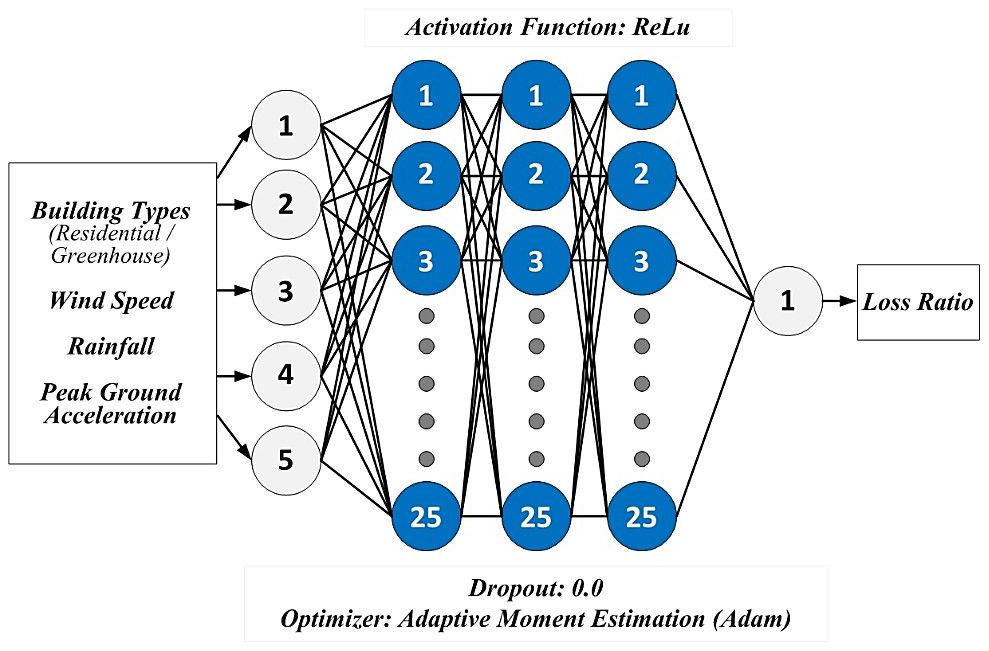
Table 3 shows MAE and RMSE values according to the network structure and dropout. Among outcomes, the model with the minimum MAE and RMSE was adopted as the final structure. As the number of hidden layer nodes increased, the MAE and RMSE values fluctuated slightly. However, the number of hidden layer nodes was minimized at 25–25–25. When the dropout was 0, MAE and RMSE values were commonly less than when the dropout was 0.2. When the number of hidden layer nodes was 25–25–25 and the dropout was 0.0, both MAE and RMSE had minimum values. Consequently, in the final structure, the number of nodes was 25–25–25 and the dropout was 0. Table 4 and Fig. 7 demonstrate the network structure and hyper parameter configuration of the optimization model.
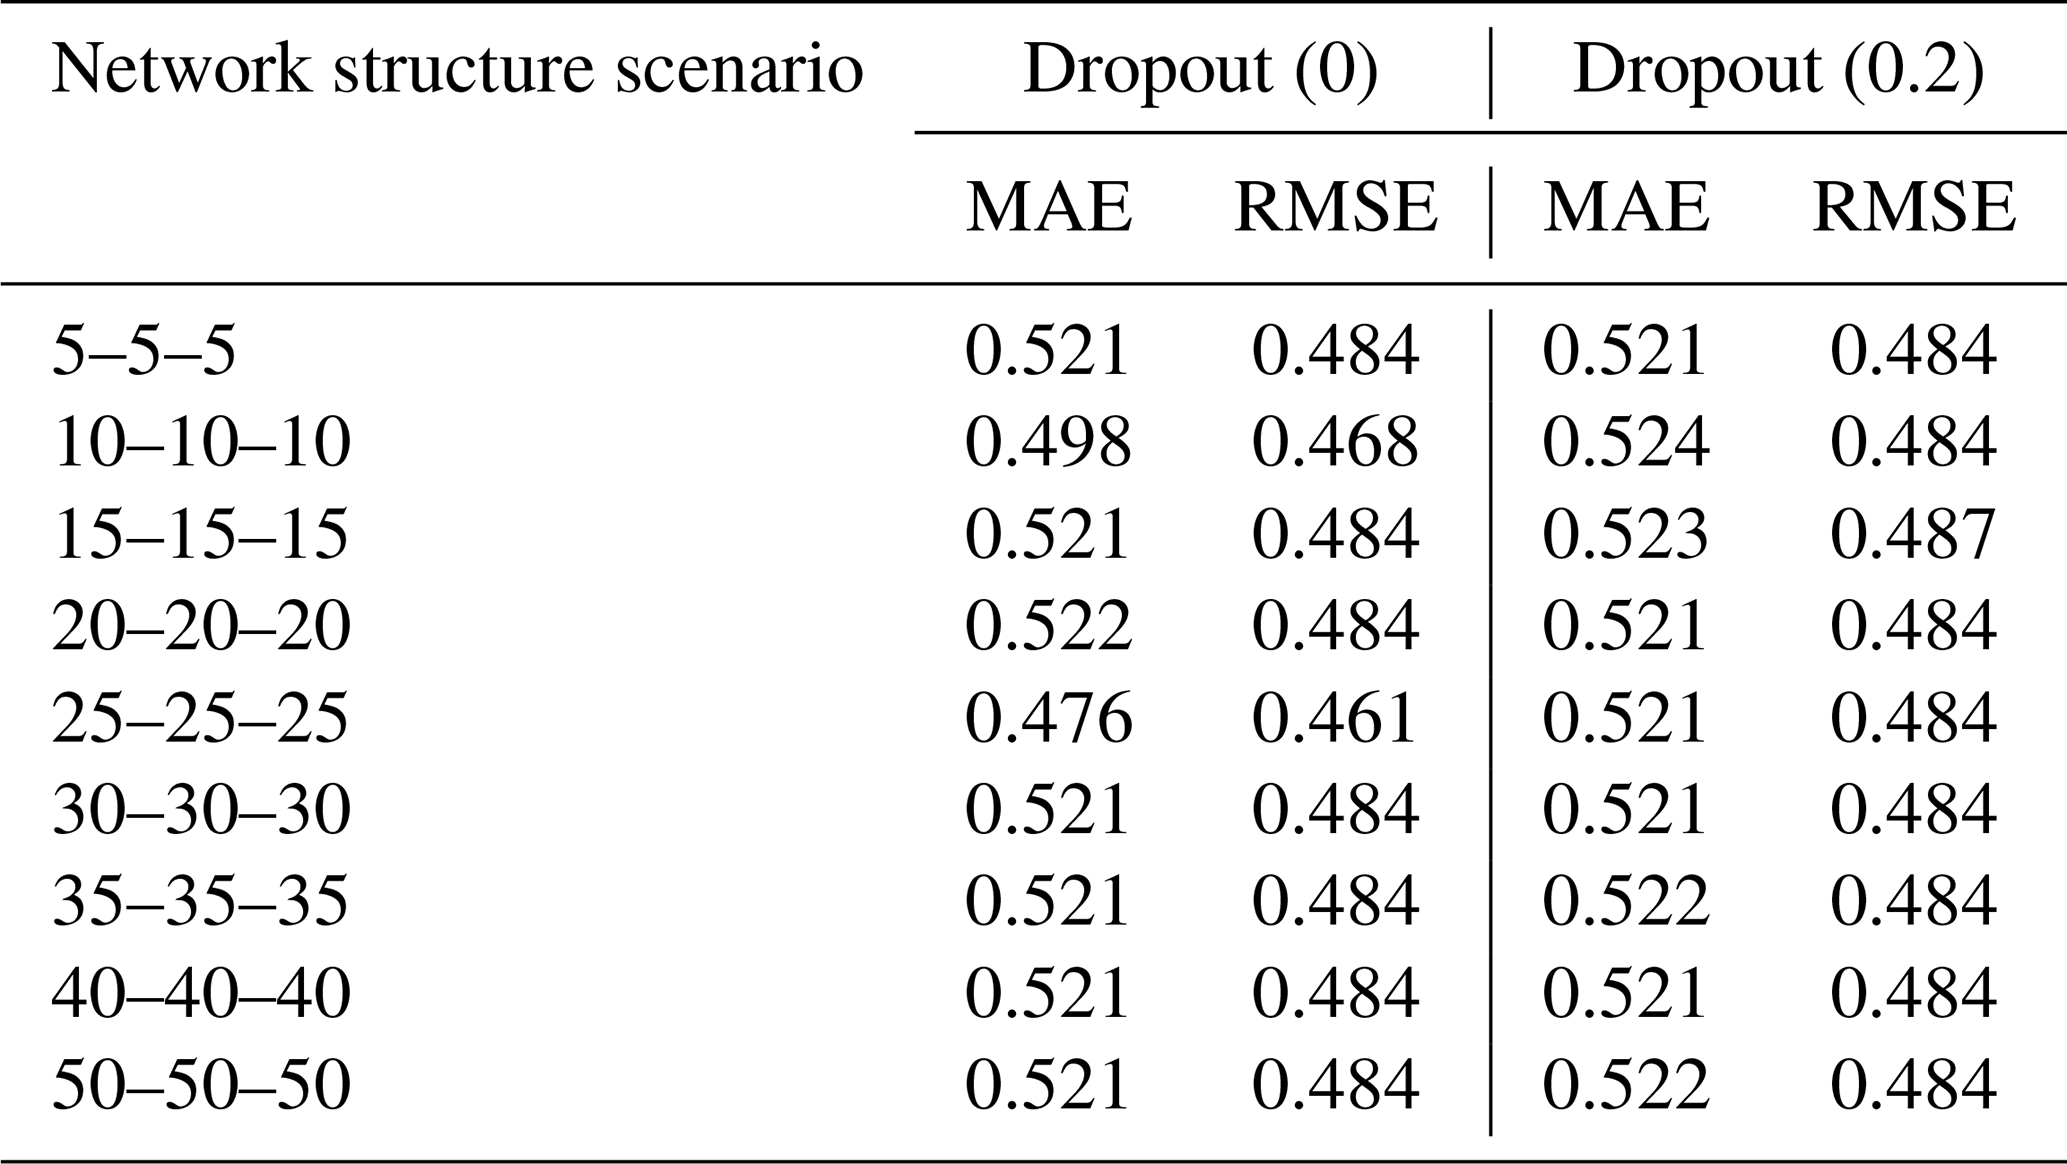
Table 4Network structure and hyper parameter formation of the final model.

4.4 The robustness validation of the final DNN model
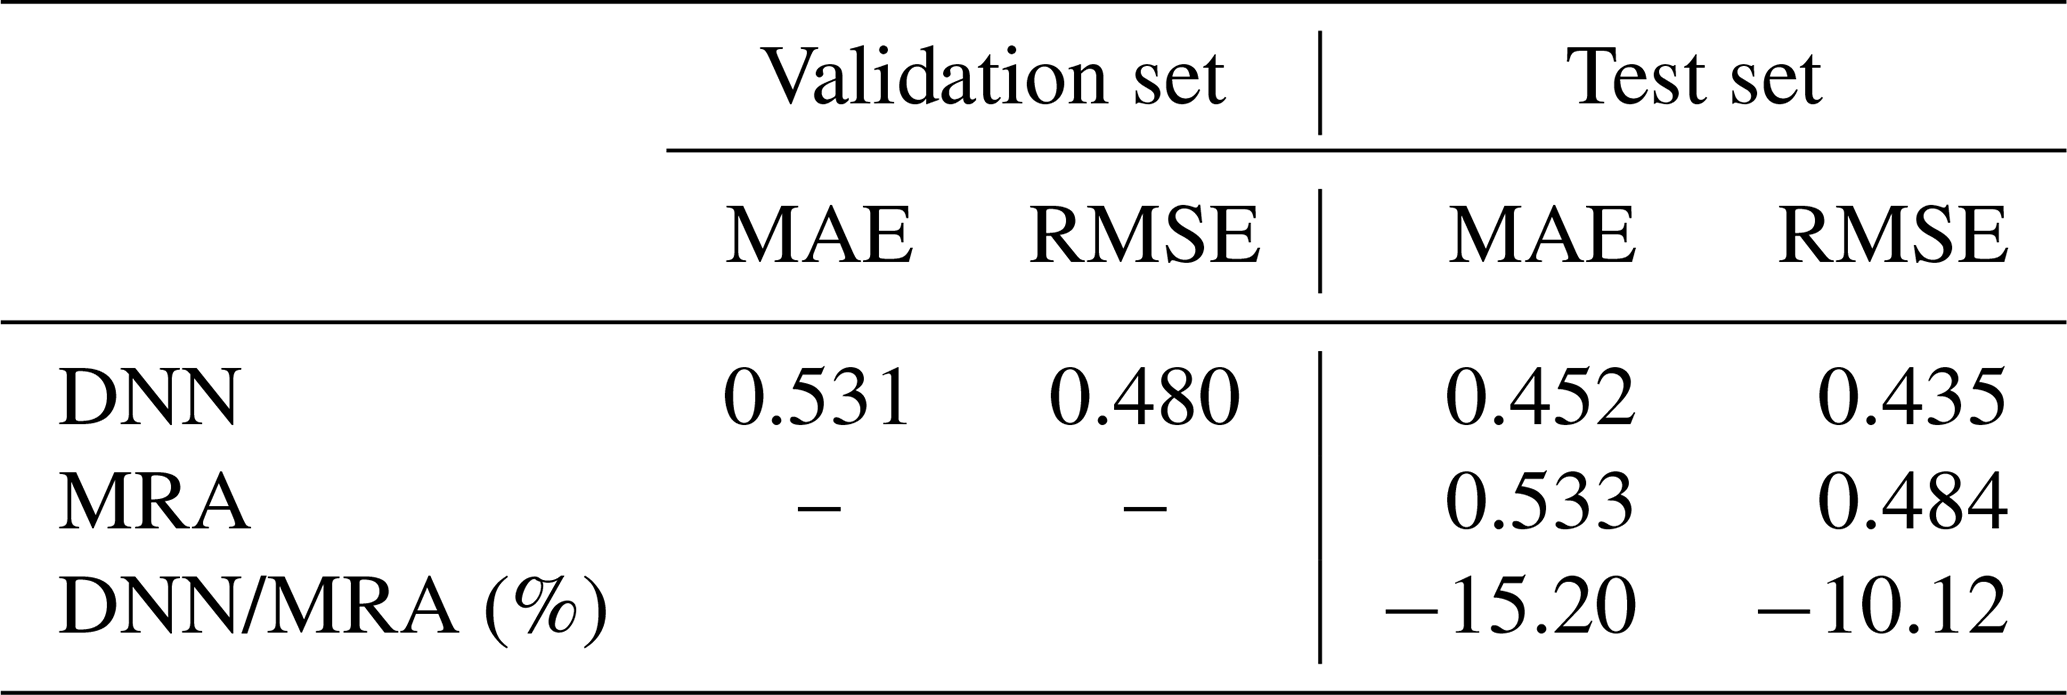
An MRA (multiple regression analysis) model was added for systematic validation of the final DNN model. MAE and RMSE values of these two models were compared. The MRA method is widely adopted as an essential method for numerical prediction models (Kim et al., 2021). Table 5 displays validation results of these models. Results of the DNN model showed MAE of 0.531 and RMSE of 0.480 with the verification set of data. For the test set of data, results showed MAE of 0.452 and RMSE of 0.435. There was no significant difference in MAE or RMSE between results with the test set of data and those with the verification set of data since the overfitting problem of the final model could be overlooked. In addition, the MRA model showed an MAE of 0.533 and a RMSE of 0.484. Equating outcomes of the DNN model and the MRA model, it was found that the DNN model had meaningfully minor prediction error rates of 15.2 % MAE and 10.12 % RMSE than the MRA model.
Management of a disaster risk reservoir is a part of the disaster prevention project. According to the Special Act on the Disaster Risk Reduction Project and Relocation Measures, the purpose of disaster prevention measures necessary for improving the disaster risk area is for fundamental prevention and permanent recovery of disasters. The disaster prevention project was started in 1998 when the Disaster Response Division of the Ministry of Government Administration and Home Affairs (South Korea) discovered disaster-prone facilities and areas with risk of human casualties and provided government funds for the maintenance of natural disaster risk areas for systematic management and prompt resolution of disaster risk factors (Lee, 2017). Disaster prevention projects include natural disaster risk improvement districts, disaster risk reservoirs, steep slope collapse risk areas, small rivers, and rainwater storage facilities (Kim et al., 2019). Given the significance of disaster prevention projects, SIP-2 examines economic effects through cost–benefit analysis of natural disaster risk reduction projects to reduce losses from natural disasters. To demonstrate SIP-2, a cost–benefit analysis was conducted for the natural disaster reduction project by comparing losses from storm and flood insurance before and after the disaster risk reservoir maintenance project.
5.1 Data collection and investigation of historical record
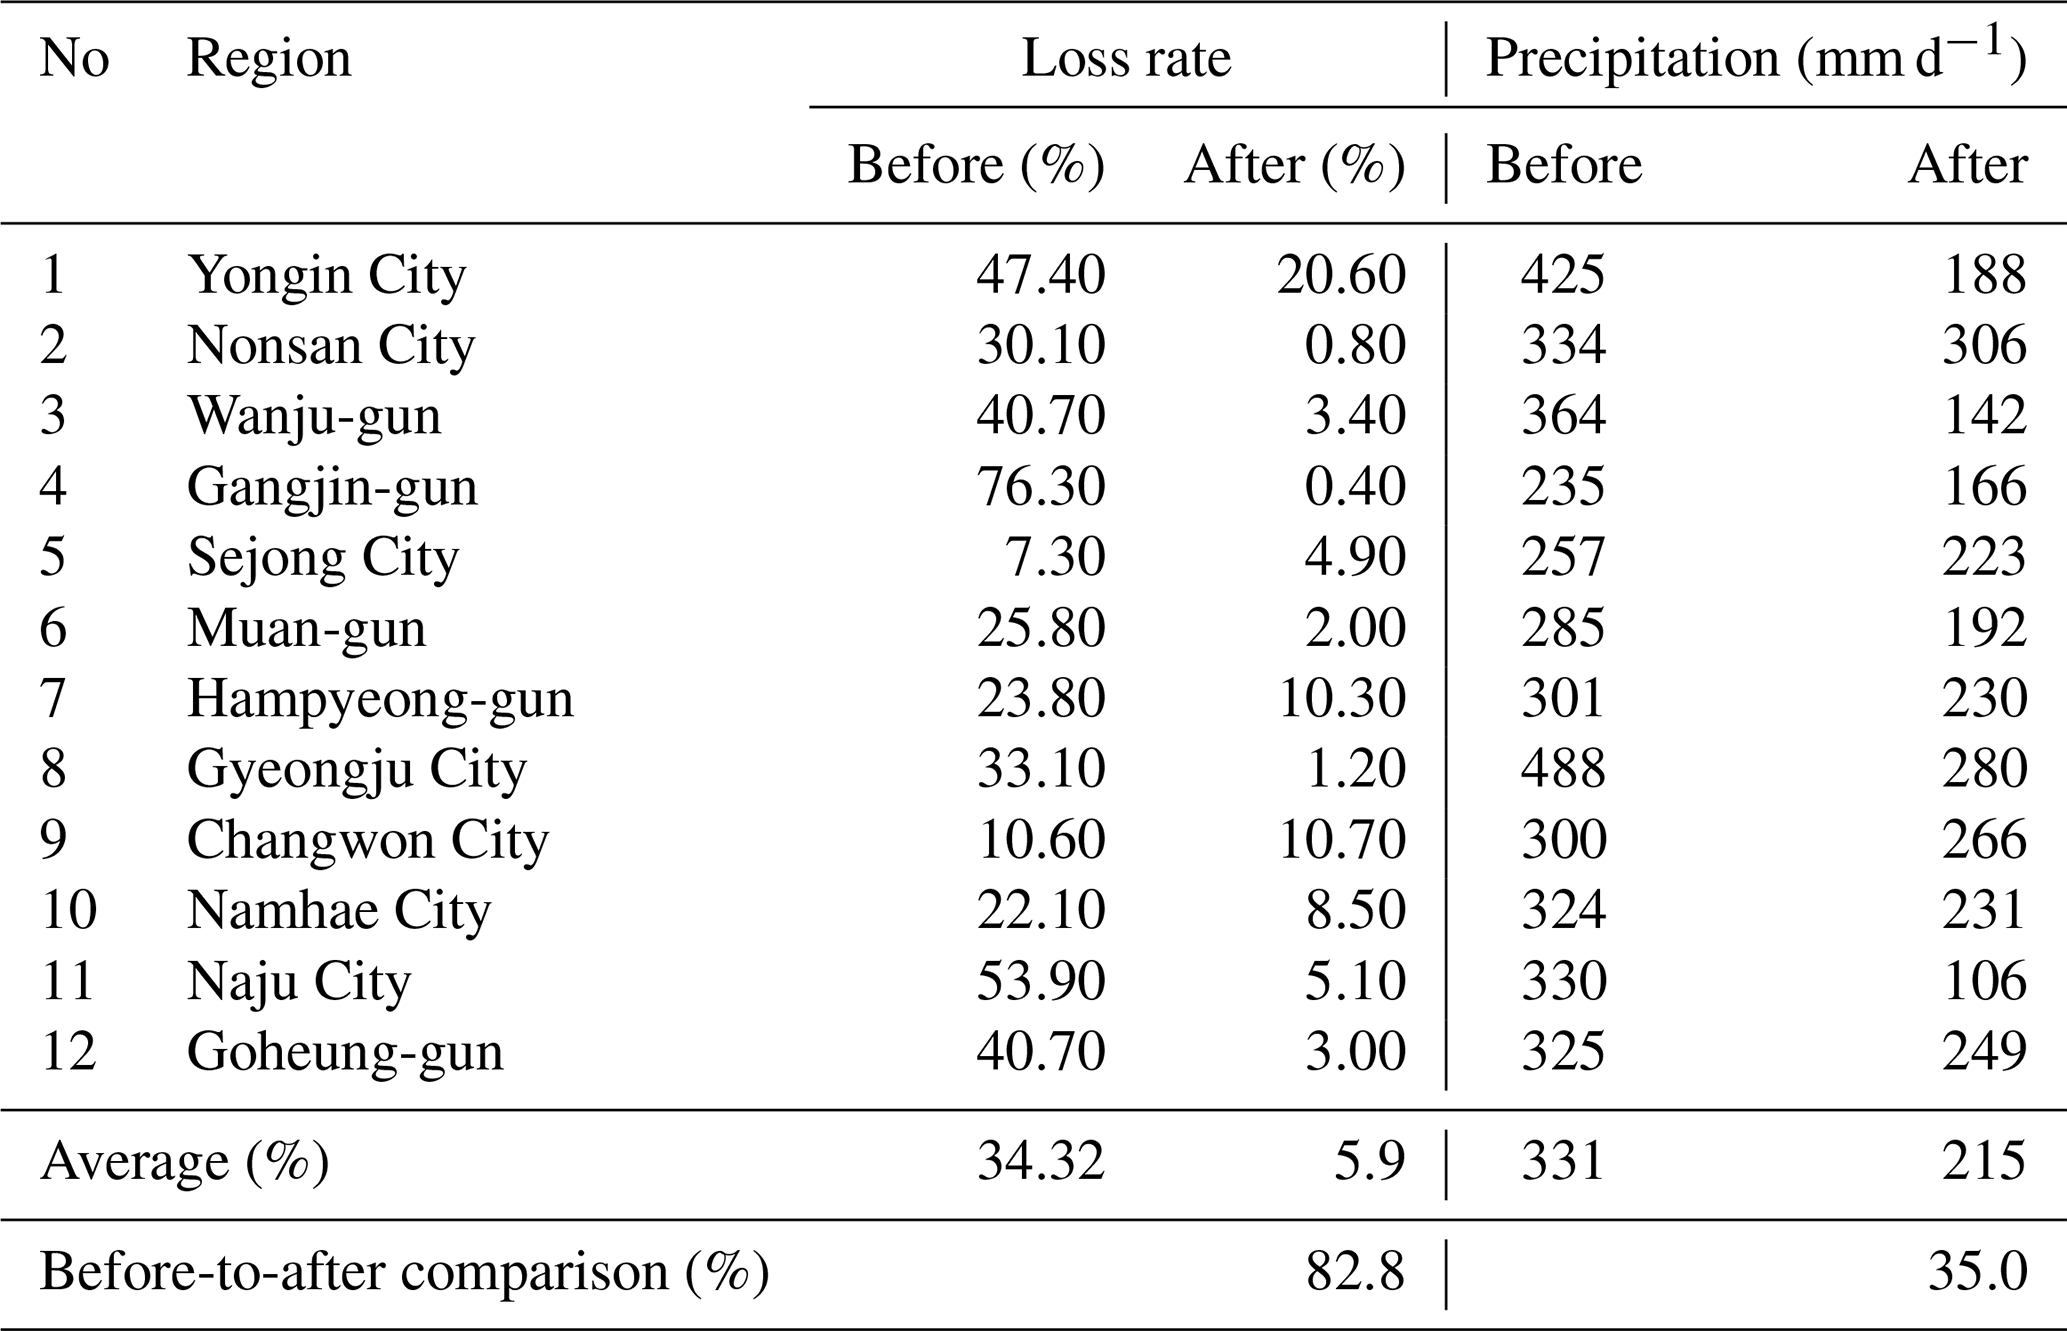
Among natural disaster risk reduction projects carried out by the South Korean government, the data set of disaster risk reservoir maintenance projects completed in 2009–2019 was extracted from the Public Data Portal (data.go.kr) managed by the South Korean government to collect and provide public data created or acquired by public institutions in one place. The system was established in 2011 to provide public data in the form of file data, visualization, and open API (application programming interface) (Closs et al., 2014). During the study period of 2009–2019, 474 reservoirs were designated as disaster risk reservoirs and 290 maintenance projects were initiated. Among them, a total of 12 areas were flooded before and after the completion of the disaster risk reservoir maintenance project. Table 6 shows the loss rate and maximum precipitation at the time of flooding before and after completion of the maintenance projects in these 12 areas. Data about the loss amounts from storm and flood insurance were obtained from KIDI. Precipitation data were collected from KMA and the maximum daily precipitation at the time of the flooding was used. Insured loss was expressed as a rate of the incurred loss divided by the accrued premium. The loss rate before the maintenance project was 34.32 % on average, while that after the maintenance project was completed was 5.9 % on average, showing a sharp decrease of 82.8 % on average.
Table 6Comparison of loss rate and precipitation before and after maintenance projects in flooded regions in South Korea.
5.2 Cost–benefit analysis and results of natural disaster risk reduction projects
As seen in Table 6, when data of precipitation as the main cause of flooding accidents during flood damage were compared, the average precipitation was 331 mm d−1 before the maintenance project and 215 mm d−1 after the maintenance project. It could be seen that the amount of precipitation was decreased by 35 % when flood damage occurred after the maintenance project. The sharp decrease in the loss rate after the maintenance project could be due to not only the effect of maintenance project, but also decreased rainfalls. In turn, it is difficult to conclude that the decreased loss rate is due to the effect of reducing storm and flood damage caused by the maintenance project.
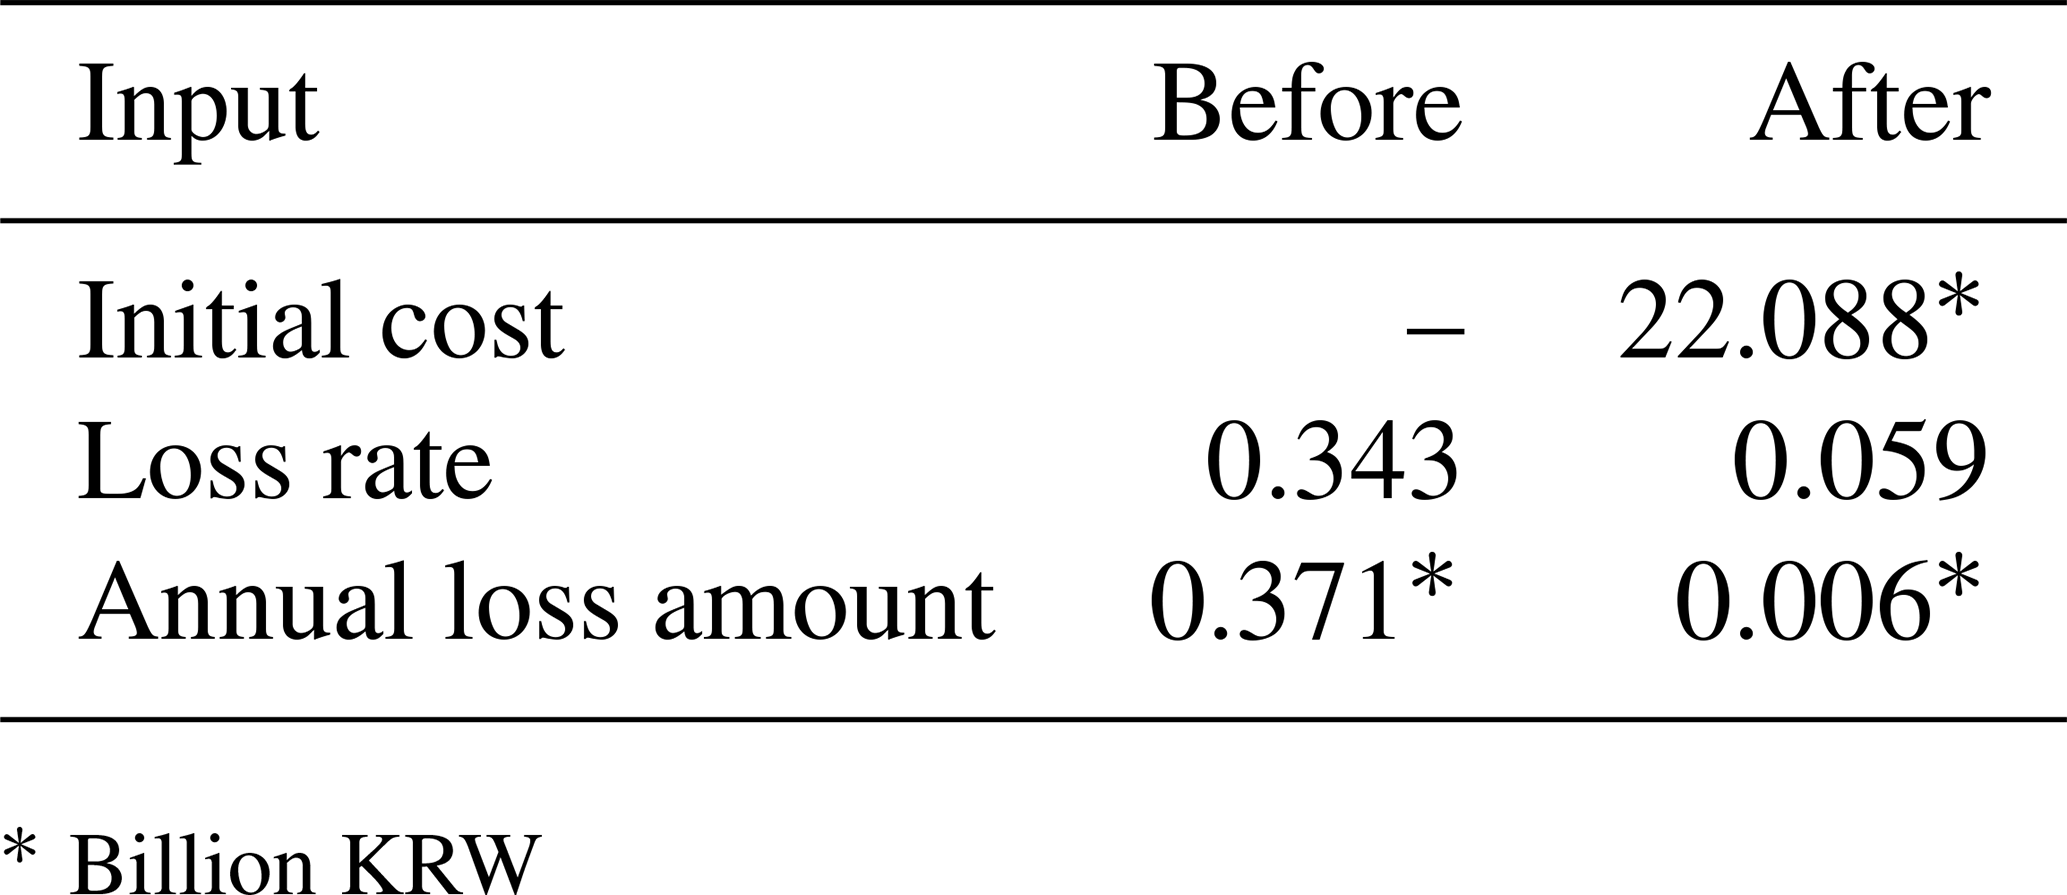
To analyse the cost effectiveness of the maintenance projects in flood regions, a cost–benefit analysis method using an equal-payment-series present-worth factor was adopted. The present-worth factor, assuming an annual loss rate i, is a coefficient used to find the present value corresponding to annual equivalent loss A for the next n years. Equation (1) presents a widely used concept in economic analysis (Park and Sharp, 2021):
where P is present value, A is annual loss amount, i is loss rate, and n is year.
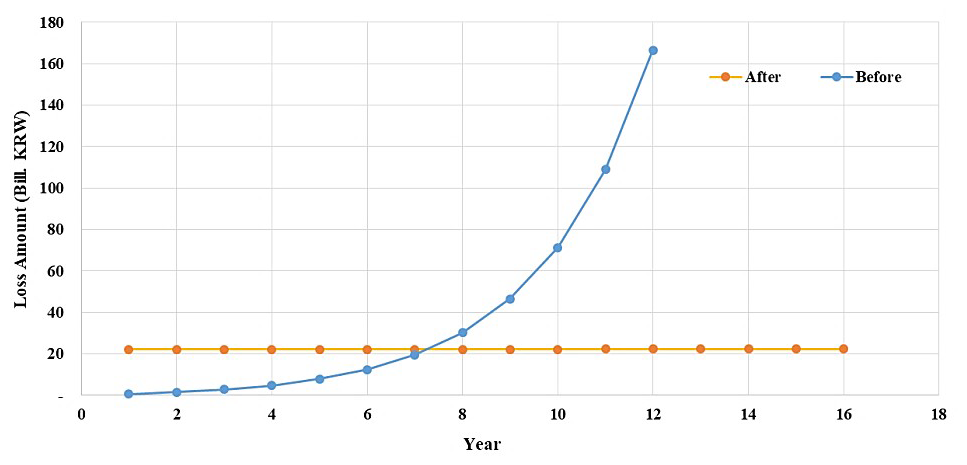
The initial cost of each maintenance project was collected through The Public Data Portal and the average cost of the maintenance project was calculated. For the loss rate, the average loss rate of the loss area was used. For the annual loss amount, the average annual loss for the study period (2009–2019) was used as seen in Table 7. However, it was assumed that no additional costs incurred due to the maintenance project. Figure 8 shows calculation results before and after the maintenance projects, which reveals that the loss amount becomes smaller after 8 years due to investment through the maintenance projects.
Within the proposed strategic framework, SIP-1 developed an improved model for predicting economic losses due to natural disasters using the DNN algorithm. For model development, insurance companies' storm and flood damage insurance loss records were used to collect economic losses caused by actual natural disasters. After developing a DNN model and training it with collected data, the final network model was selected by comparing with other DNN alternatives. To scientifically validate the improved predictability, the performance (i.e. actual-to-predicted comparison using MAE and RMSE methods) of the developed DNN model was compared with a parametric model underpinned by MRA. The results revealed that the DNN model was 15.2 % less in the MAE and 10.12 % less in the RMSE, compared to the MRA model. These results confirm that deep learning can produce more accurate and reliable prediction results of natural disaster-induced economic loss values associated with non-linear characteristics of risk indicators. It is noteworthy that the proposed implementation process is applicable to various natural disaster-triggered loss predictions, as the amount and its fluctuation of losses are diversely dependent on various types and strengths of natural disasters. In this sense, the proposed SIP-1 will help natural disaster risk managers predict the financial loss cost of natural disasters or develop an optimally customized prediction model by adopting deep learning. It can also be used as a reference when developing risk reduction investment plans or financial guidelines in public and private sectors. For example, by applying this implementation process, it would be possible to estimate reliably the negative impact of natural disaster events on existing financial management practices and thus make decisions proactively on the most feasible risk reduction investment plan that can strengthen natural disaster risk management and reduce the amount of risk, ultimately reducing the economic loss caused by natural disasters. Based on well-developed financial guidelines, it would be possible to avoid any transfers of unexpected financial losses from insurance coverage or special purchases suitable for expected losses. Despite the merit of SIP-1, there still remain some limitations. First, owing to the limited data availability, it was problematic to accumulate different data sets. Additional research in the future is needed to parallel and prove loss records in other countries or regions. In addition, further research is required to increase the amount of available data and upgrade the model through the introduction of additional variables to more precisely predict losses from natural disasters using deep learning algorithms.
Compared to SIP-1, SIP-2 proposed a new methodology that can quantify the cost effectiveness of natural disaster risk reduction projects through the cost–benefit analysis. To demonstrate SIP-2, among natural disaster risk reduction projects were implemented in South Korea, specific information of the disaster risk reservoir maintenance projects where flood damage occurred before and after completion was collected. Then, to identify benefits and costs, corresponding loss rates and daily precipitation amounts were investigated and compared at the project level. Lastly, the cost effectiveness of the projects was analysed using a cost–benefit analysis method. As the result of cost–benefit analysis, in the short term, the loss after the maintenance project was greater than that before the maintenance project. However, this was reversed from 8 years after the maintenance project and the loss amount before the maintenance project was larger than that after the maintenance project. Although it is difficult to expect profits from the maintenance project in the short term, it can be seen that the maintenance project is economically beneficial in the long term (8 years or more). SIP-2 would be useful for making sounder decisions on natural disaster management policy and natural disaster risk reduction project investment plans. Evaluating the effectiveness of risk reduction through SIP-2 will lead to drastic investment, which will ultimately reduce the amount of natural disaster risks. However, it should be noted that the study period shown in the SIP-2 case study was relatively short, while the location of project samples was limited to South Korea. In addition, it was assumed that the inflation rate is identical during the study period. In turn, it is necessary to conduct additional analyses considering various locations venerable to natural disasters in other countries and more realistic financial loss values using a net present value concept.
Due to increasing threats to the lives of the general public and built assets from natural disasters, a variety of risk mitigation activities are being carried out extensively. Given the continuous trend toward natural disaster risk mitigation, the significance of relevant economic analyses has been underlined, against the limited public budget and its economic feasibility. To overcome this difficulty, this study proposed a strategic framework for natural disaster risk mitigation, highlighting two different SIPs. SIP-1 introduced more powerful method that can improve the predictability of natural disaster-triggered financial loss values using deep learning, while SIP-2 highlighted the risk mitigation strategy at the project level, adopting a cost–benefit analysis method. In SIP-1, a DNN model for natural disaster loss prediction was developed, and the improved predictability was validated by comparing with MRA. The developed model learned and generalized the loss amount of natural disaster risk indicator facilities (building type, wind speed, total rainfall, and peak ground acceleration) and wind and flood insurance. By evaluating learning performances of 18 different DNN alternatives using RMSE and MAE values as representative evaluation indicators of deep learning algorithms, 25–25–25 hidden layers with dropouts of 0.0 structure was selected as the optimal learning model. The robustness of the developed model was technically validated by comparing RMSE and MAE values of a conventional parametric model using a multiple regression analysis. Validation results confirmed that the non-parametric DNN model was powerful for predicting non-linear characteristics of losses caused by natural disasters. In SIP-2, The cost-benefit analysis was conducted on the disaster risk reservoir maintenance project that occurred before and after the completion of the flood damage. As the result, it was difficult to expect profits from the maintenance business in the short term. However, in the long term (more than 8 years), it was found that the maintenance business was economically profitable. The proposed framework is unique as it provides a combinational approach to mitigating cost risk impacts of natural disasters at both financial loss and project levels. The main findings of this study could be used as a guideline for decision-making on natural disaster management policies and investment in natural disaster risk reduction projects. This study is its first kind and supports the current knowledge framework. This study will help practitioners quantify the loss from various natural disasters, while allowing them to evaluate the cost-effectiveness of risk reduction projects through a holistic approach.
The data presented in this research are available from the first or corresponding author upon reasonable request.
JMK contributed to the conceptualization and data collection and analyses, while proposing a methodology. In addition, JMK investigated the project and wrote the initial manuscript. SGY contributed to the data curation and validation, while investigating and reviewing the manuscript. HP contributed to conducting and improving a review of previous studies. JB strengthened the initial research methodology and contributed to improving the proposed strategic framework design and model visualization. JB also critically reviewed and revised the paper and contributed to the preparation of the final version.
The contact author has declared that neither they nor their co-authors have any competing interests.
Publisher's note: Copernicus Publications remains neutral with regard to jurisdictional claims in published maps and institutional affiliations.
This research has been supported by the Mokpo National University in 2021.
This paper was edited by Vassiliki Kotroni and reviewed by two anonymous referees.
Ajayi, A., Oyedele, L., Owolabi, H., Akinade, O., Bilal, M., Delgado, J. M. D., and Akanbi, L.: Deep learning models for health and safety risk prediction in power infrastructure projects, Risk Anal., 40, 2019–2039, 2019.
Al Najar, M., Thoumyre, G., Bergsma, E. W., Almar, R., Benshila, R., and Wilson, D. G.: Satellite derived bathymetry using deep learning, Mach. Learn., 1–24, https://doi.org/10.1007/s10994-021-05977-w, 2021.
Bae, S. W. and Yoo, J. S.: Apartment price estimation using machine learning: Gangnam-gu, Seoul as an example, Real Estate Stud., 24, 69–85, 2018.
Bae, J., Yum, S. G., and Kim, J. M.: Harnessing machine learning for classifying economic damage trends in transportation infrastructure projects, Sustainability, 13, 1–12, https://doi.org/10.3390/su13116376, 2021.
Blake, E. S., Landsea, C., and Gibney, E. J.: The deadliest, costliest, and most intense United States tropical cyclones from 1851 to 2010 (and other frequently requested hurricane facts), https://repository.library.noaa.gov/view/noaa/6929 (last access: 20 June 2022), 2011.
Bouwer, L. M., Crompton, R. P., Faust, E., Höppe, P., and Pielke, R. A.: Confronting disaster losses, Science, 318, 753, https://doi.org/10.1126/science.1149628, 2007.
Bouwer, L. M., Papyrakis, E., Poussin, J., Pfurtscheller, C., and Thieken, A. H.: The costing of measures for natural hazard mitigation in Europe, Nat. Hazards Rev., 15, 04014010, https://doi.org/10.1061/(asce)nh.1527-6996.0000133, 2014.
Cavallo, E., Galiani, S., Noy, I., and Pantano, J.: Catastrophic natural disasters and economic growth, Rev. Econ. Stat., 95, 1549–1561, https://doi.org/10.1162/REST_a_00413, 2013.
Choi, C. H. and Han, S. W.: Current status and implications of earthquake insurance in major countries, Insurance Research Institute Research Report, 20, 1–118, 2017.
Closs, S., Studer, R., Garoufallou, E., and Sicilia, M. A.: Metadata and semantics research: 8th Research Conference, MTSR 2014, Proceedings 13, Communications in Computer and Information Science, Karlsruhe, Germany, 27–29 November 2014, 478(Smiraglia 2014), 88–89, https://doi.org/10.1007/978-3-319-13674-5, 2014.
Daniell, J. E., Khazai, B., Wenzel, F., and Vervaeck, A.: The CATDAT damaging earthquakes database, Nat. Hazards Earth Syst. Sci., 11, 2235–2251, https://doi.org/10.5194/nhess-11-2235-2011, 2011.
Gledson, B. J. and Greenwood, D.: The adoption of 4d bim in the UK construction industry: An innovation diffusion approach, Eng. Constr. Archit. Manag, 24, 950–967, 2017.
Hochrainer-Stigler, S., Kunreuther, H., Linnerooth-Bayer, J., Mechler, R., Michel-Kerjan, E., Muir-Wood, R., Ranger, N., Vaziri, P., and Young, M.: The Costs and Benefits of Reducing Risk from Natural Hazards to Residential Structures in Developing Countries, 32, https://center4affordablehousing.org/wp-content/uploads/2019/02/WP2011-01_IIASARMSWharton_DevelopingCountries.pdf (last access: 20 June 2022), 2010.
IPA – Infrastructure and Projects Authority: Transforming Infrastructure Performance, https://assets.publishing.service.gov.uk/government/uploads/system/uploads/attachment_data/file/664920/transforming_infrastructure_performance_web.pdf (last access: 20 June 2022), 2017.
IPCC – Intergovernmental Panel on Climate Change: AR5 Climate Change 2014: Impacts, Adaptation, and Vulnerability, https://www.ipcc.ch/report/ar5/wg2/ (last access: 20 June 2022), 2014.
Khosravi, K., Panahi, M., Golkarian, A., Keesstra, S. D., Saco, P. M., Bui, D. T., and Lee, S.: Convolutional neural network approach for spatial prediction of flood hazard at national scale of Iran, J. Hydrol., 591, 125552, https://doi.org/10.1016/j.jhydrol.2020.125552, 2020.
Kim, D. H., Kim, J. D., Choi, C. H., Wang, W. J., Yoo, Y. H., and Kim., H. S.: Estimation of disaster risk rainfall and collapse runoff of old reservoirs, Proceedings of the Korean Society for Disaster Prevention, 19, 421–432, 2019.
Kim, J., Yum, S., Son, S., Son, K., and Bae, J.: Modeling deep neural networks to learn maintenance and repair costs of educational facilities, Buildings, 11, 165, https://doi.org/10.3390/buildings11040165, 2021.
Kim, J. M., Kim, T., and Son, K.: Revealing building vulnerability to windstorms through an insurance claim payout prediction model: a case study in South Korea, Geomat. Nat. Haz. Risk, 8, 1333–1341, https://doi.org/10.1080/19475705.2017.1337651, 2017.
Kim, J. M., Kim, T., Son, K., Yum, S. G., and Ahn, S.: Measuring vulnerability of Typhoon in residential facilities: Focusing on Typhoon Maemi in South Korea, Sustainability, 11, 2768, https://doi.org/10.3390/su11102768, 2019.
Kim, J. M., Son, K., Yum, S. G., and Ahn, S.: Typhoon vulnerability analysis in South Korea utilizing damage record of typhoon Maemi, Advances in Civil Engineering, 2020, 8885916, https://doi.org/10.1155/2020/8885916, 2020a.
Kim, J. M., Son, S., Lee, S., and Son, K.: Cost of climate change: Risk of building loss from typhoon in South Korea, Sustainability, 12, 1–11, https://doi.org/10.3390/su12177107, 2020b.
Kim, J. M., Ha, K. C., Ahn, S., Son, S., and Son, K.: Quantifying the third-party loss in building construction sites utilizing claims payouts: A case study in south korea, Sustainability, 12, 1–13, https://doi.org/10.3390/su122310153, 2020c
Kim, J. M., Bae, J., Son, S., Son, K., and Yum, S. G.: Development of model to predict natural disaster-induced financial losses for construction projects using deep learning techniques, Sustainability, 13, 5304, https://doi.org/10.3390/su13095304, 2021.
Kingma, D. P. and Ba, J. L.: Adam: A method for stochastic optimization, 3rd International Conference on Learning Representations, ICLR 2015 – Conference Track Proceedings, 7–9 May 2015, San Diego, CA, USA, 1–15, https://dblp.org/db/conf/iclr/iclr2015.html (last access: 20 June 2022), 2015.
Kreimer, A., Arnold, M., and Carlin, A.: Building safer cities: The Future of Disaster Risk, https://www.preventionweb.net/files/638_8681.pdf (last access: 20 June 2022), 2003.
Krizhevsky, B. A., Sutskever, I., and Hinton, G. E.: ImageNet classification with deep convolutional natural networks, Adv. Neural Inf. Process. Syt., 60, 84–90, 2012.
Kunreuther, H., Meyer, R., and Van De Bulte, C.: Risk analysis for extreme events: Economic Incentives for reducing future losses, Technology, 93, http://www.bfrl.nist.gov/oae/publications/gcrs/04871.pdf (last access: 20 June 2022), 2004.
Kunreuther, H. and Michel-Kerjan, E.: Challenge Paper: Natural Disasters, Policy options for reducing losses from natural disasters: Allocating USD 75 billion, Revised version for Copenhagen Consensus, Center for Risk Management and Decision Processes, The Wharton School, University of Pennsylvania, Philadelphia, Pennsylvania, USA, https://www.copenhagenconsensus.com/sites/default/files/naturaldisasters.pdf (last access: 20 June 2022), 2012.
Kwon, T. Y. and Oh, G. Y.: Development of integrated management system for wind and flood damage insurance management map equipped with insurance rate analysis algorithm module, Proceedings of the Korean Society for Disaster Prevention, 18, 105–114, 2018.
Lee, S. W.: Exploring the limitations of disaster prevention projects and improvement measures, Disaster Prevention Review, 19, 15–20, 2017.
Mechler, R.: Cost-benefit analysis of natural disaster risk management in developing countries, Eschborn: Deutsche Gesellschaft Fur Technische Zusammenarbeit (GTZ) GmbH, Sector Project: Disaster Risk Management in Development Cooperation, 5–67, https://pure.iiasa.ac.at/id/eprint/7320/1/Cost-B-A.pdf (last access: 20 June 2022), 2005.
Moishin, M., Deo, R. C., Prasad, R., Raj, N., and Abdulla, S.: Designing deep-based learning flood forecast model with ConvLSTM hybrid algorithm, IEEE Access, 9, 50982–50993, 2021.
Park, C. S. and Sharp, G. P.: Advanced engineering economics, John Wiley & Sons, ISBN 978-1-119-69196-9, 2021.
Rasjava, A. R. I., Sugiyarto, A. W., Kurniasari, Y., and Ramadhan, S. Y.: Detection of Rice Plants Diseases Using Convolutional Neural Network (CNN), in: Proceeding International Conference on Science and Engineering, 3, 393–396, https://doi.org/10.14421/icse.v3.535, 2020.
Rose, A., Porter, K., Dash, N., Bouabid, J., Huyck, C., Whitehead, J., Shaw, D., Eguchi, R., Taylor, C., McLane, T., Tobin, L. T., Ganderton, P. T., Godschalk, D., Kiremidjian, A. S., Tierney, K., and West, C. T.: Benefit-cost analysis of FEMA hazard mitigation grants, Nat. Hazards Rev., 8, 97–111, https://doi.org/10.1061/(asce)1527-6988(2007)8:4(97), 2007.
Ryu, J. D., Park, S. M., Park, S. H., Kwon, C. W., and Yoon, I. S.: A study on the development of a model for predicting the number of highway traffic accidents using deep learning, J. Korean Soc., 17, 14–25, 2018.
Sanders, D. E. A.: The management of losses arising from extreme events, Giro 2002, 261, https://www.actuaries.org.uk/system/files/documents/pdf/management-losses-arising-extreme-events2002.pdf (last access: 21 June 2022), 2002.
Shane Crawford, P., Hainen, A. M., Graettinger, A. J., van de Lindt, J. W., and Powell, L.: Discrete-outcome analysis of tornado damage following the 2011 Tuscaloosa, Alabama, tornado, Nat. Hazards Rev., 21, 04020040, https://doi.org/10.1061/(ASCE)NH.1527-6996.0000396, 2020.
Shreve, C. M. and Kelman, I.: Does mitigation save? Reviewing cost-benefit analyses of disaster risk reduction, Int. J. Disast. Risk Re., 10, 213–235, https://doi.org/10.1016/j.ijdrr.2014.08.004, 2014.
Toya, H. and Skidmore, M.: Economic development and the impacts of natural disasters, Econ. Lett., 94, 20–25, https://doi.org/10.1016/j.econlet.2006.06.020, 2007.
Ulbrich, U., Fink, A. H., Klawa, M., and Pinto, G.: December 1999, Arch. Ophthalmol., 117, 1661, https://doi.org/10.1001/archopht.117.12.1661, 1999.
United States National Hurricane Center (USNHC): Costliest, U.S. tropical cyclones tables update, 3 pp., https://www.nhc.noaa.gov/news/UpdatedCostliest.pdf (last access: 31 May 2021), 2018.
Yi, Y. and Zhang, W.: A new deep-learning-based approach for earthquake-triggered landslide detection from single-temporal RapidEye satellite imagery, IEEE J. Sel. Top. Appl., 13, 6166–6176, 2020.
Zhang, Y., Shi, X., Zhang, H., Cao, Y., and Terzija, V.: Review on deep learning applications in frequency analysis and control of modern power system, Int. J. Elec. Power, 136, 107744, https://doi.org/10.1016/j.ijepes.2021.107744, 2022.
- Abstract
- Introduction
- Point of departure: the need of more effective strategic framework for natural disaster risk mitigation
- Research objectives and methods
- SIP-1: improving the predictability of natural disaster-induced financial loss values using deep learning
- SIP-2: quantifying the cost-effectiveness of natural disaster risk reduction projects using cost–benefit analysis
- Discussion
- Conclusions
- Code and data availability
- Author contributions
- Competing interests
- Disclaimer
- Financial support
- Review statement
- References