the Creative Commons Attribution 4.0 License.
the Creative Commons Attribution 4.0 License.
 | 28 Jan 2022
Precipitation stable isotopic signatures of tropical cyclones in Metropolitan Manila, Philippines, show significant negative isotopic excursions
Dominik Jackisch
Bi Xuan Yeo
Shaoneng He
Danica Linda M. Cantarero
Fernando P. Siringan
Nathalie F. Goodkin
Tropical cyclones have devastating impacts on the environment, economies, and societies and may intensify in the coming decades due to climate change. Stable water isotopes serve as tracers of the hydrological cycle, as isotope fractionation processes leave distinct precipitation isotopic signatures. Here we present a record of daily precipitation isotope measurements from March 2014 to October 2015 for Metropolitan Manila, a first-of-a-kind dataset for the Philippines and Southeast Asia. We show that precipitation isotopic variation at our study site is closely related to tropical cyclones. The most negative shift in δ18O values (−13.84 ‰) leading to a clear isotopic signal was caused by Typhoon Rammasun, which directly hit Metropolitan Manila. The average δ18O value of precipitation associated with tropical cyclones is −10.24 ‰, whereas the mean isotopic value for rainfall associated with non-cyclone events is −5.29 ‰. Further, the closer the storm track is to the sampling site, the more negative the isotopic values are, indicating that in situ isotope measurements can provide a direct linkage between isotopes and typhoon activities in the Philippines.
- Article
(4137 KB) - Full-text XML
-
Supplement
(677 KB) - BibTeX
- EndNote


The Philippines, an archipelago with a fast-growing population clustered along the coastline, is one of the most vulnerable countries to climate change (Cinco et al., 2014). It is especially prone to the devastating effects of tropical cyclones. Thus, it is considered a hotspot region for hydrometeorological disasters (Cinco et al., 2014; Cruz et al., 2013; Takagi and Esteban, 2016). There is a clear need for developing a better understanding of tropical cyclone (TC) dynamics and cyclone histories in the context of prediction that may allow government agencies to implement proper mitigation and adaptation policies. Nine TCs per year made landfall on average between 1951 and 2013 in the Philippines. The number of TCs not making landfall but reaching Philippine waters is substantially higher with 19.4 per year (Cinco et al., 2016). The changing climate and associated warming of the surface ocean will likely increase the intensity of tropical cyclones in the future (Emanuel, 2005; Webster et al., 2005; Woodruff et al., 2013).
Table 1Costliest typhoons in the Philippines. Two devastating typhoons, Rammasun and Koppu (ranking 3 and 7), occurred during our study period and made landfall. Damage in US dollars (USD) based on each time of TC occurrence (not adjusted to current inflation rates).

References: Alojado and Padua (2015), Lagmay et al. (2015), NDRRMC (2012, 2014, 2015), and Soria et al. (2016).
The Philippines was struck by several devastating TCs in recent years (Table 1). Typhoon Haiyan (2013), which tracked over the Visayas, has been the costliest TC to date (∼ USD 2.06 billion in 2013), with strong winds and intense storm surges inundating coastal areas resulting in more than 6000 fatalities (Alojado and Padua, 2015; Lagmay et al., 2015; Soria et al., 2016). Typhoon Rammasun, which made landfall in July 2014, is ranked number 3 with ∼ USD 880 million in damage in 2014 (Alojado and Padua, 2015; NDRRMC, 2014); 80 % of the strongest typhoons making landfall in the Philippines over the last 3 decades developed during periods of higher-than-average sea surface temperature (SST), which supports the hypothesis that TC intensities are projected to rise in the future with an increase in global temperatures (Guan et al., 2018; Webster et al., 2005; Takagi and Esteban, 2016). For example, SST was found to be anomalously high and reaching 29.6 ∘C during the formation of Typhoon Haiyan (Takagi and Esteban, 2016). The average Philippine ocean SST for the period from 1945 to 2014 (basin between 6–18∘ N, 120–140∘ E) is ∼28.5 ∘C based on the National Oceanic and Atmospheric Administration Extended Reconstructed Sea Surface Temperature dataset, version 5 (NOAA ERSST v5) (Takagi and Esteban, 2016). By the end of the 21st century, average typhoon intensity in the low-latitude northwestern Pacific is predicted to increase by 14 % due to rising ocean temperatures (Mei et al., 2015).
A few studies have demonstrated the potential to investigate tropical cyclones using stable water isotopes (Good et al., 2014; Lawrence et al., 2002; Munksgaard et al., 2015; Pape et al., 2010). As dynamic tracers of hydrological processes, stable water isotopes (δ2H and δ18O) can provide insights into the water and energy budgets of TCs (Good et al., 2014; Lawrence and Gedzelman, 1996). In the regions with general TC occurrence, significantly lower δ2H and δ18O values are associated with TC rainfall due to strong isotope fractionation processes, compared to other tropical rain events (Lawrence, 1998; Lawrence and Gedzelman, 1996). Furthermore, δ2H and δ18O have been used successfully to interpret TC history from paleoarchives, such as tree rings and speleothems (Oliva et al., 2017). For instance, tree-ring cellulose isotope proxies have recorded the most recent 220 years of cyclones in the southeastern USA (Miller et al., 2006); similarly, high-resolution isotopic analysis of tree rings from the eastern US revealed the occurrence of hurricanes in 2004 (Li et al., 2011). A 23-year stalagmite record from Central America was used to reconstruct past TC activity (Frappier et al., 2007), and isotope signals from an 800-year stalagmite record were used to reconstruct past TC frequencies in northeastern Australia (Nott et al., 2007). Interpretation of TC history in paleotempestology from paleoarchives is based on the fact that TCs leave distinct isotopic signatures on precipitation, possibly providing information on TC evolution and structure (Lawrence et al., 2002).
The depletion in stable isotopes has been attributed to the high condensation levels and strong isotopic exchanges between inflowing water vapour and falling raindrops in cyclonic rainfall bands, resulting in a temporal decrease of isotopic values throughout a rain event (i.e. amount effect) (Lawrence, 1998; Lawrence and Gedzelman, 1996). Isotopic depletion can be further enhanced by a TC's thick, deep clouds; relatively large storm size; and longevity (Lawrence, 1998). Furthermore, while isotopic depletion increases inwards towards the eye wall of the storm (Lawrence and Gedzelman, 1996), isotope ratios inside the inner eye wall region are relatively enriched, likely due to an intensive isotopic moisture recharge with heavy isotopes from sea spray (Fudeyasu et al., 2008; Gedzelman et al., 2003). These findings are based on work conducted in the 1990s in Puerto Rico and on the southern and eastern coasts of the United States. More recently, these previous findings have been confirmed by studying TCs which occurred in a few other regions, such as in China or Australia (Chakraborty et al., 2016; Fudeyasu et al., 2008; Good et al., 2014; Munksgaard et al., 2015; Xu et al., 2019).
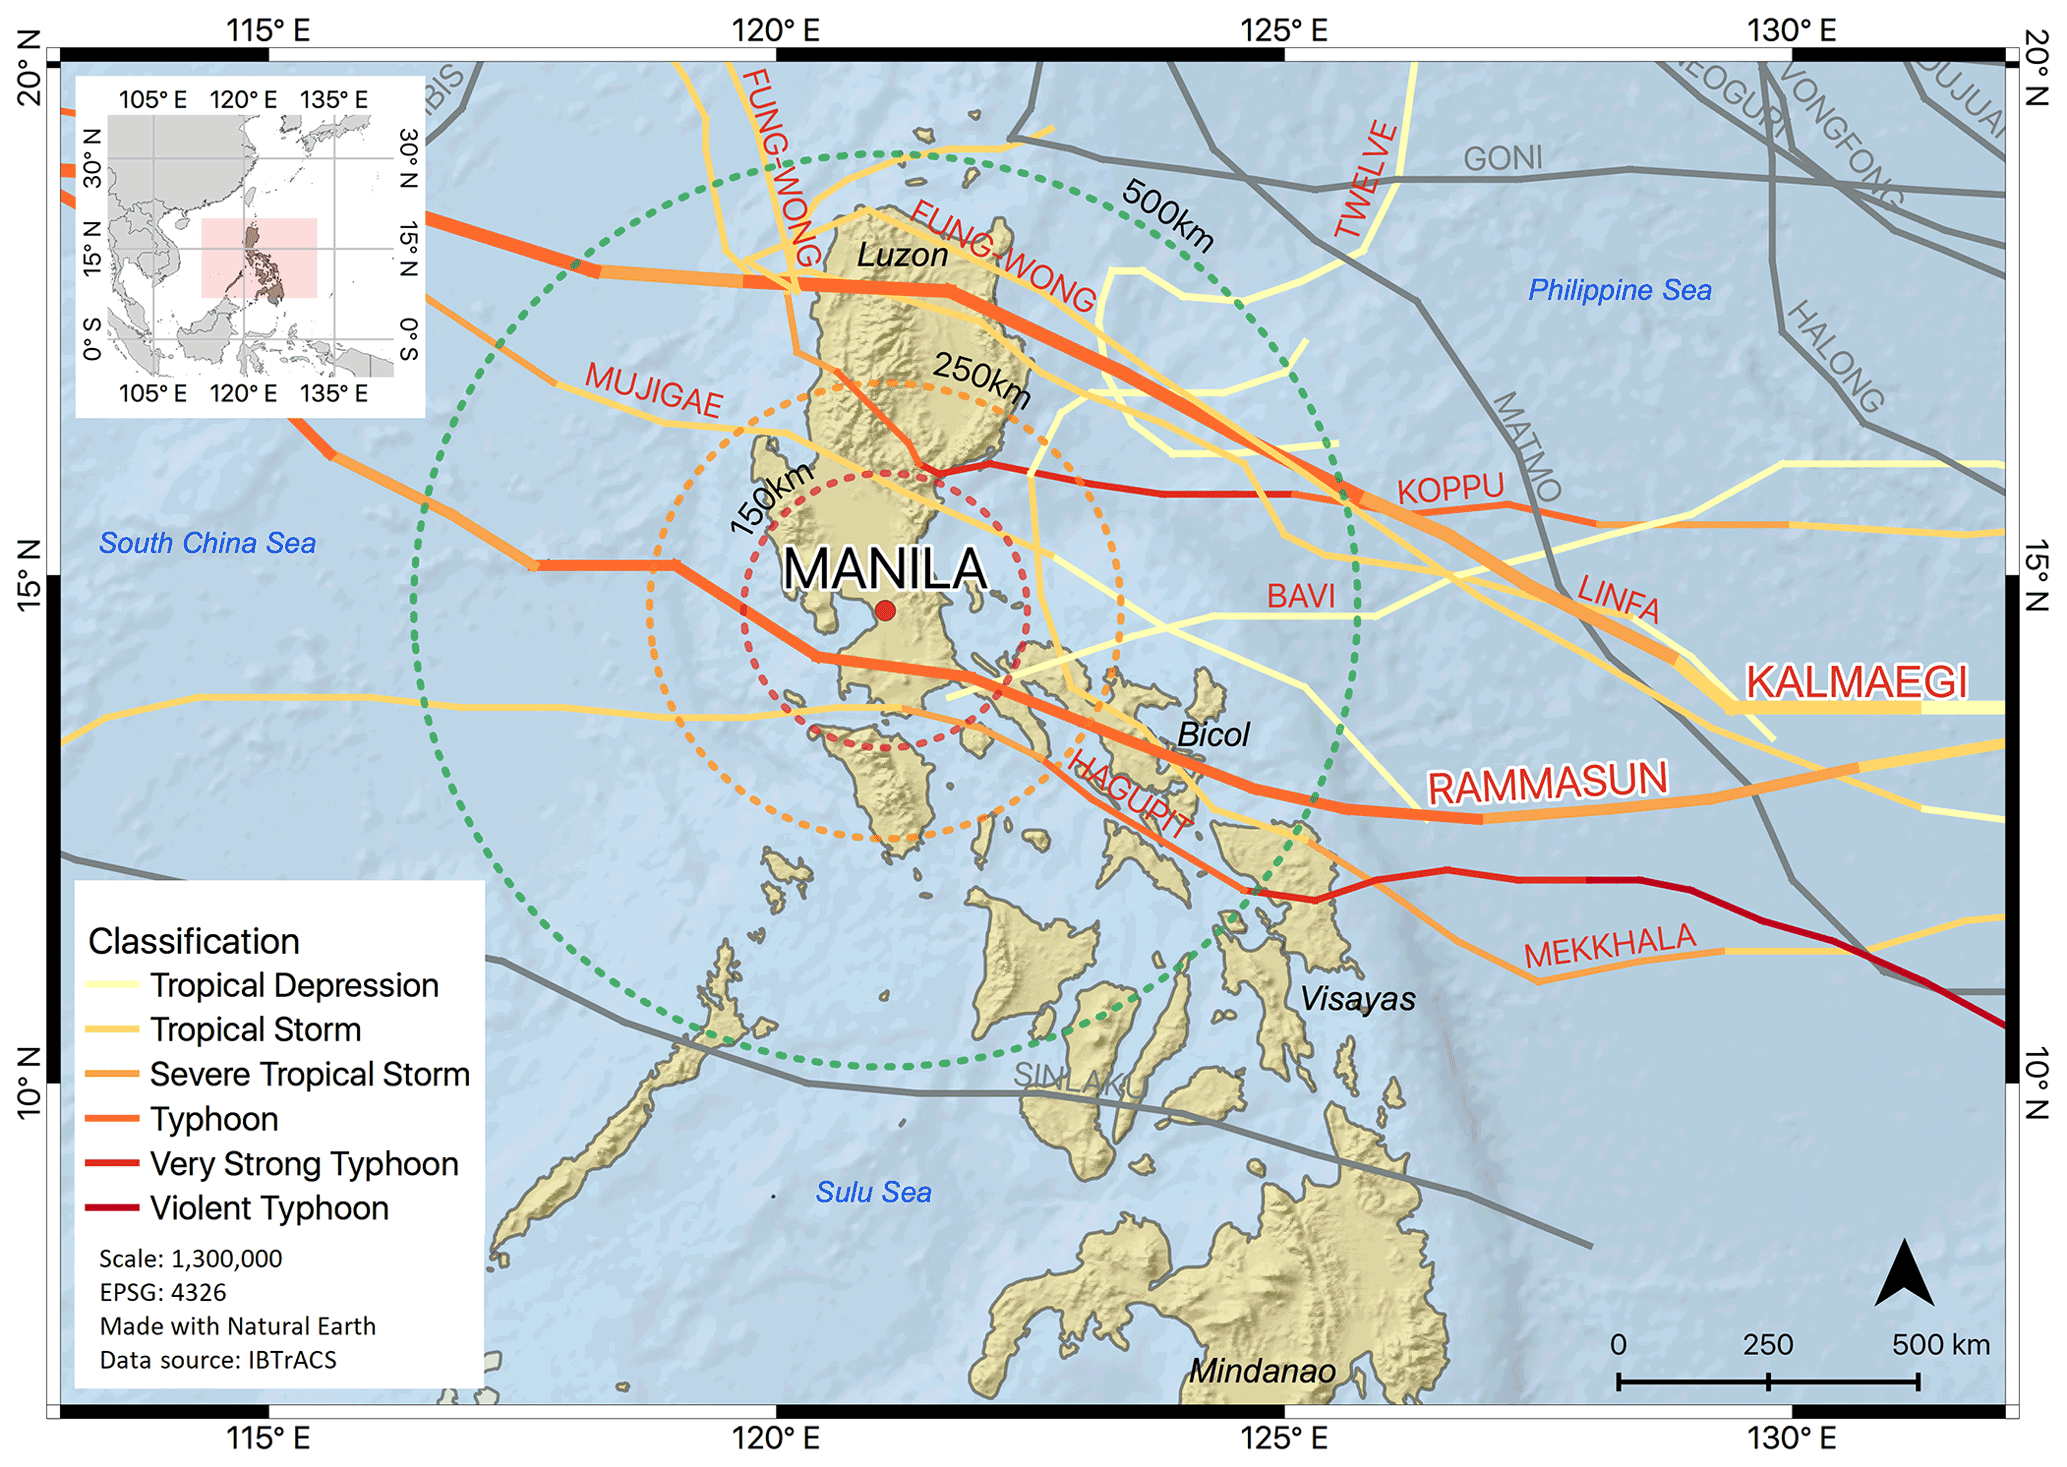
Figure 1Metropolitan Manila sampling site and TC tracks of 2014 and 2015 seasons. Three different sized circles indicate the distance to the sampling site with the outermost one being 500 km in radius. Cyclone tracks are colour-coded according to the typhoon classification from the Regional Specialized Meteorological Centre (RSMC) Tokyo. Cyclones in grey refer to a TC outside the 500 km radius.
The above-mentioned studies are geographically limited to a few locations globally, with no studies in Southeast Asia and the Philippines in particular. Here, we present the first such study for the Philippines, with daily isotope measurements of precipitation from Metropolitan Manila (the National Capital Region) spanning from March 2014 to October 2015. During the study period, nine tropical cyclones passed by or made landfall within 500 km of the sampling site (Fig. 1). The main objectives of this research are the following:
-
to understand if there is an isotopic variation in precipitation associated with TC landfall in the Philippines and if tropical cyclones leave clear isotopic signals
-
to identify the isotopic signals measured for Metropolitan Manila and the intensity of the isotopic depletion associated with TC activities and to identify how they are represented spatially
-
to understand the isotopic variation with distance from the TC track in the Philippines.
Our findings provide a baseline dataset for reconstruction of typhoon activities using stable isotopes and contribute to a better understanding of past and future TC activities in the Philippines.
2.1 Site description
The Philippines is a Southeast Asian country comprising more than 7000 islands located in the northwestern Pacific between 4∘40′ and 21∘10′ N and 116∘40′ and 126∘34′ E (Fig. 1). The country experiences an average annual rainfall of about 2000 mm, influenced by two monsoon seasons, the northeast monsoon from November to April and the southwest monsoon from May to October (Cinco et al., 2014). About 35 % of the annual rainfall is related to TC activity, while its contribution rises to about 50 % for Luzon and decreases to 4 % for the southern island of Mindanao (Cinco et al., 2016). Part of the rainfall amount in the Philippines is of orographic nature due to north–south-oriented mountain ranges of more than 1000 m spanning the largest islands of Luzon and Mindanao (Villafuerte et al., 2014). The majority of the steadily growing population in the Philippines (101 million as of the 2017 census) lives in densely populated, low-elevation areas close to the coastlines (Cinco et al., 2014, 2016; Philippine Statistics Authority, 2017).
2.2 Isotopic data
In total, 186 daily precipitation samples were collected from 11 March 2014 to 27 October 2015 using a Palmex collector (Gröning et al., 2012) at the Marine Science Institute of the University of the Philippines Diliman located in Quezon City, which is a part of Metropolitan Manila. The rain station was installed on the rooftop of the Marine Science Institute (14∘39′02.5′′ N, 121∘04′08.6′′ E), which is centrally situated in the campus and surrounded by trees and various green spaces. The rooftop location proved ideal for rainwater collection, as it allowed for unobstructed access to rainwater without any potential sources of contamination. Samples were collected daily at 10:00 and transferred without headspace to 30 mL HDPE (high-density polyethylene) bottles for storage prior to analysis. Samples were sent to the Earth Observatory of Singapore, Nanyang Technological University, Singapore, and were analysed for stable isotopes using a Picarro L1230-i laser spectroscopy instrument. We followed the procedures described by Van Geldern and Barth (2012) for post-run corrections and calibration. Three in-house water standards used for calibration include KONA (0.02 ‰ of δ18O; 0.25 ‰ of δ2H), TIBET (−19.11 ‰ of δ18O; −143.60 ‰ of δ2H), and ELGA (−4.25 ‰ of δ18O; −27.16 ‰ of δ2H). They are calibrated against the international reference water standards VSMOW2 (Vienna Standard Mean Ocean Water 2) and SLAP2 (Standard Light Antarctic Precipitation 2). Long-term analysis of our QA/QC (quality assurance/quality control) standards yields a precision of 0.04 ‰ for δ18O and 0.2 ‰ for δ2H. We used δ18O and δ2H to calculate deuterium excess, which is defined as d-excess =δ2H − 8×δ18O and is commonly regarded to reflect evaporation conditions of moisture source regions.
2.3 Cyclone track data
The International Best Track Archive for Climate Stewardship (IBTrACS) dataset contains global TC best-track data and is a joint effort of various regional meteorological institutions and centres that are part of the World Meteorological Organization (WMO). The data are publicly available and comprise information on a storm's eye/centre with its coordinates, wind speed, and pressure, etc., with a temporal resolution of 6 h (Knapp et al., 2010a, b; Rios Gaona et al., 2018). Apart from visualization of cyclone paths, we used the dataset to calculate the spatial distance between the coordinates of a storm's eye and our sampling site.
2.4 Satellite precipitation data
We used version 5 of the IMERG Final daily product (Integrated Multi-satellitE Retrievals for GPM, Global Precipitation Measurement), a remotely sensed precipitation dataset from satellites, to highlight cyclonic tracks and precipitation patterns of several TCs passing by Metropolitan Manila and to identify which rainfall events were not affected by cyclonic activity but instead were associated with local or other regional convection activities. Such a dataset is beneficial, as it provides quasi-global grid-based rainfall estimates for land and the oceans (Poméon et al., 2017). The Integrated Multi Satellite Retrievals for GPM (IMERG) dataset from the Global Precipitation Measurement (GPM) programme with a fine 0.1∘ grid size (Huffman et al., 2017, 2019) has been available since March 2014 and provides precipitation data in different temporal resolutions, such as half-hourly or daily. Such satellite rainfall data have been previously utilized to show TC tracks and related rainfall intensities (Rios Gaona et al., 2018; Villarini et al., 2011).
2.5 Rainfall, temperature, and relative humidity data
Daily rainfall, mean daily relative humidity, and mean daily temperature data were obtained from the Philippine Atmospheric, Geophysical and Astronomical Services Administration (PAGASA), which maintains a rainfall monitoring station about 2.7 km away from our sampling site. The data are freely available for the period 2013 to 2017 and can be accessed on the Philippines Freedom of Information website (https://www.foi.gov.ph/, last access: 18 October 2019).

Figure 2Time series of daily variations of δ18O, δ2H, d-excess, temperature, relative humidity, and precipitation amount at Metropolitan Manila, Philippines. Please note that the date format in this figure is month/year.
3.1 Isotopic variation of stable isotopes in daily precipitation
A total of 186 daily precipitation samples were collected during the 19 months of the study period spanning from 11 March 2014 to 27 October 2015 in Metropolitan Manila. Their stable isotope compositions show large seasonal isotopic variability; δ18O ranges from 4 ‰ to −13.84 ‰, and δ2H ranges from 16.84 ‰ to −99.1 ‰ (Fig. 2). The highest δ18O value of 4 ‰ was observed on 9 April 2014 during the annual dry period, whereas the lowest δ18O value of −13.84 ‰ was observed on 16 September 2014 in association with TC activity. The mean δ18O value of precipitation at the study site is −5.29 ‰ for non-TC rain systems, while TCs, as large regional convective systems, have the potential to cause a change in δ values of up to almost 9 ‰ relative to the mean. The average δ18O value of the nine TCs that tracked within <500 km from the sampling site is −10.24 ‰ (SD of 2.11), a factor of 2 larger than the mean from non-TC precipitation (average is −5.29 ‰, SD of 2.64).
An inter-annual variation of stable isotopes in precipitation is observed in the time series of Metropolitan Manila, where the generally humid summer months are characterized by heavy rainfall and exhibit lower isotope values compared to the rest of the year (Fig. 2). The precipitation isotopes are characterized by slightly higher values during winter and spring, when temperatures and relative humidity are lower with less frequent rainfall. Especially early 2015 shows drier conditions with sporadic rainfall and relative humidity levels of about 60 % to 70 %. This is also reflected in the precipitation collected on 1 March 2015 with δ18O of 0.01 ‰ and δ2H of 9.8 ‰, respectively. Although d-excess shows relatively high temporal variability, ranging from −15.18 ‰ to 24.31 ‰, it largely clusters in a small range between 5 ‰ and 15 ‰.
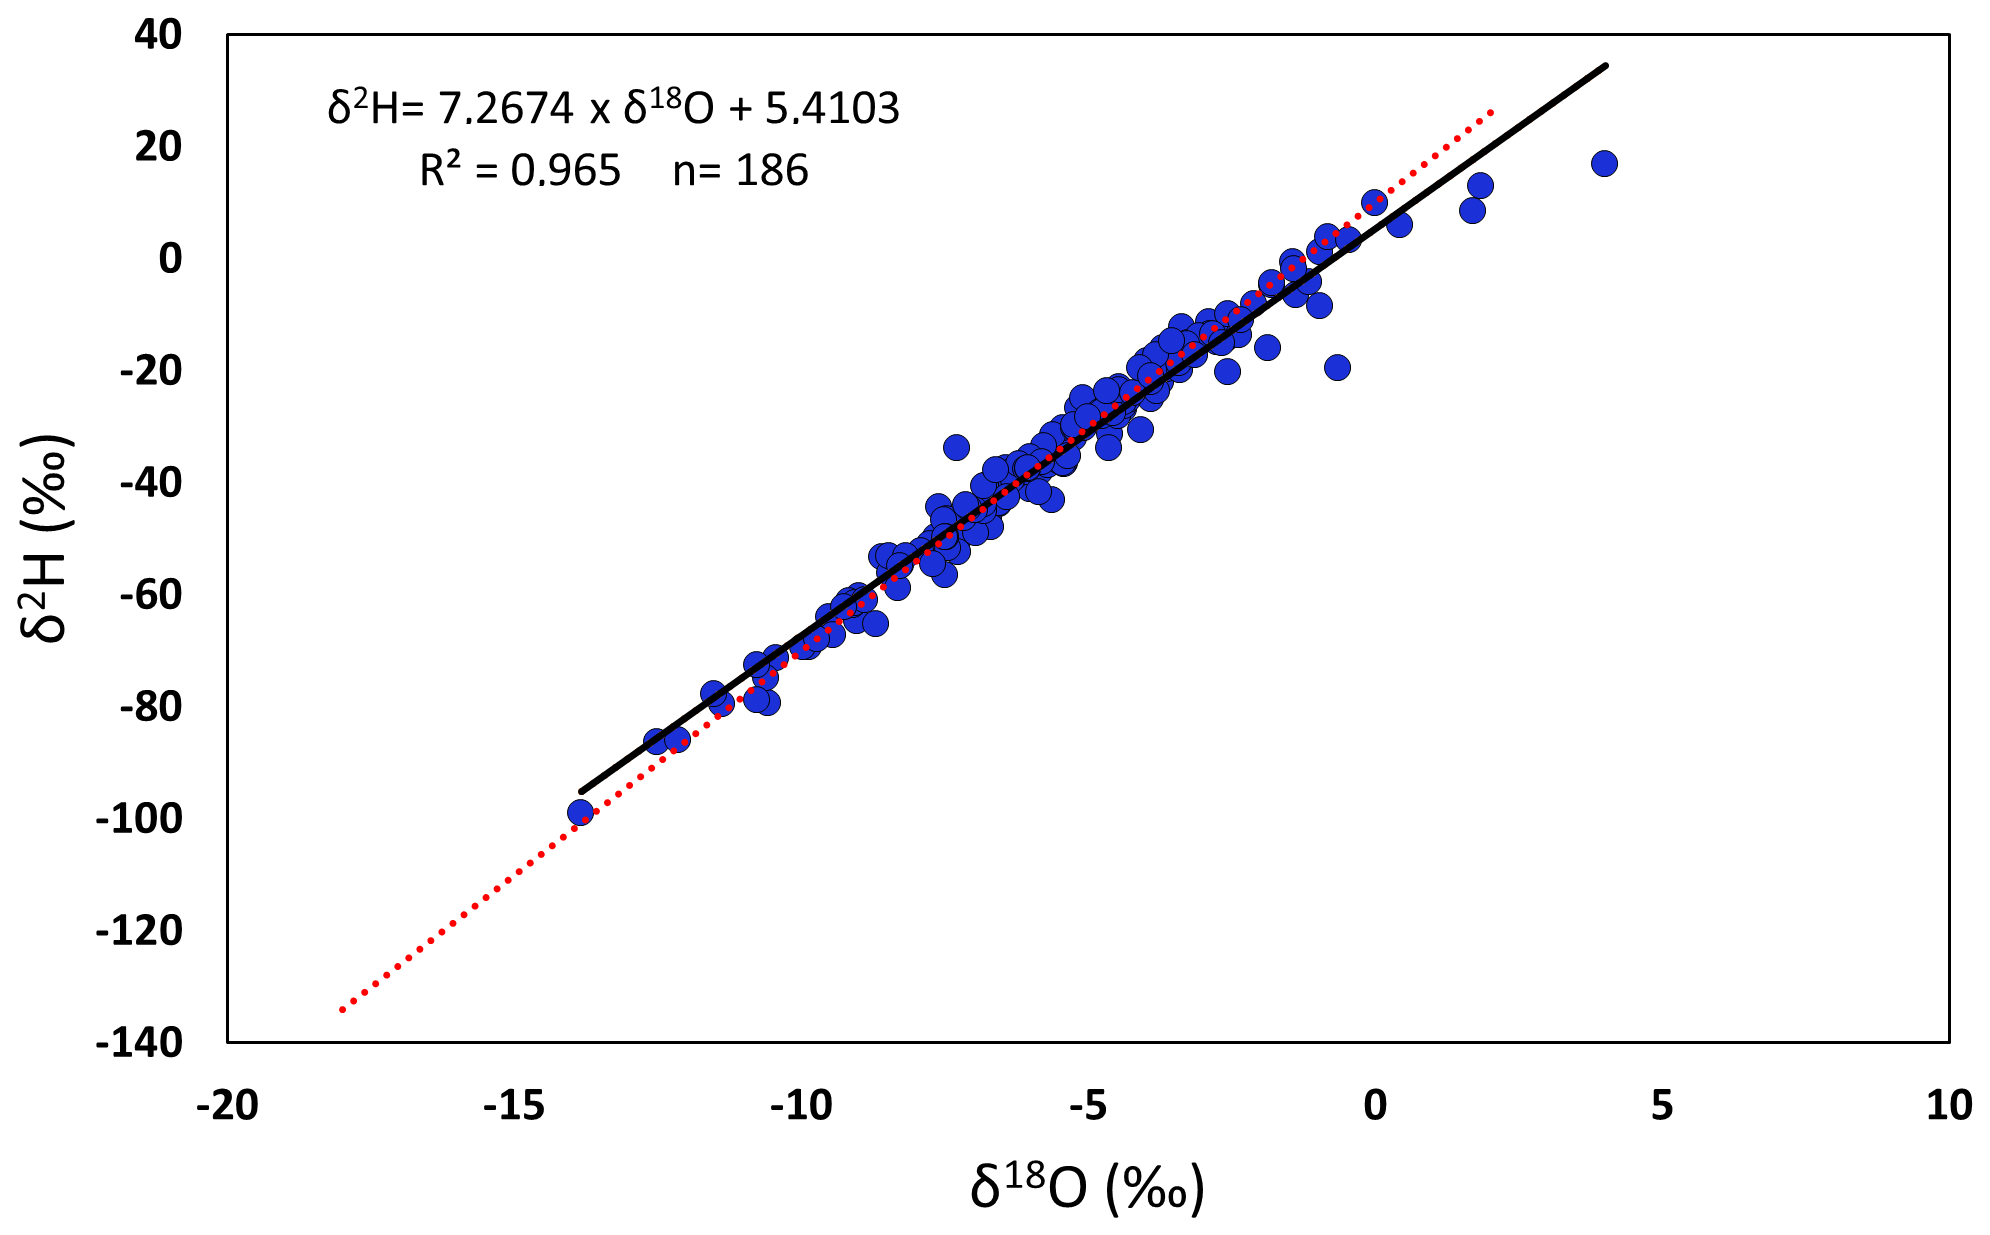
Figure 3Local meteoric water line (LMWL) established for Metropolitan Manila, Philippines. The red dotted line represents the global meteoric water line (GMWL) (δ2H = 8×δ18O + 10; Craig, 1961).
Based on the daily isotope measurements of rainfall events between 2014 and 2015, we determined the LMWL (local meteoric water line) for the study site to be δ2H = 7.2674×δ18O + 5.4103 (Fig. 3), indicating that slope and intercept of the LMWL are lower due to the influence of tropical precipitation compared to the GMWL (global meteoric water line) with δ2H = 8×δ18O + 10 (Craig, 1961).
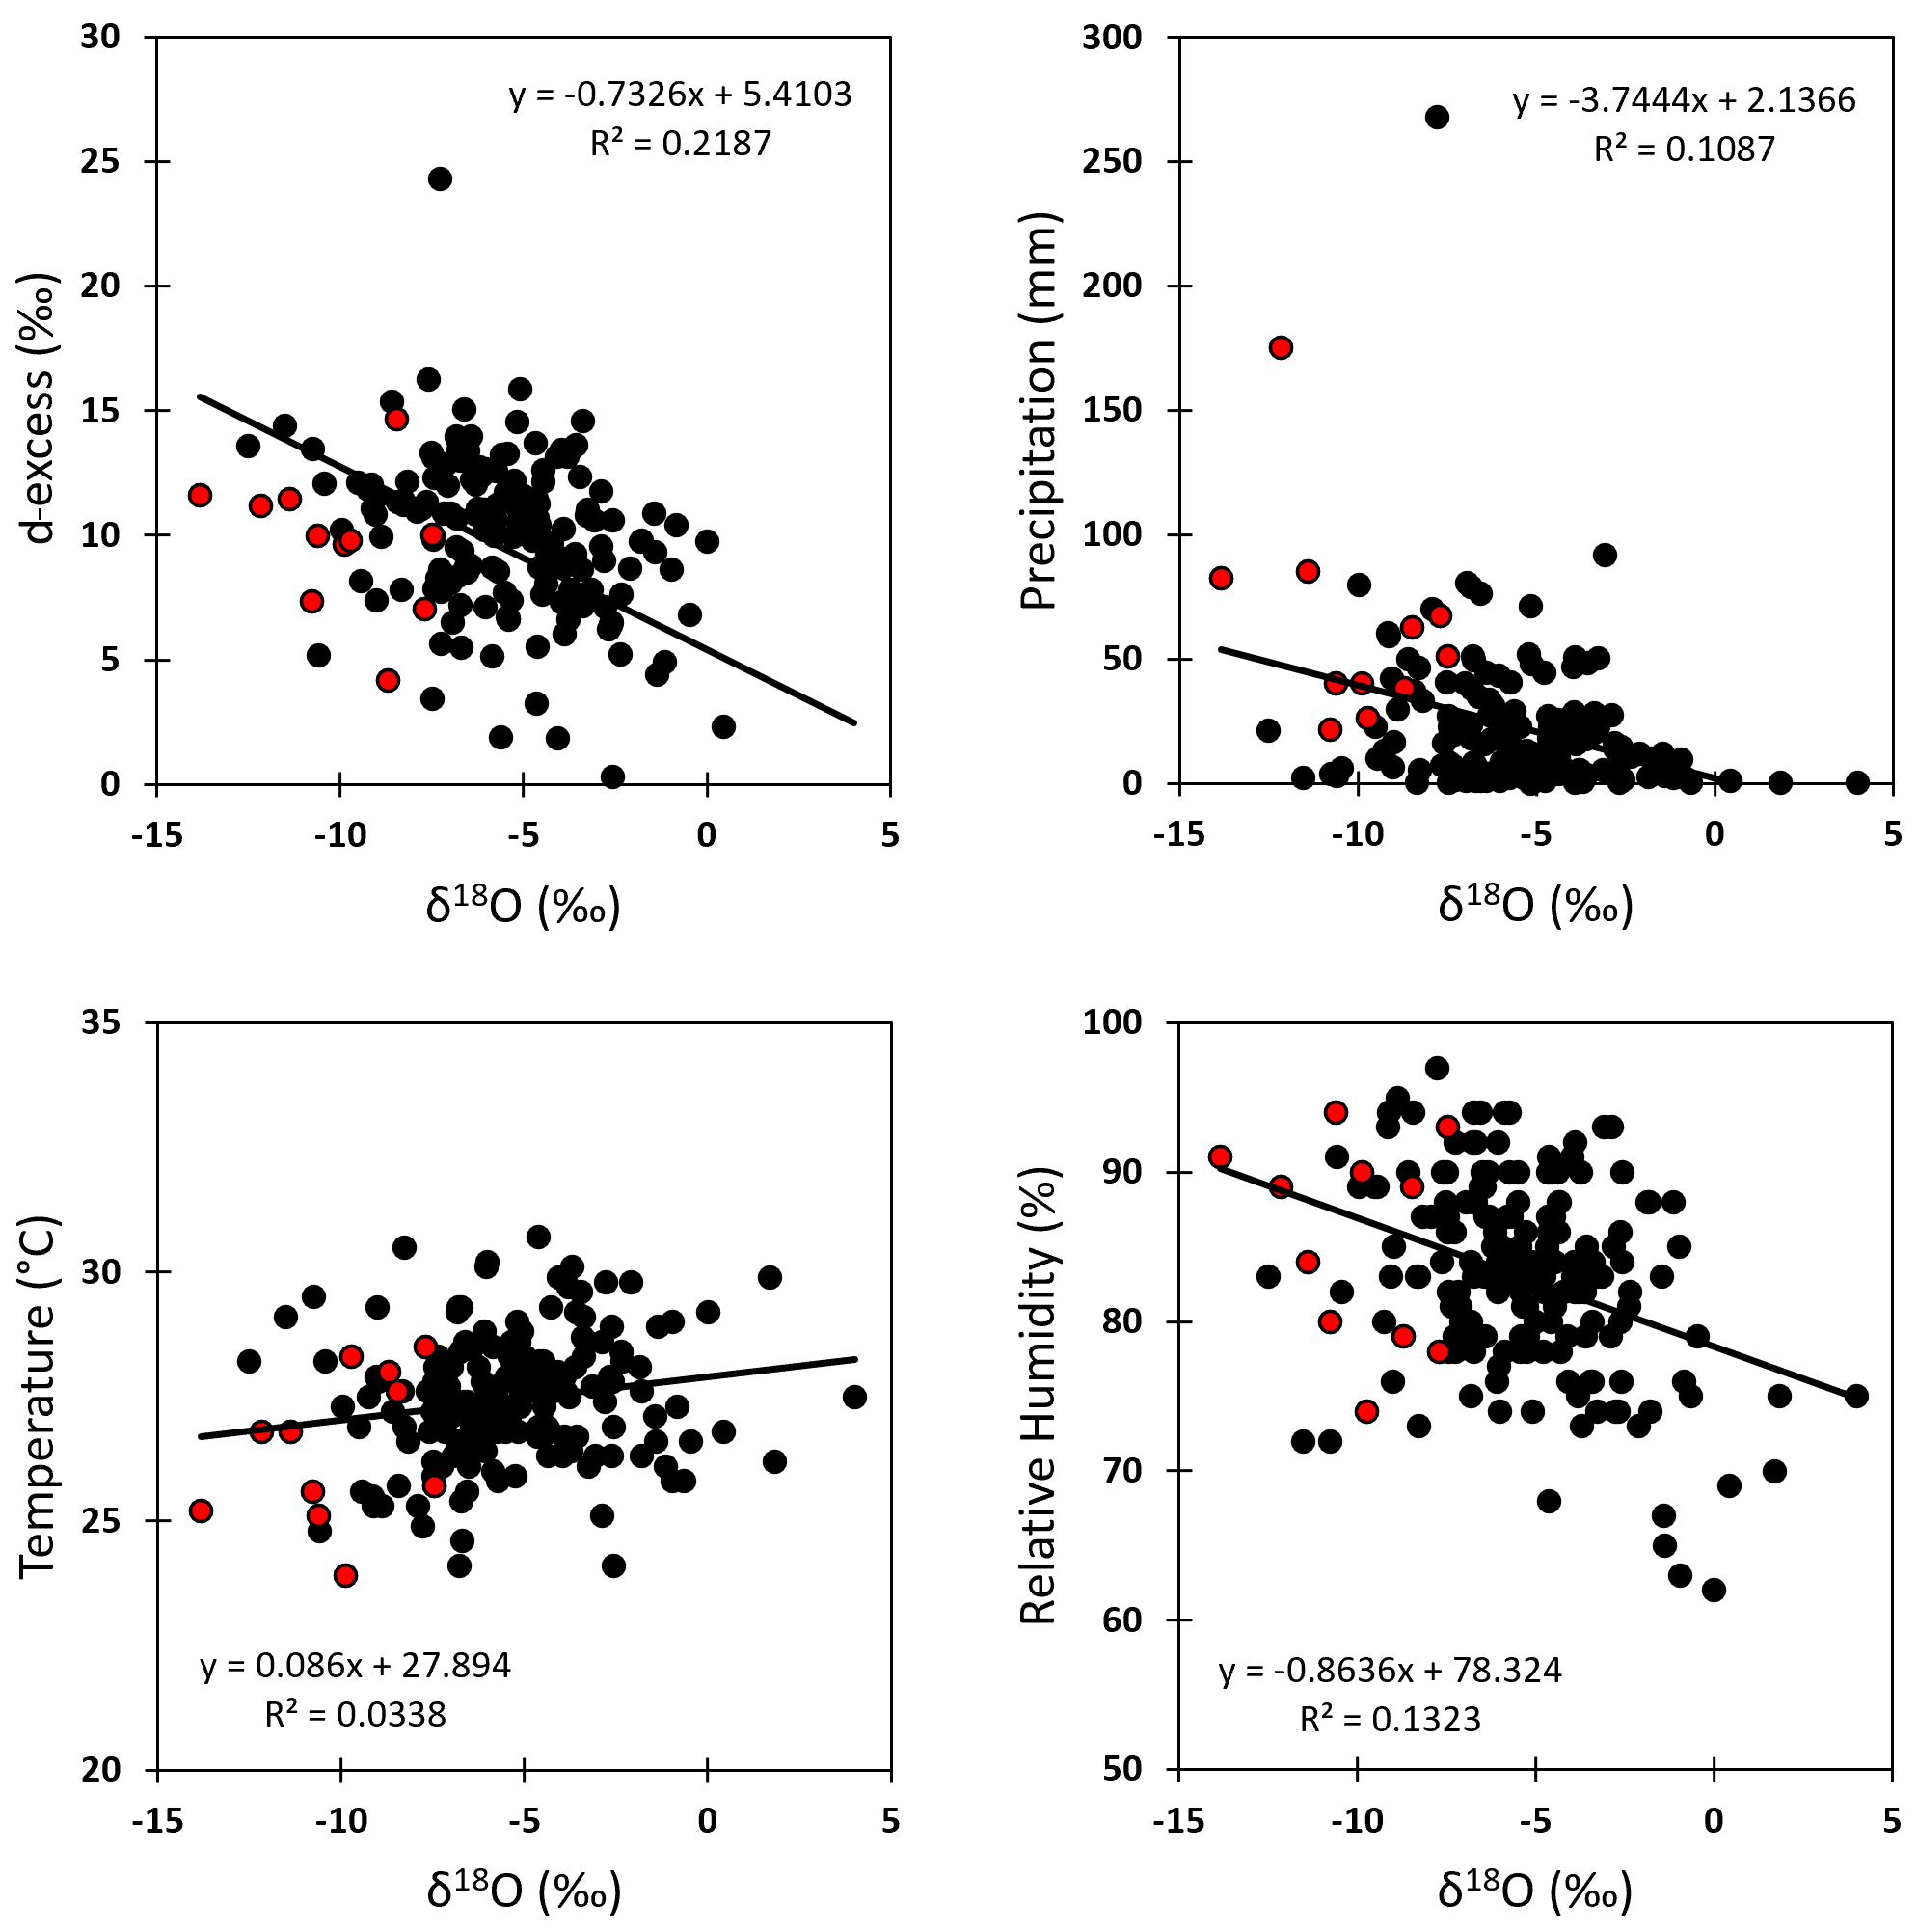
Figure 4Correlations between daily δ18O values and daily values of d-excess, precipitation amount, temperature, and relative humidity. Linear regression line, correlation coefficient (R2), slope, and intercept are shown in each plot. Samples associated with a TC are shown in red similar to Fig. 5.
In order to assess meteorological controls on the isotopic composition of daily precipitation at Metropolitan Manila, we investigated the correlation between δ18O, daily precipitation amount, daily mean temperature, and daily mean relative humidity. Additionally, δ18O is compared to d-excess (n=187) (Fig. 4). We found that δ18O is weakly correlated to d-excess (R2=0.2187), precipitation amount (R2=0.1087), and relative humidity (R2=0.1323). No association is observed between δ18O and temperature (R2=0.0338).
Table 2Monthly average values of the 19-month time series of δ18O, δ2H, d-excess, and meteorological parameters (temperature and relative humidity). Precipitation values are reported as monthly totals.

In order to get further insights into the seasonal variations, we also calculated the average values for each month in the time series for every isotopic and climatic parameter, while rainfall is reported as monthly totals (Table 2). δ18O is relatively low during the summer months, for instance with −7.29 ‰ in September 2014 compared to the months of winter and spring with −0.53 ‰ in April 2014 or −0.66 ‰ in February 2015. Similarly, the monthly rainfall total is less in winter and spring with 19.2 mm in March 2014 and 29.2 mm in January 2015 compared to the summer months such as July and August 2014 with 455.4 and 420.7 mm, respectively. As mentioned before regarding the daily measurements, we also observe on the monthly scale conditions which are more humid in the summer. We investigated the relationship between the isotopic composition of precipitation (δ18O) and meteorological parameters (total monthly rainfall, average relative humidity, and temperature) on a monthly scale. δ18O and δ2H are strongly correlated (Pearson correlation coefficient) with r=0.96 (n=18, p value , and 99 % confidence level), whereas the relationship between δ18O and d-excess yields an r value of −0.64 (n=18, p value =0.003). A clear negative correlation was determined between δ18O and precipitation with (n=18, p value =0.002) and between δ18O and relative humidity with (n=18, p value ). δ18O and temperature are not correlated with r=0.04 (n=18, p value =0.87).
A relationship between isotopic value and the distance of the TC towards the sampling site was found. The TCs' distance of up to 500 km to sampling site and the precipitation isotope value are correlated with r=0.55 (n=16, p value , and 99 % confidence level). This relationship weakens with an increase in the distance from the sampling site: a distance of 500 to 1000 km yields an r value of 0.2 (n=19, p value =0.41); the distance of 1000 to 1500 km yields an r value of 0.18 (n=24, p value =0.40); and a 1500 to 2000 km distance results in an r value of 0.1 (n=21, p value =0.69).
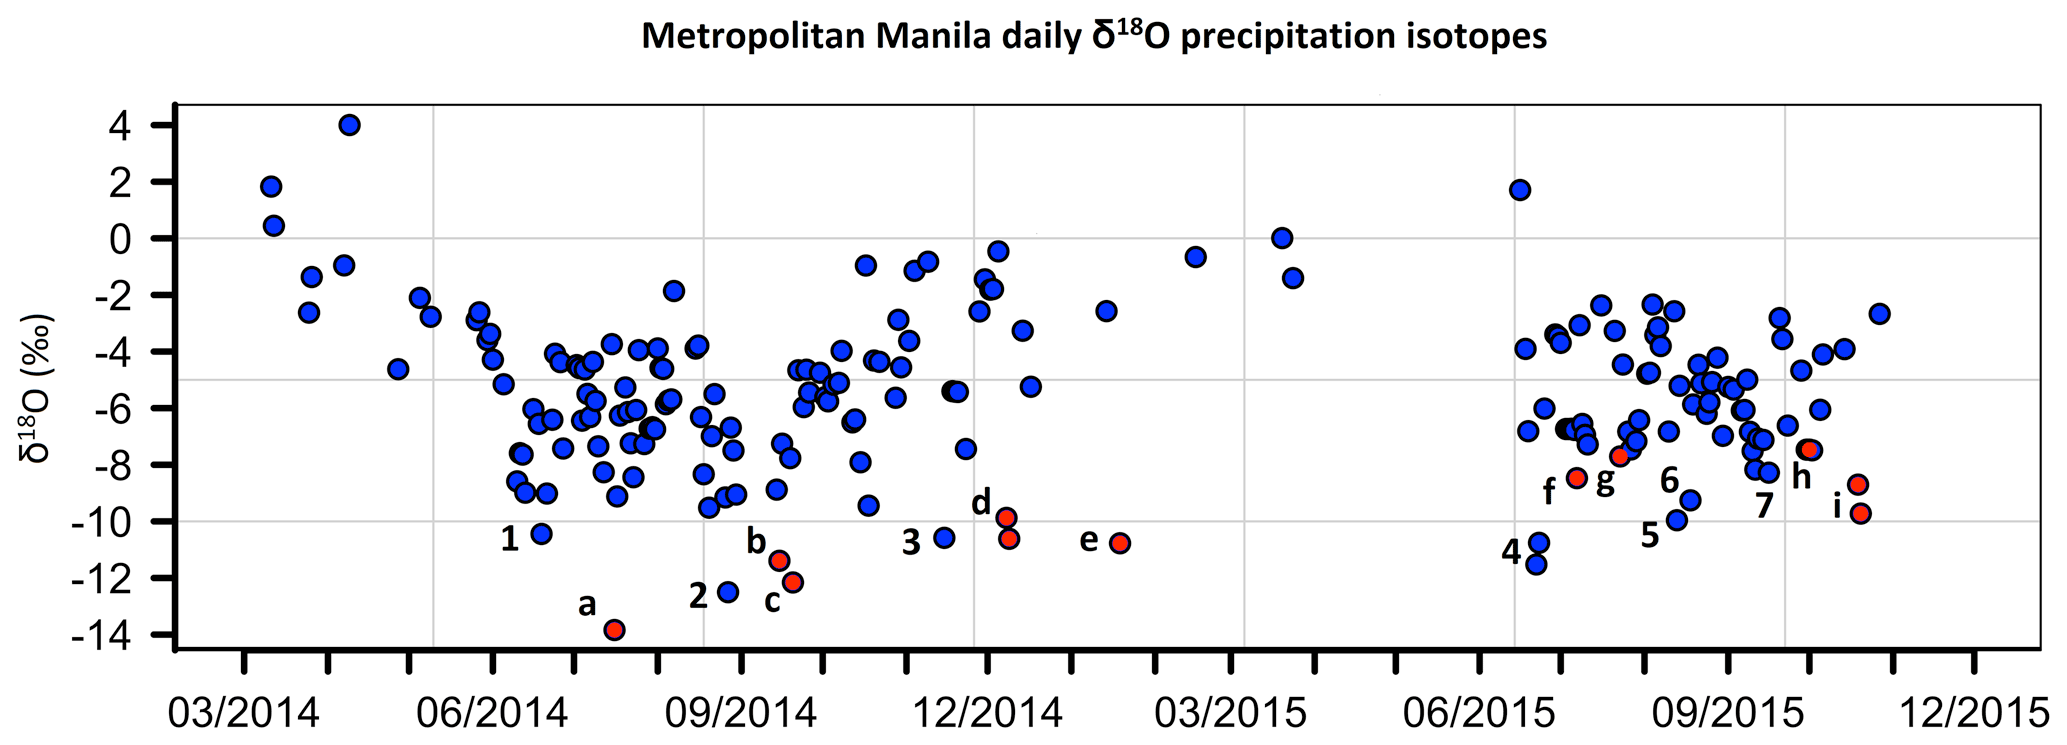
Figure 5Complete time series of 186 precipitation samples taken between 10 March 2014 and 27 October 2015. δ18O data points associated with TC activity are coloured in red. Other anomalously low δ18O values were investigated using IMERG satellite precipitation data. Point a: Rammasun, 16 July 2014, −13.84 ‰, 83 mm. Point b: Kalmaegi, 15 September 2014, −11.39 ‰, 85 mm. Point c: Fung-Wong, 20 September 2014, −12.16 ‰, 175 mm. Point d: Hagupit, 8–9 December 2014, −9.88 ‰, −10.62 ‰, 40 mm. Point e: Mekkhala, 19 January 2015, −10.77 ‰, 22 mm. Point f: Linfa, 7 July 2015, −8.5 ‰, 63 mm. Point g: Twelve, 23 July 2015, −7.7 ‰, 68 mm. Point h: Mujigae, 1 October 2015, −7.5 ‰, 51 mm. Point i: Koppu, 19–20 October 2015, −8.7 ‰, −9.72 ‰, 38, 26 mm. Point 1: storm passing by, 19 June 2014, −10.44 ‰, 6 mm. Point 2: large rain areas, 27 August 2014, −12.5 ‰, 21 mm. Point 3: storm passing by, 15 November 2014, −10.58 ‰, 3 mm. Point 4: large rain areas, 22–23 June 15, −10.76 ‰, −11.52 ‰, 2, 4 mm. Point 5: heavy rainfall, 13 August 2015, −9.96 ‰, 80 mm. Point 6: heavy rainfall, 18 August 2015, −9.26 ‰, 13 mm. Point 7: local convection, 16 September 2015, −8.28 ‰, 47 mm. Please note that the date format in this figure is month/year.
3.2 Precipitation isotope evolution during TC events
Overall, precipitation isotopes associated with TCs mark the lower range of δ18O values during the study period. Especially during the 2014 season, precipitation with low isotope values mostly occurred throughout the passage of TCs. For instance, Rammasun led to the lowest δ value (Fig. 5, point a, −13.84 ‰) of the whole study period, while other TCs such as Fung-Wong (Fig. 5, point c, −12.16 ‰), Kalmaegi (Fig. 5, point b, −11.39 ‰), or Hagupit (Fig. 5, point d, −9.88 ‰) caused other negative excursions in isotopic values. The 2015 season is characterized by on average a slightly higher isotopic enrichment during the summer months with heavy rainfall. Nonetheless, a similar noticeable isotope signal is visible with low δ18O values clustered along the lower end of the sample range, for example, caused by Linfa (Fig. 5, point f, −8.5 ‰) or Koppu (Fig. 5, point i, −8.7 ‰). The other TCs that occurred during the study period and were investigated by us were Mekkhala (Fig. 5, point e, −10.77 ‰), Twelve (Fig. 5, point g, −7.7 ‰), and Mujigae (Fig. 5, point h, −7.5 ‰). However, relatively negative isotope samples (Fig. 5) also originated from non-TC rainfall systems. Those events are discussed below.
Out of the nine TCs that occurred within a 500 km radius from the sampling site, Rammasun and Kalmaegi left clearly observable, distinct isotopic signatures during their approach and dissipation, which we will therefore present in more detail in the next paragraphs. Typhoon Hagupit (Fig. 5, point d) similarly led to a clear isotopic evolution pattern during its time of occurrence in the Philippines and is shown in the Supplement (Sect. S1).
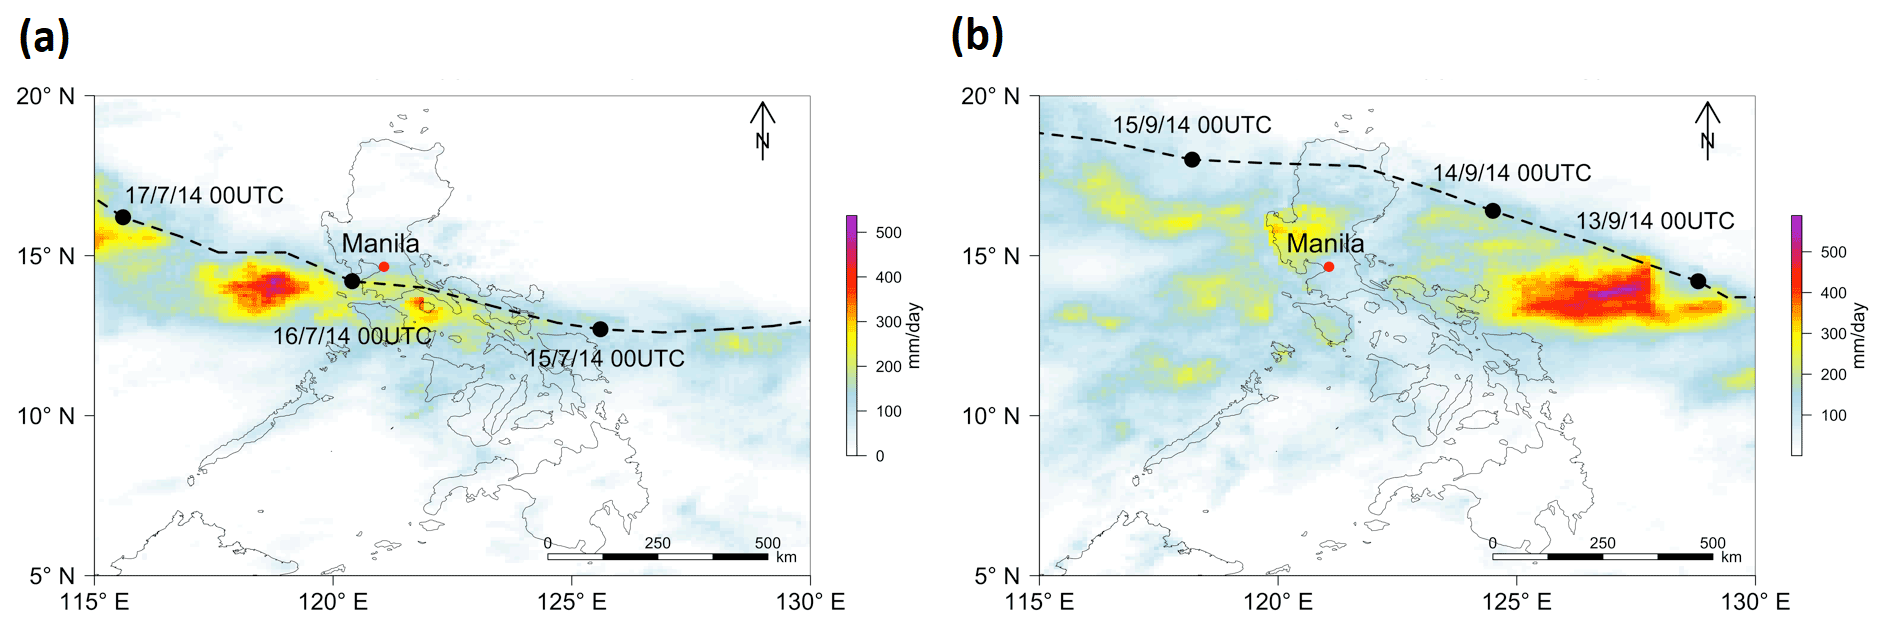
Figure 6Accumulated precipitation from IMERG satellite data and TC tracks from IBTrACS for (a) Rammasun with precipitation accumulation for 14–17 July 2014 and (b) Kalmaegi with accumulated precipitation for 12–15 September 2014. Made with base layers from Natural Earth. Please note that the date format in this figure is day/month/year.
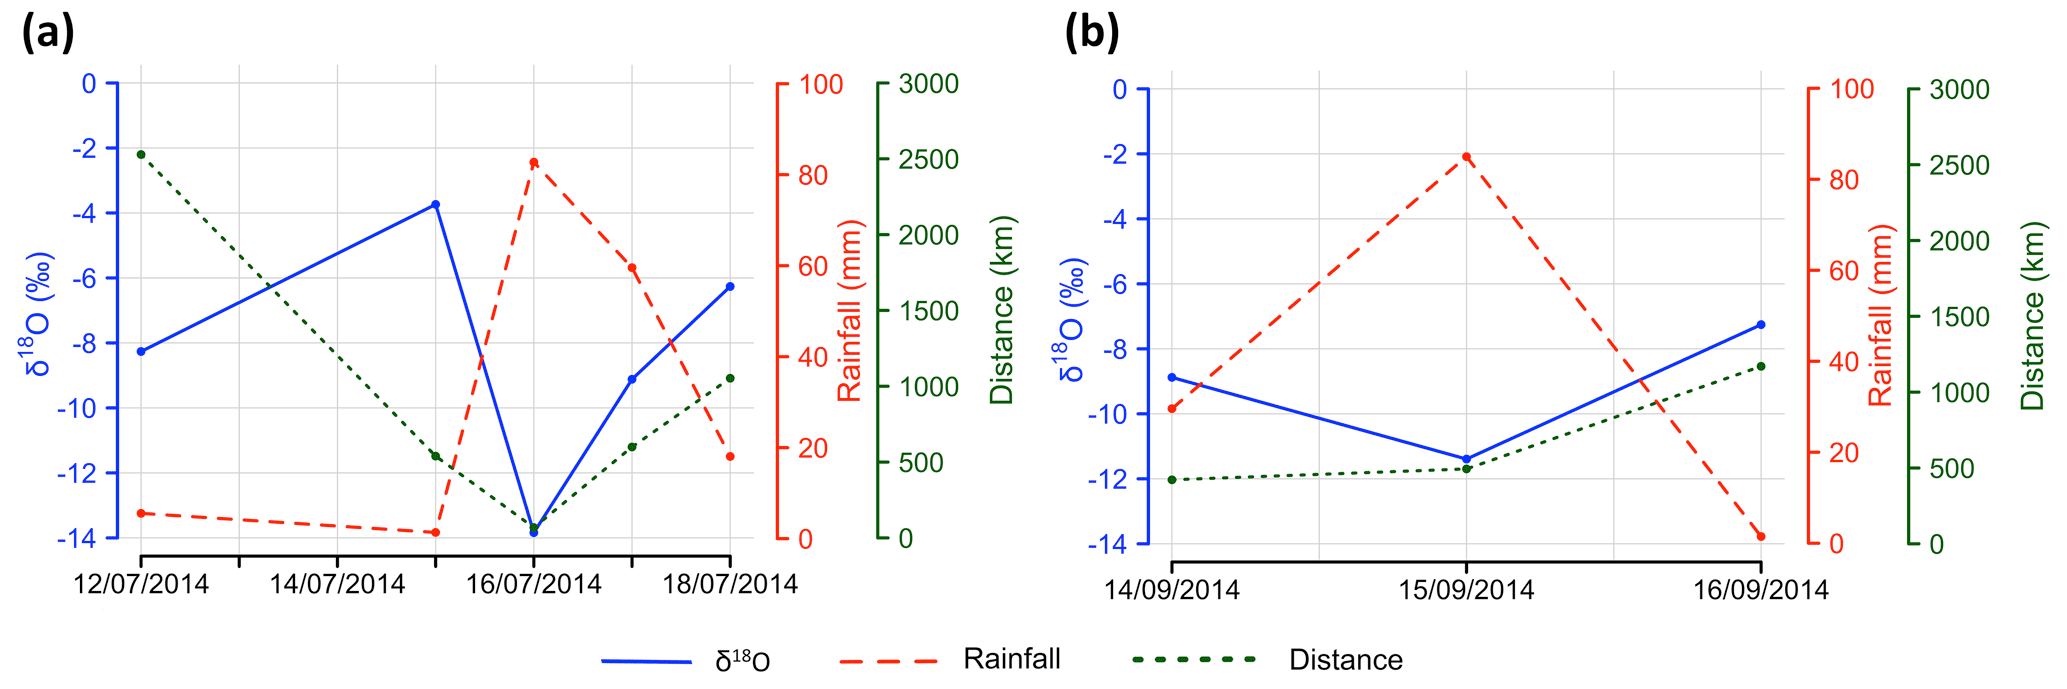
Figure 7Isotopic signature from TCs during their passage to the Metropolitan Manila sampling site. δ18O (blue), distance from the storm's centre to sampling location (green), and daily rainfall amount (red) for (a) Rammasun and (b) Kalmaegi. Please note that the date format in this figure is day/month/year.
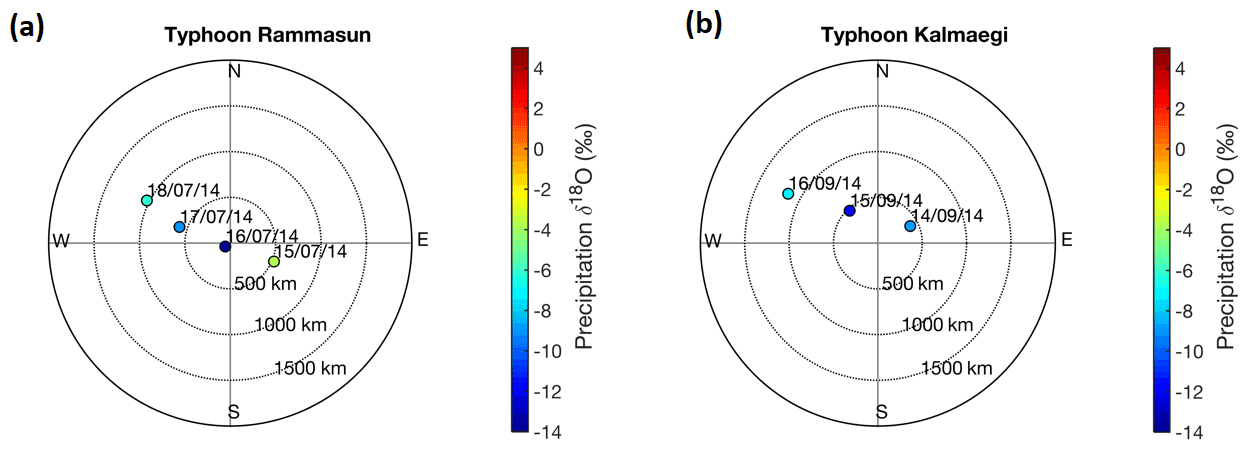
Figure 8Spatiotemporal evolution of δ18O isotopes. Centred on the Metropolitan Manila collection site, different radii provide information on distance between the storm's centre to Metropolitan Manila. δ18O values are colour-coded. (a) Rammasun.(b) Kalmaegi. Please note that the date format in this figure is day/month/year.
Typhoon Rammasun's rainfall intensity based on the IMERG precipitation data together with its track from IBTrACS is shown in Fig. 6a. Typhoon Rammasun stands out in our study period, as it moved straight towards the National Capital Region of the Philippines, resulting in a direct hit. Rammasun, locally named Glenda, made landfall in the Bicol Region of southern Luzon on 15 July, with wind speeds of about 160 km/h. On 16 July, it passed south of Metropolitan Manila, 50 km from our sampling site, with maximum winds of 130 km/h, gradually losing strength over land. As Rammasun approached on 15 July, the precipitation exhibited a relatively high δ18O value of −4 ‰, while rainfall was weak (Fig. 7a). On 16 July, the δ18O value shifted to −13.84 ‰, while the typhoon's track was the closest to our sampling site, and rainfall amount was high. As Rammasun moved away, precipitation isotopes became more positive, and the rainfall amount decreased. The characteristic isotopic evolution with time related to Rammasun's distance and rainfall intensities can be seen in Fig. 8a, where the different radii indicate the distance to the sampling site, and the strong isotopic depletion observed on 16 July is also evident. As Rammasun with its storm centre tracked towards the northwest and away from Metropolitan Manila, our precipitation samples were relatively isotopically enriched for the following 2 d, namely −9.12 ‰ on 17 July and ‰ on 18 July.
Typhoon Kalmaegi, locally named Luis, was the first typhoon to make landfall in the Philippines, 2 months after Rammasun. Kalmaegi reached typhoon intensity on 13 September, making landfall the following day in northern Luzon, with maximum wind speeds of about 120 km/h. Kalmaegi tracked relatively far away from the sampling site (about 350 km), but the accumulated rainfall it produced was centred south of the track, placing it considerably closer to the National Capital Region (Fig. 6b). Despite the distance of the eye from the sampling site, a characteristic isotopic pattern was visible, with the most negative δ18O value of −11.39 ‰ on 15 September, coincident with the highest rainfall amount (Fig. 7b). The following day, δ18O values returned to higher values with the increase in distance from the eye. This is also seen in a spatial representation in Fig. 8b, visualizing the track of Kalmaegi and the respective δ18O values. Kalmaegi was first approaching the sampling site on 14 September and passed away on 15 and 16 September. The lowest δ18O value was observed on 15 September and is indicated in the figure in dark blue.
4.1 Stable isotopes of precipitation – a possible tracer for TCs
As stable water isotopes fractionate during the physical process of evaporation and condensation, they serve as effective tracers in the hydrological cycle (Dansgaard, 1964; He et al., 2018; Risi et al., 2008; Tremoy et al., 2014). Here, we have demonstrated that stable water isotopes can possibly be used to identify TC activity in the Southeast Asian region by excursions in δ18O, providing evidence and supporting the hypothesis that TCs may leave a clear isotopic signal in the Philippines. The strong isotopic depletion is due to high condensation efficiencies in cyclonic convective rainbands, leading to extensive fractionation. This is particularly pronounced in intense, large-scale TCs (Lawrence, 1998; Lawrence and Gedzelman, 1996). In the previous section, we presented our findings of precipitation isotope ratios associated with typhoon activities affecting Metropolitan Manila during the study period of March 2014 to October 2015. Based on our time series, we therefore argue that for the Philippines, the lowest measured isotope value likely indicates the occurrence of a TC, such as is the case for Typhoon Rammasun (Fig. 5). Similarly, other anomalously low δ18O values at our site are caused by TCs making landfall or passing by.
Individual TCs (Rammasun and Kalmaegi) were characterized by consistent isotopic excursions to very negative δ18O values in a range of up to −9 ‰ compared to the mean isotopic value of −5.29 ‰ (Figs. 7 and 8). A TC approaching the sampling site had relatively higher isotope values than at its later stages when it was closest to the site in Metropolitan Manila. When at its closest, strong rainfall together with increased fractionation depleted precipitation isotopes, leading to a distinct drop in isotope value. Such a strong negative isotopic shift in precipitation has been previously observed in other regions (Fudeyasu et al., 2008; Lawrence and Gedzelman, 1996; Munksgaard et al., 2015; Xu et al., 2019). As the TC moved away and rainfall intensities weakened, δ18O in precipitation became again more positive, likely due to evaporative effects (Munksgaard et al., 2015; Xu et al., 2019).
As the strongest TC in terms of wind speeds, damage costs, and fatalities, Typhoon Rammasun reduced δ18O values most during our study period, to −13.84 ‰. Similarly, Typhoon Kalmaegi led to extensive damage and caused a significantly negative excursion in precipitation of δ18O values to −11.39 ‰, suggesting that the lowest isotope values might indicate the occurrence of the strongest TC at that time at our site in the Philippines. We note that our isotopic measurements are similar to observations elsewhere. For example, the range of δ18O values caused by Typhoon Shanshan affecting the subtropical Ishigaki Island was −6 ‰ to −13 ‰ (Fudeyasu et al., 2008); Tropical Cyclone Ita led to a range of −4.8 ‰ to −20.2 ‰ in northeastern Australia (Munksgaard et al., 2015); several TCs which made landfall in Texas resulted in isotope values from −3.9 ‰ to −14.3 ‰ (Lawrence and Gedzelman, 1996); and hurricanes that affected Puerto Rico and southern Texas were found to deplete δ18O values up to −18 ‰ (Lawrence, 1998). The lowest value resulting from Typhoon Phailin on the Andaman Islands was reported to be −5.5 ‰, and Cyclone Lehar depleted the precipitation sample to −17.1 ‰ (Chakraborty et al., 2016). For TCs within a distance of up to 500 km from the sampling site at the University of the Philippines Diliman in Metropolitan Manila, we measured an isotopic range of −7.7 ‰ (Typhoon Koppu) to −13.84 ‰ (Typhoon Rammasun). Despite the overall comparability to our measurements, differences exist. The lowest values observed in some studies are considerably more negative than at our site (Lawrence, 1998; Munksgaard et al., 2015). However, we attribute these differences to a variety of features, such as the specific climatic condition at each site and differences in temperature, humidity, and altitude or latitude, which are likely contributing factors to the observed isotopic variation by altering isotopic fractionation. Further, rainout history, the location of typhoon tracks, topography, and respective strength of each TC as well as its distance to the sampling site most likely have a significant influence as well (Fudeyasu et al., 2008; Good et al., 2014; Munksgaard et al., 2015; Xu et al., 2019).
We used IMERG satellite precipitation data to assess why other very low isotopic excursions occurred on various days (Fig. 5). IMERG data with their fine spatiotemporal resolution allow for the identification of convective rainfall areas and the passage of TCs and other rain systems (Fig. 6). Our analysis shows that precipitation events with anomalously low isotope signals unassociated with TCs are largely related to local, strong convective rainfall events or large-scale and slow-moving rain areas passing over the National Capital Region. Therefore, the degree of convection is responsible for the other observed low δ18O outliers that are not related to cyclone rainfall, as strong convection and long stratiform rainfall leads to intense fractionation (He et al., 2018; Risi et al., 2008; Tremoy et al., 2014). Contrarily, we speculate that the more positive isotope values clustering along the higher end of the sample spectrum around 0 ‰ are associated with local, short convective rainfall events and light-intensity rain as confirmed with IMERG satellite precipitation data. Additionally, the PAGASA rain gauge data indicate that rainfall amounts are very low during days with such very enriched isotope samples, such as 0.3 mm/d for the highest recorded sample of 4 ‰ on 9 April 2014. Interestingly, TCs at our site were found to be related to low isotope values together with high rainfall amounts (Fig. 5), while the majority of other low isotopic values unassociated with TCs were characterized by on average lesser rainfall amounts. This possibly indicates that TCs in the Philippines, besides using for instance modern-day satellite or radar data, can be detected using these two parameters, i.e. strong isotopic depletion coupled with high rainfall amounts.
The aforementioned local convective precipitation events have the potential to induce a signal of very negative δ18O, which is not related to TC activities. We therefore label such a signal as a “false non-TC signal”, as it is induced by non-TC rainfall. This results in the fact that TCs occurring during our study period do not entirely cluster along the lowest range of isotope values as seen in Fig. 5. Nevertheless, Typhoon Rammasun caused a clear drop in δ18O and stands out in the dataset. This might be the case because Rammasun's track and heavy rainfall come in closest proximity (50 km) to the sampling site. Other TCs occurring within the 500 km radius did not lead to such a clear negative isotopic signature, likely because these typhoons did not pass the sampling site at all or because heavy rainfall occurred elsewhere within the TC rainfall system (see Sect. S2 in the Supplement for their tracks and accumulated rainfall areas). Some of these TCs have intense rainfall areas over other parts of the Philippines and are characterized by a variable track, likely influenced by land interactions. Land interaction reduces TC strength and can lead to rainout due to orographic effects induced by the north–south-oriented mountain ranges (Park et al., 2017; Xie and Zhang, 2012; Xu et al., 2019). Especially Typhoon Koppu rained out before making landfall and abruptly changed its track, instead of passing by Metropolitan Manila. Similarly, Typhoon Mekkhala's intense rainfall occurred along the eastern coasts before it started to dissipate. Evidently, due to these factors the isotope values associated with those TCs were not as negative as during Rammasun. Therefore, a TC, which is relatively far away from the sampling site, produces an isotope signal that is not as clear and as negative, thus averaging out between the other low values from rain systems unassociated with TC.
4.2 Drivers of isotopic variation at Metropolitan Manila
δ18O, δ2H, and the second parameter of d-excess all show seasonal variabilities and are influenced by several climatic factors, including precipitation amount, temperature, and relative humidity. The scale of their influence varies depending on daily or monthly values. The results indicate that δ18O on daily levels is not influenced by temperature, relative humidity, or precipitation amount (Fig. 2) as drivers of isotopic variability. Instead, we speculate that other processes, such as large-scale convection and processes at the moisture source region, might influence stable isotopes of precipitation at our study site (Conroy et al., 2016; He et al., 2018; Kurita, 2013). Interestingly, δ18O is not affected by precipitation amount on short timescales (Fig. 4), which has also been previously confirmed in other tropical regions, suggesting that the tropical amount effect is not reflected on daily timescales (Belgaman et al., 2016; Dansgaard, 1964; He et al., 2018; Kurita et al., 2009; Marryanna et al., 2017; Permana et al., 2016). However, comparing monthly δ18O to δ2H and d-excess and to monthly average precipitation, relative humidity, and temperature, the results are clearly different (Table 2). These monthly observations show close relationships with each other; especially δ18O and precipitation amount are linked (see Sect. 3.1). The close relationship between these two parameters can be attributed to the tropical amount effect (Aggarwal et al., 2012; Bowen, 2008; Conroy et al., 2016). The relatively close relationship with between monthly δ18O and monthly total precipitation might be likely due to the influence of regional convective activities on the isotopic composition of precipitation (Bony et al., 2008; He et al., 2018; Moerman et al., 2013; Risi et al., 2008).
4.3 Distance of TCs from Metropolitan Manila
Our observations provide details on the spatial distance from the collection site towards TCs' centres, as our findings indicate that the distance from the storm's centre to the sampling site impacts the isotopic value (see Sect. 3.1). This suggests that a TC more than 500 km away from the sampling site has no influence on precipitation isotopes (Munksgaard et al., 2015). Thus, the closer the TC is to the sampling site, the more negative the isotope signal and the larger the δ change are. This relationship might provide information on storm structure and intensity, as the intensity increases with the proximity of the TC to the sampling location. We thus confirm that the isotope value at our location is a function of the closest approach of the storm's centre to the sampling site (Lawrence and Gedzelman, 1996).
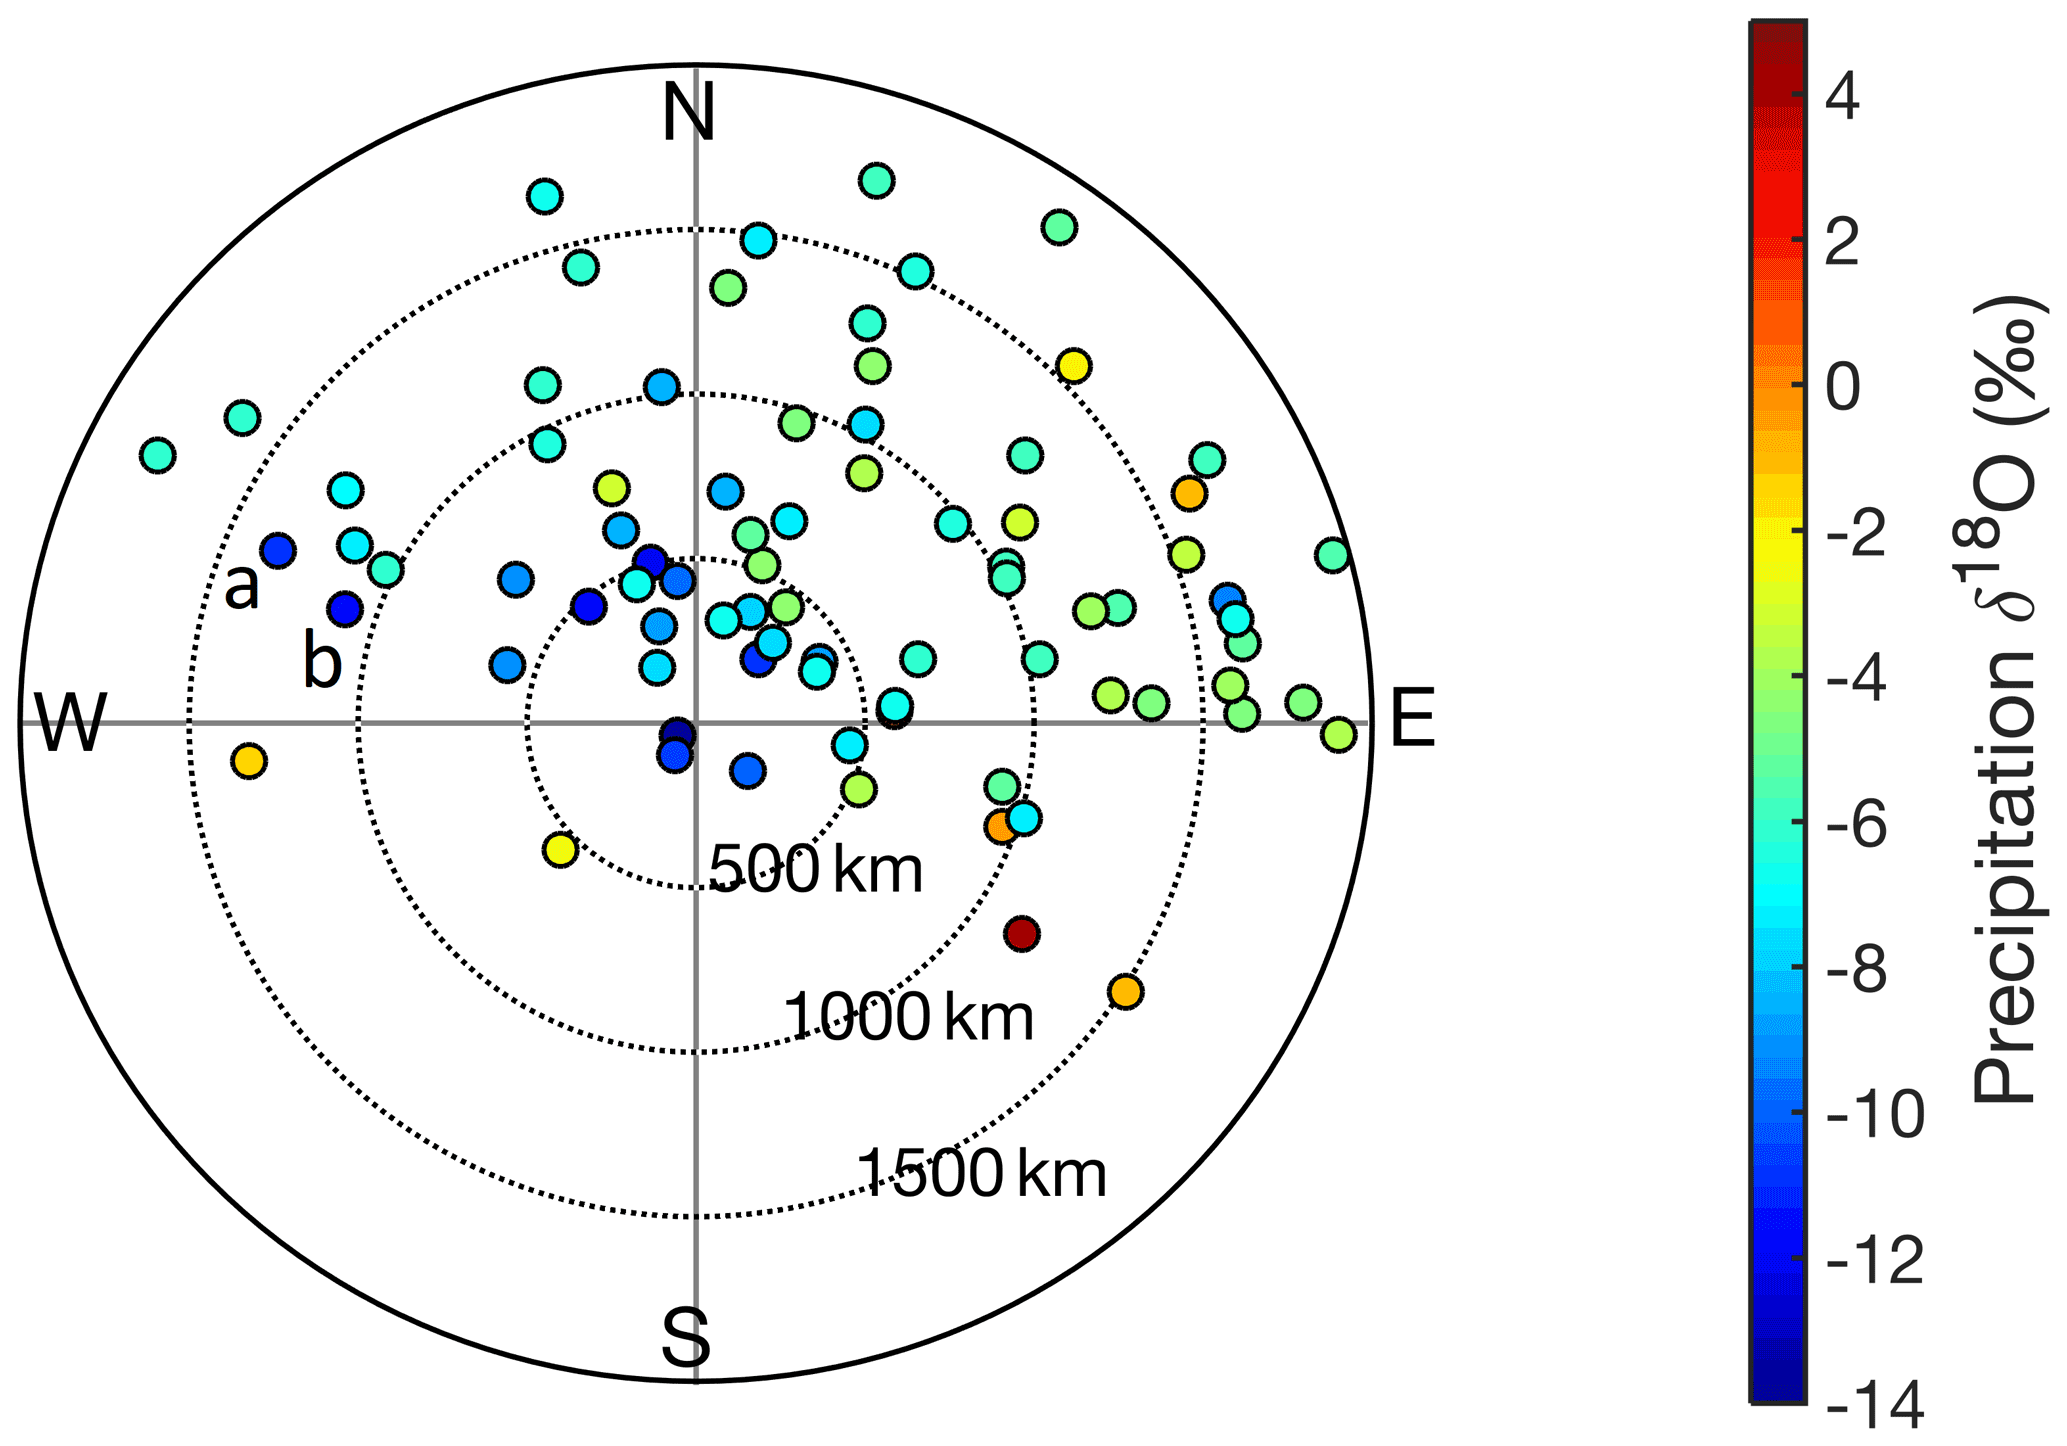
Figure 9Spatiotemporal variation of isotopes related to TC activity within 2000 km, with different radii indicating the distance towards Metropolitan Manila. δ18O values are colour-coded.
Figure 9 displays all the precipitation samples associated with TC presence and activities within a 2000 km radius from Metropolitan Manila and further highlights the relationship between distance and isotopic depletion, additionally providing a spatial indication of a TC's quadrants and its tracks relative to the location of the sampling site. The strongest depletion occurs within the 500 km radius. However, two relatively negative outliers are located within a 1000 to 1500 km radius in the northwest quadrant (see points a and b in Fig. 9). These two samples were taken during the passage of Tropical Storm Kujira on 22 and 23 June 2015 (Fig. 5), which was more than 1000 km away from Metropolitan Manila travelling east along the coast of Vietnam as seen with IBTrACS data. We investigated these two samples with IMERG satellite precipitation data and identified them as a part of a mesoscale system, with strong convective cells delivering intense rainfall, leading to distinct isotopic depletion and inducing a false non-TC signal of a very negative δ18O value, which is not related to TC activity.
4.4 Cyclone track's rainfall intensity
IMERG satellite precipitation data also reveal that the highest rainfall intensities occur at the left side of the TC track for all the TCs within the 500 km radius, except for Hagupit and Mekkhala, which are more complex cases (Fig. 6a and b and Supplement Sects. S1 and S2). This is in contrast to the results from Villarini et al. (2011), who found that the largest rainfall accumulation appeared on the right side of the hurricane tracks. They also noted that large rainfall amounts occurred far away from the storm's track, which we can confirm and quantify with our observations. The largest rainfall totals vary in a range of 50 to 150 km away from the storm's centre depending on the TC. For Kalmaegi the intense rainfall areas are up to 150 km away from the storm's centre. These areas with the highest rainfall totals should most likely coincide with the most negative isotope value, indicating that the strongest depletion occurs in the outer cyclonic rainbands. This is consistent with previous findings (Gedzelman et al., 2003; Lawrence and Gedzelman, 1996; Munksgaard et al., 2015). However, Fudeyasu et al. (2008) observed the highest isotope values in the inner eye wall, i.e. in close proximity to the storm's centre. We could not investigate this further, as no TC passed by our site in a distance of about 20 km, which is the size of a typical typhoon's eye (Weatherford and Gray, 1988).
4.5 Implications for paleoclimate studies
Isotope proxies from paleoarchives such as tree rings and speleothems have been utilized to reconstruct past cyclone activities (Frappier, 2013; Frappier et al., 2007; Miller et al., 2006; Nott et al., 2007). For instance, stalagmites yielded a record of weekly temporal resolution with negative isotopic excursions related to TC activity (Frappier et al., 2007). Such a high temporal resolution from stalagmites makes our in situ measurements very comparable, highlighting the potential to use both in conjunction. Similarly, high-resolution tree-ring isotope analysis identified the occurrence of Hurricane Ivan and Hurricane Frances in 2004, which both resulted in the lowest observed precipitation isotope values for that year (Li et al., 2011). Nevertheless, it is important to consider possible limitations at the study site that arise in paleotempestology, such as sea level change or the disruption of sedimentological records through floods or tsunamis. These need to be evaluated when comparing precipitation isotopes related to TCs with other proxy records such as speleothems and coastal deposits and when choosing the study area (Oliva et al., 2017). However, the aforementioned paleotempestology studies suffer from uncertainty regarding parameters such as TC intensity and distance to the storm's centre affecting the isotope signal. Our study provides further information on these parameters, as we hypothesize that immediate proximity of a TC results in very low δ18O values. Therefore, we might aid with a better interpretation of paleoarchives. Moreover, these studies are limited in number and only focus on a few regions affected by TCs, such as Central America and the southeastern USA (Frappier et al., 2007; Miller et al., 2006). However, more paleotempestology studies investigating paleoarchives related to typhoon footprints covering different regions and countries would provide a better understanding of past TC activity, ultimately resulting in better and more accurate climate reconstructions. TC projections related to climate change could also be improved, which is especially relevant for decision makers dealing with TC-related impacts and damages. Our in situ isotope measurements provide baseline data input in an understudied tropical region, providing isotopic data of TC occurrence and quantifying the isotopic depletion associated with TC activity. Further, our 19-month dataset suggests that the lowest measured isotope value at the Philippines study site is associated with TC activity, resulting in the distinct negative isotopic shift in the time series (Fig. 5). As rainout history, topography, distance of the track, or rainfall unassociated with TCs can induce a weak or false non-TC signal, it is important to choose stalagmites or trees as archives based on their location, ideally covering a spatial gradient, thus capturing a TC in its full size.
Our study demonstrated that a strong, high-energy TC with a track directly approaching and hitting the sampling site leads to a clear isotopic signal in a time series in the Philippines. If the TC is further away, such as more than 500 km from the site, or heavy TC rainfall occurred elsewhere prior of making landfall, the signal is not as clear and might average out between other rainfall events. Other strong convective rainfall events unassociated with TCs may result in similarly low isotope values, and we label these as a weak or false non-TC signal. Therefore, the distance of a TC to the sampling site is a key factor in influencing the isotope signal, and such a spatial component needs to be considered when interpreting the isotope signal. However, a longer time series isotope record would help to better constrain controlling factors, such as the influence of topography on high-energy TCs. To what extent mountain ranges and low-elevation coastal areas shape the TC-induced isotope signal needs further investigation. Based on our findings we conclude that the location of precipitation sample collection needs to be chosen strategically. Ideally, several rainwater collection stations should be operated, covering a wide geographical range such as stretching from northern Luzon to its south. With such a spatial-gradient coverage, a TC would likely be captured in its full size. Consequently, we aim to expand our time series spatially and temporally.
Our dataset is the first of such a record in the Philippines and provides much needed data in scarcely sampled Southeast Asia. It can be used as a baseline in paleotempestology studies reconstructing past TC history, in conjunction with tree-ring and speleothem datasets, as our data suggest that for Metropolitan Manila the lowest measured isotope value is caused by typhoon activity. A higher precipitation sampling frequency on sub-daily levels at several locations would yield more detailed constraints on TC parameters such as storm structure, which we aim to realize in the future.
The underlying research data can be accessed via the Supplement, as well as in Knapp et al. (2010a, https://doi.org/10.7289/V5NK3BZP) and Huffman et al. (2019, https://doi.org/10.5067/GPM/IMERGDF/DAY/06).
The supplement related to this article is available online at: https://doi.org/10.5194/nhess-22-213-2022-supplement.
DJ analysed the data and wrote the manuscript. BXY contributed to the data analysis and improved the manuscript. ADS conceived the idea and reviewed and improved the manuscript. SH provided advice and reviewed and improved the manuscript. DLMC and FPS collected the precipitation samples and improved the manuscript. NFG reviewed and improved the manuscript.
The contact author has declared that neither they nor their co-authors have any competing interests.
This research was supported by the Earth Observatory of Singapore (EOS) via its funding from the National Research Foundation Singapore and the Ministry of Education of Singapore under the Research Centres of Excellence initiative. This work comprises EOS contribution no. 422. This study is also the part of the IAEA Coordinated Research Project (CRP code: F31004) on “Stable Isotopes in Precipitation and Paleoclimatic Archives in Tropical Areas to Improve Regional Hydrological and Climatic Impact Models” (IAEA Research Agreement no. 17980).
This research has been supported by the National Research Foundation Singapore and the Ministry of Education of Singapore.
Publisher's note: Copernicus Publications remains neutral with regard to jurisdictional claims in published maps and institutional affiliations.
This paper was edited by Paolo Tarolli and reviewed by four anonymous referees.
Aggarwal, P. K., Alduchov, O. A., Froehlich, K. O., Araguas-Araguas, L. J., Sturchio, N. C., and Kurita, N.: Stable isotopes in global precipitation: A unified interpretation based on atmospheric moisture residence time, Geophys. Res. Lett., 39, 1–6, https://doi.org/10.1029/2012GL051937, 2012.
Alojado, D. and Padua, D. M.: Costliest Typhoons of the Philippines (1947–2014), available at: https://www.typhoon2000.ph/stormstats/WPF_CostliestTyphoonsPhilippines_2015Ed.pdf (last access: 17 September 2019), 2015.
Belgaman, H., Ichiyanagi, K., Tanoue, M., and Suwarman, R.: Observational Research on Stable Isotopes in Precipitation over Indonesian Maritime Continent, J. Japanese Assoc. Hydrol. Sci., 46, 7–28, https://doi.org/10.4145/jahs.46.7, 2016.
Bony, S., Risi, C., and Vimeux, F.: Influence of convective processes on the isotopic composition (δ18O and δD) of precipitation and water vapor in the tropics: 1. Radiative-convective equilibrium and Tropical Ocean-Global Atmosphere-Coupled Ocean-Atmosphere Response Experiment, J. Geophys. Res.-Atmos., 113, 1–21, https://doi.org/10.1029/2008JD009942, 2008.
Bowen, G. J.: Spatial analysis of the intra-annual variation of precipitation isotope ratios and its climatological corollaries, J. Geophys. Res.-Atmos., 113, 1–10, https://doi.org/10.1029/2007JD009295, 2008.
Chakraborty, S., Sinha, N., Chattopadhyay, R., Sengupta, S., Mohan, P. M., and Datye, A.: Atmospheric controls on the precipitation isotopes over the Andaman Islands, Bay of Bengal, Sci. Rep.-UK, 6, 1–11, https://doi.org/10.1038/srep19555, 2016.
Cinco, T. A., de Guzman, R. G., Hilario, F. D., and Wilson, D. M.: Long-term trends and extremes in observed daily precipitation and near surface air temperature in the Philippines for the period 1951–2010, Atmos. Res., 145–146, 12–26, https://doi.org/10.1016/j.atmosres.2014.03.025, 2014.
Cinco, T. A., de Guzman, R. G., Ortiz, A. M. D., Delfino, R. J. P., Lasco, R. D., Hilario, F. D., Juanillo, E. L., Barba, R., and Ares, E. D.: Observed trends and impacts of tropical cyclones in the Philippines, Int. J. Climatol., 36, 4638–4650, https://doi.org/10.1002/joc.4659, 2016.
Conroy, J. L., Noone, D., Cobb, K. M., Moerman, J. W., and Konecky, B. L.: Paired stable isotopologues in precipitation and vapor: A case study of the amount effect within western tropical Pacific storms, J. Geophys. Res., 121, 3290–3303, https://doi.org/10.1002/2015JD023844, 2016.
Craig, H.: Isotopic variations in meteoric waters, Science, 133, 1702–1703, https://doi.org/10.1126/science.133.3465.1702, 1961.
Cruz, F. T., Narisma, G. T., Villafuerte, M. Q., Cheng Chua, K. U., and Olaguera, L. M.: A climatological analysis of the southwest monsoon rainfall in the Philippines, Atmos. Res., 122, 609–616, https://doi.org/10.1016/j.atmosres.2012.06.010, 2013.
Dansgaard, W.: Stable isotopes in precipitation, Tellus, 16, 436–468, https://doi.org/10.3402/tellusa.v16i4.8993, 1964.
Emanuel, K.: Increasing destructiveness of tropical cyclones over the past 30 years, Nature, 436, 686–688, https://doi.org/10.1038/nature03906, 2005.
Frappier, A. B.: Masking of interannual climate proxy signals by residual tropical cyclone rainwater: Evidence and challenges for low-latitude speleothem paleoclimatology, Geochem. Geophys. Geosyst., 14, 3632–3647, https://doi.org/10.1002/ggge.20218, 2013.
Frappier, A. B., Sahagian, D., Carpenter, S. J., González, L. A., and Frappier, B. R.: Stalagmite stable isotope record of recent tropic cyclone events, Geology, 35, 111–114, https://doi.org/10.1130/G23145A.1, 2007.
Fudeyasu, H., Ichiyanagi, K., Sugimoto, A., Yoshimura, K., Ueta, A., Yamanaka, M. D., and Ozawa, K.: Isotope ratios of precipitation and water vapor observed in typhoon Shanshan, J. Geophys. Res.-Atmos., 113, 1–9, https://doi.org/10.1029/2007JD009313, 2008.
Gedzelman, S., Lawrence, J., Gamache, J., Black, M., Hindman, E., Black, R., Dunion, J., Willoughby, H., and Zhang, X.: Probing Hurricanes with Stable Isotopes of Rain and Water Vapor, Mon. Weather Rev., 131, 1112–1127, https://doi.org/10.1175/1520-0493(2003)131<1112:PHWSIO>2.0.CO;2, 2003.
Good, S. P., Mallia, D. V., Lin, J. C., and Bowen, G. J.: Stable isotope analysis of precipitation samples obtained via crowdsourcing reveals the spatiotemporal evolution of superstorm sandy, PLoS One, 9, 3, https://doi.org/10.1371/journal.pone.0091117, 2014.
Gröning, M., Lutz, H. O., Roller-Lutz, Z., Kralik, M., Gourcy, L., and Pöltenstein, L.: A simple rain collector preventing water re-evaporation dedicated for δ 18O and δ2H analysis of cumulative precipitation samples, J. Hydrol., 448–449, 195–200, https://doi.org/10.1016/j.jhydrol.2012.04.041, 2012.
Guan, S., Li, S., Hou, Y., Hu, P., Liu, Z., and Feng, J.: Increasing threat of landfalling typhoons in the western North Pacific between 1974 and 2013, Int. J. Appl. Earth Obs. Geoinf., 68, 279–286, https://doi.org/10.1016/j.jag.2017.12.017, 2018.
He, S., Goodkin, N. F., Jackisch, D., Ong, M. R., and Samanta, D.: Continuous real-time analysis of the isotopic composition of precipitation during tropical rain events: Insights into tropical convection, Hydrol. Process., 32, 1531–1545, https://doi.org/10.1002/hyp.11520, 2018.
Huffman, G. J., Bolvin, D., Braithwaite, D., Hsu, K., Joyce, R., Kidd, C., Nelkin, E. J., Sorooshian, S., Tan, J., and Xie, P.: Algorithm Theoretical Basis Document (ATBD) of Integrated Multi-satellitE Retrievals for GPM (IMERG), version 4.6, Nasa, available at: https://pmm.nasa.gov/sites/default/files/document_files/IMERG_ATBD_V4.6.pdf (last access: 11 September 2019), 2017.
Huffman, G. J., Stocker, E. F., Bolvin, D. T., Nelkin, E. J, and Tan, J.: GPM IMERG Final Precipitation L3 1 day 0.1 degree x 0.1 degree V05, edited by: Savtchenko, A., Greenbelt, MD, Goddard Earth Sciences Data and Information Services Center (GES DISC) [data set], https://doi.org/10.5067/GPM/IMERGDF/DAY/06 (last access: 14 December 2018), 2019.
Knapp, K. R., Applequist, S., Diamond, H. J., Kossin, J. P., Kruk, M., and Schreck, C.: NCDC International Best Track Archive for Climate Stewardship (IBTrACS) Project, Version 3, NOAA National Centers for Environmental Information [data set], https://doi.org/10.7289/V5NK3BZP (last access: 18 September 2019), 2010a.
Knapp, K. R., Levinson, D. H., Kruk, M. C., Howard, J. H., and Kossin, J. P.: The International Best Track Archive for Climate Stewardship (IBTrACS), B. Am. Meteorol. Soc., 91, 363–376, https://doi.org/10.1007/978-90-481-3109-9_26, 2010b.
Kurita, N.: Water isotopic variability in response to mesoscale convective system over the tropical ocean, J. Geophys. Res.-Atmos., 118, 10376–10390, https://doi.org/10.1002/jgrd.50754, 2013.
Kurita, N., Ichiyanagi, K., Matsumoto, J., Yamanaka, M. D., and Ohata, T.: The relationship between the isotopic content of precipitation and the precipitation amount in tropical regions, J. Geochem. Explor., 102, 113–122, https://doi.org/10.1016/j.gexplo.2009.03.002, 2009.
Lagmay, A. M. F., Agaton, R. P., Bahala, M. A. C., Briones, J. B. L. T., Cabacaba, K. M. C., Caro, C. V. C., Dasallas, L. L., Gonzalo, L. A. L., Ladiero, C. N., Lapidez, J. P., Mungcal, M. T. F., Puno, J. V. R., Ramos, M. M. A. C., Santiago, J., Suarez, J. K., and Tablazon, J. P.: Devastating storm surges of Typhoon Haiyan, Int. J. Disaster Risk Reduct., 11, 1–12, https://doi.org/10.1016/j.ijdrr.2014.10.006, 2015.
Lawrence, J. R.: Isotopic spikes from tropical cyclones in surface waters: Opportunities in hydrology and paleoclimatology, Chem. Geol., 144, 153–160, https://doi.org/10.1016/S0009-2541(97)00090-9, 1998.
Lawrence, J. R. and Gedzelman, S. D.: Low stable isotope ratios of tropical cyclone rains, Geophys. Res. Lett., 23, 527–530, 1996.
Lawrence, J. R., Gedzelman, S. D., Gamache, J., and Black, M.: Stable isotope ratios: Hurricane Olivia, J. Atmos. Chem., 41, 67–82, https://doi.org/10.1023/A:1013808530364, 2002.
Li, Z. H., Labbé, N., Driese, S. G., and Grissino-Mayer, H. D.: Micro-scale analysis of tree-ring δ18O and δ13C on α-cellulose spline reveals high-resolution intra-annual climate variability and tropical cyclone activity, Chem. Geol., 284, 138–147, https://doi.org/10.1016/j.chemgeo.2011.02.015, 2011.
Marryanna, L., Kosugi, Y., Itoh, M., Noguchi, S., Takanashi, S., Katsuyama, M., Tani, M., and Siti-Aisah, S.: Temporal variation in the stable isotopes in precipitation related to the rainfall pattern in a tropical rainforest in Peninsular Malaysia, J. Trop. For. Sci., 29, 349–362, https://doi.org/10.26525/jtfs2017.29.3.349362, 2017.
Mei, W., Xie, S. P., Primeau, F., McWilliams, J. C., and Pasquero, C.: Northwestern Pacific typhoon intensity controlled by changes in ocean temperatures, Sci. Adv., 1, 1–8, https://doi.org/10.1126/sciadv.1500014, 2015.
Miller, D. L., Mora, C. I., Grissino-Mayer, H. D., Mock, C. J., Uhle, M. E., and Sharp, Z.: Tree-ring isotope records of tropical cyclone activity, P. Natl. Acad. Sci. USA, 103, 14294–14297, https://doi.org/10.1073/pnas.0606549103, 2006.
Moerman, J. W., Cobb, K. M., Adkins, J. F., Sodemann, H., Clark, B., and Tuen, A. A.: Diurnal to interannual rainfall δ18O variations in northern Borneo driven by regional hydrology, Earth Planet. Sci. Lett., 369–370, 108–119, https://doi.org/10.1016/j.epsl.2013.03.014, 2013.
Munksgaard, N. C., Zwart, C., Kurita, N., Bass, A., Nott, J., and Bird, M. I.: Stable Isotope Anatomy of Tropical Cyclone Ita, North-Eastern Australia, April 2014, PLoS One, 10, 1–15, https://doi.org/10.1371/journal.pone.0119728, 2015.
NDRRMC: SitRep No. 38 re Effects of Typhoon “Pablo” (Bopha), available at: http://www.ndrrmc.gov.ph/attachments/article/2245/SitRep_No_38_Effects_of_Typhoon_PABLO_as_of_25DEC2012_0600H.pdf (last access: 18 September 2019), 2012.
NDRRMC: Final Report re Effects of Typhoon “Glenda” (RAMMASUN), available at: http://ndrrmc.gov.ph/attachments/article/1293/Effects_of_Typhoon_Glenda_(RAMMASUN)_Final_Report_16SEP2014.pdf (last access: 17 September 2019), 2014.
NDRRMC: Final Report re Preparedness Measures and Effects of Typhoon “Lando” (I.N. Koppu), available at: http://ndrrmc.gov.ph/attachments/article/2607/FINAL_REPORT_re_Preparedness_Measures_and_Effects_of_Typhoon_LANDO_KOPPU_as_of_14_-_21OCT2015.pdf (last access: 17 September 2019), 2015.
Nott, J., Haig, J., Neil, H., and Gillieson, D.: Greater frequency variability of landfalling tropical cyclones at centennial compared to seasonal and decadal scales, Earth Planet. Sci. Lett., 255, 367–372, https://doi.org/10.1016/j.epsl.2006.12.023, 2007.
Oliva, F., Peros, M., and Viau, A.: A review of the spatial distribution of and analytical techniques used in paleotempestological studies in the western North Atlantic Basin, Prog. Phys. Geogr., 41, 171–190, https://doi.org/10.1177/0309133316683899, 2017.
Pape, J. R., Banner, J. L., Mack, L. E., Musgrove, M. L., and Guilfoyle, A.: Controls on oxygen isotope variability in precipitation and cave drip waters, central Texas, USA, J. Hydrol., 385, 203–215, https://doi.org/10.1016/j.jhydrol.2010.02.021, 2010.
Park, M. S., Lee, M. I., Kim, D., Bell, M. M., Cha, D. H., and Elsberry, R. L.: Land-based convection effects on formation of tropical cyclone Mekkhala (2008), Mon. Weather Rev., 145, 1315–1337, https://doi.org/10.1175/MWR-D-16-0167.1, 2017.
Permana, D. S., Thompson, L. G., and Setyadi, G.: Tropical West Pacific moisture dynamics and climate controls on rainfall isotopic ratios in southern Papua, Indonesia, J. Geophys. Res.-Atmos., 121, 2222–2245, https://doi.org/10.1002/2015JD023893, 2016.
Philippine Statistics Authority: Philippine Population Surpassed the 100 Million Mark (Results from the 2015 Census of Population), available at: http://www.psa.gov.ph/population-and-housing/node/120080 (last access: 15 September 2019), 2017.
Poméon, T., Jackisch, D., and Diekkrüger, B.: Evaluating the performance of remotely sensed and reanalysed precipitation data over West Africa using HBV light, J. Hydrol., 547, 222–235, https://doi.org/10.1016/j.jhydrol.2017.01.055, 2017.
Rios Gaona, M. F., Villarini, G., Zhang, W., and Vecchi, G. A.: The added value of IMERG in characterizing rainfall in tropical cyclones, Atmos. Res., 209, 95–102, https://doi.org/10.1016/j.atmosres.2018.03.008, 2018.
Risi, C., Bony, S., Vimeux, F., Descroix, L., Ibrahim, B., Lebreton, E., Mamadou, I., and Sultan, B.: What controls the isotopic composition of the African monsoon precipitation? Insights from event-based precipitation collected during the 2006 AMMA field campaign, Geophys. Res. Lett., 35, 1–6, https://doi.org/10.1029/2008GL035920, 2008.
Soria, J. L. A., Switzer, A. D., Villanoy, C. L., Fritz, H. M., Bilgera, P. H. T., Cabrera, O. C., Siringan, F. P., Maria, Y. Y. S., Ramos, R. D., and Fernandez, I. Q.: Repeat storm surge disasters of typhoon haiyan and its 1897 predecessor in the Philippines, B. Am. Meteorol. Soc., 97, 31–48, https://doi.org/10.1175/BAMS-D-14-00245.1, 2016.
Takagi, H. and Esteban, M.: Statistics of tropical cyclone landfalls in the Philippines: unusual characteristics of 2013 Typhoon Haiyan, Nat. Hazards, 80, 211–222, https://doi.org/10.1007/s11069-015-1965-6, 2016.
Tremoy, G., Vimeux, F., Soumana, S., Souley, I., and Risi, C.: Clustering mesoscale convective systems with laser-based water vapor δ18O monitoring in Niamey (Niger), J. Geophys. Res.-Atmos., 119, 5079–5103, https://doi.org/10.1002/2013JD020968, 2014.
Van Geldern, R. and Barth, J. A. C.: Optimization of instrument setup and post-run corrections for oxygen and hydrogen stable isotope measurements of water by isotope ratio infrared spectroscopy (IRIS), Limnol. Oceanogr. Methods, 10, 1024–1036, https://doi.org/10.4319/lom.2012.10.1024, 2012.
Villafuerte, M. Q., Matsumoto, J., Akasaka, I., Takahashi, H. G., Kubota, H., and Cinco, T. A.: Long-term trends and variability of rainfall extremes in the Philippines, Atmos. Res., 137, 1–13, https://doi.org/10.1016/j.atmosres.2013.09.021, 2014.
Villarini, G., Smith, J. A., Baeck, M. L., Marchok, T., and Vecchi, G. A.: Characterization of rainfall distribution and flooding associated with U.S. landfalling tropical cyclones: Analyses of Hurricanes Frances, Ivan, and Jeanne (2004), J. Geophys. Res.-Atmos., 116, 1–19, https://doi.org/10.1029/2011JD016175, 2011.
Weatherford, C. L. and Gray, W. M.: Typhoon Structure as Revealed by Aircraft Reconnaissance. Part I: Data Analysis and Climatology, Mon. Weather Rev., 116, 1032–1043, https://doi.org/10.1175/1520-0493(1988)116<1032:TSARBA>2.0.CO;2, 1988.
Webster, P. J., Holland, G. J., Curry, J. A., and Chang, H.-R.: Changes in Tropical Cyclone Number, Duration, and Intensity in a Warming Environment, Science, 309, 1844–1846, https://doi.org/10.1126/science.1116448, 2005.
Woodruff, J. D., Irish, J. L., and Camargo, S. J.: Coastal flooding by tropical cyclones and sea-level rise, Nature, 504, 44–52, https://doi.org/10.1038/nature12855, 2013.
Xie, B. and Zhang, F.: Impacts of typhoon track and Island topography on the heavy rainfalls in Taiwan associated with Morakot (2009), Mon. Weather Rev., 140, 3379–3394, https://doi.org/10.1175/MWR-D-11-00240.1, 2012.
Xu, T., Sun, X., Hong, H., Wang, X., Cui, M., Lei, G., Gao, L., Liu, J., Lone, M. A., and Jiang, X.: Stable isotope ratios of typhoon rains in Fuzhou, Southeast China, during 2013–2017, J. Hydrol., 570, 445–453, https://doi.org/10.1016/j.jhydrol.2019.01.017, 2019.