the Creative Commons Attribution 4.0 License.
the Creative Commons Attribution 4.0 License.
 | 22 Jun 2022
Using a single remote-sensing image to calculate the height of a landslide dam and the maximum volume of a lake
Weijie Zou
Yi Zhou
Shixin Wang
Futao Wang
Litao Wang
Qing Zhao
Wenliang Liu
Jinfeng Zhu
Yibing Xiong
Zhenqing Wang
Gang Qin
Landslide dams are caused when landslide materials block rivers. After the occurrence of large-scale landslides, it is necessary to conduct a large-scale investigation of barrier lakes and a rapid risk assessment. Remote sensing is an important means to achieve this goal. However, at present, remote sensing is only used for the monitoring and extraction of hydrological parameters, without predicting the potential hazard of the landslide dam. The key parameters of the barrier dam, such as the dam height and the maximum volume, still need to be obtained based on a field investigation, which is time consuming. Our research proposes a procedure that is able to calculate the height of the landslide dam and the maximum volume of the barrier lake using a single remote-sensing image and a pre-landslide DEM. The procedure includes four modules: (a) determining the elevation of the lake level, (b) determining the elevation of the bottom of the dam, (c) calculating the highest height of the dam and (d) predicting the lowest crest height of the dam and the maximum volume. Finally, a sensitivity analysis of the parameters used during the procedure and an analysis of the influence of the image resolution is carried out. This procedure is mainly demonstrated through the Baige landslide dam and the Hongshiyan landslide dam. A single remote-sensing image and a pre-landslide DEM are used to predict the height of each dam and the key parameters of the dam break, which are in good agreement with the measured data. This procedure can effectively support quick decision making regarding hazard mitigation.
- Article
(11882 KB) - Full-text XML
- BibTeX
- EndNote


Landslide dams are caused when landslide materials block rivers, usually in mountainous areas with rivers and narrow valleys, bringing great risks to the local people's lives and property (Costa and Schuster, 1988; Fan et al., 2020). Landslide dam disasters are widely distributed around the world; examples include the 11 dams caused by the magnitude 7.6 earthquake in New Zealand in 1929 (Adams, 1981); the Oso landslide dam in Washington, USA in 2014 (Iverson et al., 2015); the Diexi landslide dam on the Minjiang River, China in 1933 (Li et al., 1986); the Yigong landslide dam in 2000 (Zhou et al., 2016); and a series of landslide dams – including the Tangjiashan landslide dam – caused by the Wenchuan earthquake in 2008 (Zhang et al., 2019). Based on the historical records of 183 landslide dams, Costa found that the main way in which a dam was breached was overtopping. 41 % of the dams breached within 1 week, and 85 % breached within a year (Costa and Schuster, 1988). Fan analyzed a series of dams induced by the 2008 Wenchuan earthquake and found that 43 % of them collapsed within 1 month (Fan et al., 2012). According to Shen's research on the longevity of barrier lakes, nearly 48.3 % of dams will breach within a week and 84.4 % of dams will fail within 1 year (Shen et al., 2020). Most landslide dams are unstable. However, landslide dams always occur in remote mountainous areas, with inconvenient traffic conditions and poor infrastructure (Cui et al., 2009). When earthquakes or precipitation induce large-scale landslides, a field survey is time consuming and manpower consuming (Dong et al., 2014). Remote areas tend to be more vulnerable, and the breaching of a dam is more likely to cause serious consequences in such areas. Therefore, it is necessary to identify landslide dams and take action as quickly as possible.
There are several factors that influence the formation process, the development and the risk of landslide dams. These factors can be divided into three categories. The first category is soil parameters, including the dam material composition and the repose angle of the dam material, which has an unavoidable relationship with the formation and erosion process of the dam. The low permeability and high erodibility of a landslide dam will lead to short longevity and fast breaching (Shen et al., 2020). The second category is hydrological parameters, such as the lake volume, average annual discharge and catchment area, which determine the speed at which the lake surface rises (Cao et al., 2011). The faster the lake rises, the less time there is for hazard mitigation. The third category is geometric parameters, such as the length and angle of the landslide surface and the length, width and height of the dam. The landslide surface influences the kinetic energy of the landslide material, which has a great influence on the formation of the landslide dam. Also, the geometric parameters of the dam itself determine the stability of the dam, the maximum volume of the lake and the potential maximum discharge of the breach (Dong et al., 2011; Cao et al., 2011; Shen et al., 2020).
Remote sensing has the ability to identify and monitor landslide dams at a large scale conveniently, and it supports quick decision making regarding hazard mitigation (Canuti et al., 2004; Fan et al., 2021). In previous research, remote sensing has usually been regarded as an auxiliary means to monitor changes in the catchment area or to measure the length of the dam. For example, Wang and Lv used multiple remote-sensing images to extract water boundary images and a pre-landslide DEM to monitor the changes in the volume of Yigong Lake (Wang and Lu, 2002). Chen and Lu (2008) proposed a method to estimate the water capacity of the reservoir based on the water boundary and a DEM (Chen and Lu, 2008).
The research described above focused on obtaining information about the barrier lake through remote sensing and the use of a geographic information system. However, these kinds of methods focus on monitoring and can only obtain some of the geometric parameters directly through images, such as those of the catchment area. Some essential components of hazard evaluation are not available in such research. In particular, the height of the dam, which determines the maximum volume of the barrier lake and the flood peak of the dam breach (Costa and Schuster, 1988; Ermini and Casagli, 2003; Peng and Zhang, 2012; Dong et al., 2014), cannot be obtained through these methods. However, as most landslide dams breach by overtopping, they start to breach when the elevation of the lake surface equals the elevation of the landslide dam (Meng et al., 2021; Costa and Schuster, 1988; Ermini and Casagli, 2003), so the height of the landslide dam decides the maximum volume of the lake. The damage caused by the landslide dam mostly depends on the flood it causes when breached. As water goes through the dam surface, the resulting erosion process will lead to a rapid increase in the discharge, and will finally result in flooding. According to research, this process has a strong relationship with the height of the landslide dam (Federica et al., 2021; Shen et al., 2020; Chen et al., 2004; Braun et al., 2018), which makes it one of the most important parameters related to this hazard.
Due to the rapid development of unmanned aerial vehicles (UAVs), photogrammetric UAVs were used to survey the landslide dams in the Wenchuan earthquake in 2008 (Cui et al., 2009). However, after an earthquake, there are a large number of landslides and the affected area is huge. If UAVs are used for a series of precise investigations, it is not possible to meet the requirement of timeliness for the emergency. Based on the pre-landslide DTM and a series of remote sensing images taken after landslide dam formation, Dong obtained the variation of the lake level, which enabled the slope foot of the barrier dam to be estimated and the dam height to be predicted, allowing a quick assessment of the dam breaching hazard (Dong et al., 2014). But this procedure is still inconvenient, as it requires sequential images to predict the height of the dam. All of the methods that use a pre-landslide DEM are based on an important assumption: that the pre-landslide DEM is reliable. However, if we take the Baige landslide dam as an example (Fig. 1), we find that the elevation of the landslide area changed greatly. The landslide area had a great degree of subsidence, and the dam area had a great degree of uplift. Even in areas nearby that were covered with vegetation, there was about 20 m of subsidence on average, which demonstrates that the assumption above needs further improvement.
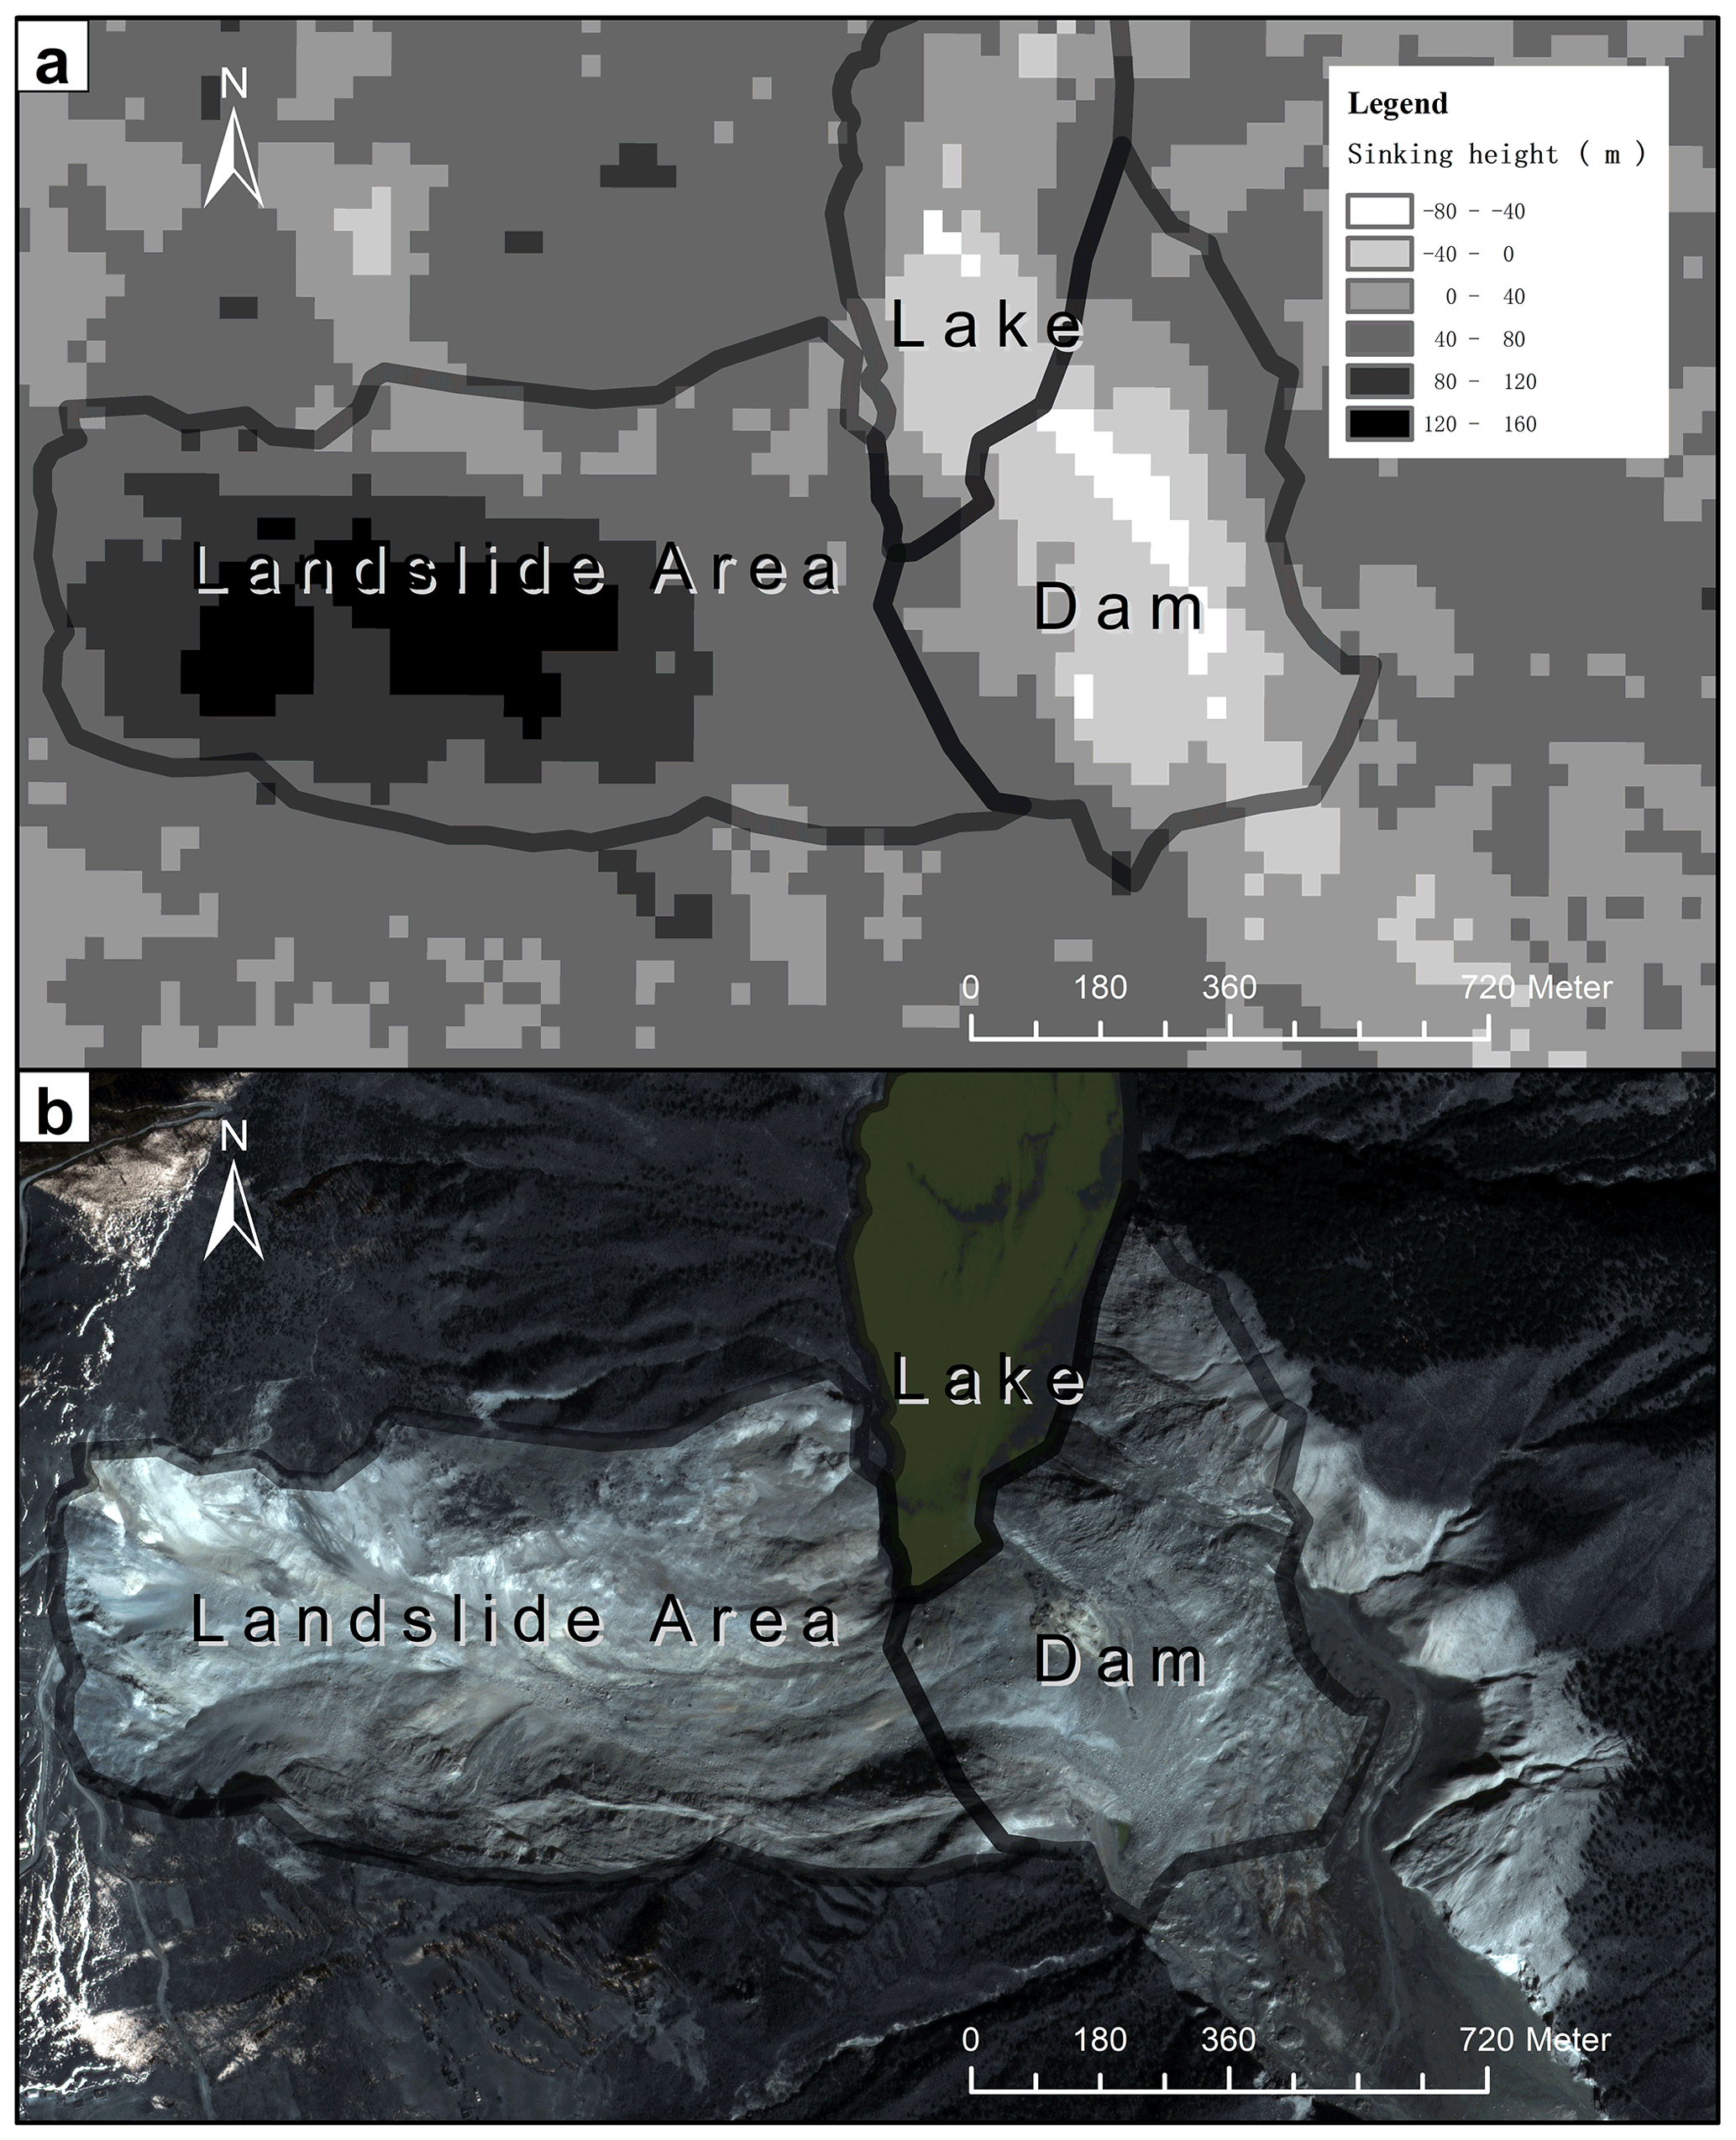
Figure 1Panel (a) is a comparison of the pre-landslide DEM (SRTM V3) with the after-landslide DEM. Panel (b) is a remote sensing image from the Beijing-1 satellite (taken on 9 November 2018).
This research will focus on the weakness above by using a single remote-sensing image and a pre-landslide DEM to obtain essential information on a landslide dam and to calculate the height of the landslide dam based on its formation mechanism. The Baige landslide dam is taken as an example to verify the feasibility of this procedure. A sensitivity analysis of the parameters during the procedure and an analysis of the influence of the image resolution are carried out in the “Discussion” section.
After the occurrence of large-scale landslides, the government often cannot fully assess the disaster situation immediately, so an investigation of large-scale landslides is needed. As such disasters often occur in remote areas, the purpose of this large-scale investigation is not only to find the landslide dams but also to make an objective evaluation of the hazard of the landslide dams, thus supporting a reasonable allocation of resources to avoid an excessive reaction. When a landslide dam is identified from the image, the procedure to calculate its height is divided into four parts (Fig. 2): (a) select the reference points used to determine the elevation of the lake level; (b) estimate the elevation of the bottom of the dam; (c) calculate the highest elevation of the dam crest based on the formation mechanism of the landslide dam; and (d) predict the lowest height of the dam crest and the maximum of the lake volume. This section will elaborate the details of (a)–(d), obtaining the lowest height of the dam crest and calculating the maximum volume based on a GIS.
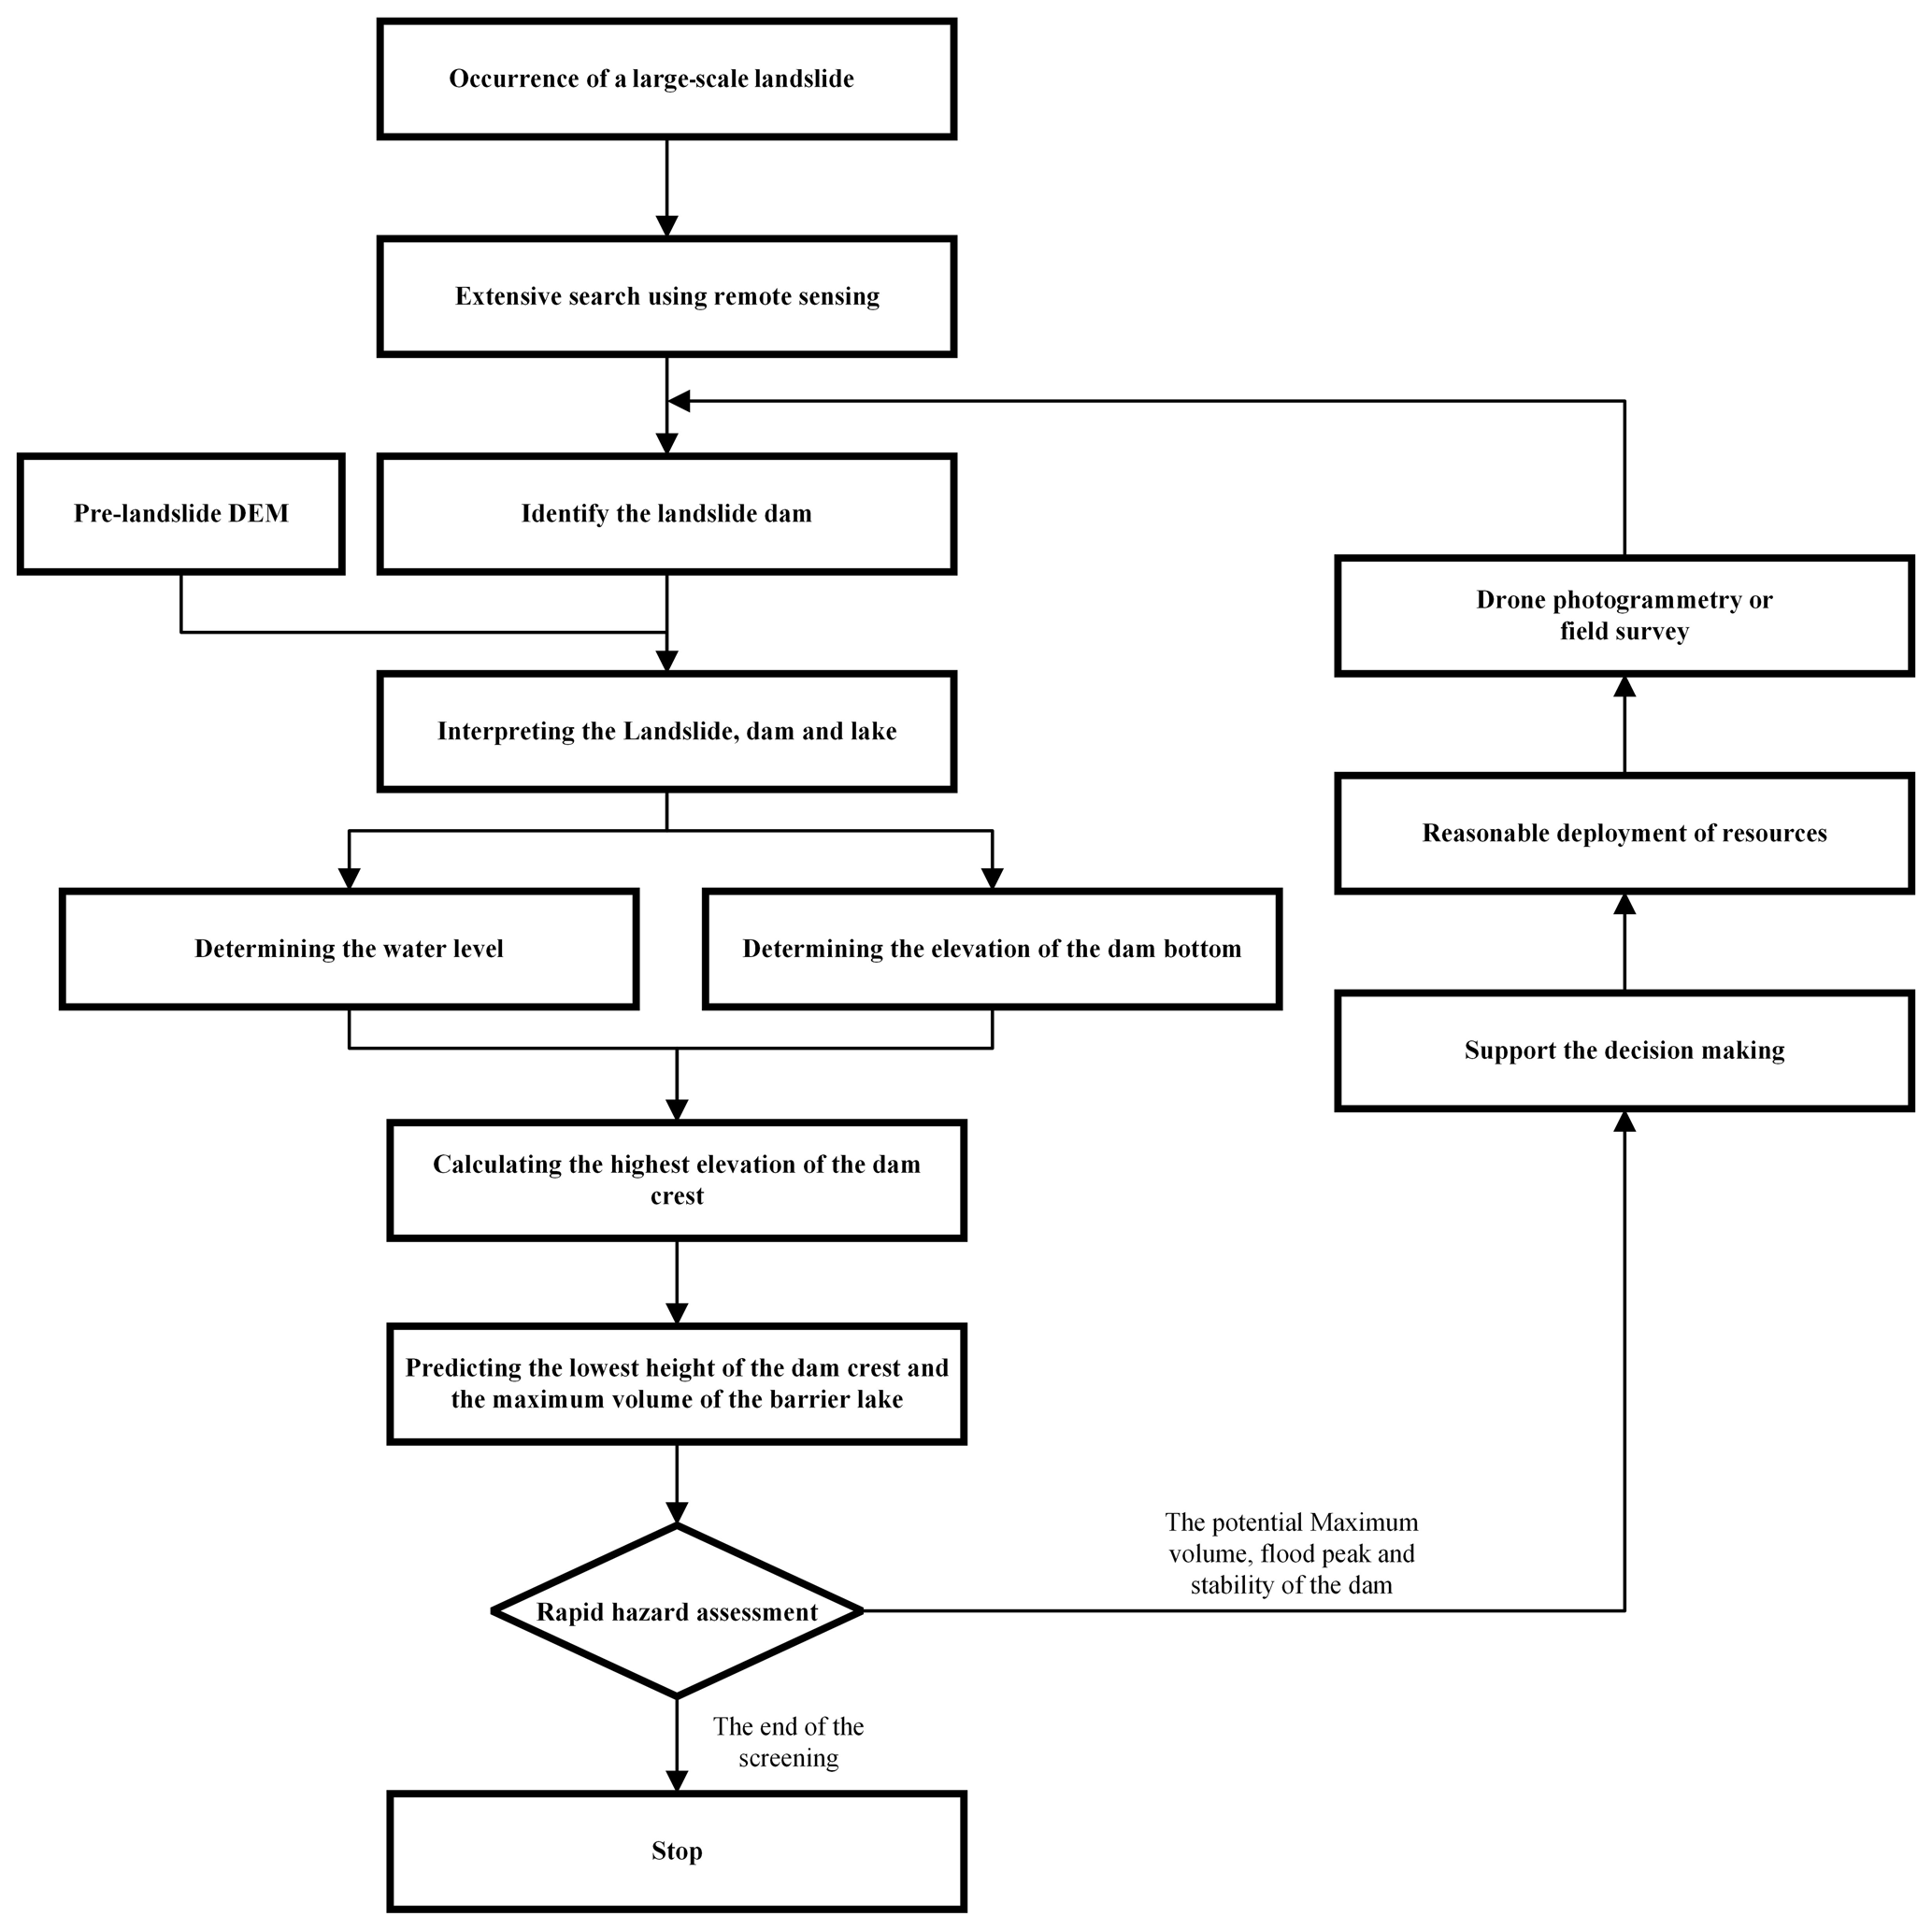
Figure 2The procedure for obtaining the height of the dam crest and completing the hazard assessment.
2.1 Determining the elevation of the lake level
The method of estimating the elevation of the barrier lake based on remote sensing images has been practiced by many scholars. Typically speaking, researchers assume that the elevation of the water boundary is the same as the topography. A pre-landslide DEM is used in most cases to determine the lake level with the water boundary in the image (Wang and Lu, 2002; Chen and Lu, 2008; Dong et al., 2014; Braun et al., 2018). However, the reliability of the pre-landslide DEM may decrease as a result of the landslide (Fig. 1). The reasons can be summarized as follows: (a) the landslide causes some changes in the topography of the area; (b) the pre-landslide DEM contains errors, especially in mountainous areas; and (c) surface deformations such as landslides occurred after DEM data acquisition.
For the reasons above, the selection of the reference points to determine the elevation of the lake level should follow certain principles to reduce errors: (a) as landslides often bring about large-scale ground subsidence, when selecting reference points, points around the landslide area should be avoided; (b) because landslides and settlement tend to occur in areas with steep terrain and little vegetation coverage (Ayalew and Yamagishi, 2005), and the DEM is more precise for flat terrain, reference points in vegetation-covered flat terrain should be selected, avoiding gully or ravines.
Under these restrictions, the reference points selected can be regarded as having the same elevation as the lake level. Therefore, the lake level can be determined. However, in order to determine the elevation of the lake level, a large number of reference points are needed. The points will not have the same values due to random error, but the random errors in the DEM and associated with the process of determining the points should be within a certain range (Figs. 7 and 9) for the random errors in the DEM and the errors associated with the process of determining the points. In this situation, points that are one and a half interquartile ranges away from the mean value are considered outliers. The elevation of the lake level is the average elevation of the remaining points. Because the dam blocks the channel and the river has no outflow, the water surface can be assumed to be have the same height (Wang and Lu, 2002; Morgenstern et al., 2021; Fan et al., 2021). So, the elevation of the lake level is the same as the elevation of the lake-dam point in Fig. 3.
2.2 Determining the elevation of the dam bottom
In this procedure, the bottom of the dam refers to the point where the dam meets the river bed on the downstream side. In practical cases, the most reliable method is to directly use the riverbed elevation obtained recently. In the absence of relevant data, the following method should be used for prediction.
Within a certain range, the riverbed elevation can be considered to decrease linearly along the channel. Therefore, elevation points at the lowest point of the river valley in the pre-landslide DEM can be sampled, outliers can be removed, and simple regression can be carried out to obtain a fit of the riverbed elevation. By extending the fitting results to the dam body and subtracting the historical river depth, the bottom elevation of the dam is obtained.
However, the historical river depth varies with the season, so there must be some errors in this prediction. The influence of the dam bottom elevation on the calculation of the dam height will be analyzed in the “Discussion” section.
2.3 Calculating the highest elevation of the dam crest
According to Wu's laboratory experimental study, the geometrical form of the barrier dam is mainly determined by the landslide slope, river slope, angle of repose, earthwork amount and sliding height (Wu et al., 2020).
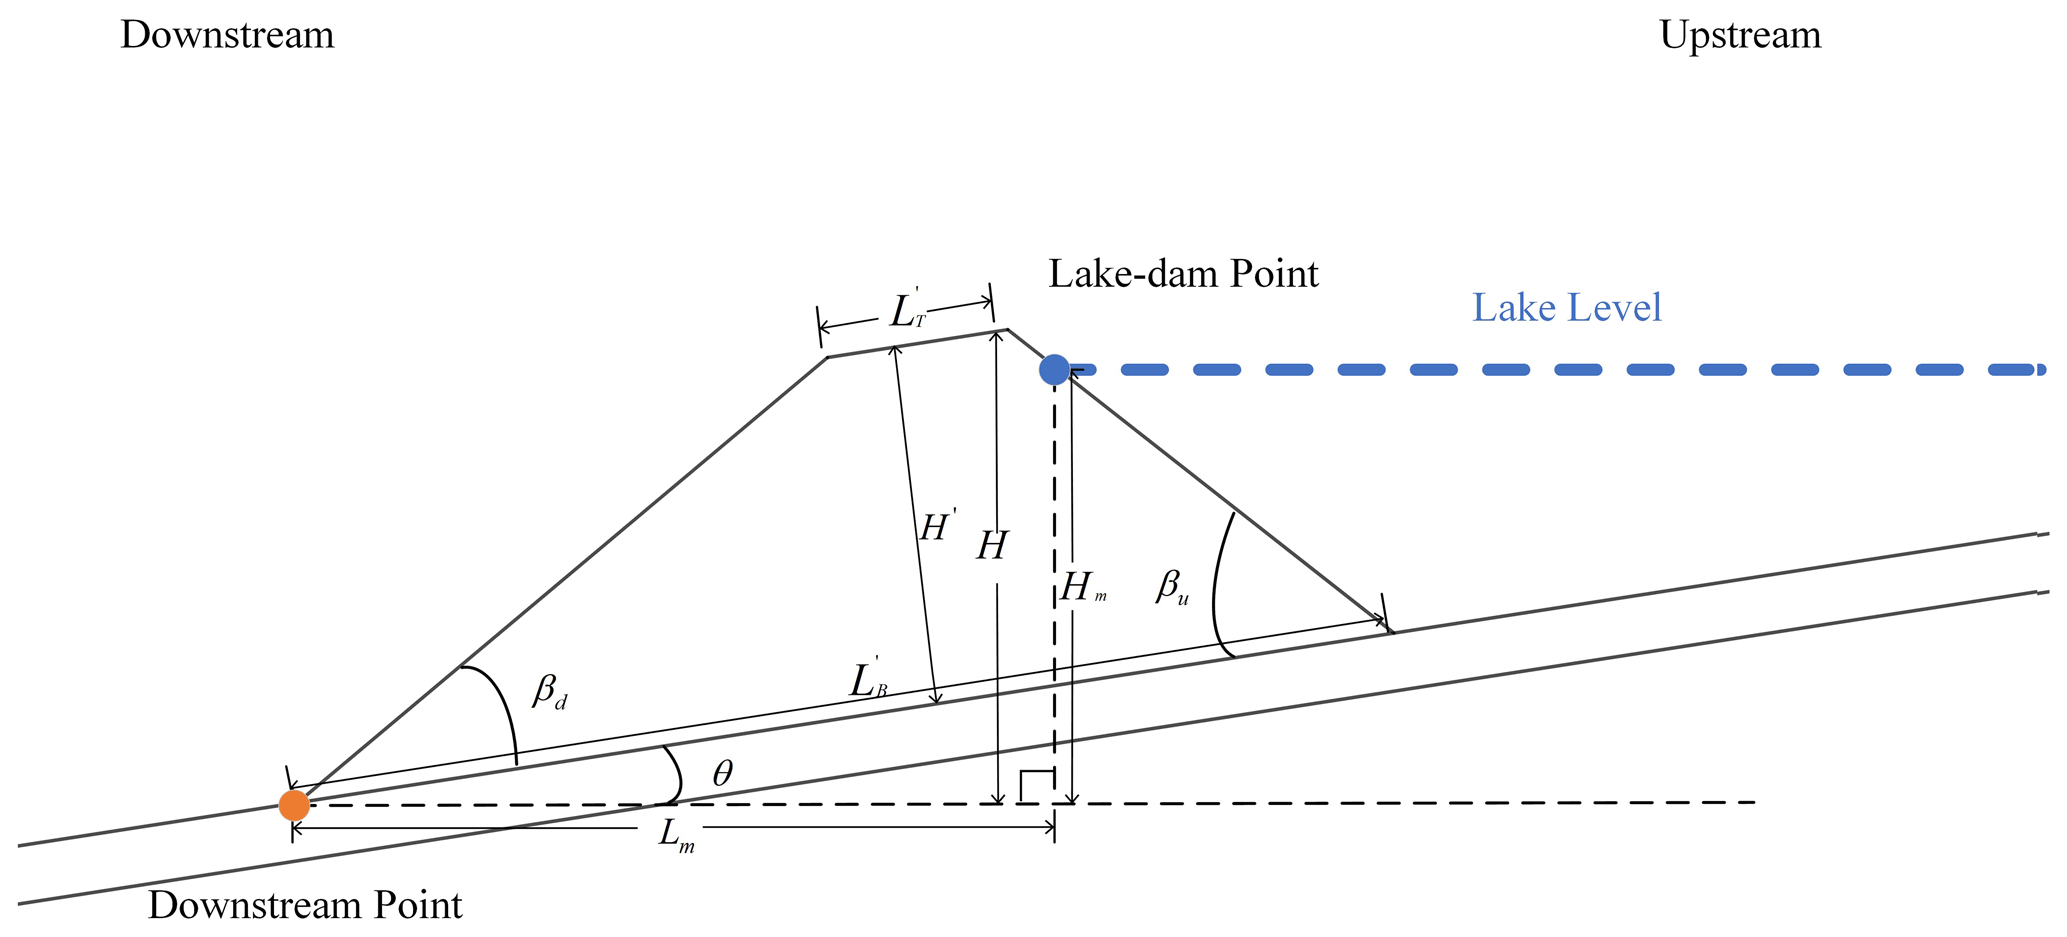
In his theory, if the river is completely blocked and the valley can be simplified to a U shape, the longitudinal section of the landslide dam can be simplified to a trapezoid (Wu et al., 2020), as shown in Fig. 3. The trapezoid will follow the pattern described below.
The top of the dam is parallel to the bottom of the dam (Wu et al., 2020):
where is the top of the dam and is the bottom of the dam (Wu et al., 2020). Also,
where βd is the angle between the body of the dam and the riverbed on the downstream side, βu is the angle between the body of the dam and the riverbed on the upstream side, ϕ is the angle of repose of the landslide mass and χ is the parameter that fits the effect of the “cut top” phenomenon. ϕ is determined by the nature of the soil itself, and χ will be affected by the landslide surface angle, landslide length and other factors (Grasselli et al., 2000). The determination of χ can be simplified as follows (Wu et al., 2020):
where α is the angle of the landslide surface. When this angle is higher, the actual angle between the riverbed and the landslide material will be smaller and the length of the dam along the river will be longer. Normally speaking, this formula fits the actual situation well. The precision of this fitting will be discussed in the “Discussion” section.
According to Wang's field investigation of the Wenchuan earthquake, it was found that the angle of repose of the landslide dam caused by the Wenchuan earthquake was between 28.8 and 44.7∘, with an average of 35.5∘ (Wang et al., 2013). In the absence of relevant data, it is recommended to use the average provided by Wang:
Wu proposed that the height of the dam has a certain relationship with the length of the bottom of the dam (Wu et al., 2020), as follows:
where H′ is the height between the dam top and the dam bottom, θ is the angle of the riverbed and is the length of the dam along the river. The R2 values of Eqs. (2), (3) and (5) are all greater than 0.95.
As shown in Fig. 3, the elevation of the dam-lake point and the elevation of the dam bottom have already been obtained. So, Hm can be calculated and Lm can be obtained directly from the remote sensing images. According to Eqs. (1)–(5), using simple geometric relations, the following relation can be obtained:
where H is the difference between the highest elevation of the dam crest and the dam bottom elevation and Hr is the difference in the elevation of the riverbed between the dam bottom and the crest. θ and α can easily be obtained using the remote sensing image and the pre-landslide DEM.
Through this procedure, the highest elevation of the dam crest can be determined based on a single image and a pre-landslide DEM. This can then be used in the further prediction of dam breaching and related decision making.
2.4 Predicting the lowest height of the dam crest and the maximum volume of the barrier lake
Because the height of the landslide dam across the river channel in the vertical direction of the will not be consistent (Costa and Schuster, 1988; Fan et al., 2020) – it will show a distribution that depends on the characteristics of the case, meaning that the height of a landslide dam is not a single value but a range. As the most important factor affecting the dam breach is the height of the lowest point of the dam crest, which determines the potential maximum volume of the barrier lake and the maximum discharge volume of the dam breach (Costa and Schuster, 1988; Chen et al., 2004, 2021; Dong et al., 2011, 2014; Yang et al., 2013; Zhong et al., 2018), the prediction result for the highest elevation of the dam crest cannot be used in related breaching models directly.
However, by simply analyzing the highest elevation of the dam crest and the lowest elevation in existing records, a simple estimation of the relationship between them can be carried out, as shown in Fig. 4.
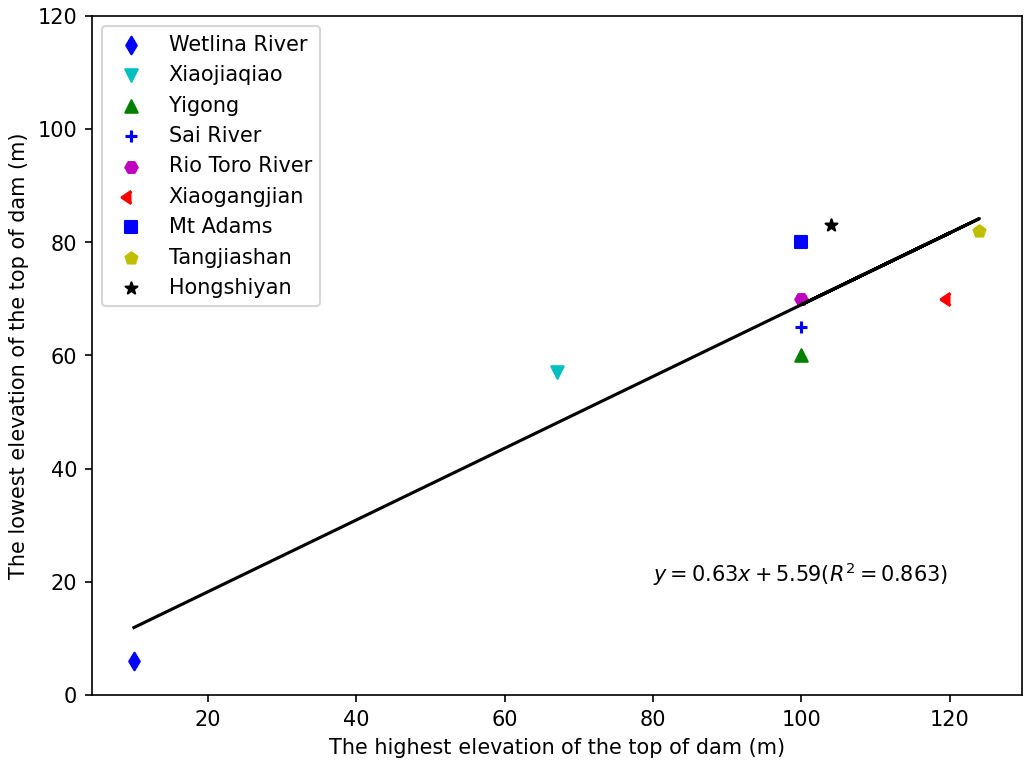
Figure 4The relationship between the highest elevation of the dam crest and the lowest elevation of the dam crest. These data can be found in the papers of Cui, Costa, Mora and so on (Costa and Schuster, 1991; Mora Castro, 1993; Briaud, 2008; Cui et al., 2009; Peng and Zhang, 2012; Chen et al., 2020).
The relationship can be expressed as follows:
where Hl is the lowest elevation of the dam crest and Hh is the highest elevation of the dam crest. On the basis of the formula above, we can use the lowest elevation of the dam crest to complete a rapid assessment of the breaching hazard.
3.1 Baige landslide dam
The Jinsha River, the upper reach of the Yangtze River, was dammed twice recently at Baige, Tibet at 98∘42′32.24′′ E, 31∘4′59.27′′ N (Fig. 5): on 10 October 2018 and on 3 November 2018 (UTC+8) (Zhang et al., 2019). On 3 November 2018, the residual landslide of the “10.10” Baige landslide dam slid down again, forming the “11.03” Baige landslide dam, based on the original residual dam (Li et al., 2019). The 11.03 dam is much larger than the first one, as the width of the dam top is 195 m, the length of the dam top is 273 m, and the highest elevation of the dam crest is 3014 m (Chen et al., 2020). After proper treatment, its storage capacity was reduced from 8.69×10⁸ to 5.79×10⁸ m3, and the flood peak diminished from 41 624 to 31 000 m3 s−1 (Chen et al., 2020; Yunjian et al., 2021). Even with proper treatment, a large number of roads and bridges were damaged downstream, and a total of 54 000 people were affected, with economic losses of over 7.43 billion yuan (Zhang et al., 2019). Due to abundant field survey data and the great harm it caused, the Baige landslide dam was selected to demonstrate this procedure.
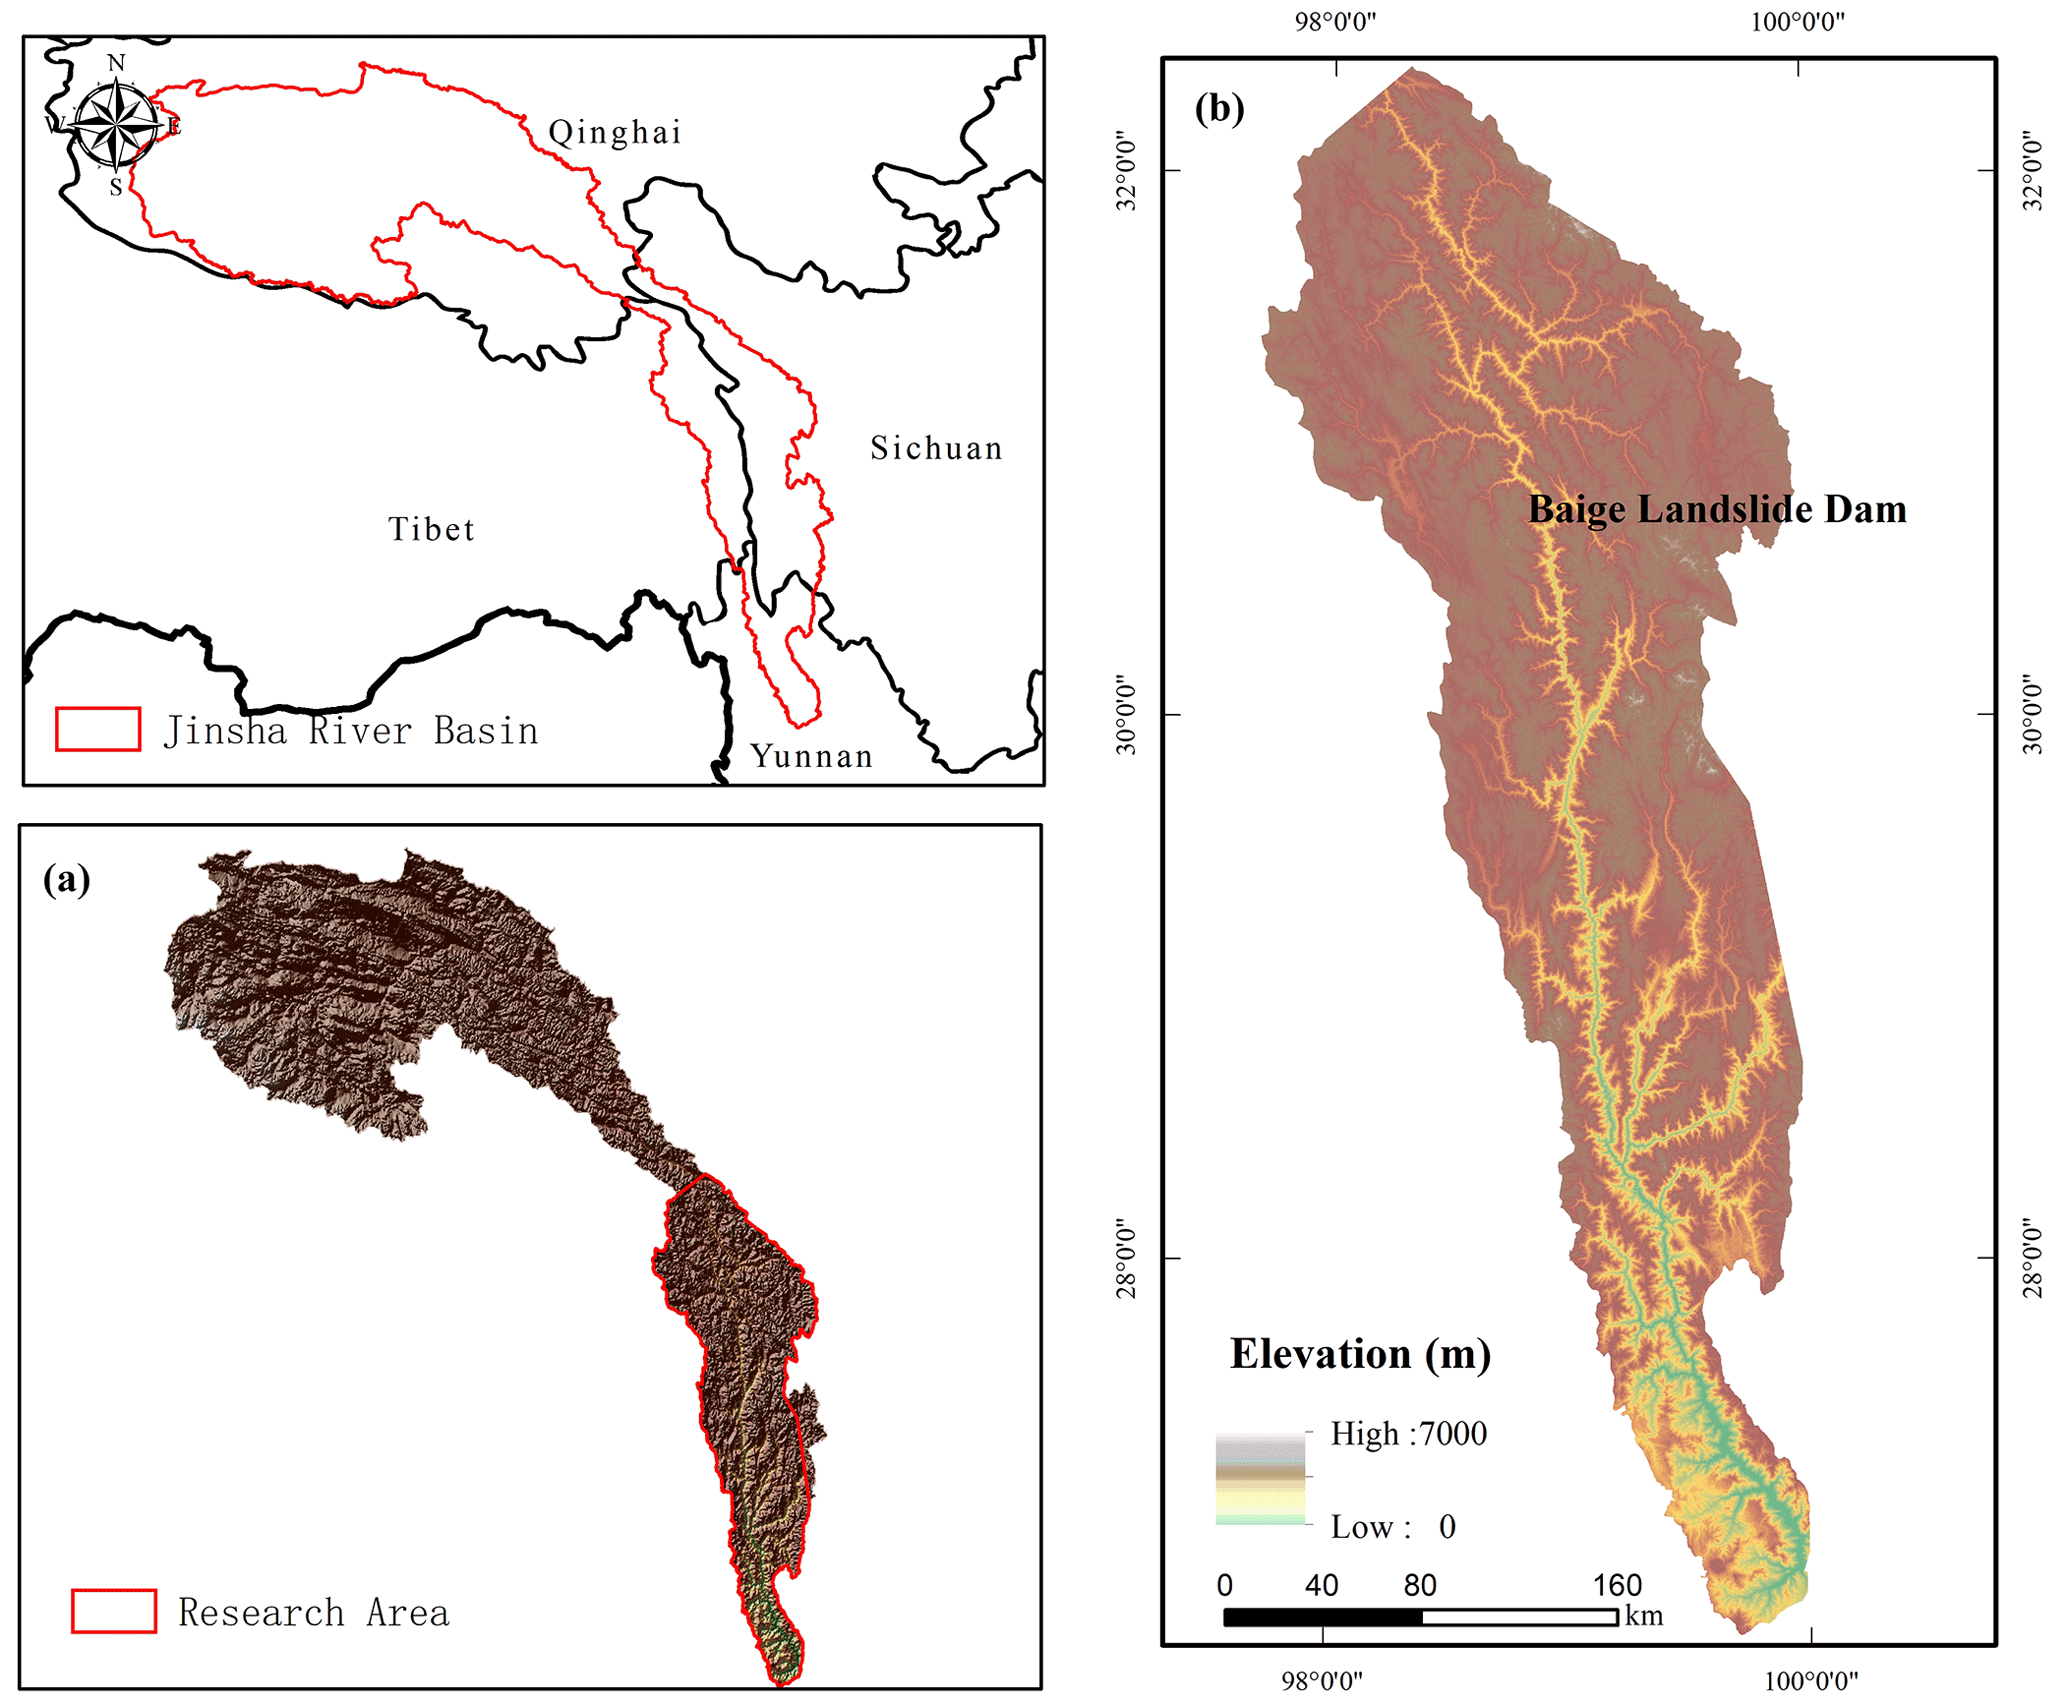
Figure 5The position of the Baige landslide dam.
The Baige landslide dam is located in a deep valley in the mountainous area and the barrier lake is long and narrow (Fig. 6). In order to demonstrate the proposed procedure, the second Baige landslide is taken as an example. The image we use is a 0.8 m resolution image from Beijing-1 that was taken on 9 November 2018, and the pre-landslide DEM we choose is SRTM V3 of 30 m resolution, which was taken in 2000. The effect of the resolution of the image will be discussed in the “Discussion” section.
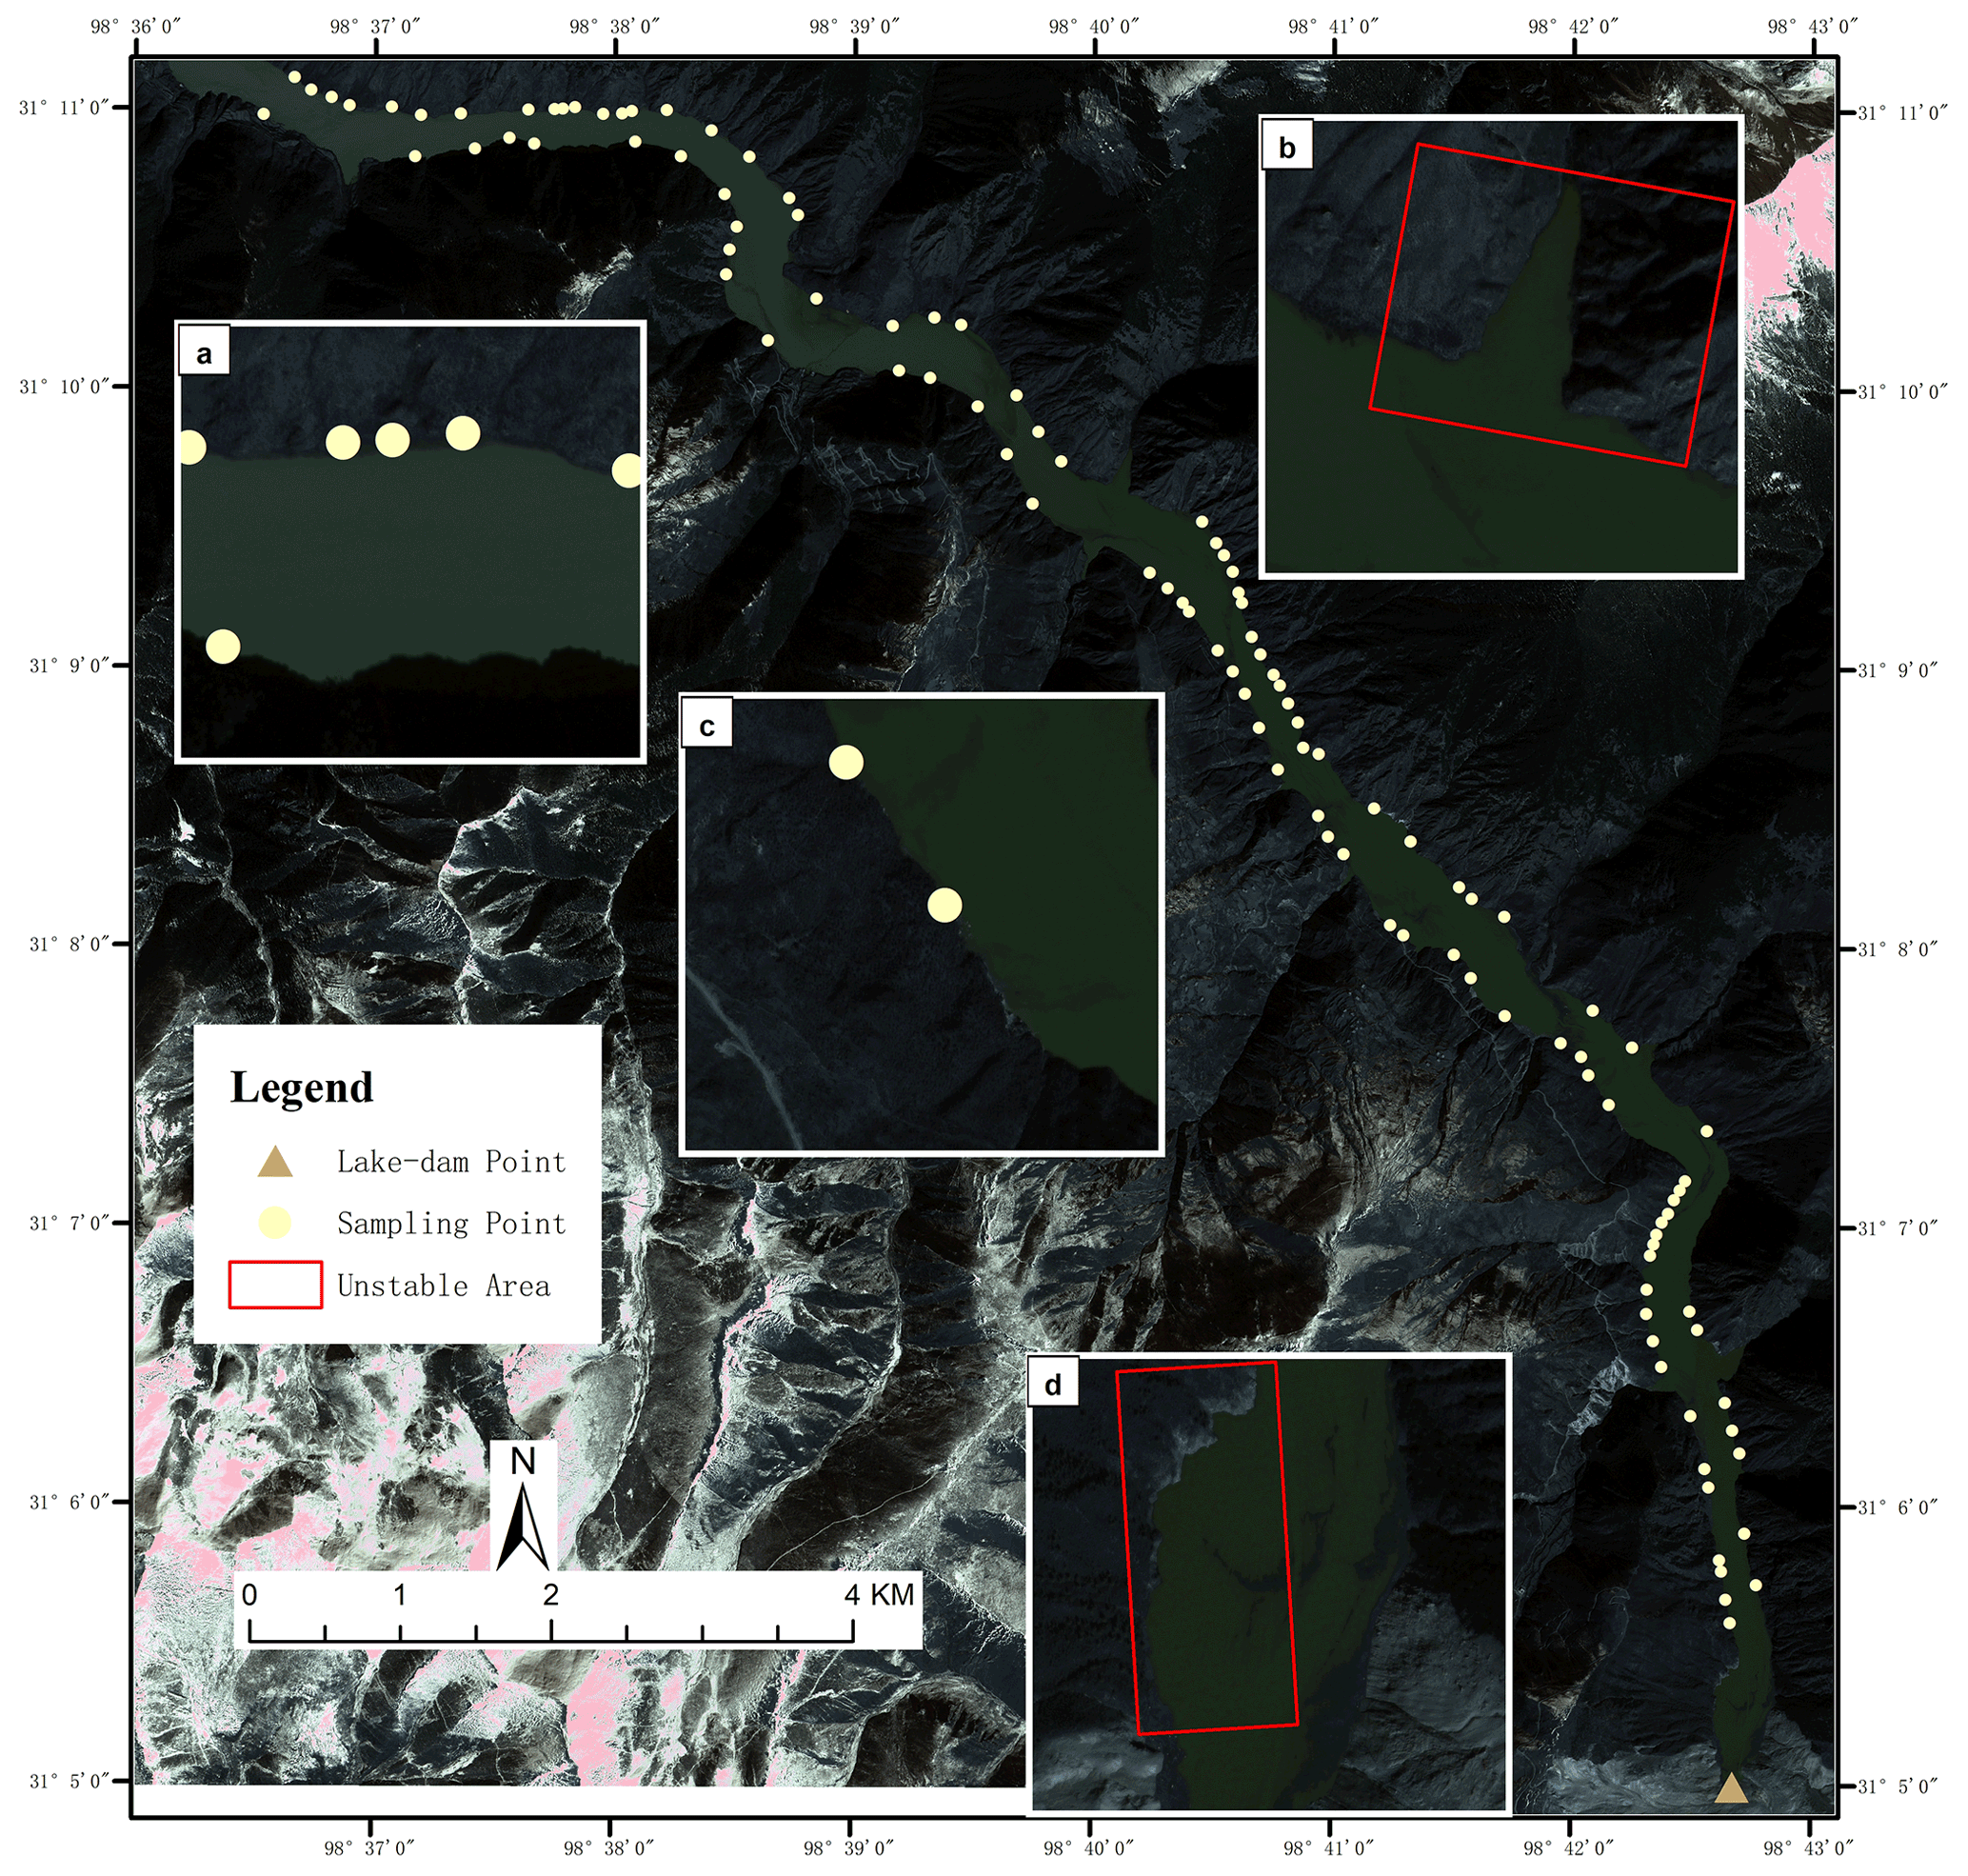
Figure 6The sampling points in the case of the Baige landslide dam (image from the Beijing-1 satellite).
3.1.1 Determining the elevation of the lake level
In the remote sensing image, an area at the water boundary that is covered by vegetation, has a relatively flat terrain and is a certain distance from the landslide was selected for elevation sampling (Fig. 6). Under ideal circumstances, the distribution of the sampling point elevation should be completely consistent. But, in practice, there are often large deviations, as shown in Fig. 7; the specific reasons for these have been discussed in the “Procedure” section and will not be repeated here. The deviation between the maximum and minimum elevations of the sampling points can reach 72 m, and the shape basically conforms to the normal distribution. Therefore, the mean of the reference points can be obtained directly after clearing the outliers; this mean is the elevation of the barrier lake and the outcome is 2944 m. Since the lake is essentially still, the elevation of the lake should be the same as the elevation of the point where the dam meets the lake, as shown as the triangle in Fig. 3.
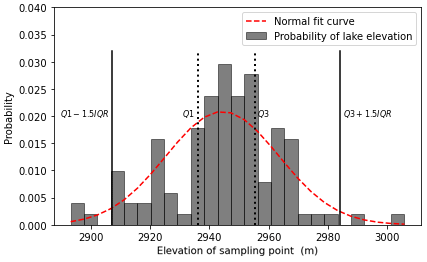
Figure 7Elevation distribution for the sampling points used in the case of the Baige landslide dam.
The intersection over union (IOU) of the area with elevations below 2944 m in the DEM and the actual submerged area in the remote sensing image is 84.48 % (Fig. 8). The two are found to be basically consistent.
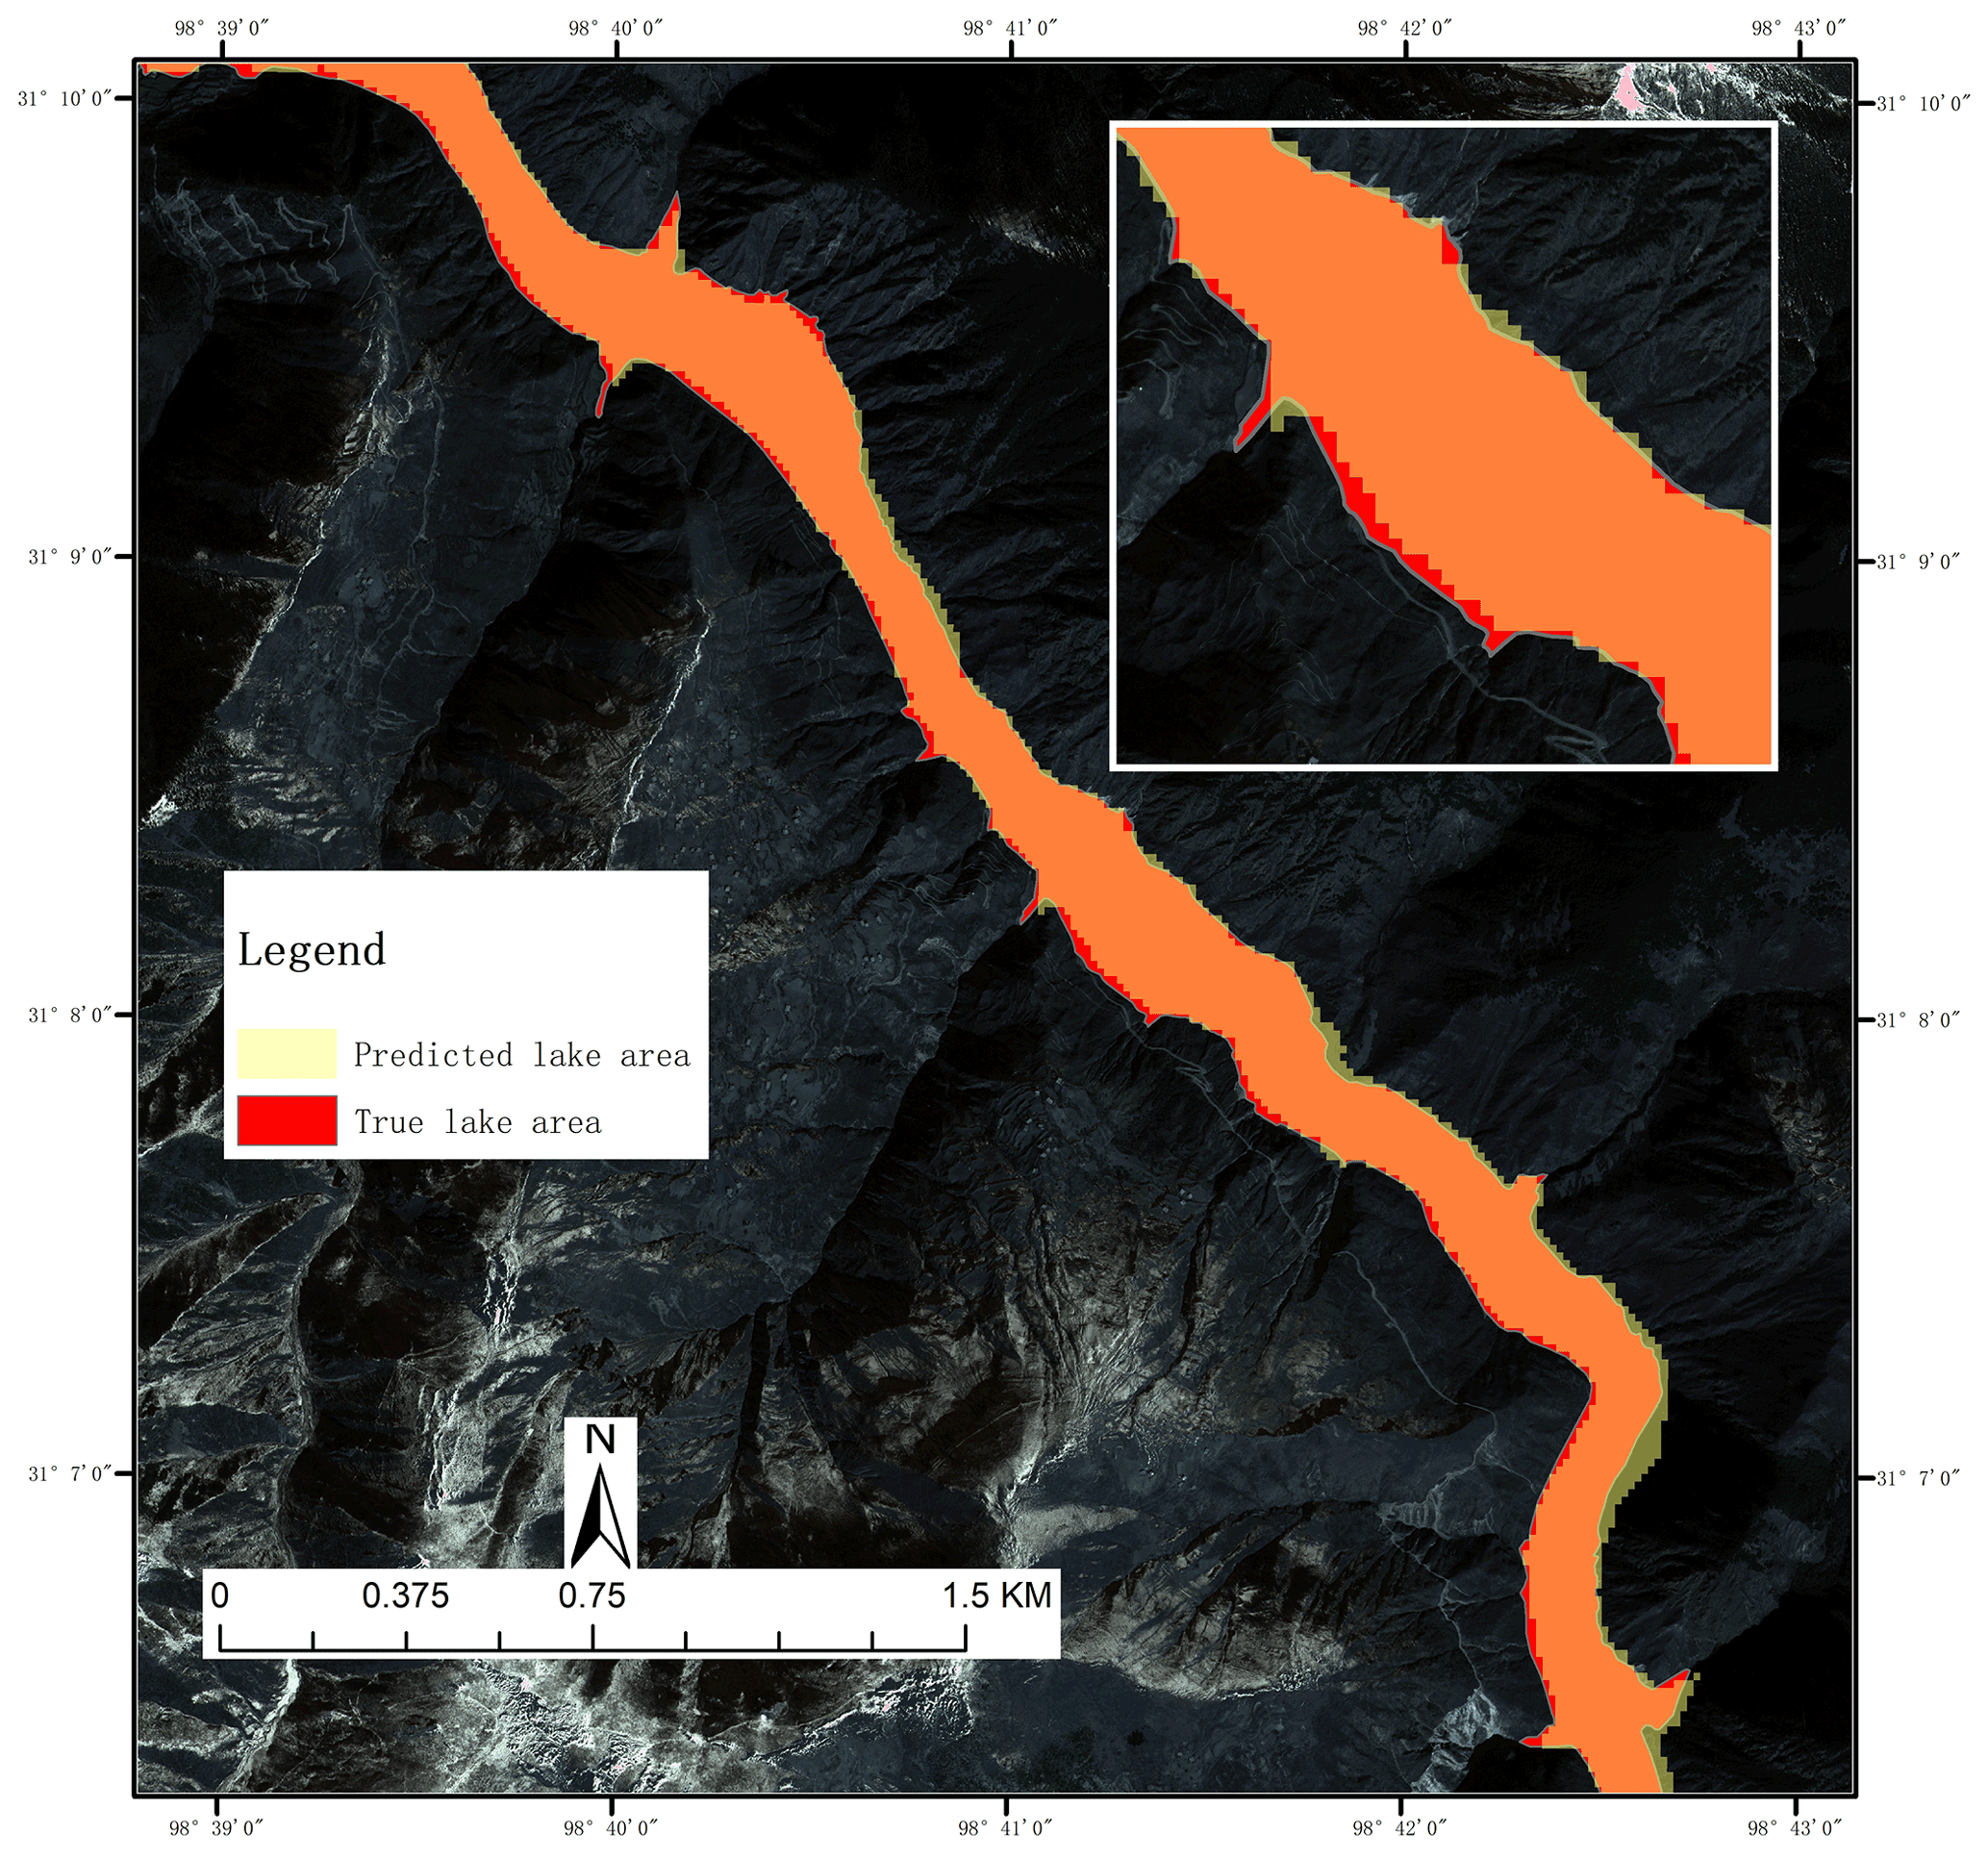
Figure 8Comparison of the area with elevations below 2944 m in the DEM to the actual submerged area in the remote sensing image (the image is from the Beijing-1 satellite).
3.1.2 Determining the elevation of the dam bottom
The inclination angle of the riverbed is calculated by sampling and unitary regression and is about 0.11∘. The elevation of the water level at the location of the dam bottom before the landslide is 2867 m. As the water depth is not considered when obtaining the DEM and varies with the rainfall in the rainy season and the dry season, this value cannot be used directly. According to the data from the China Ministry of Water Resources Information Center, the water depth of the Jinsha River section is about 2–10 m. The water depth can be assumed to be the mean value, 6 m. Therefore, the final estimate for the dam bottom elevation is 2861 m. According to the field survey, the riverbed elevation is 2860 m (Chen et al., 2020).
3.1.3 Calculating the highest height of the dam crest
The slope angle of the landslide surface, the inclination angle of the riverbed and the length of the landslide can be calculated directly using the remote sensing image and DEM. The slope angle of the landslide surface is 30.65∘, the inclination angle of the riverbed is 0.11∘ and the length of the landslide that can be observed is 567 m. According to Eqs. (5)–(8), with the parameters obtained before, the highest height of the dam top is 155.4 m and the highest elevation of the dam top is 3016.5 m (with an error of 2.5 m), which should be compared to the measured value from Chen, 3014 m (Chen et al., 2020).
3.1.4 Predicting the lowest height of the dam crest and the maximum volume of the barrier lake
Taking Baige landslide dam as an example, using the case section, we have predicted that the highest elevation of the dam crest is 3016.5 m and the height of the dam is 155.4 m. According to Eq. (9), the lowest height of the crest of the landslide dam is 104.2 m and the elevation is 2964.2 m (with an error of 2.8 m), which should be compared to the measured data from Chen, 2067 m (Chen et al., 2020). Using a geographic information system, we can estimate, based on the DEM (Wang and Lu, 2002; Chen and Lu, 2008), that its potential maximum volume is 7.96×10⁸ m3.
3.2 Hongshiyan landslide dam
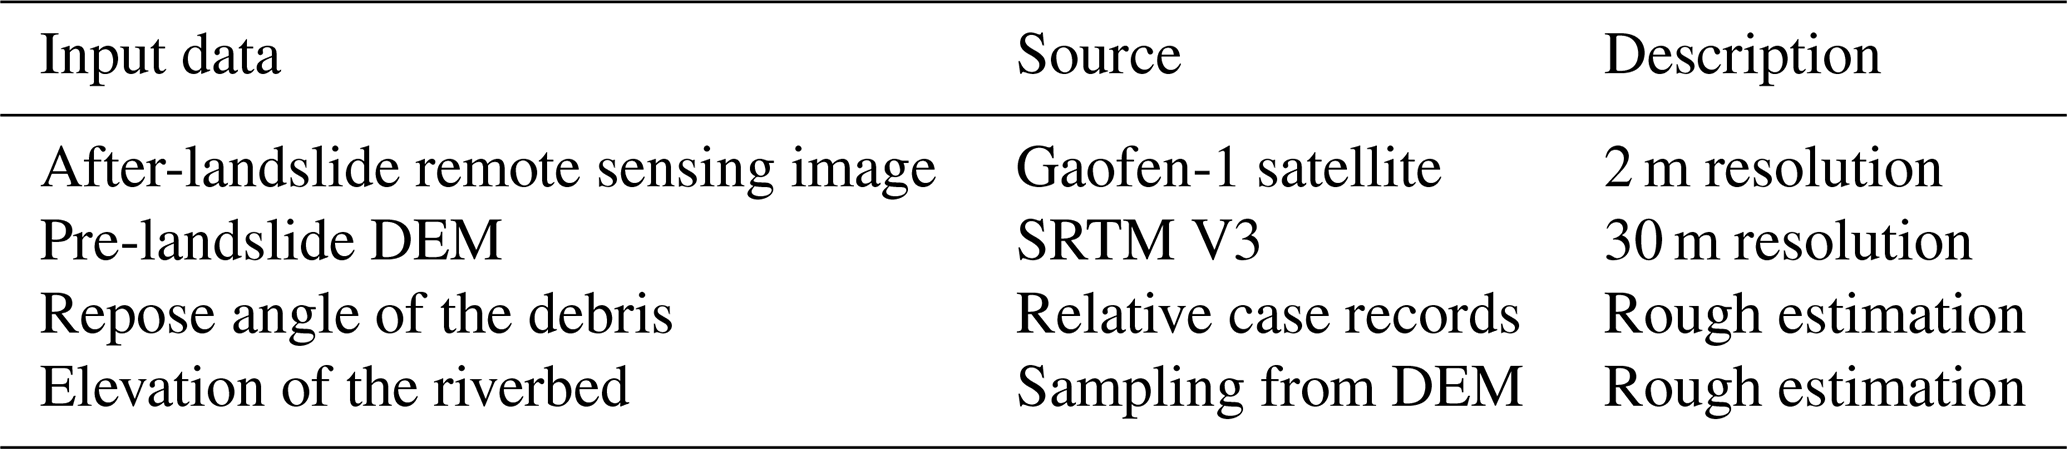
Another case for validation is the Hongshiyan landslide dam, a landslide created by a moderate earthquake (Ms 6.5) on 3 August 2014. The epicenter of the earthquake was located at 27.11∘ N, 103.35∘ E, and the landslide is located 8.8 km southeast from the epicenter (Luo et al., 2019). The landslide dam holds a maximum water storage of 2.6×10⁸ m3 (Zhou et al., 2015). The breaching of this giant dam will not only pose a high threat to the residents who live around it, but will also bring a possibility of damage to other hydropower dams downstream. The data used to carry out the procedure in this research and to predict the essential geometric parameters of the landslide dam are listed in Table 1; they include an after-landslide remote-sensing image (2 m resolution) and a pre-event DEM (30 m resolution).
Table 1Sources of input data used in the Hongshiyan landslide dam case.
3.2.1 Determining the elevation of the lake level
The image and the DEM are used to obtain the parameters required to make the prediction. The elevation of the lake level is obtained by sampling lake edge points. The distribution of the sampling points is shown in Fig. 9 and the elevation of the lake level is 1170 m.
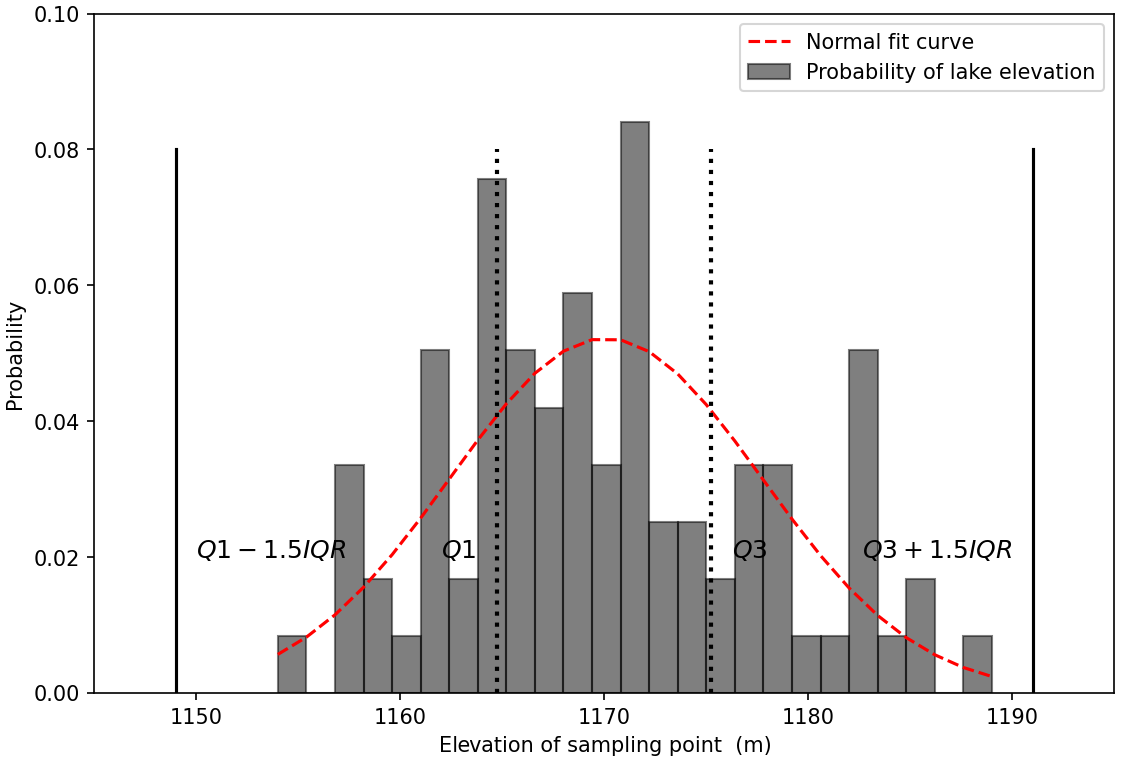
Figure 9Elevation distribution for the sampling points used in the case of the Hongshiyan landslide dam.
3.2.2 Determining the elevation of the dam bottom
As shown in Fig. 10, the pre-event elevation of the water level at the location of the dam bottom can be obtained through sampling the lowest points along the riverbed in the DEM, and is found to be 1114 m. As the water depth of the river is about 3 m (Zhou et al., 2015), the elevation of the dam bottom is 1111 m.
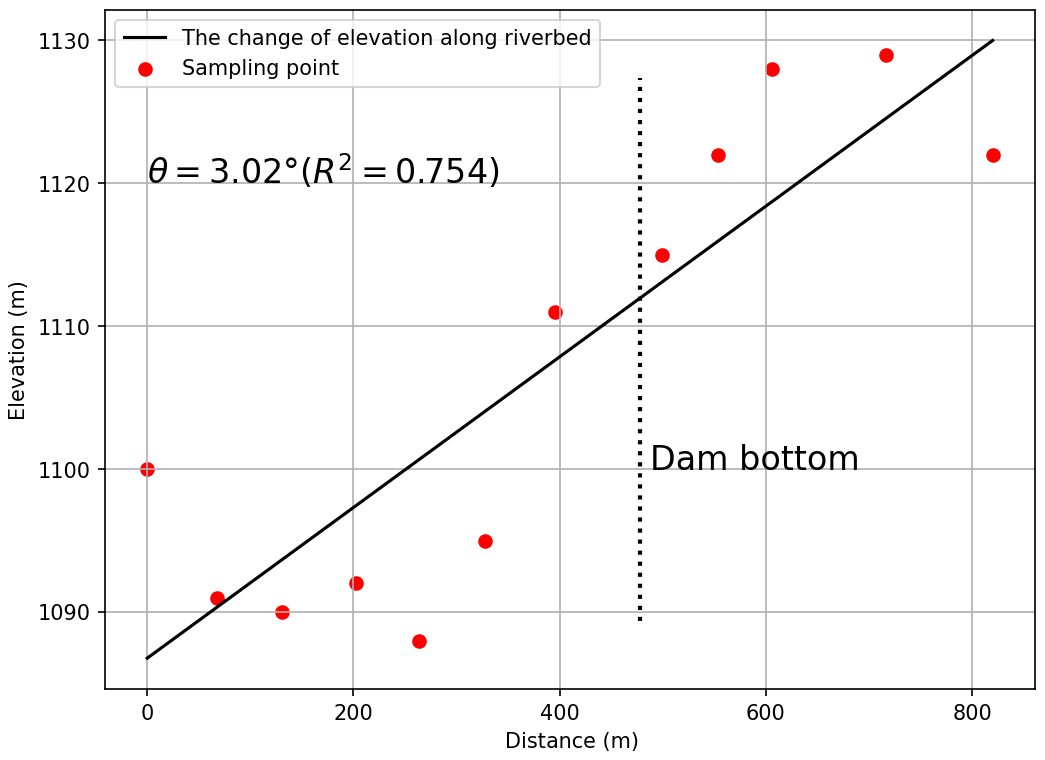
Figure 10The change in elevation along the riverbed in the case of the Hongshiyan landslide dam.
3.2.3 Calculating the highest height of the dam crest
Landslide dams are caused when landslide materials block rivers. After the occurrence of a large-scale landslide, it is necessary to conduct a large-scale investigation of barrier lakes and a rapid risk assessment. Remote sensing is an important means to achieve this goal. However, at present, remote sensing is only used for the monitoring and extraction of hydrological parameters, without predicting the potential hazard of the landslide dam. The key parameters of the barrier dam, such as the dam height and the maximum volume, still need to be obtained based on a field investigation, which is time consuming. Our research proposes a procedure that is able to calculate the height of the landslide dam and the maximum volume of the barrier lake using a single remote-sensing image and a pre-landslide DEM. The procedure includes four modules: (a) determining the elevation of the lake level, (b) determining the elevation of the bottom of the dam, (c) calculating the highest height of the dam and (d) predicting the lowest crest height of the dam and the maximum volume. Finally, a sensitivity analysis of the parameters used during the procedure and an analysis of the influence of the image resolution are carried out. This procedure is mainly demonstrated here through the Baige landslide dam and the Hongshiyan landslide dam. The single remote-sensing image and pre-landslide DEM are used to predict the height of the dam and the key parameters of the dam break, which are found to be in good agreement with the measured data. This procedure can effectively support quick decision making regarding hazard mitigation.
The length of the landslide dam that can be observed, Lm, is measured directly in the image (Fig. 11), and is found to be 737.4 m. The angle of the riverbed, θ, which is 3.02∘ (Fig. 10), and the landslide surface, α, which is 46.20∘ (Fig. 12), can be calculated through an analysis of the change in elevation along the river and the landslide. As a record of the repose angle of the debris is missing, the average of the values in other cases is taken as a rough estimation. Based on the average value for other landslide dams (Wang et al., 2013), it is set to 35.5∘.
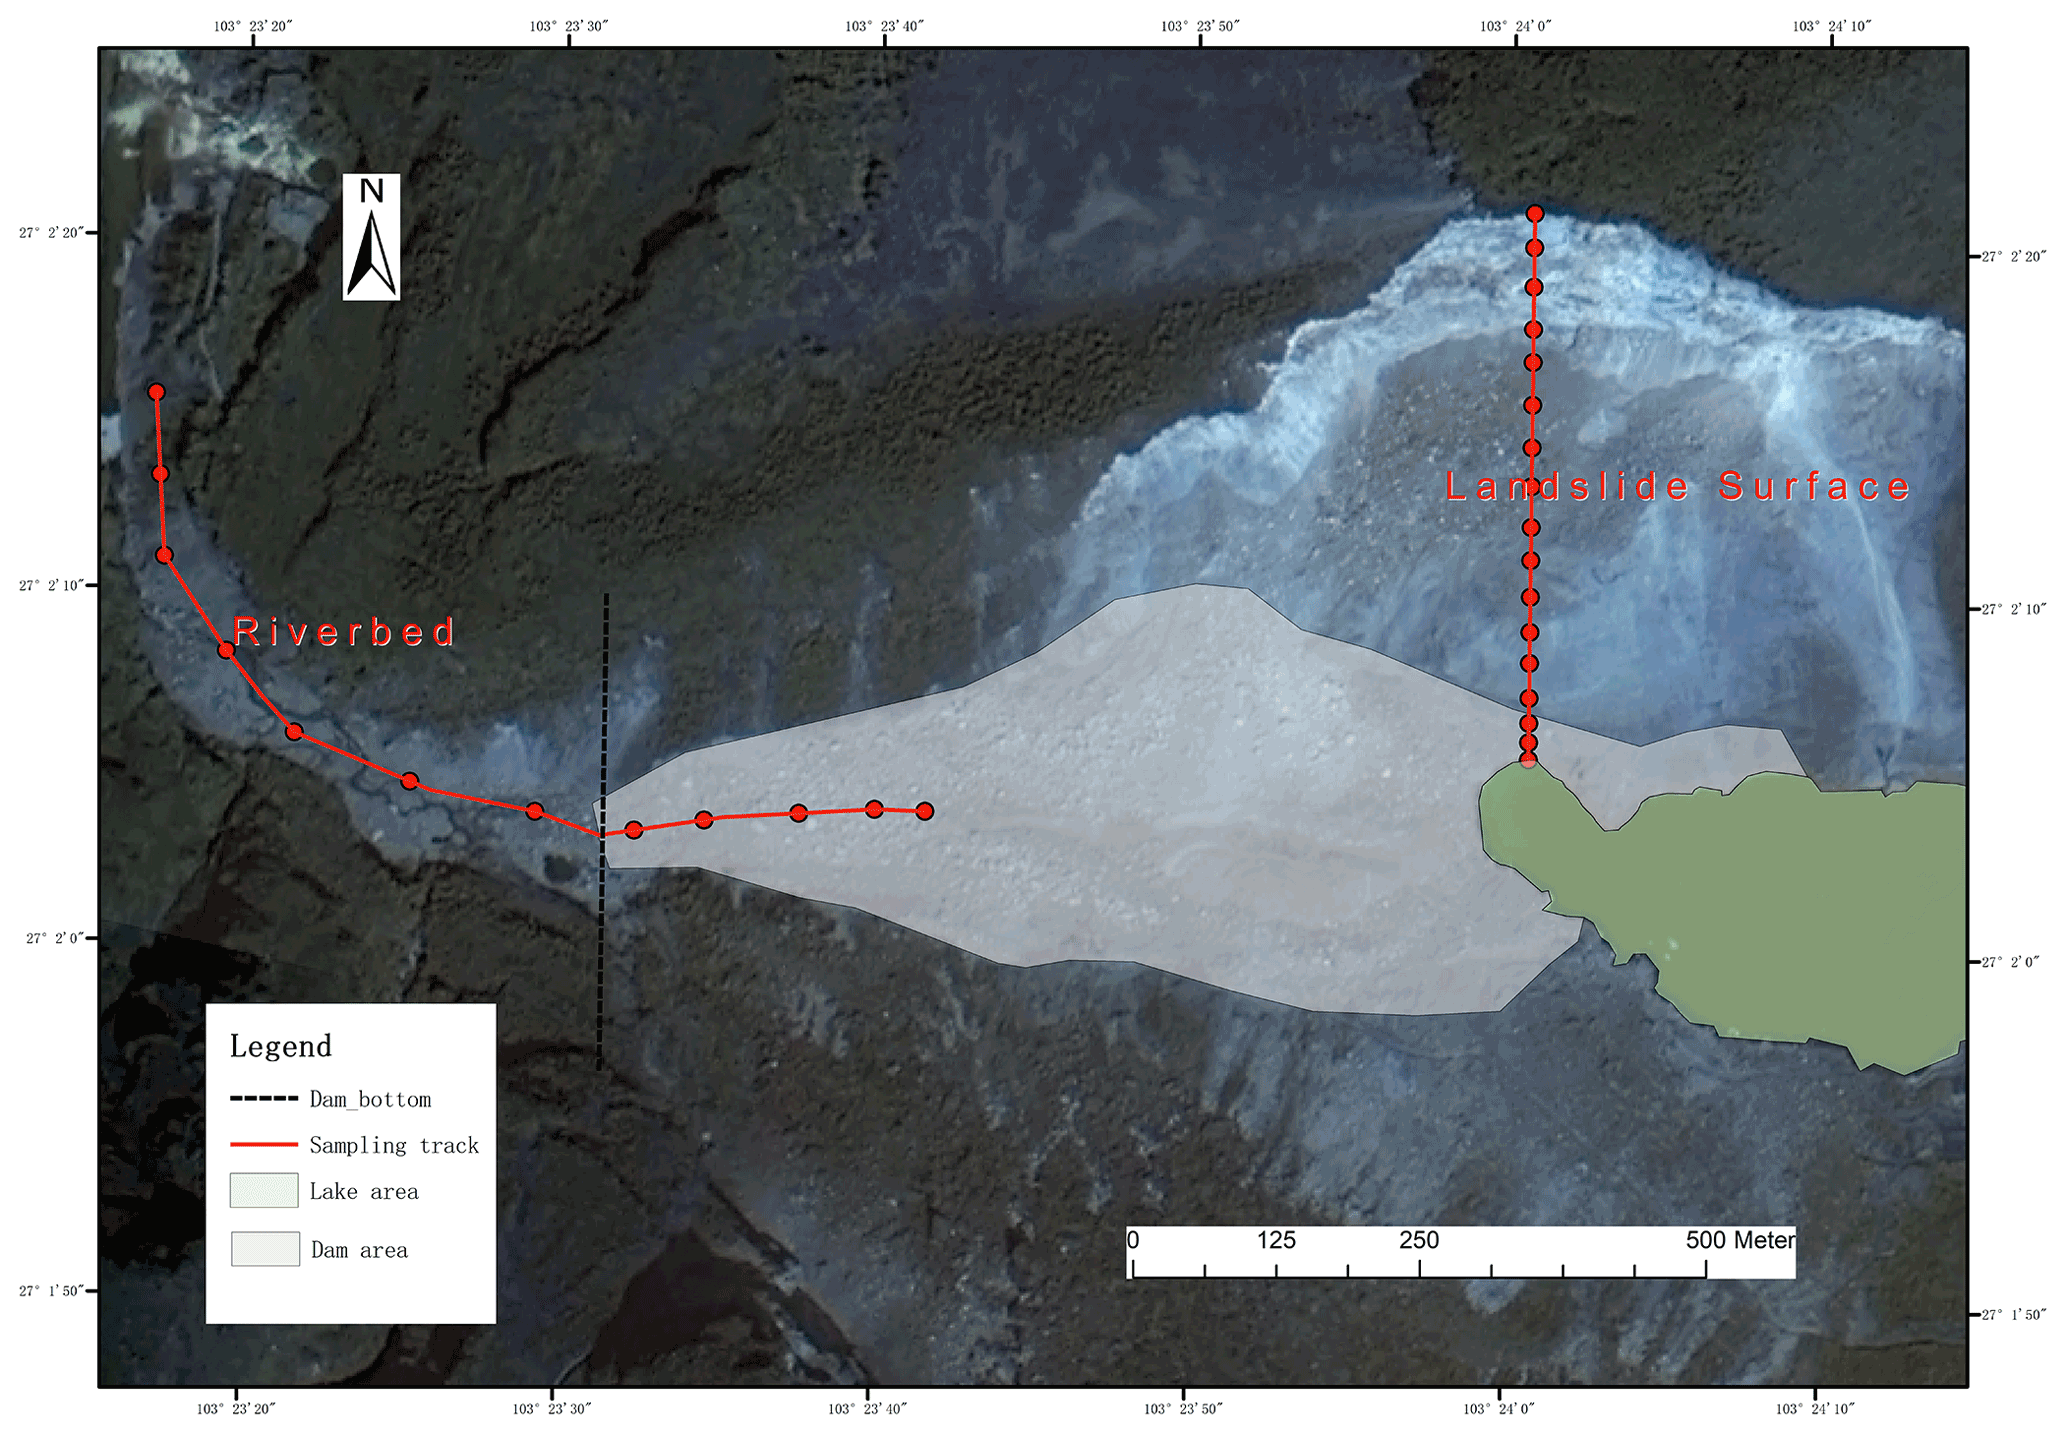
Figure 11Hongshiyan landslide dam (image from the Gaofen-1 satellite).
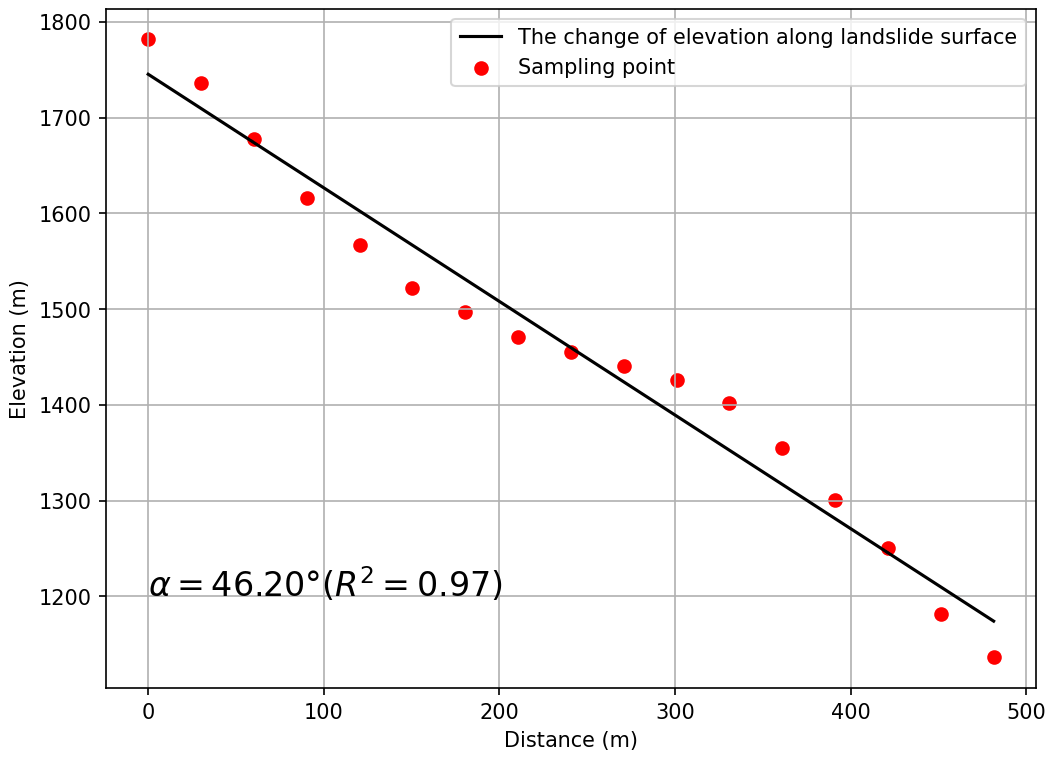
Figure 12The change in elevation across the landslide surface in the case of the Hongshiyan landslide dam.
Table 2Comparison between the predicted outcome and the measured data from a field survey (Zhou et al., 2015; Luo et al., 2019). * As proper treatment has been carried out at the Hongshiyan landslide dam, this data is calculated based on a detailed field survey.
By putting the parameters above into Eqs. (6)–(8), we can calculate the highest elevation of the dam crest, which is 1269.9 m.
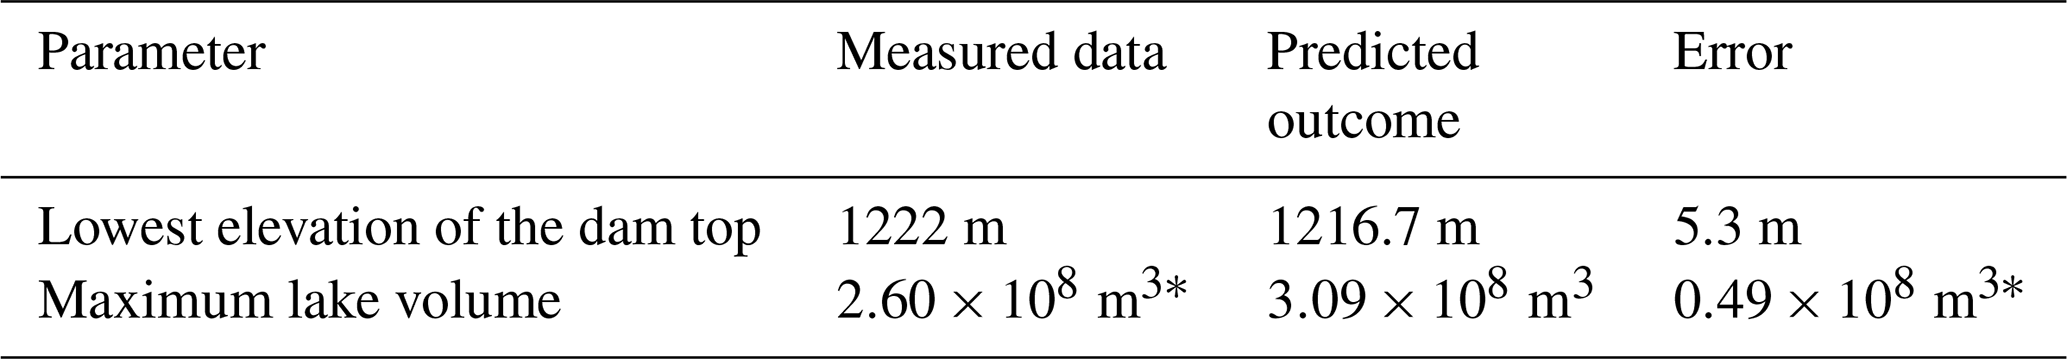
3.2.4 Predicting the lowest height of the dam crest and the maximum volume of the barrier lake
As it is the lowest elevation of the dam crest that decides the height of the water level when the break of the dam occurs, Eq. (9) is used to fit the relationship between the lowest crest and the highest crest. The lowest elevation of the dam crest is 1216.7 m. The potential maximum volume of the lake can be calculated easily with the DEM. A comparison of the field survey and the predicted outcome is shown in Table 2, which suggests strong consistency between them.
4.1 Rapid hazard assessment
The lowest height of the dam crest and the maximum volume of the barrier lake are important input parameters for the dam-break model. This paper has presented a procedure to obtain them rapidly. We have taken the Baige landslide dam as an example to illustrate how to use the prediction results to carry out rapid hazard assessment.
Many scholars have correlated the geometric parameters of a landslide dam with its risk by an empirical formula. On the basis of the prediction results and the formulas they provide, we can make a quick prediction of the key information for the landslide dam hazard, such as the dam volume, the stability of the barrier dam and the potential maximum discharge of the lake.
4.1.1 Predicting the volume of the dam
The width of the barrier dam can be obtained directly from remote sensing images, and is 574.6 m. This is because the edge and angle conditions in the simplified model (Fig. 4) have been met; in other words, all the parameters of the simplified section plane in the model can be obtained. So, based on the relationship between the edges and angles in the model, the distance between the top and bottom in the lowest crest, , and the length of the dam top, , can be expressed by Eqs. (10) and (11):
However, because the cross section of the barrier dam is not evenly distributed in the vertical direction of the river, the height change will occur as discussed in Sect. 3.5. We can assume that the change in the top height of the dam is basically linear and that the bottom side length and top side length of the section trapezoid do not change in the vertical direction. Therefore, we can obtain the estimation formula (Eq. 12) for calculating the volume of dam debris. In the case of the Baige landslide dam, the prediction outcome is 32.4×10⁶ m3, while the true value according to a field survey is 30.2×10⁶ m3 (Shen et al., 2020). The error is mainly induced by the elevation change of the riverbed in the direction of the vertical channel, which has a great influence on the area of the dam section when the width of the dam is large.
4.1.2 Predicting the stability of the landslide dam
Dong proposed a regression model to evaluate the stability of the barrier lake based on the case of a historical landslide dam (Dong et al., 2011), as shown below:
where P, Hl, W and L are the inflow, dam height, width and length of the landslide dam, respectively. In the case of the Baige landslide, the inflow of the Baige landslide dam is 822 m3 s−1 (Li et al., 2019). The resulting Ls is −1.472, which means that the Baige landslide dam is unstable and has a high risk of breaching.
4.1.3 Predicting the peak discharge of the breach
In the simple prediction formula (Eq. 14) proposed by Cenderelli, V is the maximum volume of the dammed lake and Q is the maximum flood peak from the breaching dam.
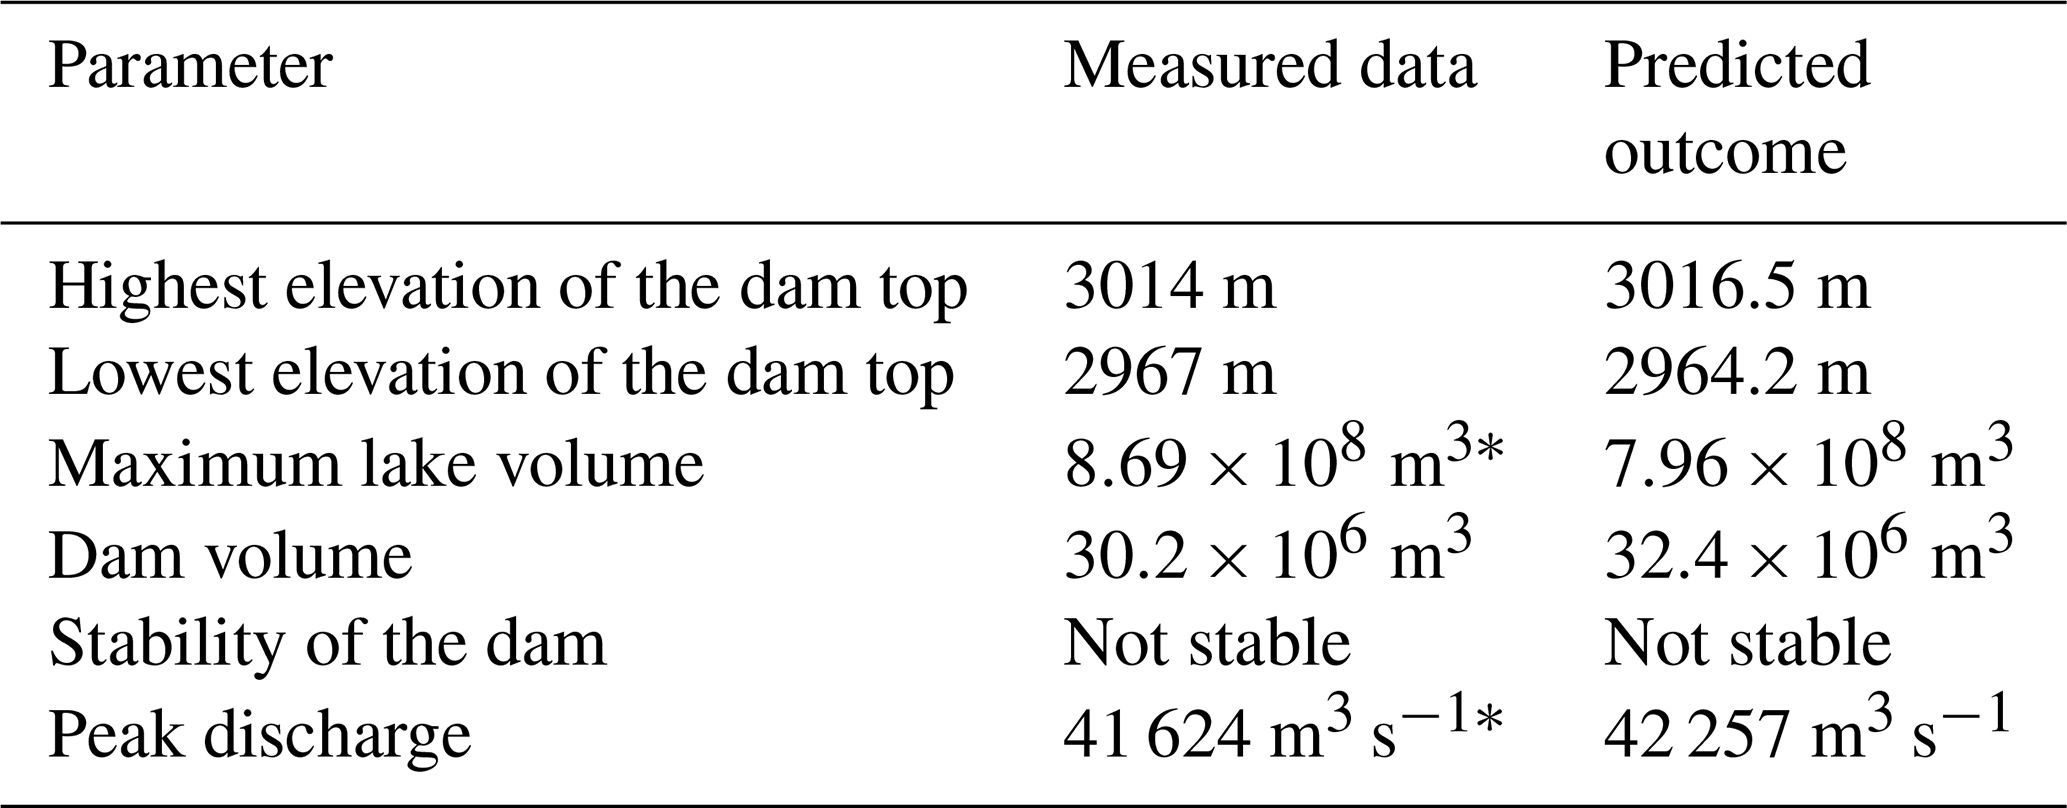
Without treatment, the largest flood peak of the breaching Baige landslide dam will reach 42 257 m3 s−1. A comparison between the predicted result and the measured value, as shown in Table 3, indicates good agreement. The rapid assessment of the dam breaching hazard has been completed. As the simulation model of dam breaching has a significant influence on the prediction of these factors, it should also be selected carefully in practical applications. Besides the formulas given above, there are also many other formulas to choose from to complete the prediction (Costa and Schuster, 1991; Walder and O'Connor, 1997; Shi et al., 2014; Ruan et al., 2021; Peng and Zhang, 2012; Zhong et al., 2018; Ermini and Casagli, 2003; Dong et al., 2011; Shen et al., 2020). Many scholars have discussed the merits and demerits of these hazard assessment models (Peng and Zhang, 2012; Fan et al., 2021).
Table 3Comparison of the measured data and the predicted results. As measures were taken to reduce the maximum volume of the barrier lake, asterisks indicate estimated results from Chen's detailed back analyses (Chen et al., 2020).
4.2 Sensitivity analysis
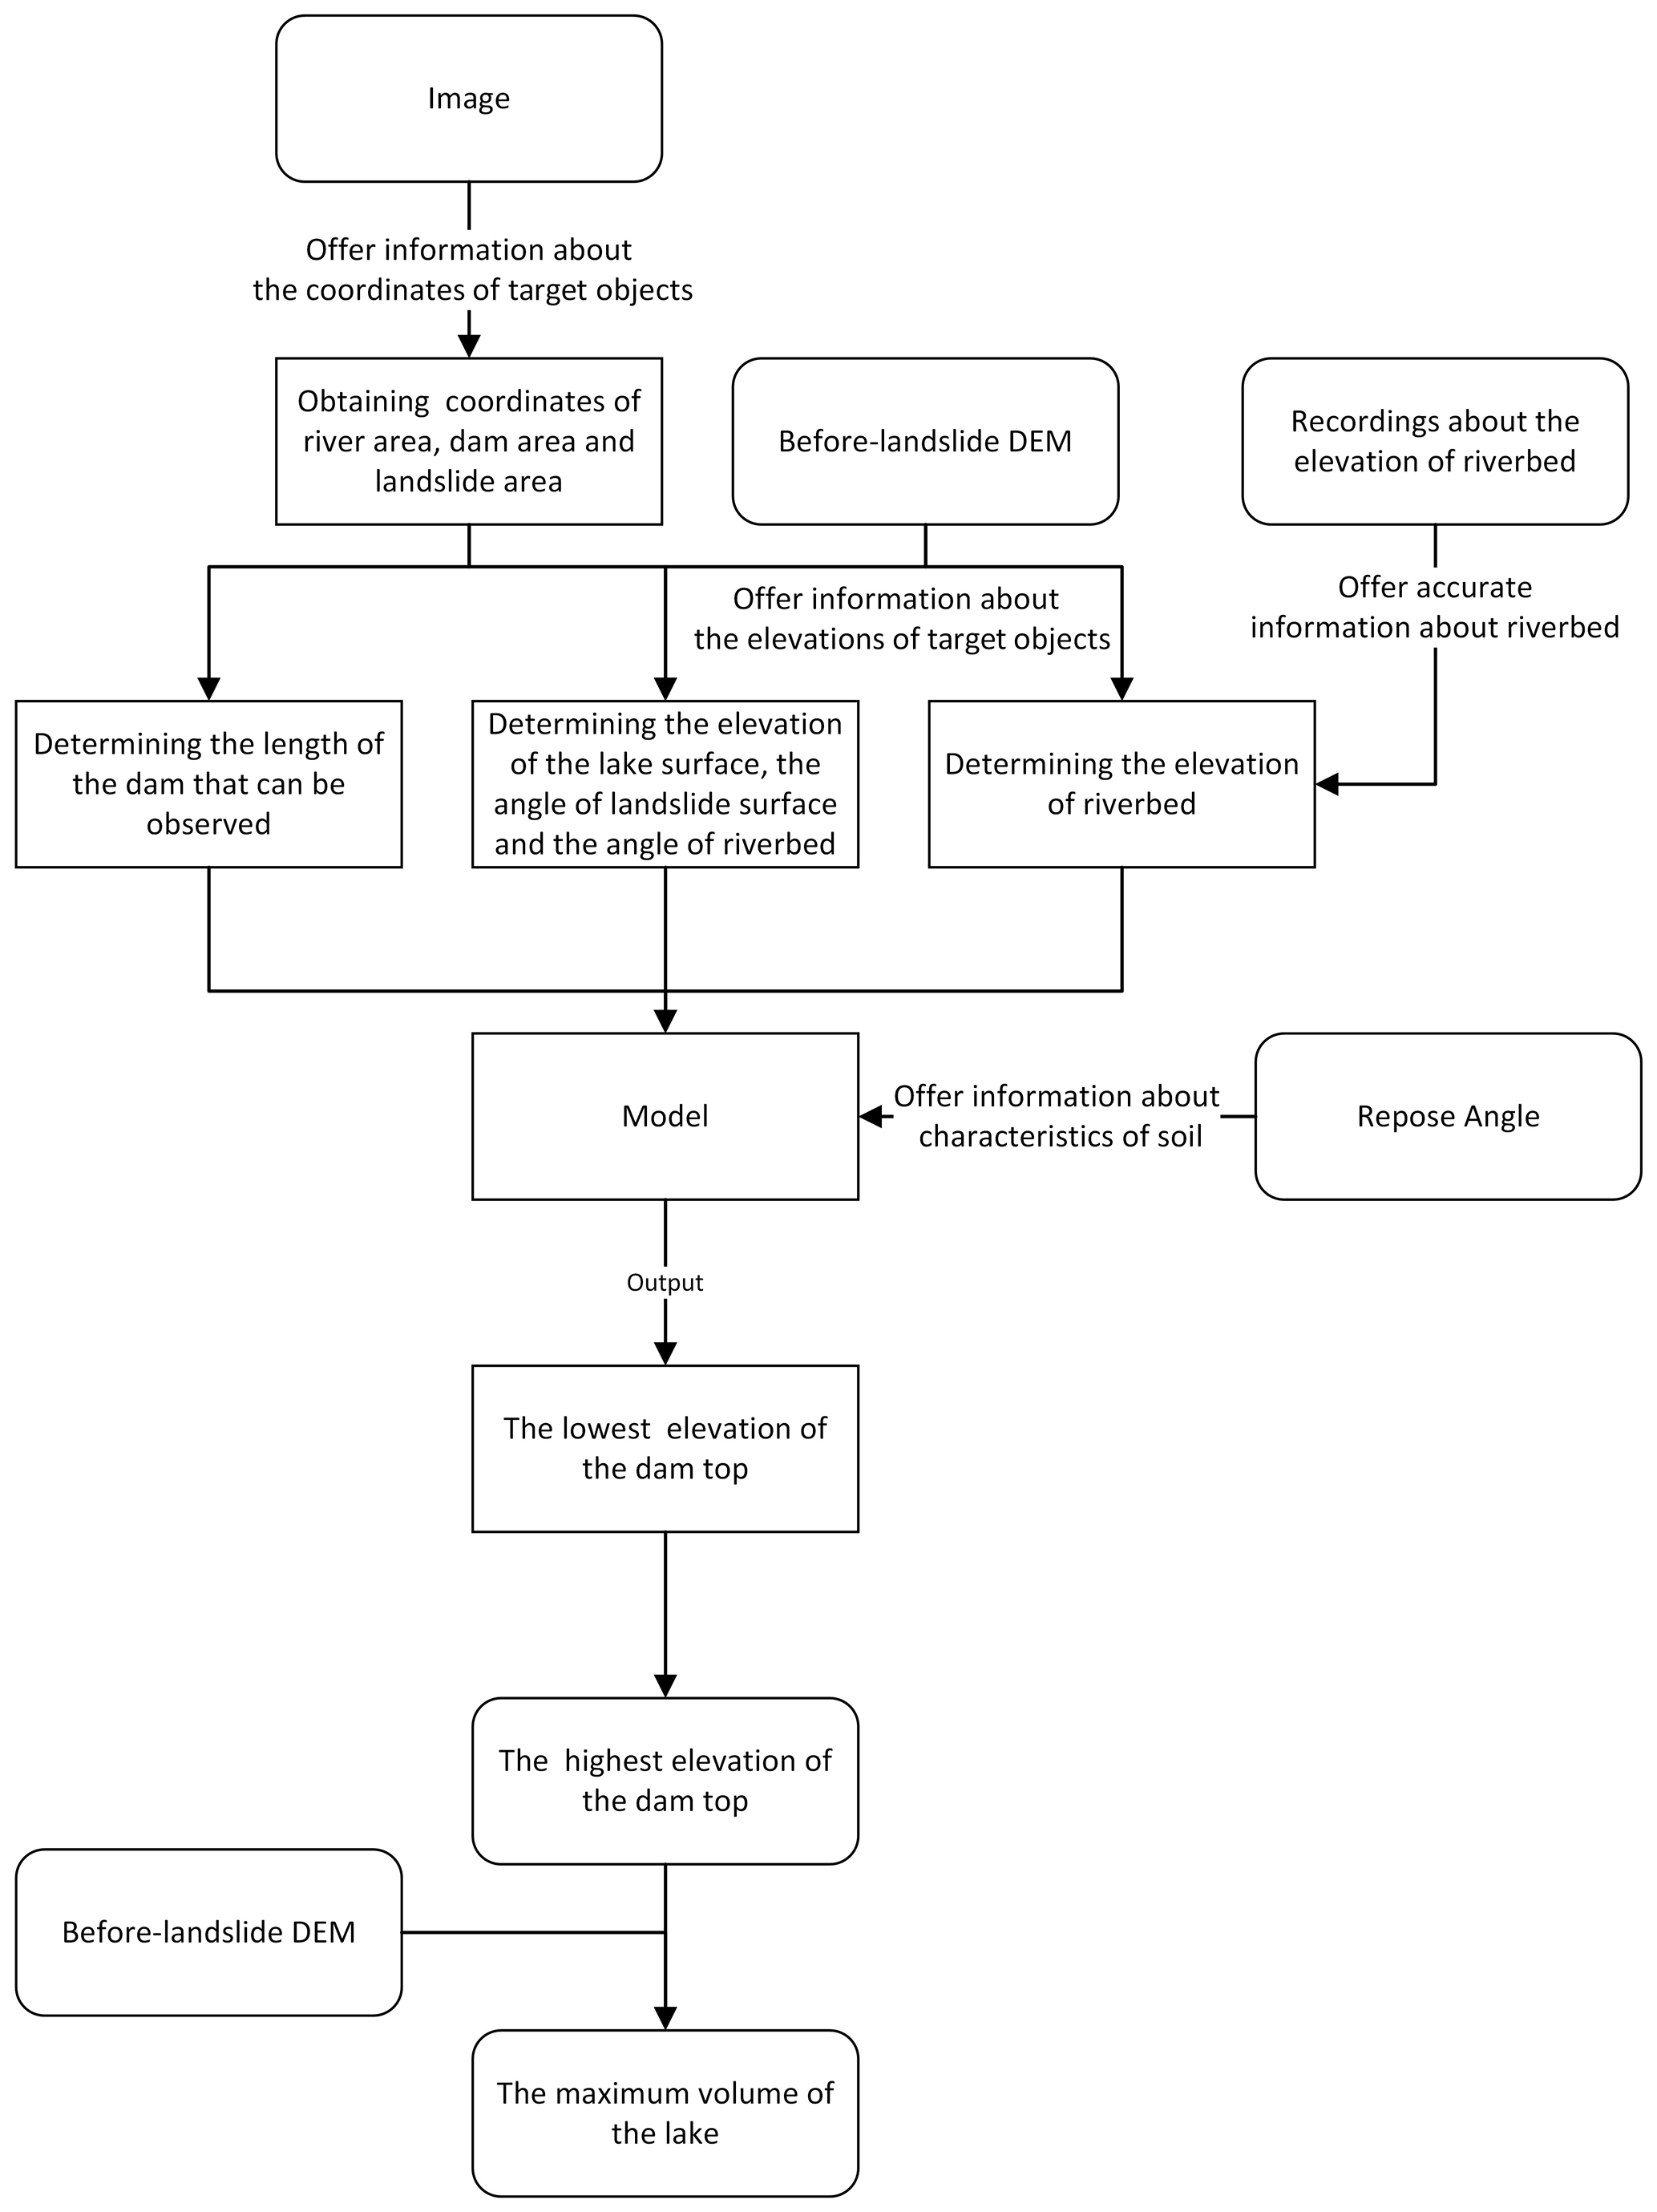
This study provides a method to predict critical information about a barrier dam using limited real-time data. The data required include an after-landslide satellite image and a pre-event DEM. The data that are not required include the repose angle of the nearby material and the elevation of the riverbed. If there are reliable records, they can be used in the procedure to improve the prediction accuracy. Otherwise, our research provides a reliable method to predict them. The process of using of each input data, determining intermediate parameters and finally outputting results is shown in Fig. 13.
In this procedure, the main parameters put into the model include the length of the dam that can be observed, the elevation of the lake level, the elevation of the dam bottom, the slope angle of the landslide surface and the inclination angle of the riverbed. Since Hm is the lake level elevation minus the elevation of the dam bottom, sensitivity analysis of these two parameters is conducted on Hm directly.
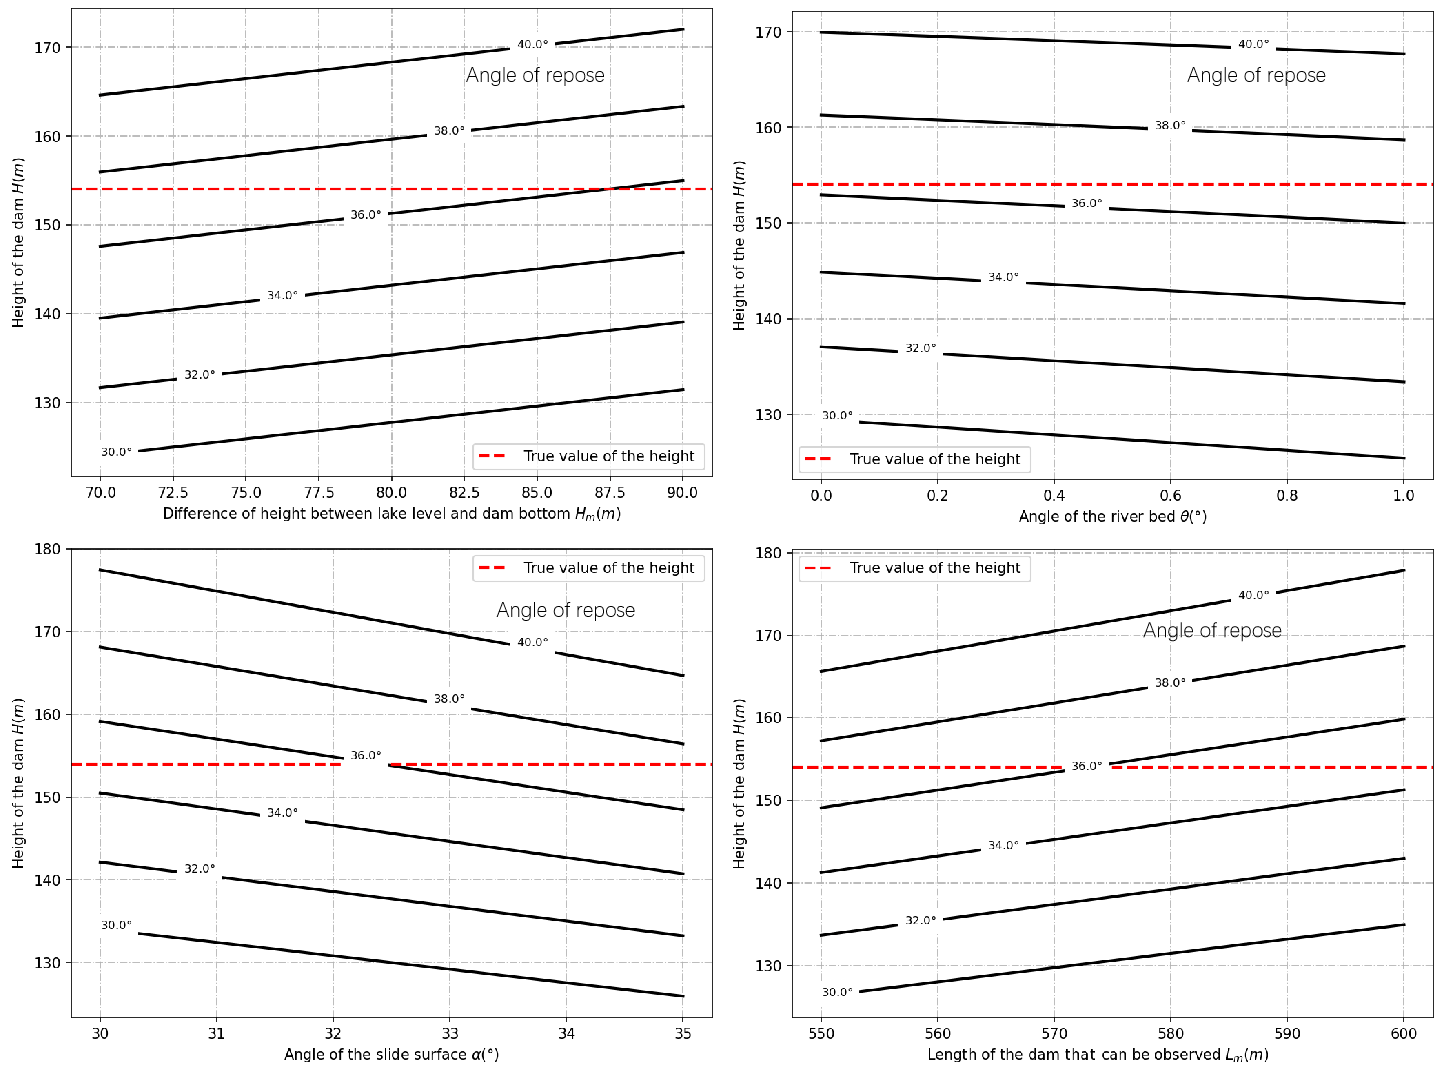
In order to analyze the sensitivity to these parameters, we have taken the Baige landslide dam as an example. The variation of the prediction result with changes in the parameters is as follows.
As can be seen from Fig. 14, with other parameters unchanged, the greater the observable length of the dam and the difference in height between the lake level and dam bottom, the higher the dam crest. The crest of the dam gets lower as the slope angle of the landslide surface and the inclination angle of the riverbed rise. The slope foot of the dam is mainly affected by the angle of the landslide surface and the inclination angle of the riverbed. The smaller the slope foot, the smaller the height of the dam. The calculated results are in good agreement with expectations.
Meanwhile, it is found that these parameters all have an impact of about 10 % on the final prediction results. So, it is necessary to determine these parameters carefully. Possible methods to reduce errors include repeating procedures and using more reliable historical data.
Finally, it is found that the angle of repose of the dam body has a significant influence on the height of the dam (Fig. 15). The greater the angle of repose, the greater the estimate of the dam height. According to Wang's field survey, the angle of repose ranges from 28.8 to 44.7∘ for the landslide dams caused by the Wenchuan earthquake, with an average value of 35.5∘ (Wang et al., 2013). In the absence of historical data, the average value proposed by Wang can be used. However, using this method, the difference between the final result and the true value can be about 30 % in the worst case. Therefore, provided there are sufficient disaster relief resources, it is better to make an overestimate of the repose angle, so as not to make a wrong judgment about the hazard. On the other hand, it is also possible to check the repose angle of the material in advance in a landslide-prone area, so as to enable a quick hazard assessment after a landslide.

4.3 Influence of the image resolution
The remote sensing image used in the case of the Baige landslide dam is from Beijing-1, which has a resolution of 0.8 m, and the pre-landslide DEM is SRTM V3, with a resolution of 30 m. More and more remote sensing data are becoming available; in addition to satellite-based remote-sensing platforms, data from small UAV remote-sensing platforms are also highly applicable to this procedure. As different sensors and remote sensing platforms may have different resolutions, we use interpolation to obtain images with different resolutions to explore the appropriate resolution for this procedure (Tables 4 and 5).
Table 4Parameters obtained using images with different resolutions. H1 is the elevation of the lake level, H0 is the elevation of the dam bottom, Hm is H1 minus H0, Lm is the length of the dam that can be observed in the image, α is the slope angle of the landslide surface, θ is the inclination angle of the riverbed and ϕ is the angle of repose.
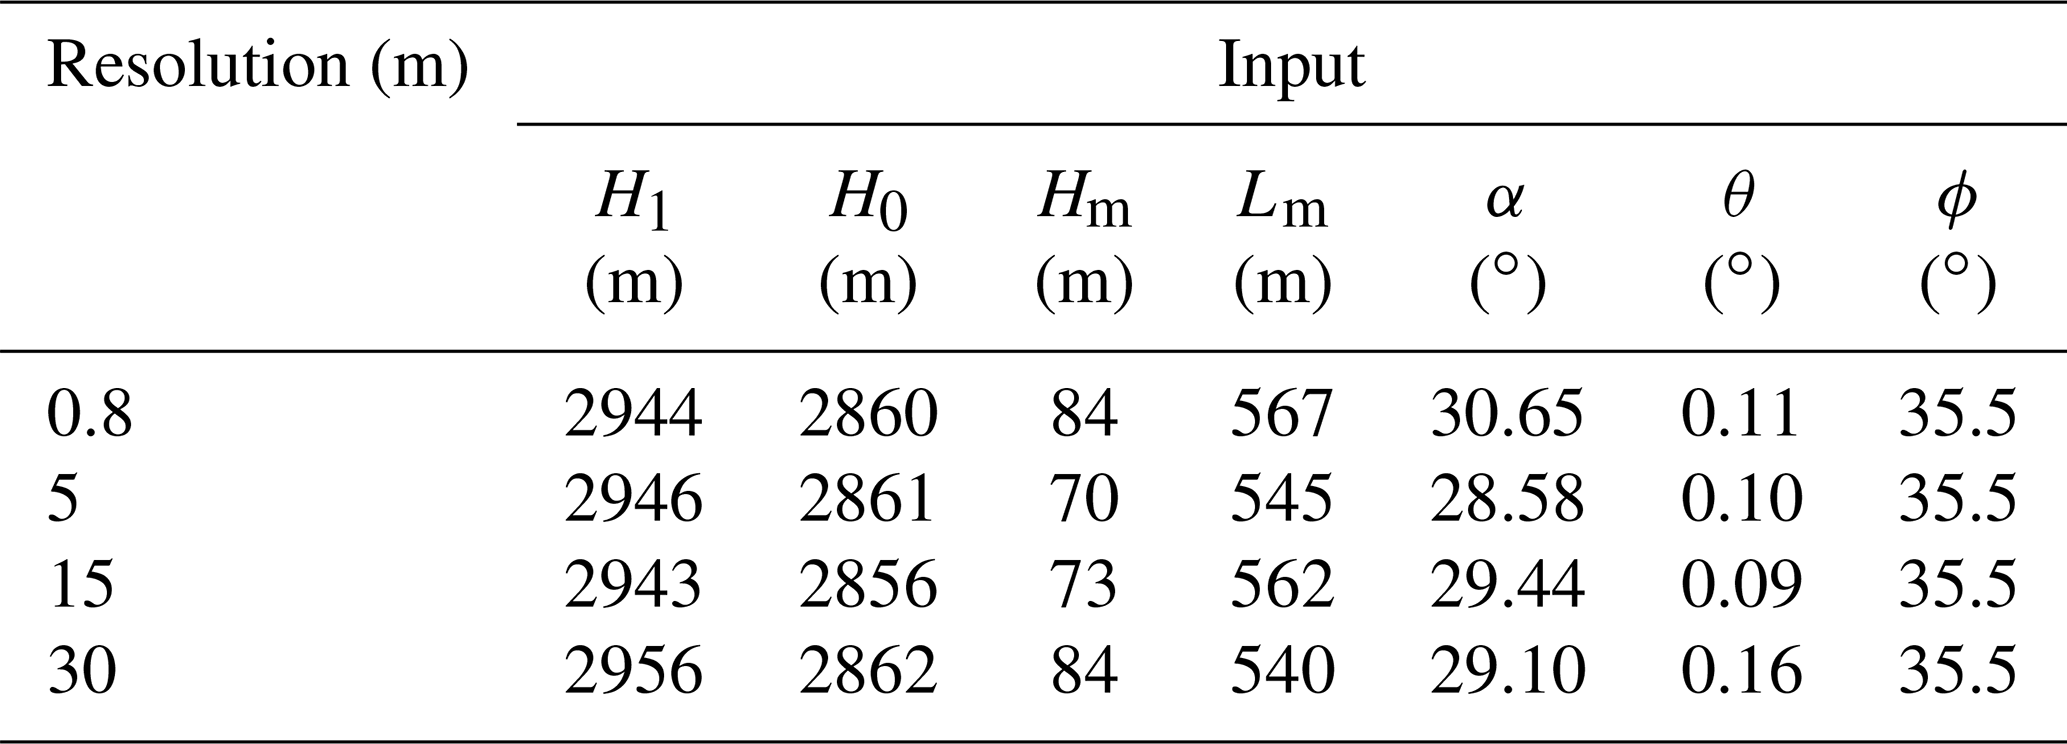
Table 5Results predicted using images with different resolutions.

As we discussed before, the main parameters used in this procedure include the length of the dam that can be observed, the lake level, the elevation of the dam bottom, the slope angle of the landslide surface and the inclination angle of the riverbed. Obviously, the resolution of the image will affect all of these five parameters (Table 4), but it will mainly affect the determination of the length of the dam that can be observed and the lake level. In general, the higher the resolution, the more accurate the prediction results obtained. When the resolution drops from 0.8 to 30 m, the error of the prediction result changes from 2.8 to 6.5 m, as shown in Table 5. However, for the procedure proposed in this paper, an image with a resolution of 5 m is sufficient to obtain a good estimate of the dam height.
There is no doubt that the resolution and quality of the DEM data are very important for this procedure. However, due to a lack of comparative data, we do not discuss this in depth in this paper. For more on this issue, the reader is referred to Dong et al. (2014), which includes relevant discussions.
4.4 Other discussion
In this study, a predictive model that is mainly based on the formation mechanism of a barrier dam combined with a single remote-sensing image and a pre-landslide DEM is used to quickly predict the essential parameters of a landslide dam hazard. Therefore, a comprehensive assessment of the reliability of the formation mechanism has also been carried out. It is found that most of the laws can be applied well, but Eq. (3) has greater limitations when fitting the cut-top effect. In Wu's experiment, the fit to the cut-top effect is mainly determined by the slope angle of the landslide surface. Actually, the angle between the riverbed plane and slope surface of the dam should be determined by the landslide potential energy, landslide length and landslide angle (Grasselli et al., 2000; Xu et al., 2013; Iverson et al., 2015). In addition to the slope angle of the landslide surface, the length of the landslide and potential energy are equally important. In Wu's formula, only the slope angle of the landslide surface is considered, so more experiments are needed to improve the fitting.
As there is not enough theoretical research to support the prediction of the lowest elevation of the dam crest, the method proposed in this paper still has certain limitations. In addition, the mechanism for the relationship between the highest elevation of the dam crest and the lowest elevation of the dam crest is not clear. In most cases, when it comes to the height of a barrier lake, usually only the highest or lowest elevation is recorded, resulting in fewer complete records of both parameters. As, in most cases, the records are not complete, only a small number of cases are used to carry out the fitting. Therefore, this aspect still needs more work and related research to support relevant predictions.
This research proposes a procedure based on a single remote-sensing image to predict the height of a dam crest and rapidly assess the hazard. Using the after-landslide remote-sensing image, it only takes no more than 1 man-hour to complete the whole procedure. Compared with Dong's procedure, this method only requires only one remote-sensing image and has a wider applicability. In view of the large topographic changes that occur in a landslide area, a more reasonable method of using a pre-landslide DEM is proposed. Even a poor-quality DEM can be used to complete the relevant prediction and hazard assessment. In the case of the Baige landslide dam, by extracting the barrier lake surface elevation and determining the bottom elevation of the dam, the highest elevation of the dam crest was predicted, and the difference between the predicted results and the measured data is within 3 m. Since the lowest point of the dam crest determines the potential maximum volume of the barrier lake, we find, based on historical records, that the heights of the highest point and the lowest point of the landslide dam crest basically conform to a linear relationship. The relationship is expressed in Eq. (9) through unary fitting. The prediction result for the lowest elevation of the crest of the Baige landslide dam is 2964.2 m (with an error of 2.8 m), as compared to the value from a field survey, 2967 m. In the case of the Hongshiyan landslide dam, the error of the prediction result for the dam top elevation is 5.3 m.
In the “Discussion,” some essential parameters of the landslide dam, such as the volume of the dam, the stability of the dam and the potential maximum flood peak when the dam breaks without treatment, were calculated based on the prediction result, which was found to be basically consistent with the true value. The sensitivities of the parameters used in this method were analyzed, and it was found that the repose angle of the landslide material can alter the prediction result by up to 30 %. Therefore, the repose angle should be carefully determined when using this procedure for related applications. Finally, through experiments with remote sensing images of different resolutions, we find that, as the resolution becomes lower, the accuracy of this method decreases. A resolution of 5 m and above is a reasonable range for applying this method, otherwise it will be difficult to distinguish the dam body and the water boundary.
The code, and output for our analysis and the data and code for the figures and tables included in this paper are available at https://doi.org/10.5281/zenodo.6680755 (Chou, 2022).
The data are available from the authors upon request.
WZ designed the experiments, and YZ carried them out. SW and FW gave some very important suggestions on basic knowledge of landslide dams. LW, WL, ZQ and JZ helped to operate the whole procedure. QG, ZW helped with some figures, and YX provided some remote sensing images. FW prepared the manuscript, with contributions from all co-authors.
The contact author has declared that neither they nor their co-authors have any competing interests.
Publisher's note: Copernicus Publications remains neutral with regard to jurisdictional claims in published maps and institutional affiliations.
This article is part of the special issue “Earthquake-induced hazards: ground motion amplification and ground failures”. It is not associated with a conference.
We appreciate the constructive reviews provided by three anonymous reviewers and the editor Hans-Balder Havenith. The authors acknowledge the support from the National Key R & D Program of China under grant 2017YFB0504101 and grant 2021YFB3901201.
This research has been supported by the Key Technologies Research and Development Program (grant nos. 2017YFB0504101 and 2021YFB3901201).
This paper was edited by Hans-Balder Havenith and reviewed by three anonymous referees.
Adams, J.: Earthquake-dammed lakes in New Zealand, Geology, 9, 215–219, 1981.
Ayalew, L. and Yamagishi, H.: The application of GIS-based logistic regression for landslide susceptibility mapping in the Kakuda-Yahiko Mountains, Central Japan, Geomorphology, 65, 15–31, https://doi.org/10.1016/j.geomorph.2004.06.010, 2005.
Braun, A., Cuomo, S., Petrosino, S., Wang, X., and Zhang, L.: Numerical SPH analysis of debris flow run-out and related river damming scenarios for a local case study in SW China, Landslides, 15, 535–550, https://doi.org/10.1007/s10346-017-0885-9, 2018.
Briaud, J.-L.: Case Histories in Soil and Rock Erosion: Woodrow Wilson Bridge, Brazos River Meander, Normandy Cliffs, and New Orleans Levees, Landslides, 134, 1425–1447, https://doi.org/10.1061/(ASCE)1090-0241(2008)134:10(1425), 2008.
Canuti, P., Casagli, N., Ermini, L., Fanti, R., and Farina, P.: Landslide activity as a geoindicator in Italy: significance and new perspectives from remote sensing, Environ. Geol., 45, 907–919, https://doi.org/10.1007/s00254-003-0952-5, 2004.
Cao, Z., Yue, Z., and Pender, G.: Landslide dam failure and flood hydraulics. Part II: coupled mathematical modelling, Nat. Hazards, 59, 1021–1045, 2011.
Chen, C.-Y., Chen, T.-C., Yu, F.-C., and Hung, F.-Y.: A landslide dam breach induced debris flow – a case study on downstream hazard areas delineation, Environ. Geol., 47, 91–101, https://doi.org/10.1007/s00254-004-1137-6, 2004.
Chen, X. and Lu, J.: Geomatics-based Method Research on Capacity Calculation of Quake Lake, J. Remote Sens., 12, 881–888, https://doi.org/10.3321/j.issn:1007-4619.2008.06.010, 2008.
Chen, Z., Chen, S., and Wang, L.: Back analysis of the breach flood of the 11.03 Baige barrier lake at the Upper Jinsha River, Scient. Sin. Technol., 50, 763–774, https://doi.org/10.1360/SST-2019-0297, 2020.
Chen, Z., Zhou, H., Ye, F., Liu, B., and Fu, W.: The characteristics, induced factors, and formation mechanism of the 2018 Baige landslide in Jinsha River, Southwest China, Catena, 203, 105337, https://doi.org/10.1016/j.catena.2021.105337, 2021.
Chou, W.: Wiki-Chou/Using-a-single-remote-sensing-remote-sensing-image-to-calculate-the-heigh: Official release (visualization), Zenodo [code], https://doi.org/10.5281/zenodo.6680755, 2022.
Costa, J. E. and Schuster, R. L.: The formation and failure of natural dams, Geol. Soc. Am. Bull., 100, 1054–1068, https://doi.org/10.1130/0016-7606(1988)100<1054:TFAFON>2.3.CO;2, 1988.
Costa, J. E. and Schuster, R. L.: Documented historical landslide dams from around the world, Documented historical landslide dams from around the world, US Geological Survey, Vancouver, WA, https://doi.org/10.3133/ofr91239, 1991.
Cui, P., Zhu, Y., Han, Y., Chen, X., and Zhuang, J.: The 12 May Wenchuan earthquake-induced landslide lakes: distribution and preliminary risk evaluation, Landslides, 6, 209–223, https://doi.org/10.1007/s10346-009-0160-9, 2009.
Dong, J.-J., Tung, Y.-H., Chen, C.-C., Liao, J.-J., and Pan, Y.-W.: Logistic regression model for predicting the failure probability of a landslide dam, Eng. Geol., 117, 52–61, https://doi.org/10.1016/j.enggeo.2010.10.004, 2011.
Dong, J.-J., Lai, P.-J., Chang, C.-P., Yang, S.-H., Yeh, K.-C., Liao, J.-J., and Pan, Y.-W.: Deriving landslide dam geometry from remote sensing images for the rapid assessment of critical parameters related to dam-breach hazards, Landslides, 11, 93–105, https://doi.org/10.1007/s10346-012-0375-z, 2014.
Ermini, L. and Casagli, N.: Prediction of the behaviour of landslide dams using a geomorphological dimensionless index, Earth Surf. Proc. Land., 28, 31–47, https://doi.org/10.1002/esp.424, 2003.
Fan, X., van Westen, C. J., Xu, Q., Gorum, T., and Dai, F.: Analysis of landslide dams induced by the 2008 Wenchuan earthquake, J. Asian Earth Sci., 57, 25–37, https://doi.org/10.1016/j.jseaes.2012.06.002, 2012.
Fan, X., Dufresne, A., Siva Subramanian, S., Strom, A., Hermanns, R., Tacconi Stefanelli, C., Hewitt, K., Yunus, A. P., Dunning, S., Capra, L., Geertsema, M., Miller, B., Casagli, N., Jansen, J. D., and Xu, Q.: The formation and impact of landslide dams – State of the art, Earth-Sci. Rev., 203, 103116, https://doi.org/10.1016/j.earscirev.2020.103116, 2020.
Fan, X., Dufresne, A., and Whiteley, J.: Recent technological and methodological advances for the investigation of landslide dams, Earth-Sci. Rev., 218, 103646, https://doi.org/10.1016/j.earscirev.2021.103646, 2021.
Federica, Z., Elisa, F., Christian, S., Silvia, T., Sinem, A., Andrea, C., and Antonio, M.: Exploring machine learning potential for climate change risk assessment, Earth-Sci. Rev., 220, 103752, https://doi.org/10.1016/j.earscirev.2021.103752, 2021.
Grasselli, Y., Herrmann, H. J., Oron, G., and Zapperi, S.: Effect of impact energy on the shape of granular heaps, Granular Matter, 2, 97–100, https://doi.org/10.1007/s100350050039, 2000.
Iverson, R. M., George, D. L., Allstadt, K., Reid, M. E., Collins, B. D., Vallance, J. W., Schilling, S. P., Godt, J. W., Cannon, C. M., and Magirl, C. S.: Landslide mobility and hazards: implications of the 2014 Oso disaster, Earth Planet. Sc. Lett., 412, 197–208, https://doi.org/10.1016/j.epsl.2014.12.020, 2015.
Li, H., Qi, S., Chen, H., Liao, H., Cui, Y., and Zhou, J.: Mass movement and formation process analysis of the two sequential landslide dam events in Jinsha River, Southwest China, Landslides, 16, 2247–2258, https://doi.org/10.1007/s10346-019-01254-z, 2019.
Li, T. C., Schuster, R. L., and Wu, J. S.: Landslide dams in south-central China, Landslide Dams-processes, Risk and Mitigation, https://www.researchgate.net/publication/284088528_Landslide_dams_in_south-central_China (last access: 17 June 2022), 1986.
Luo, J., Pei, X., Evans, S. G., and Huang, R.: Mechanics of the earthquake-induced Hongshiyan landslide in the 2014 Mw 6.2 Ludian earthquake, Yunnan, China, Eng. Geol., 251, 197–213, https://doi.org/10.1016/j.enggeo.2018.11.011, 2019.
Meng, C.-K., Chen, K.-T., Niu, Z.-P., Di, B.-F., and Ye, Y.-J.: Influence of Internal Structure on Breaking Process of Short-Lived Landslide Dams, Front. Earth Sci., 9, https://doi.org/10.3389/feart.2021.604635, 2021.
Mora Castro, S.: The 1992 Río Toro landslide dam, Costa Rica, Vol. 9, Landslide News, https://www.researchgate.net/publication/275971264_The_1992_Rio_Toro_landslide_dam_Costa_Rica (last access: 17 June 2022), 1993.
Morgenstern, R., Massey, C., Rosser, B., and Archibald, G.: Landslide Dam Hazards: Assessing Their Formation, Failure Modes, Longevity and Downstream Impacts, Springer, 117–123, https://doi.org/10.1007/978-3-030-60319-9_12, 2021.
Peng, M. and Zhang, L. M.: Breaching parameters of landslide dams, Landslides, 9, 13–31, https://doi.org/10.1007/s10346-011-0271-y, 2012.
Ruan, H., Chen, H., Wang, T., Chen, J., and Li, H.: Modeling Flood Peak Discharge Caused by Overtopping Failure of a Landslide Dam, Water, 13, 921, https://doi.org/10.3390/w13070921, 2021.
Shen, D., Shi, Z., Peng, M., Zhang, L., and Jiang, M.: Longevity analysis of landslide dams, Landslides, 17, 1797–1821, https://doi.org/10.1007/s10346-020-01386-7, 2020.
Shi, Z., Ma, X., and Peng, M.: Statistical Analysis And Efficient Dam Burst Modelling Of Landslide Dams Based On A Large-Scale Database, Chin. J. Rock Mech. Eng., 33, 1780–1790,2014.
Walder, J. S. and O'Connor, J. E.: Methods for predicting peak discharge of floods caused by failure of natural and constructed earthen dams, Water Resour. Res., 33, 2337–2348, https://doi.org/10.1029/97WR01616, 1997.
Wang, J.-J., Zhao, D., Liang, Y., and Wen, H.-B.: Angle of repose of landslide debris deposits induced by 2008 Sichuan Earthquake, Eng. Geol., 156, 103–110, https://doi.org/10.1016/j.enggeo.2013.01.021, 2013.
Wang, Z. H. and Lu, J. T.: Satellite monitoring of the Yigong landslide in Tibet, China, in: Earth Observing Systems Vii, Bellingham, 34–38, https://doi.org/10.1117/12.453739, 2002.
Wu, H., Nian, T., Chen, G., Zhao, W., and Li, D.: Laboratory-scale investigation of the 3-D geometry of landslide dams in a U-shaped valley, Eng. Geol., 265, 105428, https://doi.org/10.1016/j.enggeo.2019.105428, 2020.
Xu, W.-J., Xu, Q., and Wang, Y.-J.: The mechanism of high-speed motion and damming of the Tangjiashan landslide, Eng. Geol., 157, 8–20, https://doi.org/10.1016/j.enggeo.2013.01.020, 2013.
Yang, S.-H., Pan, Y.-W., Dong, J.-J., Yeh, K.-C., and Liao, J.-J.: A systematic approach for the assessment of flooding hazard and risk associated with a landslide dam, Nat. Hazards, 65, 41–62, https://doi.org/10.1007/s11069-012-0344-9, 2013.
Yunjian, G., Siyuan, Z., Jianhui, D., Zhiqiu, Y., and Mahfuzur, R.: Flood assessment and early warning of the reoccurrence of river blockage at the Baige landslide, J. Geogr. Sci., 31, 1694–1712, https://doi.org/10.1007/s11442-021-1918-9, 2021.
Zhang, L., Xiao, T., He, J., and Chen, C.: Erosion-based analysis of breaching of Baige landslide dams on the Jinsha River, China, in 2018, Landslides, 16, 1965–1979, https://doi.org/10.1007/s10346-019-01247-y, 2019.
Zhong, Q. M., Chen, S. S., Mei, S. A., and Cao, W.: Numerical simulation of landslide dam breaching due to overtopping, Landslides, 15, 1183–1192, https://doi.org/10.1007/s10346-017-0935-3, 2018.
Zhou, J., Cui, P., and Hao, M.: Comprehensive analyses of the initiation and entrainment processes of the 2000 Yigong catastrophic landslide in Tibet, China, Landslides, 13, 39–54, https://doi.org/10.1007/s10346-014-0553-2, 2016.
Zhou, X., Chen, Z., Yu, S., Wang, L., Deng, G., Sha, P., and Li, S.: Risk analysis and emergency actions for Hongshiyan barrier lake, Nat. Hazards, 79, 1933–1959, https://doi.org/10.1007/s11069-015-1940-2, 2015.